pillar 3 semi-annual report 2020 - bil.com
TRANSCRIPT
Pillar 3 Semi-Annual
Report 2020


C o n t e n t s
List of acronyms 4
EBA semi-annual tables and templates 8
Introduction 10
1. Own funds and capital adequacy 11
1.1 Regulatory capital adequacy (Pillar I) 12
1.2 Leverage ratio 15
2. Credit risk 16
2.1 Credit risk exposure 16
2.2 Forbearance, impairment, past due and provisions 20
2.3 Credit risk mitigation 23
2.4 Standardised approach 24
2.5 Advanced Internal Ratings Based approach (A-IRB) 26
2.6 Provisions 32
2.7 Counterparty credit risk 33
3. Market risk 38
3.1 Financial market risk exposure 38
3.2 Liquidity risk 40
3.3 Assessment of the regulatory capital requirement 42
4. Main events after end of June 2020 43
4.1 BIL reinforced its compliance framework 43
4.2 BIL closes Dubai branch to focus on strategic goals 43
5. Focus on COVID-19 situation 44

4 5BIL – PILLAR 3 Semi-Annual Report 2020 BIL – PILLAR 3 Semi-Annual Report 2020
List of acronyms
AFS Available For Sale
AFR Available Financial Resources
A-IRB Advanced Internal Rating-Based
ALM Asset and Liability Management
ASF Available Stable Funding
AT1 Additional Tier 1 capital
BCL Banque Centrale de Luxembourg
BCP Business Continuity Plan
BoD Board of Directors
BRC Board Risk Committee
BRNC Board Remuneration & Nomination Committee
BRNC-N Board Remuneration and Nominations Committee sitting in nomination matters
CAR Compliance, Audit and Risk
CC Crisis Committee
CCF Credit Conversion Factor
CCP Central Counterparty
CDS Credit Default Swap
CEO Chief Executive Officer
CET1 Common Equity Tier One
CoCo bond Contingent Convertible bond
CRCU Credit Risk Control Unit
CRMU Credit Risk Management Unit
CRD Capital Requirements Directive
CRM Credit Risk Mitigation
CRO Chief Risk Officer
4 5BIL – PILLAR 3 Semi-Annual Report 2020 BIL – PILLAR 3 Semi-Annual Report 2020
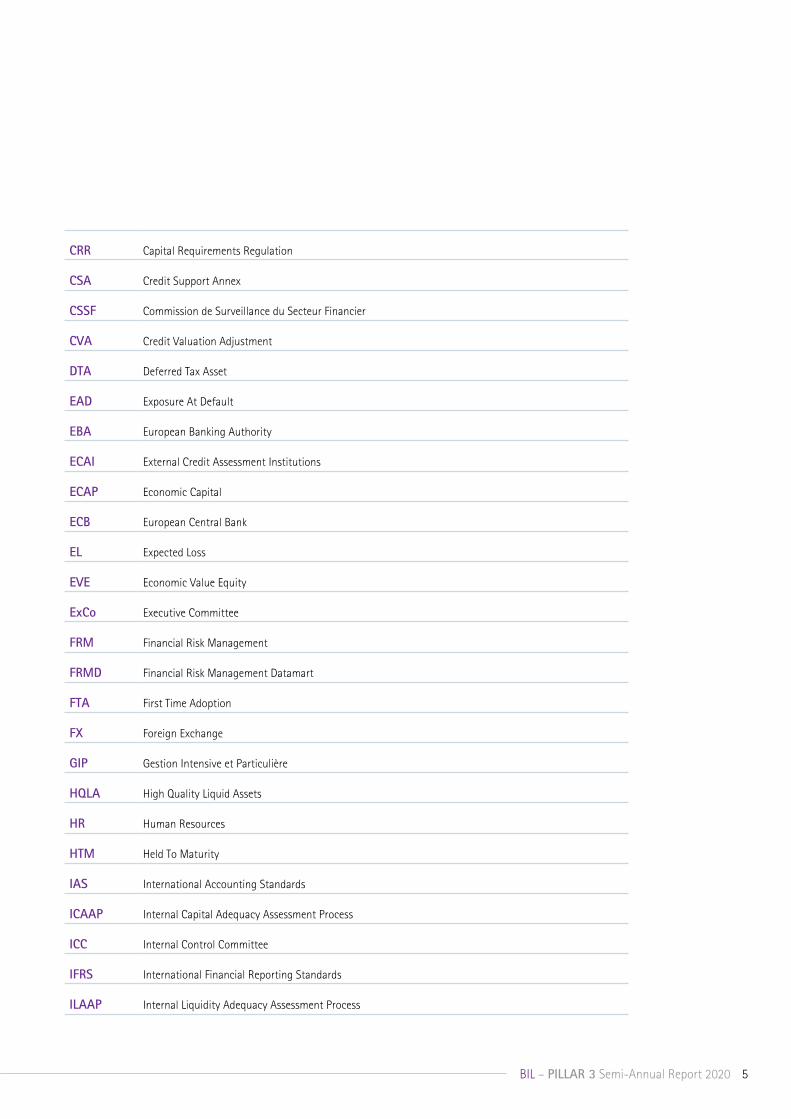
CRR Capital Requirements Regulation
CSA Credit Support Annex
CSSF Commission de Surveillance du Secteur Financier
CVA Credit Valuation Adjustment
DTA Deferred Tax Asset
EAD Exposure At Default
EBA European Banking Authority
ECAI External Credit Assessment Institutions
ECAP Economic Capital
ECB European Central Bank
EL Expected Loss
EVE Economic Value Equity
ExCo Executive Committee
FRM Financial Risk Management
FRMD Financial Risk Management Datamart
FTA First Time Adoption
FX Foreign Exchange
GIP Gestion Intensive et Particulière
HQLA High Quality Liquid Assets
HR Human Resources
HTM Held To Maturity
IAS International Accounting Standards
ICAAP Internal Capital Adequacy Assessment Process
ICC Internal Control Committee
IFRS International Financial Reporting Standards
ILAAP Internal Liquidity Adequacy Assessment Process

6 7BIL – PILLAR 3 Semi-Annual Report 2020 BIL – PILLAR 3 Semi-Annual Report 2020
IMM Internal Model Method
IR Interest Rate
IRRBB Interest Rate Risk in the Banking Book
IRS Internal Rating Systems
ISDA International Swap and Derivative Association
IT Information Technology
JST Joint Supervisory Team
KPI Key Performance Indicator
LCR Liquidity Coverage Ratio
LDP Low Default Portfolio
LR Leverage ratio
LGD Loss Given Default
L&R Loans & Receivables
MCD Mortgage Credit Directive
MCRE Maximum Credit Risk Exposure
MMB Member of the Management Board
MMU Model Management Unit
MOC Monthly Operational Committee
MRT Material Risk Takers
NACE Nomenclature statistique des Activités économiques dans la Communauté Européenne
NCA National Competent Authorities
NII Net Interest Income
NMD Non-Maturing Deposits
NPC New Products Committee
NPE Non-Performing Exposures
NSFR Net Stable Funding Ratio

6 7BIL – PILLAR 3 Semi-Annual Report 2020 BIL – PILLAR 3 Semi-Annual Report 2020
OBS Off-Balance Sheet
ORM Operational Risk Management
OTC Over-the-counter
PD Probability of Default
P&L Profit and Loss
QIS Quantitative Impact Study
RCO Risk Confidence
SFT Securities Financing Transaction
SC Security Committee
SNB Swiss National Bank
SSM Single Supervisory Mechanism
SRB Single Resolution Board
SRM Single Resolution Mechanism
STE Short Term Exercise
RAF Risk Appetite Framework
RAS Risk Appetite Statement
RCSA Risk Control Self-Assessment
RPC Risk Policy Committee
RSF Required Stable Funding
RWA Risk Weighted Assets
TFM Treasury and Financial Markets
TLTRO Targeted Longer-Term Refinancing Operations
TRIM Targeted Review of Internal Models
VaR Value at Risk
WAL Weighted Average Life

8 9BIL – PILLAR 3 Semi-Annual Report 2020 BIL – PILLAR 3 Semi-Annual Report 2020
EBA semi-annual tables and templates1
Table Reference NameRegulation (EU) No 575/2013 (CRR) articles
Section of the semi-annual report
4 EU OV1 Overview of RWAs Article 438 (c)-(f) Section 1.1.1
5 EU CR10 IRB (specialized lending and equities)Article 153 (5) or 155 (2), Article 438 Section 1.1.2
6 EU INS1Non-deducted participations in insurance undertakings
Article 438 (c)-(d) & article 49 (1) Section 1.1.3
11 EU CR1-ACredit quality of exposures by exposure class and instrument Article 442 (g)-(h) Section 2.1.1
12 EU CR1-BCredit quality of exposures by industry or counterparty types Article 442 (g) Section 2.1.1
13 EU CR1-CCredit quality of exposures by geography Article 442 (g) Section 2.1.2
14 EU CR1-D Ageing of past-due exposures Article 442 (g) Section 2.2.1
15 EU CR1-ENon-performing and forborne exposures Article 442 (g)-(i) Section 2.2.2
16 EU CR2-AChanges in the stock of general and specific credit risk adjustments Article 442 (i) Section 2.2.3
17 EU CR2-BChanges in the stock of defaulted and impaired loans and debt securities Article 442 (i) Section 2.2.4
18 EU CR3 CRM techniques – Overview Article 453 (f) - (g) Section 2.3.1
19 EU CR4 Credit risk exposure and CRM effects Article 453 (f) - (g) Section 2.4.1
20 EU CR5 Standardised approach Article 444 (e) Section 2.4.2
21 EU CR6 Qualitative disclosure requirements related to IRB models Article 452 (e) - (h) Section 2.5.1
22 EU CR7Effect on the RWAs of credit derivatives used as CRM techniques Article 453 (g)
N/A. The Bank does not have any credit derivatives.
23 EU CR8RWA flow statements of credit risk exposures under the IRB approach Article 438 (d) & Article 92 (3) Section 2.5.2
25 EU CCR1 Analysis of CCR exposure by approach Article 439 (e), (f), (i) & article 92 (3) Section 2.7.1
26 EU CCR2 CVA capital charge Article 439 (e) - (f) Section 2.7.2
27 EU CCR8 Exposures to CCPs Article 439 (e) - (f) Section 2.7.3
28 EU CCR3
Standardised approach – CCR exposures by regulatory portfolio and risk Article 444 (e) Section 2.7.4
1 In accordance with the publication EBA/GL/2016/11, version 2. Other tables which are referenced in this publication are included in the annual Pillar 3 report.

8 9BIL – PILLAR 3 Semi-Annual Report 2020 BIL – PILLAR 3 Semi-Annual Report 2020
Table Reference NameRegulation (EU) No 575/2013 (CRR) articles
Section of the semi-annual report
29 EU CCR4IRB approach – CCR exposures by portfolio and PD scale Article 452 (e) Section 2.7.5
30 EU CCR7RWA flow statements of CCR exposures under the IMM
Article 92 (3) - (4) & Article 438 (d)
N/A. The Bank does not use the IMM approach.
31 EU CCR5-AImpact of netting and collateral held on exposure values Article 439 (e) Section 2.7.6
32 EU CCR5-BComposition of collateral for exposures to CCR Article 439 (e) Section 2.7.6
33 EU CCR6 Credit derivatives exposures Article 439 (g) - (h)N/A. The Bank does not have any credit derivatives.
34 EU MR1Market risk under the standardised approach Article 445 Section 3.1
35 EU MR2-A Market risk under the IMA Article 455 (e)N/A. The Bank uses the standardised approach.
36 EU MR2-BRWA flow statements of market risk exposures under the IMA Article 455 (e)
N/A. The Bank uses the standardised approach.
37 EU MR3 IMA values for trading portfolios Article 455 (d)N/A. The Bank uses the standardised approach.
38 EU MR4Comparison of VaR estimates with gains/losses Article 455 (g)
The Bank uses the standardised approach.

10 11BIL – PILLAR 3 Semi-Annual Report 2020 BIL – PILLAR 3 Semi-Annual Report 2020
Introduction
This document gives additional information on the risk management of Banque Internationale à Luxembourg (hereafter “BIL” or “the Bank”) as of 30 June 2020. The purpose of Pillar 3 of the Basel framework is to enrich the minimum requirements of funds (Pillar 1) and the process of prudential supervision (Pillar 2) with a set of data complementing the financial communication.
This semi-annual report meets the consolidated disclosure requirements related to Part Eight of the Regulation (EU) No 575/2013, known as the Capital Requirements Regulation (CRR), the circular CSSF 15/618 which is the transposition of the EBA guidelines on materiality, the CSSF regulation 14-01, which is the transposition of the CRR into national law, thereby setting the regulatory prudential framework applicable to Luxembourgish credit institutions, and the circular CSSF 17/673 on the adoption of the European Banking Authority (EBA) Guidelines on disclosure requirements under Part Eight of the Regulation.
The report is realised at a consolidated level, including subsidiaries and branches of BIL Group.
As the ultimate parent company, BIL is a banking Group located in Luxembourg at 69, route d’Esch, L-2953 Luxembourg and counts about 2,000 employees. BIL is present in the financial centre of Luxembourg, Switzerland (since 1984), Denmark (since 2000), the People’s Republic of China (Beijing since 2019 and Hong Kong since 2020).
This BIL Group’s Pillar 3 semi-annual disclosure Report is divided into five sections: • The Bank’s capital management and capital adequacy; • The credit risk management and provides detailed
breakdowns of the Bank’s credit risk exposures;• The assessment of market risk;• Important events after June 2020;• A focus on COVID-19 situation.
Unless otherwise stated, the figures disclosed in this Report are reported in millions of euros.
Data is provided at a consolidated level, including subsidiaries and branches of BIL Group.
BIL will publish its full 2020 Pillar 3 Report in 2021.
In addition to this document, all risk and financial reports are available on the Bank’s website (www.bil.com).
10 11BIL – PILLAR 3 Semi-Annual Report 2020 BIL – PILLAR 3 Semi-Annual Report 2020
1. Own funds and capital adequacy
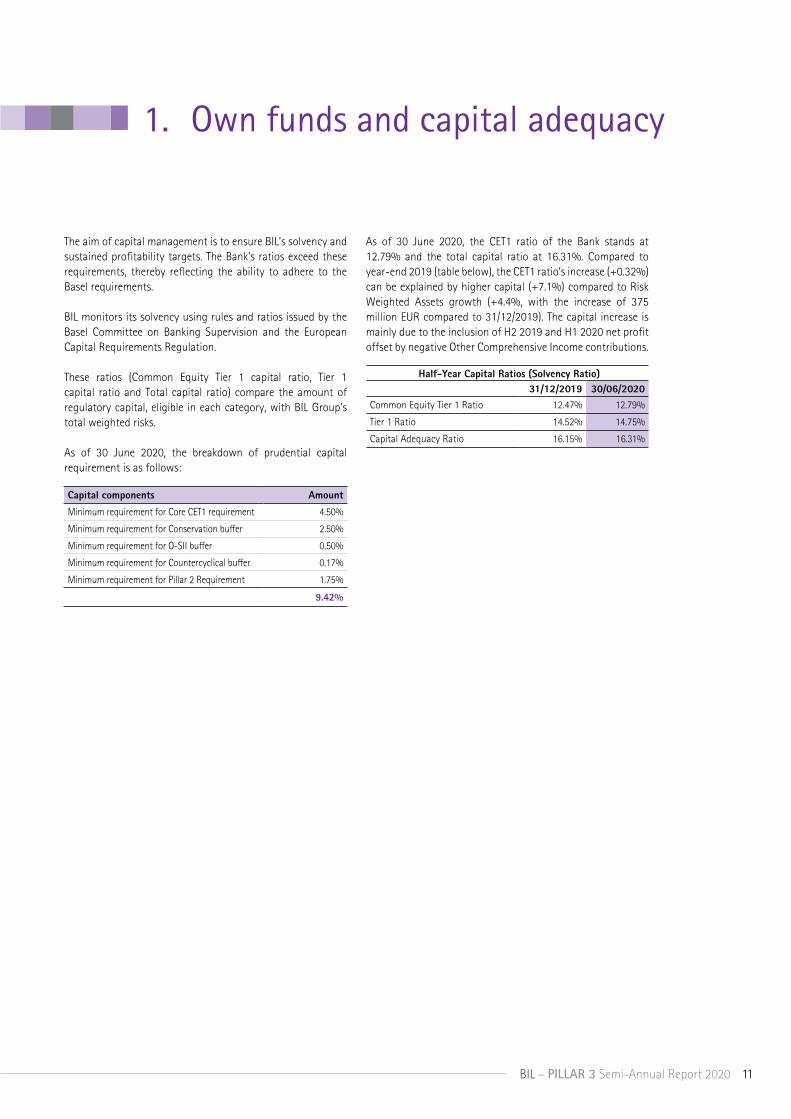
The aim of capital management is to ensure BIL’s solvency and sustained profitability targets. The Bank's ratios exceed these requirements, thereby reflecting the ability to adhere to the Basel requirements.
BIL monitors its solvency using rules and ratios issued by the Basel Committee on Banking Supervision and the European Capital Requirements Regulation.
These ratios (Common Equity Tier 1 capital ratio, Tier 1 capital ratio and Total capital ratio) compare the amount of regulatory capital, eligible in each category, with BIL Group’s total weighted risks.
As of 30 June 2020, the breakdown of prudential capital requirement is as follows:
As of 30 June 2020, the CET1 ratio of the Bank stands at 12.79% and the total capital ratio at 16.31%. Compared to year-end 2019 (table below), the CET1 ratio’s increase (+0.32%) can be explained by higher capital (+7.1%) compared to Risk Weighted Assets growth (+4.4%, with the increase of 375 million EUR compared to 31/12/2019). The capital increase is mainly due to the inclusion of H2 2019 and H1 2020 net profit offset by negative Other Comprehensive Income contributions.
Capital components Amount
Minimum requirement for Core CET1 requirement 4.50%
Minimum requirement for Conservation buffer 2.50%
Minimum requirement for O-SII buffer 0.50%
Minimum requirement for Countercyclical buffer 0.17%
Minimum requirement for Pillar 2 Requirement 1.75%
9.42%
Half-Year Capital Ratios (Solvency Ratio)31/12/2019 30/06/2020
Common Equity Tier 1 Ratio 12.47% 12.79%
Tier 1 Ratio 14.52% 14.75%
Capital Adequacy Ratio 16.15% 16.31%
12 BIL – PILLAR 3 Semi-Annual Report 2020
Own funds and capital adequacy
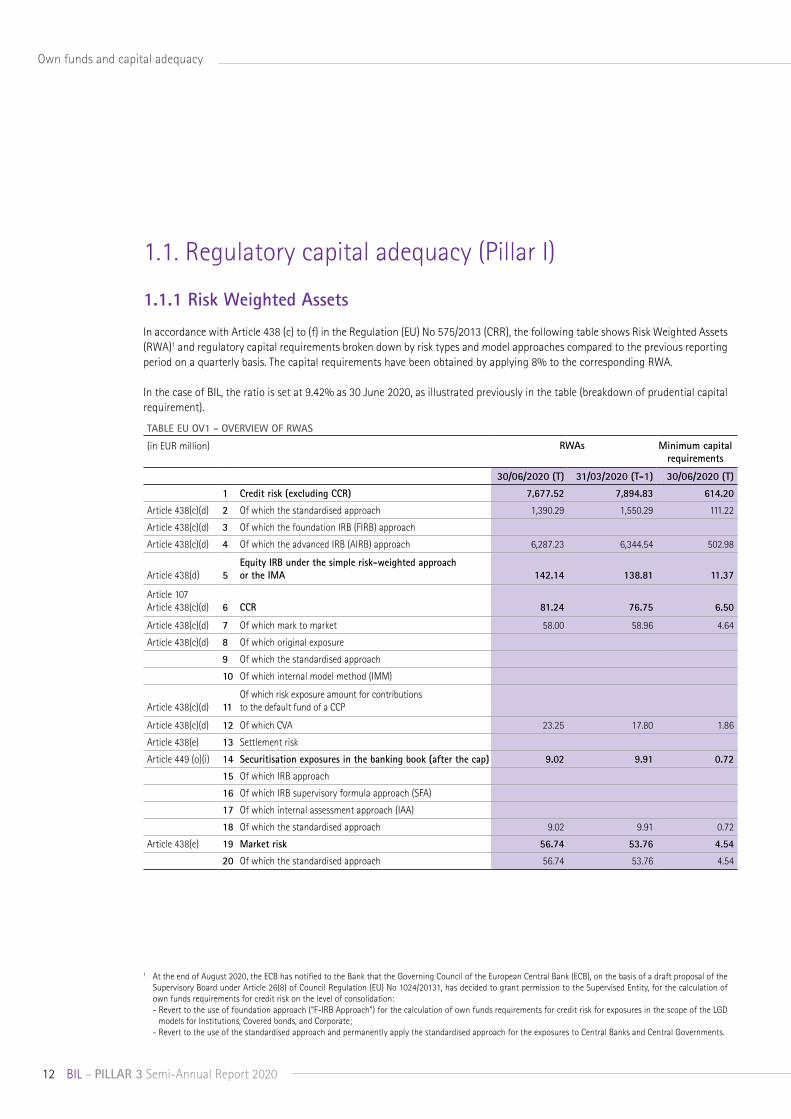
TABLE EU OV1 - OVERVIEW OF RWAS
(in EUR million) RWAs Minimum capital requirements
30/06/2020 (T) 31/03/2020 (T-1) 30/06/2020 (T)
1 Credit risk (excluding CCR) 7,677.52 7,894.83 614.20
Article 438(c)(d) 2 Of which the standardised approach 1,390.29 1,550.29 111.22
Article 438(c)(d) 3 Of which the foundation IRB (FIRB) approach
Article 438(c)(d) 4 Of which the advanced IRB (AIRB) approach 6,287.23 6,344.54 502.98
Article 438(d) 5Equity IRB under the simple risk-weighted approach or the IMA 142.14
138.81
11.37
Article 107 Article 438(c)(d) 6 CCR 81.24 76.75 6.50
Article 438(c)(d) 7 Of which mark to market 58.00 58.96 4.64
Article 438(c)(d) 8 Of which original exposure
9 Of which the standardised approach
10 Of which internal model method (IMM)
Article 438(c)(d) 11Of which risk exposure amount for contributions to the default fund of a CCP
Article 438(c)(d) 12 Of which CVA 23.25 17.80 1.86
Article 438(e) 13 Settlement risk
Article 449 (o)(i) 14 Securitisation exposures in the banking book (after the cap) 9.02 9.91 0.72
15 Of which IRB approach
16 Of which IRB supervisory formula approach (SFA)
17 Of which internal assessment approach (IAA)
18 Of which the standardised approach 9.02 9.91 0.72
Article 438(e) 19 Market risk 56.74 53.76 4.54
20 Of which the standardised approach 56.74 53.76 4.54
1.1. Regulatory capital adequacy (Pillar I)
1.1.1 Risk Weighted Assets
In accordance with Article 438 (c) to (f) in the Regulation (EU) No 575/2013 (CRR), the following table shows Risk Weighted Assets (RWA)1 and regulatory capital requirements broken down by risk types and model approaches compared to the previous reporting period on a quarterly basis. The capital requirements have been obtained by applying 8% to the corresponding RWA.
In the case of BIL, the ratio is set at 9.42% as 30 June 2020, as illustrated previously in the table (breakdown of prudential capital requirement).
1 At the end of August 2020, the ECB has notified to the Bank that the Governing Council of the European Central Bank (ECB), on the basis of a draft proposal of the Supervisory Board under Article 26(8) of Council Regulation (EU) No 1024/20131, has decided to grant permission to the Supervised Entity, for the calculation of own funds requirements for credit risk on the level of consolidation:- Revert to the use of foundation approach (“F-IRB Approach”) for the calculation of own funds requirements for credit risk for exposures in the scope of the LGD
models for Institutions, Covered bonds, and Corporate;- Revert to the use of the standardised approach and permanently apply the standardised approach for the exposures to Central Banks and Central Governments.

13BIL – PILLAR 3 Semi-Annual Report 2020
Own funds and capital adequacy
(in EUR million) RWAs Minimum capital requirements
21 Of which IMA
Article 438(e) 22 Large exposures
Article 438(f) 23 Operational risk 951.70 951.70 76.14
24 Of which basic indicator approach
25 Of which standardised approach 951.70 951.70 76.14
26 Of which advanced measurement approach
Article 437(2), Article 48 and Article 60 27
Amounts below the thresholds for deduction (subject to 250% risk weight)
Article 500 28 Floor adjustment
30 TOTAL 8,918.37 9,125.76 713.47
The Bank’s total RWA amounted to EUR 8.92 billion as of 30 June 2020, compared to EUR 9.13 billion as of 31 March 2020. The overall decrease of EUR 207.39 million mainly reflects a decrease in credit risk RWA.
Market risk RWA increased slightly by EUR 2.98 million and operational RWA remained unchanged from Q1 to Q2 in 2020.
1.1.1.1. Weighted risks
Since the setup of the Basel framework, the Bank has been compliant with capital requirements related to credit, market, operational and counterparty risk and publishing its solvency ratios.
For credit risk, BIL Group applies the Advanced-Internal Rating Based (A-IRB) approach for its main counterparties (i.e. Sovereigns, Banks, Corporate, SMEs and Retail) to compute associated RWA. When it comes to market risk, the Bank has adopted the standardised approach; this choice is based on the Bank’s moderate trading activity, whose main purpose is to serve BIL’s customers for the purchase or sale of bonds, foreign currencies, equities and structured products. The standardised approach is also used for the calculation of the risk weights related to operational risks.

14 BIL – PILLAR 3 Semi-Annual Report 2020
Own funds and capital adequacy
1.1.3 Non-deducted participations in insurance undertakings
The Bank hereby discloses the information required by Article 438(c) and (d) in the Regulation (EU) No 575/2013 (CRR) on exposures that are risk-weighted in accordance with Part Three, Title II, Chapter 2 or Chapter 3 by specifying information regarding non-deducted participations risk-weighted, when allowed (in accordance with Article 49(1) in the Regulation (EU) No 575/2013 (CRR)) to not deduct their holdings of own funds instruments of an insurance undertaking, a re-insurance undertaking or an insurance holding company.
TABLE EU INS1 – NON-DEDUCTED PARTICIPATIONS IN INSURANCE UNDERTAKINGS
Value
Holdings of own funds instruments of a financial sector entity where the institution has a significant investment not deducted from own funds (before risk-weighted)
6.85
TOTAL RWAs 15.47
TABLE EU CR10 - IRB (SPECIALISED LENDING AND EQUITIES)(in EUR million) SPECIALISED LENDINGRegulatory categories
Remaining maturity
On-balance-sheet amount
Off-balance-sheet amount
Risk weight
Exposure amount
RWAs Expected losses
Category 1Less than 2.5 years 72.90 3.08 50% 75.98 39.86
Equal to or more than 2.5 years
418.39
122.92 70%
541.30 397.49 2.17
Category 2Less than 2.5 years 502.22 25.99 70% 528.20 385.22 2.11
Equal to or more than 2.5 years 603.48
181.39 90% 784.87
740.76 6.28
Category 3Less than 2.5 years 30.22 0.26 115% 30.48 36.16 0.85
Equal to or more than 2.5 years 14.81 5.16 115% 19.97 24.12 0.56
Category 4Less than 2.5 years 250%
Equal to or more than 2.5 years 250%
Category 5Less than 2.5 years
Equal to or more than 2.5 years 12.79 0.67
13.46
6.73
TOTALLess than 2.5 years 605.34 29.33 634.67 461.24 2.97
Equal to or more than 2.5 years 1,049.47 310.14 1,359.61 1,162.36 15.73
(in EUR million) EQUITIES UNDER THE SIMPLE RISK-WEIGHTED APPROACH
Categories On-balance-sheet amount
Off-balance-sheet amount
Risk weight Exposure amount
RWAs Capital requirements
Private equity exposures 29.74 0 190% 29.74 56.50 4.52 Exchange-traded equity exposures 0.00 0 290% 0,00 0.00 0.00 Other equity exposures 3.13 0 370% 3.13 11.58 0.93 TOTAL 32.87 0 32.87 68.09 5.45
1.1.2 Equity exposures in the banking book
In compliance with the last paragraph of Article 438 in the Regulation (EU) No 575/2013 (CRR), the following table shows risk-weighted exposure amounts.

15BIL – PILLAR 3 Semi-Annual Report 2020
Own funds and capital adequacy
1.2. Leverage ratio The leverage ratio (LR) was introduced by the Basel Committee to serve as a simple and non-risk-based ratio to complete the existing risk-based capital requirements1.
The Basel III leverage ratio is defined as the capital measure divided by the total exposure, with this ratio expressed as a percentage and having to exceed a minimum of 3%.
The capital measure for the leverage ratio is the Tier 1 capital taking account transitional arrangements2. The total exposure corresponds to the sum of the following exposures: (a) on-balance sheet exposure, (b) derivative exposure, (c) securities financing transaction (SFT) exposure, and (d) off-balance sheet (OBS) items.
As at 30 June 2020, BIL Group’s leverage ratio stood at 4.11%, compared to the year-end 2019 level of 4.08%. This level is supported by the Bank’s limited use of derivatives and securities financing transactions. The composition of BIL Group’s exposure reflects its business model, based on a commercial orientation.
The Bank considers the leverage ratio in its capital and financial planning to ensure that levels are consistent with the Basel leverage ratio requirement. The Bank actively manages its balance sheet size through its Treasury and ALM desks.
The leverage ratio is discussed on a regular basis at senior management level as it is part of the Bank’s Risk Appetite framework.
(in EUR million) 31/12/2019 30/06/2020
Tier 1 Capital 1,240.36 1,315.60
Total Exposure 30,412.12 32,034.36
LEVERAGE RATIO 4.08% 4.11%
1 Final draft ITS amending ITS on LR Disclosure (EBA-ITS-2014-04-rev1).2 The capital measure for the leverage ratio is the Tier 1 capital of the risk-based capital framework as defined in paragraphs 49 to 96 of the Basel III framework taking
account of the transitional arrangements. The Basel Committee is using the transition period to monitor banks’ leverage ratio data on a semi-annual basis to assess whether the proposed design and calibration of a minimum Tier 1 leverage ratio of 3% is appropriate over a full credit cycle and for different types of business models.

16 BIL – PILLAR 3 Semi-Annual Report 2020
1 According to the Article 178 of the CRR: A default shall be considered to have occurred with regard to a particular obligor when either or both of the following have taken place: (a) the institution considers that the obligor is unlikely to pay its credit obligations to the institution, the parent undertaking or any of its subsidiaries in full, without recourse by the institution to actions such as realising security; (b)the obligor is more than 90 days past due on any material credit obligation to the institution, the parent undertaking or any of its subsidiaries. Competent authorities may replace the 90 days with 180 days for exposures secured by residential property or SME commercial immovable property in the retail exposure class, as well as exposures to public sector entities. The 180 days shall not apply for the purposes of point (m) Article 36(1) or Article 127. In the case of retail exposures, institutions may apply the definition of default laid down in points (a) and (b) of the first subparagraph at the level of an individual credit facility rather than in relation to the total obligations of a borrower.
2. Credit risk
Credit risk represents the potential loss (reduction in value of an asset or payment default) that BIL may incur because of a deterioration in the solvency of any counterparty.
2.1 Credit risk exposureThe metrics used to measure risk exposure may differ from accounting metrics. (1) Gross carrying amount:
The accounting value before any allowance/impairments and CRM techniques are not taken into consideration. In the context of IFRS9, it refers to amortised cost of financial asset, before adjusting for any loss allowance.
(2) Net value of exposure: for on-balance-sheet items, the net value is the gross carrying value of exposure less allowances/impairments.
(3) The credit risk exposure measure known as exposure-at-default (EAD), which is used for the calculation of regulatory capital requirements includes (a) current and potential future exposures, and (b) credit risk mitigants (CRM) covering those exposures (under the form of netting agreements, financial collateral for derivatives and repo exposures, and guarantees for others).
(4) Moreover, BIL has defined an internal measure compliant with IFRS 7 norms, known as maximum credit risk exposure (MCRE) to compare figures published in the annual financial statements. This metric corresponds to the EAD with a credit conversion factor (CCF) of 100%, after deduction of specific provisions and financial collateral (netting agreements).
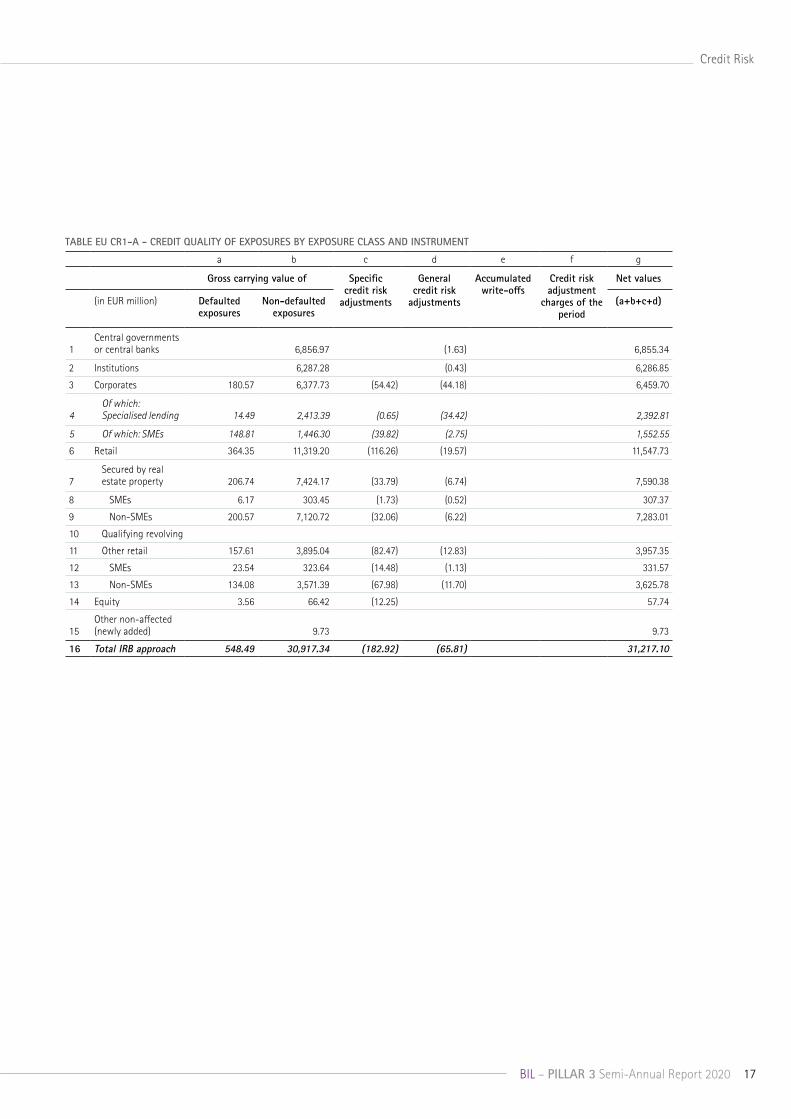
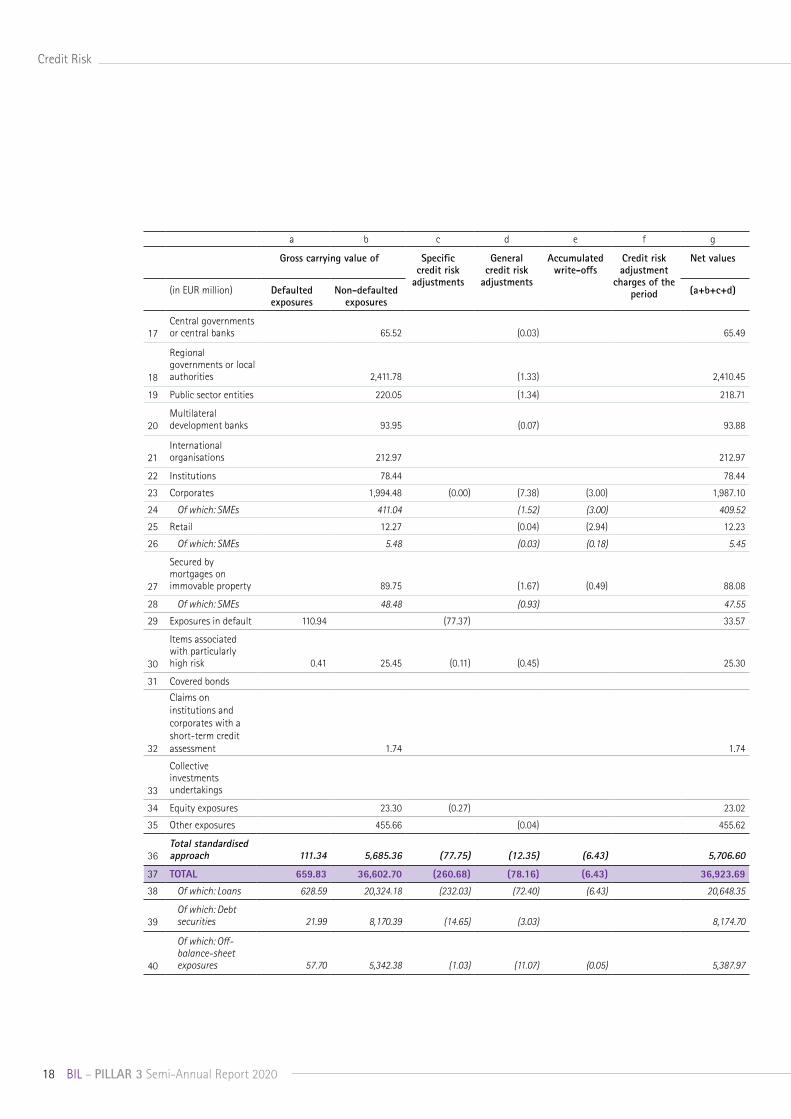
2.1.1 Credit quality of exposures
In the application of Article 442 (g) in the Regulation (EU) No 575/2013 (CRR), the tables below provide a breakdown of defaulted1 and non-defaulted exposures by regulatory exposure classes and industries respectively. It comprises figures obtained using both the standardised and the advanced methods.
The industry classification is based on NACE codes, which is a European industry standard system for classifying business activities.
17BIL – PILLAR 3 Semi-Annual Report 2020
Credit Risk
a b c d e f g
Gross carrying value of Specific credit risk
adjustments
General credit risk
adjustments
Accumulated write-offs
Credit risk adjustment
charges of the period
Net values
(in EUR million) Defaulted exposures
Non-defaulted exposures
(a+b+c+d)
1Central governments or central banks 6,856.97 (1.63) 6,855.34
2 Institutions 6,287.28 (0.43) 6,286.85
3 Corporates 180.57 6,377.73 (54.42) (44.18) 6,459.70
4Of which: Specialised lending 14.49
2,413.39 (0.65) (34.42) 2,392.81
5 Of which: SMEs 148.81 1,446.30 (39.82) (2.75) 1,552.55
6 Retail 364.35 11,319.20 (116.26) (19.57) 11,547.73
7Secured by real estate property 206.74
7,424.17 (33.79) (6.74)
7,590.38
8 SMEs 6.17 303.45 (1.73) (0.52) 307.37
9 Non-SMEs 200.57 7,120.72 (32.06) (6.22) 7,283.01
10 Qualifying revolving
11 Other retail 157.61 3,895.04 (82.47) (12.83) 3,957.35
12 SMEs 23.54 323.64 (14.48) (1.13) 331.57
13 Non-SMEs 134.08 3,571.39 (67.98) (11.70) 3,625.78
14 Equity 3.56 66.42 (12.25) 57.74
15Other non-affected (newly added)
9.73 9.73
16 Total IRB approach 548.49 30,917.34 (182.92) (65.81) 31,217.10
TABLE EU CR1-A - CREDIT QUALITY OF EXPOSURES BY EXPOSURE CLASS AND INSTRUMENT
18 BIL – PILLAR 3 Semi-Annual Report 2020
Credit Risk
a b c d e f g
Gross carrying value of Specific credit risk
adjustments
General credit risk
adjustments
Accumulated write-offs
Credit risk adjustment
charges of the period
Net values
(in EUR million) Defaulted exposures
Non-defaulted exposures
(a+b+c+d)
17Central governments or central banks 65.52 (0.03)
65.49
18
Regional governments or local authorities 2,411.78 (1.33) 2,410.45
19 Public sector entities 220.05 (1.34) 218.71
20Multilateral development banks 93.95 (0.07) 93.88
21International organisations 212.97 212.97
22 Institutions 78.44 78.44
23 Corporates 1,994.48 (0.00) (7.38) (3.00) 1,987.10
24 Of which: SMEs 411.04 (1.52) (3.00) 409.52
25 Retail 12.27 (0.04) (2.94) 12.23
26 Of which: SMEs 5.48 (0.03) (0.18) 5.45
27
Secured by mortgages on immovable property 89.75 (1.67) (0.49) 88.08
28 Of which: SMEs 48.48 (0.93) 47.55
29 Exposures in default 110.94 (77.37) 33.57
30
Items associated with particularly high risk 0.41 25.45 (0.11) (0.45) 25.30
31 Covered bonds
32
Claims on institutions and corporates with a short-term credit assessment 1.74 1.74
33
Collective investments undertakings
34 Equity exposures 23.30 (0.27) 23.02
35 Other exposures 455.66 (0.04) 455.62
36Total standardised approach 111.34 5,685.36 (77.75) (12.35) (6.43) 5,706.60
37 TOTAL 659.83 36,602.70 (260.68) (78.16) (6.43) 36,923.69
38 Of which: Loans 628.59 20,324.18 (232.03) (72.40) (6.43) 20,648.35
39Of which: Debt securities 21.99 8,170.39 (14.65) (3.03) 8,174.70
40
Of which: Off-balance-sheet exposures 57.70 5,342.38 (1.03) (11.07) (0.05) 5,387.97

19BIL – PILLAR 3 Semi-Annual Report 2020
Credit Risk
a b c d e f g
Gross carrying value of Specific credit risk
adjustments
General credit risk
adjustments
Accumulated write-offs
Credit risk adjustment
charges of the period
Net values
(in EUR million) Defaulted exposures
Non-defaulted exposures
(a+b+c+d)
Administrative and support service activities 2.75 218.08 (0.74) (0.84) (0.03) 219.25
Agriculture, forestry and fishing 0.87 152.81 (0.42) (0.31)
152.95
Mining and quarrying 0.00 5.60 (0.00) 5.61
Manufacturing 26.10 958.90 (15.80) (2.43) (0.01) 966.76
Electricity, gas, steam and air conditioning supply 30.49
191.75 (15.00) (1.67)
205.57
Financial and insurance activities 330.28
19,807.98 (145.36) (24.78) (2.28) 19,968.12
Water supply 0.02 11.81 (0.01) (0.01) 11.81
Construction 29.31 2,208.75 (11.62) (16.07) (3.07) 2,210.37
Wholesale and retail trade 23.83 903.59 (13.36) (1.84) (0.08) 912.23
Transport and storage 11.27 399.55 (4.42) (0.29) (0.01) 406.11
Accommodation and food service activities 10.07 525.78 (3.42) (1.81) (0.15) 530.62
Information and communication 6.90 281.32 (2.87) (1.45) 283.90
Real estate activities 133.66 2,902.35 (30.67) (19.22) (0.48) 2,986.11
Professional, scientific and technical activities 43.81 684.74 (8.14) (1.68) 718.73
Public admnistration and defence, compulsory social security 0.61 5,580.05 (0.28) (3.22) 5,577.17
Education 0.11 58.80 (0.05) (0.10) 58.76
Human health services and social work activities 3.69
597.55 (1.21) (1.54) (0.32) 598.48
Arts, entertainment and recreation 3.09 101.42 (1.81) (0.19) 102.51
Other services 2.97 1,066.97 (5.50) (0.73) 1,063.71
TOTAL 659.83 36,657.81 (260.68) (78.18) (6.43) 36,978.78
TABLE EU CR1-B - CREDIT QUALITY OF EXPOSURES BY INDUSTRY

20 BIL – PILLAR 3 Semi-Annual Report 2020
Credit Risk
2.1.2 Credit quality of exposures by geographical area
In the application of Article 442 (h) in the Regulation (EU) No 575/2013 (CRR), the table below provides a breakdown of defaulted and non-defaulted exposures by geographical areas. It comprises figures related to both the standardised and the advanced approaches. The geographical distribution is based on the legal residence of the counterparty or issuer.
a b c d e f g
Gross carrying value of Specific credit risk
adjustments
General credit risk
adjustments
Accumulated write-offs
Credit risk adjustment charges of the period
Net values
(in EUR million) Defaulted exposures
Non-defaulted exposures
(a+b+c+d)
1 Europe 576.39 33,691.10 (184.88) (76.76) (6.36) 34,005.86
2Of which: Luxembourg 362.65
17,700.17 (98.75) (61.54) (5.23) 17,902.52
3 Of which: France 123.72 4,471.42 (35.62) (4.87) (0.73) 4,554.64
4Of which: Switzerland
5.18
2,899.83 (7.91) (0.22)
2,896.88
5 Of which: Belgium 14.49 2,125.79 (2.46) (2.08) (0.01) 2,135.74
6 Of which: Germany 30.43 1,854.67 (18.95) (2.72) (0.39) 1,863.42
7United States and Canada
0.07 982.10 (4.23) (0.66) 977.28
8South and Central America
1.48 63.95 (0.15) (0.08) (0.07)
65.21
9 Asia 12.68 1,063.97 (2.38) (0.44) 1,073.83
10Other geographical areas 69.21
856.68 (69.04) (0.24)
856.61
11 TOTAL 659.83 36,657.81 (260.68) (78.18) (6.43) 36,978.78
TABLE EU CR1-C - CREDIT QUALITY OF EXPOSURES BY GEOGRAPHY
2.2 Forbearance, impairment, past due and provisions
2.2.1 Ageing of past-due exposure
The following table provides an ageing analysis of past-due exposures regardless of their impairment status at mid of 2020.
a b cGross carrying values
(in EUR million) ≤ 30 days > 30 days ≤ 90 days > 90 days1 Loans 31.96 22.32 175.46 2 Debt securities3 TOTAL EXPOSURES 31.96 22.32 175.46
TABLE EU CR1-D - AGEING OF PAST-DUE EXPOSURES

BIL – PILLAR 3 Semi-Annual Report 2020 21
Credit Risk
2.2.2 Information on forborne exposure and non-performing loans
Forborne exposuresBIL closely monitors its forborne exposures, in line with the definition of the Official Journal of the European Union dated February 2015.
According to the EBA definition: “Forborne exposures are debt contracts in respect of which forbearance measures have been extended. Forbearance measures consist of concessions towards a debtor facing or about to face difficulties in meeting their financial commitments (“financial difficulties”).” These measures include the granting of extensions, postponements, renewals or changes in credit terms and conditions, including the repayment plan.
Once these criteria are met, the credit files are flagged as forborne or restructured, and are added to a list closely followed by a dedicated department of the Bank “Gestion Intensive et Particulière”.
For all counterparties, dedicated analyses are carried out at single credit file level to identify those that should be classified as forborne according to the regulatory definition. The granting of the forbearance measure is set up to better match the borrower’s repayment capacity.
For credit files in forbearance and in case of early repayment, the costs related to these transactions are either borne by the debtor (in one shot or spread over the term of the new loan) or recognised directly in the Bank’s profit and loss.
As of June 2020, BIL Group's forborne exposures amounted to EUR 290 million.
Non-performing exposuresExposures (loans, debt securities, off-balance-sheet items) other than held for trading that satisfy either or both of the following criteria:
(a) material exposures which are more than 90 days past-due;
(b) the debtor is assessed as unlikely to pay its credit obligations in full without realisation of collateral, regardless of the existence of any past-due amount or the number of days past due.
Non-performing exposures include the defaulted and impaired exposures. The total NPE is given by the sum of non-performing loans, non-performing debt securities and non-performing off-balance-sheet items. See also EBA Implementing Technical Standard (ITS) on Supervisory Reporting (Forbearance and non-performing exposures).
Exposures in respect of which a default is considered to have occurred and exposures that have been identified as impaired (IFRS) are always considered as NPE.

22 BIL – PILLAR 3 Semi-Annual Report 2020
Credit Risk
TABL
E EU
CR1
-E -
NO
N-P
ERFO
RMIN
G AN
D FO
RBO
RNE
EXPO
SURE
S
ab
cd
ef
gh
ij
kl
m
Gros
s ca
rryi
ng v
alue
of
perf
orm
ing
and
non-
perf
orm
ing
expo
sure
sAc
cum
ulat
ed im
pairm
ent
and
prov
isio
ns a
nd n
egat
ive
fair
valu
e ad
just
men
ts d
ue t
o cr
edit
risk
Colla
tera
ls a
nd fi
nanc
ial
guar
ante
es r
ecei
ved
Of
whi
ch
perf
orm
ing
bu
t pa
st d
ue
> 30
day
s an
d <=
90
days
Of
whi
ch
perf
orm
ing
forb
orne
Of
whi
ch n
on-p
erfo
rmin
gO
n pe
rfor
min
g ex
posu
res
On
non-
perf
orm
ing
On
non-
perf
orm
ing
expo
sure
s
Of
whi
ch
forb
orne
ex
posu
res
Of
whi
ch
defa
ulte
dO
f w
hich
im
paire
dO
f w
hich
fo
rbor
neO
f w
hich
fo
rbor
neO
f w
hich
fo
rbor
ne
010
Debt
se
curit
ies
8,35
8,94
21.9
9
21.9
9
21.9
9
(3
,06)
(1
4.65
)
7.
33
020
Loan
s an
d ad
vanc
es16
,768
,11 18
.10
14
2.72
57
8.44
57
5.77
57
8.01
15
7.88
(6
4,41
)
(0.4
5)
(222
.66)
(4
0.13
)
330.
20
254.
64
030
Off-b
a-la
nce-
shee
t ex
posu
res
4,40
9,27
1.30
53.7
6
41.9
3
53.7
4
10.5
2
(11.
11)
(0
.00)
(1
.49)
0.01

23BIL – PILLAR 3 Semi-Annual Report 2020
Credit Risk
2.2.3 Changes in the stock of specific credit risk adjustments
In the application of Article 442 (i) in the Regulation (EU) No 575/2013 (CRR), the following table identifies the changes in the Bank’s stock of specific credit risk adjustments held against loans and debt securities that are defaulted or impaired.
2.2.4 Changes in the stock of defaulted and impaired loans and debt securities
In the application of Article 442 (i) in the Regulation (EU) No 575/2013 (CRR), the following table identifies the changes in the Bank’s stock of defaulted and impaired loans and debt securities for the first half of the year 2020 (till June).
TABLE EU CR2-A – CHANGES IN THE STOCK OF GENERAL AND SPECIFIC CREDIT RISK ADJUSTMENTS a b
(in EUR million) Accumulated specific credit
risk adjustment
Accumulated general credit
risk adjustment
1 At 31 December 2019 243.56 56.36
2 Increases due to amounts set aside for estimated loan losses during the period 25.72 21.82
3 Decreases due to amounts set aside for estimated loan losses during the period
4 Decreases due to amounts taken against accumulated credit risk adjustment (2.25)
5 Transfers between credit risk adjustment
6 Impact of exchange rate differences 0.08
7 Business combinations, including acquisitions and disposals of subsidiaries
8 Other adjustments
9 At 30 June 2020 260.68 78.18
10 Recoveries on credit risk adjustments recorded directly to the statements of profit and loss
11 Specific credit risk adjustments directly recorded to the statement of profit and loss (6.43)
TABLE EU CR2-B – CHANGES IN THE STOCK OF DEFAULTED
AND IMPAIRED LOANS AND DEBT SECURITIES
a
(in EUR million) Gross carrying value defaulted exposures
1 31 December 2019 629.72
2
Loans and debt securities that have defaulted or impaired since the last reporting period 118.81
3 Returned to non-defaulted status (30.68)
4 Amounts written off (6.43)
5 Other changes (51.59)
6 30 June 2020 659.83
2.3 Credit risk mitigation
2.3.1 Overview of credit risk mitigation techniques
In the application of Article 453 (f) and (g) in the Regulation (EU) No 575/2013 (CRR), this table provides an overview of the credit exposure covered by Basel III-eligible credit risk mitigation (CRM) - after regulatory haircuts - and includes all collateral and financial guarantees used as credit risk mitigants for all secured exposures, irrespective of whether the standardised approach or IRB approach is used for RWA calculations. This table also includes the carrying amounts of the total population which are in default. Unsecured exposures (column a) represent the carrying amount of credit risk exposures (net of credit risk adjustments) that do not benefit from a CRM technique, regardless of whether this technique is recognised in the CRR. Exposures secured (column b) represent the carrying amount of exposures that have at least one associated CRM mechanism (collateral, financial guarantees).

24 BIL – PILLAR 3 Semi-Annual Report 2020
Credit Risk
2.4 Standardised approach
2.4.1 Standardised approach – Credit risk exposure and credit risk mitigation effects
The following table shows credit risk exposure before credit conversion factor (CCF) and credit risk mitigation (CRM) and the exposure-at-default (EAD)1 broken down by exposure classes and with a split in on- and off-balance sheet exposures, under the standardised approach.
Exposures subject to the counterparty credit risk (CCR) and securitisation risk framework are excluded from this template. RWA density expresses the ratio of total risk-weighted exposures, post CCF and CRM.
TABLE EU CR3 – CRM TECHNIQUES – OVERVIEWa b c d e
(in EUR million) Exposures unsecured -
Carrying amount
Exposures secured -
Carrying amount
Exposures secured by collateral
Exposures secured by guarantees
Exposures secured by credit
derivatives
1 Total loans 9,735.34 10,074.31 9,795.93 278.38
2 Total debt securities 7,375.40 802.33 802.33
3 Total exposures 17,110.73 10,876.64 9,795.93 1,080.71
4 Of which defaulted 154.85 227.19 227.19
The Bank does not have any credit derivatives as credit risk mitigants.
a b c d e f
(in EUR million) Exposures before CCF and CRM
Exposures post CCF and CRM
RWAs and RWA density
On-balance-sheet amount
Off-balance-sheet amount
On-balance-sheet amount
Off-balance-sheet amount
RWAs RWA density
Exposure classes
1 Central governments or central banks 33.14 32.39 33.14 16.19 71.53 145%
2 Regional government or local authority 2,409.42 2,409.42 102.58 4%
3 Public sector entities 159.34 60.71 86.18 3.23 6.63 7%
4 Multilateral development banks 92.72 104.27 0.41 0%
5 International organisations 204.94 204.94 0%
6 Institutions 0.05 0.10 0.05 0.03 0.02 20%
7 Corporates 1,160.89 831.76 737.37 103.22 791.92 94%
8 Retail 5.71 6.56 5.16 2.59 4.43 57%
9 Secured by mortgages on immovable property 89.72 0.03 89.67 0.01 81.45 91%
10 Exposures in default 11.88 20.62 11.88 4.40 21.37 131%
11 Exposures associated with particularly high risk 24.34 1.41 24.34 1.26 36.72 143%
12 Covered bonds 0%
13 Insitutions and corporates with a short-term credit assessment 1.69 20%
14 Collective investment undertakings 0%
15 Equity 23.02 23.02 57.56 250%
16 Other items 455.40 0.25 455.33 0.11 216.08 47%
17 TOTAL 4,672.27 953.82 4,184.76 131.45 1,390.29 32%
TABLE EU CR4 - CREDIT RISK EXPOSURE AND CRM EFFECTS
1 After CCF and CRM.

BIL – PILLAR 3 Semi-Annual Report 2020 25
Credit Risk
2.4.2 Standardised approach – exposures by asset classes and risk weights
In the application of Article 444 (e) in the Regulation (EU) No 575/2013 (CRR), the following table shows the exposure-at-default post conversion factor and risk mitigation broken down by exposure classes and risk weights, under the standardised approach.
Exposures subject to the counterparty credit risk and securitisation risk framework are excluded from this template.
(in EUR million) Risk weight Total Of which unrated
Exposure classes 0% 20% 50% 75% 100% 150% 250% Others Deducted
1 Central governments or central banks
20.72
28.61
49.33
2 Regional government or local authorities
1,896.52
512.89 2,409.42
3 Public sector entities 56.25 33.16 89.41
4 Multilateral development banks 104.67 104.67
5 International organisations 204.94 204.94
6 Institutions 0.08 0.08
7 Corporates 3.07 50.59 10.44 771.48 5.01 840.59 779.56
8 Retail 7.75 7.75 7.75
9Secured by mortgages on immovable property
13.62
76.06 89.68 89.68
10 Exposure in default 6.08 10.20 16.27
11Exposures associated with particularly high risk
0.30
25.31 25.60 12 Covered bonds
13
Institutions and corporates with a short-term credit assessment
14 Collective investment undertakings
15 Equity 23.02 23.02 23.02
16 Other items 239.36 216.08 223.20 678.64
17 TOTAL 2,525.54 596.72 24.07 7.75 1.069.99 35.50 56.65 223.20 4,539.42 900.01
TABLE EU CR5 – STANDARDISED APPROACH
26 BIL – PILLAR 3 Semi-Annual Report 2020
Credit Risk
2.5 Advanced Internal Ratings Based approach (A-IRB)The exposure data included in the quantitative disclosures is that used for calculating the Bank’s regulatory capital requirements. In what follows and unless otherwise stated, exposures will thus be expressed in terms of Exposure-at-Default (EAD).
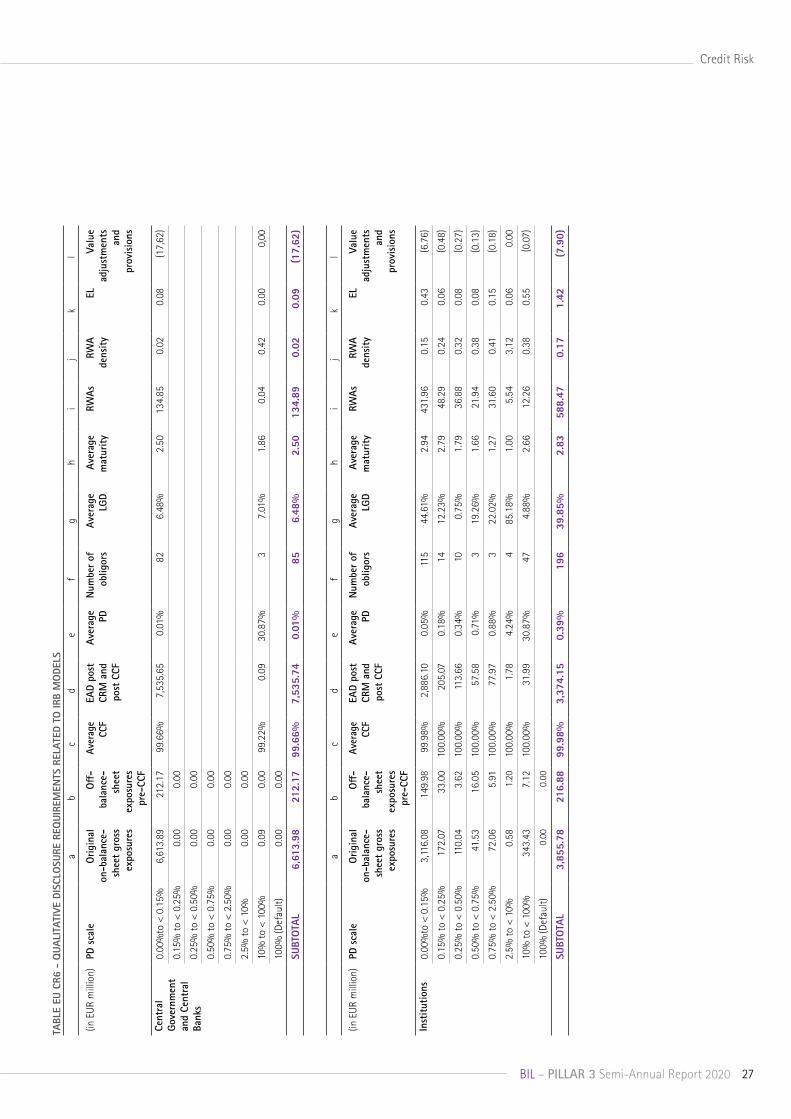
2.5.1 Credit risk exposures by exposure class and PD range
According to Article 452 (d-g) in the Regulation (EU) No 575/2013 (CRR), the following tables provide the main parameters used for the calculation of capital requirements for IRB models and show the exposure classes according to PD grades.
BIL – PILLAR 3 Semi-Annual Report 2020 27
Credit Riska
bc
de
fg
hi
jk
l
(in E
UR
mill
ion)
PD s
cale
Orig
inal
on
-bal
ance
-sh
eet
gros
s ex
posu
res
Off
- ba
lanc
e-sh
eet
expo
sure
s pr
e-CC
F
Aver
age
CCF
EAD
post
CR
M a
nd
post
CCF
Aver
age
PDN
umbe
r of
ob
ligor
sAv
erag
e LG
DAv
erag
e m
atur
ityRW
AsRW
A de
nsity
ELVa
lue
adju
stm
ents
an
d pr
ovis
ions
Cent
ral
Gove
rnm
ent
and
Cent
ral
Bank
s
0.00
%to
< 0
.15%
6,61
3.89
212.
1799
.66%
7,53
5.65
0.01
%82
6.48
%2.
5013
4.85
0.02
0.08
(17,
62)
0.15
% to
< 0
.25%
0.00
0.00
0.25
% to
< 0
.50%
0.00
0.00
0.50
% to
< 0
.75%
0.00
0.00
0.75
% to
< 2
.50%
0.00
0.00
2.5%
to <
10%
0.00
0.00
10%
to <
100
%0.
090.
0099
.22%
0.09
30.8
7%3
7.01
%1.
860.
040.
420.
000,
00
100%
(Def
ault)
0.00
0.00
SUBT
OTA
L6,
613.
9821
2.17
99.6
6%7,
535.
740.
01%
856.
48%
2.50
134.
890.
020.
09(1
7,62
)
ab
cd
ef
gh
ij
kl
(in E
UR
mill
ion)
PD s
cale
Orig
inal
on
-bal
ance
-sh
eet
gros
s ex
posu
res
Off
- ba
lanc
e-sh
eet
expo
sure
s pr
e-CC
F
Aver
age
CCF
EAD
post
CR
M a
nd
post
CCF
Aver
age
PDN
umbe
r of
ob
ligor
sAv
erag
e LG
DAv
erag
e m
atur
ityRW
AsRW
A de
nsity
ELVa
lue
adju
stm
ents
an
d pr
ovis
ions
Inst
itutio
ns0.
00%
to <
0.1
5%3,
116.
0814
9.98
99.9
8%2,
886.
100.
05%
115
44.6
1%2.
9443
1.96
0.1
5 0
.43
(6.7
6)
0.15
% to
< 0
.25%
172.
0733
.00
100.
00%
205.
070.
18%
1412
.23%
2.79
48.2
9 0
.24
0.0
6 (0
.48)
0.25
% to
< 0
.50%
110.
043.
6210
0.00
%11
3.66
0.34
%10
0.75
%1.
7936
.88
0.3
2 0
.08
(0.2
7)
0.50
% to
< 0
.75%
41.5
316
.05
100.
00%
57.5
80.
71%
319
.26%
1.66
21.9
4 0
.38
0.0
8 (0
.13)
0.75
% to
< 2
.50%
72.0
65.
9110
0.00
%77
.97
0.88
%3
22.0
2%1.
2731
.60
0.4
1 0
.15
(0.1
8)
2.5%
to <
10%
0.58
1.20
100.
00%
1.78
4.24
%4
85.1
8%1.
005.
54 3
.12
0.0
6 0.
00
10%
to <
100
%34
3.43
7.12
100.
00%
31.9
930
.87%
474.
88%
2.66
12.2
6 0
.38
0.5
5 (0
.07)
100%
(Def
ault)
0.00
0.00
SUBT
OTA
L3,
855.
7821
6.88
99.9
8%3,
374.
150.
39%
196
39.8
5%2.
8358
8.47
0.1
7 1
.42
(7.9
0)
TABL
E EU
CR6
- Q
UALI
TATI
VE D
ISCL
OSU
RE R
EQUI
REM
ENTS
REL
ATED
TO
IRB
MO
DELS

28 BIL – PILLAR 3 Semi-Annual Report 2020
Credit Risk
ab
cd
ef
gh
ij
kl
(in E
UR
mill
ion)
PD s
cale
Orig
inal
on
-bal
ance
-sh
eet
gros
s ex
posu
res
Off
- ba
lanc
e-sh
eet
expo
sure
s pr
e-CC
F
Aver
age
CCF
EAD
post
CR
M a
nd
post
CCF
Aver
age
PDN
umbe
r of
ob
ligor
sAv
erag
e LG
DAv
erag
e m
atur
ityRW
AsRW
A de
nsity
ELVa
lue
adju
stm
ents
an
d pr
ovis
ions
Corp
orat
es
- SM
E0.
00%
to <
0.1
5%
0.15
% to
< 0
.25%
0.5
0 10
0.00
%0.
500.
23%
117
.17%
1.00
0.07
13.8
3% 0
.00
0.0
0
0.25
% to
< 0
.50%
0.50
% to
< 0
.75%
40.
75
34.
83
95.6
1%81
.94
0.60
%31
14.3
6%3.
6424
.38
29.7
6% 0
.07
(0.1
9)
0.75
% to
< 2
.50%
358
.07
349
.82
89.2
0%47
1.26
1.59
%49
57.
78%
3.18
91.3
019
.37%
0.5
7 (1
.10)
2.5%
to <
10%
329
.84
194
.96
91.5
0%39
9.45
4.31
%26
85.
99%
2.60
73.5
118
.40%
1.0
5 (0
.94)
10%
to <
100
% 9
1.83
4
5.67
96
.55%
100.
4119
.80%
104
6.02
%3.
2929
.26
29.1
4% 1
.56
(0.2
4)
100%
(Def
ault)
134
.50
14.
32
98.8
7%13
2.61
100.
00%
567.
05%
2.19
82.8
862
.50%
37.
32
(37.
32)
SUBT
OTA
L 9
55.4
8 6
39.5
9 92
.13%
1,18
6.18
14.9
8%95
57.
40%
2.91
301.
4125
.41%
40.
57
(39
.78)
ab
cd
ef
gh
ij
kl
(in E
UR
mill
ion)
PD s
cale
Orig
inal
on
-bal
ance
-sh
eet
gros
s ex
posu
res
Off
- ba
lanc
e-sh
eet
expo
sure
s pr
e-CC
F
Aver
age
CCF
EAD
post
CR
M a
nd
post
CCF
Aver
age
PDN
umbe
r of
ob
ligor
sAv
erag
e LG
DAv
erag
e m
atur
ityRW
AsRW
A de
nsity
ELVa
lue
adju
stm
ents
an
d pr
ovis
ions
Corp
orat
es
- O
ther
0.00
%to
< 0
.15%
400
.78
62.
54
97.7
0%42
0.04
0.06
%24
38.4
9%3.
3711
1.28
26.4
9% 0
.10
(0.9
8)
0.15
% to
< 0
.25%
318
.04
54.
98
99.9
3%29
6.15
0.18
%20
46.3
0%3.
6417
6.85
59.7
1% 0
.25
(0.6
9)
0.25
% to
< 0
.50%
319
.86
48.
10
97.1
7%33
5.94
0.34
%23
46.5
7%3.
1825
4.20
75.6
7% 0
.53
(0.7
9)
0.50
% to
< 0
.75%
375
.19
169
.87
97.4
9%38
7.76
0.71
%33
54.8
0%3.
0746
7.17
120.
48%
1.5
1 (0
.91)
0.75
% to
< 2
.50%
338
.11
186
.26
91.3
3%39
8.63
1.15
%68
33.0
5%3.
5034
8.71
87.4
8% 1
.33
(0.9
3)
2.5%
to <
10%
102
.13
119
.26
86.1
8%13
7.92
3.31
%41
43.7
7%1.
8117
8.98
129.
77%
1.7
8 (0
.32)
10%
to <
100
% 0
.05
3.2
7 52
.26%
1.19
13.4
3%5
10.8
9%1.
840.
7664
.11%
0.0
2 (0
.00)
100%
(Def
ault)
17.
27
100.
00%
17.2
710
0.00
%3
63.8
3%1.
0510
.79
62.5
0% 1
3.95
(1
3.95
)
SUBT
OTA
L 1
,871
.44
644
.28
95.8
3%1,
994.
901.
57%
217
43.6
6%3.
221,
548.
7477
.64%
19.
46
(18
.58)

29BIL – PILLAR 3 Semi-Annual Report 2020
Credit Riska
bc
de
fg
hi
jk
l
(in E
UR
mill
ion)
PD s
cale
Orig
inal
on
-bal
ance
-sh
eet
gros
s ex
posu
res
Off
- ba
lanc
e-sh
eet
expo
sure
s pr
e-CC
F
Aver
age
CCF
EAD
post
CR
M a
nd
post
CCF
Aver
age
PDN
umbe
r of
ob
ligor
sAv
erag
e LG
DAv
erag
e m
atur
ityRW
AsRW
A de
nsity
ELVa
lue
adju
stm
ents
an
d pr
ovis
ions
Reta
il -
Secu
red
by
imm
ovab
le
prop
erty
SM
E
0.00
%to
< 0
.15%
100.
00%
0.09
0.23
%1
10.0
0%0.
00 0
.05
0.0
0 0
.00
0.15
% to
< 0
.25%
0.0
8 0
.01
0.25
% to
< 0
.50%
0.50
% to
< 0
.75%
30.
29
2.2
6 99
.84%
32.4
90.
59%
5210
.88%
3.34
10.2
8% 0
.02
(0.0
8)
0.75
% to
< 2
.50%
71.
05
9.5
2 97
.23%
75.2
81.
64%
216
11.5
2%12
.40
16.4
7% 0
.14
(0.1
8)
2.5%
to <
10%
90.
77
10.
71
98.3
5%96
.89
4.47
%23
611
.39%
25.6
626
.48%
0.4
9 (0
.23)
10%
to <
100
% 8
4.81
3
.94
99.3
7%87
.34
23.3
3%17
911
.17%
37.3
542
.76%
2.2
5 (0
.20)
100%
(Def
ault)
5.9
4 0
.23
99.7
5%6.
1310
0.00
%39
0.23
%3.
8362
.50%
1.7
3 (1
.73)
SUBT
OTA
L 2
82.9
4 2
6.68
98
.56%
298.
2310
.82%
723
11.0
7%82
.58
27.6
9% 4
.64
(2.
42)
ab
cd
ef
gh
ij
kl
(in E
UR
mill
ion)
PD s
cale
Orig
inal
on
-bal
ance
-sh
eet
gros
s ex
posu
res
Off
- ba
lanc
e-sh
eet
expo
sure
s pr
e-CC
F
Aver
age
CCF
EAD
post
CR
M a
nd
post
CCF
Aver
age
PDN
umbe
r of
ob
ligor
sAv
erag
e LG
DAv
erag
e m
atur
ityRW
AsRW
A de
nsity
ELVa
lue
adju
stm
ents
an
d pr
ovis
ions
Reta
il -
Secu
red
by
imm
ovab
le
prop
erty
no
n-SM
E
0.00
%to
< 0
.15%
1,0
56.1
2 9
0.24
99
.92%
1,14
5.27
0.10
%5,
062
10.6
1%32
.63
2.85
% 0
.12
(2.6
8)
0.15
% to
< 0
.25%
187
.27
19.
07
99.7
0%20
5.63
0.23
%45
910
.76%
11.5
25.
60%
0.0
5 (0
.48)
0.25
% to
< 0
.50%
975
.11
49.
55
99.9
8%1,
024.
450.
34%
3,08
510
.52%
74.2
67.
25%
0.3
7 (2
.40)
0.50
% to
< 0
.75%
1,8
70.2
6 9
9.54
99
.98%
1,96
9.23
0.65
%4,
531
10.6
2%22
4.58
11.4
0% 1
.35
(4.6
1)
0.75
% to
< 2
.50%
1,0
18.1
7 7
0.18
99
.80%
1,08
5.72
1.94
%2,
121
10.6
3%24
1.42
22.2
4% 2
.23
(2.5
4)
2.5%
to <
10%
1,2
90.8
9 6
6.97
99
.95%
1,35
7.12
4.68
%2,
639
10.8
5%42
7.17
31.4
8% 6
.88
(3.1
8)
10%
to <
100
% 3
17.0
3 1
0.32
99
.95%
327.
1816
.28%
641
10.6
6%17
3.75
53.11
% 5
.68
(0.7
7)
100%
(Def
ault)
194
.73
5.8
4 99
.82%
200.
1510
0.00
%34
30.
22%
125.
0962
.50%
31.
92
(31.
92)
SUBT
OTA
L 6
,909
.57
411
.72
99.9
2%7,
314.
764.
86%
18,8
8110
.37%
1,31
0.42
17.9
1% 4
8.61
(
48.5
8)

30 BIL – PILLAR 3 Semi-Annual Report 2020
Credit Risk
ab
cd
ef
gh
ij
kl
(in E
UR
mill
ion)
PD s
cale
Orig
inal
on
-bal
ance
-sh
eet
gros
s ex
posu
res
Off
- ba
lanc
e-sh
eet
expo
sure
s pr
e-CC
F
Aver
age
CCF
EAD
post
CR
M a
nd
post
CCF
Aver
age
PDN
umbe
r of
ob
ligor
sAv
erag
e LG
DAv
erag
e m
atur
ityRW
AsRW
A de
nsity
ELVa
lue
adju
stm
ents
an
d pr
ovis
ions
Reta
il -
O
ther
SM
E0.
00%
to <
0.1
5% 0
.11
0.0
7 10
0.00
%0.
180.
06%
1517
.17%
0.01
3.10
% 0
.00
(0.0
0)
0.15
% to
< 0
.25%
2.4
1 1
.88
99.8
1%4.
290.
23%
308
16.9
6%0.
348.
04%
0.0
0 (0
.01)
0.25
% to
< 0
.50%
0.50
% to
< 0
.75%
12.
81
11.
82
97.3
3%23
.07
0.62
%1,
021
13.4
9%2.
6811
.61%
0.0
2 (0
.05)
0.75
% to
< 2
.50%
84.
33
69.
64
88.9
6%11
4.47
1.59
%2,
029
12.3
6%16
.44
14.3
6% 0
.22
(0.2
7)
2.5%
to <
10%
46.
26
33.
25
92.1
6%61
.65
4.95
%1,
273
12.7
7%11
.69
18.9
7% 0
.38
(0.1
4)
10%
to <
100
% 4
3.64
1
7.20
94
.95%
49.2
820
.75%
924
12.4
2%13
.17
26.7
2% 1
.27
(0.1
2)
100%
(Def
ault)
22.
07
1.4
7 99
.26%
22.11
100.
00%
652
17.0
5%13
.82
62.5
0% 1
3.66
(1
3.66
)
SUBT
OTA
L 2
11.6
3 1
35.3
2 92
.45%
275.
0513
.59%
6,22
213
.01%
58.1
421
.14%
15.
55
(14
.25)
ab
cd
ef
gh
ij
kl
(in E
UR
mill
ion)
PD s
cale
Orig
inal
on
-bal
ance
-sh
eet
gros
s ex
posu
res
Off
- ba
lanc
e-sh
eet
expo
sure
s pr
e-CC
F
Aver
age
CCF
EAD
post
CR
M a
nd
post
CCF
Aver
age
PDN
umbe
r of
ob
ligor
sAv
erag
e LG
DAv
erag
e m
atur
ityRW
AsRW
A de
nsity
ELVa
lue
adju
stm
ents
an
d pr
ovis
ions
Reta
il -
Oth
er
non-
SME
0.00
%to
< 0
.15%
269
.11
475
.61
90.8
7%57
0.49
0.09
%35
,076
9.45
%16
.43
2.88
% 0
.05
(1.3
4)
0.15
% to
< 0
.25%
22.
52
37.
45
91.4
9%46
.38
0.23
%1,
484
10.2
1%2.
886.
21%
0.0
1 (0
.11)
0.25
% to
< 0
.50%
264
.35
164
.09
95.5
8%38
0.38
0.34
%14
,582
11.3
2%31
.50
8.28
% 0
.14
(0.8
9)
0.50
% to
< 0
.75%
295
.16
133
.18
97.1
7%39
3.86
0.64
%12
,224
12.4
3%54
.57
13.8
6% 0
.31
(0.9
2)
0.75
% to
< 2
.50%
508
.61
268
.52
95.2
2%66
8.74
2.04
%5,
994
15.6
7%17
0.46
25.4
9% 2
.17
(1.5
7)
2.5%
to <
10%
758
.03
275
.89
94.8
6%88
0.81
4.67
%9,
060
13.1
2%21
4.81
24.3
9% 5
.53
(2.0
6)
10%
to <
100
% 7
7.29
1
8.28
99
.50%
88.7
315
.42%
2,22
630
.65%
65.7
474
.09%
4.0
3 (0
.21)
100%
(Def
ault)
122
.19
11.
89
99.1
2%13
2.13
100.
00%
3,26
917
.53%
82.5
862
.50%
67.
64
(67.
64)
SUBT
OTA
L 2
,317
.24
1,3
84.9
1 94
.85%
3,16
1.53
6.48
%83
,915
13.3
3%63
8.97
20.2
1% 7
9.88
(
74.7
3)

31BIL – PILLAR 3 Semi-Annual Report 2020
Credit Riska
bc
de
fg
hi
jk
l
(in E
UR
mill
ion)
PD s
cale
Orig
inal
on
-bal
ance
-sh
eet
gros
s ex
posu
res
Off
- ba
lanc
e-sh
eet
expo
sure
s pr
e-CC
F
Aver
age
CCF
EAD
post
CR
M a
nd
post
CCF
Aver
age
PDN
umbe
r of
ob
ligor
sAv
erag
e LG
DAv
erag
e m
atur
ityRW
AsRW
A de
nsity
ELVa
lue
adju
stm
ents
an
d pr
ovis
ions
Equi
ty -
PD
/LGD
AP
PRO
ACH
0.00
%to
< 0
.15%
0.15
% to
< 0
.25%
0.25
% to
< 0
.50%
0.50
% to
< 0
.75%
0.75
% to
< 2
.50%
24.
80
100.
00%
24.8
01.
26%
690
.00%
5.00
73.6
0 2
.97
0.2
8
2.5%
to <
10%
0.0
7 10
0.00
%0.
079.
53%
190
.00%
5.00
0.46
6.3
6 0
.01
10%
to <
100
% 0
.00
100.
00%
0.00
30.8
7%5
90.0
0%5.
000.
00 6
.03
0.0
0
100%
(Def
ault)
-
SUBT
OTA
L 2
4.87
10
0.00
%24
.87
1.28
%12
90.0
0%5.
0074
.06
2.9
8 0
.29
ab
cd
ef
gh
ij
kl
(in E
UR
mill
ion)
PD s
cale
Orig
inal
on
-bal
ance
-sh
eet
gros
s ex
posu
res
Off
- ba
lanc
e-sh
eet
expo
sure
s pr
e-CC
F
Aver
age
CCF
EAD
post
CR
M a
nd
post
CCF
Aver
age
PDN
umbe
r of
ob
ligor
sAv
erag
e LG
DAv
erag
e m
atur
ityRW
AsRW
A de
nsity
ELVa
lue
adju
stm
ents
an
d pr
ovis
ions
Oth
er it
ems
0.00
%to
< 0
.15%
2.1
3 10
0.00
%2.
130.
01%
148.
13%
1.00
0.00
-0.
00
0.15
% to
< 0
.25%
0.25
% to
< 0
.50%
0.50
% to
< 0
.75%
0.0
1 10
0.00
%0.
010.
71%
234
.66%
1.00
0.00
-0.
00
0.75
% to
< 2
.50%
0.0
0 10
0.00
%0.
001.
15%
150
.00%
1.00
0.00
-0.
00
2.5%
to <
10%
0.0
0 10
0.00
%0.
003.
95%
155
.00%
1.00
0.00
-0.
00
10%
to <
100
% 7
.60
100.
00%
7.60
30.8
7%8
5.12
%1.
000.
00 -
0.02
100%
(Def
ault)
SUBT
OTA
L 9
.73
100.
00%
9.73
24.1
0%26
5.82
%1.
000.
00 -
0.02

32 BIL – PILLAR 3 Semi-Annual Report 2020
Credit Risk
2.5.2 RWA flow statements of credit risk exposures under the IRB approach
According to Article 438 (d) in the Regulation (EU) No 575/2013 (CRR), the following table provides a flow statement explaining variations in the credit RWAs between Q1 2020 and Q2 2020.
TABLE EU CR8 - RWA FLOW STATEMENTS OF CREDIT RISK EXPOSURES
a b(in EUR million) RWA
amountsCapital
requirements
31/03/2020Credit Risk RWAs (ADV+STD+TIT with CCR) as at the end of the previous reporting period 8,120.30 649.62
1 Total adjustments from Standardised Approach (with CCR) (161.21) (12.90)
1.1 Adjustment from Asset size (151.99) (12.16)
1.2 Adjustment from Model updates (9.78) (0.78)
2 Total adjustments from Advanced Approach (with CCR) (53.72) (4.30)
2,1 Adjustment from Asset size 109.82 8.79
2,2 Adjustment from Asset quality (100.75) (8.06)
2,3 Adjustment from Model updates (61.42) (4.91)
2.3.1 Add-on NDD (61.42) (4.91)
2,4 Adjustment from Methodology and policy
2,5 Adjustment from Acquisitions and disposals
2,6 Adjsutment from Foreign exchange movements
2,7 Adjustment from Other (1.38) (0.11)
3 Total adjustments from Credit Valuation Adjustment (CVA) 5.45 0.44
4 Total adjustments from Securitisation (0.89) (0.07)
30/06/2020 RWAs as at the end of the reporting period 7,909.92 632.79
30/06/2020
(in EUR million) ECL EAD
Stage 1 19% 60,48 94% 17,346.09
Stage 2 6% 18,13 6% 1,029.49
Stage 3 75% 236,5303 2% 288,05
TOTAL 315,1403 18,633.63
2.6 ProvisionsThe overall results of the ECLs calculation for BIL in June 2020 are as follows:
The ECL in Stage 3 includes both statistically calculated ECL (EUR 7.28 million) and specific provisions.
The EU Parliament adopted, at the end of 2017, the amendment to the CRR allowing credit institutions to (partially) compensate the impact of the introduction of IFRS 9 on regulatory capital during the transitional period of 5 years (i.e. until 2022). The Bank does not apply such a phase-in alternative for end of June figures.

33BIL – PILLAR 3 Semi-Annual Report 2020
Credit Risk
2.7 Counterparty credit risk
2.7.1 Analysis of CCR exposures by model approach
According to Article 439 (f) in the Regulation (EU) No 575/2013 (CRR), the following table shows the methods used for calculating the regulatory requirements for CCR exposure including the main parameters for each method. Exposures relevant for credit valuation adjustment (CVA) charges and exposures cleared through a central counterparty (CCP) are excluded but are presented separately in the following tables.
As displayed, the Bank uses mark-to-market methods to measure the exposure value of instruments subject to capital requirements for CCR
TABLE EU CCR1 - ANALYSIS OF CCR EXPOSURE BY APPROACH
a b c d e f g
(in EUR million) Notional Replacement cost/current
market value
Potential future credit
exposure
EEPE Multiplier EAD post CRM
RWAs
1 Mark to market 71.20 85.20 156.40 25.112 Original exposure3 Standardised approach4 IMM (for derivatives and SFTs)
5Of which securities financing transactions
6Of which derivatives and long settlement transactions
7Of whichfrom contractual cross-product netting
8Financial collateral simple method (for SFTs)
9Financial collateral comprehensive method (for SFTs)
10 VaR for SFTs11 TOTAL 71.20 85.20 156.40 25.11

34 BIL – PILLAR 3 Semi-Annual Report 2020
Credit Risk
2.7.3 Exposures to CCP
The table below presents an overview of exposures and capital requirements to central counterparties arising from transactions, margins and contributions to default funds.
a b
(in EUR million) EAD post CRM
RWAs
1 Exposures to QCCPs (total) 78.28 3.13
2 Exposures for trades at QCCPs (excluding initial margin and default fund contributions); of which
3 (i) OTC derivatives 78.28 3.13
4 (ii) Exchange-traded derivatives
5 (iii) SFTS
6 (iv) Netting sets where cross-product netting has been approved
7 Segregated initial margin
8 Non-segregated initial margin
9 Prefunded defaut fund contributions
10 Alternative calculation of own funds requirements for exposures
11 Exposures to non-QCCPs (total) 2,238.28 54.86
12 Exposures for trades at non-QCCPs (excluding initial margin and default fund contributions); of which
13 (i) OTC derivatives 156.40 25.11
14 (ii) Exchange-traded derivatives
15 (iii) SFTS 2,081.89 29.76
16 (iv) Netting sets where cross-product netting has been approved
17 Segregated initial margin
18 Non-segregated initial margin
19 Prefunded defaut fund contributions
20 Unfunded defaut fund contributions
TABLE EU CCR8 - EXPOSURES TO CCPS
2.7.2 CVA capital charge
In the application of Article 439 (f) in the Regulation (EU) No 575/2013 (CRR), the following table provides the exposure value and risk exposure amount of transactions subject to capital requirements for credit valuation adjustment. The standardised approach is used to calculate the CVA capital charge.
TABLE EU CCR2 - CVA CAPITAL CHARGEa b
(in EUR million) Exposure value RWAs
1 Total portfolios subject to the advanced method
2 (i) VaR component (including the 3x multiplier)
3 (ii) SVaR component (including the 3x multiplier)
4 All portfolios subject to the standardised method 123.47 23.25
EU4 Based on the original exposure method
5 Total subject to the CVA capital charge 123.47 23.25
35BIL – PILLAR 3 Semi-Annual Report 2020
Credit Risk
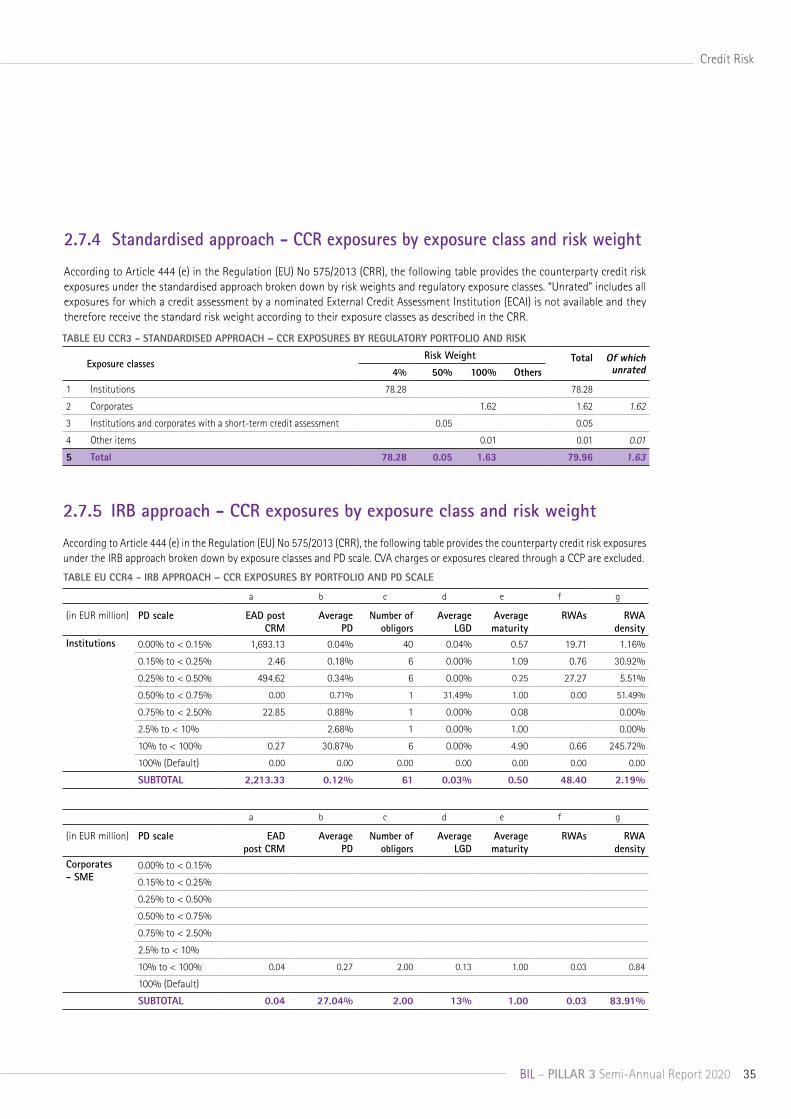
2.7.4 Standardised approach - CCR exposures by exposure class and risk weight
According to Article 444 (e) in the Regulation (EU) No 575/2013 (CRR), the following table provides the counterparty credit risk exposures under the standardised approach broken down by risk weights and regulatory exposure classes. “Unrated” includes all exposures for which a credit assessment by a nominated External Credit Assessment Institution (ECAI) is not available and they therefore receive the standard risk weight according to their exposure classes as described in the CRR.
Exposure classesRisk Weight Total Of which
unrated4% 50% 100% Others
1 Institutions 78.28 78.28
2 Corporates 1.62 1.62 1.62
3 Institutions and corporates with a short-term credit assessment 0.05 0.05
4 Other items 0.01 0.01 0.01
5 Total 78.28 0.05 1.63 79.96 1.63
TABLE EU CCR3 - STANDARDISED APPROACH – CCR EXPOSURES BY REGULATORY PORTFOLIO AND RISK
2.7.5 IRB approach - CCR exposures by exposure class and risk weight
According to Article 444 (e) in the Regulation (EU) No 575/2013 (CRR), the following table provides the counterparty credit risk exposures under the IRB approach broken down by exposure classes and PD scale. CVA charges or exposures cleared through a CCP are excluded.
TABLE EU CCR4 - IRB APPROACH – CCR EXPOSURES BY PORTFOLIO AND PD SCALE
a b c d e f g
(in EUR million) PD scale EAD post CRM
Average PD
Number of obligors
Average LGD
Average maturity
RWAs RWA density
Institutions 0.00% to < 0.15% 1,693.13 0.04% 40 0.04% 0.57 19.71 1.16%
0.15% to < 0.25% 2.46 0.18% 6 0.00% 1.09 0.76 30.92%
0.25% to < 0.50% 494.62 0.34% 6 0.00% 0.25 27.27 5.51%
0.50% to < 0.75% 0.00 0.71% 1 31.49% 1.00 0.00 51.49%
0.75% to < 2.50% 22.85 0.88% 1 0.00% 0.08 0.00%
2.5% to < 10% 2.68% 1 0.00% 1.00 0.00%
10% to < 100% 0.27 30.87% 6 0.00% 4.90 0.66 245.72%
100% (Default) 0.00 0.00 0.00 0.00 0.00 0.00 0.00
SUBTOTAL 2,213.33 0.12% 61 0.03% 0.50 48.40 2.19%
a b c d e f g
(in EUR million) PD scale EAD post CRM
Average PD
Number of obligors
Average LGD
Average maturity
RWAs RWA density
Corporates - SME
0.00% to < 0.15%
0.15% to < 0.25%
0.25% to < 0.50%
0.50% to < 0.75%
0.75% to < 2.50%
2.5% to < 10%
10% to < 100% 0.04 0.27 2.00 0.13 1.00 0.03 0.84
100% (Default)
SUBTOTAL 0.04 27.04% 2.00 13% 1.00 0.03 83.91%
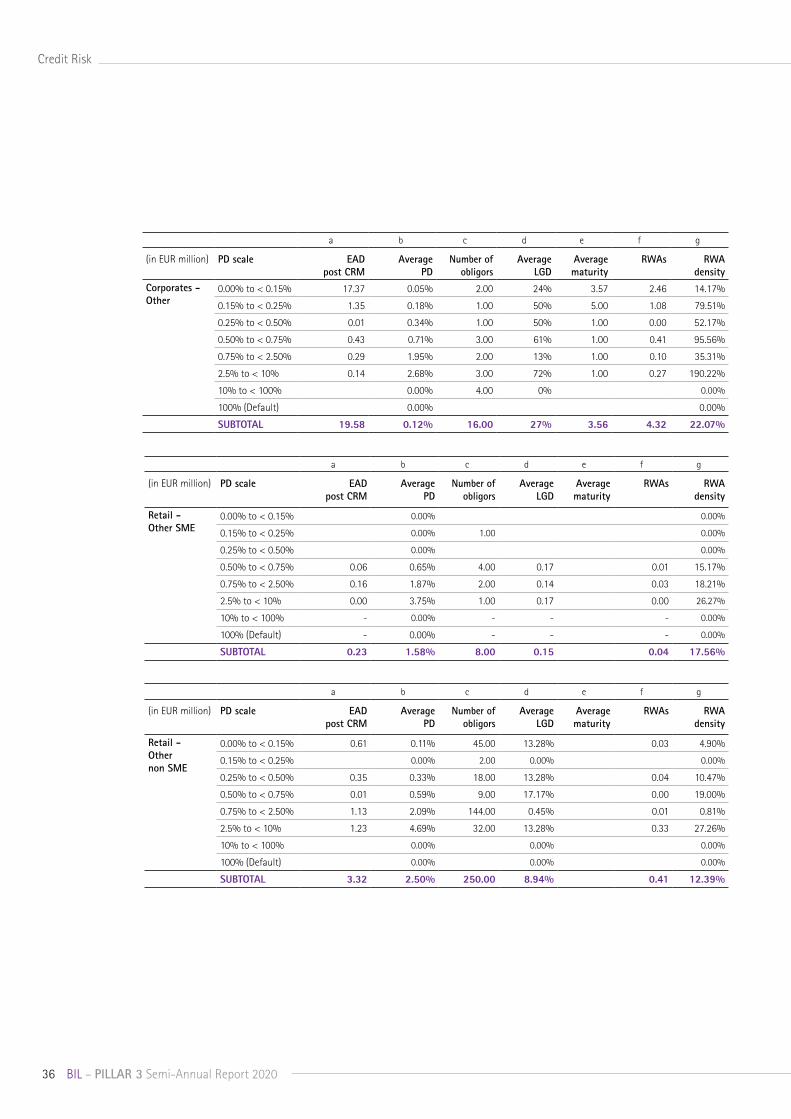
36 BIL – PILLAR 3 Semi-Annual Report 2020
Credit Risk
a b c d e f g
(in EUR million) PD scale EAD post CRM
Average PD
Number of obligors
Average LGD
Average maturity
RWAs RWA density
Corporates - Other
0.00% to < 0.15% 17.37 0.05% 2.00 24% 3.57 2.46 14.17%
0.15% to < 0.25% 1.35 0.18% 1.00 50% 5.00 1.08 79.51%
0.25% to < 0.50% 0.01 0.34% 1.00 50% 1.00 0.00 52.17%
0.50% to < 0.75% 0.43 0.71% 3.00 61% 1.00 0.41 95.56%
0.75% to < 2.50% 0.29 1.95% 2.00 13% 1.00 0.10 35.31%
2.5% to < 10% 0.14 2.68% 3.00 72% 1.00 0.27 190.22%
10% to < 100% 0.00% 4.00 0% 0.00%
100% (Default) 0.00% 0.00%
SUBTOTAL 19.58 0.12% 16.00 27% 3.56 4.32 22.07%
a b c d e f g
(in EUR million) PD scale EAD post CRM
Average PD
Number of obligors
Average LGD
Average maturity
RWAs RWA density
Retail - Other SME
0.00% to < 0.15% 0.00% 0.00%
0.15% to < 0.25% 0.00% 1.00 0.00%
0.25% to < 0.50% 0.00% 0.00%
0.50% to < 0.75% 0.06 0.65% 4.00 0.17 0.01 15.17%
0.75% to < 2.50% 0.16 1.87% 2.00 0.14 0.03 18.21%
2.5% to < 10% 0.00 3.75% 1.00 0.17 0.00 26.27%
10% to < 100% - 0.00% - - - 0.00%
100% (Default) - 0.00% - - - 0.00%
SUBTOTAL 0.23 1.58% 8.00 0.15 0.04 17.56%
a b c d e f g
(in EUR million) PD scale EAD post CRM
Average PD
Number of obligors
Average LGD
Average maturity
RWAs RWA density
Retail - Other non SME
0.00% to < 0.15% 0.61 0.11% 45.00 13.28% 0.03 4.90%
0.15% to < 0.25% 0.00% 2.00 0.00% 0.00%
0.25% to < 0.50% 0.35 0.33% 18.00 13.28% 0.04 10.47%
0.50% to < 0.75% 0.01 0.59% 9.00 17.17% 0.00 19.00%
0.75% to < 2.50% 1.13 2.09% 144.00 0.45% 0.01 0.81%
2.5% to < 10% 1.23 4.69% 32.00 13.28% 0.33 27.26%
10% to < 100% 0.00% 0.00% 0.00%
100% (Default) 0.00% 0.00% 0.00%
SUBTOTAL 3.32 2.50% 250.00 8.94% 0.41 12.39%
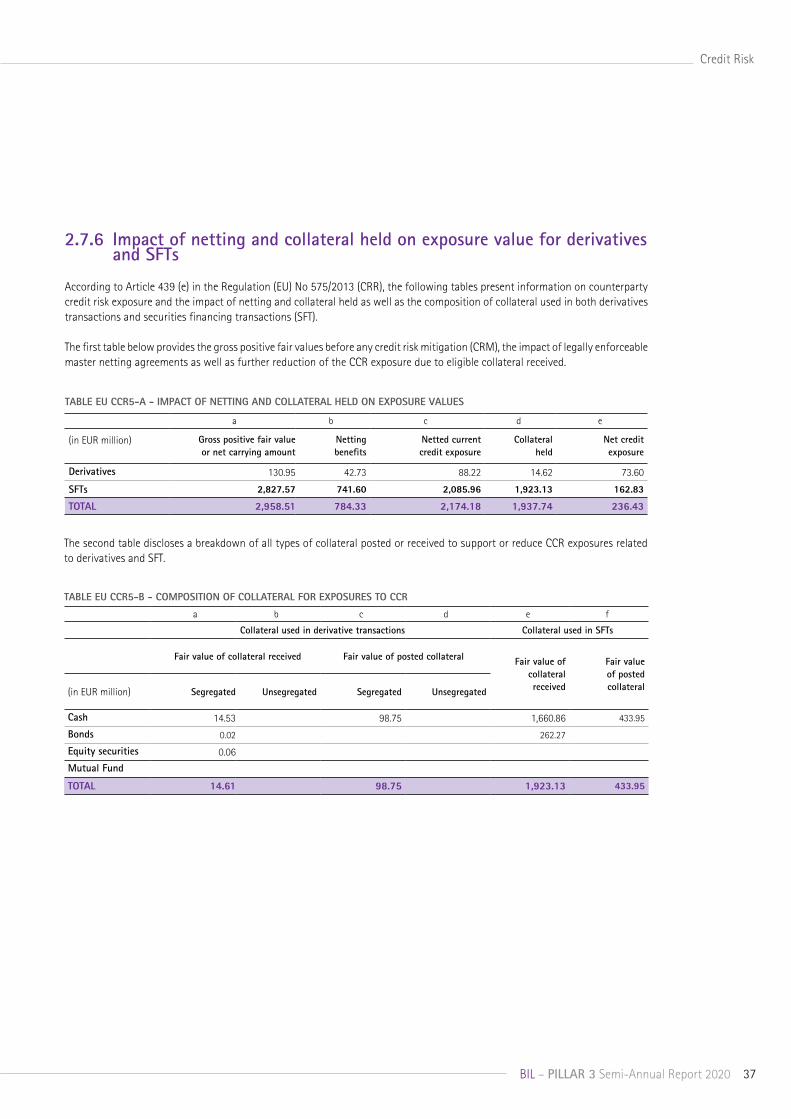
37BIL – PILLAR 3 Semi-Annual Report 2020
Credit Risk
2.7.6 Impact of netting and collateral held on exposure value for derivatives and SFTs
According to Article 439 (e) in the Regulation (EU) No 575/2013 (CRR), the following tables present information on counterparty credit risk exposure and the impact of netting and collateral held as well as the composition of collateral used in both derivatives transactions and securities financing transactions (SFT).
The first table below provides the gross positive fair values before any credit risk mitigation (CRM), the impact of legally enforceable master netting agreements as well as further reduction of the CCR exposure due to eligible collateral received.
TABLE EU CCR5-A - IMPACT OF NETTING AND COLLATERAL HELD ON EXPOSURE VALUES
a b c d e
(in EUR million) Gross positive fair value or net carrying amount
Netting benefits
Netted current credit exposure
Collateral held
Net credit exposure
Derivatives 130.95 42.73 88.22 14.62 73.60
SFTs 2,827.57 741.60 2,085.96 1,923.13 162.83
TOTAL 2,958.51 784.33 2,174.18 1,937.74 236.43
The second table discloses a breakdown of all types of collateral posted or received to support or reduce CCR exposures related to derivatives and SFT.
TABLE EU CCR5-B - COMPOSITION OF COLLATERAL FOR EXPOSURES TO CCR
a b c d e f
Collateral used in derivative transactions Collateral used in SFTs
Fair value of collateral received Fair value of posted collateral Fair value of collateral received
Fair value of posted collateral(in EUR million) Segregated Unsegregated Segregated Unsegregated
Cash 14.53 98.75 1,660.86 433.95
Bonds 0.02 262.27
Equity securities 0.06
Mutual Fund
TOTAL 14.61 98.75 1,923.13 433.95

38 BIL – PILLAR 3 Semi-Annual Report 2020
3.1 Financial market risk exposureIn the first half of 2020, BIL Group’s financial risk indicators remained stable compared to end 2019.
FINANCIAL MARKETS
BIL continues to follow a prudent approach in the context of low rates and the COVID-19 crisis.
During the first half of 2020, two downward back-testing exceptions occurred:
VaR (10 days, 99%) 31/12/2019 30/06/2020
(in EUR million)
Average 0.23 0.19
End of period 0.09 0.03
Maximum 0.79 0.55
Limit 2 2
VaR date 1-d VaR (EUR) Hypothetical P&L (EUR) Comment
03/06/2020 (84,183.52) (89,400.65) Downward back testing exception on global trading perimeter.
The main sources of this hypothetical loss are due to FX Spot & Forward and FX Derivatives perimeters.
These hypothetical losses are mainly due to impact of currencies variations especially in EUR/USD and in EUR/JPY.
19/06/2020 (19,209.28) (30,769.07) Downward back testing exception on global trading perimeter.
These hypothetical losses are mainly due to impact of currencies variations especially in EUR/USD and in EUR/JPY
3. Market risk

39BIL – PILLAR 3 Semi-Annual Report 2020
Market Risk
-250
,000
-200
,000
-150
,000
-100
,000
-50,
000
50,0
00
100,
000
150,
000
200,
000
250,
000 0
1-d
VaR
Hyp
othe
tical
P&L
The
com
paris
on o
f VaR
(1-d
, 99%
) est
imat
es w
ith g
ains
/loss
es is
pre
sent
ed a
s fo
llow
s:

40 41BIL – PILLAR 3 Semi-Annual Report 2020 BIL – PILLAR 3 Semi-Annual Report 202040 BIL – PILLAR 3 Semi-Annual Report 2020
Market Risk
3.2 Liquidity risk The LCR increased from 139% as at 31 December 2019 to 167% as at 30 June 2020 due to the increase of the excess of liquidity.
The NSFR remained stable during the first half of 2020.
(in EUR billion) 31/12/2019 30/06/2020
Stock of HQLA 6.34 6.72
Net Cash Outflows 4.55 4.03
LCR ratio 139% 167%
Regulatory limit 100%
Internal limit 110%
Internal Trigger 115%
(in EUR billion) 31/12/2019 30/06/2020Available Stable Funding (ASF) 17.76 19.69
Required Stable Funding (RSF) 16.01 17.46
NSFR ratio 111% 113%
Regulatory Limit 100%
Internal limit 104%
Internal trigger 106%
1 Asset encumbrance ratio = (Encumbered assets + Collateral received re-used) / (Total assets + Total collateral received).2 Assets and collateral received available for encumbrance.3 Additional amount of encumbered assets resulting from a decrease by 30% of the fair value of encumbered assets.
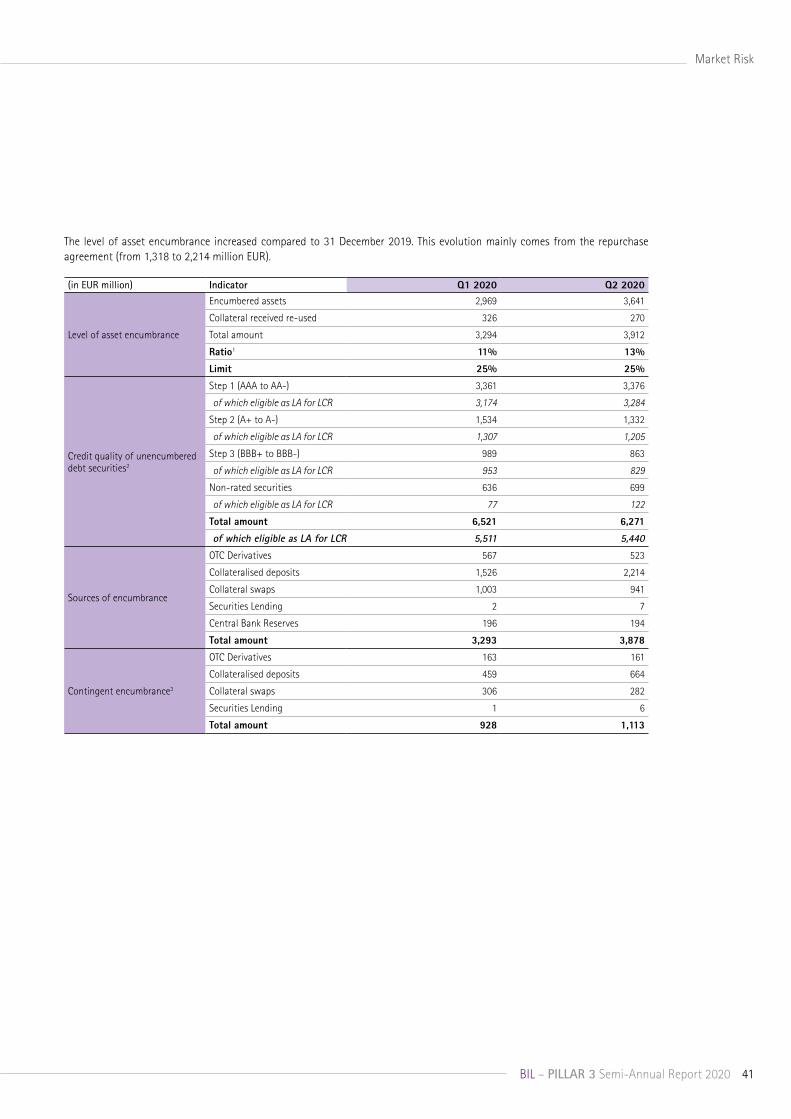
40 41BIL – PILLAR 3 Semi-Annual Report 2020 BIL – PILLAR 3 Semi-Annual Report 2020
Market Risk
The level of asset encumbrance increased compared to 31 December 2019. This evolution mainly comes from the repurchase agreement (from 1,318 to 2,214 million EUR).
(in EUR million) Indicator Q1 2020 Q2 2020
Level of asset encumbrance
Encumbered assets 2,969 3,641
Collateral received re-used 326 270
Total amount 3,294 3,912
Ratio1 11% 13%
Limit 25% 25%
Credit quality of unencumbered debt securities2
Step 1 (AAA to AA-) 3,361 3,376
of which eligible as LA for LCR 3,174 3,284
Step 2 (A+ to A-) 1,534 1,332
of which eligible as LA for LCR 1,307 1,205
Step 3 (BBB+ to BBB-) 989 863
of which eligible as LA for LCR 953 829
Non-rated securities 636 699
of which eligible as LA for LCR 77 122
Total amount 6,521 6,271
of which eligible as LA for LCR 5,511 5,440
Sources of encumbrance
OTC Derivatives 567 523
Collateralised deposits 1,526 2,214
Collateral swaps 1,003 941
Securities Lending 2 7
Central Bank Reserves 196 194
Total amount 3,293 3,878
Contingent encumbrance3
OTC Derivatives 163 161
Collateralised deposits 459 664
Collateral swaps 306 282
Securities Lending 1 6
Total amount 928 1,113

42 43BIL – PILLAR 3 Semi-Annual Report 2020 BIL – PILLAR 3 Semi-Annual Report 2020
Market Risk
3.3 Assessment of the regulatory capital requirement All market risks are treated under the Basel III standardised approach. The table below presents the Bank’s regulatory capital requirements broken down by risk type as of the end of June 2020, in comparison with the number at the end of 2019.
31 December 2019 30 June 2020
RWAs Capital requirements RWAs Capital requirements
OUTRIGHT PRODUCTS
1 Interest rate risk (general and specific) 32.04 2.56 42.38 3.39
2 Equity risk (general and specific) 0.21 0.02 0.02 0
3 Foreign exchange risk 16.64 1.33 14.34 1.15
4 Commodity risk
Options
5 Simplified approach
6 Delta-plus method
7 Scenario approach
8 Securitisation (specific risk)
9 TOTAL 48.88 3.91 56.74 4.54
TABLE EU MR1 - MARKET RISK UNDER THE STANDARDISED APPROACH

42 43BIL – PILLAR 3 Semi-Annual Report 2020 BIL – PILLAR 3 Semi-Annual Report 2020
4. Main events after end of June 2020
4.1 BIL reinforced its compliance framework Banque Internationale à Luxembourg is constantly updating its policies and processes to adapt to changing anti-money laundering (AML) and counter-terrorism financing (CTF) regulations. The Bank is committed to ensuring the highest level of compliance standards at all times when it comes to the fight against money laundering and financing of terrorism, fully supporting the “Commission de Surveillance du Secteur Financier” (CSSF) in its supervisory mission.
During on-site inspections in 2017 and 2018, the CSSF identified certain weaknesses in the Bank’s processes which were in place at the time. These inspections concerned a sample of clients from the Commonwealth of Independent States, thus representing a limited segment of customers whose inherent risk is generally to be considered high. As a result, the CSSF decided to impose an administrative sanction as mentioned in the CSSF publication dated on 12th August 2020. No money laundering or terrorism financing activity was identified.
With the support of the new shareholder structure and under the leadership of the new CEO, BIL promptly took appropriate measures to remediate the identified weaknesses. The Bank has since defined a new and strict AML Risk Appetite Statement and related Wealth Management Compliance Guiding Principles, recruited additional compliance specialists and increased AML/CTF training and awareness. Compliance tools, i.e. the AML scoring engine, were implemented.
4.2 BIL closes Dubai branch to focus on strategic goals Following extensive strategic considerations the Bank has decided to withdraw from Dubai. This is in line with the Bank´s strategic plan Create Together 2025 which aims to increase efficiency, increase focus on stable and sustainable growth and to ensure management attention focus on the China strategic development (including the Greater Bay Area). For BIL´s national and international Wealth Management activities, this means further developing its two main hubs, Luxembourg and Switzerland, and refocusing on markets where BIL is in a position to provide value to its clients.
Middle Eastern clients will remain a key client group for BIL, but will be served out of Switzerland or Luxembourg, whatever place is the best place to serve in the interest of these clients.

44 NPBIL – PILLAR 3 Semi-Annual Report 2020 BIL – PILLAR 3 Semi-Annual Report 2020
5. Focus on COVID-19 situation
In view of the COVID-19 pandemic and the protective measures announced by the Luxembourgish Government, the Bank has taken measures to protect the safety and health of employees and clients, whilst ensuring its business continuity. These measures include restricting business trips, splitting teams between different buildings, additional hygiene measures and remote working coupled with a presence by team with strict social distancing.• As one of the major banks in Luxembourg, BIL is supporting Government and Central Bank actions and remains accessible
to all retail, private and corporate clients. Financing facilities are available to clients to minimise the negative effect of the economic slowdown on their activities. The business teams accompanied by the credit risk teams are currently working on the best solutions for the Bank’s counterparts notably regarding the end of the period for the moratoria in order to support the economy;
• The adverse macroeconomic outlook will impact all market participants, businesses and the banking industry. As a result, the Bank is expecting an impact on 2020 financials with lower revenues and higher costs of risk;
• The Bank’s capital and liquidity positions remain solid with buffers in excess of regulatory requirements; • With the support of the two main shareholders of the Bank: Legend Holdings and the State of Luxembourg, the Management
closely monitors the situation, while further deploying the Create Together 2025 Strategy, aiming at sustainable growth.

Banque Internationale à Luxembourg SA
69, route d’EschL-2953 LuxembourgRCS Luxembourg B-6307T: (+352) 4590 -1F: (+352) 4590-2010
www.bil.com