pillar 3 report 2017 - banque internationale à luxembourg
TRANSCRIPT

Pillar 3 Report
2017

T a b l e o f c o n t e n t s
List of acronyms 4
EBA tables and templates 8
Introduction 11
1. Risk Management 16
1.1 Risk management responsibilities 16
1.2 Risk organisation and governance 16
2. Own funds and capital adequacy 22
2.1 Regulatory capital adequacy (Pillar I) 22
2.2 Leverage ratio 37
2.3 Internal capital adequacy Assessment Process (Pillar II) 39
3. Credit risk 46
3.1 Credit risk governance 46
3.2 Credit risk exposure 47
3.3 Forbearance, impairment, past due and provisions 55
3.4 Credit risk mitigation 61
3.5 Standardised approach 64
3.6 Advanced Internal Ratings Based approach (A-IRB) 66
3.7 Counterparty credit risk 82
3.8 Exposure in equities not included in the trading book 88
3.9 Securitisation exposures 90

4. Market risk 92
4.1 Market risk governance 92
4.2 Market risk exposure 94
4.3 Liquidity risk 96
4.4 Interest rate risk in the banking book 99
4.5 Assessment of the regulatory capital requirement 101
5. Operational risk 102
5.1 Operational risk governance 102
5.2 Calculation of the regulatory capital requirementf 105
6. Remuneration Charter and practices 106
6.1 Key Pillars 107
6.2 Determination of the Identified Staff 107
6.3 Determination of the Relevant Persons 107
6.4 Performance assessment 108
6.5 Remuneration structure & pay out modalities 109
6.6 Governance: roles and responsibilities in the design, implementation and ongoing supervision of the Charter 115
6.7 Diversity and succession plan at the level of the Management Body 116
6.8 CRD IV mandates limitation 116
6.9 Disclosure 117
6.10 Quantitative information 118
Appendix 1: Declaration of the Management Body 120

4 BIL – Pillar 3 Report 2017
List of acronyms
AFS Available For Sale
AFR Available Financial Resources
A-IRBA Advanced Internal Rating-Based Approach
ALM Asset and Liability Management
ASF Available Stable Funding
AT1 Additional Tier 1 capital
BCL Banque Centrale de Luxembourg
BCP Business Continuity Plan
BoD Board of Directors
BRC Board Risk Committee
BRNC Board Remuneration & Nomination Committee
BRNC-N Board Remuneration and Nominations Committee sitting in nomination matters
CAR Compliance, Audit and Risk
CC Crisis Committee
CCF Credit Conversion Factor
CCP Central Counterparty
CDS Credit Default Swap
CEO Chief Executive Officer
CET1 Common Equity Tier One
CoCo bond Contingent Convertible bond
CRCU Credit Risk Control Unit
CRMU Credit Risk Management Unit
CRD Capital Requirements Directive
CRM Credit Risk Mitigant
CRO Chief Risk Officer
CRR Capital Requirements Regulation
CSA Credit Support Annex

5BIL – Pillar 3 Report 2017
CSSF Commission de Surveillance du Secteur Financier
CVA Credit Valuation Adjustement
DTA Deferred Tax Asset
EAD Exposure At Default
EBA European Banking Authority
ECAI External Credit Assessment Institutions
ECAP Economic Capital
ECB European Central Bank
EL Expected Loss
EVE Economic Value Equity
FRM Financial Risk Management
FRMD Financial Risk Management Datamart
FTA First Time Adoption
FX Foreign Exchange
GIP Gestion Intensive et Particulière
HQLA High Quality Liquid Assets
HR Human Resources
HTM Held To Maturity
IAS International Accounting Standards
ICAAP Internal Capital Adequacy Assessment Process
ICC Internal Control Committee
IFRS International Financial Reporting Standards
ILAAP Internal Liquidity Adequacy Assessment Process
IR Interest Rate
IRRBB Interest Rate Risk in the Banking Book
IRS Internal Rating Systems
ISDA International Swap and Derivative Association

6 BIL – Pillar 3 Report 2017
IT Information Technology
JST Joint Supervisory Team
KPI Key Performance Indicator
LCR Liquidity Coverage Ratio
LDP Low Default Portfolio
LR Leverage ratio
LGD Loss Given Default
L&R Loans & Receivables
MCD Mortgage Credit Directive
MCRE Maximum Credit Risk Exposure
MMB Member of the Management Board
MMU Model Management Unit
MOC Monthly Operational Committee
MRT Material Risk Takers
NACE Nomenclature statistique des Activités économiques dans la Communauté Européenne
NCA National Competent Authorities
NII Net Interest Income
NMD Non-Maturing Deposits’
NPC New Products Committee
NPE Non-Performing exposures
NSFR Net Stable Funding Ratio
OBS Off-Balance Sheet
ORM Operational Risk Management
OTC Over-the-counter
PD Probability of Default
P&L Profit and Loss
QIS Quantitative Impact Study

7BIL – Pillar 3 Report 2017
SFT Securities Financing Transaction
SC Security Committee
SNB Swiss National Bank
SSM Single Supervisory Mechanism
SRB Single Resolution Board
SRM Single Resolution Mechanism
STE Short Term Exercise
RAF Risk Appetite Framework
RAS Risk Appetite Statement
RCSA Risk Control Self-Assessment
RPC Risk Policy Committee
RSF Required Stable Funding
RWA Risk Weighted Assets
TFM Treasury and Financial Markets
TLTRO Targeted Longer Term Refinancing Operations
TRIM Targeted Review of Internal Models
VaR Value at Risk
WAL Weighted Average Life

8 BIL – Pillar 3 Report 2017
EBA tables and templates1
Templates Reference Name CRR articles Reference
1 EU OVA Institution risk management approach Article 435 (1) Section 1.2
2 EU CRA General qualitative information about credit risk Article 435 (1) Section 3
3 EU CCRA Qualitative disclosure requirements related to CCR Article 435 (1) Section 3.7
4 EU MRA Qualitative disclosure requirements related to market risk Article 435 (1) Section 4
5 EU LIAExplanations of differences between accounting and regulatory exposure amounts
Article 436 (b) Section 2.1.1
6 EU CRB-A Additional disclosure related to the credit quality of assets Article 442 (a)-(b) Section 3
7 EU CRC Qualitative disclosure requirements related to CRM techniques Article 453 (a) - (e) Section 3.4
8 EU CRDQualitative disclosure requirements on institutions’ use of external credit ratings under the standardised approach for credit risk
Article 444 (a) - (d) Section 3.5
9 EU CRE Qualitative disclosure requirements related to IRB models Article 452 (a) - (c) Section 3.6
10 EU MRB Qualitative disclosure requirements for institutions using the IMA
Article 455N/A. The Bank uses the standardised approch.
Templates Reference Name CRR articles Reference
1 EU LI1Differences between accounting and regulatory scopes of consolidation and the mapping of financial statement categories with regulatory risk categories
Article 436 (b) Section 2.1
2 EU LI2Main sources of differences between regulatory exposure amounts and carrying values in financial statements
Article 436 (b) Section 2.1
3 EU LI3Outline of the differences in the scopes of consolidation (entity by entity)
Article 436 (b) Section 2.1
4 EU OV1 Overview of RWAs Article 438 (c)-(f) Section 2.1
5 EU CR10 IRB (specialised lending and equities)Article 153 (5) or 155 (2), Article 438
Section 2.1
6 EU INS1 Non-deducted participations in insurance undertakings Article 438 (c)-(d) & article 49 (1)
Section 2.2
7 EU CRB-B Total and average net amount of exposures Article 442 (c) Section 3.2
8 EU CRB-C Geographical breakdown of exposures Article 442 (d) Section 3.2
9 EU CRB-D Concentration of exposures by industry or counterparty types Article 442 (e) Section 3.2
10 EU CRB-E Maturity of exposures Article 442 (f) Section 3.2
11 EU CR1-A Credit quality of exposures by exposure class and instrument Article 442 (g)-(h) Section 3.2
12 EU CR1-B Credit quality of exposures by industry or counterparty types Article 442 (g) Section 3.2
13 EU CR1-C Credit quality of exposures by geography Article 442 (g) Section 3.2
14 EU CR1-D Ageing of past-due exposures Article 442 (g) Section 3.3
15 EU CR1-E Non-performing and forborne exposures Article 442 (g)-(i) Section 3.4
16 EU CR2-A Changes in the stock of general and specific credit risk adjustments Article 442 (i) Section 3.5
17 EU CR2-BChanges in the stock of defaulted and impaired loans and debt securities
Article 442 (i) Section 3.6
18 EU CR3 CRM techniques – Overview Article 453 (f) - (g) Section 3.7
19 EU CR4 Credit risk exposure and CRM effects Article 453 (f) - (g) Section 3.5
20 EU CR5 Standardised approach Article 444 (e) Section 3.5
21 EU CR6 Qualitative disclosure requirements related to IRB models Article 452 (e) - (h) Section 3.6
22 EU CR7 Effect on the RWAs of credit derivatives used as CRM techniques Article 453 (g)N/A. The Bank does not have any credit derivatives.
23 EU CR8 RWA flow statements of credit risk exposures under the IRB approach Article 438 (d) & Article 92 (3)
Section 3.6
24 EU CR9 IRB approach – Backtesting of PD per exposure class Article 452 (i) Section 3.6

9BIL – Pillar 3 Report 2017
25 EU CCR1 Analysis of CCR exposure by approach Article 439 (e), (f), (i) & article 92 (3)
Section 3.7
26 EU CCR2 CVA capital charge Article 439 (e) - (f) Section 3.7
27 EU CCR8 Exposures to CCPs Article 439 (e) - (f) Section 3.7
28 EU CCR3Standardised approach – CCR exposures by regulatory portfolio and risk
Article 444 (e) Section 3.7
29 EU CCR4 IRB approach – CCR exposures by portfolio and PD scale Article 452 (e) Section 3.7
30 EU CCR7 RWA flow statements of CCR exposures under the IMM Article 92 (3) - (4) & Article 438 (d)
N/A. The Bank does not use the IMM approach.
31 EU CCR5-A Impact of netting and collateral held on exposure values Article 439 (e) Section 3.7
32 EU CCR5-B Composition of collateral for exposures to CCR Article 439 (e) Section 3.7
33 EU CCR6 Credit derivatives exposures Article 439 (g) - (h)N/A. The Bank does not have any credit derivatives.
34 EU MR1 Market risk under the standardised approach Article 445 Section 4.5
35 EU MR2-A Market risk under the IMA Article 455 (e)N/A. The Bank uses the standardised approch.
36 EU MR2-B RWA flow statements of market risk exposures under the IMA Article 455 (e)N/A. The Bank uses the standardised approch.
37 EU MR3 IMA values for trading portfolios Article 455 (d)N/A. The Bank uses the standardised approch.
38 EU MR4 Comparison of VaR estimates with gains/losses Article 455 (g)N/A. The Bank uses the standardised approch.
1 In accordance with the publication EBA/GL/2016/11, version 2.

10 BIL – Pillar 3 Report 2017
Foreword
Banque Internationale à Luxembourg (hereafter “BIL” or “the Bank”) is a banking group located in Luxembourg at 69, route d’Esch, L-2953 Luxembourg and counts about 2,000 employees. It is the ultimate parent company of BIL group. BIL is present in the financial centre of Luxembourg, Denmark, Switzerland and Dubai.
This report meets the consolidated disclosure requirements related to the Part Eight of the Regulation (EU) No 575/2013, known as the Capital Requirements Regulation (CRR), the circular CSSF 14/583, the CSSF regulation 14-01, which are the transpositions of the CRR into national law, thereby setting the regulatory prudential framework applicable to credit institutions, and the circular CSSF 17/673 on the adoption of the European Banking Authority (EBA) Guidelines on disclosure requirements under Part Eight of Regulation.
Unless otherwise stated, the figures disclosed in this report are expressed in millions of euros.
Data is provided at a consolidated level, including subsidiaries and branches of BIL group.
In addition to this document, the annual report is available on the BIL’s website (www.bil.com).

11BIL – Pillar 3 Report 2017
Introduction
The aim of this document is to give in-depth information to the stakeholders on the BIL’s risk management.
This BIL group’s Pillar III disclosure report is divided into six sections and two appendices, as follows:• The first section describes the structure and functioning of
BIL group’s risk organisation and governance;• The second section covers the Bank’s capital management
and capital adequacy;• The third section is dedicated to the credit risk management
and outlines the organisation, the methodological procedures and provides detailed breakdowns of the Bank’s credit risk exposures;
• The fourth section describes methodological procedures for the management of market risk while disclosing the Bank’s corresponding risk profile;
• The fifth section presents the operational risk framework and related key risk figures;
• Finally, the last section relates to the remuneration policy and practices.
It is worth noting that BIL also publishes its Pillar III report on a semi-annual basis.
Main indicators as of December 31, 2017:
Leverage ratio
Liquidity Coverage ratio
Distribution of RWAs by type
Credit Risk;86%
CVA;0%
Operational Risk;13%
Market Risk;1%
3,92%
31.12.15 31.12.16 31.12.17
3,78% 3,89%
119%
31.12.15 31.12.16 31.12.17
140% 131%
SOLVENCY RATIO31.12.15 31.12.16 31.12.17
CET1 Capital ratio 13.04% 12.98% 12.21%Tier 1 ratio 15.72% 15.55% 14.47% Total Capital Ratio 16.07% 18.04% 16.48%

12 BIL – Pillar 3 Report 2017
Introduction
Structure of BIL group
1 Ex-BIL Finance S.A. The entity is not active anymore since July 2013. It was decided to put the entity into liquidation at Q1 2014.2 Ex-BIL Bank Denmark A/S. The entity is not active anymore since December 2013.3 It was decided to put the entity into liquidation as of April 2014.4 Red Sky is a SOPARFI set up as at December 22, 2015.
Remark: The remaining part of the BIL’s shares are held by BIL (0.05%).
Banque Internationale à Luxembourg S.A.Share capital EUR 141.2M
Precision Capital /Legend Holdings
(subject to regulatory approval)Public State of the Grand Duchy
of Luxembourg
Société du25 juillet 2013
S.A.1
Share capital 7,3M EUR dormant investment
company
IB Finance S.A.Share capital 5M EUR
Soparfi
Private II Wealth Management
SARLShare capital 12.500 EUR management
company
Société de la Bourse de Luxembourg S.A. Share capital 14,2M EUR
Europay S.C. Share capital 0,3M EUR
BIL Dubai Branch Endowment capital 4,5MUSO
BIL Danemark Branch Endowment capital 34,8MDKK
Experta Corp & Fund Services
S.A.Share capital 125k EUR investment company
BIL AsiaSingapore Ltd3
Share capital 3M 5GD dormant merchant
bank
BILTRUST LtdAuthorized capital
250.000 G8PNon-cellular company
limited by shares
Belair House S.A.
Share capital 2.5M EUR
family offi ce
Red Sky S.A.4Share capital
13M EUR Soparfi
BIL Reinsurance
S.A.Share capital 3,6M EUR reinsurance company
BIL Lease S.A.Share capital 2,5M EUR
leasing company
Cie Financière BIL & Cie S.E.C.S
Share capital 5,9M EUR dormant commercial
company
BIL (Suisse) S.A.Share capital
52M CHF Bank
Selskabet af 18December 2013
A/S2
Share capital 58.5 M EUR DKK
dormant company (bank)
BIL Manage Invest S.A.Share capital
0.5 M EUR DKKmanagement
company
9.99%89.94%
100%
100% 100% 100%
100%99.9%
21.41%
35.20%
Companies accounted for by the equity method Branches
100% 100%
100%
100% 100% 100% 100% 100%
0,02%

13BIL – Pillar 3 Report 2017
Introduction
Since late 2014, important strategic initiatives were undertaken at a group-wide level that changed BIL group’s corporate structure and risk profile. All these initiatives have been monitored closely by the Bank’s Risk Management department whose main objective is to guide their implementation by ensuring that the related risks are continuously under control and compatible with the institution’s Risk Appetite.
BIL group’s Risk Management department monitored the Bank’s activities and risk profile throughout 2017 in line with the BIL2020 Reloaded strategy. The on-going implementation of new regulatory requirements was the main challenge faced by the institution during the year.
BIL group – Highlights of 2017 and early 2018
BIL upheld its solid performance and continued to implement its BIL2020 strategy in 2017, while at the same time adapting its products and services to comply with new regulatory requirements.
The key highlights for BIL in 2017 are as follows:
Governance
On September 1, 2017, Legend Holdings Corp., a Hong Kong-listed diversified investment group, announced an agreement with Precision Capital, a Luxembourg-based financial holding company, to acquire the latter’s 89.936% stake in BIL. The proposed transaction was approved by the Legend Holdings’ shareholders and remains subject to regulatory approval. The Grand Duchy of Luxembourg retains its 9.993% ownership of BIL.
The acquisition of a majority stake in BIL represents a long-term strategic investment for Legend Holdings. The company is committed to providing financial and operational support to maintain and grow the BIL brand, further enhance its client offering and support the existing management in the delivery of the BIL2020 strategy aiming at sustainable growth.
Adapting to regulatory change
BIL continued to implement its BIL2020 strategy throughout the year with a strong focus on preparing for the new regulatory landscape, in particular MiFID II and PRIIPs. Both regulations entered into force in January 2018, bringing profound changes to the way in which BIL interacts with clients. BIL also took this opportunity to rethink the overall investment offering, revenue model, relationship with third-party intermediaries, as well as certain processes and ways of working.
In particular the investment products were overhauled and the new MiFID-compliant “BIL way of investing” was introduced in January 2018. The product offering was simplified by greatly reducing the number of investment products and streamlining the accompanying pricing grid. On the operational side, the Triple‘ A tool was upgraded and launched for executing trades on the market in compliance with MiFID II.
Review of BIL2020 strategy
A review of the BIL2020 strategy assumptions was undertaken in the first half of 2017 to further align the IT strategy with the Bank’s commercial ambitions. As a result, BIL has a more integrated IT strategy, bundling the regulatory, Ignite and Loans projects with the preparations for a new Core Banking System (CBS) and the digital developments. In addition, several growth and efficiency initiatives were launched in 2017 in continuation of those undertaken since 2015. These initiatives ensure the client is always at the centre thanks to an increased tailoring of products and services to specific client segments.
The FLEX programme launched in Wealth Management in September 2017 is a good example of such an initiative as it aims to optimise client-facing time, improve the client experience and empower employees. Three pilot teams completed the twelve-week programme by the end of 2017 with excellent results, including a 63% increase in commercial activities such as client and prospect meetings and a 50% increase in leadership activities such as client book reviews and performance dialogues.
A focus on entrepreneurs
As part of its efforts to offer more bespoke services to certain client groups, BIL launched a dedicated service for business owners in March. By bringing together the best of BIL’s Wealth Management, Corporate Banking and Retail Banking services, BIL offers business owners a single point of contact at the bank for both their personal and professional banking and financing needs throughout the entire lifecycle of their business.
In addition to providing tailored services for entrepreneurs, BIL continued to support innovation and innovative start-ups in Luxembourg in 2017. BIL is proud of its leading role in promoting the development of Luxembourg into a start-up nation.
In this respect, BIL has built an entire network of partnerships with business incubators which continued to grow in 2017. In May, BIL and the business incubator Paul Wurth InCub agreed to jointly support the development of industrial

14 BIL – Pillar 3 Report 2017
Introduction
technologies, or InduTech, in Luxembourg. In August, BIL launched a collaboration with The Office, a start-up office space in Luxembourg City, to help the start-ups it works with to find office space. BIL also launched a partnership with Jonk Entrepreneuren, a Luxembourgish association that supports young entrepreneurs. In addition to encouraging entrepreneurship and start-up businesses, BIL of course also continued to provide services for established companies, including for larger corporate clients.
Service upgrades
BIL continued to fine-tune its services for meeting the specific needs of different client groups in 2017. For example, BIL improved its B-active offer for young professionals in July by introducing new features such as 100% mortgages with deferred first loan instalments and tax-efficient pension products. BIL also increased its attractiveness for newcomers to Luxembourg in October by offering these clients a voucher for their first tax return and a moving-in loan. Also in October, the BIL MasterCard World Elite was launched for clients willing for high-end insurance, assistance and concierge services.
Digitisation is a key aspect of the BIL2020 strategy and BIL continued to upgrade its digital service offering in 2017. New mobile alerts on the BIL app enable clients to monitor their account movements on their mobile phones in real time. In addition, since July, BIL clients using Android phones can use fingerprint authentication and access all QuickBanking™ features easily without having to enter a PIN.
In Retail Banking, BIL launched a collaboration with AXA and Foyer for retirement saving services on January 24, 2017. Daily banking procedures were also rendered more efficient to save time for clients and reduce the administrative workload of the sales teams, for example concerning overdraft authorisations and the replacement of lost or stolen bank cards.
Local footprint
BIL remains firmly rooted in Luxembourg and plays an active role in supporting the local economy. For example, BIL joined the government’s KlimaBank initiative in January 2017 to promote zero percent green building loans for homeowners. BIL also successfully acted as a joint lead manager for a EUR 2 billion bond issue by the Grand Duchy of Luxembourg.
In February 2017, three tax reform conferences for residents and non-residents attracted over 300 attendees in total. The ins and outs of the Luxembourgish tax reform 2017 were explained to participants and the conferences presented an opportunity to showcase BIL’s tax services.
In addition to these local initiatives, BIL also actively supports the Luxembourgish government’s efforts to promote the Grand Duchy’s financial centre abroad. For example, on February 13 and 14, BIL participated in a mission by Luxembourg for Finance (LFF) to the United Arab Emirates.
Corporate social responsibility – the local touch
In addition to the areas of innovation, education and art & culture, BIL extended its Corporate Social Responsibility (CSR) activities in 2017 to the promotion of health-related projects and organisations such as Médecins du Monde. Although BIL has been active in this field for years, health-related projects will be further structured. In this spirit, the Art2Cure art exhibition at BIL’s Galerie Indépendence from June 23 to September 15, combined the Bank’s support for art with the new aim of promoting health by raising EUR 30,000 for the Luxembourg Center for Systems Biomedicine (LCSB).
The exhibition “The Promises of Monsters” by Laura Mannelli was another major exhibition at the Galerie Indépendence and generated a lot of media attention. The artist is the first recipient of the Indépendance grant in support of digital art in Luxembourg awarded by the National Culture Fund, the Indépendance Foundation and BIL.
In the area of education, BIL once again supported SOS Villages d’Enfants Monde and the local Luxembourgish branch Fondation Lëtzebuerger Kannerduerf. One of the highlights in the area of innovation was the granting of Innovation Awards by BIL to Alexandra Fernandez-Ramos, co-founder of Travelsify, and Nathalie Dondelinger, co-founder of Kliber.
Awards and ratings
BIL’s ratings remained in a favourable level in 2017, confirming the Bank’s strong financial fundamentals. The announcement of Legend Holdings’ intention to buy a majority stake in BIL was welcomed by rating agencies with Fitch revising BIL’s outlook from “stable” to “positive”.

15BIL – Pillar 3 Report 2017
Introduction
The high quality of BIL’s services was also recognised externally by numerous awards such as “Best Bank in Luxembourg 2017” by Global Finance and “Bank of the Year Luxembourg” by The Banker magazine for the second time in a row.
The private banking division won Euromoney’s “Best Private Bank for Super Affluent Clients in Luxembourg” award in confirmation of BIL’s wealth management expertise and bespoke services as well as a WealthBriefing award for the “Best International Clients Team”.
In addition, BIL’s myLIFE, an online multimedia platform focusing on questions from clients and their financial plans, was judged “Best Marcom Project of the Year” at the Luxembourg Marketing & Communication Awards.
Overview of the main regulatory changes occurred in 2017
In 2017, BIL continued to invest time and resources to remain compliant with regulatory standards, and notably regarding the A-IRB framework. In the context of the Targeted Review of Internal Models (TRIM), BIL has been working on different topics related to Pillar I internal models used by significant institutions within the Single Supervisory Mechanism (SSM). Within this framework, the mains missions/reviews that were made by the supervisors during the year are: (i) The reviews of some specific A-IRB models (retail models (PD, LGD and CCF), LGD Bank, Haircut on Financial Collateral) and, (ii) Credit to Wealth Management and (iii) Real Estate review.
In the context of the Basel III revisions, some topics were published by the Basel Committee in order to introduce the so-called Basel IV requirements. In 2018, the Bank will continue to invest resources to comply with these new requirements.
In 2017, BIL also kept working on the new default definition. This project will be divided into two parts: (i) A tactical solution in order to estimate and calibrate the Credit Risk Parameters according to this new default definition and (ii) A strategic solution including different elements, such as the IT deployment, and the validation of the new implied models, etc. The roadmap (2018-2021) of this strategic part will be communicated to the supervisors by July 2018.
BIL has adapted its accounting standard to new IFRS9 norm which replaces IAS 39. BIL uses the IFRS accounting framework for the production of annual and semi-annual consolidated accounts as required by the Transparency Directive. Following the financial crisis, the IASB started the reform of the financial instruments accounting framework in order to address the following IAS 39 weaknesses: Timeliness of recognition of
credit losses and complexity of multiple impairment models. IFRS 9 introduces new rules regarding the classification and measurement based on the entity’s business model and the contractual cash flow characteristics of the individual financial asset. Regarding the different elements of the framework, the Bank is now up and running: All the business models and the classifications have been set-up, the SPPI tests are in production and the impairment assessment (ECL) is also in production with a methodology developed in-house. This leads to a first estimation of the accounting norm change (FTA) regarding the impairment which represents EUR 24.7 M and EUR 31.9 M taking into account the classification impact (both figures are before taxes).
Moreover, the Bank has worked on the Interest Rate Risk in the Banking Book (IRRBB), which refers to the current or prospective risk to a bank’s capital and its earnings, arising from the impact of adverse movements in interest rates on the banking book. In this context, a new policy has been drawn up in September 2017. The new standards is applicable from January 2018 and take into account changes introduced by the BIS/EBA guidances.
The Bank Recovery and Resolution Directive (2014/59/EU), published in May 2014, was transposed into Luxembourgish law in late 2015. In this context, in 2017, the Bank elaborated its third Recovery Plan, which was sent to the regulators at the end of September. Regarding the resolution part, BIL has worked on the Resolution Plan with the Single Resolution Board. Moreover, in May 2017 and 2018, the Bank has completed several templates in order to provide general information on its governance, legal contracts, balance sheet composition, etc. Finally, it is worth mentioning that the Bank frequently meets the Resolution Authority to discuss the different topics linked to the Resolution Plan.
During the last quarter of 2017, the Bank started to work on the 2018 EU-wide stress testing, by conducting a review of its capability and the methodology of this exercise. This was to prepare the official exercise which is now running until October 2018.
Regarding the credit topics, BIL has also worked on Anacredit in order to be fully compliant for the first submission in September 2018, and on the Mortgage Credit Directive (MCD).
Finally, it is also worth noting that the Bank took part in various ad hoc regulatory exercises such as the benchmarking portfolio exercise.

16 BIL – Pillar 3 Report 2017
1.1 Risk management responsibilities
BIL group Risk Management framework relies on a governance allowing a prudent and sound management of risks:• Board of Directors (assisted by the Board Risk Committee)
and the Management Board and their responsibilities in decision-taking and monitoring risk;
• A comprehensive set of Management Committees (including at least one member of the Management Board) specialised in various risks (Commitment Committee, Default Committee, ALCO, Information Security Committee, New Product Committee);
• Other formalised Risk committees including experts and operational teams taking decisions related to the Bank’s risk monitoring (e.g. Rating Committee) as well as specific practices (e.g. Model Risk Committee).
Consistent with the Bank’s Risk Appetite, charters, policies, procedures and reporting are explaining:• The activities;• The definition of limits for risk-taking by risk types;• The assessment and measurement of the risks induced by
the Bank’s activities;• The reporting to the Management.
As a general principle, BIL’s entities internal control functions report both hierarchically and functionally for branches and functionally for subsidiaries, to the corresponding control functions at BIL Head Office level.
1.2 Risk organisation and governance
BIL group's risk management framework is based on a clear organisational structure with a transparent decision-making process that facilitates prudent management of risks.
The Bank’s risk management model is based on the following principles:• Independence of the risk function with respect to the
business;• Collegial decision-making to ensure that opinions are
challenged;• Precise policies and procedures detailing limits of risk,
responsibilities, monitoring and reporting of risks taken by the Bank;
• Central control, whereby all departments, subsidiaries and branches report both organisational related and technical matters to Risk Management at BIL’s Head office;
• Implementation of the same risk monitoring and data control system in all entities of BIL group.
1. Risk Management

17BIL – Pillar 3 Report 2017
Risk Management
1.2.1. Organisation
To reflect a sound management of risk and develop an integrated risk culture, the Bank has set up an effective Risk Management organisation, in adequacy with its activities, encompassing the relevant risks induced by its activities.
In order to help the Bank reach defined objectives as well as face the changing regulatory environment, the organisation of the Risk Management department has been reviewed as depicted below:
Credit Risk Management Modeling
Data, Reporting &
Systems
Enterprise Risk
Management
Financial Risk Management
Operational Risk
Management
Corporate Information
Security
ProjectOffice
LoansServices
Chief Risk Officer
At the Management Board level, the overall Risk Management framework is under the Chief Risk Officer (CRO)’s responsibility, and the CRO is responsible for providing any relevant information on risks to the Management Board, enabling the capture and management of the Bank’s overall risk profile. The nine specific units are described in further details hereafter.
Credit Risk Management
This unit is composed of four different teams:• The Banks & Countries, Private Banking Analyses team is
in charge of the assessment and the monitoring of the risk related to banks and sovereign counterparts on one side and private banking counterparts on the other side;
• The Retail, Midcorp, Real Estate Analyses team is in charge of retail and midcorp counterparts on one side and for the real estate specialised counterparts on the other side;
• The Corporate Analyses team is in charge of the assessment and the monitoring of the risk related to corporate and institutional counterparts, including providing support for complex files to the other teams;
• “Gestion Intensive et Particulière” (GIP) proactively manages assets deemed to be “sensitive” in order to minimize the potential losses for the Bank in case of the default of a counterparty.
The three Analyses teams are in charge of assigning internal ratings to BIL counterparties and monitoring the corresponding portfolio.
Modeling
The Modeling team is in charge of the development and performance monitoring of the Basel III Pillar I approach and IFRS 9 models for Credit Risk.
The Modeling unit is responsible for the development and the maintenance of all the models related to credit risk quantification implemented in the context of:• The credit risk management and monitoring;• The computation of regulatory capital requirements
(Pillar 1);• The provisioning modelling according to the IFRS 9
standard;• The forecasting of the risk parameters used in the stress test
process.
It also manages and ensures the consistency of the internal rating system integration within the credit risk management process and policies of the Bank.
Data, Reporting & Systems
The Data, Reporting & Systems unit is in charge of the development and maintenance of the data and risk systems used for the calculation of the credit risk capital requirements and the corresponding regulatory reporting. These teams are also responsible for the production of regulatory and internal reports related to Credit Risk such as the COREP, Large Exposures and covers ad hoc requests from regulatory authorities.

18 BIL – Pillar 3 Report 2017
Risk Management
This unit is composed of three different teams:• The Data Management & Quality team is responsible
for operational quality control (known as level 1) and regulations (so-called second level) for data and processes related to Basel risk parameters;
• The Risk Reporting team is in charge of monitoring credit risk figures, producing regulatory reporting (e.g. COREP, Large exposures, Past Due, IFRS 7) as well as any internal credit risk reporting, external demands or periodical credit risk reporting (ECB, EBA, CSSF, etc.);
• The Risk Systems team mainly works with the Moody’s RAY software which serves to produce, among others, the Basel COREP and Large Exposures reports. The team is responsible for the software's expertise in terms of data, parameterisation and calculation engines (i.e. Basel, Economic IRBA, IBNR provisions and Large Exposures).
In addition to these above-mentioned activities, this department is directly involved in the implementation of IFRS 9 standards, including the definition and the classification of the credits according to IFRS 9 standards and in the selection of the different IT tools required.
Enterprise Risk Management
The Enterprise Risk Management department consolidates all the activities related to the monitoring of the Bank’s group-wide Risk Management frameworks including, but not limited to, ICAAP/ILAAP, stress tests, model validation, and Recovery Plan.
The unit is composed of two different teams:• The Enterprise Risk Management team is in charge of the
deployment and monitoring of the various components of the SREP process. This process is based on the analysis of the Business Model of the Bank through its Risk Appetite; the establishment of a framework for risk governance; the deployment of an Internal Capital Adequacy Assessment Process (ICAAP) and an Internal Liquidity Adequacy Assessment Process (ILAAP); a transversal stress testing device; and the establishment of a BIL Recovery Plan. Moreover, the Enterprise Risk Management department ensures the coordination of transversal projects related thereto; the realisation of regulatory transversal reports (Pillar III Report, Annual Report, Long Form Report, etc.) and the prudential risk consolidation for the Bank and its subsidiaries/ branches.
• The Internal Validation team aims to ensure the robustness and soundness of the internal rating systems by validating all the BIL risk quantification models. The unit is responsible for independently verifying that models proposed for use by model owners are fit for purpose through the whole
model lifecycle, and that the associated model risks are appropriately identified and mitigated. In order to do so, Internal Validation has explicit authority and independence to provide effective challenging to related stakeholders, presenting issues and highlighting deficiencies. The key aspects of models validated by the internal validation unit include model design, data quality, model implementation, and model performance.
Financial Risk Management
The Financial Risk Management (hereafter “FRM”) department is in charge of the charters, policies and guidelines definition and their application on financial market activities (ALM, Trading, Liquidity and Collateral Management). Moreover, this department is responsible for identifying, analysing, monitoring and reporting on risks and results on these topics at BIL and BIL group level. Furthermore, FRM is the functional responsible of the main tools (Kondor+, Bloomberg), interfaces of the Dealing Room and the FRM datamart (FRMD).
FRM is composed of two different teams, as described below: • The Market Data Management & Risk Engineering team
is in charge of: - Implementing regulatory projects related to market risks; - Ensuring the operational management of the Treasury and
Financial Markets (TFM) and FRM tools and implementing the methodologies of revaluation models for the positions of the Bank (and some specific clients) in order to optimise the risk and capital level of the Bank; setting up the evolutions or new activities of the Dealing Room;
- Developing, producing and monitoring some regulatory indicators (liquidity: LCR, NSFR, HQLA, etc. and interest: IRRBB) and monitoring the counterparties limits and middle-office controls (preventing operational and fraud risk);
- Designing and maintaining the intelligence tools (Datamart);
- Managing the definition and the availability of the market data for the Bank.
• The Banking & TFM Risk Monitoring team is in charge of (for BIL and BIL group): - Implementing the regulatory standards by defining the
technical and functional policies and guidelines; - Identifying, managing and optimising market and liquidity
risks; - Identifying, managing and optimising the collateral
management; - Maintaining an optimised level of capital allocation
consistent with the Bank’s Risk Appetite strategy;

19BIL – Pillar 3 Report 2017
Risk Management
- Informing and alerting the Bank’s Management of the risks to which BIL group is exposed;
- Conducting the stress testing and data collection exercises required by the Regulator (EBA/CSSF).
Operational Risk Management
The Operational Risk Management unit handles the management of corporate operational risks and Insurance & Reinsurance topics.
This unit is composed of two different teams: • The Corporate Operational Risk team is in charge of:
- Implementing for BIL and its subsidiaries / branches, a system of control and actions to ensure an adequate operational risk exposure (internal fraud, external fraud, processes, systems, products, etc.) in line with the risk appetite as defined by the Bank;
- Assessing operational risk on new products and/or projects from the beginning and through the analyses of Key Risk Indicators.
• The Insurance & Reinsurance team is in charge of: - The establishment and regular updating of the insurance
programme (BIL and employee coverage) within the Bank and its subsidiaries / branches;
- A centralised management of insurance policies and claims within the Bank and its subsidiaries, acting as a single contact for both brokers and the insured;
- Developing a comprehensive approach by ensuring the adequacy of the policy and insurance device including the own reinsurance company of BIL (captive) for risk analysis.
Corporate Information Security
The Corporate Information Security unit aims to define the high level objectives in each domain of Information Security – as defined in ISO/IEC 27001:2013 and the corresponding roles defined in the circular CSSF 12/552 – that must be fulfilled to ensure the security of the information of the Bank. This unit is composed of three different teams: • The Security Risk Prevention team is in charge of validating
and controlling access according to the rules and principles set out in memo NS0032 to ensure the security of systems and applications. This team is also in charge of maintaining the referential or resources available in the Identity and Access Management system;
• The Security Risk Regulation team ensures the establishment and maintenance of a global and transversal overview of various aspects of the Bank's Information Security to provide BIL with adequate protection and
prevent threats (theft, loss, destruction, alteration , inaccessibility, etc.). This team performs regular controls on effective access rights to systems compared to declared and validated access in the Identity and Access Management tool. This team is also intervenes in the new projects process to ensure that Confidentiality, Integrity and Availability principles defined in internal security policies are applied (Security by design);
• The Business Continuity team establishes and maintains the continuity plan (Business Continuity Plan), its alignment with the IT Recovery Plan (Disaster Recovery Plan) and performs an annual review of Business Impact Analysis with Business Lines in order to maintain an up-to-date continuity plan.
Project Office
The Project Office within Risk Management is set up in order to cope with the various risk projects, be they regulatory, enhancements or strategic projects, Risk Management is involved. These projects are generally transversal projects at the level of the Bank but also at the level of Risk Management.
This unit is composed of two different teams:• The Projects Management team aims is to have a
centralised and coordinated management of these projects ensuring: - A structured and centralised approach to anticipation and
prioritisation; - Solutions designs and deliveries within the projects fit
Risk Management requirements and processes with a transversal forward looking assessment;
- A consolidated tracking of status/budgets of the projects including their respective deliverables/milestones with regular updates to Risk Management top management;
- Proper and continuous communication and organisation among participants, within and outside Risk Management.
• In addition to the projects management, the Project Office is also responsible for the Model Governance. The Model Governance unit is in charge of overseeing compliance with the Model Risk Management Framework of the Bank. This unit ensures the documentation is in place for each model, that the model inventory and issue tracking tool is maintained and updated regularly, and provides challenge where appropriate to the Model Owners and Developers. Moreover, the Model Governance unit is responsible for organising the model risk committees by preparing agendas, writing minutes, and archiving documents. The unit is the central repository for all charters and policies related to the Model Risk Management Framework.

20 BIL – Pillar 3 Report 2017
Risk Management
Loans Services
Loans Services is the back office dedicated to the implementation and follow-up of all loans granted by the Bank. This team has been integrated into Risk Management Organisation in order to ensure a better control of risks linked to the legal implementation and monitoring of loans (and associated security packages).
Loans Services is: • Accountable for the management of operational and legal
risks related to the implementation and the maintenance of all credits granted by the Bank;
• Accountable for the disbursement of loans consecutively to their implementation in full adequacy with the decisions of the credit authorities and committees;
• Guarantor of the operational efficiency of the Bank, reflected in the capacity to implement the loans and credits in conditions of form and time consistent with the expectations of the three main business lines (Retail & Digital Banking, Corporate & Institutional Banking and Wealth & Investment Management) and their customers while respecting the allocated budgets.
Loans Services is divided into 4 dedicated teams.• The Retail and Employee Loans team is in charge of :
- The implementation of retail loans consisting of a large number of highly standardised small to medium sised loans, mainly consumption and housing loans (in Luxembourg or Luxembourg Great Region);
- The management of all life cycle events (disbursement, partial or full release of sureties, renewal of sureties, interest rates changes, repayment programs deferrals, etc. related to Retail and Corporate loans);
- The final validation of mortgage deeds securing cross border loans.
• The Bank Guarantee & Corporate Banking Loans team is in charge of : - Implementing business loans granted to small and
midsised companies in Luxembourg, these loans are also highly standardised and are mainly investment loans and overdraft facilities;
- Managing the issuance of Bank Guarantees as well as the received bank guarantee portfolio.
• The Private, Large Corporate and Institutional Banking Loans team is in charge of: - Implementing Private banking loans, mainly Lombard
loans and investment loans which are quite standardised and secured by assets deposited in BIL;
- Implementing tailor-made structured multiform facilities or cross-border mortgage loans for international wealth management clients and Ultra High Net Worth Individuals;
- Implementing tailor-made structured or syndicated facilities for large corporate or institutional clients.
• The Project and Monitoring team is in charge of: - Maintaining, updating and improving the Bank’s risk
monitoring system of stock of credit and security packages throughout their life cycle;
- Maintaining, updating and improving the Bank’s system for monitoring the operational efficiency of the Loans Services line;
- Maintaining, updating and improving the quality monitoring system;
- Representing Loans Services as Project Business Owner in all projects related to the business;
- Representing Loans Services as application Owner for tools related to the Bank’s activity.
The Board Risk Committee is responsible for proposing BIL’s group risk policy to the Board of Directors. This committee also ensures that BIL’s activities are consistent with its risk appetite and gives positive recommendation to the Board of Directors as regards the level of global limits for the main risk exposures.
The Management Board is responsible for implementing strategies as approved by the Board of Directors, and establishing a safe and sound management, in accordance with the principles and objectives established by the BoD. The Management Board ensures that rigorous and robust processes for risk management and internal controls are in place, that the Bank is staffed enough in order to be able to set up a safe and sound management of its activities. These processes include the establishment of strong risk governance.
In addition, there are other management committees related to risk topics. These committees stand and receive attribution from the Management Board within a precise and defined scope. They facilitate the development and implementation of sound practices of governance and decisions. These committees are described in more detail below.

21BIL – Pillar 3 Report 2017
Risk Management
Finally, discussions and decisions related to Risk Management are also governed by additional internal committees. Those committees allow to ensure, among others, that the processes set up for the Bank’s A-IRB framework are in line with regulatory requirements and that the corresponding tools are used in an appropriate way.
1.2.2.1 Risk policies, guidelines and procedures
The Risk Management framework is governed by an integrated set of charters and policies. Internal BIL policies and procedures are required to comply with regulatory requirements and must be aligned with BIL group’s Charters.
All charters, policies and procedures are centrally stored and made be available to all the staff. Charters, policies and procedures are reviewed on at least three-yearly basis (unless otherwise mentioned in the respective document) and more frequently if a material change justifies it.
These documents allow to have an uniform methodology and terminology to be applied within BIL group Risk Management and controls functions.
They clarify risk identification, risk assessment and risk monitoring processes, as required by the circular CSSF 12/552 (as amended). This set of documents ensures that the risks are adequately described and that the appropriate controls are well implemented across the group.
Committee Responsabilities
Internal Control CommitteeThe Internal Control Committee is mandated by the Management Board to strengthen cooperation between the 3 lines of defence through coordination of the activities of each Internal Control function and decision on transversal issues related to Internal Control.
Commitments Committee Those Committees are mandated by the Management Board to grant specific and decide for certain type of commitments (Risk Policy Committee has been merged with the Commitments Committee).
Credit Committee This Committee is mandated by the Management Board to validate commitments meeting certain criteria.
Employee Credit Committee This Committee is mandated by the Management Board to decide for BIL and its domestic subsidiaries all commitments regardless of their level.
Default Committee This Committee is mandated by the Management Board to deal with the incidents of default and define the principles to apply to BIL and its subsidiaries.
ALM Committee This Committee is mandated by the Management Board to decide on the structural positioning of the Bank’s balance sheet in terms of rates, foreign exchange and liquidity.
Security CommitteeThis Committee is mandated by the Management Board to oversee the risks linked to the BIL’s information security and the security incidents, and make recommendations for decisions on projects with a potential link to the security of information assets.
Regulatory CommitteeThis Committee is mandated by the Management Board to develop and promote a culture of regulatory strategy within the bank, oversee regulatory projects and provide assistance in the implementation of regulatory projects.
New Products Committee Management Committee responsible for new products/ services on the basis of ideas coming from the entire Bank and for checking the relevance of the underlying business case against the Bank strategy.

22 BIL – Pillar 3 Report 2017
The aim of capital management is to guarantee BIL’s solvency and sustain its profitability, while ensuring compliance with internal capital objectives and capital regulatory requirements. The Bank’s ratios comfortably exceed the required levels, thereby reflecting its ability to reply to the new Basel III requirements.
BIL monitors its solvency using rules and ratios issued by the Basel Committee on Banking Supervision and the European Capital Requirements Directive.
These ratios (Common Equity Tier 1 capital ratio, Tier 1 capital ratio and total capital ratio) compare the amount of regulatory capital, eligible in each category, with BIL group’s total weighted risks.
As from 2018, the breakdown of prudential capital requirement (without the P2G component which is not disclosed according the prescription of the ECB) is the following:
As at December 31, 2017, the CET1 ratio of the bank stands at 12.21% and a total capital ratio of 16.48%1.
The supervisory bodies (ECB and CSSF) require BIL to disclose the calculation of capital necessary for the performance of its activities in accordance with the prudential banking regulations, on the one hand, and in accordance with the prudential regulations on financial conglomerates on the other hand.
BIL did comply with all regulatory capital rules for all periods reported.
1 Following an on-site JST (Joint Supervisory Team) review of the real estate promotion exposures which ended March 2018, the JST requests a change of some exposure classification which leads to an increase of credit-related RWA, which is currently estimated to approximately EUR 200 million to reach 6.8 B. This would reduce the CET1 ratio by around 35bps
Capital components Amount
Minimum requirement for Core CET1 requirement 4.50%
Minimum requirement for Conservation buffer 2.50%
Minimum requirement for O-SII buffer 0.375%
Minimum requirement for Countercyclical buffer 0%
Minimum requirement for Pillar 2 Requirement 1.750%
9.125%
2. Own funds and capital adequacy
2.1. Regulatory capital adequacy (Pillar I)
2.1.1. Accounting and regulatory equity
In line with the regulatory requirements, BIL has limited the scope of the Pillar III report to its banking activities. Therefore, the scope of consolidation differs from the scope of consolidation of the financial statements (as provided in BIL group’s annual report).
31/12/2016Financial
statementsRegulatory
purposesTotal shareholders’ equity 1,260 1,260
of which Core equity 1,191 1,191of which Gains and Losses not recognized in the statement of income 69 69
Non-controlling interests 0 0 of which Core equity 0 0of which Gains and Losses not recognized in the statement of income 0 0
Discretionary participation features of insurance contracts 0 0
TOTAL 1,260 1,260
31/12/2017Financial
statementsRegulatory
purposesTotal shareholders’ equity 1,286 1,286
of which Core equity 1,240 1,240of which Gains and Losses not recognized in the statement of income 46 46
Non-controlling interests 0 0 of which Core equity 0 0
of which Gains and Losses not recognized in the statement of income 0 0
Discretionary participation features of insurance contracts 0 0
TOTAL 1,286 1,286
As at end-2017, shareholder’s equity increased by 26 million (+2.%).
23BIL – Pillar 3 Report 2017
Own funds and capital adequacy
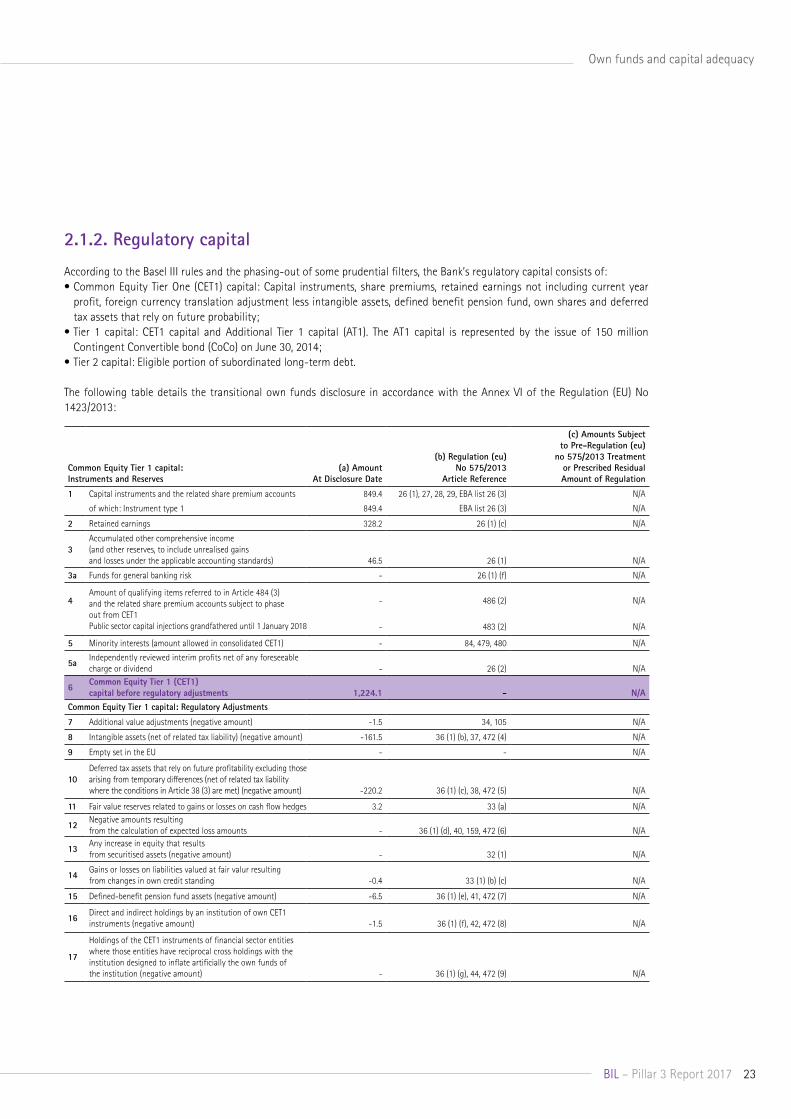
2.1.2. Regulatory capital
According to the Basel III rules and the phasing-out of some prudential filters, the Bank’s regulatory capital consists of:• Common Equity Tier One (CET1) capital: Capital instruments, share premiums, retained earnings not including current year
profit, foreign currency translation adjustment less intangible assets, defined benefit pension fund, own shares and deferred tax assets that rely on future probability;
• Tier 1 capital: CET1 capital and Additional Tier 1 capital (AT1). The AT1 capital is represented by the issue of 150 million Contingent Convertible bond (CoCo) on June 30, 2014;
• Tier 2 capital: Eligible portion of subordinated long-term debt.
The following table details the transitional own funds disclosure in accordance with the Annex VI of the Regulation (EU) No 1423/2013:
Common Equity Tier 1 capital: Instruments and Reserves
(a) Amount At Disclosure Date
(b) Regulation (eu) No 575/2013
Article Reference
(c) Amounts Subject to Pre-Regulation (eu)
no 575/2013 Treatment or Prescribed Residual Amount of Regulation
1 Capital instruments and the related share premium accounts 849.4 26 (1), 27, 28, 29, EBA list 26 (3) N/A
of which: Instrument type 1 849.4 EBA list 26 (3) N/A
2 Retained earnings 328.2 26 (1) (c) N/A
3Accumulated other comprehensive income (and other reserves, to include unrealised gains and losses under the applicable accounting standards) 46.5 26 (1) N/A
3a Funds for general banking risk - 26 (1) (f) N/A
4Amount of qualifying items referred to in Article 484 (3) and the related share premium accounts subject to phase out from CET1Public sector capital injections grandfathered until 1 January 2018
- 486 (2) N/A
- 483 (2) N/A
5 Minority interests (amount allowed in consolidated CET1) - 84, 479, 480 N/A
5a Independently reviewed interim profits net of any foreseeable charge or dividend - 26 (2) N/A
6 Common Equity Tier 1 (CET1) capital before regulatory adjustments 1,224.1 - N/A
Common Equity Tier 1 capital: Regulatory Adjustments
7 Additional value adjustments (negative amount) -1.5 34, 105 N/A
8 Intangible assets (net of related tax liability) (negative amount) -161.5 36 (1) (b), 37, 472 (4) N/A
9 Empty set in the EU - - N/A
10Deferred tax assets that rely on future profitability excluding those arising from temporary differences (net of related tax liability where the conditions in Article 38 (3) are met) (negative amount) -220.2 36 (1) (c), 38, 472 (5) N/A
11 Fair value reserves related to gains or losses on cash flow hedges 3.2 33 (a) N/A
12 Negative amounts resulting from the calculation of expected loss amounts - 36 (1) (d), 40, 159, 472 (6) N/A
13 Any increase in equity that results from securitised assets (negative amount) - 32 (1) N/A
14 Gains or losses on liabilities valued at fair valur resulting from changes in own credit standing -0.4 33 (1) (b) (c) N/A
15 Defined-benefit pension fund assets (negative amount) -6.5 36 (1) (e), 41, 472 (7) N/A
16 Direct and indirect holdings by an institution of own CET1 instruments (negative amount) -1.5 36 (1) (f), 42, 472 (8) N/A
17
Holdings of the CET1 instruments of financial sector entities where those entities have reciprocal cross holdings with the institution designed to inflate artificially the own funds of the institution (negative amount) -
36 (1) (g), 44, 472 (9) N/A

24 BIL – Pillar 3 Report 2017
Own funds and capital adequacy
18
Direct and indirect holdings by the institution of the CET1 instruments of financial sector entities where the institution does not have a significant investment in those entities (amount above 10% threshold and net of eligible short positions) (negative amount) -
36 (1) (h), 43, 45, 46, 49 (2) (3), 79, 472 (10) N/A
19
Direct, indirect and synthetic holdings by the institution of the CET1 instruments of financial sector entities where the institution has a significant investment in those entities (amount above 10% threshold and net of eligible short positions) (negative amount) -
36 (1) (i), 43, 45, 47, 48 (1) (b), 49 (1) to (3), 79, 470, 472 (11) N/A
20 Empty set in the EU - - N/A
20aExposure amount of the following items which qualify for a RW of 1250%, where the institution opts for the deduction alternative
36 (1) (k) N/A
20b of which: qualifying holdings outside the financial sector (negative amount) - 36 (1) (k) (i), 89 to 91 N/A
20c of which: securitisation positions (negative amount) - 36 (1) (k) (ii) 243 (1) (b) 244 (1) (b) 258 N/A
20d of which: free deliveries (negative amount) - 36 (1) (k) (iii), 379 (3) N/A
21Deferred tax assets arising from temporary differences (amount above 10% threshold, net of related tax liability where the conditions in Article 38 (3) are met) (negative amount) -
36 (1) (c), 38, 48 (1) (a), 470, 472 (5) N/A
22 Amount exceeding the 15% threshold (negative amount) - 48 (1) N/A
23of which: direct and indirect holdings by the institution of the CET1 instruments of financial sector entities where the institution has a significant investment in those entities - 36 (1) (i), 48 (1) (b), 470, 472 (11) N/A
24 Empty set in the EU - - N/A
25 of which: deferred tax assets arising from temporary differences - 36 (1) (c), 38, 48 (1) (a), 470,
472 (5) N/A
25a Losses for the current financial year (negative amount) - 36 (1) (a), 472 (3) N/A
25b Foreseeable tax charges relating to CET1 items (negative amount) - 36 (1) (l) N/A
26 Regulatory adjustments applied to Common Equity Tier 1 in respect of amounts subject to pre-CRR treatment -25.1 - N/A
26a Regulatory adjustments relating to unrealised gains and losses pursuant to Articles 467 and 468 -69.2 - N/A Of which: … filter for unrealised loss 1 0.9 467 N/A
Of which: … filter for unrealised loss 2 467 N/A
Of which: … filter for unrealised gain 1 -70.1 468 N/A
Of which: … filter for unrealised gain 2 468 N/A
26bAmount to be deducted from or added to Common Equity Tier 1 capital with regard to additional filters and deductions required pre CRR 44 481 N/A
27 Qualifying AT1 deductions that exceed the AT1 capital of the institution (negative amount) - 36 (1) (j) N/A
28 Total regulatory adjustments to Common Equity Tier 1 (CET1) -412 - N/A
29 Common Equity Tier 1 (CET1) capital 810.605 - N/A
Additional Tier 1 (AT1) capital: instruments
30 Capital instruments and the related share premium accounts 150 51, 52 N/A
31 of which: classified as equity under applicable accounting standards - - N/A
32 of which: classified as liabilities under applicable accounting standards 150 - N/A
33 Amount of qualifying items referred to in Article 484 (4) and the related share premium accounts subject to phase out from AT1 - 486 (3) N/A
Public sector capital injections grandfathered until 1 January 2018 - 483 (3) N/A
34Qualifying Tier 1 capital included in consolidated AT1 capital (including minority interests not included in row 5) issued by subsidiaries and held by third parties - 85, 86, 480 N/A
35 of which: instruments issued by subsidiaries subject to phase out - 486 (3) N/A
36 Additional Tier 1 (AT1) capital before regulatory adjustments 150 - N/A

25BIL – Pillar 3 Report 2017
Own funds and capital adequacy
Additional Tier 1 (AT1) capital: regulatory adjustments
37 Direct and indirect holdings by an institution of own AT1 instruments (negative amount) - 52 (1) (b), 56 (a), 57, 475 (2) N/A
38
Holdings of the AT1 instruments of financial sector entities where those entities have reciprocal cross holdings with the institution designed to inflate artificially the own funds of the institution (negative amount) - 56 (b), 58, 475 (3) N/A
39
Direct and indirect holdings by the institution of the AT1 instruments of financial sector entities where the institution does not have a significant investment in those entities (amount above 10% threshold and net of eligible short positions) (negative amount) - 56 (c), 59, 60, 79, 475 (4) N/A
40
Direct and indirect holdings by the institution of the AT1 instruments of financial sector entities where the institution has a significant investment in those entities (amount above 10% threshold and net of eligible short positions) (negative amount) - 56 (d), 59, 79, 475 (4) N/A
41
Regulatory adjustments applied to Additional Tier 1 in respect of amounts subject to pre-CRR treatment and transitional treatments subject to phase out as prescribed in Regulation (EU) No 575/2013 (i.e. CRR residual amounts) - - N/A
41a
Residual amounts deducted from Additional Tier 1 capital with regard to deduction from Common Equity Tier 1 capital during the transitional period pursuant to article 472 of Regulation (EU) No 575/2013 -
472, 473(3)(a), 472 (4), 472 (6), 472 (8) (a), 472 (9), 472 (10) (a),
472 (11) (a) N/A
41bResidual amounts deducted from Additional Tier 1 capital with regard to deduction from Tier 2 capital during the transitional period pursuant to article 475 of Regulation (EU) No 575/2013 - 477, 477 (3), 477 (4) (a) N/A
41c Amount to be deducted from or added to Additional Tier 1 capital with regard to additional filters and deductions required pre CRR - 467, 468, 481 N/A
42 Qualifying T2 deductions that exceed the T2 capital of the institution (negative amount) - 56 (e) N/A
43 Total regulatory adjustments to Additional Tier 1 (AT1) capital - -
N/A
44 Additional Tier 1 (AT1) capital 150 - N/A
45 Tier 1 capital (T1=CET1+AT1) 960.6 - N/A
Tier 2 (T2) capital: instruments and provisions
46 Capital instruments and the related share premium accounts 133.3 62. 63 N/A
47 Amount of qualifying items referred to in Article 484 (5) and the related share premium accounts subject to phase out from T2 - 486 (4) N/A Public sector capital injections grandfathered until 1 January 2018 - 483 (4) N/A
48
Qualifying own funds instruments included in consolidated T2 capital (including minority interests and AT1 instruments not included in rows 5 and 34) issued by subsidiaries and held by third parties - 87, 88, 480 N/A
49 of which: instruments issued by subsidiaries subject to phase out - 486 (4) N/A
50 Credit risk adjustments - 62 (c) & (d) N/A
51 Tier 2 (T2) capital before regulatory adjustments 133.3 - N/A
Tier 2 (T2) capital: regulatory adjustments
52 Direct and indirect holdings by an institution of own T2 instruments and subordinated loans (negative amount) - 63 (b) (i), 66 (a), 67, 477 (2) N/A
53
Holdings of the T2 instruments and subordinated loans of financial sector entities where those entities have reciprocal cross holdings with the institution designed to inflate artificially the own funds of the institution (negative amount) - 66 (b), 68, 477 (3) N/A
54
Direct and indirect holdings by the institution of the T2 instruments and subordinated loans of financial sector entities where the institution does not have a significant investment in those entities (amount above 10% threshold and net of eligible short positions) (negative amount) - 66 (c), 69, 70, 79, 477 (4) N/A
54a Of which new holdings not subject to transitional arrangements - - N/A
54b Of which holdings existing before 1 January 2013 and subject to transitional arrangements - - N/A

26 BIL – Pillar 3 Report 2017
Own funds and capital adequacy
55
Direct and indirect synthetic holdings by the institution of the T2 instruments and subordinated loans of financial sector entities where the institution has a significant investment in those entities (net of eligible short positions) (negative amount) - 66 (d), 69, 79, 477 (4) N/A
56
Regulatory adjustments applied to Tier 2 in respect of amounts subject to pre-CRR treatment and transitional treatments subject to phase out as prescribed in Regulation (EU) No 575/2013 (i.e. CRR residual amounts) - - N/A
56a
Residual amounts deducted from Tier 2 capital with regard to deduction from Common Equity Tier 1 capital during the transitional period pursuant to article 472 of Regulation (EU) No 575/2013 -
472, 472(3)(a), 472 (4), 472 (6), 472 (8), 472 (9), 472 (10) (a), 472
(11) (a) N/A
of which items to be detailed line by line, e.g. material net interim losses, intangibles, shortfall of provisions to expected losses, etc - - N/A
56bResidual amounts deducted from Tier 2 capital with regard to deduction from Additional Tier 1 capital during the transitional period pursuant to article 475 of Regulation (EU) No 575/2013 -
475, 475 (2) (a), 475 (3), 475 (4) (a) N/A Of which items to be detailed line by line, e.g. reciprocal cross holdings in AT1 instruments, direct holdings of non-significant investments in the capital of other financial sector entities, etc - - N/A
56c Amount to be deducted from or added to Tier 2 capital with regard to additional filters and deductions required pre CRR
- 467, 468, 481 N/A
Of which: … possible filter for unrealised losses - 467 N/A
Of which: … possible filter for unrealised gains - 468 N/A
Of which:… - 481 N/A
57 Total regulatory adjustments to Tier 2 (T2) capital - - N/A
58 Tier 2 (T2) capital 133.3 - N/A
59 Total capital (TC=T1+T2) 1,094 - N/A
59a
Risk weighted assets in respect of amounts subject to pre-CRR treatment and transitional treatments subject to phase out as prescribed in Regulation (EU) No 575/2013 (i.e. CRR residual amounts) - - N/A
Of which:… items not deducted from CET1 (Regulation (EU) No 575/2013 residual amounts) (items to be detailed line by line, e.g. Deferred tax assets that rely on future profitability net of related tax liability, indirect holdings of own CET1, etc) -
472, 472 (5), 472 (8) (b), 472 (10) (b), 472 (11) (b) N/A
Of which:…items not deducted from AT1 items (Regulation (EU) No 575/2013 residual amounts) (items to be detailed line by line, e.g. Reciprocal cross holdings in T2 instruments, direct holdings of non-significant investments in the capital of other financial sector entities, etc.) -
475, 475 (2) (b), 475 (2) ©, 475 (4) (b) N/A
Items not deducted from T2 items (Regulation (EU) No 575/2013 residual amounts) (items to be detailed line by line, e.g. Indirect holdings of own T2 instruments, indirect holdings of non-significant investments in the capital of other financial sector entities, indirect holdings of significant investments in the capital of other financial sector entities etc) -
477, 477 (2) (b), 477 (2) (c), 477 (4) (b) N/A
60 Total risk weighted assets 6,639.6 - N/A
Capital ratios and buffers
61 Common Equity Tier 1 (as a percentage of risk exposure amount) 12.21% 92 (2) (a), 465 N/A
62 Tier 1 (as a percentage of risk exposure amount) 14.47% 92 (2) (b), 465 N/A
63 Total capital (as a percentage of risk exposure amount) 16.48% 92 (2) (c) N/A
64
Institution specific buffer requirement (CET1 requirement in accordance with article 92 (1) (a) plus capital conservation and countercyclical buffer requirements, plus systemic buffer, plus the systemically important institution buffer (G-SII or O-SII buffer), expressed as a percentage of risk exposure amount)
2.625% CRD 128, 129, 140
N/A
65 of which: capital conservation buffer requirement 2.50% - N/A
66 of which: countercyclical buffer requirement - - N/A
67 of which: systemic risk buffer requirement - - N/A

27BIL – Pillar 3 Report 2017
Own funds and capital adequacy
67a of which: Global Systemically Important Institution (G-SII) or Other Systemically Important Institution (O-SII) buffer 0.125% CRD 131 N/A
68 Common Equity Tier 1 available to meet buffers (as a percentage of risk exposure amount) 7.125% CRD 128 N/A
69 [non relevant in EU regulation] - - -
70 [non relevant in EU regulation] - - -
71 [non relevant in EU regulation] - - -
Amounts below the thresholds for deduction (before risk weighting)
72
Direct and indirect holdings of the capital of financial sector entities where the institution does not have a significant investment in those entities (amount below 10% threshold and net of eligible short positions) 3.1
36 (1) (h), 45, 46, 472 (10)56 (c), 59, 60, 475 (4), 66 (c), 69,
70, 477 (4) N/A
73
Direct and indirect holdings by the institution of the CET1 instruments of financial sector entities where the institution has a significant investment in those entities (amount below 10% threshold and net of eligible short positions) 13.8 36 (1) (i), 45, 48, 470, 472 (11) N/A
74 Empty set in the EU - - N/A
75Deferred tax assets arising from temporary differences (amount below 10% threshold, net of related tax liability where the conditions in Article 38 (3) are met) 0.0 36 (1) (c), 38, 48, 470, 472 (5) N/A
Applicable caps on the inclusion of provisions in Tier 2
76Credit risk adjustments included in Tier 2 in respect of exposures subject to standardised approach (prior to the application of the cap) - 62 N/A
77 Cap on inclusion of credit risk adjustments in T2 under standardized approach - 62 N/A
78Credit risk adjustments included in Tier 2 in respect of exposures subject to internal ratings-based approach (prior to the application of the cap) - 62 N/A
79 Cap on inclusion of credit risk adjustments in T2 under internal ratings-based approach
- 62 N/A
Capital instruments subject to phase-out arrangements (only applicable between 1 Jan 2013 and 1 Jan 2022)
80 Current cap on CET1 instruments subject to phase out arrangements
- 484 (3), 486 (2) & (5) N/A
81 Amount excluded from CET1 due to cap (excess over cap after redemptions and maturities)
- 484 (3), 486 (2) & (5) N/A
82 Current cap on AT1 instruments subject to phase out arrangements
- 484 (4), 486 (3) & (5) N/A
83 Amount excluded from AT1 due to cap (excess over cap after redemptions and maturities)
- 484 (4), 486 (3) & (5) N/A
84 Current cap on T2 instruments subject to phase out arrangements
- 484 (5), 486 (4) & (5) N/A
85 Amount excluded from T2 due to cap (excess over cap after redemptions and maturities)
- 484 (5), 486 (4) & (5) N/A
The capital instruments main features is detailed in the table below, in accordance with the Annex II of the Regulation (EU) No 1423/2013.

28 BIL – Pillar 3 Report 2017
Own funds and capital adequacy
1 Issuer Banque Internationale à Luxembourg SA
Banque Internationale à Luxembourg SA
Banque Internationale à Luxembourg SA
Banque Internationale à Luxembourg SA
2 Unique identifier XS1426144561 XS1502535351 XS1068770335 LU0006040975
3 Governing law(s) of the instrument Luxembourg Law Luxembourg Law Luxembourg Law Luxembourg Law
Regulatory treatment
4 Transitional CRR rules Tier2 Tier2 Additional Tier1 Common Equity Tier 1
5 Post-transitional CRR rules Tier2 Tier2 Additional Tier1 Common Equity Tier 1
6Eligible at solo/(sub-)consolidated/ solo&(sub-)consolidated
solo&(sub-) consolidated
solo&(sub-) consolidated
solo&(sub-) consolidated
solo&(sub-)consolidated
7 Instrument type (types to be specified by each jurisdiction)
Subordinated debt
Subordinated debt
Subordinated Contingent Convertible Debt
Ordinary shares
8Amount recognised in regulatory capital (Currency in million, as of most recent reporting date)
EUR 50 mio EUR 94.63 mio EUR 150 mio EUR 849.4 mio
9 Nominal amount of instrument EUR 50,000,000 USD 100,000,000 EUR 150,000,000 EUR 141,212,330
9a Issue price 100,00% 100,00% 100,00% N/A
9b Redemption price 100% 100% 100% N/A
10 Accounting classification Liability-amortized cost Liability-amortized cost Liability-amortized cost Shareholder's equity
11 Original date of issuance 08/06/2016 18/10/2016 30/06/2014 08/03/1856
12 Perpetual or dated Dated Dated Perpetual Perpetual
13 Original maturity date 08/06/2028 18/10/2028 No maturity N/A
14 Issuer call subject to prior supervisory approval No No Yes N/A
15Optional call date, contingent call dates and redemption amount
EUR 100,000 per Note of EUR 100,000 specified denomination for tax,
default and capital event calls
EUR 100,000 per Note of EUR 100,000 specified denomination for tax,
default and capital event calls
Tax, capital and regulatory event calls N/A
16 Subsequent call dates, if applicable
Not Applicable
Not Applicable
30/06/2020 and each anniversary
date thereafterN/A
Coupons / dividends
17 Fixed or floating dividend/coupon Fixed / Floating Fixed Fixed floating
18 Coupon rate and any related index
4 % per annum up to 8/06/2018 / euribor 6m+230 thereafter
5.01% per annum
6.625% (+ 0,375% per annum in line with the
increase of the CET1 trigger level)
N/A
19 Existence of a dividend stopper no no no no
20aFully discretionary, partially discretionary or mandatory (in terms of timing)
Mandatory Mandatory Mandatory Fully discretionary
20bFully discretionary, partially discretionary or mandatory (in terms of amount)
Mandatory Mandatory Mandatory Fully discretionary

29BIL – Pillar 3 Report 2017
Own funds and capital adequacy
21 Existence of step up or other incentive to redeem No No No N/A
22 Noncumulative or cumulative Non cumulative Non cumulative Non cumulative N/A
23 Convertible or non-convertible Non-convertible Non-convertible Convertible N/A
24 If convertible, conversion trigger(s) N/A N/A
CET1 <5.75% to 7% -trigger can be revised at
the Bank's discretion at any time
N/A
25 If convertible, fully or partially N/A N/A Fully N/A
26 If convertible, conversion rate N/A N/A 100% N/A
27 If convertible, mandatory or optional conversion N/A N/A mandatory N/A
28 If convertible, specify instrument type convertible into N/A N/A shares N/A
29 If convertible, specify issuer of instrument it converts into N/A N/A Banque Internationale
à Luxembourg SA N/A
30 Write-down features No No No N/A
31 If write-down, write-down trigger(s) N/A N/A N/A N/A
32 If write-down, full or partial N/A N/A N/A N/A
33 If write-down, permanent or temporary N/A N/A N/A N/A
34If temporary write-down, description of write-up mechanism
N/A N/A N/A N/A
35
Position in subordination hierarchy in liquidation (specify instrument type immediately senior to instrument)
Unsubordinated Debt Unsubordinated Debt Dated Subordinated DebtSubordinated
Contingent Convertible Debt
36 Non-compliant transitioned features No No No No
37 If yes, specify non-compliant features N/A N/A N/A N/A
In line with the CRD IV definition, the total amount of available distributable items amounts EUR 333 million as of December 31, 2017.

30 BIL – Pillar 3 Report 2017
Own funds and capital adequacy
2.1.3. Overview of RWAs
In accordance with Article 138 (c) to (f) in the CRR, the following table shows RWA and regulatory capital requirements broken down by risk types and model approaches compared to the previous year-end. The capital requirement amounts have been obtained by applying 8% to the corresponding weighted risks.
TABLE EU OV1 - OVERVIEW OF RWAS1
(in EUR million) RWAs Minimum capital
requirements
31 Dec 2017 31 Dec 2016 31 Dec 2017
1 Credit risk (excluding CCR) 5,613.16 4,828.81 449.05 Article 438(c)(d) 2 Of which the standardised approach 1,793.48 1,637.42 143.48 Article 438(c)(d) 3 Of which the foundation IRB (FIRB) approach - - - Article 438(c)(d) 4 Of which the advanced IRB (AIRB) approach 3,803.27 3,174.49 304.26
Article 438(d) 5 Of which equity IRB under the simple risk-weighted approach or the IMA
16.41
16.91
1.31
Article 107Article 438(c)(d)
6 CCR 77.69
71.35 6.22
Article 438(c)(d) 7 Of which mark to market 52.10 48.76 4.17 Article 438(c)(d) 8 Of which original exposure - - -
9 Of which the standardised approach - - - 10 Of which internal model method (IMM) - - -
Article 438(c)(d) 11 Of which risk exposure amount for contributions to the default fund of a CCP
- - -
Article 438(c)(d) 12 Of which CVA 25.59 22.59 2.05 Article 438(e) 13 Settlement risk - - - Article 449 (o)(i) 14 Securitisation exposures in the banking book
(after the cap)48 64.91
3.84
15 Of which IRB approach - - -
16 Of which IRB supervisory formula approach (SFA) - - - 17 Of which internal assessment approach (IAA) - - - 18 Of which the standardised approach 48 64.91 3.84
Article 438(e) 19 Market risk 69.75 55.10 5.58 20 Of which the standardised approach 69.75 55.10 5.58 21 Of which IMA - - -
Article 438(e) 22 Large exposures - - -
Article 438(f) 23 Operational risk 831 798.89 66.48 24 Of which basic indicator approach - - - 25 Of which standardised approach 831 798.89 66.48 26 Of which advanced measurement approach - - -
Article 437(2), Article 48 and Article 60
27 Amounts below the thresholds for deduction (subject to 250% risk weight)
- - -
Article 500 28 Floor adjustment - - - 29 TOTAL 6,639.60 5,819.07 531.17
1 Following an on-site JST (Joint Supervisory Team) review of the real estate promotion exposures which ended March 2018, the JST requests a change of some exposure classification which leads to an increase of credit-related RWA, which is currently estimated to approximately EUR 200 million to reach 6.8 B. This would reduce the CET1 ratio by around 35bps.

31BIL – Pillar 3 Report 2017
Own funds and capital adequacy
At the end of 2017, the Bank’s total RWAs amounted to 6.6 billion as of December 31, 2017, compared to 5.8 billion as of December 31, 2016. The overall increase of 820.5 million mainly reflects increases in credit risk RWA. This increase is explained by methodological changes (higher degree of conservativeness) and by the net production of new loans.
Both market and operational RWAs increased respectively of 14.6 million and 32.1 million in 2017. The increase in operational RWAs is explained by higher average revenues on the Commercial Banking and Trading & Sales activities of the Bank.
2.1.3.1. Weighted risks
Since January 1, 2008, the Bank has been compliant with the Basel framework – through its different evolutions – to calculate its capital requirements with respect to credit, market, operational and counterparty risk, and to publish its solvency ratios.
For credit risk, BIL group has decided to use the Advanced-Internal Rating Based (A-IRB) approach on its main counterparties (i.e. Sovereigns, Banks, Corporate, SMEs and Retail) for the assessment of its risk weighted assets (RWA). When it comes to Market Risk, the Bank has adopted the Standardised method; this choice is based on the Bank’s very moderate trading activity, whose sole purpose is to assist BIL’s customers by providing the best service relating to the purchase or sale of bonds, foreign currencies, equities and structured products. The Standardised method is also used for the calculation of the weighted operational risks of the Bank.
2.1.4 Specialised lending and equity exposures in the banking book
As of December 31, 2017, the Bank does not have exposures for specialised lending.
To comply with the last paragraph of Article 438, the following table shows risk-weighted exposure amounts in accordance with Article 155(2) regarding equity exposures using the simple risk-weighted approach.
TABLE EU CR10 - IRB (SPECIALISED LENDING AND EQUITIES)
(in EUR million) EQUITIES UNDER THE SIMPLE RISK-WEIGHTED APPROACH
Categories On-balance-sheet amount
Off-balance-sheet amount Risk weight Exposure
amount RWAs Capital requirements
Private equity exposures 3.26 - 190% 3.26 6.19 0.50 Exchange-traded equity exposures - - 290% - - - Other equity exposures 2.76 - 370% 2.76 10.22 0.82 TOTAL 6.02 - - 6.02 16.41 1.31
TOTAL RISK EXPOSURE AMOUNT 5,713.25
Institution specific countercyclical buffer rate 0.002%
Institution specific countercyclical buffer requirement 0.102
2.1.5 Countercyclical capital buffer disclosure template
In accordance with Article 440 (a) and (b) in the CRR, the following tables disclose the amount of the institution’s specific countercyclical buffer as well as the geographical distribution of credit exposures relevant for its calculation in the standard format as set out in Commission Delegated Regulation (EU) 2015/1555.
2.1.5.1 Institution-specific countercyclical capital buffer
The following table shows an overview of the Bank’s countercyclical exposure and buffer requirements (in eur million):

32 BIL – Pillar 3 Report 2017
Own funds and capital adequacy
2.1.5.2 Geographical distribution of credit exposures relevant for the calculation of the countercyclical capital buffer
The institution specific countercyclical buffer is the weighted average of the countercyclical capital buffers that apply in the jurisdictions where the Bank’s relevant credit exposures are located. As per December 31, 2017, the institution-specific countercyclical capital buffer was at 0.002 %.
Countercyclical capital buffer rates are determined by Basel Committee member jurisdictions. The “General credit exposures” exclude exposures to the public sector and to institutions.

33BIL – Pillar 3 Report 2017
Own funds and capital adequacyRO
WGe
nera
l cre
dit
expo
sure
sTr
adin
g bo
ok e
xpos
ures
Secu
ritis
atio
n ex
posu
res
Ow
n fu
nds
requ
irem
ents
Ow
n fu
nds
requ
irem
ents
w
eigh
ts
Coun
terc
yclic
al
capi
tal
buff
er r
ate
expo
sure
va
lue
SAex
posu
re
valu
e IR
B
Sum
o
f lo
ng
and
shor
t po
sitio
ns
for
SA
expo
sure
s
Expo
sure
fo
r in
tern
al
mod
els
expo
sure
v
alue
SA
of w
hich
: Ge
nera
l cr
edit
ex
posu
res
of w
hich
: Tr
adin
g bo
ok
expo
sure
s
of w
hich
: Se
curit
isat
ion
expo
sure
sTo
tal
010
020
030
040
050
070
080
090
100
110
120
010
Brea
kdow
n
by c
ount
ryAl
bani
a0,
020,
000,
000,
000,
000,
000%
Alge
ria1,
880,
000,
010,
000,
000,
010,
000%
Ando
rra
0,01
0,33
0,01
0,00
0,00
0,00
0,00
0,00
0%An
gola
0,08
0,00
0,00
0,00
0,00
0,00
0%An
guill
a0,
000,
000,
000,
000,
000%
Antig
ua A
nd
Barb
uda
0,0
0
0,
000,
000,
000,
000,
000%
Arge
ntin
a0,
120,
000,
000,
000,
000,
000,
000%
Arm
enia
0,00
0,00
0,00
0,00
0,00
0,00
0%Au
stra
lia0,
0826
,76
0,00
0,00
0,43
0,43
0,00
0%Au
stria
125,
326,
920,
000,
006,
920,
020%
Azer
baija
n0,
030,
000,
000,
000,
000,
000%
Baha
mas
0,2
5 0
,00
0,01
0,00
0,00
0,01
0,00
0%Ba
hrai
n
2
,06
0,07
0,00
0,00
0,07
0,00
0%Be
laru
s 0
,07
0,00
0,00
0,00
0,00
0,00
0%Be
lgiu
m 5
,35
419
,94
0,6
5 0
,44
10,6
50,
000,
0110
,66
0,03
0%Be
lize
0,1
8 0,
010,
000,
000,
010,
000%
Berm
uda
0,0
0 0
,12
0,00
0,01
0,00
0,01
0,00
0%Bo
livia
0,0
1 0,
000,
000,
000,
000,
000%
Bosn
ia A
nd
Her
zego
vina
0,0
6 0,
000,
000,
000,
000,
000%
Braz
il 0
,16
0,1
0 0,
020,
000,
000,
020,
000%
Bulg
aria
0,2
9 0
,76
0,0
0 0,
020,
000,
000,
020,
000%
Buru
ndi
0,0
0 0,
000,
000,
000,
000,
000%
Cam
bodi
a 0
,05
0,00
0,00
0,00
0,00
0,00
0%Ca
mer
oon
0,0
2 0,
000,
000,
000,
000,
000%
Cana
da 0
,03
16,
40
0,0
0 2,
780,
000,
002,
780,
010%
Cape
Ver
de 0
,03
0,00
0,00
0,00
0,00
0,00
0%Ca
yman
Isla
nds
17,
80
25,
36
1,59
0,00
0,00
1,59
0,00
0%Ch
ile
0
,05
0,00
0,00
0,00
0,00
0,00
0%Ch
ina
10,
04
0,11
0,00
0,00
0,11
0,00
0%Co
lom
bia
0,0
2 0
,00
0,00
0,00
0,00
0,00
0,00
0%Co
ngo
0,0
0 0,
000,
000,
000,
000,
000%
Cong
o,
Dem
ocra
tic
Repu
blic
0,0
7 0
,00
0,00
0,00
0,00
0,00
0,00
0%

34 BIL – Pillar 3 Report 2017
Own funds and capital adequacyCo
sta
Rica
0,0
4 0,
000,
000,
000,
000,
000%
Côte
D'Iv
oire
0,0
4 0,
000,
000,
000,
000,
000%
Croa
tia 0
,03
0,00
0,00
0,00
0,00
0,00
0%Cu
ba 0
,00
0,00
0,00
0,00
0,00
0,00
0%Cu
raça
o 0
,00
0,1
9 0,
000,
000,
000,
000,
000%
Cypr
us 1
1,41
0
,39
0,0
3 0
,13
0,92
0,00
0,00
0,92
0,00
0%Cz
ech
Repu
blic
0,2
9 0,
000,
000,
000,
000,
000%
Denm
ark
6,4
3 2
23,11
0
,06
3,85
0,00
0,00
3,85
0,01
0%Do
min
ica
0,0
0 0,
000,
000,
000,
000,
000%
Dom
inic
an
Repu
blic
0,0
6 0,
000,
000,
000,
000,
000%
Ecua
dor
0,0
0 0,
000,
000,
000,
000,
000%
Egyp
t 0
,00
0,1
5 0,
000,
000,
000,
000,
000%
Eritr
ea
0,0
1 0,
000,
000,
000,
000,
000%
Esto
nia
0,0
0 0
,87
0,01
0,00
0,00
0,01
0,00
0%Et
hiop
ia 0
,00
0,00
0,00
0,00
0,00
0,00
0%Fi
nlan
d 8
,14
1,4
3 0,
000,
000,
020,
030,
000%
Fran
ce
(Incl
udin
g Do
m-T
om)
18,
14
1.1
92,2
4
0,3
3 8
6,76
45
,49
0,01
1,39
46,8
90,
120%
Gab
on 0
,00
0,00
0,00
0,00
0,00
0,00
0%G
ambi
a 0
,00
0,00
0,00
0,00
0,00
0,00
0%G
eorg
ia 0
,01
0,00
0,00
0,00
0,00
0,00
0%G
erm
any
190
,33
376
,18
0,0
8 0
,05
36,
45
29,0
80,
010,
5829
,67
0,07
0%G
hana
0,0
0 0,
000,
000,
000,
000,
000%
Gib
ralta
r 4
,55
0,2
9 0
,10
0,37
0,00
0,00
0,37
0,00
0%G
reec
e 0
,00
1,2
6 0
,00
0,00
0,00
0,00
0,00
0,00
0%G
rena
da
0,00
0,00
0,00
0,00
0,00
0%G
uern
esey
0,0
8 1
6,28
0,
190,
000,
000,
190,
000%
Gui
nea
0,0
9 0,
000,
000,
000,
000,
000%
Gui
nea-
Biss
au 0
,00
0,00
0,00
0,00
0,00
0,00
0%H
ong
Kong
0,0
1 1
,96
0,0
1 0,
010,
000,
000,
010,
001,
25%
Hun
gary
0,1
8 0
,06
0,00
0,00
0,00
0,00
0,00
0%Ic
elan
d 0
,03
0,00
0,00
0,00
0,00
0,00
0%In
dia
0,0
4 0,
000,
000,
000,
000,
000%
Indo
nesi
a 0
,01
0,0
0 0,
000,
000,
000,
000,
000%
Iran,
Isla
mic
Re
publ
ic O
f 0
,03
0,00
0,00
0,00
0,00
0,00
0%Ira
q 0
,00
0,00
0,00
0,00
0,00
0,00
0%Ire
land
30,0
421
6,08
24,9
260
,92
0,00
4,98
65,9
00,
010%
Isle
Of M
an 0
,00
0,11
0,
000,
000,
000,
000,
000%
Isra
el 1
,67
0,00
0,00
0,00
0,00
0,00
0%Ita
ly 0
,02
16,
72
0,0
1 1
4,01
0,
290,
000,
220,
510,
000%
Japa
n 4
,49
0,22
0,00
0,00
0,22
0,00
0%Je
rsey
0,0
4 2
,13
0,04
0,00
0,00
0,04
0,00
0%Jo
rdan
0,0
0 0,
000,
000,
000,
000,
000%

35BIL – Pillar 3 Report 2017
Own funds and capital adequacyKa
zaks
tan
0,0
5 0,
000,
000,
000,
000,
000%
Keny
a 0
,22
0,00
0,00
0,00
0,00
0,00
0%Ko
rea,
Rep
ublic
Of
0,0
1 0
,73
0,00
0,00
0,01
0,01
0,00
0%
Kuw
ait
0,0
0 0,
000,
000,
000,
000,
000%
Kyrg
yzst
an 0
,00
0,00
0,00
0,00
0,00
0,00
0%La
tvia
0,1
9 0,
000,
000,
000,
000,
000%
Leba
non
0,0
0 0
,07
0,00
0,00
0,00
0,00
0,00
0%Li
beria
0,00
0,00
0,00
0,00
0,00
0%
Liby
an A
rab
Jam
ahiri
ya 3
,90
0,0
3 0,
310,
000,
000,
310,
000%
Liec
hten
stei
n 6
,23
5,3
4 0
,00
0,75
0,00
0,00
0,75
0,00
0%
Lith
uani
a 0
,05
0,00
0,00
0,00
0,00
0,00
0%Lu
xem
bour
g 1
.422
,21
9.4
03,5
9 2
,53
9,1
0 7
,52
253,
071,
160,
1225
4,35
0,64
0%M
acau
0,0
0 0,
000,
000,
000,
000,
000%
Mac
edon
ia,
Form
er
Yugo
slav
Rep
. 0
,00
0,00
0,00
0,00
0,00
0,00
0%M
adag
asca
r 0
,02
0,0
0 0,
000,
000,
000,
000,
000%
Mal
aysi
a 0
,00
0,0
4 0,
000,
000,
000,
000,
000%
Mal
i 0
,00
0,00
0,00
0,00
0,00
0,00
0%M
alta
8,3
3 0
,75
0,67
0,00
0,00
0,67
0,00
0%M
arsh
all
Isla
nds
0,5
1 0,
000,
000,
000,
000,
000%
Mau
ritiu
s 0
,09
0,0
0 0,
000,
000,
000,
000,
000%
Mex
ico
0,0
0 0
,05
0,0
8 0,
000,
000,
000,
000,
000%
Mol
dova
, Re
publ
ic O
f 0
,01
0,00
0,00
0,00
0,00
0,00
0%M
onac
o 1
41,9
9 1,
900,
000,
001,
900,
000%
Mon
tene
gro
0,0
5 0,
000,
000,
000,
000,
000%
Mor
occo
0,6
4 0
,00
0,05
0,00
0,00
0,05
0,00
0%M
ozam
biqu
e 0
,00
0,00
0,00
0,00
0,00
0,00
0%N
amib
ia 0
,02
0,00
0,00
0,00
0,00
0,00
0%N
epal
0,0
0 0,
000,
000,
000,
000,
000%
Net
herla
nds
55,
49
77,
03
0,0
1 4
,64
7,52
0,00
0,07
7,60
0,02
0%N
ew Z
eala
nd 3
6,68
0,
500,
000,
000,
500,
000%
Nig
eria
0,0
2 0,
000,
000,
000,
000,
000%
Nor
way
0,0
0 3
,18
0,4
4 1
,89
5,7
1 0,
030,
070,
090,
200,
002%
Oman
0,0
4 0,
000,
000,
000,
000,
000%
Othe
r 6
2,70
0
,07
0,0
0 1,
620,
000,
001,
620,
000%
Paki
stan
0,1
9 0,
000,
000,
000,
000,
000%
Pana
ma
0,0
0 1
0,38
0,
600,
000,
000,
600,
000%
Para
guay
0,2
1 0,
000,
000,
000,
000,
000%
Peru
0,0
1 0,
000,
000,
000,
000,
000%
Phili
ppin
es 0
,01
0,00
0,00
0,00
0,00
0,00
0%Po
land
3,2
3 0,
020,
000,
000,
020,
000%
Port
ugal
7,6
4 0,
150,
000,
000,
150,
000%
Qata
r 1
67,5
1 2,
800,
000,
002,
800,
010%

36 BIL – Pillar 3 Report 2017
Own funds and capital adequacyRo
man
ia 1
,40
0,02
0,00
0,00
0,02
0,00
0%Ru
ssia
n Fe
dera
tion
8,5
8 0
,00
0,11
0,00
0,00
0,11
0,00
0%
Rwan
da 0
,01
0,00
0,00
0,00
0,00
0,00
0%Sa
int K
itts
And
Nev
is 0
,00
0,0
1 0,
000,
000,
000,
000,
000%
Sain
t Luc
ia 0
,02
0,00
0,00
0,00
0,00
0,00
0%Sa
int V
ince
nt
And
The
Gre
nadi
nes
0,0
0 0,
000,
000,
000,
000,
000%
San
Mar
ino
0,00
0,00
0,00
0,00
0,00
0%
Saud
i Ara
bia
0,4
5 0
,00
0,00
0,00
0,00
0,00
0,00
0%Se
nega
l 0
,05
0,0
0 0,
000,
000,
000,
000,
000%
Serb
ia 0
,04
0,00
0,00
0,00
0,00
0,00
0%Se
yche
lles
0,0
2 0,
000,
000,
000,
000,
000%
Sier
ra L
eone
0,0
0 0,
000,
000,
000,
000,
000%
Sing
apor
e 3
,51
0,03
0,00
0,00
0,03
0,00
0%Sl
ovak
ia 1
,55
0,0
0 0,
010,
000,
000,
010,
000%
Slov
enia
0,3
4 0,
000,
000,
000,
000,
000%
Sout
h Af
rica
1,2
1 0,
010,
000,
000,
010,
000%
Spai
n 2
3,92
0
,01
42,
71
0,74
0,00
0,68
1,43
0,00
0%Sr
i Lan
ka 0
,00
0,00
0,00
0,00
0,00
0,00
0%Sw
eden
9,9
3 0
,02
0,1
5 0,
150,
000,
000,
160,
002%
Switz
erla
nd 2
7,60
2
61,0
5 0
,03
7,68
0,00
0,00
7,68
0,02
0%Sy
rian
Arab
Re
publ
ic 0
,01
0,00
0,00
0,00
0,00
0,00
0%Ta
iwan
0,0
1 0
,00
0,00
0,00
0,00
0,00
0,00
0%Th
aila
nd 0
,40
0,0
4 0,
070,
000,
000,
070,
000%
Togo
0,0
0 0,
000,
000,
000,
000,
000%
Tuni
sia
1,1
5 0,
080,
000,
000,
080,
000%
Turk
ey 0
,91
1,9
3 0,
450,
000,
000,
450,
000%
Uga
nda
0,0
0 0,
000,
000,
000,
000,
000%
Ukr
aine
5,0
8 0,
020,
000,
000,
020,
000%
Uni
ted
Arab
Em
irate
s 2
,55
71,
85
0,8
2 1,
120,
060,
001,
180,
000%
Uni
ted
King
dom
(Not
N
orm
.Isd/
Man
) 2
2,64
1
14,5
0 2
0,90
6
,29
3,33
0,18
0,10
3,61
0,01
0%U
nite
d St
ates
3,7
5 1
3,47
1,
390,
000,
001,
390,
000%
Uru
guay
0,2
1 0,
000,
000,
000,
000,
000%
Uzb
ekis
tan
0,0
2 0,
000,
000,
000,
000,
000%
Vene
zuel
a 0
,26
0,0
0 0,
000,
000,
000,
000,
000%
Viet
Nam
0,0
8 0,
000,
000,
000,
000,
000%
Virg
in Is
land
s, Br
itish
5,0
8 3
1,64
4
,91
1,83
0,01
0,00
1,84
0,00
0%
020
TOTA
L 1
.883
,33
12.9
33,6
1 3
,22
39,
36
239
,99
392
,68
1,5
2 3
,84
398,
04
1,00

37BIL – Pillar 3 Report 2017
Own funds and capital adequacy
2.2. Leverage ratio The leverage ratio (LR) is introduced by the Basel Committee to serve as a simple, transparent and non-risk-based ratio to complete the existing risk-based capital requirements.
The Basel III leverage ratio is defined as the capital measure (the numerator) divided by the exposure measure (the denominator), with this ratio expressed as a percentage and having to exceed a minimum of 3%.
While the capital measure for the leverage ratio is the Tier 1 capital taking account transitional arrangements, the total exposure measure corresponds to the sum of the following exposures: (a) on-balance sheet exposures; (b) derivative exposures; (c) securities financing transaction (SFT) exposures; and (d) off-balance sheet (OBS) items.
As at December 2017, BIL group’s leverage ratio amounted to 3.89%, showing an increase compared to year-end 2016 level of 3.78%. This comfortable level is explained by the Bank’s limited use of derivatives and securities financing transactions. The composition of BIL group’s exposure reflects its business model, based on a commercial orientation.
The evolution of this ratio compared to year-end 2016 can be explained as follows:• On one hand, by the increase of the numerator: increase of
T1 capital (i.e. increase of CET1 capital);
• On the other hand, by the increase of the total leverage ratio exposure (denominator) explained by the structural increase of the Bank’s assets: main changes are the significant decrease of loans and securities available for sale compensated by the increases of (i) securities held to maturity, (ii) loans and advances to customers and (iii) cash and balances with central banks.
The Bank takes into account the leverage ratio in its capital and financial planning to ensure that its forecasted commercial growth is consistent with this requirement. The Bank also actively manages its balance sheet size through its Treasury and ALM desks by limiting interbank operations (unsecured or secured) that could deteriorate its leverage ratio. The leverage ratio is discussed on a regular basis at top management level as it is part of the Bank’s Risk Appetite framework (with an early trigger above the minimum requirement).
With regards to disclosure of the leverage ratio for institutions, the Official Journal of European Union published on February 15, 2016 the Commission implementing regulation EU 2016/200.
In this regard, the leverage ratio disclosures templates are made pursuant to this publication.

38 BIL – Pillar 3 Report 2017
Own funds and capital adequacy
AMOUNTS IN EUR MILLION1 Total assets as per published financial statements 23,750.29
2 Adjustment for entities which are consolidated for accounting purposes but are outside the scope of regulatory consolidation 0.00
3(Adjustment for fiduciary assets recognised on the balance sheet pursuant to the applicable accounting framework but excluded from the leverage ratio exposure measure in accordance with Article 429(13) of Regulation (EU) No 575/2013 "CRR")
-6.52
4 Adjustments for derivative financial instruments 59.385 Adjustments for securities financing transactions "SFTs" 0.00
6 Adjustment for off-balance sheet items (ie conversion to credit equivalent amounts of off-balance sheet exposures) 1,287.44
7 Other adjustments -398.518 TOTAL LEVERAGE RATIO EXPOSURE 24,692.08
SUMMARY RECONCILIATION OF ACCOUNTING ASSETS AND LEVERAGE RATIO EXPOSURES:
LEVERAGE RATIO COMMON DISCLOSUREAmounts in EUR million
On-balance sheet exposures (excluding derivatives and SFTs)1 On-balance sheet items (excluding derivatives, SFTs and fiduciary assets, but including collateral) 23,531.76
2 (Asset amounts deducted in determining Tier 1 capital) -413.46
3 TOTAL ON-BALANCE SHEET EXPOSURES (EXCLUDING DERIVATIVES, SFTS AND FIDUCIARY ASSETS) (SUM OF LINES 1 AND 2) 23,118.30
Derivative exposures4 Replacement cost associated with all derivatives transactions (ie net of eligible cash variation margin) 135.07
5 Add-on amounts for PFE associated with all derivatives transactions (mark-to-market method) 149.05
EU-5a Exposure determined under Original Exposure Method
6Gross-up for derivatives collateral provided where deducted from the balance sheet assets pursuant to the applicable accounting framework
7 (Deductions of receivables assets for cash variation margin provided in derivatives transactions)
8 (Exempted CCP leg of client-cleared trade exposures)
9 Adjusted effective notional amount of written credit derivatives
10 (Adjusted effective notional offsets and add-on deductions for written credit derivatives)
11 TOTAL DERIVATIVE EXPOSURES (SUM OF LINES 4 TO 10) 284.12Securities financing transaction exposures12 Gross SFT assets (with no recognition of netting), after adjusting for sales accounting transactions 0
13 (Netted amounts of cash payables and cash receivables of gross SFT assets)
14 Counterparty credit risk exposure for SFT assets 0
EU-14aDerogation for SFTs: Counterparty credit risk exposure in accordance with Article 429b (4) and 222 of Regulation (EU) No 575/2013
15 Agent transaction exposures
EU-15a (Exempted CCP leg of client-cleared SFT exposure)
16 TOTAL SECURITIES FINANCING TRANSACTION EXPOSURES (SUM OF LINES 12 TO 15A) 0Other off-balance sheet exposures17 Off-balance sheet exposures at gross notional amount 1,287.44
18 (Adjustments for conversion to credit equivalent amounts)
19 OTHER OFF-BALANCE SHEET EXPOSURES (SUM OF LINES 17 TO 18) 1,287.44Capital and total exposures20 Tier 1 capital 960,60
21 TOTAL LEVERAGE RATIO EXPOSURES (SUM OF LINES 3, 11, 16, 19, EU-19A AND EU-19B) 24,689.86Leverage ratio22 Leverage ratio 3.89%
Choice on transitional arrangements and amount of derecognised fiduciary itemsEU-23 Choice on transitional arrangements for the definition of the capital measure Transitional
EU-24 Amount of derecognised fiduciary items in accordance with Article 429(11) of Regulation (EU) NO 575/2013

39BIL – Pillar 3 Report 2017
Own funds and capital adequacy
SPLIT-UP OF ON BALANCE SHEET EXPOSURES (EXCLUDING DERIVATIVES, SFTS AND EXEMPTED EXPOSURES):
Amounts in EUR million
EU-1 Total on-balance sheet exposures (excluding derivatives, SFTs, and exempted exposures), of which: 23,531.76
EU-2 Trading book exposures 38.03
EU-3 Banking book exposures, of which: 23,493.73
EU-4 Covered bonds 0.00
EU-5 Exposures treated as sovereigns 7,247.04
EU-6 Exposures to regional governments, MDB, international organisations and PSE NOT treated as sovereigns 464.14
EU-7 Institutions 1,693.95
EU-8 Secured by mortgages of immovable properties 6,664.40
EU-9 Retail exposures 2,655.29
EU-10 Corporate 3,590.10
EU-11 Exposures in default 443.69
EU-12 Other exposures (eg equity, securitisations, and other non-credit obligation assets) 735.12
2.3. Internal capital adequacy Assessment Process (Pillar II)
2.3.1. ICAAP Framework
2.3.1.1. Definition of the ICAAP
Article 73 of Directive 2013/36/EU defines the ICAAP as a set of “[…] sound, effective and comprehensive strategies and processes to assess and maintain on an ongoing basis the amounts, types and distribution of internal capital that they consider adequate to cover the nature and level of the risks to which they are or might be exposed”.
ICAAP is an internal instrument, which shall allow BIL group to hold the internal capital it deems appropriate in order to cover all the risks to which it is or could be exposed as a result of its Business Model and Strategy Plan, this being framed by its Risk Appetite and its risk bearing capacity.
The ICAAP report identifies and quantifies all the risks to which the consolidated entity (i.e. BIL, its subsidiaries and branches) is or could be exposed, according to its business model and strategy, as well as the economic and regulatory environment under which the Bank operates or could come to operate to maintain adequate capital to back them. This capital must be of sufficient quantity and quality to absorb losses that may arise with certain probability and frequency. The ICAAP shall therefore not only take into account the current situation of the Bank but shall definitively be forward-looking in order to ensure the internal capital adequacy on an ongoing basis.
In order to achieve this objective, ICAAP is anchored within BIL group’s decision-making processes, its business and risk strategies and its risk management and control processes. This requires the ICAAP to be, amongst others things, an integral part of BIL’s limit systems and internal reporting frameworks, especially due to the fact that it is a system of forward-looking strategies and processes.
2.3.1.2. Purpose of the ICAAP
The main purpose of the ICAAP is, for the Board of Directors, to proactively make a strategic assessment of its capital (and liquidity situation as these notions are clearly nested ) requirements and adequacy considering its strategies, the Bank’s business model and current situation. Further, the ICAAP also establishes the capital required for economic purposes and helps identifying its planned sources of capital to meet these objectives.
One of the benefits of the ICAAP includes greater corporate governance and improved risk assessment within banks, and thereby increases the stability of the overall financial system. It also helps to maintain capital levels in accordance with the Bank’s strategy, risk profile, governance structures and internal risk management systems.
Another important purpose of the ICAAP is, for senior Management, to inform the Board of Directors on the on-going assessment of the Bank’s risk profile, Risk Appetite, Strategic Model and Capital Adequacy. It also includes the documentation as to how the Bank intends to manage these risks, and how much current and future capital is necessary to meet its future plan.

40 BIL – Pillar 3 Report 2017
Own funds and capital adequacy
2.3.1.3. ICAAP Components
BIL group’s ICAAP is based on the following building blocks:• Risk appetite framework (RAF);• Risk Identification and Cartography;• Capital Structure Analysis;• Risk Assessment;• Capital Adequacy process;• Stress Testing; and• Business Integration.
Risk appetite framework (RAF)
a. ProcessWhile defining the Bank’s strategic priorities, its appeared necessary to think about the changes the related initiatives will have on the institution’s customer and risk profile, risk bearing capacity as thus the (new) boundaries of its Risk Appetite.
b. DefinitionIn line with the principles developed in the FSB guideline (“Principles for An Effective Risk Appetite Framework, November 2013”), BIL’s Risk Appetite Statement (RAS) designs in written form the aggregate level and types of risks that BIL is willing to accept, or to avoid, in order to achieve its business model and strategic objectives. It includes qualitative statements as well as quantitative measures expressed relative to different axes (e.g. solvency, earnings, liquidity). It should also address more difficult to quantify risks such as reputation and operational risk etc.
RAS provides BIL with an objective and measurable view of whether or not the Bank lays within its risk appetite boundaries related to the overall strategic objectives and the key current and future risks applicable to the Bank.
Amongst other features, BIL’s RAS (i) Is easy to communicate, (ii) Is directly linked to the financial institution’s strategy, (iii) Addresses the material risks in a holistic fashion under both normal and stressed market and macroeconomic conditions, (iv) Sets clear boundaries and expectations by establishing quantitative limits in order to determine for each material risk, and overall, the maximum level the Bank is willing to accept and finally, (v) Sets the overall tone for the approach to risk taking.
c. GovernanceAmongst its missions, the Board of Directors (BoD) is responsible for setting and overseeing the overall business strategy, the overall risk strategy and policy including the risk tolerance/appetite and the risk management framework. Under the framework set by the RAS, the BoD:• Approves BIL’s Risk Appetite Statement and ensures it
remains consistent with the short and medium term strategy, business and capital plans, risk capacity as well as compensation programs;
• Holds the CEO and other Senior Management accountable for the integrity of the risk appetite, including the timely identification, management and escalation of breaches in risk limits and of material risk exposures;
• Includes an assessment of risk appetite in its strategic discussions including decisions regarding mergers, acquisitions, growth in business lines or products, budget forecasting etc.;
• Regularly reviews and monitors the actual risk profile and risk limits against the agreed levels, and discusses and monitors them to ensure appropriate action is taken regarding “breaches” in risk limits (e.g. there are mechanisms in place to ensure Senior Management can act in a timely manner to effectively manage, and where necessary mitigate, material adverse risk exposures, in particular those that are close to or exceed the approved risk appetite statement or risk limits).
The BoD can be helped in these different tasks by dedicated Committees. One of these Committees is the Board Risk Committee (BRC):• The BRC is responsible for proposing to the BoD BIL’s group
risk policy. This Committee also ensures that BIL’s activities are consistent with its risk profile defined in the Risk Appetite Statement while establishing global limits for the Bank’s main risk exposures;
• Moreover, and among its roles, the BRC reviews and recommends changes to BIL group’s Risk Management framework and the global risk limits, included in the Risk Appetite Statement, to the BoD.
These previously mentioned principles concerning the Risk Appetite Statement are notably translated in the escalation procedure:• Where it is applicable within the Risk Appetite Statement,
a traffic light approach – based on Triggers and Limits – is adopted building on different levels of the chosen key metrics;
• Whilst Limits constitute boundaries requiring immediate escalation to the Board of Directors, BIL has also implemented a complementary escalation mechanism for the breach of the Trigger indicators in order to ensure that appropriate actions are taken timely;

41BIL – Pillar 3 Report 2017
Own funds and capital adequacy
• Moreover, all changes impacting materially the chosen key metrics between two consecutive periods are discussed and analysed by the Management Board, within the BRC and finally reported to the BoD.
d. 2017 Risk Appetite Statement evolutionA continuous reviewing of the BIL’s Risk Appetite framework has been realised in 2017 in line with the definition of the BIL2020 Reloaded Strategy. BIL2020 does not change in an important way the risk profile of the Bank, it represents more an evolution than a revolution. The statements made for the 5 pillars remain valid and achievable: • Capital Adequacy: Within the set-up of the different
priorities defined for each business line, maintain sufficient capital to support the Bank’s risk profile, in both normal and crisis periods, and to ensure maintenance of a long term A- credit rating;
• Earnings stability: Generate a sustainable return on capital above the Bank’s cost of capital together with achieving the Bank’s strategy targets (including dividend payment);
• Liquidity: Maintain a strong liquidity position allowing the Bank to deploy the different aspects of its strategy (e.g. growth of focused Wealth & Investment Management segments, investing in new sectors etc.);
• Reputation: Maintain a strong reputation in targeted markets through focusing on relevant and innovative financial services which allow to achieve excellence and fair, dedicated value propositions;
• Operational Effectiveness: Focus on operational efficiency through (i) Encompassing collaborative behaviours and breaking “silo-thinking”, (ii) Achieving service level optimisation and (iii) Improving the current set-up.
e. 2017 Risk Appetite Statement situationBIL group’s updated Risk Appetite Framework includes, as described above, indicators to fit with the Bank’s risk profile and comply with new regulatory requirements. The table below shows an extract of the main solvency, profitability and liquidity indicators and their evolutions between the year-end 2016 and 2017 (We shall mention that the internal limits mentioned are valid for 2018):
Risk Appetite figures as of December 31, 2017 attest of the sound situation of BIL group according to solvency and liquidity axes. No limit breach is observed.
Risk identification and cartography
According to Circular CSSF 07/301 (as amended), the Bank shall, “to determine its internal capital requirements for risks, […] first identify the risks to which it is exposed. The permanent and total internal capital adequacy requires this identification to refer to all the risks to which the institution is or might be exposed. This is the comprehensive nature of the ICAAP.”
BIL group’s risk cartography aims at fulfilling this principle. As a natural step of the ICAAP, the risk cartography to be established must be (i) Exhaustive, (ii) Cover the risks to which the Bank is or might be exposed, and (iii) Be forward-looking in order to take into account the future developments which may affect its internal capital adequacy and risk management framework.
The risk identification cycle conducted internally is based on a four steps process comprising:• The establishment/update of a risk glossary;• The identification of the Bank’s risks in accordance with this
glossary; • The assessment of the identified risks materiality;• The formalisation of the Bank’s risk cartography.
Category Indicators 12/2016 12/2017 Internal limit
Capital
Basel III CET1 12.98% 12.21% 10.90%
Basel III Total Capital ratio 18.04% 16.48% 14.40%
Leverage ratio 3.78% 3.89% 3.30%
LiquidityLCR 140% 131% 110%NSFR 114% 109% 100%
RiskCartography
RiskGlossary
RiskAssessment
RiskIdentification

42 BIL – Pillar 3 Report 2017
Own funds and capital adequacy
Risk Glossary
The risk glossary is an exhaustive list of risks the Bank is or might be exposed to as a consequence of its activities and overall environment. This list summarizes the definitions commonly agreed at the Bank’s level and is strongly inspired by the regulatory references (e.g. CRR, CRD IV) and the common admitted market practices.
BIL group’s risk glossary is based on four main categories (i.e. Credit Risks, Market and ALM Risks, Operational and Outsourcing Risks, Enterprise Risks) detailed hereafter:
Credit Risks
Solvency RiskCountry RiskCredit Spread RiskSecuritisation RiskResidual/recovery RiskSettlement RiskConcentration RiskCounterparty Risk
Operational Risks
Unauthorised activity and Internal fraud RiskExternal fraud RiskEmployment practices and workplace safety RiskClients, products and business practices RiskDamage to assets RiskBusiness disruption and systems failures RiskOutsourcing RiskExecution, delivery and process management RiskConduct RiskCyber Security Risk
Market & ALM Risks
Interest rate RiskPrice RiskCurrency RiskCommodity RiskInflation RiskLiquidity RiskFunding RiskBasis RiskBehavioural Risk
Entreprise Risks
Business RiskStrategic RiskPension RiskModel RiskHuman resources and Remuneration RisksLegal and Compliance RisksReputation RiskSocial and Environmental Risk
Risk Identification
The second step of the cartography process consists in identifying the main risks the Bank is or might be exposed to according to its current and planned activities and the expected evolution of its business environment. According to this, specific analyses are then internally conducted and aim at answering the following question: For a given risk type, are the Bank, its business lines and entities subject to that risk?
The core elements that form the basis of the risk identification process are summarised hereafter:• Current Risk processes developed specifically for the ICAAP
purpose. Those processes ensure that the Bank has an up-to-date view of its risks: (i) The Bank’s previous aggregated risk cartography, (ii) The Outcome of the previous ICAAP, (iii) The detailed ECAP map, detailing for each entity and business line the Economic Capital requirements identified for each risk type and updated on a quarterly basis;
• Moreover, the Risk Cartography uses also the other on-going follow-up of the Bank’s activities realised by the different departments of the Risk Management units and formalised, amongst others, through the various risk reports (e.g. Market Risk reports and Credit Risk reports), the complementary assessments realised by the internal control functions (i.e. Internal Audit Cartography, Compliance report, Risk Control Self-Assessment (RCSA) etc.), and the Financial Planning assumptions and results;
• More globally, the Risk Cartography is based on the risk identification implied by the Bank’s Strategy and Business Model (BIL2020 Reloaded);
• Findings and issues highlighted by the regulators through their supervisory exercises (e.g. Comprehensive Assessment and SREP) and views on the evolution of the Bank’s environments (e.g. legal, regulatory, market and political expectations) allows for the objectification of the risk identification;
• Finally, the outcomes of different regulatory or internal Stress Testing exercises (EU-Wide, Regulatory IRRBB, EIOPA, ICAAP/ILAAP, Credit Risk Pillar I, Recovery, Market Risk, Internal IRRBB, etc.).

43BIL – Pillar 3 Report 2017
Own funds and capital adequacy
Risk Assessment
The materiality of each identified risk is based on its nature, in light of the Bank’s activities, and the overall impact its materialisation has or could have on BIL group’s viability.
The overall risk assessment is based on the effective materiality and the mitigation techniques the Bank has put in place in order to prevent its occurrence or reduce its impacts.
Depending on its materiality and its nature, the risk identified will then be covered by economic capital, when deemed necessary, or apprehended through the establishment of
dedicated internal governance, process and procedures.
Whenever risks could strongly affect the achievement of the Bank’s business objectives, reputation, create liquidity pressure, impact capital and/or revenues or lead to regulatory compliance issues, they are considered as material.
A severity level (i.e. High, Significant, Medium, Low and Immaterial) is finally applied to each risk identified allowing thus to draw BIL group’s risk cartography.
Risk Cartography
The 2017 Cartography process has led to the following Risk Radar:
Note (1) : Pension risk is assessed, then rebalanced through Credit isk, Price risk and Interest rate risk.Non material Risk Low RiskMedium Risk Significant RiskNote (2) : The Center of the Risk radar would be assigned to High Risk
Settlement
Securitisation
Country
Inflation
Commodity
Basis
Damage
to assetsSocial &
Environmental
Employment practices & workplace safety
Unauthorised activity and internal fraud
Conduct Risk
Clients, products and business practices
External fraud
Cyber, Security Risk
Business disruption & systems failures
Execution, delivery and process mgt
Behavioral
Funding
Liquidity
PriceInterest rate
Spread
Solvency
Concentration
Reputation
Model Business
Legal & Compliance
HR
Outsourcing
CurrencyCounterparty
Residual / Recovery
Cred
it
Risk
Market & ALM Risk
Operational Risk
Enter
prise
Risk

44 BIL – Pillar 3 Report 2017
Own funds and capital adequacy
Risk assessment
The risk assessment process carried out by the Bank is performed in coherence with the Risk identification and cartography process. One of the main components of risk assessment is Economic Capital (ECAP).
Economic capital can be seen as the methods or practices allowing banks to consistently assess risk and attribute capital to cover the economic effects of risk-taking activities. Economic capital is defined as the potential deviation between the group’s economic value and its expected value, with a given confidence interval and time horizon.
Economic capital aims at summarising in one single figure the unexpected losses of the Bank regarding the risks facing by its different activities and entities.
Capital adequacy process
The capital adequacy process mainly links the Economic Capital requirements with the Bank’s Available Financial Resources. It aims to ensure that the Bank allocates sufficient capital considering its risk profile.
Capital & Liquidity Planning
One of the main objectives of the ICAAP is to ensure the Bank has and will have sufficient capital and liquidity to support its business model and strategy on the long-run, under both normal and adverse circumstances.
Following this, Capital & Liquidity Planning can be defined as a tool allowing the Bank’s management to assess whether its capital and liquidity buffers levels, together with its funding structure is adequate to support its strategy, taking into account various scenarios in a forward-looking perspective.
2.3.2. Capital Adequacy
The following section summarises (i) the Available Financial Resources calculation, (ii) the Economic Capital assessment and (iii) the Pillar I and Pillar II capital adequacy.
2.3.2.1. Available Financial Resources
Definition
Available Financial Resources (AFR) represent the loss absorbing financial capacity and availability over a given time horizon (one year for BIL group). AFR are materialised by the available financial capacity to cover the incurred risks and absorb the losses.
Core principles
Principle 1: Permanent, loss absorbing and available resources. The bases of the AFR measure are BIL group’s CET1 ratio but with some adjustments to have an economic view of the Bank’s available resources and to respect the second principle.
Principle 2: Consistency with Economic Capital. ECAP is a measure of the Bank’s unexpected losses. According to this, AFR do not aim at absorbing the existing incurred losses for which provisions have been booked; the current P&L is not filtered for the AFR contrary to CET1.
Principle 3: Continuity of operations. Any resource should comply with a going concern scenario, meaning that the Bank is not looking for a measure in a resolution scenario.
Principle 4: Solidarity between the different constituents within the group. Minority interests are considered making part of the available financial resources (up to a certain level in line with current Basel III understanding).

45BIL – Pillar 3 Report 2017
Own funds and capital adequacy
2.3.2.2. AFR as of end 2017
According to those principles, the Bank’s AFR are adjusted according to economic considerations in order to ensure consistency with the key principles of the ECAP measure.
As of December 31, 2017, the BIL group Available Financial Resources amounted to EUR 1267 M.
BIL GROUP AFR 2016 YE 2017 YE Delta
ResourcesCore equity 848.0 848.0 -
Retained earnings & Reserves (P&L included) 230.4 327.1 96.7
AFS Bonds 83.6 50.6 -33.1AT1 (CoCo bonds) 150.0 150.0 -TOTAL 1,312.0 1,375.7 63.6
DeductionsIntangible & goodwill -121.9 -161.5 -39.5
Full deduction DTA Netting with DTL -221.9 -220.2 1.7
TOTAL -343.9 -381.7 -37.8
UCG on AFS Equity after haircut 25% 12.3 11.7 -7
UCG on real estate PLM after haircut 25% 95.5 261.4 165.9
TOTAL 107.9 273.1 165.2
TOTAL AFR 1,076.0 1,267.0 191.0
2.3.2.3. Economic Capital
In the context of BIL group, ECAP can be defined as the amount of capital that would be necessary to cover the unexpected risks inherent in the Bank’s activities and thus ensure the continuity of its business over a given time period with a certain level of confidence. ECAP could thus be interpreted as the worst-case loss the Bank’s shareholders could face with a 99.93% confidence interval, corresponding to a long-term rating of A- over a one year horizon.
The process for quantifying economic capital is based on the following two steps:• Measurement of risk capital by type of risk, on the basis of
dedicated statistical methods. Each risk is thus individually assessed,
• Aggregation based on an inter-risk diversification matrix to obtain a global ECAP figure and its reallocation to the various levels of risk (entities, business lines, etc.).
Firstly, an ECAP engine allows to aggregate the risk capital estimated for each risk and then allocate it to all risk levels (entities, business lines, etc.). This tool is based on the Markowitz approach: the total estimated capital is diversified using a calibrated correlation matrix.
As at December 31, 2017, BIL group’s economic capital amounted to EUR 970 M, allocated according to the following structure:
Credit Risk60.8%
Business Risk7.1%
Operational Risk5%
Outflow Risk1.8%
Funding Risk1.4%
Currency Risk0.6%
Interest Rate Risk7%
Price Risk14.7%
Model Risk1.4%
2.3.2.4. Capital Adequacy
BIL group’s capital adequacy is represented in the following table (EUR M):
Risk Category Risk Type Pillar 1 Pillar 2
Credit Risks
Credit Risk
459
342
Concentration Risk 28
Credit spread Risk 192
Other credit Risks 28
Market & ALM
Price Risk
6
143
Interest Rate Risk 68
Currency Risk 6
Funding Risk 14
Behavioural Risk 18
Operational Operational Risk 66 49
Enterprise Risks
Business Risk - 69
Model Risk - 13
TOTAL CAPITAL LEVEL 531 970
Capital Supplies 1,094 1,267
Adequacy Ratios 206% 131%
As of 2017 year-end, the ratio of economic capital resources to economic capital consumption (AFR/ECAP) had reached the level of 131%.

46 BIL – Pillar 3 Report 2017
3. Credit risk
Credit risk represents the potential loss (reduction in value of an asset or payment default) that BIL may incur as a result of a deterioration in the solvency of any counterparty.
3.1 Credit risk governance
3.1.1 Organisation
Please refer to the section 1.2.1 Organisation.
3.1.2 Policy
BIL group’s Risk Management department has established a general policy and procedural framework in line with the Bank’s Risk Appetite. This framework guides the analysis, decision-making and monitoring of credit risk. The Risk Management department manages the loan issuance process by chairing credit and risk committees and by delegating within the limits set by the Bank’s internal governance. As part of its monitoring tasks, the Credit Risk Management unit supervises changes in the Bank’s portfolios’ credit risks by regularly analysing loan applications and reviewing counterparties’ ratings. The Risk Management department also draws up and implements the policy on provisions, decides on specific provisions, and assesses default cases.
3.1.3 Committees
BIL group’s Risk Management department oversees the Bank’s credit risk, under the supervision of the Management Board and dedicated committees.
The Risk Policy Committee defines the general risk policies, as well as specific credit policy in different areas or for certain types of counterparty, and sets up the rules for granting loans, supervising counterparties’ ratings and monitoring exposures. The Risk Policy Committee validates all changes in procedures or risk policies, principles and calculation methods referring to risk.
In order to streamline the decision-making process, the Management Board delegates its decision-making authority to credit committees or joint powers. This delegation is based on specific rules, depending on the counterparty’s category, rating level and credit risk exposure. The Board of Directors remains the ultimate decision-making body for the largest loan applications or those presenting a level of risk deemed to be significant. The Credit Risk Management department carries out an independent analysis of each application
presented to the credit committees, including determining the counterparty’s rating, and stating the main risk indicators; it also carries out a qualitative analysis of the transaction.
Alongside supervision of the issuance process, various committees are tasked with overseeing specific risks:• The Default Committee identifies and tracks counterparties
in default, in accordance with Basel regulations, by applying the rules in force at BIL, determines the amount of allocated specific provisions and monitors the risk cost. The same committee supervises assets deemed to be “sensitive” and placed under surveillance by being filed as “Special Mention” or put on “Watchlists”;
• The Rating Committee ensures that the internal rating systems are correctly applied and that rating processes meet pre-defined standards;
• The Internal Rating Systems Performance Committee ensures the monitoring of BIL’s internal rating systems’ performance through time (i.e. backtesting, benchmarking, model validation) and discusses all the strategic choices related to this matter (e.g. new model development, material changes etc.).
3.1.4 Risk measurement
Credit risk measurement is primarily based on internal systems introduced and developed within the Basel framework. Each counterparty is assigned an internal rating by credit risk analysts, using dedicated rating tools. This internal rating corresponds to an evaluation of the level of default risk borne by the counterparty, expressed by means of an internal rating scale. Rating assessment is a key factor in the loan issuance process. Ratings are reviewed at least once a year, making it possible to identify counterparties requiring the close attention of the Default Committee.
To manage the general credit risk profile and limit concentration of risk, credit risk limits are set for each counterparty, establishing the maximum acceptable level for each one. Limits by economic sector and by product may also be imposed by the Risk Management department. The latter actively monitors limits, which it can reduce at any time, in light of changes in related risks. The Risk Management department may freeze specific limits at any time in order to take the latest events into account.
Metrics
The metrics used to measure risk exposure may differ from accounting metrics.

47BIL – Pillar 3 Report 2017
Credit Risk
The credit risk exposure measure known as exposure-at-default (EAD), which is used for the calculation of regulatory capital requirements includes (a) current and potential future exposures, and (b) credit risk mitigants (CRM) covering those exposures (under the form of netting agreements, financial collateral for derivatives and repo exposures, and guarantees for others).
Moreover, BIL has defined an internal measure compliant with IFRS 7 norms, known as maximum credit risk exposure (MCRE) in order to compare figures published in the annual financial statements. This metric corresponds to the EAD with a credit conversion factor (CCF) of 100%, after deduction of specific provisions and financial collateral (netting agreements).
3.2 Credit risk exposureCredit risk exposure refers to the Bank’s internal concept of MCRE:• The net carrying value of balance sheet assets other than
derivative products (i.e. the carrying value after deduction of specific provisions);
• The mark-to-market valuation of derivative products;• The total off-balance sheet commitments. The total
commitment corresponds to unused lines of liquidity or to the maximum amount that BIL is obliged to honour under guarantees issued to third parties.
Several metrics will be used throughout this report to express different views on the Bank’s risk exposures.
3.2.1 Total and average amount of credit exposure by exposure classes
In the application of Article 442 (c) in the CRR, this table represents the year-end total and annual average exposure expressed in MCRE. For on-balance sheet items the “Net value of exposure” is calculated by deducting credit risk adjustments from the gross amount and for off-balance sheet respective provisions have been deducted.
Hence, credit risk exposures values are shown after accounting offsets but before credit risk mitigation.
The year-end total exposure includes figures obtained using both the standardised approach and advanced methods. The average credit exposure is computed as the average of the net exposure values observed at the end of each quarter of the year 2017.
(in EUR million)Net
exposure values
Average of net
exposure values*
1 Central governments or central banks 5,963.27 6,069.82
2 Institutions 2,107.15 2,546.56 3 Corporates 4,471.90 4,449.42 4 Of which: SME 2,219.67 2,143.32 5 Of which: Other 2,252.23 2,306.11 6 Retail 8,589.54 8,388.94
7 Of which: Secured by real estate property SME 194.90 170.89
8 Of which: Secured by real estate property Non-SME 5,839.92 5,642.88
9 Of which: Other SME 255.29 249.76 10 Of which: Other Non-SME 2,299.43 2,325.42 11 Equity 6.02 6.21
12 Other non credit-obligation assets 3.52 4.14
13 Total IRB approach 21,141.41 21,465.10
14 Central governments or central banks 1,197.38
1,016.47
15 Regional governments or local authorities 236.77 346.61
16 Public sector entities 350.80 375.85
17 Multilateral development banks 83.92 76.73
18 International organisations 218.43 239.37 19 Institutions 43.36 45.22 20 Corporates 2,172.51 2,143.51 21 Retail 8.54 8.56
22 Secured by mortgages on immovable property 354.41 355.87
23 Exposures in default 18.67 23.68
24 Items associated with particularly high risk 33.33 33.19
25Claims on institutions and corporates with a short-term credit assessment 0.14 0.04
26 Equity exposures 12.77 13.63 27 Securitisation 240.81 260.97 28 Other items 452.53 435.57
29 TOTAL STANDARDISED APPROACH 5,424.37 5,375.29
30 TOTAL 26,565.78 26,840.39
TABLE EU CRB-B - TOTAL AND AVERAGE NET AMOUNT OF EXPOSURES
As of December 31, 2017, the Bank’s total credit risk exposure amounted to 26’566 million which represents a slight increase of 1.6% compared with the 2016 year-end (26’158 million). Therefore, there are no significant changes between the two periods.

48 BIL – Pillar 3 Report 2017
Credit Risk
(in EUR million) Europe Of which: Luxembourg
Of which: France
Of which: Switzerland
Of which: Belgium
Of which: Germany
United States
and Canada
South and
Central America
Asia Other geographical
areas
TOTAL
Central governments or central banks
5,473.24 1,409.65 722.00 1,803.93 522.76 -
409.27 - 80.76 -
5,963.27
Institutions 1,788.04 207.00 493.38 12.80 177.34 170.53 105.91 0.53 21.44 191.23 2,107.15 Corporates 4,143.43 3,098.93 400.00 84.81 107.27 199.47 32.09 - 241.22 55.17 4,471.90 Of which: SME 2,215.24 2,122.25 26.50 - 25.67 25.25 - - 4.43 - 2,219.67 Of which: Other 1,928.19 976.68 373.50 84.81 81.60 174.23 32.09 - 236.78 55.17 2,252.23 Retail 8,344.05 6,314.42 722.79 64.33 373.36 163.78 2.88 60.88 148.07 33.68 8,589.54 Of which: Secured by
real estate property SME
194.90 185.42 3.33 - 4.27 0.97 - - - - 194.90
Of which: Secured by real estate property Non-SME 5,791.56 4,795.71 437.75 30.11 220.28 123.32
1.00 2.51
34.05 10.79
5,839.92 Of which: Other SME 255.13 248.37 3.03 0.02 1.28 0.75 0.00 0.08 0.04 0.03 255.29 Of which: Other
Non-SME 2,102.46 1,084.93
278.69 34.20 147.53 38.74
1.87 58.28
113.97
22.85
2,299.43 Equity 6.02 5.99 0.00 - - - - - - 0.00 6.02 Other non credit-obligation assets 2.81 1.09 - 0.89 - - 0.60 0.00 0.03 0.07 3.52 Total IRB approach 19,757.59 11,037.08 2,338.17 1,966.76 1,180.74 533.78 550.76 61.41 491.52 280.14 21,141.41 Central governments or central banks 1,072.93 140.55 6.87 -
216.45 443.91
124.45 - - - 1,197.38
Regional governments or local authorities 236.77
- 167.81 42.78 26.18 - - - - - 236.77 Public sector entities 350.80 335.73 - - - 14.63 - - - - 350.80 Multilateral development banks - - - - - - - - - 83.92 83.92 International organisations - - - - - - - - - 218.43 218.43 Institutions 40.42 0.82 10.73 0.00 - 28.86 2.94 - - - 43.36 Corporates 2,063.00 1,396.17 215.43 0.25 12.38 191.32 0.94 0.72 5.77 102.09 2,172.51 Retail 8.52 8.44 - - 0.03 0.05 0.02 - - - 8.54 Secured by mortgages on immovable property 350.94 293.96 8.31 - - 22.57 2.82 - - 0.65 354.41 Exposures in default 18.50 11.22 0.60 - - 6.68 - 0.00 - 0.17 18.67
Items associated with particularly high risk 33.06 31.07 0.00 1.68 0.32 - 0.10 0.16 - - 33.33 Claims on institutions and corporates with a short-term credit assessment 0.14 0.00 0.00 - 0.14
- - - - - 0.14 Equity exposures 12.77 12.67 0.04 - - - - - - - 12.77 Securitisation 213.30 22.19 87.08 - 0.44 18.61 - - 0.73 26.78 240.81 Other items 406.00 402.50 0.00 - - - - - - 46.53 452.53 Total standardised approach 4,807.17 2,655.31 496.87 44.71 255.94 726.63
131.26 0.88 6.49 478.57
5,424.37
TOTAL 24,564.75 13,692.39 2,835.05 2,011.46 1,436.68 1,260.42 682.02 62.29 498.01 758.71 26,565.78
3.2.2 Geographical breakdown of credit exposures
In the application of Article 442 (d) in the CRR, the table below shows the total exposure expressed in terms of MCRE broken down by exposure classes and geographic areas at year-end 2017. The geographical distribution is based on the legal residence of the counterparty or issuer. It comprises figures obtained using both the standardised and the advanced methods.
TABLE EU CRB-C - GEOGRAPHICAL BREAKDOWN OF EXPOSURES

49BIL – Pillar 3 Report 2017
Credit Risk
As at December 31, 2017, the Bank’s exposure was mainly concentrated in Europe (92.5%, 24’565 million) with 51.5% of the total exposure in Luxembourg, 10.7% in France, 7.6% in Switzerland, 5.4% in Belgium and 4.7% in Germany.• Corporate activity is concentrated in Luxembourg (67.7%).• Retail activity is concentrated in Luxembourg (73.5%) and
its neighbouring countries (8.4% in France, 4.3% in Belgium and 1.9% in Germany).
• Regarding the Central Governments and Central Banks exposures, the main counterparties of the Bank are the Central Bank of Luxembourg, the Swiss National Bank, Luxembourg, France and Belgium.
Please note that exposures to supra-national organisations are part of the 'Other geographical areas' for a total amount of 344.8 million.
.
3.2.3 Exposure breakdown by industry sector
In the application of Article 442 (e) in the CRR, the table below shows the total exposure (expressed in terms of MCRE) broken down by exposure class and industry at year-end 2017. The industry classification is based on NACE codes (NACE (Nomenclature des Activités Économiques dans la Communauté Européenne) is a European industry standard classification system for classifying business activities). It comprises figures obtained using both the standardised and the advanced methods

50 BIL – Pillar 3 Report 2017
Credit Risk
(in EUR million) Agriculture. foresty and
fishing
Mining and
quarrying
Manufacturing Electricity. gas. steam
and air conditioning
supply
Water supply Construction Wholesale and retail
trade
Transport and storage
Accommodation and food service
activities
Central governments or central banks - - - - - - - - -
Institutions - - - - - - - - -
Corporates - - - - - - - - -
Of which: SME 20.97 0.56 134.80 65.54 2.30 710.91 165.50 43.80 62.34
Of which: Other 3.02 0.52 555.99 87.10 7.40 105.65 253.62 139.80 25.08
Retail - - - - - - - - -
Of which: Secured by real estate property SME 2.16 0.08 4.10 0.70 0.13 36.57 19.71 2.60 17.65
Of which: Secured by real estate property Non-SME 76.34 2.12 69.16 4.62 1.58 220.57 152.26 28.31 131.13
Of which: Other SME 3.61 0.30 14.29 1.35 1.06 44.18 62.07 11.49 21.34
Of which: Other Non-SME 24.31 0.77 28.19 0.36 0.19 72.23 52.76 7.20 16.03
Equity - - - - - - - - -
Other non credit-obligation assets - - - - - - - - -
Total IRB approach 130.41 4.34 806.53 159.68 12.66 1.190.11 705.92 233.20 273.56 Central governments or central banks - - - - - - - - - Regional governments or local authorities - - - - - - - - - Public sector entities - - - - 0.01 - - 149.84 - Multilateral development banks - - - - - - - - -
International organisations - - - - - - - - -
Institutions - - - - - - - - -
Corporates - 0.15 17.58 134.70 - 506.71 8.68 18.11 1.17
Retail 0.15 - 0.00 - - 0.08 0.05 0.29 -
Secured by mortgages on immovable property - - 3.30 2.57 - 80.11 3.31 - 1.00
Exposures in default - - - - - 9.74 0.01 - -
Items associated with particularly high risk - - - - - - - 8.07 -
Claims on institutions and corporates with a short-term credit assessment - - - - - - - - -
Equity exposures - - - - - - - - -
Securitisation - - - - - - - - -
Other items - - - - - - - - -
Total standardised approach 0.15 0.15 20.89 137.27 0.01 596.64 12.04 176.31 2.17
TOTAL 130.56 4.49 827.42 296.94 12.66 1,786.75 717.97 409.51 275.73
TABLE EU CRB-D - CONCENTRATION OF EXPOSURES BY INDUSTRY OR COUNTERPARTY TYPES

51BIL – Pillar 3 Report 2017
Credit Risk
Information and
communication
Financial and
insurance activities
Real estate activities
Professional. scientific and
technical activities
Administrative and support
service activities
Public admnistration and defence. compulsory
social security
Education Human health
services and social work
activities
Arts. entertainment and recreation
Other services
Others TOTAL
-
2,642.12 - - - 3,273.48 - 45.12 0.50 - 2.05 5,963.27
- 2,086.92 - - - - - - - - 20.23 2,107.15
- - - - - - - - - - - -
38.01 189.49 633.40 73.57 57.31 - 0.36 10.57 7.90 1.08 1.27 2,219.67
59.77 683.06 76.43 120.90 40.30 - - 58.48 20.09 - 15.03 2,252.23
- - - - - - - - - - - -
3.26 5.36 79.64 7.03 5.87 - 0.26 4.51
3.61
1.68 - 194.90
38.35 772.56 608.54 231.24 26.54 22.50 21.51 216.62 30.39 28.28 3,157.30 5,839.92
13.23 9.28 15.59 22.87 16.76 - 1.33 7.17 2.85 6.34 0.18 255.29
18.30 693.84 209.59 86.77 8.73 84.10 6.59 49.94 18.33 18.83 902.37 2,299.43
0.00 0.01 - 0.03 0.43 - - - - 5.55 - 6.02
- 2.43 - - - - - - - - 1.09 3.52
170.93 7,085.07 1,623.18 542.41 155.95 3,380.08 30.05 392.40 83.67 61.76 4,099.51 21,141.41
- 20.04 - - 11.49 1,066.01 - 70.77 - - 29.07 1,197.38
- - - - - 226.72 - - - - 10.06 236.77
20.90 - - - 5.51 153.78 0.19 16.39 - 4.08 0.10 350.80
- 83.92 - - - - - - - - - 83.92
- - - - - - - - - - 218.43 218.43
- 33.37 - - - - - - - - 9.99 43.36
36.12 855.88 358.10 32.31 0.01 49.58 3.71 11.71 - 105.36 32.64 2,172.51
0.12 0.22 0.87 0.03 0.00 0.13 0.54 1.69 2.16 2.21 - 8.54
1.43 115.12 144.09 1.53 - - - 0.48 0.43 0.39 0.65
354.41 - 0.17 8.75 - - - - - - 0.00 - 18.67
0.32 23.56 0.00 - 0.70 - - - - 0.68 0.00 33.33
- 0.14 - - - - - - - - - 0.14
- 0.99 0.00 - - - - - - 11.78 - 12.77
- 81.04 - - - - - - - 14.00 145.77 240.81
- 42.43 - - - - - - - - 410.10 452.53
58.89
1,256.87 511.82 33.86 17.71 1,496.22 4.44 101.04 2.59
138.51 856.81 5,424.37
229.81 8,341.93 2,135.00 576.27 173.66 4,876.30 34.49 493.44 86.26 200.27 4,956.32 26,565.78

52 BIL – Pillar 3 Report 2017
Credit Risk
As of December 31, 2017, the sectors “Financial and insurances activities” and “Public administration” represented the highest exposures with respectively 31.4% and 18.4% of the total exposures.
BIL continues to invest in low RWA cost counterparties such as Central Governments or strong Financial institutions.
NEXT EXPOSURE VALUE
(in EUR million) <= 1 year > 1 year < = 5 years Over 5 years No stated maturity TOTAL
Central governments or central banks 936.71 768.07 2,000.70 2,257.80 5,963.27
Institutions 504.85 900.02 296.61 405.68 2,107.15 Corporates 1,131.77 973.59 1,824.47 542.06 4,471.90 Of which: SME 466.84 233.87 1,087.85 431.11 2,219.67 Of which: Other 664.93 739.72 736.62 110.95 2,252.23 Retail 540.73 1,044.54 5,821.53 1,182.74 8,589.54
Of which: Secured by real estate property SME 10.85 18.66 137.90 27.49 194.90
Of which: Secured by real estate property Non-SME 129.26 336.65 5,121.42 252.59 5,839.92
Of which: Other SME 40.09 95.08 57.68 62.44 255.29
Of which: Other Non-SME 360.52 594.16 504.54 840.22 2,299.43 Equity - - - 6.02 6.02 Other non credit-obligation assets - - - 3.52 3.52 Total IRB approach 3,114.06 3,686.22 9,943.31 4,397.82 21,141.41 Central governments or central banks 324.83 239.46 608.32 24.77 1,197.38
Regional governments or local authorities 73.97 87.87 74.93 - 236.77 Public sector entities 51.23 2.17 207.95 89.45 350.80 Multilateral development banks - 33.60 50.32 - 83.92 International organisations - 134.01 84.43 - 218.43 Institutions 0.18 3.36 35.61 4.21 43.36 Corporates 500.73 353.60 830.94 487.24 2,172.51 Retail 1.38 2.87 2.44 1.85 8.54 Secured by mortgages on immovable property 3.31 57.73 292.45 0.93 354.41
Exposures in default 0.30 - 9.25 9.12 18.67
Items associated with particularly high risk - - - 33.33 33.33
Claims on institutions and corporates with a short-term credit assessment - - - 0.14 0.14 Equity exposures - - - 12.77 12.77 Securitisation - 15.40 225.40 - 240.81 Other items 0.25 3.53 0.06 448.69 452.53 Total standardised approach 956.19 933.59 2,422.10 1,112.49 5,424.37 TOTAL 4,070.25 4,619.81 12,365.41 5,510.32 26,565.78
3.2.4 Exposure breakdown by residual maturity
In the application of Article 442 (f) in the CRR, the table below shows the total exposure (expressed in terms of MCRE) broken down by exposure classes and residual maturities at year-end 2017. It comprises figures obtained using both the standardised and the advanced methods.
TABLE EU CRB-E - MATURITY OF EXPOSURES

53BIL – Pillar 3 Report 2017
Credit Risk
This table shows that 32.7% of the total risk exposure does not exceed five years.
Over the longer term, 46.5% of the total risk exposure exceeds five years. This represents long-term bonds to central governments and central banks, retail banking mortgage activity and the financing of the real estate and construction sector.
Exposures classified as “no defined maturity” represent 20.7% of the total exposure and are essentially composed of debits accounts for the corporate and retail exposure class and (ii) Nostri accounts with central banks for the Central Governments and Central Banks exposure class.
3.2.5 Credit quality of exposures
In the application of Article 442 (g) in the CRR, the tables below provide a breakdown of defaulted and non-defaulted exposures by regulatory exposure classes and industries respectively. It comprises figures obtained using both the standardised and the advanced methods.
The industry classification is based on NACE codes, which is a European industry standard classification system for classifying business activities.
The Bank does not book any credit risk adjustment which qualify as general credit risk adjustment.
Gross carrying value ofSpecific
credit risk adjustements
General credit risk
adjustements
Net values
(in EUR million) Defaulted exposures
Non-defaulted exposures
(a+b-c-d)
Central governments or central banks - 5,963.27 - - 5,963.27 Institutions - 2,107.15 - - 2,107.15 Corporates 160.14 4,353.50 41.74 - 4,471.90 Of which: SME 159.11 2,102.30 41.74 - 2,219.67 Of which: Other 1.02 2,251.21 - - 2,252.23 Retail 441.86 8,278.52 130.84 - 8,589.54 Of which: Secured by real estate property SME 8.36 188.47 1.93 - 194.90 Of which: Secured by real estate property Non-SME 202.58 5,660.75 23.41 - 5,839.92 Of which: Other SME 22.47 246.68 13.87 - 255.29 Of which: Other Non-SME 208.45 2,182.62 91.64 - 2,299.43 Equity 3.33 6.46 3.77 - 6.02 Other non credit-obligation assets - 3.52 - - 3.52 Total IRB approach 605.33 20,712.43 176.35 - 21,141.41 Central governments or central banks - 1,197.38 - - 1,197.38 Regional governments or local authorities - 236.77 - - 236.77 Public sector entities - 350.80 - - 350.80 Multilateral development banks - 83.92 - - 83.92 International organisations - 218.43 - - 218.43 Institutions - 43.36 - - 43.36 Corporates - 2,172.51 - - 2,172.51 Retail - 8.54 - - 8.54 Secured by mortgages on immovable property - 354.41 - - 354.41 Exposures in default 88.17 - 69.50 - 18.67
Items associated with particularly high risk - 41.61 8.29 - 33.33
Claims on institutions and corporates with a short-term credit assessment - 0.14 - - 0.14
Equity exposures - 20.06 7.29 - 12.77 Securitisation - 240.81 - - 240.81 Other items - 452.53 - - 452.53 Total standardised approach 88.17 5,421.28 85.07 - 5,424.37 TOTAL 693.50 26,133.70 261.42 - 26,565.78
TABLE EU CR1-A - CREDIT QUALITY OF EXPOSURES BY EXPOSURE CLASS AND INSTRUMENT

54 BIL – Pillar 3 Report 2017
Credit Risk
Gross carrying value ofSpecific
credit risk adjustements
General credit risk
adjustements
Net values
(in EUR million) Defaulted exposures
Non-defaulted exposures
(a+b-c-d)
Agriculture, foresty and fishing 2.58 128.37 0.38 - 130.56 Mining and quarrying 0.27 4.23 0.01 - 4.49 Manufacturing 10.27 820.04 2.89 - 827.42 Electricity, gas, steam and air conditioning supply 32.23 281.30 16.59 - 296.94 Water supply 0.03 12.66 0.02 - 12.66 Construction 51.45 1,751.89 16.59 - 1,786.75 Wholesale and retail trade 24.10 707.72 13.85 - 717.97 Transport and storage 1.65 408.55 0.69 - 409.51 Accommodation and food service activities 11.01 268.29 3.58 - 275.73 Information and communication 2.93 227.98 1.10 - 229.81 Financial and insurance activities 324.81 8,154.63 137.51 - 8,341.93 Real estate activities 102.67 2,061.41 29.08 - 2,135.00 Professional, scientific and technical activities 12.39 567.54 3.66 - 576.27 Administrative and support service activities 1.85 172.83 1.02 - 173.66 Public admnistration and defence, compulsory social security 0.82 4,875.71 0.23 - 4,876.30
Education 0.13 34.41 0.05 - 34.49 Human health services and social work activities 7.74 488.10 2.40 - 493.44 Arts, entertainment and recreation 4.52 83.57 1.84 - 86.26 Other services 3.64 197.18 0.55 - 200.27 Others 98.40 4,887.29 29.37 - 4,956.32 TOTAL 693.50 26,133.70 261.42 - 26,565.78
TABLE EU CR1-B - CREDIT QUALITY OF EXPOSURES BY INDUSTRY
3.2.6 Credit quality of exposures by geographical area
In the application of Article 442 (h) in the CRR, the table below provides a breakdown of defaulted and non-defaulted exposures by geographical areas. It comprises figures obtained using both the standardised and the advanced methods. The geographical distribution is based on the legal residence of the counterparty or issuer.
The Bank does not book any credit risk adjustment which qualify as general credit risk adjustment.

55BIL – Pillar 3 Report 2017
Credit Risk
Gross carrying value ofSpecific
credit risk adjustements
General credit risk
adjustements
Net values
(in EUR million) Defaulted exposures
Non-defaulted exposures
(a+b-c-d)
Europe 591.82 24,132.40 159.48 - 24,564.75 Of which: Luxembourg 374.65 13,413.20 95.46 - 13,692.39 Of which: France 106.26 2,748.76 19.97 - 2,835.05 Of which: Switzerland 4.67 2,011.93 5.14 - 2,011.46 Of which: Belgium 8.64 1,429.20 1.16 - 1,436.68 Of which: Germany 45.51 1,238.16 23.25 - 1,260.42 United States and Canada 0.05 686.59 4.62 - 682.02 South and Central America 1.09 61.40 0.21 - 62.29 Asia 5.35 495.02 2.35 - 498.01 Other geographical areas 95.18 758.29 94.76 - 758.71 TOTAL 693.50 26,133.70 261.42 - 26,565.78
TABLE EU CR1-C - CREDIT QUALITY OF EXPOSURES BY GEOGRAPHY
3.3 Forbearance, impairment past due and provisions
3.3.1 Definitions
BIL records allowances for impairment losses when there is objective evidence that a financial asset or group of financial assets is impaired as a result of one or more events occurring after initial recognition and is evidencing (a) a decline in expected cash flows and (b) an impact on estimated future cash flows that can be reliably estimated.
3.3.1.1 Financial assets measured at amortised cost
BIL first assesses whether objective evidence of impairment exists individually for financial assets. If no such evidence exists, the financial assets is included in a group of financial assets with similar credit risk characteristics and collectively assessed for impairment.
Determination of the impairment
• Specific individual impairments: If an objective evidence exists individually on a significant asset classified as loans or other receivables or financial assets classified as held-to-maturity, the amount of impairment on specifically identified assets is calculated as the difference between the carrying amount and the estimated future cash flows being the present value of estimated future cash flows.
• Specific collective impairments for mass products: If the objective evidence is identified individually for insignificant assets or collectively for a group of assets with similar risk characteristics, specific impairments is recorded on these identified group of assets.
• Collective impairments: Collective provisions are calculated for counterparties for which no objective evidence of impairment exist but for which the Bank knows that from a statistical point of view losses may have occurred unless those losses have not yet been identified.
The Bank considers the following events as impairment triggers according to IAS 39:• Significant financial difficulty of the issuer or obligor;• A breach of contract, such as a default or delinquency in
interest or principal payments;• The lender, for economic or legal reasons relating to the
borrower’s financial difficulty, granting to the borrower a concession that the lender would not otherwise consider;
• It becoming probable that the borrower will enter bankruptcy or other financial reorganisation;
• The disappearance of an active market for that financial asset because of financial difficulties; or
• Observable data indicating that there is a measurable decrease in the estimated future cash flows from a group of financial assets since the initial recognition of those assets, although the decrease cannot yet be identified with the individual financial assets in the group, including:
• Adverse changes in the payment status of borrowers in the group (e.g. an increased number of delayed payments or an increased number of credit card borrowers who have reached their credit limit and are paying the minimum monthly amount); or
• National or local economic conditions that correlate with defaults on the assets in the group (e.g. an increase in

56 BIL – Pillar 3 Report 2017
Credit Risk
the unemployment rate in the geographical area of the borrowers, a decrease in property prices for mortgages in the relevant area, a decrease in oil prices for loan assets to oil producers, or adverse changes in industry conditions that affect the borrowers in the group).
In addition, the Bank will also consider the levels of and trends in delinquencies for similar financial assets.
In order to adopt a prudent approach, the Bank considers all individual factor as a trigger event.
Accounting treatment of the impairment
BIL recognizes changes in the amount of impairment losses in the consolidated statement of income and reports them as "Impairment on loans and provisions for credit commitments". The impairment losses are reversed through the consolidated statement of income if the increase in fair value relates objectively to an event occurring after the impairment was recognised.
When an asset is determined by management to be uncollectable, the outstanding specific impairment is reversed via the consolidated statement of income under the heading "Impairment on loans and provisions for credit commitments" and the net loss is recorded under the same heading. Subsequent recoveries are also accounted for under this heading.
3.3.1.2 Available-for-sale financial assets
BIL recognizes the impairment of available-for-sale (AFS) assets on an individual basis if there is objective evidence of impairment as a result of one or more events occurring after initial recognition.
Determination of the impairment
• Quoted equities: The potential need of impairment is analysed based on an impairment test which consists of identifying cases where the net carrying amount is higher than the net present value;
• Unquoted equities: The potential need of impairment on participations is reviewed based on a comparison between the purchase cost and the estimated fair value obtained through latest annual accounts available of the entity (for consolidated participations) and/or any other information that can help evaluating the participation such as latest
securities exchanges, internal memorandum on valuation,… (for non-consolidated participations);
• Quoted/unquoted bonds: The potential need of impairment is analysed based on (i) the same impairment test described for the quoted equities above and, in some cases, (ii) an impairment test based on the evolution of the fair value referring to the credit spread;
• Private equity instruments: the potential need of impairment is analysed based on (i) the net asset value of reported by the fund/company, and (ii) an utility value calculated by the Credit Risk department.
Accounting treatment of the impairment
When AFS financial assets are impaired, the AFS reserve is recycled and these impairment losses are reported in the consolidated statement of income as "Net income on investments". Additional decline in fair value is recorded under the same heading for equity securities.
When an impairment loss has been recognised on bonds, any subsequent decline in fair value is recognised under "Net income on investments", if there is objective evidence of impairment. In all other cases, changes in fair value are recognised in "Other comprehensive income".
Impairments on equity securities cannot be reversed in the statement of income due to later recovery of quoted prices.

57BIL – Pillar 3 Report 2017
Credit Risk
3.3.2 Ageing of accounting past due and not impaired exposures
The following table provides an ageing analysis of past-due exposures regardless of their impairment status at year-end 2017.
Gross carrying values
≤ 30 days > 30 days≤ 60 days
> 60 days≤ 90 days
> 90 days≤ 180 days
> 180 days≤ 1 year
> 1 years
Loans 99,202,005.89 46,669,716.00 30,460,040.00 50,080,157.00 59,653,494.00 71,137,567.00Debt securities 0 0 0 0 0 0TOTAL EXPOSURES 99,202,005.89 46,669,716.00 30,460,040.00 50,080,157.00 59,653,494.00 71,137,567.00
3.3.3 Information on forborne exposure and non-performing loans
Forborne exposuresBIL closely monitors its forborne exposures, in line with the definition stated in the publication of the Official Journal of the European Union dated February 2015.
Forborne exposures are debt contracts in respect of which forbearance measures have been extended. Forbearance measures consist of concessions towards a debtor facing or about to face difficulties in meeting their financial commitments (“financial difficulties”). Those measures include in particular the granting of extensions, postponements, renewals or changes in credit terms and conditions, including the repayment plan.
Once those criteria are met, the credit files are flagged as being restructured and are added to a list closely followed by the team “Gestion Intensive et Particulière”.
In order to comply with the regulatory standards, BIL group has set up a dedicated project aimed at (i) identifying the criteria leading to the forborne classification, (ii) classifying the Bank’s existing exposures as forborne or non-forborne and (iii) implementing these criteria across the systems.
For all counterparties, dedicated analyses are carried out at single credit file level in order to identify those that should be classified as forborne according to the regulatory definition. The granting of forbearance measure is likely to constitute an impairment trigger, meaning that the loan should be assessed for impairment either individually or as part of a collective assessment.
For credit files in forbearance and in case of early repayment, the costs related to these transactions are either borne by the debtor (in one shot or spread over the term of the new loan) or recognised directly in the Bank’s profit and loss.
As at end 2017, BIL group's forborne exposures amounted to EUR 283.4 million including EUR 3.7 million as given banking guarantees.
Non-performing exposuresAccording to EBA definition, non-performing exposures correspond to files classified in default, or in pre-litigation (past due period > 90 days) or all files from counterparties whose pre-litigated exposure represent at least 20% of their total exposure.
Exposures in respect of which a default (CRR) is considered to have occurred and exposures that have been found impaired (IFRS) are always considered as non-performing exposures.
The table below provides an overview of non-performing and forborne exposures.
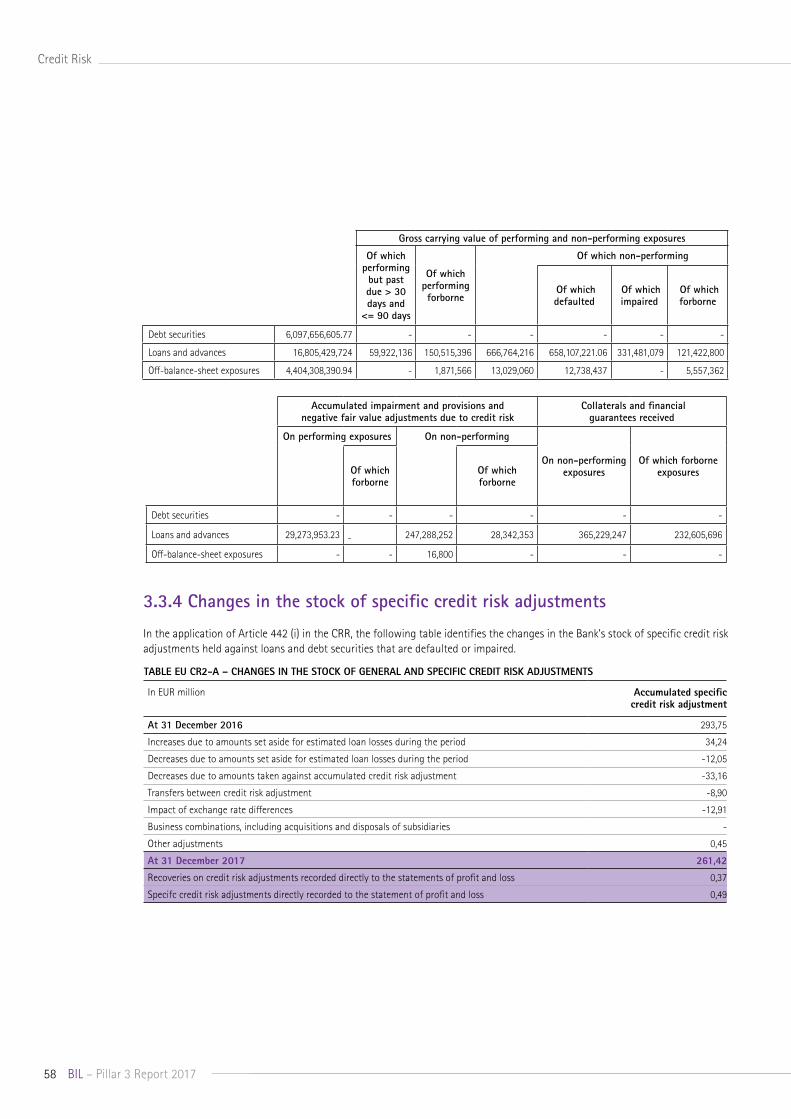
58 BIL – Pillar 3 Report 2017
Credit Risk
Accumulated impairment and provisions and negative fair value adjustments due to credit risk
Collaterals and financial guarantees received
On performing exposures On non-performing
On non-performing exposures
Of which forborne exposuresOf which
forborneOf which forborne
Debt securities - - - - - -
Loans and advances 29,273,953.23 - 247,288,252 28,342,353 365,229,247 232,605,696
Off-balance-sheet exposures - - 16,800 - - -
Gross carrying value of performing and non-performing exposures
Of which performing but past due > 30 days and
<= 90 days
Of which performing forborne
Of which non-performing
Of which defaulted
Of which impaired
Of which forborne
Debt securities 6,097,656,605.77 - - - - - -
Loans and advances 16,805,429,724 59,922,136 150,515,396 666,764,216 658,107,221.06 331,481,079 121,422,800
Off-balance-sheet exposures 4,404,308,390.94 - 1,871,566 13,029,060 12,738,437 - 5,557,362
3.3.4 Changes in the stock of specific credit risk adjustments
In the application of Article 442 (i) in the CRR, the following table identifies the changes in the Bank’s stock of specific credit risk adjustments held against loans and debt securities that are defaulted or impaired.
In EUR million Accumulated specific credit risk adjustment
At 31 December 2016 293,75
Increases due to amounts set aside for estimated loan losses during the period 34,24
Decreases due to amounts set aside for estimated loan losses during the period -12,05
Decreases due to amounts taken against accumulated credit risk adjustment -33,16
Transfers between credit risk adjustment -8,90
Impact of exchange rate differences -12,91
Business combinations, including acquisitions and disposals of subsidiaries -
Other adjustments 0,45
At 31 December 2017 261,42
Recoveries on credit risk adjustments recorded directly to the statements of profit and loss 0,37
Specifc credit risk adjustments directly recorded to the statement of profit and loss 0,49
TABLE EU CR2-A – CHANGES IN THE STOCK OF GENERAL AND SPECIFIC CREDIT RISK ADJUSTMENTS

59BIL – Pillar 3 Report 2017
Credit Risk
3.3.5 Changes in the stock of defaulted and impaired loans and debt securities
In the application of Article 442 (i) in the CRR, the following table identifies the changes in the Bank’s stock of defaulted and impaired loans and debt securities for the year 2017.
3.3.6 Impact due to the IFRS 9 standard
IFRS 9 replaces the existing standard IAS 39 norm as from January 1, 2018.
Section I - Classification and measurement of financial instruments
Classification determines how financial assets and financial liabilities are accounted for in financial statements and, in particular, how they are measured on an on-going basis. While there are no major changes in classification and measurement of financial liabilities, IFRS 9 introduces a new approach for the classification of financial assets driven by cash flow characteristics and the business model under which an asset is held.
The assessment of the features of the contractual cash flows aims to identify whether the contractual cash flows are solely payments of principal and interest on the principal amount outstanding. Hence, the assessment is referred to as the “SPPI” test.
Financial assets are classified according to the Bank’s business model for managing these assets and according to the
In EUR million Gross carrying value defaulted exposures
At 31 December 2016 795.81
Loans and debt securities that have defaulted or impaired since the last reporting period 217.48
Returned to non-defaulted status -275.00
Amounts written off -33.16
Other changes -11.63
Of which: Transfers -8.90
At 31 December 2017 693.50
TABLE EU CR2-B – CHANGES IN THE STOCK OF DEFAULTED AND IMPAIRED LOANS AND DEBT SECURITIES
contractual cash flow characteristics of the financial assets.
There are three portfolios for financial assets:
• Financial assets at amortised cost: financial assets whose business model is to collect cash flows and which passed the SPPI test;
• Financial assets at fair value through other comprehensive income: financial assets whose business model is to collect cash flows and sell, and which passed the SPPI test;
• Financial assets measured at fair value through profit or loss include: - Financial assets held for trading such as:
> Derivatives held for trading and assets that the Bank intends to sell immediately or in the near term,
> The non-trading financial assets mandatorily at fair-value through P&L (financial assets whose business model is to collect cash flows or to collect cash flows and sell but which did not pass the SPPI test), and
> Financial assets designated at fair-value through profit or loss (to avoid an accounting mismatch).
The Bank’s exposures are classified into two main portfolios:
• The first portfolio contains the dealing room exposures, notably the Investment Portfolio. The Bank splits the Investment Portfolio into two sub-portfolios which follow two different business models: - A portfolio of financial assets aimed at collecting
contractual cash flows (“Hold To Collect” or HTC business model);
- A business model based on collecting contractual cash flows and selling financial assets (“Hold To Collect and Sell” or HTC&S business model);
• The second portfolio concerns the loans activity, the business model depends on the way the Bank manages its loans. The objective of the Bank is clearly to only hold loans to collect contractual cash flows and not to sell them (HTC model).
These portfolios have been reviewed to define their classification and measurement under IFRS 9. All products (bonds, interbank exposures and loans) passed the SPPI test.
In parallel, the Bank has established relevant procedures, notably in relation with the “SPPI checks”, and has reviewed the loans granting process in order to ensure that new production will be entirely SPPI compliant. Front office and support staff have been trained on the new processes and procedures related to IFRS 9.

60 BIL – Pillar 3 Report 2017
Credit Risk
The Bank’s business models have been clearly defined for the two main concerned activities (Loans and Investment Portfolio) together with the SPPI criteria. As a consequence, IFRS 9 classification is already set up in BIL’s Core Banking System based on a dedicated chart of account.
The Bank’s business models have been validated by the Management Board, the Board Strategy Committee and the Board of Directors in line with BIL’s strategy. The Bank is now ready to manage portfolios consistently within the new classifications. The Bank has also established an appropriate framework to deal with any potential future change in the business model.
As a result of the application of the classification and measurement requirements of IFRS 9, the following reclassifications on the Investment Portfolio have been done :• 210 positions of debt securities for a nominal of EUR 2.12
billion have been reclassified from available for sale under IAS 39 to amortised cost under IFRS 9 ;
• 105 positions of debt securities for a nominal of EUR 1.57 billion classified in held to maturity under IAS 39 have been to amortised cost under IFRS 9;
• 192 positions of debt securities for a nominal of EUR 1.77 billion have been reclassified from available for sale under IAS 39 to fair value through other comprehensive income under IFRS 9;
• 7 positions of debt securities for a nominal of EUR 0.12 billion classified in held to maturity under IAS 39 have been reclassified to fair value through other comprehensive income under IFRS 9;
Remaining securities have been reclassified as described hereunder :• Open ended funds for approximately EUR 0.01 billion have
been reclassified from available for sale under IAS 39 to mandatorily at fair-value through P&L under IFRS 9;
• Equity securities classified as available for sale under IAS 39 have been reclassified to fair value through other comprehensive income under IFRS 9 as the Bank has irrevocably elected to present in other comprehensive income subsequent changes in the fair value of all its investments in equity instruments.
Financial instruments currently classified as Loans and Receivables under IAS 39 have been reclassified to amortised cost under IFRS 9.
Section II – Impairment
In addition to Pillar I models which focus on the unexpected credit loss (via minimum regulatory capital ratios), IFRS 9 also defines principles to estimate the Expected Credit Loss
(ECL). Under IFRS 9, the ECL is measured in a forward-looking perspective by defining a set of macroeconomic scenarios over a given forecasting horizon. Two types of ECL are proposed:
• 12-month ECL: representing the ECL resulting from default events within 12 months on a financial instrument;
• Lifetime ECL: representing the ECL resulting from all possible default events over the expected lifetime of a financial instrument.
The use of 12-month ECL or Lifetime ECL depends on the evolution of the credit risk of the financial instrument since its initial recognition .
Formule à mettre en page
Financial assets are allocated into impairment stages. This classification depends on the assessment of increase in credit risk since origination or on whether the financial asset has defaulted.
Regarding the different criteria for a stage, it is sufficient to fulfil one of the criteria to be classified in the subsequent stage.
BIL has defined its staging criteria, as follows:• Stage 1: Loan is either performing or with less than 30 days
past due;• Stage 2: Loan is either under forbearance but performing,
or not performing, or with since its initial recognition; or with x notches downgrades (depending since its initial recognition; and
• Stage 3: Loan is either in default, or in pre-litigation, or underperforming and in forbearance.
Key ActivitiesThroughout 2017, the Bank has been testing the application of the ECL methodology for the impacted portfolios through the application of an internal parallel run. This included testing the processes to forecast and probability weight the forward-looking factors used to calculate the ECLs and assessing the appropriateness of the staging criteria. During the year, the Bank also focused on updating all relevant internal controls and policies and continued to educate key stakeholders. Throughout the transition program, the Management Body received regular program updates, including the results of the parallel ECL allowances.

61BIL – Pillar 3 Report 2017
Credit Risk
Section III - Hedge accounting
IFRS 9 introduces a reformed model for hedge accounting with enhanced risk management disclosures. While the IFRS 9 hedge accounting disclosures will be applicable in any case, the standard gives the choice of either retaining IAS 39 accounting policies for hedging purposes or switching to IFRS 9 hedge accounting. This choice remains until a formal standard on macro hedging is issued. At this stage, the Bank will retain the IAS 39 accounting policy requirements for hedging purposes.
Section IV - BIL’s First Time Adoption
The First Time Adoption (FTA) consolidated impact is equal to EUR -31.9 million (before taxes) and can be declined between impairment impact and classification impact.
Impairment impactAs at January 1, 2018, Expected Credit Losses (hereafter “ECL”) reached EUR 54.0 million of which:• Stage 1: EUR -27.0 million;• Stage 2: EUR -14.7 million;• Additional ECL related to exposures in Stage 3 regarding
specific provisions: EUR -12.3 million.
This ECL amount are partially compensated by the reversal of the IAS 39 collective provisions (IBNR model) of EUR 29.3 million.
The retained earnings are therefore negatively impacted by EUR -24.7 million before taxes.
In addition, the recognition of ECL decreasing the fair-value of HTC&S debt securities positively impact the OCI reserve for EUR 0.2 million before taxes, as the fair value of the instruments has not changed.
Classification impact on BIL’s equity• Debt securities’ reclassifications due to the application of
the new business models impact the OCI reserve for EUR -7.4 million before taxes;
• Equities for which the Bank has elected the fair-value through OCI option lead to a transfer of EUR -20.4 million before taxes from retained earnings to OCI reserve;
• Open-ended funds initially classified in the IAS 39 AFS portfolio and now classified at fair-value through P&L bring to a transfer of EUR 0.9 million before taxes from the OCI reserve to retained earnings.
The overall classification impact on BIL’s equity is EUR -7.4 million before taxes of which EUR 20.8 million in retained earnings and EUR -28.2 million in the OCI reserve.
IFRS 9 ratio:The EU Parliament adopted, at the end of 2017, the amendment to the CRR allowing credit institutions to (partially) compensate the impact of the introduction of IFRS 9 on regulatory capital during the transitional period of 5 years (i.e., until 2022). The Bank decided not to apply such a phase-in alternative.
The IFRS 9 CET 1 ratio reached 12.79% as at January 1, 2018, after profit allocation.
3.4 Credit risk mitigation
3.4.1 Description of the main types of credit risk mitigants (CRM)
Basel regulation recognises three main types of CRM:• Collateral;• Guarantees and credit derivatives;• Netting agreements (applicable to on-balance sheet and
off-balance sheet netting agreements – see below).
Main types of collateral
Collateral is represented by financial products or physical assets used to hedge exposures. BIL group manages a wide range of collateral types. From a regulatory point of view, three main categories of collateral exist:
• Pledges of financial assets – cash, blocked accounts, term deposits, insurance contracts, bonds and equity portfolios;
• Pledges of real estate (residential mortgages, commercial mortgages);
• Pledges of commercial assets (e.g. transfer of receivables).
Main types of guarantee
Guarantees refer to personal guarantees, first demand guarantees and support commitments.
Main types of netting agreements
A netting agreement is a technique for mitigating credit risk. Banks have legally enforceable netting agreements for on-balance sheet exposures (loans and deposits) and off-balance sheet exposures (derivatives) for which they may calculate capital requirements on the basis of net credit exposures subject to specific regulatory conditions.

62 BIL – Pillar 3 Report 2017
Credit Risk
3.4.2 Policies and processes
Collateral and Guarantees/Credit Derivatives
Within BIL, managing the CRM involves the following tasks:• Analysis of the eligibility of all CRM under the standardised
and advanced approaches;• Collateral valuation in mark-to-market;• Description of all CRM characteristics in BIL group’s risk
systems, such as: - Mortgages – rank, amount and maturity; - Financial collateral – valuation frequency and holding
period; - Guarantees/credit derivatives – identification of the
guarantor, analysis of the legal mandatory conditions, check as to whether the credit derivative covers restructuring clauses;
- ecurity portfolio: description of each security.• Periodic review of the descriptive data.
At an operational level, different IT tools are used to manage collateral. These IT tools are used to record any relevant data needed to identify collateral characteristics, eligibility criteria and estimated value, in accordance with the Basel framework.
Main types of guarantor
Guarantees that BIL received are mostly given by bank counterparties. The Bank does not have credit derivatives exposures.
On- and off-balance sheet netting
BIL group does not make use of on- or off-balance sheet netting for regulatory purposes, except for over-the-counter (OTC) derivative products.
For these products, internal policies document the eligibility criteria and minimum requirements that netting agreements need to fulfil in order to be recognised for regulatory purposes under the Basel framework.
Appropriate internal procedures and minimum requirements have been implemented in the internal risk management process.
Information about market or credit risk concentrationsConcentration risk is related to a concentration of collateral in one issuer, country, industry or market. As a result, credit deterioration might have a significant impact on the overall value of collateral held by the Bank to mitigate its credit exposure.
An important part of the credit BIL portfolio is linked to the Luxembourgish real estate market. In order to mitigate this risk, most of its credit risk mitigants are linked to mortgage loans and leveraged loans (categorised as Lombard loans and investment lines of credit by BIL).
MortgagesAs a major Luxembourg-based bank, BIL makes a substantial contribution to the financing of local projects involving both residential and commercial real estate. As such, it is inevitably dependent on the effect Luxembourg's economic growth may have on the large amount of mortgages it takes as collateral for loans granted.
However, the Bank has strong governance and specific guidelines in place in order to adequately cover the risks involved in the granting of loans to its retail and corporate customers and to diversify the range of collateral it takes as a guarantee. This involves the approval of commitment/credit committees based on credit applications proposed by front officers, for which credit analysts give their opinion. This opinion takes into account the quality of the debtor through its rating, revenues, indebtedness level and repayment capacity, as well as the quality of the asset pledged as collateral for which a conservative loan-to-value ratio is assigned.
The Bank as well as the national regulator are well aware of this exposure and carefully monitor the concentration risk through regular reports and monitoring of limits on real estate exposure.
Financial collateralAmong its range of services to wealthy customers, the Bank proposes Lombard loans and investment lines of credit. These are granted against the pledge of eligible financial assets for which cover values are assigned by the Credit Risk team reflecting the quality, liquidity and volatility of the underlying collateral. As part of their contractual obligations and in order to limit the concentration risk within individual portfolios, customers using these kinds of facilities must not only maintain adequate cover values for their loans at all times, but are also required to comply with an obligation of diversification of their collateral portfolios.

63BIL – Pillar 3 Report 2017
Credit Risk
Exposure and collateral values are continuously monitored to ensure the proper application of these instructions, and margin calls or close-out procedures are enforced when the market value of collateral falls below a predefined trigger level.
3.4.3 Basel III treatment
BIL group recognises the mitigation impact of netting agreements (subject to eligibility conditions), by applying the netting effect of these agreements to the calculation of the EAD used to compute its risk weighted assets.
For guarantees and credit derivatives, BIL recognises the impact by substituting the PD, LGD and risk weight formula of the guarantor to those of the borrower (i.e. the exposure is considered to be directly to the guarantor) if the risk weight of the guarantor is lower than the risk weight of the borrower.
For collateral (both financial and physical), BIL methodology relating to eligible CRM is based on the Basel III approach.
Standardised exposuresEligible CRM (after regulatory haircuts) are directly taken into account when calculating the EAD (deduction).
A-IRB approach exposures – Two methodologies may be applied:
• CRM are incorporated into the calculation of the LGD based on internal loss data and A-IRB approach model calculations.
• CRM are not incorporated into the LGD computed by the model. The impact of each individual CRM is taken into account in the LGD according to each transaction.
3.4.4 Overview of credit risk mitigation techniques
In the application of Article 453 (f) and (g), this table provides an overview of the exposure value covered by Basel III-eligible CRM (after regulatory haircuts) and includes all collateral and financial guarantees used as credit risk mitigants for all secured exposures, irrespective of whether the standardised approach or IRB approach is used for RWA calculations. This table also includes the carrying amounts of the total population which are in default. Exposures unsecured (column a) represent the carrying amount of credit risk exposures (net of credit risk adjustments) that do not benefit from a credit risk mitigation technique, regardless of whether this technique is recognised in the CRR. Exposures secured (column b) represent the carrying amount of exposures that have at least one CRM mechanism (collateral, financial guarantees) associated with them.

64 BIL – Pillar 3 Report 2017
Credit Risk
In EUR million Exposures unsecured -
Carrying amount
Exposures secured -
Carrying amount
Exposures secured by collateral
Exposures secured by guarantees
Exposures secured by credit
derivatives
Total loans 7.026,40 8.242,82 7.810,53 432,28 -
Total debt securities 240,81 - - - -
Total exposures 0,01 0,01 0,01 0,00 -
Of which defaulted 138,09 278,07 278,07 - -
The Bank does not have any credit derivatives as credit risk mitigants.
3.5 Standardised approach
3.5.1 Introduction
As previously stated, BIL group uses the A-IRB approach to calculate its regulatory capital requirements. Nevertheless, the Bank applies the standardised approach for some portfolios corresponding to cases specifically authorised by regulation such as:
• Small business units with non-material exposures;• Portfolios without enough data to build a sound model;• Portfolios for which BIL has adopted a phased roll-out of
the A-IRB approach.As requested by the regulator, more than 85% of the exposures are treated under the A-IRB approach.
3.5.2 External credit assessment institutions
The standardised approach provides weighted risk figures based on external ratings given by External Credit Assessment Institutions (ECAI’s) as indicated in the CRR. In order to apply the standardised approach for risk weighted exposure, BIL group uses external ratings assigned by the following rating agencies: Standard & Poor’s and Moody’s.
The rating used for regulatory capital calculation is the lower of the two ratings. If no external rating is available, the standardised approach provides specific risk weights defined by the regulator (depending on the counterparty type).
Credit rating agencies and credit quality step under the standardised approach
Standard & Poor’s Moody’s Regulatory credit quality step
AAA to AA- Aaa to Aa3 1A+ to A- A1 to A3 2
BBB+ to BBB- Baa1 to Baa3 3BB+ to BB- Ba1 to Ba3 4
B+ to B- B1 to B3 5CCC+ and below Caa and below 6
Risk weights are mainly determined in relation to the credit quality step and the exposure class.
3.5.3 Standardised approach – Credit risk exposure and Credit Risk Mitigation effects
The following table shows credit risk exposure before credit conversion factor (CCF) and credit risk mitigation (CRM) and the exposure-at-default (EAD)1 broken down by exposure classes and a split in on- and off-balance sheet exposures, under the standardised approach.
Exposures subject to the counterparty credit risk (CCR) and securitisation risk framework are excluded from this template.
1 After CCF and CRM

65BIL – Pillar 3 Report 2017
Credit Risk
In EUR million Exposures before CCF and CRM
Exposures post CCF and CRM
RWAs and RWA density
Exposure classes On-balance-sheet amount
Off-balance-sheet amount
On-balance-sheet amount
Off-balance-sheet amount RWAs RWA density
Central governments or central banks 1.132,20 54,10 1.126,95 18,30 40,15 3,5%
Regional governments or local authorities 236,41 - 238,42 0,20 47,72 20,0%
Public sector entities 227,72 123,08 44,13 7,62 10,35 20,0%
Multilateral development banks 82,00 - 97,92 1,39 - 0,0%
International organisations 209,92 - 209,92 - - 0,0%
Institutions 14,20 0,34 14,20 0,09 5,21 36,5%
Corporates 1.535,77 755,39 855,96 152,38 999,11 99,1%
Retail 4,55 4,13 4,52 1,19 3,26 57,1%
Secured by mortgages on immovable property 354,35 2,11 352,09 0,97 298,29 84,5%
Exposures in default 18,36 0,30 18,36 0,06 20,74 112,6%
Items associated with particularly high risk 33,33 - 33,33 - 49,99 150,0%
Claims on institutions and corporates with a short-term credit assessment 0,14 - 0,14 - 0,07 50,0%
Equity exposures 12,77 - 12,77 - 31,78 248,8%
Other items 452,02 1,00 451,30 0,26 286,80 63,5%
Total 4.313,76 940,46 3.460,01 182,46 1.793,48 49,2%
TABLE EU CR4 - CREDIT RISK EXPOSURE AND CRM EFFECTS
3.5.4 Standardised approach – exposures by asset classes and risk weights
In the application of Article 444 (e), the following table shows the exposure-at-default post conversion factor and risk mitigation broken down by exposure classes and risk weights, under the standardised approach.
Exposures subject to the counterparty credit risk and securitisation risk framework are excluded from this template.
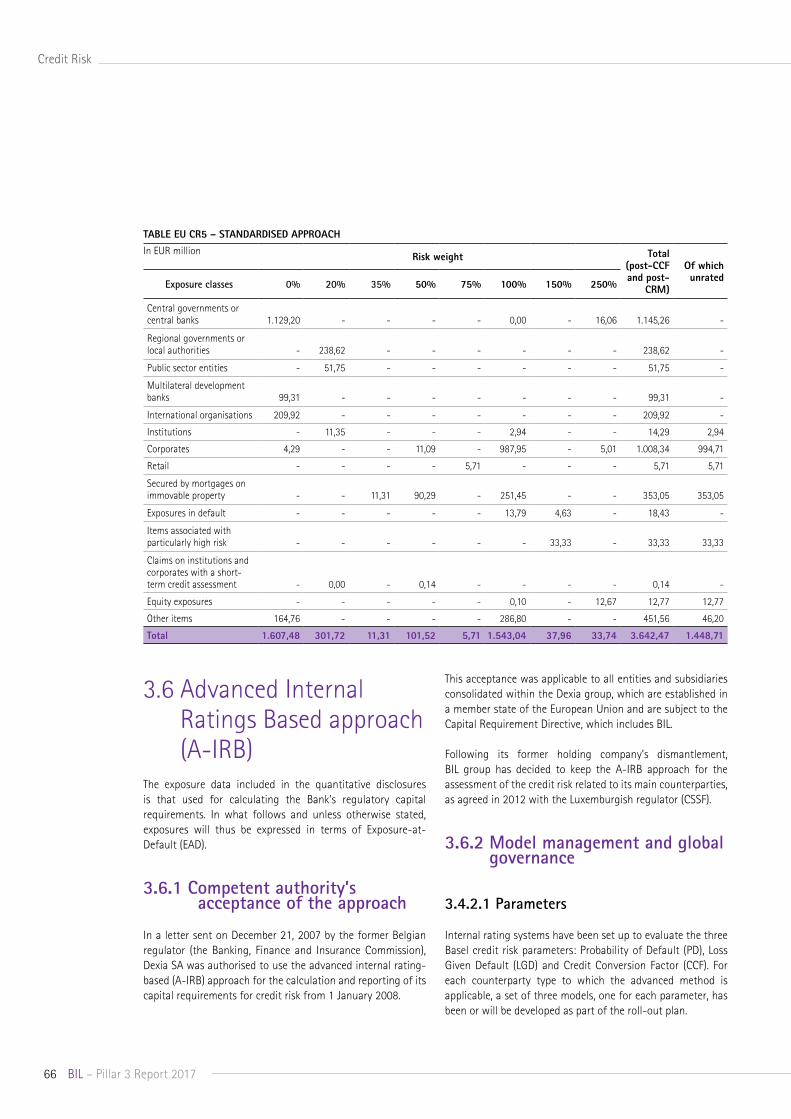
66 BIL – Pillar 3 Report 2017
Credit Risk
In EUR million Risk weight Total(post-CCFand post-
CRM)
Of which unrated
Exposure classes 0% 20% 35% 50% 75% 100% 150% 250%
Central governments or central banks 1.129,20 - - - - 0,00 - 16,06 1.145,26 -
Regional governments or local authorities - 238,62 - - - - - - 238,62 -
Public sector entities - 51,75 - - - - - - 51,75 -
Multilateral development banks
99,31 - - - - - - - 99,31 -
International organisations 209,92 - - - - - - - 209,92 -
Institutions - 11,35 - - - 2,94 - - 14,29 2,94
Corporates 4,29 - - 11,09 - 987,95 - 5,01 1.008,34 994,71
Retail - - - - 5,71 - - - 5,71 5,71
Secured by mortgages on immovable property - - 11,31 90,29 - 251,45 - - 353,05 353,05
Exposures in default - - - - - 13,79 4,63 - 18,43 -
Items associated with particularly high risk - - - - - - 33,33 - 33,33 33,33
Claims on institutions and corporates with a short-term credit assessment - 0,00 - 0,14 - - - - 0,14 -
Equity exposures - - - - - 0,10 - 12,67 12,77 12,77
Other items 164,76 - - - - 286,80 - - 451,56 46,20
Total 1.607,48 301,72 11,31 101,52 5,71 1.543,04 37,96 33,74 3.642,47 1.448,71
TABLE EU CR5 – STANDARDISED APPROACH
3.6 Advanced Internal Ratings Based approach (A-IRB)
The exposure data included in the quantitative disclosures is that used for calculating the Bank’s regulatory capital requirements. In what follows and unless otherwise stated, exposures will thus be expressed in terms of Exposure-at-Default (EAD).
3.6.1 C ompetent authority’s acceptance of the approach
In a letter sent on December 21, 2007 by the former Belgian regulator (the Banking, Finance and Insurance Commission), Dexia SA was authorised to use the advanced internal rating-based (A-IRB) approach for the calculation and reporting of its capital requirements for credit risk from 1 January 2008.
This acceptance was applicable to all entities and subsidiaries consolidated within the Dexia group, which are established in a member state of the European Union and are subject to the Capital Requirement Directive, which includes BIL.
Following its former holding company’s dismantlement, BIL group has decided to keep the A-IRB approach for the assessment of the credit risk related to its main counterparties, as agreed in 2012 with the Luxemburgish regulator (CSSF).
3.6.2 Model management and global governance
3.4.2.1 Parameters
Internal rating systems have been set up to evaluate the three Basel credit risk parameters: Probability of Default (PD), Loss Given Default (LGD) and Credit Conversion Factor (CCF). For each counterparty type to which the advanced method is applicable, a set of three models, one for each parameter, has been or will be developed as part of the roll-out plan.

67BIL – Pillar 3 Report 2017
Credit Risk
The PD models estimate the one-year probability of default of given obligors. Each model has its own rating scale and each rating on the scale corresponds to a probability of default used for regulatory and reporting purposes. The correspondence between the rating and PD for each scale is set during the calibration process, as part of the model development, and is reviewed and adjusted during the yearly backtesting, when applicable. The number of ratings on each scale depends on the characteristics of the underlying portfolio (the number of counterparties, their homogeneity, whether it is a low default portfolio or not) up to a maximum of 17 non-default classes. In addition, each scale has been attributed two internal default classes (named D1 and D2).
The LGD models estimate the ultimate loss incurred on a facility of a defaulting counterparty before taking the credit risk mitigants into account. The unsecured LGD depends on different factors such as the product type, the level of subordination or the rating of the counterparty.
CCF models estimate the portion of off-balance sheet commitments that would be drawn before a counterparty goes into default.
In addition to the calculation of the regulatory risk-weighted assets, internal estimates of Basel parameters are increasingly used within BIL group in the decision-making process, credit risk management and monitoring, as well as provisioning assessment.
3.6.2.2 Segmentation and principles used for estimating the PD, LGD and CCF
BIL group uses a wide range of models to estimate PD and LGD in respect of the following types of counterparty.
Segmentation
SovereignsThe scope of the model encompasses sovereign counterparties, defined as central governments, central banks and all debtors whose liabilities are guaranteed irrevocably and unconditionally by central governments or central banks.
In addition, in-depth analysis of some public sector counterparties shows that they share the same credit risk as the “master” counterparties to which they are assimilated (usually local authorities or sovereigns). They are consequently attributed the same PD and LGD as their “master” counterparties.
BanksThe scope of the model encompasses worldwide bank counterparties, defined as legal entities that have banking activities as their usual profession. Banking activities consist of the receipt of funds from the public, credit operations and putting these funds at customers’ disposal, or managing means of payment. Bank status requires a banking licence granted by the supervisory authority.
CorporatesTwo models have been designed for corporate and mid-corporate counterparties:
• CorporatesThe scope of the model encompasses worldwide corporate counterparties. BIL defines a corporate as a private or a publicly traded company with total annual revenue higher than 50 million (250 million if Belgium and Luxembourg companies) or belonging to a group with total annual revenue higher than 50 million that is not a bank, a financial institution, an insurer or a public/private satellite.
• Mid-corporatesThis model is approved in accordance with the A-IRB approach for mid-corporates from Belgium and Luxembourg. BIL defines a mid-corporate as a private company with total revenue lower than 50 million (250 million if Belgium and Luxembourg companies) and belonging to a group with consolidated total revenue lower than 50 million and with total assets higher than 2 million that is not a bank, a financial institution, an insurer or a public/private satellite.
Retail
• Retail – IndividualsThese models are applied to retail customers (individuals). Individuals are defined as retail counterparties not engaged in a self-employed activity or a liberal profession (i.e. doctors, lawyers, etc.) and are not linked to the activity of a legal entity.
• Retail – Small professionalsThese models are applied to small professional retail customers defined as individuals engaged in a self-employed activity or a liberal profession, or small companies generating revenue lower than a certain threshold (0.25 million).
• Retail – Small companiesThese models are applied to small companies that are defined as companies generating revenue higher than a certain threshold (0.25 million), but which are still considered as retail counterparties based on certain criteria

68 BIL – Pillar 3 Report 2017
Credit Risk
(i.e. not considered as mid-corporate or corporate counterparties). However, where these companies have a credit exposure higher than 1 million, they will be considered as non-retail counterparties from a regulatory reporting point of view.
Equity and securitisation transactionsNo internal model has been developed specifically for equity or securitisation transactions.
3.6.2.3 Model management process and internal governance
BIL has reviewed its internal model management process and internal governance in 2017 in order to allow the introduction, monitoring, maintenance and progressive development of the A-IRB framework in an adequate scaled and skilled way. This is reflected in a well-defined process, which is described below.
Credit Risk Control Unit
The Credit Risk Control Unit (CRCU), as the first line of defence of BIL, is an independent functional unit whose prime objective is to ensure the robustness of the Bank internal rating systems as part of the Model Risk Management scope.
The composition of the CRCU is formed from four units or teams of the BIL Risk Management Organisation: Modeling; Data Management & Quality; Risk Reporting; and Model Governance.
Pursuant to the Article 190 of CRR, the CRCU is responsible for the design, implementation, oversight, and the performance of all models, as defined within the Model Risk Management Framework of BIL group. It regularly produces and analyses reports on the output of the internal rating systems. The roles and responsibilities of each component of CRCU are as follow:
• Modeling Unit, which is in charge of the development and performance monitoring of the Basel III Pillar I approach and IFRS9 models for Credit Risk. In particular, this team: - Actively participates in the design or selection,
implementation and validation of models used in the rating process;
- Monitors model performance over time, and initiates model improvement requests;
- Executes back testing of the models and proposes first conclusions to the Internal Validation team;
- Regularly performs analysis of the risk parameters (e.g. distribution of exposures among rating classes, average probability of default, expected losses) of different asset class portfolio. Such analysis should be progressively refined to take into account of the changes in the internal rating system and the external environment;
- Ongoing reviews models used in the rating process; and - Documents and reports any changes to the rating process
including the reasons for the changes to the Internal Validation team and to the Model Risk Committee for approval.
• Data Management & Quality Unit, which is responsible for operational quality control and regulations for data and processes related to Basel risk parameters. In particular, this team: - Ensures that the data used by the models be accurate,
complete, appropriate, and consistent according to defined materiality threshold;
- Ensures models are used according to their respective model scope and the model user procedures;
- Issues and follows recommendation about the model usage; and
- Generates summary reports to the Rating Committee on the model usage.
• Model Governance Unit, which is in charge of overseeing compliance with the Model Risk Management Framework of the Bank. In particular, this team: - Oversees the governance of the CRCU by monitoring if
CRCU is performing in compliance with the Model Risk Management policies and procedures as well as any Applicable Laws or Regulations;
- Oversees models used in the rating process; - Co-operates with other teams or units to ensure a
complete set of documentation is maintained by the CRCU, including any changes to the rating process, criteria or individual rating parameters; and
- Implements the outsourcing policy regarding certain functions of CRCU as stated in the Article 190 (3) of CRR.
Internal Validation Unit
The Internal Validation team aims to ensure the robustness and soundness of the internal rating systems by validating all the BIL risk quantification models. The unit is responsible for independently verifying that models proposed for use by model owners are fit for purpose through the whole model lifecycle, and that the associated model risks are appropriately identified and mitigated. In order to do so, Internal Validation has explicit authority and independence to provide effective
69BIL – Pillar 3 Report 2017
Credit Risk
challenging to related stakeholders, presenting issues and highlighting deficiencies. The key aspects of models validated by the internal validation unit include model design, data quality, model implementation, and model performance.
Credit Risk Management Unit
The Credit Risk Management Unit (CRMU) is composed of four different teams: • The Banks & Countries, Private Banking Analyses team is
in charge of the assessment and the monitoring of the risk related to banks and sovereign counterparties on one side and private banking counterparties on the other side;
• The Retail, MidCorp, Real Estate Analyses team is in charge of retail and midcorp counterparties on one side and for the real estate specialised counterparties on the other side;
• The Corporate Analyses team is in charge of the assessment and the monitoring of the risk related to corporate and institutional counterparties, including providing support for complex files to the other teams;
• Gestion Intensive et Particulière (GIP) proactively manages assets deemed to be “sensitive” in order to minimize the potential losses for the Bank in case of the default of a counterparty.
The credit risk analysts are the main users of the IRS; they are responsible for the assessment and monitoring of credit risk. Specifically regarding the model management framework, CRMU is in charge of assessing the ratings of the Bank’s counterparties (i.e. PD) as well as their corresponding exposure facility type (i.e. LGD and CCF) and of documenting these results in the context of the loan approval process (i.e. mention on the “Fiche de Décision Crédit”).
As a key member of the Default Committee, this unit is actively involved in default decisions and monitoring.
Moreover, credit analysts bring qualitative input to the model development stage and during backtesting and stress testing exercises.
Audit
As part of its audit plan for the Bank, the Internal Audit function reviews whether the Bank's control systems for internal ratings and related parameters are sufficiently robust.
The main objective of the review is to ensure compliance with the legal and regulatory requirements related to the credit risk modelling framework and the effective assessment and management of all risks/weaknesses. In particular, internal
audit may review Credit Risk Control Unit activities, ensuring that the oversight process is properly managed.
3.6.2.4 Committees
Several committees have been designed to consolidate the credit risk model management framework and to provide adequate follow-up and decisions.
Model Risk Committee
The Model Risk Committee (MRC) manages all subject matter in relation with model and model risks including but not limited to: methodology, back-testing, validation, implementation, model change, model inventory and audit recommendations.
The scope of the Committee is further defined by the definition of models within BIL group (refer to the Model Risk Management Framework) and as such includes all risk quantification models. If necessary, it will also discuss other points such as significant variation in RWA.
The MRC should inform relevant stakeholders on a regular basis about: • The planning and result of the models performance
analysis (Backtesting, Benchmarking and Quality Control reviews and feedback from the model user);
• An analysis on the frequency, justification and monitoring of overrides that are applied to models throughout the group;
• The Validation, Audit and Supervisory reports on Modeling; • The current status of all open recommendations issued
by the Internal Validation team, Internal Audit or the Supervisors;
• The status of new model development or model improvements;
• Any discussions regarding the change requests (i.e. feasibility opinion/approval/development strategy proposition and tasks assigned to the requests); and
• The stress testing results regarding the credit portfolio.
The MRC has the authority to take decisions regarding: • Validation of model performance; • Initiation of new model development or model
improvement request; • Validation of the strategy regarding new model
development or model changes; • Validation of new model development or model update; • Model implementation acceptance.

70 BIL – Pillar 3 Report 2017
Credit Risk
Rating Committee
The objective of the Rating Committee is to discuss and make decisions about the following topics:
Rating methodology: The Committee has to validate any changes in the operational rating process in accordance with the rating methodology of the different IRS. Moreover, it has to be informed on the monitoring results regarding the adequacy of the counterparties segmentation within both management and internal rating systems (i.e. correlation between BLS segmentation and existing Internal Rating Systems).
Rating system framework: The Committee has to validate the Data Management & Quality (DMQ) IRS reports and has to be informed on the monitoring results of the Bank’s internal rating ratio.
Rating process reviews: The Committee has to review and validate, if needed, the overrides above 2 notches (rerating of a counterparty due to an atypical event or judgement of the analyst) of the counterparties.
The procedure to be followed for an override above 2 notches is: request to do an override by the analyst; transmission of the request via e-mail to the Rating Systems Quality Control who will communicate it either to the members of the Rating Committee by e-mail (in case of an Ad-hoc Committee) or will present it during the Rating Committee; validation or not by the Committee.
Activity follow-up: The Committee has to follow up and validate the status of the recommendations issued by the DMQ teams as well as the effective implementation of the corresponding action plans.
Risk Policy Sub-Committee
The Risk Policy Sub-Committee is responsible for the implementation and the maintenance of risk governance within the Bank. The Risk Policy Sub-Committee especially aims to ensure the comprehensiveness and the consistency of the policies and procedures related to model risk concerns. MRC informs the Risk Policy Sub-Committee on model development.
Default Committee
For BIL and its main subsidiaries and branches, this committee examines each case of default, classifies it (distinguishing between “true default” and “technical default”), assigns counterparties default level D1 or D2 according to general default indicators and parameters specific to each customer segment, and decides on the reclassification as a non-default counterparty.
Escalation Committee
Disagreements could appear when cases are discussed during the Model Risk Committee between Modeling Unit, Internal Validation team or Credit Risk Management Unit, leaving the case without decision. These cases are then submitted to Escalation Committee for final decision.
It takes final decision regarding topics for which no agreement has been found during the MRC.
3.6.2.5 Model management process
The lifecycle of a model can be summarised as follows:
Initialisation Stage
The initialisation stage is the preliminary phase for every model. The decision to develop a new model or to initiate a model change can be explained by: a new business development, new product, new risk factor or new regulatory framework; change in business opportunities and/or risk materiality; requirements
Initialisation stage
Methodolody & Model Design
Maintenance
ImplementationMonitoring
Dissemination
Use Phase
Design Phase
Implementation Phase

71BIL – Pillar 3 Report 2017
Credit Risk
for on-going improvement processes of the Bank’s Risk Management; inefficiency and/or irrelevancy of the previously implemented models; changes of the approach for calculating regulatory capital requirements; or improvement requests issued by regulators.
New model development requests are submitted to the MRC, which centralizes and documents the requests and decides on their relevancy.
Once the MRC has decided that a new model should be developed or reviewed, a pre-analysis is performed by the Model Developer with the support of the Model User.
Based on the results of this analysis, a strategy will be proposed by the Model Developer and submitted to the MRC. At this stage, a validation of the strategy is required.
Finally, the Model Risk Manager updates the Model Inventory according to the decisions made by the MRC and Internal Audit must be informed of MRC’s decision in case of development or change of a regulatory model.
Methodology and Model Design
The Model Developer is responsible for all model development activities consisting of methodology, design and prototype construction. The model choice is left to the discretion of the Model Developer.
However, the choice of the model structure must be clearly detailed and, in the case that more objective model forms are applicable, one must detail why a particular model has been rejected in favour of another.
During this stage, the Model Developer works closely with other actors such as: Model Data Manager, Model Risk Manager, Model User or Model Implementer or departments of the Bank such as: Credit Risk Management Unit and Debt Recovery Unit, in an iterative way.
Moreover, in case of the Pillar I model, the Model Developer will perform a self-assessment exercise to ensure it complies with regulatory requirements for IRBA as referred to in Section 6 of the CRR.
At the end of this stage, a model vetting review is performed prior to the effective and internal implementation of the new model. Model vetting consists of a detailed review of the model’s methodology, assumptions, as well as the data and the programs on which the model relies. This review is under
the responsibility of the Model Validator.
The Internal Audit assesses the model’s compliance with regulatory requirements and also reviews the Pillar I Self-Assessment performed by the Model Developer.
Based on the validation report, MRC approves the model methodology and agrees to change the status of the model from the Development phase to the Implementation phase.
Implementation
Once the methodology of the model has been validated, its technical implementation is performed. The technical implementation is based on a business requirement definition (BRD) which is defined by or under the responsibility of the Model Developer.
Approval of the Model implementation should be validated by the MRC based on test reports reviewed by the Model Validation team.
Dissemination
Model Use begins with the Model Dissemination phase, which consists of: deploying the model internally; defining or updating the reports and tools impacted by the Model; defining or updating the procedures of the Model User; defining or updating the policies related to the Model; performing the end-user training on the model’s methodology and the use of the new application.
Model Monitoring and Annual Review of Estimates
In order to ensure that the model provides the same level of performance over time, three types of controls are performed. The three types of controls are known as: quantitative validation, qualitative validation, and internal audit review and they are briefly described in the sections below:
Quantitative ValidationQuantitative validation of a model consists of performing a set of tests, which aim to monitor the consistency of the model’s output over time. Quantitative controls include, but are not limited to:• A representativeness analysis to identify potential difference
between dataset used to calibrate model and the current population to which the model is applied;
• A benchmarking analysis by comparing model outputs and estimates with other benchmarks;

72 BIL – Pillar 3 Report 2017
Credit Risk
• Back-testing exercises completed by comparing the expected model output with observed outcome over time;
• The stability of the inputs and the stability of the output’s population;
• An analysis of the predictive power of the model.Model Validation and Back Testing policies provide a detailed description of the controls to be applied during the quantitative validation.
Qualitative ValidationQualitative validation consists of the operational validation of the model. This function aims to ensure the reliability of the inputs involved in the modelling process. Qualitative validation includes ensuring that:• Documentation: procedures are in place, assumptions
are described, expert judgment is identified, models are registered in the inventory;
• Input Data and Model usage are aligned with model assumptions;
• Data are available and up-to-dated, missing data are limited, and data quality remains satisfactory;
• The methodology remains relevant with current market practices; and,
• The model’s technical implementation satisfies all current business;
• The model remains compliant with new or changed regulatory requirement.
The Model Validation Policy describes into details the controls to apply for the qualitative validation.
Internal Audit ReviewInternal Audit Review consists of assessing the model’s compliance with BIL’s internal business requirements and external regulatory requirements. It focuses on:• Model documentation and its adherence to BIL’s model
development lifecycle;• Model validation reports and its compliance with the Model
Validation Policy;• Model governance and its compliance with the Bank
expectations and applicable regulatory requirements (especially the independence of the validation function).
Those controls are discussed during the MRC and the Model monitoring can lead to the recalibration or the review of the methodology if the model is not aligned with expected levels of performance. In this case, the model status of the current version will move to the Maintenance Phase to allow for the development of a new version of the model.
Model Maintenance
Model Management is an iterative process which aims to ensure the consistency and the objectivity of risk assessment over time. The Maintenance Phase is the preparatory phase for managing model changes before starting a new cycle.
Improvements or updates could be triggered for existing models for various reasons: Lack of performance highlighted during the monitoring stage; Changes in the Bank’s business model in terms of risk policy, product or population; and/or, identified issues or gaps identified by Model User.
During the Maintenance Phase, the Model Risk Manager, with the support of the Model Developer, collects change requests and provides an opinion regarding the relevancy and the feasibility of each request.
The new model changes follow the same steps as those followed during the new model development (initialisation phase, methodology and model design, implementation and dissemination, and model monitoring).
In addition to the performance tests applied during the methodological and model design stages, an impact analysis is performed to assess the materiality of the model evolution and to inform internal and external stakeholders (i.e., internal management, regulators and other stakeholders…), as required.
Business integration of internal estimates
Internal estimates of Basel parameters are increasingly used within BIL group, and cover a large number of applications in addition to the calculation of the regulatory capital requirements. They are notably used in the following areas:
Decision-making processBasel III parameters are the key elements considered by the Credit Committee in assessing the opportunity to accept or reject a transaction. Basel II parameters are thus integrated into the credit files to assess credit proposals.
Credit risk management and monitoringBasel III parameters are actively used for the individual monitoring of distressed transactions and counterparties by the Default Committee.
The counterparty internal ratings, the LGD, the level of expected loss and the risk weighted assets are the key Basel II parameters used for internal reports or specific analysis, with the aim of improving credit risk management best practices.

73BIL – Pillar 3 Report 2017
Credit Risk
3.6.2.6 Model approval process
In the context of the Capital Requirement Regulation, the use of internal models for the assessment of the Risk Weighted Assets may require preliminary approval by the competent Authority before effective implementation of one of the following cases: • A new model is developed for a specific portfolio
(Methodology and Model Design);• An existing model is extended to a specific portfolio
(“Methodology and Model Design” or “Model Maintenance” stage of the Model Lifecycle);
• Changes are applied to an existing model covering a specific portfolio (“Model Maintenance” stage of the Model Lifecycle).
For the first case, the permission of the competent authority is systematically required.
However, in the two other cases, the Bank is required to apply for permission, whenever it intends to implement any material extension and change to its internal approaches for credit risk. The model changes are sorted into three categories: • Material changes and extensions need to be approved by the
Joint Supervisory Team (‘JST’) before their implementation; • Non-material changes and extensions, fulfilling a set of
qualitative and quantitative criteria, need to be notified to the JST at least two months before their implementation, but do not require an approval;
• Minor changes and extensions can be consolidated and notified to the Authority on an annual or quarterly basis.
The assessment of the materiality of the extensions or changes within the Internal Ratings Based Approach (‘IRBA’) relies on the Commission Delegated Regulation (EU) n°529/2014 and the Final Draft RTS on assessment methodology for IRBA. The assessment is also based on the ECB TRIM Guide which provides additional information on the interpretation and application of the existing legal framework.
The rules defined below represent the classification as a four step process of both quantitative and qualitative criteria regarding the assessment of the materiality:

74 BIL – Pillar 3 Report 2017
Credit Risk
STEP 1Impact on RWA over the first thresholds?
Ask for Approval before Implementation
Notification 2 months before implementation
Material change
Non- Material change
Non- Material change
Non- Material change
Non- Material change Yearly ex-post notification
STEP 2Fulfil qulitative criteria for material extension
or change?
Additional Stability Criteria?
Fulfil Stability Criteria?
STEP 3Fulfil qulitative criteria
for non-material extension or change?
STEP 4Impact on RWA over
the second thresholds?
The materiality is firstly assessed quantitatively:• Extensions or changes are considered as material when the
overall Risk Weighted Asset of BIL group decreases of more than 1.5% or when Risk Weighted Asset related to the range of application of a considered IRS decreases of more than 15%;
• Extensions or changes are considered as not material but should be notified before implementation when the Risk Weighted Asset related to the range of application of a considered IRS decreases of more than 5% and less than 15%;
• Other impacts on Risk Weighted Assets should be notified after implementation.
In addition to those quantitative criteria, qualitative criteria should also be considered to assess the materiality of changes and/or extensions of internal approaches.
In fact, if the first step concludes the RWA impacts are below the thresholds, then the Bank shall make a qualitative assessment of the model change as a second step. The qualitative criteria to be applied depends on the model change type: • Changes related to the range of application (such as
additional business unit, or new type of product);• Changes related to the methodology of rating systems
(such as changes in the default definition or in the rating methodology for IRB systems).
The materiality and the classification of changes and/or extensions are discussed during the MRC which states in which category the change should be classified. According to this, the appropriate communication stream with the regulatory authority is then applied.
3.6.3 Credit risk models performance
According to BIL credit risk model governance, the Modelling Unit includes an ongoing reviewing process which aims to control that the expected level of performance of the credit risk models is ensured over time. This control is performed on a yearly basis and regards all risk models under the scope of the A-IRB approach. This control consists in a backtesting. Its primary purpose is to ensure the adequacy of the regulatory capital of the Bank with the credit risks it is exposed to. Since the capital adequacy relies on internally estimated credit risk factors (i.e. PD, LGD and EAD), the Bank has to provide evidences that its risk assessment is accurate or at least sufficiently conservative.
A second purpose of backtesting is the evaluation of the predictive power of the rating system and its evolution overtime to early detect its reduced performance. Reduced performance of the rating system as decision making tool may expose the Bank to model risk by impacting the risk
NO
YES
YES
YES YES
NO
NO
YES
YES
NO
NO
Material change

75BIL – Pillar 3 Report 2017
Credit Risk
assessments of the defined risk buckets, and reduce the Bank’s profitability. The performance is tracked by analysing the ability to predict default and losses, to discriminate between high and low risks, and by analysing the stability of IRS results.
According to this, the backtesting consists mainly in comparing calibrated and actual levels of risk parameters.
Especially, the calibrated PD is compared to the observed default rates, and the estimated LGD to (1-loss recovery rate) for the part of the portfolio for which BIL has experienced default. Therefore, BIL has experienced a limited number of default for a part of its portfolio (i.e. Low Default Portfolio, LDP). This regards Sovereigns, Banks and Corporates segments. The performance assessment of the models related to the LDP relies on external data due to the absence or the insufficient number of experienced losses.
The results of the last backtestings have not highlighted major issues regarding the conservativeness of the calibrated levels of PD and LGD. Some weaknesses have been however identified during the previous exercises and the review of the related model is in progress.
The next table contains the obligor weighted average of the calibrated PD and the obligor weighted average of the actual default rates observed from 2011 to 2016. Default rate is computed according to the cohort principle as the ratio between the observed number of new defaults occurred during the considered period N and the number of non-defaulted obligors at the end of the previous period N-1. The date of reference of the cohort is end of June for Retail and Small corporate models, and end of December for the other models.
Retail and Small corporate PD model:The PD of the Retail and Small corporate rating model has been calibrated with internal experienced defaults. As a consequence, the resulting PD and default rates are very close over the considered period, especially for Retail model which relies on a large portfolio. The gaps between PD and DR for Small corporate is larger. However the Small corporate portfolio is smaller and the level of uncertainty of the estimate is higher. This gap reflects the conservative layer added to the PD to cover this uncertainty level. Nevertheless, the backtesting demonstrates that the calibration of PD is statistically conservative for both.
Corporate, Bank and Sovereign PD model:Due to the absence or the limited number of experienced default, the PD of the Corporate, Bank and Sovereign rating model has been calibrated with external data. Especially, it relies on default data provided by external rating agencies Moody’s and S&P. The performance of these PD models is assessed both
with internal default and external defaults. Internal rating scale is mapped with the rating scales of rating agencies and the calibrated PD are tested with default rates provided by these agencies. The results of the related backtest have demonstrated that the PD of these models is conservatively calibrated. It has been observed however some default rates higher than the calibrated PD, especially in 2012 for Corporate exposures. In fact, the default rate of corporate is higher than the PD while only two defaults have been observed in 2012. Despite these default rates higher than expected, the statistical tests of the backtestings have demonstrated that the PD are conservatively calibrated for the considered years and for the considered period anyway.
Mid-Corporate:During the backtest of 2013, the default rates have appeared durably higher than the PD. The PD of the Mid-corp rating model were originally calibrated with external data including mainly bankruptcies of Belgium corporates. Since the results of backtesting demonstrated that the PDs were not sufficiently calibrated, the PD scale has been recalibrated on the basis of internal experienced default. This new calibration has been in approved by the competent authority.

76 BIL – Pillar 3 Report 2017
Credit Risk
Cohort Years
Retail Smal Corp Mid Corp** Corporate Sovereign** Bank**
PD% DR% PD% DR% PD% DR% PD% DR% PD% DR% PD% DR%2011 0.60 0.57 8.58 5.70 7.86 2.24 0.87 0.00 0.96 0.00 1.01 0.002012 0.66 0.61 9.00 6.40 8.01 3.80 0.86 2.60 1.42 0.00 2.75 0.002013 0.67 0.66 9.01 6.77 5.79 2.80 0.49 0.00 1.42 0.00 1.50 0.002014 0.65 0.62 8.59 6.80 7.06 2.15 0.62 0.002015 0.67 0.68 8.55 5.60 6.03 2.34 0.73 0.002016 0.69 0.69 8.02 5.92
Average 0.64 0.58 8.24 5.74 6.94 2.70 0.71 0.40 2.53 0.73 1.45 0.24Cohort Period 2004-2016 2006-2016 2008-2015 2009-2015 2004-2013 2007-2013
The following table shows the average PD and average default rates, as follows:
The following table contains the average of the calibrated LGD and the average of the loss rates for the retail and small & middle corporates as reported in the backtesting. Loss rate is computed as the ratio between the not recovered part of defaulted exposures and the total amount of the defaulted exposures. This table reports closed defaults, i.e. the default files for which the recovery process is closed. Backtesting results have not highlighted calibration weaknesses. The loss rates are globally lower than the calibrated level of LGD for both and the LGD levels are considered as conservative enough.
Due to the limited number of experienced default for Sovereign, Bank and Corporate exposures, the comparison between LGD and loss rate cannot be performed. The calibration backtesting for these types of exposure relies on external loss data. The backtesting results have not highlighted conservativeness issues regarding the calibration of the LGD. However, some improvements have been requested and submitted to the competent authority in order to address some weaknesses regarding the Bank LGD model features.
YearsRetail Smal & Mid Corp
LGD% LR% LGD% LR%2011 13.52 7.02 23.09 2.002012 14.23 6.63 13.60 7.902013 13.54 5.51 30.70 1.602014 10.69 3.75 20.50 0.702015 7.92 2.80 20.70 0.102016 5.02 1.48
Average 16.17 9.50 10.75 6.68Period 2007-2016 2000-2015
3.6.4 Credit risk exposures by exposure class and PD range
In the application of Article 452 (d-g) in the CRR, the following tables provide the main parameters used for the calculation of capital requirements for IRB models and show the exposure classes according to PD grades.
Table EU CR6 - Qualitative disclosure requirements related to IRB models

77BIL – Pillar 3 Report 2017
Credit Risk
PD s
cale
Orig
inal
on
-bal
ance
-sh
eet
gros
s ex
posu
res
Off
-ba-
lanc
e-sh
eet
expo
sure
s pr
e-CC
F
Aver
age
CCF
EAD
post
CR
M a
nd
post
CCF
Aver
age
PDN
umbe
r of
ob
ligat
ors
Aver
age
LGD
Aver
age
mat
urity
RWAs
RWA
dens
ityEL
Valu
e ad
just
men
ts
and
prov
isio
ns
Cent
ral
Gove
rnm
ents
an
d Ce
ntra
l Ba
nks
0.00
to <
0.15
5.5
46,3
9 1
09,3
4 99
,54%
6.2
16,2
5 0,
01%
85
7,91
% 3
,02
111
,70
1,80
% 0
,08
-
0.15
to <
0.25
7,1
0 -
10
0,00
% 7
,10
0,18
% 1
25
,00%
5,0
0 2
,67
37,5
7% 0
,00
-
0.25
to <
0.50
269
,42
-
100,
00%
327
,94
0,34
% 1
45
,00%
4,8
2 2
87,5
6 87
,69%
0,5
0 -
0.50
to <
0.75
0,0
0 -
10
0,00
% 0
,00
0,71
% 1
35
,00%
1,0
0 0
,00
51,5
6% 0
,00
-
0.75
to <
2.50
-
-
-
-
-
-
-
-
-
-
-
-
2.50
to <
10.0
0 -
-
-
-
-
-
-
-
-
-
-
-
10.0
0 to
< 1
00.0
0 0
,01
-
100,
00%
0,0
1 30
,87%
2
9,40
% 4
,52
0,0
1 59
,21%
0,0
0 -
100
(Def
ault)
-
-
-
-
-
-
-
-
-
-
-
-
SUBT
OTA
L 5
.822
,92
109
,34
99,5
6% 6
.551
,31
0,02
% 9
0 9,
78%
3,1
1 4
01,9
3 6,
14%
0,5
8 -
PD s
cale
Orig
inal
on
-bal
ance
-sh
eet
gros
s ex
posu
res
Off
-ba-
lanc
e-sh
eet
expo
sure
s pr
e-CC
F
Aver
age
CCF
EAD
post
CR
M a
nd
post
CCF
Aver
age
PDN
umbe
r of
ob
ligat
ors
Aver
age
LGD
Aver
age
mat
urity
RWAs
RWA
dens
ityEL
Valu
e ad
just
men
ts
and
prov
isio
ns
Inst
itutio
ns0.
00 to
<0.
15 1
.363
,11
121
,98
98,7
2% 1
.471
,06
0,05
% 9
4 9,
10%
3,0
3 1
67,5
9 11
,39%
0,1
4 -
0.15
to <
0.25
93,
37
0,3
7 99
,96%
93,
61
0,18
% 9
19
,05%
3,3
8 1
2,94
13
,82%
0,0
2 -
0.25
to <
0.50
166
,01
0,0
2 99
,90%
5,1
2 0,
34%
7
38,2
7% 1
,03
3,1
9 62
,37%
0,0
1 -
0.50
to <
0.75
26,
29
0,0
2 99
,98%
26,
30
0,71
% 2
0,
00%
2,4
6 2
,79
10,6
0% 0
,01
-
0.75
to <
2.50
-
-
-
-
-
-
-
-
-
-
-
2.50
to <
10.0
0 0
,17
0,9
1 73
,29%
0,2
6 3,
95%
1
40,7
2% 1
,00
0,3
0 11
5,88
% 0
,00
-
10.0
0 to
< 1
00.0
0 3
0,80
8
,19
86,7
3% 5
,19
30,8
7% 6
4 44
,71%
1,11
1
3,97
26
9,36
% 0
,71
-
100
(Def
ault)
-
-
-
-
-
-
-
-
-
-
-
SUBT
OTA
L 1
.679
,75
131
,49
98,7
8% 1
.601
,53
0,17
% 1
77
10,4
9% 3
,03
200
,78
12,5
4% 0
,90
-
TABL
E EU
CR6
- Q
UALI
TATI
VE D
ISCL
OSU
RE R
EQUI
REM
ENTS
REL
ATED
TO
IRB
MO
DELS

78 BIL – Pillar 3 Report 2017
Credit Risk
PD s
cale
Orig
inal
on
-bal
ance
-sh
eet
gros
s ex
posu
res
Off
-ba-
lanc
e-sh
eet
expo
sure
s pr
e-CC
F
Aver
age
CCF
EAD
post
CR
M a
nd
post
CCF
Aver
age
PDN
umbe
r of
ob
ligat
ors
Aver
age
LGD
Aver
age
mat
urity
RWAs
RWA
dens
ityEL
Valu
e ad
just
men
ts
and
prov
isio
ns
Corp
orat
es
- SM
E0.
00 to
<0.
15 -
-
-
-
-
-
-
-
-
-
-
-
0.15
to <
0.25
20,
20
-
100,
00%
20,
20
0,18
% 1
43
,31%
3,1
8 8
,48
41,9
9% 0
,02
-
0.25
to <
0.50
-
-
-
-
-
-
-
-
-
-
-
-
0.50
to <
0.75
5,2
8 3
8,29
81
,16%
31,
88
0,61
% 1
2 21
,22%
3,2
3 1
1,49
36
,05%
0,0
4 -
0.75
to <
2.50
691
,76
408
,55
93,0
8% 7
95,0
3 1,
60%
619
4,
87%
3,4
3 8
9,54
11
,26%
0,5
9 -
2.50
to <
10.0
0 4
73,9
1 3
05,2
7 92
,61%
556
,10
4,79
% 2
97
4,17
% 3
,02
64,
97
11,6
8% 1
,05
-
10.0
0 to
< 1
00.0
0 1
28,2
6 7
3,18
93
,61%
155
,78
22,2
6% 1
35
5,14
% 2
,75
34,
03
21,8
4% 1
,82
-
100
(Def
ault)
150
,85
13,
24
0,9
8 1
57,11
10
0,00
% 5
6 4,
61%
1,9
5 0
,96
0,61
% 7
,25
41,
74
SUBT
OTA
L 1
.470
,26
838
,53
93,3
1% 1
.716
,10
13,4
8% 1
.120
5,
40%
3,0
9 2
09,4
8 12
,21%
10,
77
41,
74
PD s
cale
Orig
inal
on
-bal
ance
-sh
eet
gros
s ex
posu
res
Off
-ba-
lanc
e-sh
eet
expo
sure
s pr
e-CC
F
Aver
age
CCF
EAD
post
CR
M a
nd
post
CCF
Aver
age
PDN
umbe
r of
ob
ligat
ors
Aver
age
LGD
Aver
age
mat
urity
RWAs
RWA
dens
ityEL
Valu
e ad
just
men
ts
and
prov
isio
ns
Corp
orat
es
- O
ther
0.00
to <
0.15
348
,10
92,
48
97,8
1% 4
45,7
9 0,
05%
22
32,7
1% 2
,76
73,
74
16,5
4% 0
,07
-
0.15
to <
0.25
308
,84
35,
61
98,4
5% 3
17,2
3 0,
18%
18
35,8
0% 3
,29
143
,16
45,1
3% 0
,20
-
0.25
to <
0.50
361
,72
32,
10
98,9
4% 3
67,4
6 0,
34%
24
45,9
8% 3
,94
292
,94
79,7
2% 0
,57
-
0.50
to <
0.75
350
,43
86,
09
97,7
6% 3
61,8
7 0,
71%
27
46,8
3% 2
,72
355
,81
98,3
3% 1
,21
-
0.75
to <
2.50
204
,38
175
,20
90,3
9% 2
46,9
8 1,
15%
52
33,6
7% 3
,07
193
,38
78,3
0% 0
,86
-
2.50
to <
10.0
0 1
33,2
0 1
25,2
0 87
,10%
177
,72
3,64
% 5
2 40
,61%
1,9
5 2
10,6
0 11
8,51
% 2
,31
-
10.0
0 to
< 1
00.0
0 3
8,70
5
,32
82,8
0% 5
,45
21,8
1% 1
7 17
,29%
1,7
7 9
,18
168,
37%
0,4
5 -
100
(Def
ault)
1,0
2 -
10
0,00
% 1
,02
100,
00%
1
63,9
3% 1
,00
-
0,00
% 0
,65
-
SUBT
OTA
L 1
.746
,39
551
,99
96,1
4% 1
.923
,51
0,84
% 2
13
39,8
6% 3
,03
1.2
78,8
2 66
,48%
6,3
2 -

79BIL – Pillar 3 Report 2017
Credit RiskPD
sca
leO
rigin
al
on-b
alan
ce-
shee
t gr
oss
expo
sure
s
Off
-ba-
lanc
e-sh
eet
expo
sure
s pr
e-CC
F
Aver
age
CCF
EAD
post
CR
M a
nd
post
CCF
Aver
age
PDN
umbe
r of
ob
ligat
ors
Aver
age
LGD
Aver
age
mat
urity
RWAs
RWA
dens
ityEL
Valu
e ad
just
men
ts
and
prov
isio
ns
Reta
il -
Secu
red
by
imm
ovab
le
prop
erty
SM
E
0.00
to <
0.15
-
-
-
-
-
-
-
-
-
-
-
-
0.15
to <
0.25
0,1
6 0
,01
100,
00%
0,1
7 0,
23%
1
10,0
0% -
0
,01
4,72
% -
-
0.25
to <
0.50
-
-
-
-
-
-
-
-
-
-
-
-
0.50
to <
0.75
15,
46
1,4
0 99
,76%
16,
81
0,59
% 5
2 12
,14%
-
1,7
9 10
,66%
93,
82
-
0.75
to <
2.50
45,
52
5,3
5 97
,84%
47,
74
1,65
% 1
59
11,3
6% -
7
,32
15,3
3% 4
76,9
5 -
2.50
to <
10.0
0 5
2,16
4
,68
99,0
5% 5
5,14
4,
44%
183
11
,77%
-
13,
04
23,6
4% 5
.327
,64
-
10.0
0 to
< 1
00.0
0 6
1,47
2
,80
99,3
4% 6
2,96
23
,50%
205
11
,68%
-
24,
41
38,7
6% 2
0.95
1,89
-
100
(Def
ault)
8,2
8 0
,08
99,9
7% 8
,35
100,
00%
48
0,07
% -
2
,59
30,9
7% 5
.629
,74
1,9
3
SUBT
OTA
L 1
83,0
6 1
4,30
98
,95%
191
,18
13,8
5% 6
48
11,1
6% -
4
9,15
25
,71%
32.
480,
03
1,9
3
PD s
cale
Orig
inal
on
-bal
ance
-sh
eet
gros
s ex
posu
res
Off
-ba-
lanc
e-sh
eet
expo
sure
s pr
e-CC
F
Aver
age
CCF
EAD
post
CR
M a
nd
post
CCF
Aver
age
PDN
umbe
r of
ob
ligat
ors
Aver
age
LGD
Aver
age
mat
urity
RWAs
RWA
dens
ityEL
Valu
e ad
just
men
ts
and
prov
isio
ns
Reta
il -
Secu
red
by
imm
ovab
le
prop
erty
no
n-SM
E
0.00
to <
0.15
1.0
33,3
2 8
2,91
99
,95%
1.11
5,58
0,
10%
5.2
24
10,6
0% -
2
9,20
2,
62%
0,0
0 -
0.15
to <
0.25
126
,71
14,
46
99,9
3% 1
41,0
6 0,
23%
317
10
,68%
-
7,1
6 5,
08%
0,0
0 -
0.25
to <
0.50
911
,31
43,
86
99,9
8% 9
55,0
0 0,
34%
3.2
19
10,5
5% -
6
3,12
6,
61%
0,0
0 -
0.50
to <
0.75
1.2
16,9
0 7
4,67
99
,90%
1.2
90,0
8 0,
65%
3.6
18
10,6
2% -
1
33,3
5 10
,34%
0,0
1 -
0.75
to <
2.50
642
,74
34,
68
99,8
9% 6
76,5
8 1,
95%
1.6
16
10,8
3% -
1
35,2
3 19
,99%
0,0
4 -
2.50
to <
10.0
0 1
.064
,91
65,
47
99,8
0% 1
.127
,83
4,80
% 2
.091
10
,94%
-
304
,54
27,0
0% 0
,08
-
10.0
0 to
< 1
00.0
0 3
78,5
0 1
5,20
99
,82%
392
,89
18,2
2% 9
02
10,8
6% -
1
93,4
4 49
,23%
0,11
-
100
(Def
ault)
197
,07
5,9
8 99
,82%
202
,63
100,
00%
376
0,
25%
-
126
,64
62,5
0% 0
,50
23,
41
SUBT
OTA
L 5
.571
,45
337
,24
99,9
0% 5
.901
,65
6,01
% 1
7.36
3 10
,35%
-
992
,68
16,8
2% 0
,75
23,
41

80 BIL – Pillar 3 Report 2017
Credit Risk
PD s
cale
Orig
inal
on
-bal
ance
-sh
eet
gros
s ex
posu
res
Off
-ba-
lanc
e-sh
eet
expo
sure
s pr
e-CC
F
Aver
age
CCF
EAD
post
CR
M a
nd
post
CCF
Aver
age
PDN
umbe
r of
ob
ligat
ors
Aver
age
LGD
Aver
age
mat
urity
RWAs
RWA
dens
ityEL
Valu
e ad
just
men
ts
and
prov
isio
ns
Reta
il -
O
ther
SM
E0.
00 to
<0.
15 0
,05
0,0
6 10
0,00
% 0
,11
0,06
% 1
6 17
,20%
-
0,0
0 2,
82%
0,0
0 -
0.15
to <
0.25
2,11
1
,51
99,8
4% 3
,62
0,23
% 2
68
16,9
6% -
0
,26
7,31
% 0
,00
-
0.25
to <
0.50
-
-
-
-
-
-
-
-
-
-
-
-
0.50
to <
0.75
15,
89
9,9
7 99
,22%
24,
01
0,62
% 1
.094
13
,09%
-
2,4
3 10
,13%
0,0
2 -
0.75
to <
2.50
58,
05
42,
81
91,3
2% 7
5,23
1,
66%
1.5
44
12,0
1% -
1
0,14
13
,47%
0,1
5 -
2.50
to <
10.0
0 4
3,39
2
5,82
93
,45%
54,
94
4,93
% 1
.239
12
,81%
-
9,7
9 17
,82%
0,3
4 -
10.0
0 to
< 1
00.0
0 6
0,24
2
0,02
96
,09%
68,
76
24,4
5% 1
.250
12
,52%
-
17,
78
25,8
5% 2
,07
-
100
(Def
ault)
21,
63
1,4
1 99
,49%
22,
17
100,
00%
578
17
,05%
-
7,8
0 35
,19%
3,7
8 1
3,87
SUBT
OTA
L 2
01,3
7 1
01,6
1 94
,73%
248
,85
17,3
2% 5
.989
12
,96%
-
48,
20
19,3
7% 6
,36
13,
87
PD s
cale
Orig
inal
on
-bal
ance
-sh
eet
gros
s ex
posu
res
Off
-ba-
lanc
e-sh
eet
expo
sure
s pr
e-CC
F
Aver
age
CCF
EAD
post
CR
M a
nd
post
CCF
Aver
age
PDN
umbe
r of
ob
ligat
ors
Aver
age
LGD
Aver
age
mat
urity
RWAs
RWA
dens
ityEL
Valu
e ad
just
men
ts
and
prov
isio
ns
Reta
il -
O
ther
no
n-SM
E
0.00
to <
0.15
352
,06
193
,07
99,0
1% 5
26,8
1 0,
09%
32.
644
15,0
0% -
2
2,94
4,
35%
0,0
8 -
0.15
to <
0.25
21,
61
16,
79
98,2
1% 3
7,35
0,
23%
1.0
92
11,0
4% -
2
,31
6,20
% 0
,01
-
0.25
to <
0.50
307
,24
75,
11
99,2
2% 3
77,7
4 0,
34%
13.
812
11,11
% -
2
8,14
7,
45%
0,1
4 -
0.50
to <
0.75
268
,82
58,
08
99,2
8% 3
21,1
0 0,
64%
9.8
42
19,2
3% -
6
2,99
19
,62%
0,4
0 -
0.75
to <
2.50
439
,02
138
,99
97,5
9% 5
34,5
7 2,
03%
5.2
67
16,6
9% -
1
34,0
4 25
,07%
1,8
4 -
2.50
to <
10.0
0 7
41,11
9
4,84
99
,21%
816
,37
4,68
% 8
.494
13
,44%
-
188
,33
23,0
7% 5
,21
-
10.0
0 to
< 1
00.0
0 7
8,90
1
9,99
99
,21%
96,
38
17,7
1% 2
.875
17
,50%
-
42,
89
44,5
1% 3
,11
-
100
(Def
ault)
218
,96
7,3
0 99
,69%
224
,94
100,
00%
2.5
36
22,2
4% -
1
40,5
9 62
,50%
50,
03
91,
64
SUBT
OTA
L 2
.427
,73
604
,17
98,9
1% 2
.935
,26
10,0
5% 7
6.56
2 15
,42%
-
622
,23
21,2
0% 6
0,82
9
1,64

81BIL – Pillar 3 Report 2017
Credit RiskPD
sca
leO
rigin
al
on-b
alan
ce-
shee
t gr
oss
expo
sure
s
Off
-ba-
lanc
e-sh
eet
expo
sure
s pr
e-CC
F
Aver
age
CCF
EAD
post
CR
M a
nd
post
CCF
Aver
age
PDN
umbe
r of
ob
ligat
ors
Aver
age
LGD
Aver
age
mat
urity
RWAs
RWA
dens
ityEL
Valu
e ad
just
men
ts
and
prov
isio
ns
Equi
ty -
PD
/LGD
AP
PRO
ACH
0.00
to <
0.15
-
-
-
-
-
-
-
-
-
-
-
-
0.15
to <
0.25
-
-
-
-
-
-
-
-
-
-
-
-
0.25
to <
0.50
-
-
-
-
-
-
-
-
-
-
-
-
0.50
to <
0.75
-
-
-
-
-
-
-
-
-
-
-
-
0.75
to <
2.50
-
-
-
-
-
-
-
-
-
-
-
-
2.50
to <
10.0
0 -
-
-
-
-
-
-
-
-
-
-
-
10.0
0 to
< 1
00.0
0 0
,00
-
100,
00%
0,0
0 27
,04%
5
90,0
0% 5
,00
0,0
1 65
9,71
% 0
,00
-
100
(Def
ault)
-
-
-
-
-
-
-
-
-
-
-
-
SUBT
OTA
L 0
,00
-
100,
00%
0,0
0 27
,04%
5
90,0
0% 5
,00
0,0
1 6
,60
0,0
0 -
Orig
inal
on
-bal
ance
-sh
eet
gros
s ex
posu
res
Off
-ba-
lanc
e-sh
eet
expo
sure
s pr
e-CC
F
Aver
age
CCF
EAD
post
CR
M a
nd
post
CCF
Aver
age
PDN
umbe
r of
ob
ligat
ors
Aver
age
LGD
Aver
age
mat
urity
RWAs
RWA
dens
ityEL
Valu
e ad
just
men
ts
and
prov
isio
ns
Equi
ty -
Sim
ple
Risk
W
eigh
t Ap
proa
ch6,
0204
9188
9 -
6,02
0491
889
0,09
2332
25
3,77
1218
622
PD s
cale
Orig
inal
on
-bal
ance
-sh
eet
gros
s ex
posu
res
Off
-ba-
lanc
e-sh
eet
expo
sure
s pr
e-CC
F
Aver
age
CCF
EAD
post
CR
M a
nd
post
CCF
Aver
age
PDN
umbe
r of
ob
ligat
ors
Aver
age
LGD
Aver
age
mat
urity
RWAs
RWA
dens
ityEL
Valu
e ad
just
men
ts
and
prov
isio
ns
Oth
er
item
s0.
00 to
<0.
15 2
,24
-
100,
00%
2,2
4 0,
00%
12
7,48
% 1
,00
-
-
-
-
0.15
to <
0.25
-
-
-
-
-
-
-
-
-
-
-
-
0.25
to <
0.50
-
-
-
-
-
-
-
-
-
-
-
-
0.50
to <
0.75
-
-
-
-
-
-
-
-
-
-
-
-
0.75
to <
2.50
0,0
0 -
10
0,00
% 0
,00
0,88
% 1
40
,00%
1,0
0 -
-
-
-
2.50
to <
10.0
0 -
-
-
-
-
-
-
-
-
-
-
-
10.0
0 to
< 1
00.0
0 1
,27
-
100,
00%
1,2
7 30
,87%
16
7,01
% 1
,00
-
-
-
-
100
(Def
ault)
-
-
-
-
-
-
-
-
-
-
-
-
SUBT
OTA
L 3
,52
-
100,
00%
3,5
2 11
,16%
29
7,33
% 1
,00
-
-
-
-

82 BIL – Pillar 3 Report 2017
Credit Risk
3.6.5 RWA flow statements of credit risk exposures under the IRB approach
In the application of Article 438 (d), the following table provides a flow statement explaining variations in the credit RWAs between year-end 2016 and 2017, excluding counterparty credit risk.
The main variation over the period is explained by updates in the Bank’s internal models.
TABLE EU CR8 - RWA FLOW STATEMENTS OF CREDIT RISK EXPOSURES UNDER THE IRB APPROACH
In EUR million RWA amounts
Capital requirements
At 31 December 2016 3,191.40 255.31
Asset size 164.40 13.15
Asset quality 67.43 5.39
Model updates 455.61 36.45
Methodology and policy - -
Acquisitions and disposals - -
Foreign exchange movements -59.15 -4.73
Other - -
At 31 December 2017 3,819.68 305.57
3.7 Counterparty credit risk
3.7.1 Management of counterparty risk
A counterparty risk attached to derivatives exists in all over-the-counter (OTC) transactions such as interest rate swaps, foreign exchange swaps, inflation or commodity swaps and credit default swaps.
All OTC transactions are monitored within the credit limits that are set up for each individual counterparty, and are subject to the general delegation rules. Sub-limits may be put in place for each type of product. Credit limits granted to Banking counterparties are first analysed by the credit risk Banks & Countries analysis team and then proposed to the Board committee for decision. These limits are annually reviewed by the Board committee.
Derivatives transactions, repo/reverse repos and securities lending are traded with counterparties with whom BIL has collateral agreement (respectively ISDA/CSA, GMRA, and GMSLA). These trades are daily revaluated (MtM) which leads to margin calls or to margin delivery from or to the counterparty according to the advantage or disadvantage for the Bank of the deals Marked-to-Market included in the ISDA/CSA contract.
Currently, exchanged collateral is cash. Within EMIR regulation, it is forecasted to treat non-cash collateral. This will be taken into account in the collateral management rules.
In order to reduce counterparty risk, OTC derivatives are in most cases concluded under a master agreement (i.e. the International Swap and Derivative Association – ISDA) taking account of the general rules and procedures set out in the credit risk policies of the Bank. Collateral postings for derivative contracts are regulated by the terms and rules stipulated in the Credit Support Annex (CSA) negotiated with the counterparty. The CSA to master agreements provides for rating dependent triggers (called threshold), where addition collateral has to be pledged if a party’s rating is downgraded. The impact of potential downgrades is managed by the Bank.
Nevertheless, in 2016, BIL’s threshold was not dependent of the credit rating. In consequence, there was no impact due to a credit rating downgrade on the collateral amount.

83BIL – Pillar 3 Report 2017
Credit Risk
In EUR million NotionalReplacement cost/current
market value
Potential future credit
exposureEEPE Multiplier EAD p
ost CRM RWAs
Mark to market 130.43 95.71 226.13 40.05
Original exposure
Standardised approach
IMM (for derivatives and SFTs)
Of which securities financing transactions
Of which derivatives and long settlement transactions
Of whichfrom contractual cross-product netting
Financial collateral simple method (for SFTs)
Financial collateral comprehensive method (for SFTs)
VaR for SFTs
Total
3.7.2 Analysis of CCR exposures by model approach
In the application of Article 439 (f) in the CRR, the following table shows the methods used for calculating the regulatory requirements for CCR exposure including the main parameters for each method. Exposures relevant for credit valuation adjustment (CVA) charges and exposures cleared through a central counterparty (CCP) are excluded but are presented separately in the following tables.
As displayed, the Bank uses the mark-to-market methods to measure the exposure value of instruments subject to capital requirements for CCR.
3.7.3 CVA capital charge
In the application of Article 439 (f) in the CRR, the following table provides the exposure value and risk exposure amount of transactions subject to capital requirements for credit valuation adjustment. The standardised approach is used to calculate the CVA capital charge.
TABLE EU CCR1 - ANALYSIS OF CCR EXPOSURE BY APPROACH
TABLE EU CCR2 - CVA CAPITAL CHARGE
In EUR million Exposure value RWAs
Total portfolios subject to the advanced method - -
(i) VaR component (including the 3x multiplier) - -
(ii) SVaR component (including the 3x multiplier) - -
All portfolios subject to the standardised method 133.83 25.59
Based on the original exposure method - -
Total subject to the CVA capital charge 133.83 48.00

84 BIL – Pillar 3 Report 2017
Credit Risk
3.7.4 Exposures to CCP
The table below presents an overview of exposures and capital requirements to central counterparties arising from transactions, margins and contributions to default funds
In EUR million EAD post CRM RWAs
Exposures to QCCPs (total) 28,86 1,15
Exposures for trades at QCCPs (excluding initial margin and default fund contributions); of which 28,86 1,15
(i) OTC derivatives 28,86 1,15
(ii) Exchange-traded derivatives - -
(iii) SFTS - -
(iv) Netting sets where cross-product netting has been approved - -
Segregated initial margin - -
Non-segregated initial margin - -
Prefunded defaut fund contributions - -
Alternative calculation of own funds requirements for exposures - -
Exposures to non-QCCPs (total) 1.116,91 10,89 Exposures for trades at non-QCCPs (excluding initial margin and default fund contributions); of which 1.116,91 10,89
(i) OTC derivatives - -
(ii) Exchange-traded derivatives - -
(iii) SFTS 1.116,91 10,89
(iv) Netting sets where cross-product netting has been approved - -
Segregated initial margin - -
Non-segregated initial margin - -
Prefunded defaut fund contributions - -
Unfunded defaut fund contributions - -
TABLE EU CCR8 - EXPOSURES TO CCPS
3.7.5 Standardised approach - CCR exposures by exposure class and risk weight
In the application of Article 444 (e) in the CRR, the following table provides the counterparty credit risk exposures under the standardised approach broken down by risk weights and regulatory exposure classes. “Unrated” includes all exposures for which a credit assessment by a nominated ECAI is not available and they therefore receive the standard risk weight according to their exposure classes as described in the CRR.
TABLE EU CCR3 - STANDARDISED APPROACH – CCR EXPOSURES BY REGULATORY PORTFOLIO AND RISK
In EUR million Exposure classesRisk weight Total
(post-CCF and post- CRM)Of which unrated
4% 100%
Institutions Institutions 28.86 - 28.86 -
Corporates Corporates - 3.22 3.22 3.22
Other items Other items - 0.00 0.00 0.00
Total Total 28.86 3.22 32.09 3.22

85BIL – Pillar 3 Report 2017
Credit Risk
3.7.6 IRB approach - CCR exposures by exposure class and risk weight
In the application of Article 444 (e) in the CRR, the following table provides the counterparty credit risk exposures under the IRB approach broken down by exposure classes and PD scale. CVA charges or exposures cleared through a CCP are excluded.
TABLE EU CCR4 - IRB APPROACH – CCR EXPOSURES BY PORTFOLIO AND PD SCALE
PD scale EAD post CRM
Average PD
Number of obligors
Average LGD
Average maturity
RWAs RWA density
Institutions 0.00 to <0.15 157,97 0,05% 42 34,11% 1,47 15,63 9,89%
0.15 to <0.25 0,90 0,18% 3 0,00% 1,00 - 0,00%
0.25 to <0.50 13,24 0,34% 4 34,30% 1,21 3,62 27,33%
0.50 to <0.75 0,06 0,71% 1 40,46% 1,00 0,04 59,60%
0.75 to <2.50 - - - - - - -
2.50 to <10.00 - - - - - - -
10.00 to < 100.00 3,85 30,87% 12 1,12% 1,00 0,28 7,31%
100 (Default) - - - - - - -
SUBTOTAL 176,02 0,75% 62 30,37% 1,44 19,56 11,11%
PD scale EAD post CRM
Average PD
Number of obligors
Average LGD
Average maturity
RWAs RWA density
Corporates - SME
0.00 to <0.15 - - - - - - -
0.15 to <0.25 - - - - - - -
0.25 to <0.50 - - - - - - -
0.50 to <0.75 - - - - - - -
0.75 to <2.50 0,04 1,30% 3 13,10% 1,00 0,01 29,95%
2.50 to <10.00 - - - - - - -
10.00 to < 100.00 - - - - - - -
100 (Default) - - - - - - -
SUBTOTAL 0,04 1,30% 3 13,10% 1,00 0,01 29,95%
PD scale EAD post CRM
Average PD
Number of obligors
Average LGD
Average maturity
RWAs RWA density
Corporates - Other
0.00 to <0.15 25,77 0,06% 3 31,91% 1,85 3,61 14,01%
0.15 to <0.25 - - - - - - -
0.25 to <0.50 1,69 0,34% 1 50,10% 5,00 1,69 99,94%
0.50 to <0.75 0,89 0,71% 5 63,77% 1,00 0,85 95,59%
0.75 to <2.50 0,79 1,71% 5 22,54% 1,00 0,37 46,66%
2.50 to <10.00 5,41 2,68% 3 72,73% 1,00 9,79 181,19%
10.00 to < 100.00 - 0,00% 5 0,00% -
100 (Default) - - - - - - -
SUBTOTAL 34,54 0,54% 22 39,75% 1,83 16,31 47,22%

86 BIL – Pillar 3 Report 2017
Credit Risk
PD scale EAD post CRM
Average PD
Number of obligors
Average LGD
Average maturity
RWAs RWA density
Retail - Other SME
0.00 to <0.15 - - - - - - -
0.15 to <0.25 - - - - - - -
0.25 to <0.50 - - - - - - -
0.50 to <0.75 0,08 0,59% 1 17,17% - 0,01 13,11%
0.75 to <2.50 0,05 1,65% 4 16,92% - 0,01 19,97%
2.50 to <10.00 0,14 3,75% 2 17,17% - 0,03 23,88%
10.00 to < 100.00 - - - - - -
100 (Default) - - - - - -
SUBTOTAL 0,27 2,41% 7 17,12% - 0,05 19,90%
PD scale EAD post CRM
Average PD
Number of obligors
Average LGD
Average maturity
RWAs RWA density
Retail - Other non SME
0.00 to <0.15 6,38 0,06% 126 12,68% - 0,16 2,47%
0.15 to <0.25 0,05 0,23% 11 17,17% - 0,00 9,72%
0.25 to <0.50 1,22 0,33% 49 13,28% - 0,12 9,47%
0.50 to <0.75 0,04 0,63% 27 15,61% - 0,01 16,20%
0.75 to <2.50 1,81 2,08% 261 0,41% - 0,01 0,64%
2.50 to <10.00 2,54 4,69% 51 13,28% - 0,63 24,78%
10.00 to < 100.00 0,00 12,07% 2 13,28% - 0,00 30,35%
100 (Default) - - - - - - -
SUBTOTAL 12,04 1,37% 527 11,05% - 0,93 7,69%
3.7.7 Impact of netting and collateral held on exposure value for derivatives and SFTs
In the application of Article 439 (e) in the CRR, the following tables present information on counterparty credit risk exposure and the impact of netting and collateral held as well as the composition of collateral used in both derivatives transactions and securities financing transactions (SFT).
The first table below provides the gross positive fair values before any credit risk mitigation, the impact of legally enforceable master netting agreements as well as further reduction of the CCR exposure due to eligible collateral received.
TABLE EU CCR5-A - IMPACT OF NETTING AND COLLATERAL HELD ON EXPOSURE VALUES
In EUR millionGross positive fair value or net carrying amount
Netting benefits
Netted current credit exposure
Collateral held
Net credit exposure
Derivatives 193.30 53.37 139.94 25.55 114.39
SFTS 1,708.37 591.46 1,116.91 971.51 145.40
TOTAL 1,901.67 644.83 1,256.84 997.05 259.79

87BIL – Pillar 3 Report 2017
Credit Risk
The second table discloses a breakdown of all types of collateral posted or received to support or reduce CCR exposures related to derivatives and SFT.
TABLE EU CCR5-B - COMPOSITION OF COLLATERAL FOR EXPOSURES TO CCRCollateral used in derivative transactions Collateral used in SFTs
Fair value of collateral received Fair value of posted collateral Fair value of collateral received
Fair value of posted collateralIn EUR million Segregated Unsegregated Segregated Unsegregated
Cash 25.52 - 256.56 - 913.43 4.50
Bonds 0.00 - - - 58.07 -
Equity securities 0.02 - - - - -
TOTAL 25.55 - 256.56 - 971.51 4.50
3.7.8 Management of the Wrong-Way Risk
Wrong-way risk occurs when an exposure to a counterparty is adversely correlated with the credit quality of that counterparty. At the Bank level, the derivatives transactions are mainly concluded to cover the rate risk (interest rate risk hedging to the fixed rate bonds portfolio). Correlation between the underlying of the derivatives and the debtor is considered very low, and margin call are performed daily.
3.7.9 Credit derivatives
BIL does not use credit derivatives for the management of its counterparty risk.

88 BIL – Pillar 3 Report 2017
Credit Risk
3.8. Exposure in equities not included in the trading book
This section provides accounting policies and valuation methods applied to equity instruments. In addition, data are provided on any amounts of such capital instruments not included in the trading book.
3.8.1 Fair value of financial instruments
IFRS 13 defines fair value as the price that would be received to sell an asset or paid to transfer a liability in an orderly transaction between market participants at the measurement date. Quoted market prices on an active market for identical instruments are to be used as fair value, as they are the best evidence of the fair value of a financial instrument.
If a financial instrument is not traded on an active market, recourse is provided by valuation models. The objective of a valuation model is to determine the value that is most representative of fair value under current market conditions.
The valuation model should take into account all factors that market participants would consider when pricing the financial instrument. Measuring the fair value of a financial instrument requires consideration of current market conditions. To the extent that observable inputs are available, they should be incorporated into the model.
Financial assets and liabilities measured at fair value are categorised into one of the three fair value hierarchy levels
The following definitions used by the Bank for the hierarchy levels are in line with IFRS 13 rules:
• Level 1: Quoted prices (unadjusted) on active markets for identical assets and liabilities;
• Level 2: Valuation techniques based on inputs other than quoted prices included within Level 1 that are observable, either directly or indirectly;
• Level 3: Valuation techniques for which significant inputs are not based on observable market data.
Financial instruments measured at fair value for which reliable quoted market prices are available
If the market is active, market prices are the most reliable evidence of fair value and therefore shall be used for valuation purposes. The use of market prices quoted on an active market for identical instruments with no adjustments qualifies for inclusion in Level 1 within the IFRS 13 fair value hierarchy, contrary to the use of quoted prices on inactive markets or the use of quoted spreads.
Financial instruments measured at fair value for which no reliable quoted market prices are available and for which valuations are obtained by means of valuation techniques
Financial instruments for which no quoted market prices are available on an active market are valued by means of valuation techniques. The models used by the Bank range from standard market models (discount models) to in-house developed valuation models. In order for a fair value to qualify for Level 2 inclusion, observable market data should mainly be used. The market information incorporated in the Bank’s valuation models is either directly observable data (prices) or indirectly observable data (spreads), and or own assumptions about unobservable market data. Fair value measurements that rely significantly on own assumptions qualify for Level 3 disclosure.

89BIL – Pillar 3 Report 2017
Credit Risk
31/12/17
Level 1 Level 2 Level 3 Total
Financial assets available for sale - equities 0 18,019,759 31,830,373 49,850,132
TOTAL 0 18,019,759 31,830,373 49,850,132
3.8.2. Equity exposures by type of asset and calculation process
The following table shows the amount of exposure to equities included in the banking book broken down by accounting class and level at year-end 2017.
It provides an analysis of the fair value of financial instruments measured at fair value after their initial recognition, grouped in three levels from 1 to 3, according to the degree of observability of the fair value.
3.8.3. Equity portfolio
At 31 December 2017, the Bank had an equity portfolio in the non-trading book of EUR 49.85 million.
Capital instruments whose fair value cannot be reliably measured are carried at cost.
31/12/17
Acquisition cost
Impairment Fair Value Adjustment
Carrying Amount
Investment Funds 14,243,803 0 893,200 15,137,003Operationnal Participations 20,826,039 (9,986,498) 2,749,328 13,588,869Other 743,102 (13,021) 18,548 748,629Private Equities 9,396,421 (9,276,403) 242,363 362,381Strategic Participations 8,059,638 0 11,953,612 20,013,250TOTAL 53,269,003 (19,275,922) 15,857,051 49,850,132
31/12/17Carrying Amount Of which at cost Of which Fair Valued
Investment Funds 15,137,003 0 15,137,003Operationnal Participations 13,588,869 2,212,383 11,376,486Other 748,629 1,524 747,105Private Equities 362,381 1 362,380Strategic Participations 20,013,250 0 20,013,250TOTAL 49,850,132 2,213,908 47,636,224

90 BIL – Pillar 3 Report 2017
Credit Risk
3.8.4. Gains or losses on equity
3.8.4.1. Realised gains or losses arising from sales and liquidations
The following table shows the cumulative realised gains or losses arising from sales or liquidations, impairments allowances and write-backs in 2016 and 2017.
2016 2017Financial assets available for sale - equities 57,806 (27,611)
TOTAL 57,806 (27,611)
3.8.4.2. Unrealised gains or losses included in own funds
The total unrealised gains or losses related to equity instruments amounted to 15.06 million as at December 31, 2017.
2016 2017Financial assets available for sale - equities 16,156,606 15,067,435
TOTAL 16,156,606 15,067,435
3.9 Securitisation exposures
3.9.1 Introduction: Theoretical considerations on securitisation
The following disclosures refer to traditional securitisations held in the banking book and regulatory capital on these exposures calculated according to the Basel III standardised approaches to securitisation exposures.
BIL’s role in the securitisation process is that of investor since it has acquired EUR 240 million of ABS on a total portfolio of EUR 5.5 billion. BIL has exclusively securitisation exposures in the banking book referencing different types of underlying assets including residential mortgage-backed security, auto loans, consumer loans and credit cards receivables.
A traditional securitisation is a financial transaction or mechanism that takes the credit risk associated with an exposure or pool of exposures and divides it up into transferable tranches with the following characteristics:
a) Payments in the transaction or mechanism are dependent upon the performance of the securitised exposure or pool of exposures.
b) The subordination of tranches determines the distribution of losses during the life of the transaction or mechanism. A distinction is made between the Equity tranche (first-loss tranche), which is the riskier tranche, the Mezzanine tranche and the senior tranche. The senior tranche will be defined as BIL solely bought ABS with such a tranching.
The senior tranche can be defined as any tranche that is neither a first-loss nor a mezzanine tranche. Within the senior tranches, the super senior tranche is the top tranche in the priority of payments, without taking into account for these purposes any amounts owed under interest rate or currency deriva¬tives, brokerage charges or similar payments.
3.9.2 Management of the Bank’s securitisation activity
The only activity in securitisation is done through investments in the banking book of the Bank. The Bank has no role of originator or sponsor of securitised deal.
To invest in securitised assets, the Bank complies to the strict investment guidelines that were approved by the Board of Directors. These guidelines stipulate that: • Exposures on securitised assets could not exceed 10% of
total size of portfolio,• The Weighted Average Life (WAL) of each exposure must not
exceed 5-year at the time of the trade,• The evolution of the WAL must be followed on a monthly
basis. If the WAL exceeds 5-year during the life of the issue, a specific investment committee is organised to make a decision on the future of the exposure,
• For any securitised asset in the portfolio, the portfolio manager will review the trustee reports once it is published and communicate it to the Credit Risk department,
• In the case the portfolio manager is uncomfortable with the published figures due to a weak performance of the pool, he will present the situation to the Investment Committee, which decides whether the exposure has to be sold or to be monitored further.
In 2017, the Bank has implemented the following investment strategy in securitised products: 1) Invest only in senior tranche of ABS,2) Limit the total invested amount to 600 million with a
minimum rating of AA-,3) Limit the WAL to 5-year,4) Invest principally in ECB-eligible paper, if the paper is not

91BIL – Pillar 3 Report 2017
Credit Risk
ECB-eligible, a significant spread differential should reward for the additional risk,5) In terms of geographic exposure, the investment is mainly
concentrated in core-countries, peripheral countries could be envisaged only if the spread premium compared to other asset types is significant for a comparable level of risk,
6) Investments in securitised assets must comply to Art 405 & 406 of the CRR to ensure a preferential risk-weighting under the standard method.
On December 31, 2017, the total EAD for securitised products amounted to 240 million for forty-two exposures. The exposure could be split as follows:
Chart 1: Breakdown by country of Risk (by EAD)
France36.2%
Finland0.6%
Spain17.8%
Belgium0.2%
Australia11.2%
Norway2.4%
Korea0.3%
Italy5.8%
Germany18,3%
Netherlands1.9%
Ireland2.7%
United Kingdom2.6%
Chart 2: Breakdown type of assets (by EAD)
RMBS40.9%
Consumer-Loans10.4%
Credit Cards8.1%
Autoloan40.6%
3.9.3 Securitisation accounting policies
Currently, the Bank does not own any securitisation for which it would be originator/initiator. Therefore, policies as described in the CRR 449 J are not deemed necessary at this stage.
Indeed, the Bank owns securitisations (ABS, MBS etc.) that it has acquired and not originated. These types of securitisation are classified in the portfolio of the Bank as available-for-sale securities. Therefore, the accounting treatment as explained in IAS 39 applies.
The Bank recognizes AFS securities initially at fair value plus transaction costs. Interest is recognised based on the effective interest-rate method and recorded under "Net interest income".
The Bank subsequently measures AFS financial assets at fair value.
Unrealised gains and losses arising from changes in the fair value of financial assets classified as AFS are recognised within equity, under the heading "Gains and losses not recognised in the consolidated statement of income". When securities are disposed of, or impaired, BIL recycles the related accumulated fair value adjustments in the consolidated statement of income as "Net income on investments".
BIL recognizes the impairment of available-for-sale (AFS) assets on an individual basis if there is objective evidence of impairment as a result of one or more events occurring after initial recognition.
When AFS financial assets are impaired, the AFS reserve is recycled and these impairment losses are reported in the consolidated statement of income as "Net income on investments".
3.9.4 Breakdown of securitisation exposures
The following table shows the securitisation breakdown by weighted risk in the banking book at year-end 2017:
EAD (Standard) RWA
Traditional securitisations <= 20% RW <= 20% RW
Autoloan 97.39 19.48
Credit Cards 19.50 3.90
Consumer loans 24.84 4.97
RMBS 98.26 19.65
TOTAL 239.99 48.00

92 BIL – Pillar 3 Report 2017
4. Market risk
Market risk is the risk of losses resulting from adverse movements of market risk parameters (e.g. interest rate risk, spread risk, equity price risk and foreign exchange risk):
• The interest rate risk is the risk that an investment’s value will change due to a change in the absolute level of interest rates, in the spread between two rates, in the shape of the yield curve, or in any other interest rate relationship;
• The spread risk is the risk of a reduction in market value of an instrument due to changes in the credit quality of the debtor / counterparty;
• The risk associated with the equity price represents the risk arising from the reduction in value of the Bank’s equity positions;
• The foreign exchange risk represents the potential decrease in value due to currency exchange rate movements.
Assets & Liabilities Management covers all the banking book’s structural risks, namely interest-rate risk, foreign exchange risk and liquidity risk.
Liquidity risk measures BIL’s ability to meet its current and future liquidity requirements, both expected and unexpected, whether or not the situation deteriorates.
Counterparty risk measures on a daily basis BIL’s exposure to an external counterparty.
4.1 Market risk governance
4.1.1. Organisation
Please refer to the section 1.2.1 Organisation.
4.1.2. Policy and committees
In order to manage market and ALM risks in an efficient manner, BIL group has defined a framework based on:• An exhaustive risk measurement approach, which is an
important part of BIL’s risk profile monitoring and control process;
• A sound set of policies, procedures and limits governing risk-taking;
• As a core principle, the system of limits must be consistent with the overall risk measurement (including risk appetite) and management process, and be proportionate to the capital position. These limits are set for the broadest possible scope;
• An efficient risk management structure for identifying, measuring, monitoring, controlling and reporting risks:
BIL’s development of a general risk management framework is suited to the type of challenges it faces. This approach offers an assurance that market risks have been managed in accordance with BIL’s objectives and strategy, within its overall risk appetite.
Financial Risk Management (FRM) oversees market risk under the supervision of the Management Board and specialised risk committees. FRM is a support unit within the Risk Management department. On the basis of its global risk management approach, it is responsible for identifying, analysing, monitoring and reporting risks and results (including the valuation of assets) associated with financial market activities.
The policies, directives and procedures documenting and governing each of the activities are defined within BIL and applied to all the Bank’s entities:• Head Office FRM teams define risk measurement methods
for BIL group; in addition they report and monitor the consolidated risks of the activities they are responsible for;
• Head Office and local FRM teams follow the day-to-day activity, implement policies and directives, monitor risks (e.g. calculation of risk indicators, control limits and triggers, frame new activities/new products etc.) and report to their own Management Board, as well as to local supervisory and regulatory bodies;
• The ALM Committee decides on the structural balance sheet positioning regarding rates, foreign exchange and liquidity. It defines and revises market risk limits;
• FRM, in its day-to-day activity, is supported by two operational committees: the MOC (Monthly Operational Committee) and the NPC (New Products Committee), which is detailed in Operational Risk section hereafter.

93BIL – Pillar 3 Report 2017
4.1.3. Risk measurement
The Bank has adopted sensitivity and Value-at-Risk (VaR) measurement methodologies as key risk indicators. VaR measures the maximal expected potential loss that can be experienced with a 99% confidence interval, within a 10-day holding period. Risk sensitivity measurements reflect the impacts on the exposure of a parallel movement of 1% on the interest rate curve.
BIL applies sensitivity and VaR approaches to accurately measure the market risk inherent to its various portfolios and activities:• General interest rate risk and currency risk are measured
through historical VaR;• Trading portfolio equity risk is measured through historical
VaR;• Non-linear risks are measured through historical VaR;• Specific interest rate risk (spread risk) is measured through
sensitivities.
As a complement to VaR measures and income statement triggers, the Bank applies a broad range of other measures aimed at assessing risks associated with its various business lines and portfolios (e.g. nominal limits, maturity limits, market limits, sensitivity to various risk factors etc.).
Since 2016, the Bank had set up a stress testing1 framework (scenario, triggers, limits) taking into account exceptional market occurrences. These stress tests cover the trading activity and the banking book. They are computed each month and the results are regularly communicated to the ALM Committee.
1 Stress testing is a risk management technique used to evaluate the potential effects on an institution’s financial condition of a specific event and/or movement in a set of financial variables. The traditional focus of stress testing relates to exceptional but plausible events.

94 BIL – Pillar 3 Report 2017
Market Risk
4.2 Market risk exposure
4.2.1. Treasury and Financial Market
The detailed IR&FX VaR used for Treasury and Financial Market activities (ALM not included) is disclosed in the table below. The average Value at Risk was EUR 0.38 million in 2017, compared with EUR 0.91 million in 2016.
VaR (10 days 99%) (in EUR million)
2016IR 1 & FX 2 (trading and banking) 3 EQT 4 tradingQ1 Q2 Q3 Q4 Q1 Q2 Q3 Q4
By risk factor Average 0.84 1.00 1.00 0.81 0.01 0.01 0.01 0.01Maximum 1.22 1.48 1.45 1.32 0.03 0.02 0.04 0.02
Global
Average 0.91Maximum 1.48End of period 0.44Limit 8.00
VaR (10 days 99%) (in EUR million)
2017IR 1 & FX 2 (trading and banking) 3 EQT 4 tradingQ1 Q2 Q3 Q4 Q1 Q2 Q3 Q4
By risk factor Average 0.42 0.39 0.36 0.36 0.01 0.01 0.01 0.00Maximum 0.68 0.58 0.68 0.94 0.02 0.03 0.05 0.02
Global
Average 0.38Maximum 0.94End of period 0.58Limit 8.00
1 IR: interest rate.2 FX: foreign exchange.3 IR & FX: excluding asset & liability management (ALM).4 EQT: equities.
As of December 31, 2017, the spread sensitivity (+1bp) for the capital markets activity amounted to EUR +1’637 for a limit set at EUR - 60’000. The average for 2017 amounted to EUR + 6’404.
4.2.2 Asset & Liability Management (ALM)
The role of the ALM unit in terms of interest-rate risk management is to reduce the volatility of the income statement, thereby safeguarding the gross margin generated by the business lines.
The sensitivity of the net present value of ALM positions to a change in interest rates is currently used as the main indicator for setting limits and monitoring risks.
As at December 31, 2017, the ALM sensitivity amounted to EUR 4 million (vs EUR 6 million as at end 2016).
Over 2017, the ALM department managed its rate position in order to keep a neutral sensitivity.
The limit of interest-rate sensitivity for a 100 bp parallel shift was EUR 81 million as at December 31, 2017 (identical to the 2016 limit).

95BIL – Pillar 3 Report 2017
Market Risk
Investment portfolio (in EUR million)
Notional amount Rate bpv Spread bpv31/12/16 31/12/17 31/12/16 31/12/17 31/12/16 31/12/17
Treasury 2,947 2,107 (0.10) (0.08) (1.24) (0.91)ALM 3,285 3,465 (1.39) (1.32) (2.17) (2.28)
4.2.3 Investment portfolio
The interest-rate risk of the Investment Portfolio is transferred and managed by the Treasury department or by the ALM department, depending on various criteria (i.e. maturity, sector, etc.).
The investment portfolio had a total nominal exposure of EUR 5.57 billion as at December 31, 2017 (against EUR 6.23 billion as at December 31, 2016). The majority of the bonds are classified in the AFS portfolio: EUR 3.89 billion as at December 31, 2017 (against EUR 5.71 billion as at December 31, 2016). The remaining part is classified in the HTM portfolio: EUR 1.69 billion as at December 31, 2017.
As far as the AFS-classified bond portfolio is concerned, the sensitivity of fair value (and the AFS reserve), to a one basis point widening of the spread, was EUR -1.9 million as at end 2017 (compared with EUR -3.0 million per basis point as at December 31, 2016).
4.2.4 Model management
4.2.4.1 Backtesting
The backtesting measures the accuracy of the VaR’s model by comparing the predicted losses from calculated VaR with the actual losses realised at the end of the specified time horizon. There are two methods:
• Hypothetical backtesting is carried out daily based on the fixed positions of two days before and then compares the profits and losses with the market data from changes between two days before and the day before. That difference is then compared with the VaR (99%, 1D) for the previous day. BIL has adopted this method;
• Actual backtesting uses the same method, but compares the results of actual days’ trading with the VaR (99%, 1D). It is based on the actual P&L for the day and therefore the day’s purchases/sales and any costs and commission.
An exception occurs when the calculated P&L exceeds the VaR (99%, 1D).
In 2017, the hypothetical backtesting calculated on the trading portfolio revealed one downward backtesting exception for interest rate and currency risks explained by a high volatility of exchange rate between USD and EUR.
4.2.4.2 Systems and controls
On a daily basis, FRM calculates, analyses and reports on the risks and results at a consolidated level.
All market activities are backed by specific guidelines describing the objectives, the authorised products, sensitivity, VaR and/or outstanding limits, etc.
The systems and controls established inside the Bank are described in various procedures to ensure a comprehensive framework is in place to support those responsible for managing market risks.

96 BIL – Pillar 3 Report 2017
Market Risk
Additional funding needed to reach 100% of the base case ratio (in EUR million)
2016 Q1 Q2 Q3 Q4
Estimated - 1 month
Average (4,418) (4,607) (4,348) (4,355) (4,362)Maximum (5,041) (5,041) (4,783) (4,633) (4,678)
Additional funding needed to reach 100% of the base case ratio (in EUR million)
2017 Q1 Q2 Q3 Q4
Estimated - 1 month
Average (4,363) (4,308) (4,532) (4,346) (4,266)Maximum (5,041) (4,403) (5,041) (4,781) (4,644)
The negative amount of additional funding needed to reach 100% of the base-case ratio shows that the Bank presents a surplus of liquidity.
4.3 Liquidity riskThe liquidity management process is based upon covering funding requirements with available liquidity reserves. Funding requirements are assessed carefully, dynamically and comprehensively by taking the existing and planned on- and off-balance sheet asset and liability transactions into consideration. Reserves are constituted with assets eligible for refinancing with the central banks to which BIL has access (Banque Centrale du Luxembourg (BCL) and Swiss National Bank (SNB)).
Regular information channels have been established for management bodies. A weekly report is sent to the CEO, the CRO, the ALM Committee members, the Risk Management, the Cash & Liquidity Management and the TFM teams. An analysis of the balance sheet development (e.g. customer deposits etc.) is presented and commented during the ALM Committee meetings.
4.3.1 Risk measurement
The internal liquidity management framework includes indicators enabling the assessment of BIL’s resilience to liquidity risk. These indicators include liquidity ratios, which compare liquidity reserves with liquidity deficits1. All these indicators are assessed according to a variety of scenarios, in the major currencies. These ratios are sent to the CSSF and to the BCL, on a daily and a weekly basis respectively.
From a commercial balance sheet point of view, the Bank observed a progressive increase in customer deposits and a moderate growth in the loan portfolio.
This excess cash has been partially invested through the Bank’s liquidity buffer bonds portfolio. This portfolio is mainly composed of Central Bank-eligible bonds which are also compliant with the Basel III package requirements, i.e. the Liquidity Coverage Ratio (LCR) and the Net Stable Funding Ratio (NSFR).
4.3.3 Liquidity Coverage Ratio
As the main short-term liquidity reference indicator, the LCR requires the Bank to hold sufficient High Quality Liquid Assets (HQLA) to cover its total net cash outflows over 30 days. It has been fully implemented in 2014 to comply with the CRR (Delegated Act based on art. 462 of the CRR).
It is worth mentioning that the LCR has an impact on the asset structure as well as the funding profile of the Bank. LCR forecasts therefore become an integral part of the decision-making process of the Management Bodies.
For further details, please refer to the hereafter table elaborated in line with the circular CSSF 18/676 on LCR disclosure:
1 Called “Base Case Ratio”.
4.3.2 Risk exposure
In line with the 2016 year-end situation, BIL presented a significant liquidity surplus throughout 2017.
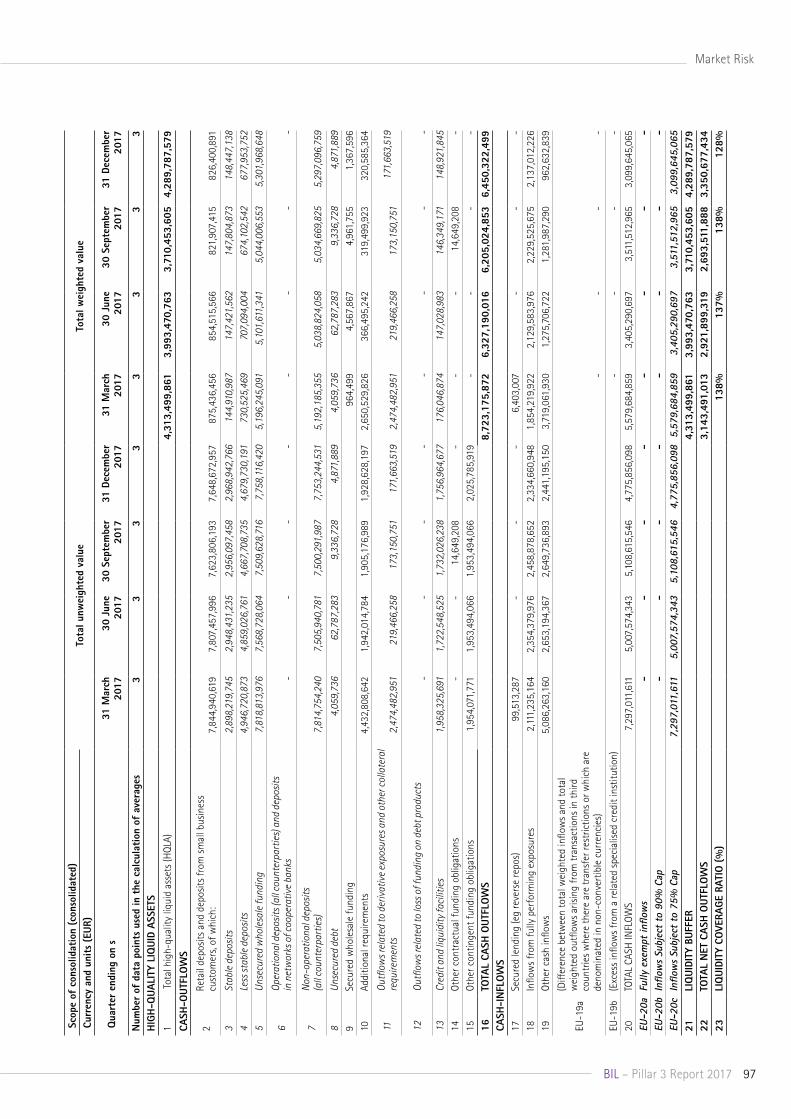
97BIL – Pillar 3 Report 2017
Market Risk S
cope
of
cons
olid
atio
n (c
onso
lidat
ed)
Tota
l unw
eigh
ted
valu
eTo
tal w
eigh
ted
valu
e C
urre
ncy
and
unit
s (E
UR)
Qua
rter
end
ing
on s
31 M
arch
20
17
30 J
une
2017
3
0 Se
ptem
ber
2017
31
Dec
embe
r 20
17
31 M
arch
20
17
30
June
20
17
30
Sept
embe
r 20
17
31
Dece
mbe
r 20
17
Num
ber
of d
ata
poin
ts u
sed
in t
he c
alcu
lati
on o
f av
erag
es
3
3
3
3
3
3
3
3
HIG
H-Q
UALI
TY L
IQUI
D AS
SETS
1 T
otal
hig
h-qu
ality
liqu
id a
sset
s (H
QLA)
4,
313,
499,
861
3,9
93,4
70,7
63
3,7
10,4
53,6
05
4,28
9,78
7,57
9 CA
SH-O
UTFL
OW
S
2 Re
tail
depo
sits
and
dep
osits
from
sm
all b
usin
ess
cu
stom
ers,
of w
hich
: 7,
844,
940,
619
7,8
07,4
57,9
96
7,62
3,80
6,19
3 7
,648
,672
,957
8
75,4
36,4
56
854
,515
,566
8
21,9
07,4
15
826
,400
,891
3 St
able
dep
osits
2
,898
,219
,745
2
,948
,431
,235
2
,956
,097
,458
2
,968
,942
,766
1
44,9
10,9
87
147
,421
,562
1
47,8
04,8
73
148
,447
,138
4
Less
stab
le d
epos
its
4,9
46,7
20,8
73
4,8
59,0
26,7
61
4,6
67,7
08,7
35
4,6
79,7
30,1
91
730
,525
,469
7
07,0
94,0
04
674
,102
,542
6
77,9
53,7
52
5 U
nsec
ured
who
lesa
le fu
ndin
g 7
,818
,813
,976
7
,568
,728
,064
7
,509
,628
,716
7
,758
,116,
420
5,19
6,24
5,09
1 5
,101
,611
,341
5
,044
,006
,553
5
,301
,968
,648
6 Op
erat
iona
l dep
osits
(all
coun
terp
artie
s) a
nd d
epos
its
in n
etw
orks
of c
oope
rativ
e ba
nks
- -
- -
- -
- -
7 N
on-o
pera
tiona
l dep
osits
(a
ll co
unte
rpar
ties)
7
,814
,754
,240
7
,505
,940
,781
7
,500
,291
,987
7
,753
,244
,531
5,19
2,18
5,35
5 5
,038
,824
,058
5
,034
,669
,825
5
,297
,096
,759
8 U
nsec
ured
deb
t 4
,059
,736
6
2,78
7,28
3 9
,336
,728
4
,871
,889
4
,059
,736
6
2,78
7,28
3 9
,336
,728
4
,871
,889
9
Secu
red
who
lesa
le fu
ndin
g 9
64,4
99
4,5
67,8
67
4,9
61,7
55
1,3
67,5
96
10
Addi
tiona
l req
uire
men
ts
4,43
2,80
8,64
2 1
,942
,014
,784
1
,905
,176
,989
1
,928
,628
,197
2,
650,
529,
826
366
,495
,242
3
19,4
99,9
23
320
,585
,364
11
Outfl
ows r
elat
ed to
der
ivat
ive
expo
sure
s and
oth
er c
olla
tera
l re
quire
men
ts
2,47
4,48
2,95
1 2
19,4
66,2
58
173
,150
,751
1
71,6
63,5
19
2,
474,
482,
951
219
,466
,258
1
73,1
50,7
51
171
,663
,519
12
Outfl
ows r
elat
ed to
loss
of f
undi
ng o
n de
bt p
rodu
cts
- -
- -
- -
- -
13
Cred
it an
d liq
uidi
ty fa
cilit
ies
1,9
58,3
25,6
91
1,7
22,5
48,5
25
1,7
32,0
26,2
38
1,7
56,9
64,6
77
176
,046
,874
1
47,0
28,9
83
146
,349
,171
1
48,9
21,8
45
14
Othe
r con
trac
tual
fund
ing
oblig
atio
ns
-
-
14,
649,
208
-
-
-
14,
649,
208
-
15
Othe
r con
tinge
nt fu
ndin
g ob
ligat
ions
1
,954
,071
,771
1
,953
,494
,066
1
,953
,494
,066
2
,025
,785
,919
-
-
-
-
16
TO
TAL
CASH
OUT
FLO
WS
8,72
3,17
5,87
2 6
,327
,190
,016
6
,205
,024
,853
6,
450,
322,
499
CASH
-IN
FLO
WS
17
Secu
red
lend
ing
(eg
reve
rse
repo
s)
99,
513,
287
-
-
-
6,4
03,0
07
-
-
-
18
Inflo
ws
from
fully
per
form
ing
expo
sure
s 2
,111,
235,
164
2,3
54,3
79,9
76
2,4
58,8
78,6
52
2,3
34,6
60,9
48
1,85
4,21
9,92
2 2
,129
,583
,976
2
,229
,525
,675
2
,137
,012
,226
19
Ot
her c
ash
inflo
ws
5,08
6,26
3,16
0 2
,653
,194
,367
2
,649
,736
,893
2
,441
,195
,150
3,
719,
061,
930
1,2
75,7
06,7
22
1,2
81,9
87,2
90
962
,632
,839
EU-1
9a
(Diff
eren
ce b
etw
een
tota
l wei
ghte
d in
flow
s an
d to
tal
wei
ghte
d ou
tflow
s ar
isin
g fr
om tr
ansa
ctio
ns in
third
co
untr
ies
whe
re th
ere
are
tran
sfer
rest
rictio
ns o
r whi
ch a
re
deno
min
ated
in n
on-c
onve
rtib
le c
urre
ncie
s)
-
-
-
-
EU-1
9b
(Exc
ess
inflo
ws
from
a re
late
d sp
ecia
lised
cre
dit i
nstit
utio
n)
-
-
-
-
20
TOTA
L CA
SH IN
FLOW
S 7
,297
,011
,611
5
,007
,574
,343
5
,108
,615
,546
4
,775
,856
,098
5,
579,
684,
859
3,4
05,2
90,6
97
3,5
11,5
12,9
65
3,0
99,6
45,0
65
EU-2
0a
Fully
exe
mpt
inflo
ws
-
-
-
-
-
-
-
-
EU-2
0b I
nflow
s Su
bjec
t to
90%
Cap
-
-
-
-
-
-
-
-
EU
-20c
In
flow
s Su
bjec
t to
75%
Cap
7
,297
,011
,611
5
,007
,574
,343
5
,108
,615
,546
4
,775
,856
,098
5,
579,
684,
859
3,4
05,2
90,6
97
3,5
11,5
12,9
65
3,0
99,6
45,0
65
21
LIQ
UIDI
TY B
UFFE
R 4,
313,
499,
861
3,9
93,4
70,7
63
3,7
10,4
53,6
05
4,28
9,78
7,57
9 22
TO
TAL
NET
CAS
H O
UTFL
OW
S 3,
143,
491,
013
2,9
21,8
99,3
19
2,6
93,5
11,8
88
3,35
0,67
7,43
4 23
LI
QUI
DITY
CO
VERA
GE R
ATIO
(%
) 13
8%13
7%13
8%12
8%

98 BIL – Pillar 3 Report 2017
Market Risk
4.3.4 Net Stable Funding Ratio
The NSFR, reflecting the longer term liquidity position of an institution, requires the available amount of stable funding to exceed the required amount of stable funding over a one-year period of extended stress. Pending the official EU calibration of the NSFR, calculations are based on Basel III calibration included in the Quantitative Impact Study (QIS) and reported in the Short Term Exercise (STE).
in EUR B 2016 2017Available Stable Funding (ASF) 15.31 15.22
Required Stable Funding (RSF) 13.41 13.94
NSFR ratio 114% 109%
Limit 100%
4.3.5 Asset encumbrance
Since December 2014, BIL group’s asset encumbrance has been reported on a quarterly basis to the CSSF. This report includes the whole balance sheet split into encumbered and non-encumbered assets, collateral received and sources of encumbrance.
The Bank set up a report of key metrics and a limit regarding asset encumbrance which is based on data of regulatory reporting. The following metrics have been selected to provide key information: • Level of asset encumbrance;• Credit quality of unencumbered debt securities;• Sources of encumbrance;• Contingent encumbrance.
A reference to the LCR classification has been added in the section “Credit quality of unencumbered debt securities” in order to give a complementary information about the quality of unencumbered assets.
The European asset encumbrance ratio has been calculated and added in the internal report. The components also rely on metrics of regulatory reporting:
Total encumbered assets + Total collateral received re-usedTotal assets + Total collateral received available for emcumbrance
AE% =
This ratio measures the asset encumbrance of credit institutions in Europe in a harmonised way. The overall weighted average encumbrance ratio calculated and published regularly by the EBA (26.6% in 2017 for the reference period December 2016) is an available benchmark. By comparison, BIL’s ratio is around 10% and reflects a low/moderate level of asset encumbrance compared to other institutions. It is worth mentioning that the limit in Risk Appetite Framework remains at a level of 25%.
In line with the exemptions mentioned in the Article 16a of Commission Implementing Regulation (EU) 680/2014 for supervisory reporting on asset encumbrance, BIL does not disclose the required template on asset encumbrance (EBA/RTS/2017/03) in 2017. Indeed, the BIL’s total assets is below EUR 30 billion. However, the hereafter table is realised with internal data.
The ratio decreased from 114% as of December 31, 2016 to 109% as of December 31, 2017. This evolution of the Required Stable Funding (RSF) (+ EUR 0.54 billion) is mainly due the growth of the commercial loans whereas the Available Stable Funding (ASF) is stable.

99BIL – Pillar 3 Report 2017
Market Risk
in EUR million 2016 YE 2017 YELevel of asset encumbrance
Encumbered assets 2,597 2,282
Collateral received re-used 0 203
Total amount 2,597 2,485
Ratio1 11% 10%
Limit2 25% 25%
Credit quality of unencumbered debt securities3
Step 1 (AAA to AA-) 3,048 2,316
of which eligible as LA for LCR 2,851 1,977
Step 2 (A+ to A-) 1,214 1,057
of which eligible as LA for LCR 754 728
Step 3 (BBB+ to BBB-) 819 918
of which eligible as LA for LCR 755 868
Non-rated securities 22 317
of which eligible as LA for LCR 10 66
Total amount 5,103 4,608
of which eligible as LA for LCR 4,370 3,639
Sources of encumbrance
OTC Derivatives 437 370
Repurchase agreements 554 999
Collateral swaps 594 645
Securities Lending 751 443
Total amount 2,335 2,457
Contingent encumbrance4
OTC Derivatives 57 79
Repurchase agreements 165 299
Collateral swaps 245 217
Securities Lending 309 149
Total amount 776 745
As of December 31, 2017, EUR 2.48 billion of BIL group's balance sheet assets were encumbered, slightly lower than the previous year. Key sources of encumbrance are deposits to the BCL (EUR 0.7 billion), collateral swaps (EUR 0.6 billion), securities lending (EUR 0.4 billion) and OTC derivatives (EUR 0.4 billion). Almost all securities lending transactions are open maturity operations with a maximum recall period of two days, which mitigates liquidity risk. Depending on the counterparty, BIL or a third party on the behalf of BIL receives
securities as collateral to address the credit risk. A common feature of collateral swaps carried out by BIL is the lending of high quality securities (e.g. issued by a general government) against LCR-eligible securities of lesser quality (e.g. RMBS). Central Bank-eligible securities are encumbered to pledge BIL’s participation in the Targeted Longer Term Refinancing Operations (TLTRO) programme. Lastly, collateral needs from derivatives (CSA and GRMA) require cash deposits.
4.4. Interest rate risk in the banking book
Interest Rate Risk in the Banking Book (IRRBB) refers to the current or prospective risk to a bank’s capital and its earnings, arising from the impact of adverse movements in interest rates on its banking book.
BIL participated to the ECB IRRBB Stress Tests in 2017.
In 2017, BIL wrote a dedicated policy validated by the ALM Committee. The covered topics are:• Regulatory context;• Perimeter;• Methodology (accounting reconciliation, Economic
Value Equity (EVE) / Net Interest Income (NII), products specificities, stress scenario); and
• Governance (frequency, limits and triggers for EVE and NII).
The drafting of this policy allows BIL to manage the IRRBB in compliance with the regulatory framework.
Two complementary methods measure the impacts of changes on the IRRBB: Changes in expected earnings (earnings based measures) and changes in economic values.
4.4.1. Monitoring of Economic Value of Equity
BIL measures the level of change to the net present value of the relevant balance sheet items, based on existing or adjusted cash flows that are revaluated in line with the interest rate shock and stress scenarios.
In accordance with the principle 8 of BCBS, BIL discloses the measure of EVE variation with the following basis:• BIL excludes:
- Its own equity from the computation of the exposure level;
- The loans’ commercial margins / spreads components.
1 Asset encumbrance ratio = (Encumbered assets + Collateral received re-used) / (Total assets + Total collateral received).
2 Last EU asset encumbrance ratio.3 Assets and collateral received available for encumbrance.4 Additional amount of encumbered assets resulting from a decrease by 30%
of the fair value encumbered assets.

100 BIL – Pillar 3 Report 2017
Market Risk
• BIL includes: - All cash flows from all interest rate-sensitive assets,
liabilities and off-balance sheet items in the banking book; - Margins / spreads for bonds booked in the Banking scope.
• The Bank is currently working on the split of interest rate (FTP, margin) for each exposure in order to compute both calculation flows;
• The cash flows are discounted using a swap curve as the risk-free interest rate curve;
• EVE variation are computed with the assumption of a run-off balance sheet.
4.4.2. Monitoring of Net Interest Income
An earning-based measure offers the possibility of measuring risk under a range of different time horizons. The short/medium-term horizon is considered as the standard (one to three years, no more than five years), to limit the cumulative impact of underlying assumptions and the complexity of calculations.
BIL currently calculates the NII over a one-year horizon assuming a constant balance-sheet. In next steps, BIL will calculate earnings over a three-years horizon with a dynamic balance-sheet.
In accordance with the principle 8 of BCBS, BIL discloses the measure of NII variation with the following basis:• The Bank should include expected cash flows (including
commercial margins and other spreads components) arising from all interest rate-sensitive assets, liabilities and off-balance sheet items in the banking book;
• The NII variation should be computed assuming a constant balance sheet, where maturing or repricing cash flows with identical features with regard to the amount repricing period and spread components;
• The NII variation should be disclosed as the difference in the future interest income over a rolling 12-month period.
4.4.3. Products specificities
4.4.3.1. Non-Maturing Deposits
In accordance with a JST recommendation, the Bank is reviewing its current Non-Maturing Deposits’ (NMD) model. Currently, the balance of the current accounts deemed as stable is amortised over a ten-year horizon, resulting in an average duration of 5 years. This stable part is defined by the Bank as 90% of the moving average of the balances over the 12 months since 2016. The following element have already been addressed taken into account the 2016 BIS requirements for IRRBB:
• A first segmentation has been obtained according to deposit threshold between transactional and non-transactional for current account;
• Non-Maturing Deposit segmentations have been linked to interest rate;
• Monte-Carlo simulations have been produced by Non-Maturing Deposits segmentation (backtesting);
• The following steps are going to perform: - Increase the date range (at least 10 years) and granularity
(currently 3 months frequency to be at least 1 month); - Performance analysis on the models under different
segmentation’s deposit thresholds.• The revised approach will be embedded in the risk framework
(RAF, ECAP, etc.).
4.4.3.2. Explicit and implicit options
The explicit options concern products with contractual (automatic) options. These options are taken into account considering interest rate curves scenarios.
The implicit options are derived from client behavioural assumptions on specific products (e.g. early repayments in the context of the Luxemburgish law of 23 December 2016). BIL is studying the implementation of a specific prepayment model.
in EUR million Δ EVE Δ NIIPeriod 2016 2017 2017 2016Parallel up +200bp 10 14 46 39Steepener -56 -43Flattener 60 50Short rate down -58 -44Short rate up 55 46Maximum -58 -44 46 39Period 2016 2017Tier 1 Capital 909 961
4.4.4. IRRBB Stress scenario
BIL applies two categories of scenario.
The first set of scenario comes from the annex 2 of the BCBS document:• Parallel shock up (both for EVE and NII);• Steepener shock (only EVE);• Flattener shock (only EVE);• Short rates shock up (only EVE); and• Short rates shock down (only EVE).
The application of these scenarios gives the following table:

101BIL – Pillar 3 Report 2017
Market Risk
The Bank managed its rate position in order to keep a neutral sensitivity, which is confirmed by the low ∆EVE in 2016 and 2017 for the parallel up +200bp.
In 2016 and 2017, the worst case scenario is the short rate down. The impact of this scenario is more important in 2017 because of the increase of the fixed-rate mortgage loans production.
The limits and triggers are driven by the Basel Committee constraints:• The limit corresponds to 20% of BIL’s own equity, i.e. 180
mios, which is the Regulatory limit;• The trigger corresponds to EUR 162 mios, which represents
90% of the Regulatory limit.
Unlike the EVE, the Basel Committee does not define limit for the NII. BIL defined its limits and triggers taking account the following elements:• The CET1 ratio;• The NII over 1 year;• The results of the stresses over several periods from the +/-
200bp regulatory scenario and the most severe scenarios IRRBB 2017 with a limit at EUR 30 million and the trigger at EUR 25 million.
As of 2017, the trigger is equal to 1/12 of the NII budget or 40bp of the CET1 and the limit is equal to 10% of the NII budget or 50bp of the CET1 ratio.
The second set of scenario was developed by the Bank and corresponds to interest rates movements that both the ALM and FRM experts think possible.
Finally, BIL applies a last set of scenario corresponding to the rate movements of the last big financial crisis.
These scenario are submitted to triggers only.
2016 2017RWAs Capital requirements RWAs Capital requirements
OUTRIGHT PRODUCTS
Interest rate risk (general and specific) 34 3 43 3
Equity risk (general and specific) 0 0 0 0
Foreign exchange risk 21 2 27 2
Commodity risk
OPTIONS
Simplified approach
Delta-plus method
Scenario approach
Securitisation (specific risk)
Total 55 5 70 6
4.5. Assessment of the regulatory capital requirement BIL no longer applies the internal VaR model to calculate its regulatory capital requirement for general interest rate risk and currency risk within trading activities.
From 2013 onward, all market risks are treated under the Basel III standardised approach. The table below presents the Bank’s regulatory capital required broken down by risk type for both year-end 2016 and 2017.

102 BIL – Pillar 3 Report 2017102 BIL – Pillar 3 Report 2016
5. Operational risk
Operational risk is the risk of losses stemming from inadequate or failed internal processes, people, systems or external events. This definition includes legal risk, but excludes strategic risk. It also excludes losses resulting from commercial decisions.
5.1 Operational risk governance
5.1.1 Organisation
Please refer to the section 1.2.1 Organisation.
5.1.2 Policies & committees
BIL group’s operational risk management framework relies on strong governance, with clearly defined roles and responsibilities.
Policies
BIL’s Operational Risk Management (ORM) policy involves identifying and regularly assessing operational risks in order to take actions to reduce them. This framework is implemented through a preventive approach via the RCSA and a Key Risk Indicators (KRI) methodology has been developed in 2017 and will be continuously implemented throughout 2018. The management of the risk framework of the Bank also includes the transfer of the financial consequences of certain risks towards insurances.
In terms of operational risk, BIL’s management conducted the annual review of the Operational Risk Global Policy without any major change in September 2016.
End of 2015, BIL has decided to build its “Cyber Security Strategy” with the help of an external consulting firm. Therefore, in 2016, the internal governance and policies related to Cyber Security topics (i.e. covering both IT Security and Information Security perimeters) have been reviewed. Finally, end of 2017, the Bank began its validation process for all these documents (i.e. charters, policies and procedures) required to support this framework. The aim of the BIL Information Security Charter is to define the high level objectives in each domain of Information Security – as defined in ISO/IEC 27001:2013 and the corresponding roles defined in the CSSF circular 12/552 – that must be fulfilled to ensure the security of the information of the Bank. The Charter will also define the high level responsibilities of the different actors of BIL’s Information Security.
In addition, in the context of an IT Security and Information Security review (organisation, governance, operational mode, etc.), a new Business Continuity and Crisis Management Charter has been achieved. Therefore, the review of the framework of all the documents has been implemented and the validation process has been launched at end-2017. The aim of this document is to define the high level objectives in each domain of Business Continuity Management and Crisis Management – as defined in ISO/IEC 22301:2012 – that must be fulfilled to ensure the business continuity and manage crisis.
Committees
BIL’s Operational Risk Management framework relies on strong governance, with clearly defined roles and responsibilities.
The following committees are responsible for operational risk at BIL:
• The Internal Control Committee (ICC), mandated by the Management Board, is in charge of supervising the Operational Risk Management for operational incidents, major risks and root causes, follow-up on corrective/mitigating measures, RCSA results, KRI, BCP/DRP Information Security as well as overseeing the operational risks for BIL, its subsidiaries and branches based on the existing products/services;
• The New Product Committee (NPC) is a transversal committee responsible for new products/ services on the basis of ideas coming from the entire bank including the Innovation & Digital Forum and for checking the relevancy of the underlying business case against the Bank’s strategy. The Head of BIL’s group Risk Management acts as the chairman and the Head of Corporate Operational risk acts as member for risk advice;
• The Monthly Operational Committee (MOC), under the responsibility of the Treasury & Financial Markets (TFM) business line, and with the participation of ORM, supervises BIL’s TFM projects and operational risks, takes decisions in terms of tackling day-to-day problems and monitors other risks related to TFM Luxembourg’s activities.
• The Crisis Committee (CC) is mandated by the Management Board to create an Operational Crisis Management Committee consisting of a core incorporating different members of the functions necessary for the management of any crisis; depending on the type of crisis, this core is complemented by the heads of the entities affected. This Committee also deals with the Information Security subjects.

103BIL – Pillar 3 Report 2017 103BIL – Pillar 3 Report 2016
It is worth mentioning that all topics related to the Information Security are dealt in the following committees:
• The Security Committee (SC) is mandated by the Management Board to oversee the risks to BIL’s Information Security and to that of its subsidiaries and branches, as well as all risks of deficiency of confidentiality, availability, or integrity of the Bank’s information assets. It is also in charge of overseeing security incidents involving BIL, taking decisions on any project which could have a potential impact on the security of BIL’s information assets and ensuring that the implementation and support of a global Business Continuity Plan (BCP) follows the strategy defined by the Management Board;
• The Compliance, Audit and Risk Committee is a quarterly committee which covers aspects of Compliance, Audit and Risk between BIL and IBM. It brings together the Chief Compliance Officer, the Head of Audit and the Head of BIL group’s Risk Management and/or their substitutes (Head of Operational Risk Management or Head of Corporate Information Security) and their equivalents at an IBM side.
5.1.3 Risk measurement
The operational risk framework is based on the following elements:• Efficient data collection,• Self-assessment of risks,• orrective and preventive action plans,• Development, implementation and follow up of Key Risk
Indicators.
Operational risk event data collection
According to the Basel Committee, the systematic recording and monitoring of operational incidents is a fundamental aspect of risk management: “Historical data on banking losses may provide significant information for assessing the Bank’s operational risk exposure and establishing a policy to limit/manage risk”.
Regardless of the approach used to calculate the capital, data collection is required. Having a relevant procedure in place ensures that BIL complies with the Basel Committee’s requirements (i.e. guidelines for reporting operational incidents). At the same time, recording incidents provides information that may be used to improve the internal control system and determine the Bank’s operational risk profile.
The division of BIL group’s gross losses for the year 2016 by risk event type is disclosed in the chart below. The total gross
Internal fraud; 4;0.3%
External fraud; 8; 0.6%
Damage to Assets & Public Safety; 7; 0.5%
Client Products &Business Practices; 115; 8.5%
Information,Technology & ITFailure; 6; 0.4%
Execution, Delivery & Process Management; 1,209; 89.7%
Employment Practicesand Workplace Safety; 0; 0%
Gross impact in thousands EUR and share in %
Execution, Delivery & Process Management incidents represent 89.7% of the total amount of BIL group’s operational risk losses. Losses related to these incidents were mainly incurred due to human errors and the main operational risk lies in the wrong execution of instructions.
In the second place, one incident related to the Client Products & Business Practices category represents 8.5% of the total amount of operational incidents. This incident is related to the “Systems” cause category and concerns a tool which is no longer used by the Bank.
In 2017, the Bank recorded 34 operational incidents related to External Fraud among which 30 have been stopped by the Bank (fraud attempts) for a risk exposure amount of 1,150 million EUR. Four frauds were executed for an effective loss of EUR 8,000 but the risk exposure amount was EUR 31,000. A review of the internal memorandum that imposes the execution of additional controls based on the customer’s habits or profile has been done in 2017. The criteria of the controls have been updated to keep them in line with the fraudulent practices. Moreover, thanks to various campaigns especially via intranet, the Bank keeps raising all front business lines’ employees awareness. The Bank also faced the consequence of an internal fraud in 2017 for an amount of EUR 4,000 resulting from an incident that occurred in 2008. The Bank had updated the internal procedures accordingly in due time.
impact is calculated on an absolute value basis, including losses, profits, timing accounting and excluding recoveries. This explains possible differences with other regulatory reports which are only based on a losses point of view.

104 BIL – Pillar 3 Report 2017
Opertaional Risk
In the Information, Technology and Infrastructures category (0.4%), the operational incidents were linked to disturbances in the IT systems. BIL does not estimate the related financial impacts except if they have direct financial consequences for customers. The principal impact is calculated in man/days.
In the Damage to Assets & Public Safety category, a remaining loss of approximately EUR 6,500 (0.5%) has not been recovered due to the insurance deductible or the (partial) exclusion of the case from the insurance contracts. .
In terms of control, an exhaustive monthly document is produced for each line manager (Head Office, subsidiaries and branches). It covers every incident that has arisen in their business over the previous month and that has been declared to the COR team. Recipients analyse their report and verify that all incidents brought to their attention have been treated and reported.
ORM presents an operational risk report to the ICC at the end of each quarter.
Self-assessment of risks and associated controls
A pre-defined RCSA exercise is performed each year to identify the most significant operational risk areas of the Bank. This assessment provides a good overview of the various activities and existing checks and can lead to the definition of mitigating actions. The results of these assessments are reported to the management during the ICC meeting. The guideline for RCSA has been reviewed at the beginning of 2017 without significant changes.
Definition and follow-up of action plans
As part of the operational risk management, corrective action plans linked to major risks and events are monitored closely.
Two types of action plans are managed through operational risk management:• Action plans – Incidents: Following a significant incident,
management has to implement action plans in order to reduce the impact or prevent its reiteration;
• Action plans – RCSA: In the event of unacceptable risk exposure, management has to identify ad hoc action plans mitigating the identified risk.

105BIL – Pillar 3 Report 2017
Opertaional Risk
5.2 Calculation of the regulatory capital requirementBIL group applies the standardised Basel approach to calculate the regulatory capital requirements for operational risk. This approach consists in applying a percentage (called the “beta factor”, ranging from 12% to 18%) to an appropriate activity indicator, calculated for each of the eight business lines defined by the Basel Committee (i.e. corporate finance, commercial banking, retail banking, trading and sales, asset management, agency services, retail brokerage, payment and settlement).
The relevant indicator is defined by the regulator and is based on the operational results of the underlying business lines, using an average over the past three years. The calculation is updated at the end of each year. The amount of operational risk-weighted assets has increased compared with the 2016 figures (799 million) to 831 million at year-end 2017.
Banking activities(EUR million) Beta Factor Ajusted P&L
Capital Requirements
2015
Capital Requirements
2016
Capital Requirements
2017
Commercial Banking 15% 102 12.47 13.79 15.3
Retail Banking 12% 377.7 45.59 44.96 45.3
Trading and sales 18% 32.5 3.05 5.15 5.9
TOTAL 512.2 61.11 63.91 66.5
The chart below presents the breakdown by business lines (according to Basel definitions) of the capital requirement for operational risk as at December 31, 2017.
Commercial banking;15%
Trading & sales;18%
Retail banking; 12%

106 BIL – Pillar 3 Report 2017
6. Remuneration Charter and practices
6.1 Key pillars This remuneration charter (the “Charter”) has been reviewed and approved by the BoD on 9 February 2018 , and is applicable to all entities of BIL group.
To both reflect BIL group’s core values and comply with the regulatory requirements in terms of remuneration policies and principles, the Charter has been defined around the following pillars:
• Maintain a sound and effective risk management framework
The Charter and its associated practices aim at defining the remuneration within BIL group with a view to protect the interests of BIL group’s clients, providers, employees, shareholders as well as BIL group’s financial sustainability in a long-term perspective.
The Charter is consistent with and promotes sound and effective risk management, does not induce excessive risk-taking and is fully aligned with BIL group’s aim to efficiently manage conflicts of interests and promote best banking practices.
• Attract and retain talent with competitive remuneration packages
Client satisfaction and protection remain at the heart of the philosophy of BIL group. BIL group wishes to attract, retain and motivate highly qualified professionals in their respective domains. Therefore, BIL group offers remuneration packages that, while in line with market practices, are attractive and competitive, both in terms of amounts and structure.
The remuneration components granted by BIL group to its staff are regularly benchmarked through market studies performed by internal or external consultants, in order to verify the positioning of its remuneration packages in comparison to any given reference market. The remuneration analyses may be carried out at local or international level and aim to provide a benchmark of BIL group’s position against comparable financial institutions.
By decision of the BOD, ad hoc measures may be envisaged in certain entities of BIL group when significant distortions are observed, with a view to enable BIL group to attract the talent it needs and keep those already in position. Although remuneration must be kept attractive, it must respect the budgetary framework set by the BOD and not jeopardise the financial situation of BIL group.
• Ensure primacy of clients’ interests In order to ensure that clients are treated fairly and their interests are not impaired by the remuneration practices, BIL Group does not remunerate or assess the performance of its staff in a way that conflicts its duty to act in the best interest of its clients.
In the same way, when BIL Group acts as an insurance distributor, no arrangement should be made that could provide an incentive to recommend a particular insurance product to a customer when the insurance distributor could offer a different insurance product which would better meet the client’s needs.
• Link between performance and remunerationVariable Remuneration is part of the standard compensation package offered by BIL group. To protect the interests of all stakeholders, and encourage responsible business conducts. Variable Remuneration must be aligned with short, mid and long-term collective and individual performance. Effective performance is therefore subject to strict assessment rules that primarily aim at preventing excessive risk-taking behaviour. This is why the BIL Group Remuneration Charter takes into account the main outcomes of the ICAAP. Moreover and more generally, BIL group does not reward failure.
Remuneration and similar incentives shall not be solely or predominantly based on quantitative commercial criteria, and shall take into account appropriate qualitative criteria reflecting compliance, the fair treatment of clients and the quality of services provided to clients. A balance between fixed and variable components of remuneration shall be maintained at all times, so that the remuneration structure does not favor the interests of BIL Group against the interests of any client.
• Comply with the regulatory frameworkThe Charter complies with the requirements on remuneration policy and practices in the financial sector that have been defined by applicable rules and competent regulators, including the CSSF.
• Foster transparencyTransparency is a keystone of the Charter. Detailed information on the Charter’s rules and practices is made available both internally and externally in order to ensure that employees as well as stakeholders are timely and accurately informed about BIL group’s remuneration Charter.
• Ensure group consistency BIL group remuneration Charter is applicable to all subsidiaries and branches in Luxembourg and abroad. In order to ensure consistency throughout the Group, all entities of BIL group are requested to examine the conformity of the Charter with

107BIL – Pillar 3 Report 2017
regards to specific rules and regulations and should mandatory specific rules apply, local entities should adapt the Charter accordingly. Should local regulators provide stricter rules, the later shall prevail
BIL group regularly carries out internal audits in entities in Luxembourg and abroad to verify the compliance by such entities with the Charter.
6.2 Determination of the Identified Staff
BIL performs, at least on an annual basis, a detailed analysis in order to identify its staff members and staff members of entities of the BIL group whose professional activities have a material impact on BIL group’s risk profile (hereafter referred to as the “Identified Staff”).
BIL group applies the guidance provided by the EBA when determining its Identified Staff. The list of Identified Staff is drawn up each year on the basis of the analysis of job functions and responsibilities according to the following governance :
1/ Each entity is requested to identify staff members who meet the Identified Staff criteria or definition. This analysis is made on the basis of (i) the Qualitative and Quantitative Criteria detailed in the Commission Delegated Regulation EU 604/2014 on the identification of categories of staff whose professional activities have a material impact on an institution’s risk profile and, whenever appropriate (ii) the specific definition set forth in the context of AIFMD;
2/ The analysis is combined into a consolidated Identified Staff list which is assessed at Group level during an ad hoc meeting;
3/ This annual process is coordinated by Human Resources (HR) in close collaboration with Risk Management, Compliance, Audit and Legal departments;
4/ The final consolidated list is reviewed by the BRNC-N and recommended by the BRNC-N to the BoD for decision.
Proportionality principle at the level of Identified Staff
All principles described in this Charter apply to all Identified Staff at BIL group level.
However, as foreseen by the CRD IV, the Luxembourg Financial Sector Law and the EBA Guidelines, BIL may apply the remuneration requirements in a proportionate way to Identified Staff who have a less material impact on BIL group’s risk profile.
More precisely, BIL applies the proportionality principle to Identified Staff who have a less material impact on BIL group’s risk profile and an annual Variable Remuneration below or equal to EUR 100 000.
Based on past practice in a normal year, a significant proportion (+/- 85%) of the Identified Staff is considered to fall within the criteria foreseen in CSSF Circular 11/505.
In this context, the following specific remuneration requirements are neutralised for the Identified Staff for whom the proportionality principle is applied:• Requirement to pay out a part of the Variable Remuneration
in instruments and, as a consequence, the related instrument retention obligations;
• Requirement to pay out a part of the Variable Remuneration through a deferral scheme and, de facto, the related ex-post risk adjustment obligations (Malus).
6.3. Determination of the Relevant Persons
In addition, as per Commission Delegated Regulation (EU) 2017/565 of 25 April 2016 supplementing Directive 2014/65/EU, BIL Group identifies, on a regular and continuous basis, and establishes a list of the Relevant Persons. The list is drawn up and yearly reviewed by HR and Compliance Departments.
BIL already adopted before the implementation of Directive 2004/39/CE in 2007 and still maintains measures enabling to define appropriate criteria to be used to assess the performance of Relevant Persons, including qualitative criteria encouraging the relevant persons to act in the best interest of the client. In addition, organisational measures adopted in the context of the launching of new products or services appropriately take into account the remuneration policies and practices and the risks that these products or services may pose in terms of conduct of business and conflicts of interests.

108 BIL – Pillar 3 Report 2017
Remuneration Charter and practices
6.4. Performance assessment
6.4.1. Performance management system
6.4.1.1. Main characteristics of the system
Within BIL group and subject to minor local adjustments, all members of staff are assessed once a year on the basis of targets set at the beginning of each calendar year.
A skills matrix assesses the competencies of the employee, four different categories of skills matrixes exist in order to take the role (people manager or non-people manager) as well as the status of the employee into account (staff or executive function). All skills matrixes assess Qualitative Criteria and are stable over time.
Targets are set for one calendar year. They are specific to the function and to the employee and focus on what the employee is asked to achieve in that particular calendar year. Objectives may be quantitative or qualitative, but the set of objectives should always include qualitative objectives for a minimum of 30%.
Objectives are weighted by the direct manager and must respect the SMART principle, i.e. be Specific, Measurable, Attainable, Relevant and Time-Bound.
As a general principle performance is assessed and discussed during appraisal interviews that are done at least once a year by the direct manager of the employee, might this employee be an Identified Staff or not. It is the manager’s duty to ensure he/she has all the information needed to assess the employee‘s performance in a sound, fair and objective way. The appraiser (direct manager) might therefore take all the necessary actions (ask for third party feedback, analyse data…) to ensure he/she has all the elements necessary to have a complete overview of his/her employee’s performance. It is also to be noted that the direct manager is aware whether the appraised is an Identified Staff or not.
The main objective of such annual assessments is to give feedback to employees regarding their performance and competencies and hence recognize the work done, identify developments needs and career aspirations and motivate employees to continue contributing to BIL group performance
.BIL group’s performance management also aims to:• Guarantee fairness and internal consistency throughout the
BIL group;• Promote internal mobility;• Recognise collective efforts done to achieve BIL group
corporate objectives;• Granting a fair bonus.The performance appraisal guidelines and processes are detailed in a practical guide provided to each appraiser and appraised.
The appraisal interview assesses the competencies of the employee as well as the achievement of targets.
Both dimensions are rated on a scale from “5” to “1” and the final assessment score is based on the average of these 2 scores. There is no mathematical formula to set the final score. It is left to the manager’s discretion to round it up or down.
Hereafter is the rating scale and the explanation of the scores:• Rating 5: Very exceptional level of competencies
and performance: the staff member has exceeded all expectations and targets constantly and throughout the year;
• Rating 4: Exceptional level of competencies and performance: the staff member has exceeded expectations and targets;
• Rating 3: Very good level of competencies and performance: the staff member masters his function and has reached all his/her targets;
• Rating 2: Competencies are not entirely in line with expectations and / or poor level of performance: the staff member needs to develop his / her competencies and / or has not reached all his/her targets;
• Rating 1: Competencies do not meet expectations and / or very poor level of performance: the staff member is not considered competent for his / her function or has not reached his/her targets at all.
6.4.1.2. Performance assessment process overview
The process starts with the annual target-setting interview between the appraisers and their direct reports. This interview is recorded in writing in the course of the first quarter. In the course of the second and third quarter, an optional second interview (mid-year appraisal) may take place to monitor first achievements of the objectives and, if need be, adapt them to take the evolution of the professional context into account.
109BIL – Pillar 3 Report 2017
Remuneration Charter and practices
During the last quarter, during the appraisal interviews the skills of the employee and the level of target achievement are assessed on a 1-5 rating scale.
6.4.1.3. Link between remuneration and performance
BIL group aims to attract, retain and motivate highly qualified professionals. BIL group offers remuneration packages that, while in line with market practices, are competitive and attractive, both in terms of amount and structure. An important element of the employees’ remuneration packages is the variable component which is strongly linked to the performance of the BIL group, the entity, the department and the individual.
BIL group can decide, in case of poor performance of the staff member, the department, the entity or BIL group to lower or even to reduce to zero the Variable Remuneration
When it comes to individual performance, the rating given by the appraiser determines whether the staff member is eligible or not to receive Variable Remuneration:• The staff member with a rating from “3” to “5” is eligible for
Variable Remuneration;• The staff member with a rating of “2” is in principle not
eligible for Variable Remuneration;• The staff member with a rating of “1 ” is not eligible for
Variable Remuneration.
Variable compensation for performance should always have an individual component reflecting non-financial performance criteria, such as compliance with internal rules, risk standards and procedures, compliance with the BIL group’s standards in terms of client relationship and ethical behaviour.
6.4.2. Setting-up of objectives
Objectives are cascaded via a top-down approach in order to allow BIL group to achieve its strategic priorities and ensure consistency and coherence throughout the group.
Staff objectives are set-up in a way that ensures that individual performance and development are coherent with BIL group’s ambition, future development and risk management.
6.5. Remuneration structure & pay out modalities
6.5.1. Description of the remuneration structure and components
The principles set out below apply to all employees of BIL group.
However, since BIL group is active in multiple countries, it sometimes needs to align its practices with local regulatory frameworks (e.g. labour, social security and tax laws, codes / rules / circulars issued by the local regulator, etc.) and with local remuneration market practices. Therefore, the structure and components of remuneration packages may slightly differ from one country to another.
The remuneration at BIL group is structured around two pillars: Fixed and Variable Remuneration.
Fixed Remuneration
Base Salary:Portion of the Total Remuneration periodically received in cash. It remunerates the competencies of the staff members, is based on the role and experience of the staff members and is guaranteed irrespective of their performance. Fixed Remuneration may be impacted by a Collective Bargaining Agreement and is generally composed of the following elements:• Monthly salary;• Additional monthly or annual fixed premium if provided for
by contract or by Collective Bargaining Agreement;• Mandatory additional premiums provided for a Collective
Bargaining Agreement.
Fringe Benefits:All advantages received in kind by an employee in addition to his/her Base Salary (such as company cars, pension schemes and loans). These benefits are non-discretionary and do not foster under any circumstances excessive risk-taking.
These benefits are linked to the employee’s classification in the CBA or internal grading (Hay grading) for executives, as well as the seniority within the BIL group.

110 BIL – Pillar 3 Report 2017
Remuneration Charter and practices
None of these benefits are linked to performance. Fringe Benefits depend on each entity’s Remuneration Structure.
Variable Remuneration
Portion of the Total Remuneration received in cash (or cash and instruments for Identified Staff for whom proportionality cannot be applied) which is entirely at BIL group entities’ discretion and is determined on the basis of individual and collective, financial and non-financial performance criteria. In particular it enables the interests of the employee to be aligned with those of BIL group.
For selected sales functions, a formula-based bonus may be setup by a BIL Group entity for a determined period. The formula-based approach considers mainly key performance indicators on assets and revenues applicable to the employee’s yearly bonus computation. Nevertheless, an adjustment factor (reducing the formula based bonus ratio up to 100%) may apply to the computed bonus if the qualitative criteria are not met during the performance year.
6.5.2. Staff identified as Material Risk Takers (MRT)
The list of Identified Staff is fixed at 104 as of December 31, 2017.
6.5.3 Variable Remuneration principles & Upper Limits
A Variable Remuneration is allocated to staff members according to:• The status of the employee (employee/manager/executive)
and his/her job level;• The appraisal scores obtained through the performance
assessment process on the basis of individual and collective, quantitative and qualitative performance criteria;
• The average presence of the employee during the year.
As far as the proportion of Variable Remuneration to the Fixed Remuneration of the Identified Staff is concerned, these proportions are linked to the categories of Identified Staff as well as to the entities or countries where the entities are located.
As a general principle, and as per the CRD IV and the financial Sector Law requirements, the variable component shall not exceed 100% of the Fixed Remuneration. On an exceptional basis, a higher maximum level of the ratio between the fixed
and variable components can be fixed but will in no case exceed 200 % of the fixed component. In such a case, and to comply with the CRD IV law requirements, the Board of Directors of the relevant entities, subject to a prior decision by the General Meeting of Shareholders of BIL S.A., will submit to their respective shareholders a detailed recommendation describing the reasons for, and the scope of, the approval sought (incl. the number of staff affected, their functions and the expected impact on the requirement to maintain a sound capital base). The shareholders’ decision will be taken at the General Meeting. The procedure for increasing the ratio (including the quorum and voting thresholds) as described in CRD IV, the Financial Sector Law and the EBA Guidelines will be strictly followed. Copies of both the recommendation of the board of directors to the shareholders and the shareholders’ decision will be provided to the regulator.
If one of BIL group entities is located in another EU Member States which have chosen to set lower maximum percentages, the ratios defined in this Charter will no longer apply and the local mandatory requirements will be respected.
6.5.4. Variable Remuneration principles for specific categories of staff
6.5.4.1. Non-executive directors in BIL group entities
Non-executive directors do not receive Variable Remuneration. The remuneration of the non-executive directors of BIL S.A. for the exercise of their mandates, is set as follows:• The annual General Meeting of Shareholders of BIL S.A.
decides on the remuneration of non- executive directors; • The annual General Meeting of Shareholders of the relevant
BIL group entities defines the remuneration of their non-executive and independent directors.
A director of BIL S.A. (or of a BIL group entity) who is an employee of BIL S.A. (or of such BIL group entity), does not receive any remuneration for the exercise of its director mandate unless such a director represents the staff.
The annual General Meeting of the Shareholders of BIL S.A., upon proposal of the BRNC, decides each year on the remuneration of the Chairman, Vice-Chairman and the Members of the BoD, including the remuneration of the directors who are members of the specialised Board Committees.

111BIL – Pillar 3 Report 2017
Remuneration Charter and practices
6.5.4.2. Member of the Management Board (MMB) of BIL group
The remuneration of the MMB is defined by the BoD, upon recommendation of the BRNC in accordance with the Applicable Laws and the TOR BRNC. The BRNC may be assisted by independent external advisers who are experts in the field of remuneration, and by the Risk, Human Resources, Compliance, Legal & Tax Departments of BIL.
In order to offer remuneration which is in line with market practice, the BRNC regularly orders a benchmarking study on the basis of which, if need be, it makes proposals to the BoD to adapt the remuneration conditions of the MMB, including the variable components.
If a MMB receives a remuneration (allowances or attendance fees) for a mandate that he/she exercises in the name of or on behalf of BIL group, this remuneration is retroceded to BIL group.
Amount of Variable Remuneration
At the beginning of the year, objectives are set and a target bonus is agreed upon.
This target bonus represents a percentage of the Fixed Remuneration of the MMB. The Variable Remuneration eventually paid out may be higher or lower than the target bonus and depends on the level of achievement of the objectives.
Variable Remuneration is by no means guaranteed, remains discretionary and can be set to zero by the BoD if the BIL group / Business / Individual performances targets are not met.
Drivers of Variable Remuneration
Variable Remuneration is determined on the basis of Key Performance Indicators (KPIs) of 3 types, each type being assessed on the basis of quantitative or qualitative, financial or non-financial criteria :
Group KPIsThese KPIs are common to all MMBs. Entire BIL group results determine whether and to what extend the KPIs are met. They are calculated on the basis of the financial indicators set by the BoD, acting upon recommendation of the BRNC.
Business KPIsThe business KPIs are analysed individually with respect to the targets set for the MMBs for the coming year. The performance assessment depends on the manner in which the business or the support line has taken an active part in the achievement of the group target. The performance assessment includes the monitoring of the risk elements specific to the MMB’s activity line.
Individual KPIs The individual component is analysed separately with respect to the targets set for the MMBs for the coming year, on the basis of Qualitative Criteria such as management skills, the manner in which the MMB has participated in the elaboration and/or the implementation of the transformation plan for his/her entity, support line or business line, and compliance with rules, procedures and values of the BIL group. Below a certain result in the individual assessment, the entire Variable Remuneration amount may be set at zero. This decision is made by the BoD, acting upon the recommendation of the BRNC.
6.5.4.3. Members of Management Boards in BIL group entities
For members of management boards in a BIL group entity (other than BIL), Variable Remuneration components will depend on business and individual KPIs. In case the performance of the entity is not satisfactory, the BRNC can decide to lower the Variable Remuneration (in a consolidated manner). There is no direct link with BIL group’s results, the Variable Remuneration within a BIL group entity being, per se, conditioned by the good results of BIL group that impact on the Bonus Pool defined by the BRNC.
6.5.4.4. Internal Control Functions
The performance analysis and the decision on the Variable Remuneration are performed in all independence for the Internal Control Functions. More precisely, in order to avoid conflicts of interests, the performance indicators in the Internal Control Functions mainly consist of non-financial individual criteria and do not in any case contain financial criteria related to the entities they control.
The performance is assessed on the basis of targets that are mainly qualitative and specific to the Internal Control Functions performed. Although there is no direct link with BIL group’s results, the Variable Remuneration is, per se, conditioned by the good results of BIL group that impact on the Bonus Pool.

112 BIL – Pillar 3 Report 2017
Remuneration Charter and practices
The Variable Remuneration of the Heads of the Internal Control Functions is overseen and decided by the BoD upon recommendation of the BRNC in accordance with the TOR BRNC at BIL group level.
The appraisal, remuneration and objectives’ setting of the Chief Internal Auditor are performed by the Chairman of the BACC, who takes input from the members of the BACC, in accordance with the TOR BRNC.
6.5.4.5. Identified Staff for whom a Target Bonus Model may be set
Variable Remuneration for all other Identified Staff is, discretionary.
For some Identified Staff members, a target bonus model may be set-up in order to condition the pay-out of a bonus to the achievement of certain objectives.
Notwithstanding the setting of the Target Bonus, the Variable Remuneration is in no way guaranteed and its pay-out may be set to zero if the Group / Business / Individual performances targets are not fulfilled.
6.5.5. Variable Remuneration pay-out principles for Identified Staff
6.5.5.1. Procedure governing the payment of Variable Remuneration
Variable Remuneration of Identified Staff members for whom the proportionality principle applies is paid out annually and in cash; the rules described below are hence applicable to the Identified Staff members for whom the proportionality principle cannot be applied only.
6.5.5.2. General rules for deferral
Variable Remuneration of an Identified Staff member higher than EUR 100.000 shall be deferred in order to establish a clear link between the Variable Remuneration and the evolution of his / her performance and potential future impact. In that respect, the performance assessment is part of a multi-annual framework, thereby guaranteeing an assessment of long-term performance. As such, payment of a part of the Variable Remuneration is deferred and subject to the fulfilment of conditions described under 6.5.5.6. and 6.5.6. The Deferred part will not be paid out in case these conditions are not met.
6.5.5.3. Calculation of the deferred part of the variable remuneration
For the MMB, 50% of the total Variable Remuneration is deferred over a period of five years.
For other Identified Staff, 40% of the total Variable Remuneration is deferred over a period of three years.
If the Variable Remuneration is of a particular high amount, the portion of the Variable Remuneration to be deferred will be increased to 60%. Whether the variable component is considered as of a particular high amount will be determined by reference to the CSSF guidelines, once such guidelines will be issued. In the meantime, it has to be understood as Variable Remuneration above EUR 1.000.000.
6.5.5.4. T erms of payment of the Variable Remuneration for the MMB
Principles applied to the non-deferred part
The non-deferred part related to performance year Y, i.e. 50% of the total variable remuneration, is paid during the first semester of Y+1:• 50% (=25% of the total variable remuneration) in cash;• 50% (=25% of the total variable remuneration) in the form
of phantom shares, with a retention period of one year.
Principles applied to the deferred part
• 50% of the deferred part (=25% of the total variable remuneration) is paid in cash in Y+2, Y+3 and Y+4, Y+5, Y+6, vesting on a pro rata basis.
• 50% of the deferred part (=25% of the total variable remuneration) is paid in the form of phantom shares in Y+2, Y+3 and Y+4, Y+5, Y+6,vesting on a pro rata basis and subject to one year retention period.
6.5.5.5. Terms of payment of the Variable Remuneration for other Identified Staff
Principles applied to the non-deferred part
The non-deferred part related to performance year Y, i.e. 60% of the total variable remuneration, is paid during the first semester of Y+1:• 50% (=30% of the total variable remuneration) in cash;• 50% (=30% of the total variable remuneration) in the form
of phantom shares, with a retention period of one year.

113BIL – Pillar 3 Report 2017
Remuneration Charter and practices
Principles applied to the deferred part
• 50% of the deferred part (=20% of the total variable remuneration) is paid in cash in Y+2, Y+3 and Y+4, vesting on a pro rata basis.
• 50% of the deferred part (=20% of the total variable remuneration) is paid in the form of phantom shares in Y+2, Y+3 and Y+4, vesting on a pro rata basis and subject to one year retention period.
6.5.5.6. Conditions of vesting of the deferred element
Any vesting of a deferred Variable Remuneration is subject to a prior analysis of a long term multi-year performance assessment that has to be verified and confirmed within the assessment review. Actual payment of the deferred part of the Variable Remuneration requires in any case the fulfilment of the following conditions:
Performance/ex-post risks adjustments
BIL group may reduce part of, or all the Variable Remuneration that has not been paid out yet in case the sustainability of the performance of the institution as a whole, the entity and / or the staff member is not in line with expectations. As an ex-post risk adjustment measure, Malus will be used to reduce a part of, or all the deferred remuneration in order to take into account the potential negative underlying performance of BIL group as a whole, of BIL group entity or of the Identified Staff individual.
A Malus will be applied:
• In case of misbehavior or serious error by the staff member (e.g. breach of code of conduct and other internal rules, especially concerning risks). If a Malus is applied, all deferred but not yet vested bonus amounts (as well as the bonus amount for the current year) will be reduced in proportion to the severity and impacts of the error / misbehavior;
• When BIL group and/or the underlying BIL group entity suffers a significant downturn in its financial performance. If the performance for the year, assessed at Group and entity level under review is more than 20% lower than those in place when the deferred bonuses were granted, these deferred bonuses will be reduced in proportion to the performance decrease, unless this decrease is fully independent of the strategy employed during the previous years;
• When BIL as a whole and/or the underlying BIL group entity in which the staff member works suffers a significant failure of risk management. If this is the case, all deferred, but not yet vested, bonus amounts (as well as the bonus amount for the current year) will be reduced in proportion to the severity and impacts of the failure;
• In case of significant changes in the institution’s economic or regulatory capital base.
Existence of a professional relationship
There needs to be a professional relationship under a contract of employment or, as the case may be, a mandate as a director and/or as a member of a management board, linking the beneficiary to a BIL group entity on the date of payment. Notwithstanding this principle, if the contract is terminated by statutory or early retirement, or on BIL group’s initiative on grounds other than serious misconduct, or by automatic termination of the employment contract in accordance with article L.121-4 of the Labour Code or by death, the beneficiary whose contract is terminated may, nonetheless, remain entitled to the Deferred Parts of his Variable Remuneration. The Deferred Parts of the Variable Remuneration will be settled in line with the original vesting schedule and the principles of this Charter (in particular ex-post risk adjustments). The Deferred Parts of the Variable Remuneration will not be paid if the beneficiary leaves BIL group voluntarily or if there is a termination on the grounds of serious misconduct. Nevertheless, the BoD reserves the right to adopt a more favourable position, on a case-by-case basis, upon recommendation of the BRNC, in accordance with the applicable laws and the TOR BRNC.
6.5.6. Specific provisions
6.5.6.1. Claw-back
Payment of Variable Remuneration is based on the premise that, during the period when the Identified Staff member was working within BIL group, he / she fully observed the law and the regulations specific to the relevant entity as well as the values of BIL group.
In case fraud is observed after the award of variable remuneration, and in cases where the Variable Remuneration might have been granted on the basis of intentionally erroneous information, the Board of Directors reserves the right to claim back the part of the Variable Remuneration which might already have been paid, or at least to recover equivalent damages and interest, in cases where BIL might have suffered a significant loss.

114 BIL – Pillar 3 Report 2017
Remuneration Charter and practices
BIL has the authority to reclaim any variable compensation granted. The Claw-back provision is applied in case of established or proven fraud or in case of use of misleading information, if enforceable under local employment law.
6.5.6.2. Prohibitions of guaranteed variable remuneration
A Variable Remuneration is no way guaranteed. In very particular circumstances, the only exception relates to the recruitment of new staff members to whom a Variable Remuneration might be guaranteed during the first year of employment.
6.5.6.3. Compensation and buy out from previous employment contract
In exceptional circumstances, the Identified Staff could be entitled to a one time lump sum compensating the loss of the Variable Remuneration by leaving his previous employer.
Variable Remuneration pay-out principles will apply automatically and a dedicated clause will be inserted in the employment contract.
6.5.6.4. Severance payments
Without prejudice to the application of the relevant and applicable legal and regulatory framework and agreements binding the relevant entity, payments associated with the early termination of an employment contract and/or a mandate as a member of the Management Board must reflect effective performance achieved over time and are designed not to reward failure or misconduct.
There are no so called “Golden Parachutes” in the BIL group’s Remuneration Charter.
The BRNC decides in a consolidated manner, on termination packages for MB Members, in the event of termination of an employment and if requires recommend to the BoD for approval.
Severance pay will not be awarded in case of an obvious failure allowing the relevant entity of the BIL group to terminate the employment contract with immediate effect. Failure of Identified Staff will be assessed on a case by case basis and will notably include the situations described in the EBA Guidelines (e.g. acting contrary to BIL internal rules, values and procedures, not meeting BIL’s standard of fitness and proprietary).
Severance pay will not be awarded in case the employee/member of the Management Board resigns. In case the employment contract is terminated by mutual consent, the potential severance payment will be considered and reviewed on a case by case basis and subject to Applicable Laws by the BRNC, and recommended to the BoD for decision.
Severance payments may be paid out in the context of a settlement agreement in order to prevent or terminate a potential or current labour dispute leading to costly and long labour court procedures. Severance payments are granted in the event a labour court might declare the dismissal as unfair. In order to assess whether a dismissal is likely to be declared unfair by labour courts, BIL group will, as need may be, seek to assistance of internal or external labour law specialists.
The labour law specialists will counsel BIL group on the appropriate amount to be granted.
BIL group will ensure that it does not pay severance amounts greater than applicable under the laws, regulations and collective bargaining agreements or exceeding the benefits generally fixed by the competent courts.
Severance pay is considered by the EBA Guidelines, as Variable Remuneration. Severance paid to Identified Staff will thus in principle be subject to all principles described in this Charter (e.g. deferral and payment in instruments) except for those amounts of severance payments that are mentioned under rule 154 of the EBA Guidelines.
6.5.6.5. Prohibition of personal hedging
It is forbidden for staff members to use personal hedge or insurance strategies linked to the remuneration or to responsibility in order to offset the impact of the ex-ante and ex-post risk alignment measures incorporated in the Charter.
Every Identified Staff is asked to comply which such requirement by accepting the principles laid in the Remuneration Charter.
6.6. Governance: roles and responsibilities in the design, implementation and ongoing supervision of the Charter

115BIL – Pillar 3 Report 2017
Remuneration Charter and practices
6.6. Governance: roles and responsibilities in the design, implementation and ongoing supervision of the Charter
6.6.1. The Board of Directors (BoD)
The BoD is responsible for the design, the review and the correct implementation of the Remuneration Charter. It ensures that its compliance with mandatory Applicable Laws,
In this context, the BoD acts upon the recommendation of the BRNC, based on preparation and proposed amendments of the relevant Internal Control Functions (Risk Management, Compliance, Internal Audit), RH and Secretary General departments. If need may be, the BoD may seek the assistance of external remuneration specialists.
The BoD ensures that the implementation of the Charter is reviewed on a regular basis by the BRNC, which must be assisted by the Internal Control Functions or by external experts. Such independent review will assess whether the remuneration system (i) operates as intended, and (ii) is compliant with the Applicable Laws.
The BOD has final decision power and responsibility regarding all aspects of the Remuneration Charter.
6.6.2. The Board of Remuneration and Nominations Committee (BRNC)
BIL operates in the financial market place giving rise to business, regulatory, financial, operational and human capital issues from many aspects of its activities. The BRNC is a BoD specialised committee and has been set up by the BoD in order to ensure the smooth management and operation of all relevant nomination and remuneration matters and as part of the governance structure of BIL. The BRNC operates through two sub-meetings provided for in the BRNC TOR.
The responsibilities and the functioning of the BRNC at the level of BIL S.A. is laid down in the TOR of the BRNC. The TOR BRNC are reviewed regularly by the BRNC and subsequently by the BOD to ensure its perfect compliance with all relevant regulations applicable to BIL (hereafter, the “Applicable Laws”).
Since 1 January 2016, the BRNC is organised in two sub-meetings: • Sub-meeting BRNC siting for Nominations matters;• Sub-meeting BRNC sitting for Remuneration matters.
During 2017, the Board Remuneration and Nominations Committee sitting for remuneration matters held 5 meetings.
6.6.3. The Management Board Members
Whereas the overall responsibility for the Charter is in the hands of the BoD, the Management Board of BIL S.A. ensures the correct operational implementation of the Charter throughout the BIL group and takes all appropriate measures to ensure that the Charter is applied properly and in line with mandatory local regulations.
6.6.4. The Internal Control Functions
BIL group Control Functions review of the Charter are :
6.6.4.1. Internal Audit
• Takes part, in the annual identification of the Identified Staff;
• Takes part in the annual review of the Charter in collaboration with other Control Functions and the Secretary General;
• Reviews on an annual basis the practical application of the Charter within BIL group.
6.6.4.2. Compliance
• Takes part, in the annual identification of the Identified Staff.
• Takes part to the annual review of the Remuneration Charter to ensure it effectively complies with regulatory requirements, in close collaboration with the other Control Functions and the Secretary General;
• Communicates to the HR Department any new regulations to be taken into account with regard to the Charter;
• Performs on a regular basis a gap analysis of the Charter compared to new regulations.

116 BIL – Pillar 3 Report 2017
Remuneration Charter and practices
6.6.4.3. Risk Management
• Takes part, if need be, in the update of the Charter, especially regarding the definition/identification of the identified Staff.
6.6.5. Human Resources
The role of BIL group Human Resources function in the design and the review of the Charter is as follows:
• HR is the process owner and coordinator of the Charter definition and implementation process;
• HR proceeds to the annual review and updates the Charter on the basis of the new regulatory requirements in collaboration with other Control Functions and adapt BIL group procedures and processes accordingly;
• HR informs staff and concerned parties about all changes;• HR coordinates the circulation of the Charter within BIL
group, follow-up on the approval by local management, keeps track of the finalised version applicable in each entity;
• HR ensures that BIL group entities comply with the Charter during the appraisal/reward process (coherence checks, awareness of managers, etc...);
• HR, together with General Secretary, initiates updates especially regarding the identification of the Identified Staff;
• HR manages the day-to-day performance assessment and pay-out processes.
6.7. Diversity and succession plan at the level of the Management Body
The Board of Directors of BIL has approved (December 16, 2016) the Diversity Charter to be considered by the bank when selecting members of the Management Body.
The purpose in establishing the Diversity Charter is to document the principles, commitment and measurable objectives in relation to diversity upon which BIL forms and implements its nomination strategy for its Management Bodies.
In making recommendations to the Board regarding potential candidates, the Board Remuneration and Nominations Committee sitting in nomination matters will consider among others the following diversity criteria:• Age and experience;• Gender;• Geographical background; and• Educational background.
The quantitative objective laid down in the Charter with regard to the underrepresented gender is to reach a minimum of three persons among the Members of the Management Body representing at least 5% out of the total number of the Management Body members by the year 2020, and a minimum of five persons representing at least 10% out of the total number of the Management Body members by the year 2024.
The BRNC-N is responsible to review on a regular and at least annual basis the Diversity Charter and its implementation.
Regarding the recruitment policy for the selection and appointment of the Management Body member(s) to fill vacancies, the assessment will consider the candidate(s) good repute, the balance of knowledge, skills, diversity, time and availability to perform his/her duties, gender, experience and number of executive and non-executive directorships of a candidate. The Management Body shall possess adequate collective knowledge, skills and experience to be able to understand the Banks’ activities, including the main risks.
When a position of Management Body member(s) vacates, the members of the BRNC sitting in Nomination matters will liaise and cooperate in order to select and recommend an appropriate candidate(s) to fill in the vacancy as soon as possible taking into account the following criteria: reputation criteria, experience criteria, governance criteria, independence criteria (BoD candidates), individual and collective requirements. The suitability of the Management Body member(s) is assessed according to the EBA guidelines of November 22, 2012 (EBA/GL/2012/06).
The initial assessment of candidate(s) and the periodic assessments of members of the Management Body is performed in accordance with the Bank Succession Charters.
For the year 2017, one new Board Member was assessed to replace a departing Board Member. The fit and proper exercise was positive and the regulators non objection granted.

117BIL – Pillar 3 Report 2017
Remuneration Charter and practices
6.8. CRD IV mandates limitation
Regarding the number of directorships held by the Management Body, the Board assessed in July 2016 the compliance of the members of the Board of Directors with the CRD IV mandates limitation.
The conclusion by the BRNC-N assessment is that there is no violation of the limitation requirement.
One Director holds 5 non-executive mandates, whereby an exception (+1 non-executive mandate versus the standard rule of 4 non-executive mandates) could be requested to the CSSF. However, given the upcoming change in the Board composition, such request is considered to be unnecessary at this stage. Consequently, the Board members are considered by the Board to have sufficient time available to perform their duties as a directors of BIL.
In consideration of the CRD IV and article 38-2 of the Law of 5 April 1993 on the Financial Sector as amended with regards to the limitation of mandates of BIL’s Management Body, the summary of the 2017 annual assessment exercise is the following:
Board of Directors:• Mr. Luc Frieden holds three non-executive directorships
within three different groups.• Mr. George Nasra holds two non-executive directorships
within the same group counting as one non-executive mandate based on the Privileged Counting.
• Mr. Hugues Delcourt holds (i) one executive mandate, (ii) two non-executive mandates within the same group which should be counted as one directorship and (iii) one non-executive mandate within a different group as BIL S.A..
• Mr. Nicolas Harvey holds two non-executive directorships within the same group counting as one non-executive mandate based on the Privileged Counting.
• Mr. Wildgen holds two non-executive directorships within the same group counting as one non-executive mandate based on the Privileged Counting.
• Mr. Maurice Lam holds (i) two non-executive directorships within the same group counting as one non-executive mandate based on the Privileged Counting and (ii) one non-executive mandate in a different group.
• Mr. Schaack holds (i) one non-executive mandate in BIL S.A., (ii) five non-executive directorships within a different group as BIL S.A. counting as one non-executive mandate based on the Privileged Counting and (iii) one non-executive mandate in a third group.
• The staff representatives members of the Board of Directors holds one-executive mandate each.
Management Board:• Mr. Hugues Delcourt (please refer to point 1 above).• Mr. Pierre Malevez holds (i) one executive mandate at the
level of BIL S.A., (ii) seven non-executive directorships within the same group counting as one non-executive mandate based on the Privileged Counting, and (iii) one non-executive mandate held within another group.
• Mr. Nico Picard holds seven non-executive directorships counting as one directorship based on the Privileged Counting.
• Mr. Stéphane Albert holds one executive directorship and three non-executive directorship counting as one directorship based on Privileged Counting.
• Mr. Yves Baguet holds (i) one executive mandate at the level of BIL S.A. and (ii) two non-executive directorships within the same group counting as one non-executive mandate based on the Privileged Counting.
• Mr. Hans-Peter Borgh holds (i) one executive mandate at the level of BIL S.A., (ii) four non-executive directorships within the BIL Group counting as one non-executive mandate based on the Privileged Counting, and (iii) one non-executive mandate held within another group.
• Mr. Debehogne holds one executive mandate at the level of BIL S.A.
• Mr. Marcel Leyers holds, (i) one executive mandate at the level of BIL S.A., (ii) five non-executive directorships within the BIL Group counting as one non-executive mandate based on the Privileged Counting, and (iii) two non-executive mandates held within two different groups.
• Mr. Mommens holds (i) one executive mandate at the level of BIL S.A., (ii) ten non-executive directorships within the BIL Group counting as one non-executive mandate based on the Privileged Counting.”

118 BIL – Pillar 3 Report 2017
Remuneration Charter and practices
6.9. Disclosure
6.9.1. Internal disclosure
Employees of BIL group are informed through the Intranet and/or by their hierarchy on the annual performance assessment and reward process and the main principles of this Charter.
The discretionary nature of the Variable Remuneration is mentioned in the employment contracts.
BIL group informs its staff members appropriately and timely of any amendments to the Charter which might affect them.
6.9.2. External disclosure
As set out in article 450 (Part Eight) of EU Regulation 575/2013 on prudential requirements and article 22(2) & (f) of the EU Directive 2011/61 on AIFM, BIL group makes available to the public information regarding its remuneration policy and practices for those categories of staff whose professional activities have a material impact on BIL group’s risk profile (i.e. the Identified Employees).

119BIL – Pillar 3 Report 2017
Remuneration Charter and practices
6.10. Quantitative informationThe tables below show data on remuneration for all staff and are expressed in EUR.
Information on remuneration of Identified Staff on December 31, 2017:
Senior Management Other Identified Staff MEMBERS (HEADCOUNT) 50 46TOTAL FIXED 13,179,711 8,112,308
of which: fixed in cash 13,179,711 8,112,308of which: fixed in shares and share- linked instruments 0 0
of which: fixed in other types instruments 0 0TOTAL VARIABLE REMUNERATION (IN EUR) 7,028,510 2,753,390
of which: variable in cash 4,313,974 1,928,355of which: variable in shares and share-linked instruments 0 0
of which: variable in other types instruments 2,714,536 825,035TOTAL AMOUNT OF VARIABLE REMUNERATION AWARDED IN YEAR N WHICH HAS BEEN DEFERRED (IN EUR) 2,478,793 660,028
of which: deferred variable in cash in year N 1,239,396 330,014of which: deferred variable in shares and share-linked instruments in year N 0 0
of which: deferred variable in other types of instruments in year N 1,239,396 330,017
Additional information regarding the amount of total variable remunerationArticle 450 h(iii)CRR – total amount of outstanding deferred variable remuneration awarded in previous periods and not in year N (in EUR) 4,558,494 476,749
Total amount of explicit ex post performance adjustment applied in year N for previously awarded remuneration (in EUR)
0 0
Number of beneficiaries of guaranteed variable remuneration (new sign-on payments) 3 0
TOTAL AMOUNT OF GUARANTEED VARIABLE REMUNERATION (NEW SIGN-ON PAYMENTS) (IN EUR) 102,024 0
Number of beneficiaries of severance payments 1 0Total amount of severance payments paid in year N (in EUR) 140,391 0Article 450 h(v) – Highest severance payment to a single person (in EUR) 0 0Number of beneficiaries of contributions to discretionary pension benefits in year N 0 0
TOTAL AMOUNT OF CONTRIBUTIONS TO DISCRETIONARY PENSION BENEFITS (IN EUR) IN YEAR N20 0 0
Total amount of variable remuneration awarded for multi- year periods under programmes which are not revolved annually (in EUR) 0 0

120 BIL – Pillar 3 Report 2017
Remuneration Charter and practices
Business areas Senior Management
Investment banking Retail banking Asset
managementCorporate functions
Independent control
functionsAll other
Number of members (Headcount) 50 63 577 501 664 220 57
Total remuneration (in EUR) 20,208,220 6,819,953 49,152,250 59,952,059 57,104,970 20,547,934 4,072,179,52
In 2017, one Identified Staff member has received a total remuneration between 1,5 million and 2 million Euro.
Information on remuneration for all staff on December 31, 2017:

121 BIL – Pillar 3 Report 2017
Appendix 1: Declaration of the Management Body
In accordance with point 61 of the CSSF Circular 12/552, as amended (the ”Circular”), BIL’s Management Body confirms that it respects the Circular among others in its aspects related to risk management and that they are adequate with regard to the Bank’s profile and strategy, these arrangements being already implemented or making part of an action plan with the aim to reach this objective.
This declaration is based on the reliability of the risk-related information communicated to the Management Body through the dedicated channels foreseen by the governance, in particular but not limited to the Board Risk Committee - a sub-committee of the Board of Directors, where the risk exposures are compared to the Board’s risk appetite, and where significant risk events and issues are reported and discussed.

Banque Internationale à Luxembourg SA
69, route d’EschL-2953 LuxembourgRCS Luxembourg B-6307T: (+352) 4590 -1F: (+352) 4590-2010
www.bil.com