pile foundation design example design step pgororong.tistory.com/attachment/cfile29.uf@124c... ·...
TRANSCRIPT
Design Step P.9 - Determine Factored Axial Geotechnical Resistance for Single Pile
37
Design Step P.10 - Check Drivability of Pile 38
Design Step P.11 - Do Preliminary Pile Layout Based on Factored Loads and Overturning Moments
53
Design Step P.12 - Evaluate Pile Head Fixity 63
Design Step P.13 - Perform Pile Soil Interaction Analysis 65
Design Step P.14 - Check Geotechnical Axial Capacity 77
Design Step P.15 - Check Structural Axial Capacity (in lower portion of pile)
78
Design Step P.16 - Check Structural Axial Capacity in Combined Bending and Axial Load (upper portion of pile)
79
Design Step P.17 - Check Structural Shear Capacity 89
Pile Foundation Design ExampleDesign Step P
Table of Contents Page
Design Step P.1 - Define Subsurface Conditions and Any Geometric Constraints
2
Design Step P.2 - Determine Applicable Loads and Load Combinations
13
Design Step P.3 - Factor Loads for Each Combination 14
Design Step P.4 - Verify Need for a Pile Foundation 16
Design Step P.5 - Select Suitable Pile Type and Size 23
Design Step P.6 - Determine Nominal Axial Structural Resistance for Selected Pile Type / Size
32
Design Step P.7 - Determine Nominal Axial Geotechnical Resistance for Selected Pile Type / Size
33
Design Step P.8 - Determine Factored Axial Structural Resistance for Single Pile
36
P-1
Design Step P.18 - Check Maximum Horizontal and Vertical Deflection of Pile Group at Beam Seats Using Service Load Case
91
Design Step P.19 - Additional Miscellaneous Design Issues 92
References 103
Design Step P.1 - Define Subsurface Conditions and Any Geometric Constraints
This task involves determining the location and extent of soil and rock materials beneath the proposed abutment and determining engineering design properties for each of those materials. It also includes identification of any specific subsurface conditions that may impact the performance of the structure. The design of the foundation system needs to address any identified issues.
A subsurface investigation was conducted at the site. Two test borings were drilled at each substructure unit. Soils were sampled at 915mm intervals using a split spoon sampler in accordance with ASTM D-1586. Rock was continuously sampled with an N series core barrel in accordance with ASTM D-2113.
For Abutment 1, one boring was drilled at each side of the abutment. These borings are illustrated graphically in Section A1 below.
Refer to Design Step 1 for introductory information about this design example. Additional information is presented about the design assumptions, methodology, and criteria for the entire bridge, including the Pile Foundation Design.
The following units are defined for use in this design example:
kN 1000 N⋅= MPa N
mm2=
P-2
ELE
VA
TIO
N (F
EE
T)Centerline
Bridge Prop. Bottom of FootingElev. 101
Loose SiltySand (sm)
Hard GreySandstone
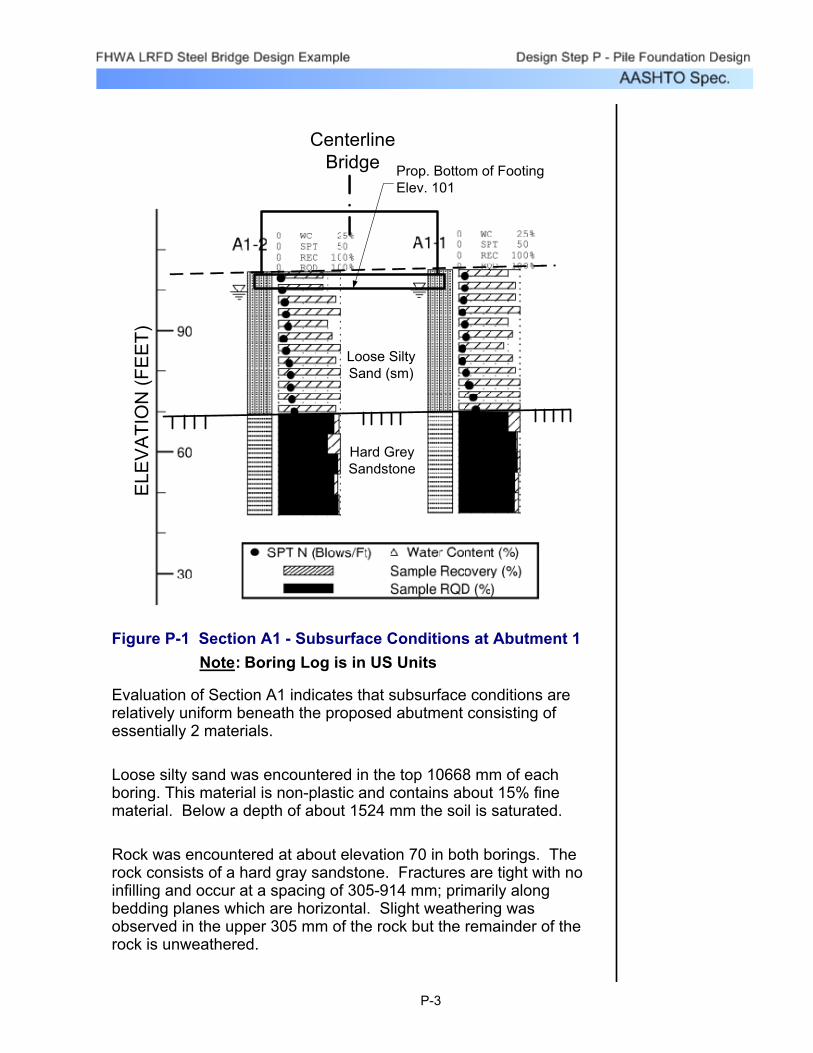
Figure P-1 Section A1 - Subsurface Conditions at Abutment 1Note: Boring Log is in US Units
Evaluation of Section A1 indicates that subsurface conditions are relatively uniform beneath the proposed abutment consisting of essentially 2 materials.
Loose silty sand was encountered in the top 10668 mm of each boring. This material is non-plastic and contains about 15% fine material. Below a depth of about 1524 mm the soil is saturated.
Rock was encountered at about elevation 70 in both borings. The rock consists of a hard gray sandstone. Fractures are tight with no infilling and occur at a spacing of 305-914 mm; primarily along bedding planes which are horizontal. Slight weathering was observed in the upper 305 mm of the rock but the remainder of the rock is unweathered.
P-3

Special Geotechnical Considerations:
The loose fine sandy soils could be subject to liquefaction under seismic loading. Liquefaction is a function of the anticipated maximum earthquake magnitude and the soil properties. If liquefaction is a problem, the soils can not be relied upon to provide lateral support to deep foundation systems. For this example it is assumed that the potential for liquefaction has been evaluated and has been found to be negligible. (Note: Seed and Idriss (NCEER-97-0022) provides more up to date material for evaluation of liquefaction)
C10.5.4, SAppendix A10
The weight of the approach embankment will cause compression of the loose soil horizon. The granular material should compress essentially elastically with little or no long term consolidation. However, since the full height abutment will likely be placed prior to completion of the approach embankment in the vicinity of the abutment, soil compression beneath the abutment must be accounted for in foundation design. For shallow foundations, this compression will result in settlement and rotation of the footing. For deep foundations this compression could result in negative skin friction (downdrag) loads on the foundation elements; particularly in the back row of piles.
S10.7.1.4, C10.7.1.4
P-4
Υeff 762 kg
m3=
Υeff Υwet Υwater−=Effective unit weight:
Υwater 1000 kg
m3=Unit weight of water:
Υwet 1762 kg
m3⋅=Wet unit weight:
Υdry 1442 kg
m3⋅=Dry unit weight:
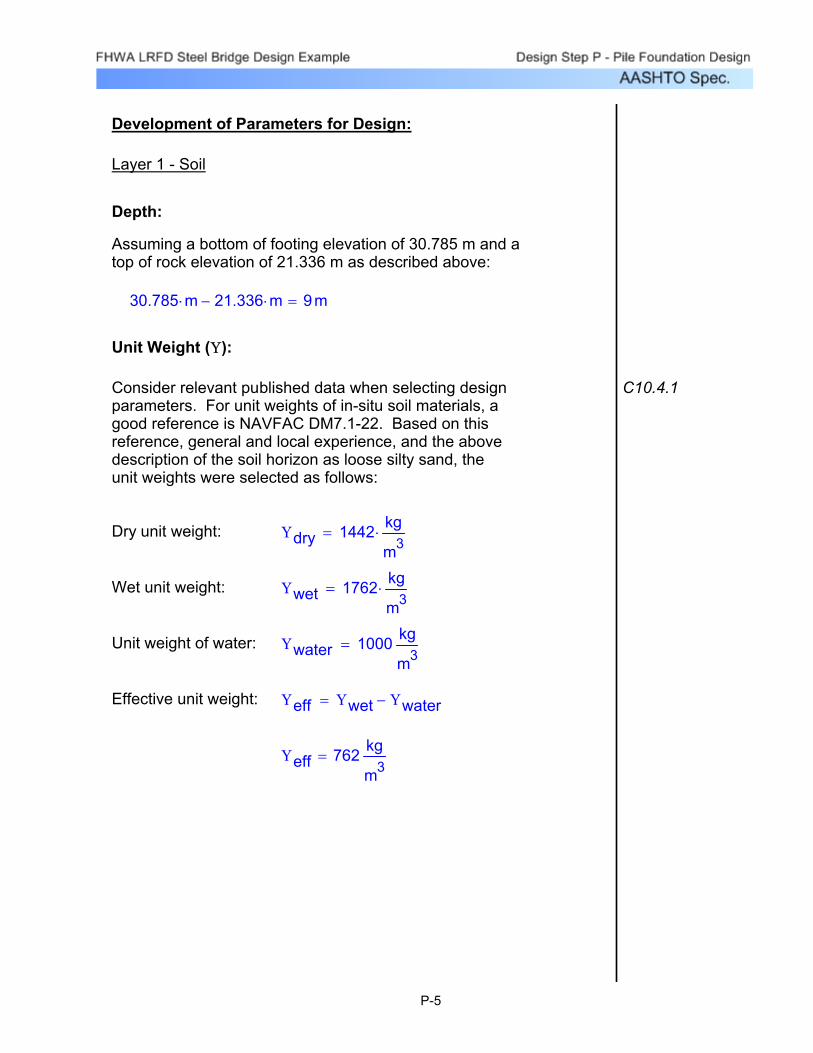
C10.4.1Consider relevant published data when selecting design parameters. For unit weights of in-situ soil materials, a good reference is NAVFAC DM7.1-22. Based on this reference, general and local experience, and the above description of the soil horizon as loose silty sand, the unit weights were selected as follows:
Unit Weight (Υ):
30.785 m⋅ 21.336 m⋅− 9m=
Assuming a bottom of footing elevation of 30.785 m and a top of rock elevation of 21.336 m as described above:
Depth:
Layer 1 - Soil
Development of Parameters for Design:
P-5

This formula is implemented for each of the borings below. Wet unit weight is used for the soil above the water table and effective unit weight is used for the soil below the water table.
iNumber of soil layer under consideration:
ΥeffiEffective unit weight of soil layer i (kg/m^3):
hiThickness of soil layer i above point being considered (mm):
where:
σ'ν Σ hi Υeffi⋅( )= Υeffi
σ'νVertical effective stress at bottom of sample (MPa):
N2SPT blow count (Blows/300mm):
NcorrCorrected SPT blow count (Blows/300mm) Note: The formula above is generally considered valid for values of σ' > 0.02394 MPa (Bowles 1977):
where:
SEquation 10.7.2.3.3-4
Ncorr 0.77 log 1.92σ'ν
⎛⎜⎝
⎞
⎠⋅⎛
⎜⎝
⎞
⎠N⋅=
σ'ν
The angle of internal friction can be estimated based on correlation to Standard Penetration Test (SPT) N values. The raw SPT N-values determined in the test borings must be corrected for overburden pressure as follows:
Angle of internal friction (ϕ):
P-6

Depth to Top of Sample
(mm)
Depth to Bottom of
Sample (mm)
Υef f i
(kg/m^3)σν'
(MPa)
N2
Blows/300mm (BPMM)
Ncorr
Blows/300mm (BPMM)
0 457 1762 0.0079 5 9914 1371 1762 0.0237 5 71829 2286 762.5 0.0305 4 62743 3200 762.5 0.0374 3 43658 4115 762.5 0.0442 5 64572 5029 762.5 0.0511 6 75486 5943 762.5 0.0579 3 46401 6858 762.5 0.0647 3 37315 7772 762.5 0.0716 6 78230 8687 762.5 0.0784 9 109144 9601 762.5 0.0853 12 12
10058 10515 762.5 0.0921 14 14
0 457 1762 0.0079 2 4914 1371 1762 0.0237 3 41829 2286 762.5 0.0305 5 72743 3200 762.5 0.0374 6 83658 4115 762.5 0.0442 8 104572 5029 762.5 0.0511 4 55486 5943 762.5 0.0579 6 76401 6858 762.5 0.0647 9 107315 7772 762.5 0.0716 10 118230 8687 762.5 0.0784 10 119144 9601 762.5 0.0853 11 11
10058 10515 762.5 0.0921 13 13
Boring A1-2
Boring A1-1
Table P-1 Calculation of Corrected SPT Blow Count
Find average values for zone between bottom of footing and top of rock. This means ignoring the first two values of each boring.
N2 7.35= BPMM
Ncorr 8.3= BPMM
P-7

oφ'f 31=say oφ'f 32=
φ'f a Ncorr⋅ b+=
Thus
b 27.5=
Ncorr 8.3=
a 0.5=
a and b are as listed in Table P-2.
where:
φ'f a Ncorr⋅ b+= b
This correlation can be expressed numerically as:
Table P-2 Correlation
DescriptionVery
Loose Loose Medium DenseVery
DenseNcorr = 0-4 4-10 10-30 30-50 >50
ϕf = 25-30o 27-32o 30-35o 35-40o 38-43o
a = 0.5 0.5 0.25 0.15 0b = 27.5 27.5 30 33 40.5
The correlation published in FHWA-HI-96-033 Page 4-17 (after Bowles, 1977) is used to determine the angle of internal friction. This correlation is reproduced below.
P-8

G0 2400000Pa=
G0E0
2 1 ν+( )⋅=
From Elastic Theory:
Shear Modulus (G):
ν 0.25=Loose Fine Sand:
STable 10.6.2.2.3b-1
Estimating ν from description
Poisons Ratio (ν):
E0 6 MPa⋅=
Based on above, use:
MPaE0 6=
E0 0.7 Ncorr⋅=
STable 10.6.2.2.3b-1
E0 0.7 N1⋅= N1
Clean fine to medium sands and slightly silty sands
Note, in Table 10.6.2.2.3b-1 N1 is equivalent to Ncorr
Estimating E0 from Ncorr
7.5 - 10 MPaLoose Fine Sand E0 =
STable 10.6.2.2.3b-1
Estimating E0 from description
Modulus of elasticity (E):
P-9
Coefficient of variation of subgrade reaction (k):
As per FHWA-HI-96-033, Table 9-13:
This is used for lateral analysis of deep foundation elements
Submerged Loose Sand
k 5430 kN
m3⋅=
Layer 2 - Rock:
Depth:
Rock is encountered at elevation 70 and extends a minimum of 7620 mm beyond this point.
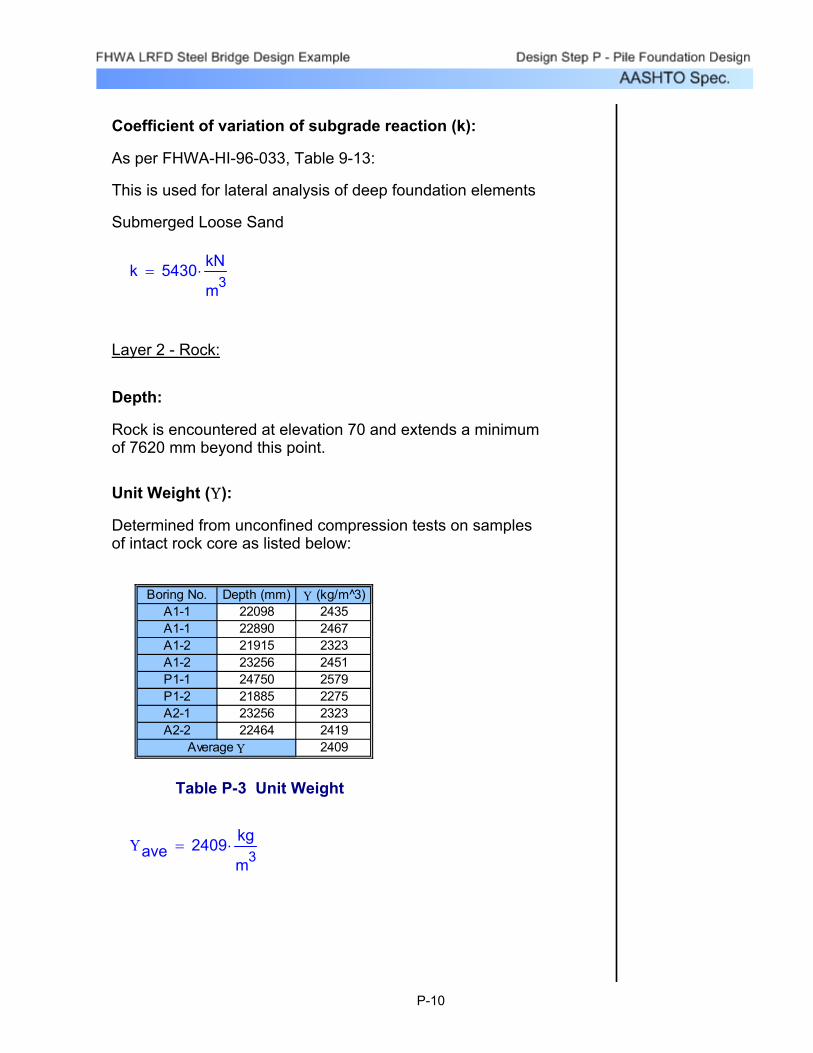
Unit Weight (Υ):
Determined from unconfined compression tests on samples of intact rock core as listed below:
Boring No. Depth (mm) Υ (kg/m^3)A1-1 22098 2435A1-1 22890 2467A1-2 21915 2323A1-2 23256 2451P1-1 24750 2579P1-2 21885 2275A2-1 23256 2323A2-2 22464 2419
2409Average Υ
Table P-3 Unit Weight
Υave 2409 kg
m3⋅=
P-10

Unconfined Compressive Strength (q):
Determined from unconfined compression tests on samples of intact rock core as listed below:
Boring No. Depth (mm) qu (Pa)A1-1 22098 89149210A1-1 22890 72050210A1-2 21915 44471180A1-2 23256 89493950P1-1 24750 96940290P1-2 21885 46194870A2-1 23256 92527640A2-2 22464 102662900
79186281Average qu
Table P-4 Unconfined Compressive Strength
quave 79186281 Pa⋅=
Modulus of elasticity (E): STable 10.6.2.2.3d-2
This is to be used for prediction of deep foundation response
For sandstone, Average: E0 14700 MPa⋅=
Poisons Ratio (ν): STable 10.6.2.2.3d-1
This is to be used for prediction of pile tip response
For sandstone, Average: νave 0.2=
P-11

Shear Modulus (G):
From elastic theory
G0E0
2 1 νave+( )⋅=
G0 6125000000Pa=
G0 6125 MPa⋅=
Rock Mass Quality:
Rock mass quality is used to correct the intact rock strength and intact modulus values for the effects of existing discontinuities in the rock mass. This is done through empirical correlations using parameters determined during core drilling.
Data from the test borings is summarized below:
Depth (mm)
Run Length (mm)
Recovery (%)
RQD (%)
10668 1524 100 8012192 1524 96 9413716 1524 100 9615240 1524 98 9216764 1524 98 90
10668 1524 98 9012192 1524 100 8013716 1524 100 9615240 1524 96 9016764 1524 98 96
98.4 90.4
Boring A1-1
Boring A1-2
Averages
Table P-5 Rock Mass Quality
P-12

Design Step P.2 - Determine Applicable Loads and Load Combinations
Loads and load combinations are determined elsewhere in the design process. The critical load cases for evaluation of foundation design are summarized below:
1). The load combination that produces the maximum vertical load on the foundation system. This will typically be a Strength I and a Service I load case with the maximum load factors applied.
2). The load combination that produces the maximum overturning on the foundation which will tend to lift a spread footing off the bearing stratum or place deep foundation elements in tension.
3). The load combination that produces the maximum lateral load. If several combinations produce the same horizontal load, select the one with the minimum vertical load as this will be critical for evaluation of spread footing sliding or response of battered deep foundations. In some cases, particularly deep foundations employing all vertical elements, the highest lateral load and associated highest vertical load should also be evaluated as this case may produce higher foundation element stress and deflections due to combined axial load and bending in the foundation elements.
P-13

Design Step P.3 - Factor Loads for Each Combination
It is extremely important to understand where the loads are being applied with respect to foundation design. In this case the loads were developed based on an assumed 3125 mm wide by 14287.5 mm long footing that is offset behind the bearings a distance of 533.4 mm. The loads are provided at the horizontal centroid of the assumed footing and at the bottom of that footing. A diagram showing the location and direction of the applied loads is provided below.
X
Z
Y
P
M
MP
P
vert
trans
long
long
trans
CLFooting
CLBearings
CL Footingand Bridge
Bottom of footing
Horizontal centroid of footing
NOTE: Loads and moments shown inpositive direction
L = 14287.5 mm
B = 3125 mm533.4 mm 1028.7 mm
Figure P-2 Application of Loads
P-14

LIMIT STATE
AXIAL FORCE
Pv ert
(N)
LONG MOMENT
Mlong
(N-m)
TRANS MOMENT
Mtrans
(N-m)
LATERAL LOAD
(IN LONG. DIR.)
Plong (N)
LATERAL LOAD
(IN TRANS. DIR.)
Ptrans (N)STR-I
MAX/FIN 10021840 10430308 0 3803229 0
SER-I MAX/FIN
7966765 6472675 219643 2539935 44482
STR-I MIN/FIN
8273692 9885269 0 3803229 0
SER-I MIN/FIN
7966765 6384547 219643 2526590 44482
STR-III MAX/FIN
8073522 8641984 688756 3500750 164584
SER-I MAX/FIN 7966765 6472675 219643 2539935 44482
Maximum Vertical
Load
Maximum Overturning
Maximum Lateral Load
Table P-6 Summary of Factored Loads
It should be noted that the calculations performed in Design Step P are based on preliminary pile foundation design forces. In an actual design, the geotechnical engineer would need to revisit the pile foundation design calculations and update the results based on the final design bottom of booting forces given at the end of Design Step 7.7.
P-15
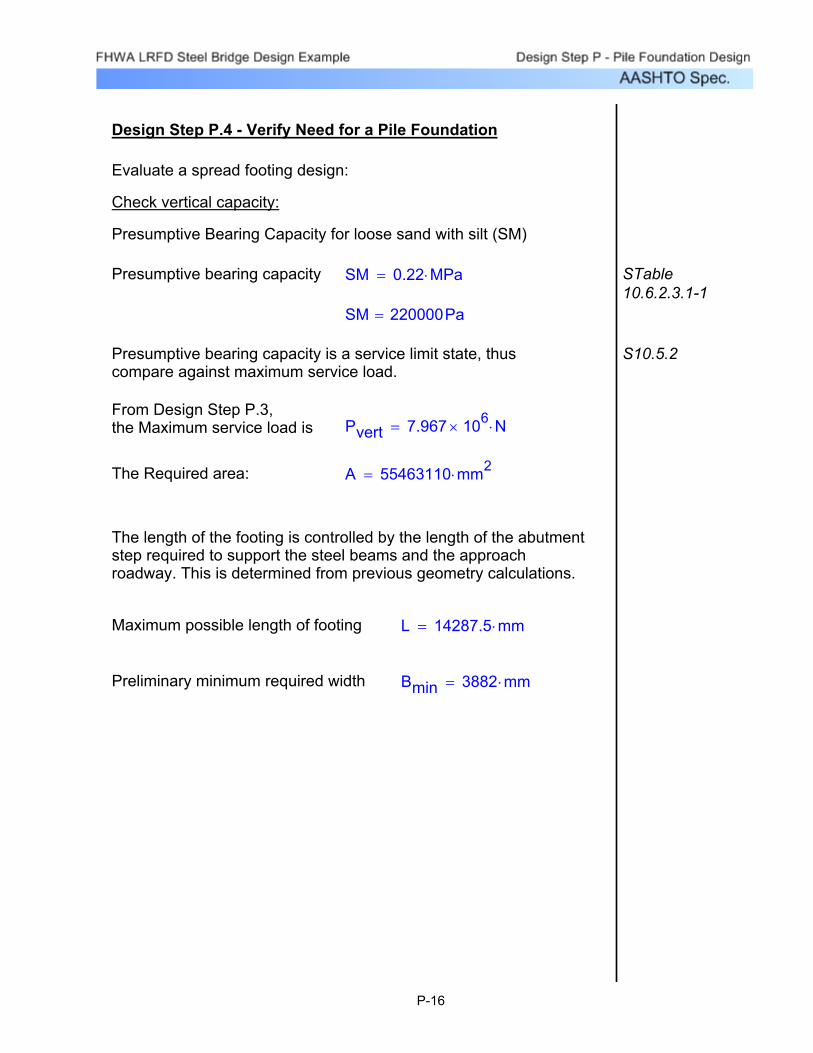
Bmin 3882 mm⋅=Preliminary minimum required width
L 14287.5 mm⋅=Maximum possible length of footing
The length of the footing is controlled by the length of the abutment step required to support the steel beams and the approach roadway. This is determined from previous geometry calculations.
A 55463110 mm2⋅=The Required area:
Pvert 7.967 106× N⋅=From Design Step P.3, the Maximum service load is
S10.5.2Presumptive bearing capacity is a service limit state, thus compare against maximum service load.
SM 220000Pa=
STable 10.6.2.3.1-1
SM 0.22 MPa⋅=Presumptive bearing capacity
Presumptive Bearing Capacity for loose sand with silt (SM)
Check vertical capacity:
Evaluate a spread footing design:
Design Step P.4 - Verify Need for a Pile Foundation
P-16
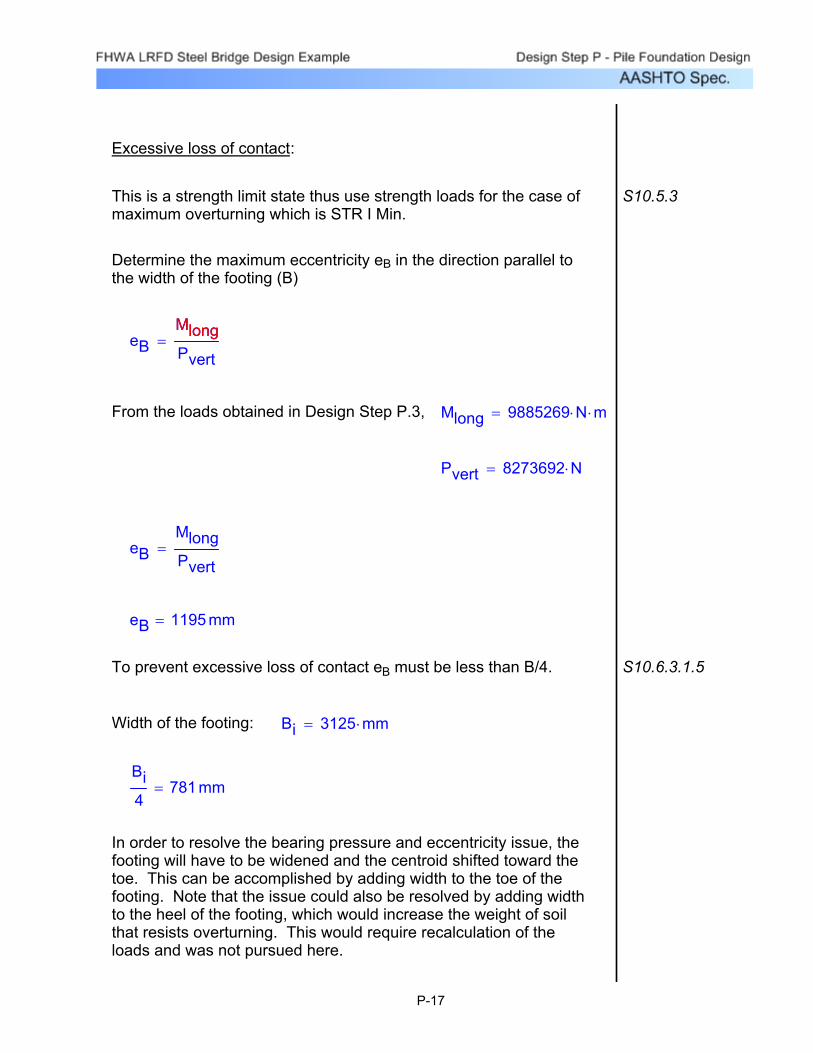
In order to resolve the bearing pressure and eccentricity issue, the footing will have to be widened and the centroid shifted toward the toe. This can be accomplished by adding width to the toe of the footing. Note that the issue could also be resolved by adding width to the heel of the footing, which would increase the weight of soil that resists overturning. This would require recalculation of the loads and was not pursued here.
Bi4
781 mm=
Bi 3125 mm⋅=Width of the footing:
S10.6.3.1.5To prevent excessive loss of contact eB must be less than B/4.
eB 1195 mm=
eBMlongPvert
=
Pvert 8273692 N⋅=
Mlong 9885269 N⋅ m⋅=From the loads obtained in Design Step P.3,
eBMlongPvert
=Mlong
Determine the maximum eccentricity eB in the direction parallel to the width of the footing (B)
S10.5.3This is a strength limit state thus use strength loads for the case of maximum overturning which is STR I Min.
Excessive loss of contact:
P-17
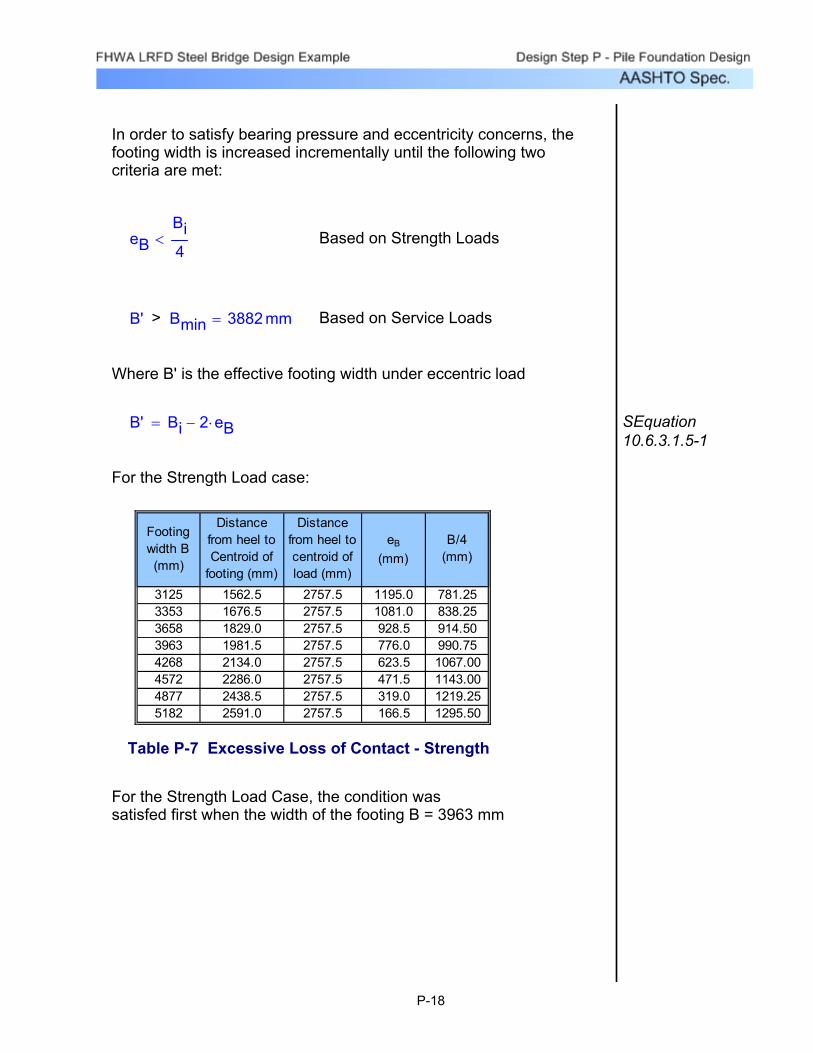
In order to satisfy bearing pressure and eccentricity concerns, the footing width is increased incrementally until the following two criteria are met:
eBBi4
< Based on Strength Loads
B' > Bmin 3882 mm= Based on Service Loads
Where B' is the effective footing width under eccentric load
B' Bi 2 eB⋅−= SEquation 10.6.3.1.5-1
For the Strength Load case:
Footing width B (mm)
Distance from heel to Centroid of
footing (mm)
Distance from heel to centroid of load (mm)
eB
(mm)B/4
(mm)
3125 1562.5 2757.5 1195.0 781.253353 1676.5 2757.5 1081.0 838.253658 1829.0 2757.5 928.5 914.503963 1981.5 2757.5 776.0 990.754268 2134.0 2757.5 623.5 1067.004572 2286.0 2757.5 471.5 1143.004877 2438.5 2757.5 319.0 1219.255182 2591.0 2757.5 166.5 1295.50
Table P-7 Excessive Loss of Contact - Strength
For the Strength Load Case, the condition was satisfed first when the width of the footing B = 3963 mm
P-18

For the Service Load Case
eBMlongPvert
=
From the loads obtained from Design Step P.3, Mlong 6472675 N⋅ m⋅=
Pvert 7966765 N⋅=
eBMlongPvert
=
eB 812 mm=
Footing width B (mm)
Distance from heel to Centroid of
footing (mm)
Distance from heel to centroid of load (mm)
eB (mm) B' (mm)
3125 1562.5 2374.50 812.0 15013353 1676.5 2374.50 698.0 19573658 1829.0 2374.50 545.5 25673963 1981.5 2374.50 393.0 31774268 2134.0 2374.50 240.5 37874572 2286.0 2374.50 88.5 43954877 2438.5 2374.50 -64.0 5005
Table P-8 Presumptive Bearing Pressure - Service
For the Service Load Case, the condition was satisfed first when the width of the footing B = 4572 mm
The first width to satisfy both conditions is 4572 mm. Which would require the toe of the footing to be extended:
∆B 4572 mm⋅ Bi−=
∆B 1447 mm=
This increase may not be possible because it may interfere with roadway drainage, roadside utilities, or the shoulder pavement structure. However, assume this is not the case and investigate potential settlement of such a footing.
P-19
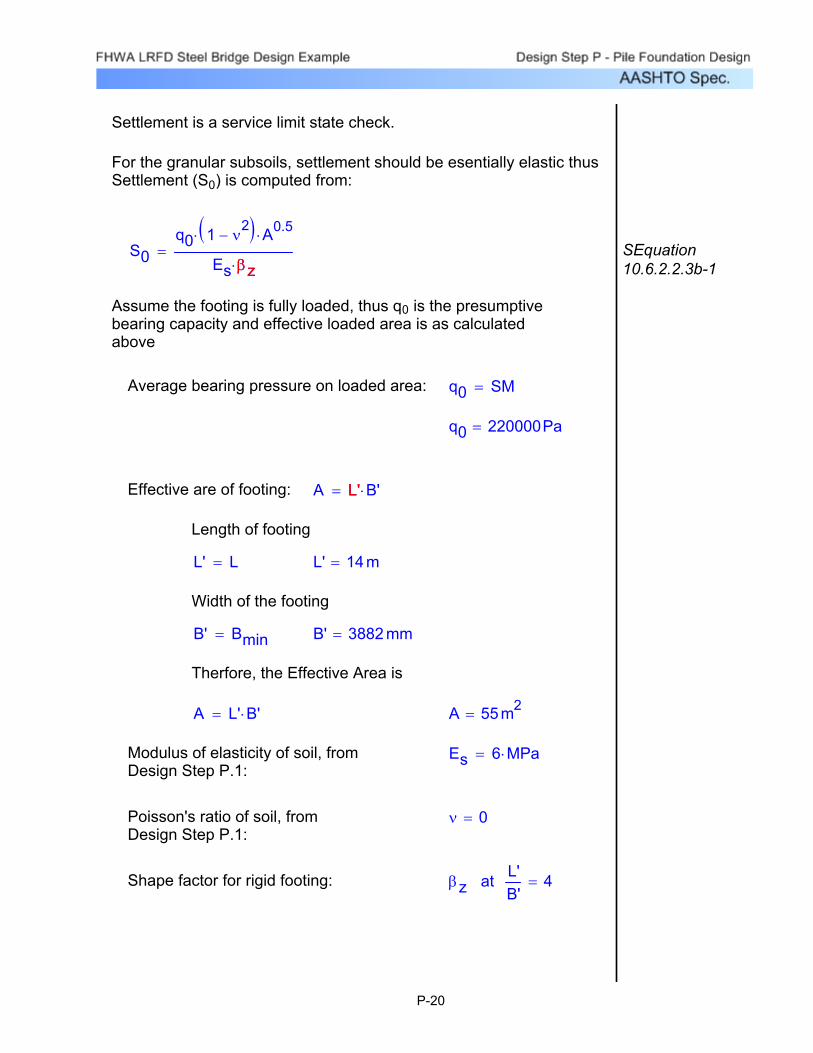
L'B'
4=atβzShape factor for rigid footing:
ν 0=Poisson's ratio of soil, from Design Step P.1:
Es 6 MPa⋅=Modulus of elasticity of soil, from Design Step P.1:
A 55m2=A L' B'⋅=
Therfore, the Effective Area is
B' 3882 mm=B' Bmin=
Width of the footing
L' 14m=L' L=
Length of footing
A L' B'⋅= L'Effective are of footing:
q0 220000Pa=
q0 SM=Average bearing pressure on loaded area:
Assume the footing is fully loaded, thus q0 is the presumptive bearing capacity and effective loaded area is as calculated above
SEquation 10.6.2.2.3b-1
S0q0 1 ν
2−( )⋅ A0.5⋅
Es βz⋅=
βz
For the granular subsoils, settlement should be esentially elastic thus Settlement (S0) is computed from:
Settlement is a service limit state check.
P-20

The influence value determined above is for a Poisson's ratio of 0.33. A Poisson's ration of 0.25 is used for the soil. This difference is small for the purposes of estimating elastic settlement.
Isb 0.64=I for rigid circular area over stiff base at H/B of 3:
Iinf 0.79=I for rigid circular area over infinite halfspace:
As per NAVFAC DM7.1-212, and DM7.1-213:
Note: This computation assumes an infinite depth of the compressible layer. Other computation methods that allow for the rigid base (NAVFAC DM-7.1-211) indicate the difference between assuming an infinite compressible layer and a rigid base at a depth equal to 3 times the footing width (H/B = 3) below the footing can be estimated by computing the ratio between appropriate influence factors (I) as follows:
S0 216.95mm=
S0q0 1 ν
2−( )⋅ A0.5⋅
Es βz⋅=
βz 1.18=L'B'
4=By interpolation, at
Table P-9 Rigid Footing
STable 10.6.2.2.3b-2
L'/B' βz
3 1.155 1.24
From Table 10.6.2.2.3b-2 for rigid footing:
P-21

Ratio of I values:
IsbIinf
0.810127=
Since I is directly proportional to settlement, this ratio can be multiplied by S0 to arrive at a more realistic prediction of settlement of this footing.
S'0 S0IsbIinf
⋅=
S'0 176 mm=
This settlement will occur as load is applied to the footing and may involve some rotation of the footing due to eccentricities of the applied load. Since most of the loads will be applied after construction of the abutment (backfill, superstructure, deck) this will result in unacceptable displacement.
The structural engineer has determined that the structure can accommodate up to 38 mm of horizontal displacement and up to 13 mm vertical displacement. Given the magnitude of the predicted displacements, it is unlikely this requirement can be met. Thus, a deep foundation system or some form of ground improvement is required.
Note that the above calculation did not account for the weight of the approach embankment fill and the effect that this will have on the elastic settlement. Consideration of this would increase the settlement making the decision to abandon a spread footing foundation even more decisive.
P-22
Design Step P.5 - Select Suitable Pile Type and Size
It will be assumed that for the purposes of this example, ground improvement methods such as vibro-flotation, vibro replacement, dynamic deep compaction, and others have been ruled out as impractical or too costly. It is further assumed that drilled shaft foundations have been shown to be more costly than driven pile foundations under the existing subsurface conditions (granular, water bearing strata). Thus a driven pile foundation will be designed.
Of the available driven pile types, a steel H-pile end bearing on rock is selected for this application for the following reasons.
1) It is a low displacement pile which will minimize friction in the overlying soils.
2) It can be driven to high capacities on and into the top weathered portion of the rock.
3) It is relatively stiff in bending thus lateral deflections will be less than for comparably sized concrete or timber piles.
4) Soils have not been shown to be corrosive thus steel loss is not an issue.
P-23

For spacing in the direction of loading, various model studies indicate that group efficiency is very low at 3D spacing, moderate at about 5D spacing and near 100% for spacings over about 8D. Thus it is desirable to maintain at least 5D spacing in the direction of the load and preferable to maintain 8D spacing.
As per FHWA-HI-96-033, Section 9.8.4 & NACVFAC DM7.2-241:
For spacing perpendicular to the direction of loading 3D results in no significant group impacts.
From Reese and Wang, 1991, Figure 5.3 (personal communication):
Lateral group effects are controlled by pile spacing in the direction of loading and perpendicular to the direction of loading.
Axial group effects for end bearing piles on hard rock are likely to be negligible thus axial group capacity is not a consideration. However, note that the FHWA driven pile manual recommends a minimum c-c spacing of 3D or 1 meter in granular soils to optimize group capacity and minimize installation problems. The designer's experience has shown 3D to be a more practical limit that will help avoid problems during construction.
As per FHWA-HI-96-033, Section 9.8.1.1:
3) Minimum pile spacing to reduce group effects:
2.5 D⋅ 775 mm=
D 310 mm⋅=Where the pile diameter:
S10.7.1.52.5 D⋅Per referenced article, spacing is to be no less than:
2) Absolute Minimum Spacing:
H-Piles range in size from 200 to 360 mm width. Since pile spacing is controlled by the greater of 750 inches or 2.5 times the pile diameter (D); pile sizes 300 mm and under will result in the same minimum spacing of 750 mm. Thus for preliminary analysis assume a 310 inch H-Pile.
1) Pile diameter:
To determine the optimum pile size for this application, consideration is given to the following:
P-24
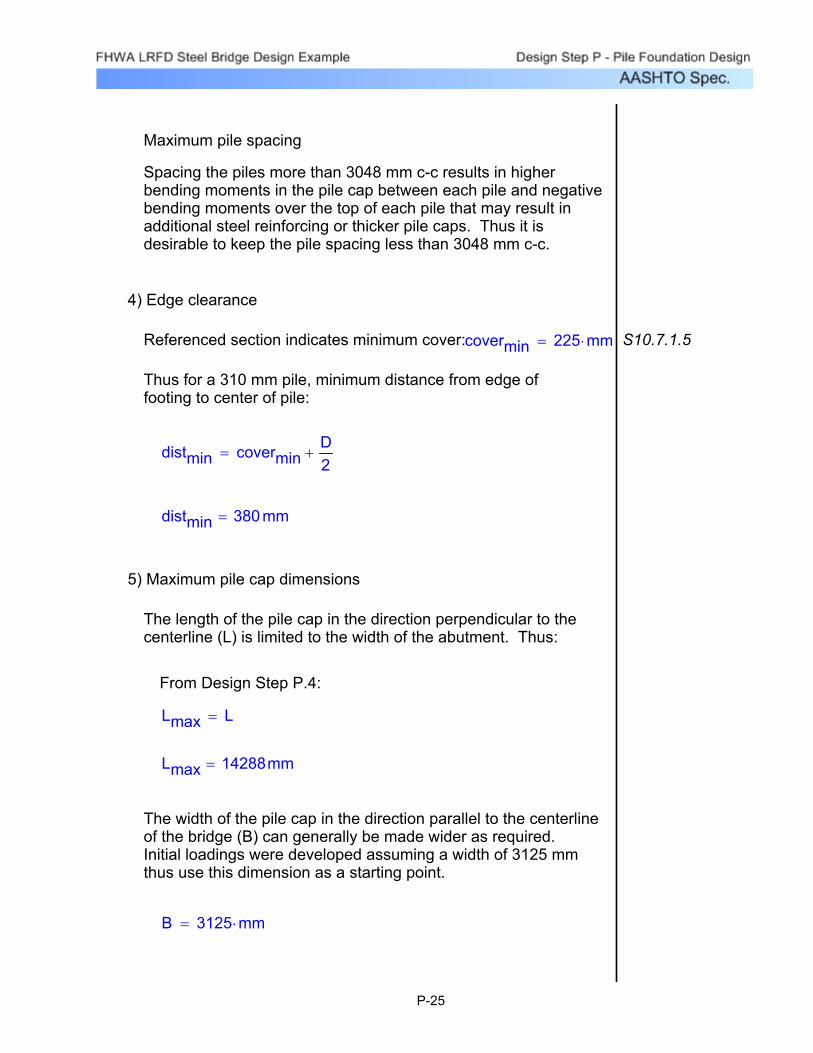
B 3125 mm⋅=
The width of the pile cap in the direction parallel to the centerline of the bridge (B) can generally be made wider as required. Initial loadings were developed assuming a width of 3125 mm thus use this dimension as a starting point.
Lmax 14288mm=
Lmax L=
From Design Step P.4:
The length of the pile cap in the direction perpendicular to the centerline (L) is limited to the width of the abutment. Thus:
5) Maximum pile cap dimensions
distmin 380 mm=
distmin coverminD2
+=
Thus for a 310 mm pile, minimum distance from edge of footing to center of pile:
S10.7.1.5covermin 225 mm⋅=Referenced section indicates minimum cover:
4) Edge clearance
Spacing the piles more than 3048 mm c-c results in higher bending moments in the pile cap between each pile and negative bending moments over the top of each pile that may result in additional steel reinforcing or thicker pile caps. Thus it is desirable to keep the pile spacing less than 3048 mm c-c.
Maximum pile spacing
P-25

Determine the maximum and minimum number of piles that can be placed beneath the cap (See sketch below for definition of variables)
BSB
NLSL
L
EdgeDistance
EdgeDistance
NB
Figure P-3 Plan View of Pile Cap
P-26
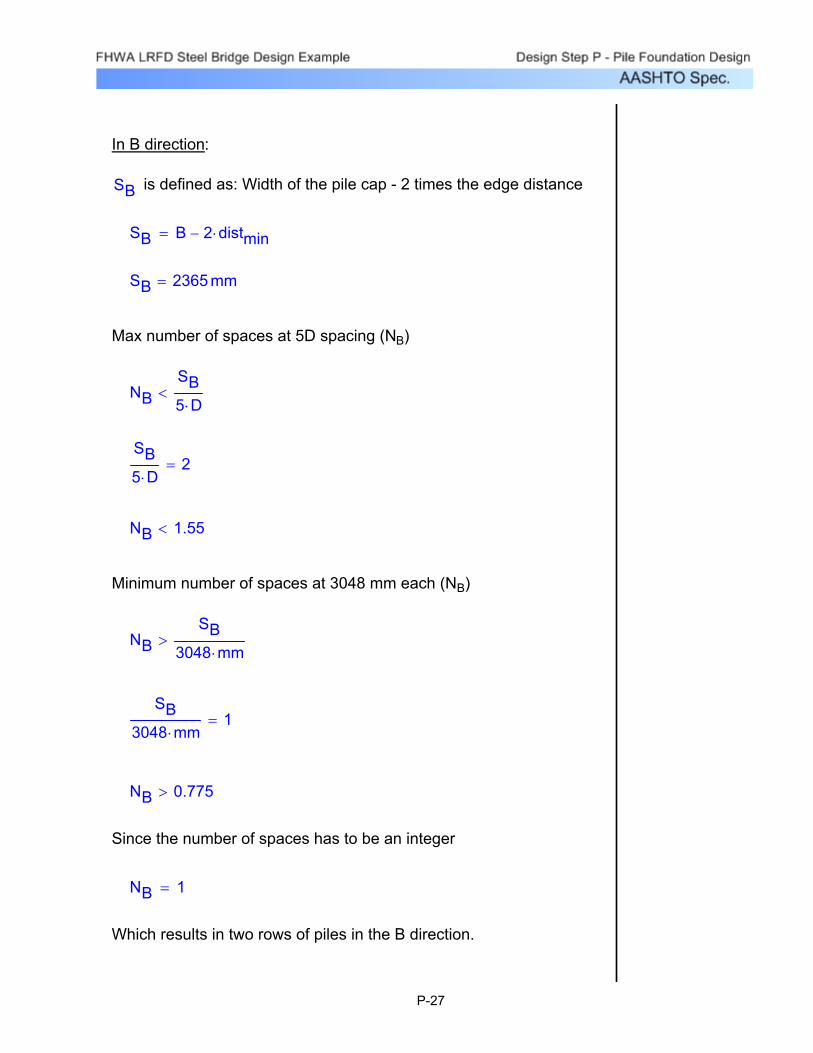
Which results in two rows of piles in the B direction.
NB 1=
Since the number of spaces has to be an integer
NB 0.775>
SB3048 mm⋅
1=
NBSB
3048 mm⋅>
Minimum number of spaces at 3048 mm each (NB)
NB 1.55<
SB5 D⋅
2=
NBSB5 D⋅
<
Max number of spaces at 5D spacing (NB)
SB 2365 mm=
SB B 2 distmin⋅−=
is defined as: Width of the pile cap - 2 times the edge distanceSB
In B direction:
P-27

Which results in 6 to 15 rows of piles in the L direction.
to 14NL 5=
Since the number of spaces has to be an integer
NL 4.438>
SL3048 mm⋅
4=
NLSL
3048 mm⋅>
Minimum number of spaces at 3048 mm each (NL)
NL 14.792<
SL3 D⋅
15=
NLSL3 D⋅
<
Max number of spaces at 3D spacing (NL)
SL 13528mm=
SL L 2 distmin⋅−=
is defined as: Width of the pile cap - 2 times the edge distanceSL
In L direction:
P-28
RBACK249− N⋅=RFRONT2
8322623 N⋅=
Mlong29885269 N⋅ m⋅=Pvert2
8273692 N⋅=
For STR I min, from Table P.6:
RBACK1596062 N⋅=RFRONT1
9425782 N⋅=
Mlong110796379 N⋅ m⋅=Pvert1
10021840 N⋅=
For STR I max, from Table P.6:
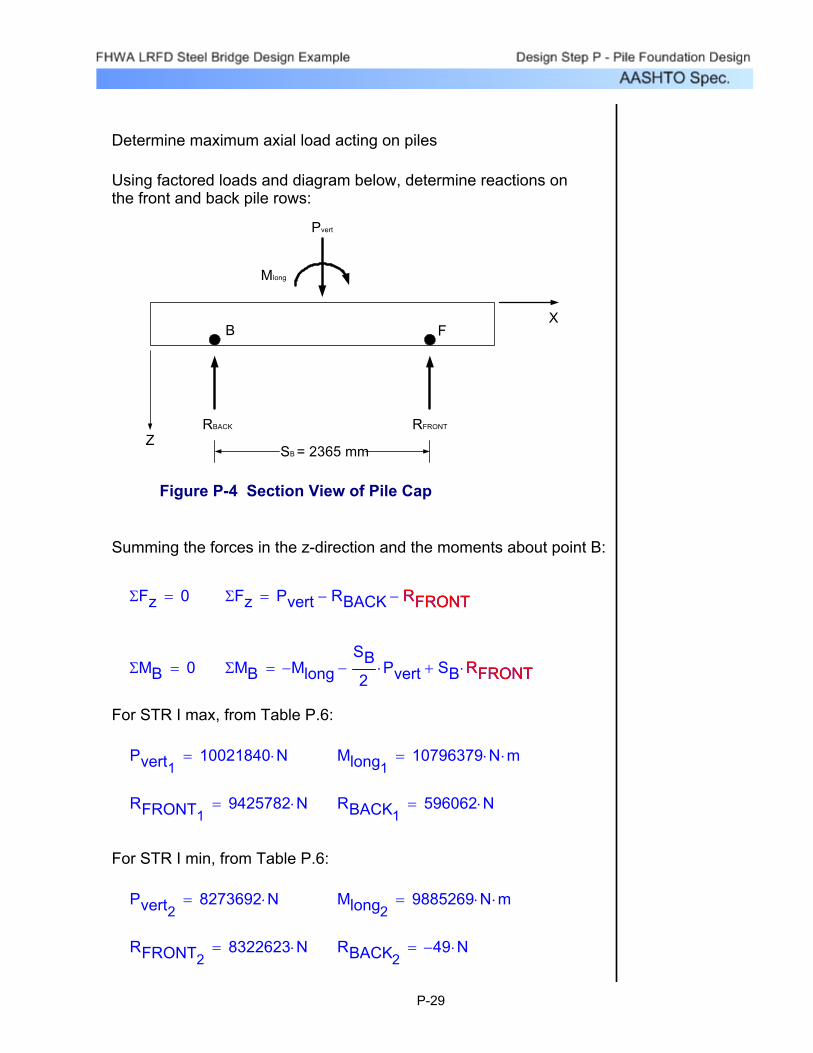
ΣMB Mlong−SB2
Pvert⋅− SB RFRONT⋅+= RFRONTΣMB 0=
ΣFz Pvert RBACK− RFRONT−= RFRONTΣFz 0=
Summing the forces in the z-direction and the moments about point B:
Figure P-4 Section View of Pile Cap
RFRONTRBACK
Pvert
Mlong
SB = 2365 mmZ
XB F
Using factored loads and diagram below, determine reactions on the front and back pile rows:
Determine maximum axial load acting on piles
P-29

NOTE: Grade 250 steel is assumed at this stage even though most H-pile sections are available in higher grades at little or no cost differential. The need for using a higher strength steel will be investigated in future design steps
Fy 250 MPa⋅=
S6.5.4.2φc 0.6=
NOTE: λ in equation 6.9.4.1-1 is assumed to be zero (because unbraced length is zero) resulting in the simplified equation shown above.
Pr φc Fy⋅ As⋅= AsStructural resistanceSEquation 6.9.2.1-1 and SEquation 6.9.4.1-1
Axial pile resistance is controlled by structural resistance
Assuming the following:
RFRONT15 628385N=RFRONT6 1570964N=
and
RFRONT15RFRONT
15=RFRONT6
RFRONT6
=
Max anticipated factored pile load can range between:
Since the front row can have 6 - 15 piles,
RFRONT 9425782N=
RFRONT max RFRONT1RFRONT2
,( )=
Max axial load on front row of piles:
P-30

Es 200000 MPa⋅=
Zy 525 103⋅ mm3⋅=
Note: Plastic section modulus is used to evaluate nominal moment capacity
Zx 1210 103⋅ mm3⋅=
Iyy 52.6 106⋅ mm4⋅=
Ixx 163 106⋅ mm4⋅=
tw 11.0 mm⋅=
tf 11.0 mm⋅=
bf 306 mm⋅=
d 299 mm⋅=
As 10000 mm2⋅=
Properties of HP 310x79:
For preliminary layout and design, select: HP 310x79
RFRONT15φc
⎛⎜⎝
⎞
⎠Fy
4189 mm2=and
RFRONT6φc
⎛⎜⎝
⎞
⎠Fy
10473mm2=
Compute required pile area to resist the anticipated maximum factored pile load. The required steel area can range between:
P-31
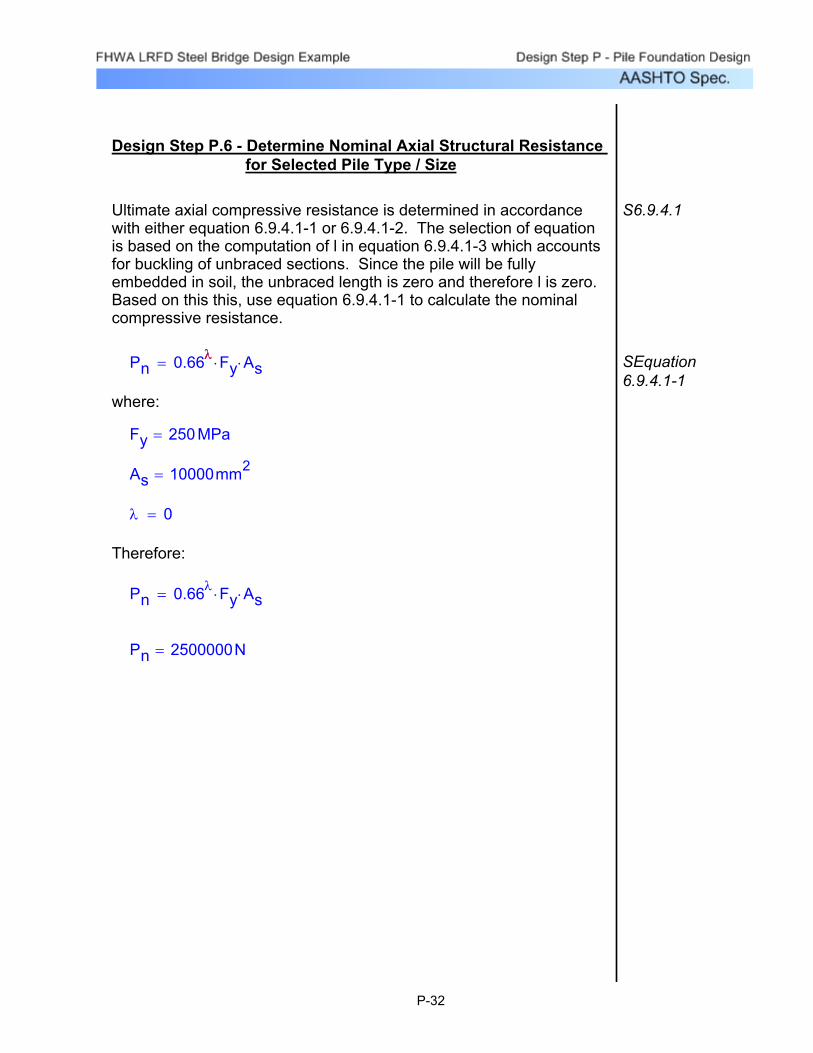
Design Step P.6 - Determine Nominal Axial Structural Resistance for Selected Pile Type / Size
Ultimate axial compressive resistance is determined in accordance with either equation 6.9.4.1-1 or 6.9.4.1-2. The selection of equation is based on the computation of l in equation 6.9.4.1-3 which accounts for buckling of unbraced sections. Since the pile will be fully embedded in soil, the unbraced length is zero and therefore l is zero. Based on this this, use equation 6.9.4.1-1 to calculate the nominal compressive resistance.
S6.9.4.1
Pn 0.66λ Fy⋅ As⋅= λ SEquation 6.9.4.1-1
where:
Fy 250 MPa=
As 10000mm2=
λ 0=
Therefore:
Pn 0.66λ Fy⋅ As⋅=
Pn 2500000N=
P-32

td 0 mm⋅=Joints are tight as per discussion in Design Step P.1:
Width of discontinuities:
sd 305 mm⋅=Based on high observed RQD in Design Step P.1 and description of rock:
Spacing of discontinuities:
qu 79MPa=
qu quave=From Design Step P.1:
Average compressive strength of rock core:
where:
d 3.4<d 1 0.4HsDs
⋅+=Ds
SEquation 10.7.3.5-2
Ksp
3sdD
+
10 1 300tdsd
+⎛⎜⎝
⎞
⎠
0.5
⋅
=td
for which:
SEquation 10.7.3.5-1
qp 3 qu⋅ Ksp⋅ d⋅= Ksp
Nominal unit bearing resistance of pile point, qp
Geotechnical axial resistance for a pile end bearing on rock is determined by the CGS method outlined in 10.7.3.5
Design Step P.7 - Determine Nominal Axial Geotechnical Resistance for Selected Pile Type / Size
P-33
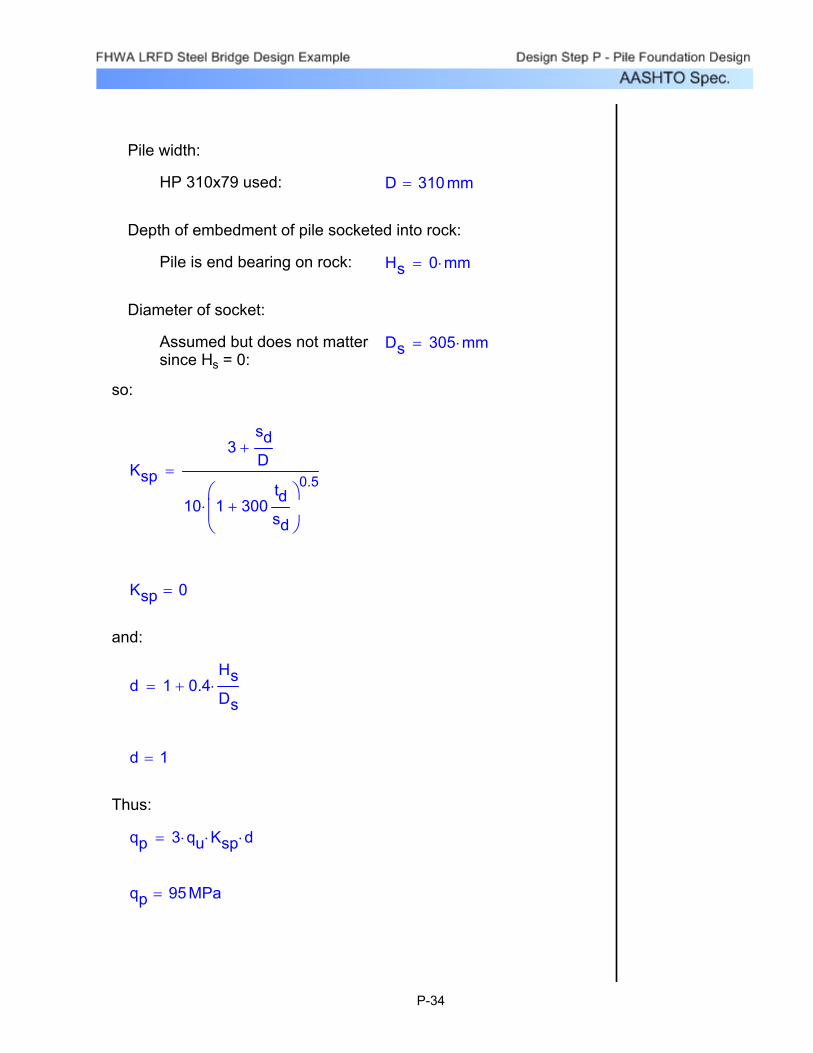
qp 95MPa=
qp 3 qu⋅ Ksp⋅ d⋅=
Thus:
d 1=
d 1 0.4HsDs
⋅+=
and:
Ksp 0=
Ksp
3sdD
+
10 1 300tdsd
+⎛⎜⎝
⎞
⎠
0.5
⋅
=
so:
Ds 305 mm⋅=Assumed but does not matter since Hs = 0:
Diameter of socket:
Hs 0 mm⋅=Pile is end bearing on rock:
Depth of embedment of pile socketed into rock:
D 310 mm=HP 310x79 used:
Pile width:
P-34

Nominal geotechnical resistance (Qp):
Qp qp Ap⋅= Ap SEquation 10.7.3.2-3
where:
Nominal unit bearing resistance as defined above: qp 95MPa=
Area of the pile tip:
Area determined assuming a plug develops between flanges of the H-Pile. This will be the case if the pile is driven into the upper weathered portion of the rock.
Ap 92903 mm2⋅=
Therefore:
Qp qp Ap⋅=
Qp 8792375N=
P-35

Design Step P.8 - Determine Factored Axial Structural Resistance for Single Pile
Factored Structural Resistance (Pr):
Pr φc Pn⋅= SEquation 6.9.2.1
where:
Resistance factor for H-pile in compression, no damage anticipated:
φc 1= S6.5.4.2
Nominal resistance as computed in Design Step P.6:
Pn 2500000N=
Therefore:
Pr 1500000N=
P-36

Note: This is greater than the structural capacity, thus structural capacity controls.
Qr 4396188N=
Qr φqp Qp⋅=
Therefore:
Qp 8792375N=Nominal resistance as computed in Design Step P.7:
φqp 1=φqp 0.5 λv⋅=
and therefore:
STable 10.5.5-2
λv 1.0=For this porject, stress wave measurements will be specified on 2% of the piles (a minimum of one per substructure unit) and the capacity will be verified by CAPWAP analysis. Thus:
Factor to account for method controlling pile installation:
STable 10.5.5-2
φqp 0.5 λv⋅= λvResistance factor, end bearing on rock (CGS method):
where:
Note: remainder of equation not included since piles are point bearing and skin friction is zero.
SEquation 10.7.3.2-2
QR φqp Qp⋅= φqp
Factored Geotechnical Resistance (QR):
Design Step P.9 - Determine Factored Axial Geotechnical Resistance for Single Pile
P-37
Design Step P.10 - Check Drivability of Pile
Pile drivability is checked using the computer program WEAP. The analysis proceeds by selecting a suitable sized hammer. Determining the maximum pile stress and driving resistance (BP300MM) at several levels of ultimate capacity and plotting a bearing graph relating these variables. The bearing graph is then entered at the driving resistance to be specified for the job (in this case absolute refusal of 240 BP300MM will be used) and the ultimate capacity and driving stress correlating to that driving resistance is read.
If the ultimate capacity is not sufficient, a bigger hammer is specified and the analysis is repeated.
If the driving stress exceeds the permitted driving stress for the pile, a smaller hammer is specified and the analysis is repeated.
Drivability of Piles
If a suitable hammer can not be found that allows driving the piile to the required ultimate capacity without exceeding the permissible driving stress, modification to the recommended pile type are necessary. These may include:
Specifying a heavier pile section•Specifying a higher yield stress for the pile steel•Reducing the factored resistance of the pile•
Develop input parameters for WEAP
Driving lengths of piles
The finished pile will likely be 9754-10059 mm long which includes a 300 mm projection into the pile cap and up to 300 mm of penetration of the pile tip into the weathered rock. Therefore assume that 10668 mm long piles will be ordered to allow for some variation in subsurface conditions and minimize pile wasted during cut off.
P-38
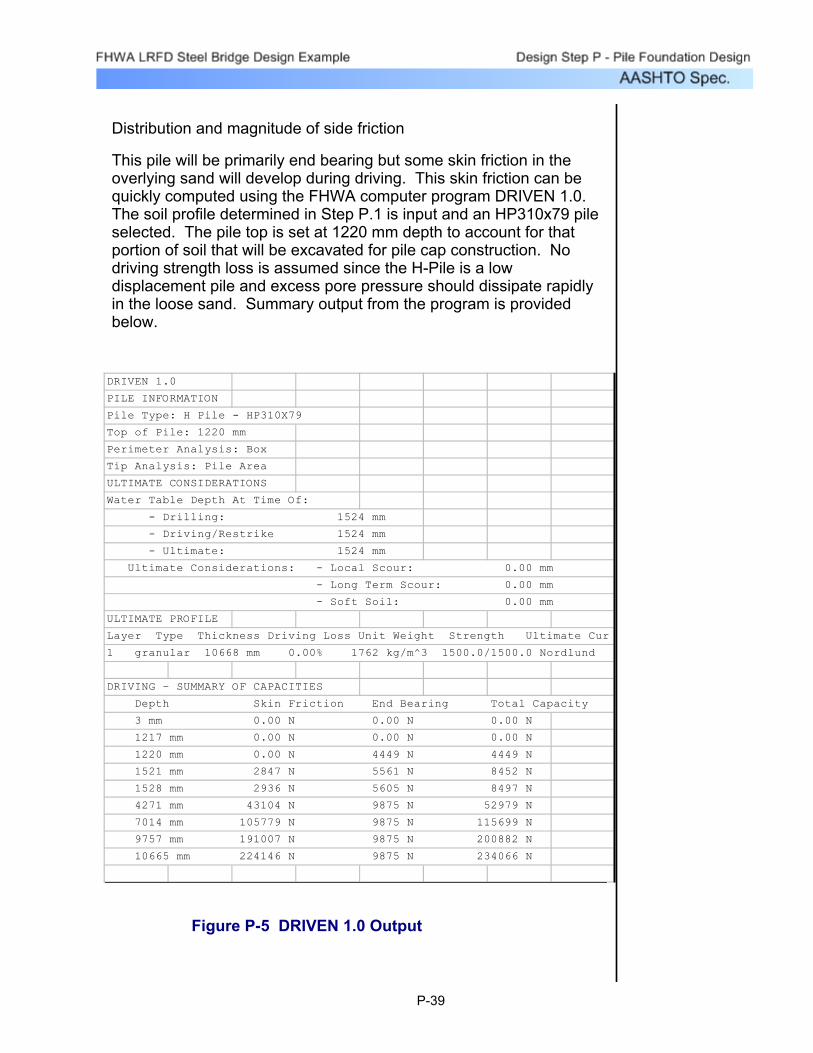
Distribution and magnitude of side friction
This pile will be primarily end bearing but some skin friction in the overlying sand will develop during driving. This skin friction can be quickly computed using the FHWA computer program DRIVEN 1.0. The soil profile determined in Step P.1 is input and an HP310x79 pile selected. The pile top is set at 1220 mm depth to account for that portion of soil that will be excavated for pile cap construction. No driving strength loss is assumed since the H-Pile is a low displacement pile and excess pore pressure should dissipate rapidly in the loose sand. Summary output from the program is provided below.
DRIVEN 1.0
PILE INFORMATION
Pile Type: H Pile - HP310X79
Top of Pile: 1220 mm
Perimeter Analysis: Box
Tip Analysis: Pile Area
ULTIMATE CONSIDERATIONS
Water Table Depth At Time Of:
- Drilling: 1524 mm
- Driving/Restrike 1524 mm
- Ultimate: 1524 mm
Ultimate Considerations: - Local Scour: 0.00 mm
- Long Term Scour: 0.00 mm
- Soft Soil: 0.00 mm
ULTIMATE PROFILE
Layer Type Thickness Driving Loss Unit Weight Strength Ultimate Cur
1 granular 10668 mm 0.00% 1762 kg/m^3 1500.0/1500.0 Nordlund
DRIVING – SUMMARY OF CAPACITIES
Depth Skin Friction End Bearing Total Capacity
3 mm 0.00 N 0.00 N 0.00 N
1217 mm 0.00 N 0.00 N 0.00 N
1220 mm 0.00 N 4449 N 4449 N
1521 mm 2847 N 5561 N 8452 N
1528 mm 2936 N 5605 N 8497 N
4271 mm 43104 N 9875 N 52979 N
7014 mm 105779 N 9875 N 115699 N
9757 mm 191007 N 9875 N 200882 N
10665 mm 224146 N 9875 N 234066 N
Figure P-5 DRIVEN 1.0 Output
P-39

Bearing Capacity Graph - Driving
0
2000
4000
6000
8000
10000
12000
0 50000 100000 150000 200000 250000
Capacity (N)D
epth
(mm
)
Skin FrictionEnd BearingTotal Capacity
Figure P-6 Bearing Capacity
From this analysis, the side friction during driving will vary in a triangular distribution, and will be about:
Qs 222411 N⋅=
The distribution will start 1220mm below the top of the pile which is:
1220 N⋅10668 N⋅
11%= below the top of the pile.
The desired factored resistance was determined in Design Step P.8 and is controlled by structural resistance of the pile. This value is:
Pr 1500000N=
The ultimate resistance that must be achieved during wave equation analysis will be this value divided by the appropriate resistance factor for wave equation analysis + the estimated side friction.
NOTE: Side friction is added here because downdrag is expected to reduce or reverse the skin friction in the final condition. Therefore, sufficient point capacity must be developed during driving to adequately resist all applied loads plus the downdrag.
P-40
φ 0.65 λv⋅= STable 10.5.5-2
From Design Step P.9:
λv 1=
Thus:
φ 1=
and
QPPrφ
=
QP 2307692N=
At this Ultimate point resistance the percent side friction is:
QsQs QP+
9%=
and the resistance required by wave equation analysis is:
Qreq Qs QP+=
Qreq 2530103N=
P-41
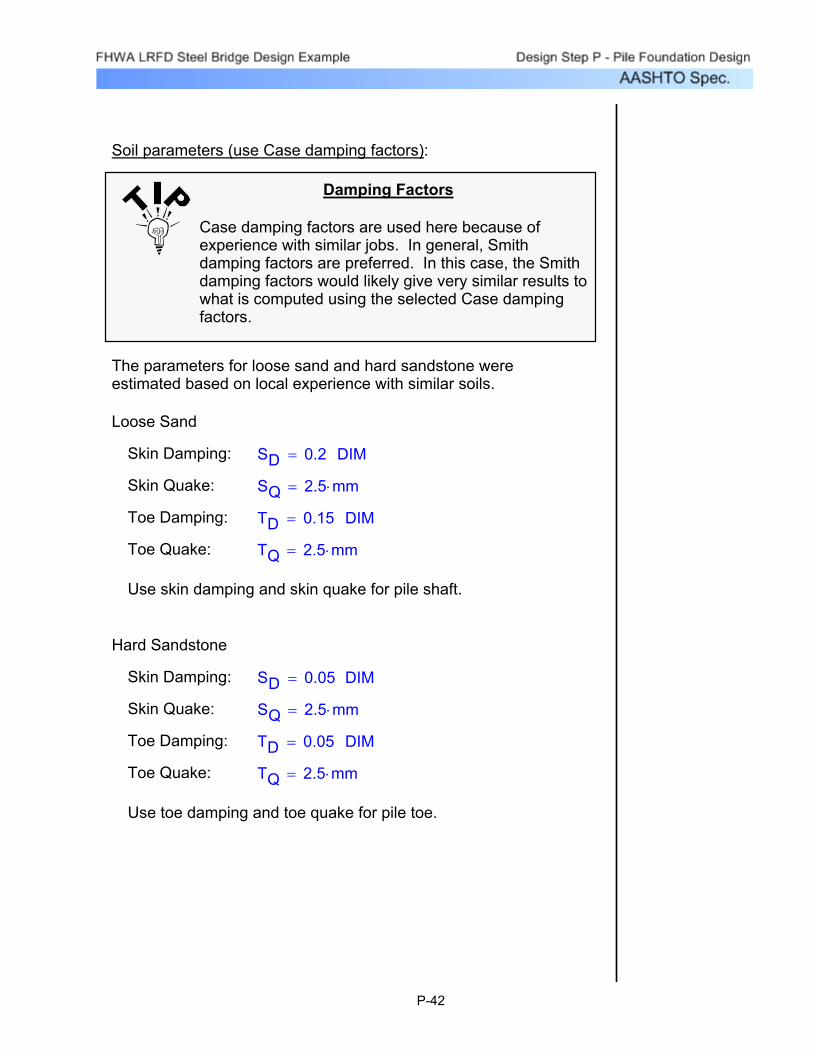
Use toe damping and toe quake for pile toe.
TQ 2.5 mm⋅=Toe Quake:
DIMTD 0.05=Toe Damping:
SQ 2.5 mm⋅=Skin Quake:
DIMSD 0.05=Skin Damping:
Hard Sandstone
Use skin damping and skin quake for pile shaft.
TQ 2.5 mm⋅=Toe Quake:
DIMTD 0.15=Toe Damping:
SQ 2.5 mm⋅=Skin Quake:
DIMSD 0.2=Skin Damping:
Loose Sand
The parameters for loose sand and hard sandstone were estimated based on local experience with similar soils.
Damping Factors
Case damping factors are used here because of experience with similar jobs. In general, Smith damping factors are preferred. In this case, the Smith damping factors would likely give very similar results to what is computed using the selected Case damping factors.
Soil parameters (use Case damping factors):
P-42

Thickness: 51 mm⋅
COR: 0.8
Hammer Efficiency: 72%
Permissible Driving Stress:
Driving Stress, Sd 0.9 φ⋅ Fy⋅< S10.7.1.16
Note that the equation above was modified to yield stress rather than load.
where:
Resistance factor for driving: φ 1.0= S6.5.4
Steel yield stress, from Design Step P.5:
Fy 250 MPa=
0.9 φ⋅ Fy⋅ 225 MPa=
Sd 22779450 kg
m3⋅<
Hammer Selection:
As a rule of thumb, start out with a rated energy of 272 Joules times the steel area of the pile.
Area: As 10000= mm2 from Design Step P.5
Rated Energy: Er 272J( ) As⋅=
Er 2720000J=
Select open ended diesel common to area
DELMAG 12-32 (ID=37) rated at: 42478 N⋅ m⋅
Helmet weight: 9564 N⋅
Hammer Cushion Properties:
Area: 182903 mm2⋅
Elastic Modulus: 196859500 kg
m3⋅
P-43

Summary of Wave Equations Analysis:
42 KSI
660 Kips
240BPF
Figure P-7 Wave Equation Analysis
at refusal the pile has an ultimate capacity of Qult 660 K⋅=
Qult 2935826 N⋅=
at refusal the driving stress in the pile is Sd_act 42 ksi⋅= ksi
Sd_act 29528920 kg
m3⋅=
P-44

Hammer Cushion Properties same as before
31984 N⋅ m⋅DELMAG D 12 (ID=3) rated at
Try reducing hammer energy
This condition is not satisfied - no good.
Sd_act 29528920 kg
m3=>Sd 22779450 kg
m3⋅=
SD Sd_act>
The permissible driving stress exceeds the actual value
OKQreq 2530103N=>Qult 2935826N=
Qult Qreq>
The ultimate capacity exceeds that required
Check:
P-45

Summary of Wave Equations Analysis:
34 KSI29 KSI
520 Kips420 Kips
100BPF
240BPF
Figure P-8 Wave Equation Analysis
at refusal the pile has an ultimate capacity of Qult 2313075 N⋅=
at refusal the driving stress in the pile is Sd_act 23904370 kg
m3⋅=
P-46

Based on above analysis, no hammer can possibly drive this pile to the required capacity without exceeding the permissible driving stress.
Is pile drivable to minimum of Ultimate Geotechnical Axial Resistance or Ultimate Structural Resistance without pile damage?
A decision must be made at this point:
This condition is not satisfied - no good.
Sd_act 23904370 kg
m3=>Sd 22779450 kg
m3⋅=
SD Sd_act>
The permissible driving stress exceeds the actual value
This condition is not satisfied - no good
Qreq 2530103N=>Qult 2313075N=
Qult Qreq>
The ultimate capacity exceeds that required
Check:
P-47

There are 2 approaches to resolving this problem
1) Reduce the factored resistance of the pile to a value that can be achieved without over stressing the pile.
Based on the above bearing graph and allowing for some tolerance in the driving stress (requiring the contractor to select a driving system that produces exactly 22779450 kg/m^3 in the pile is unreasonable) a reasonable driven capacity is estimated. Using a minimum driving stress of 20389020 kg/m^3 (0.8 Fy) the penetration resistance is about 100 BP300MM and the ultimate capacity would be:
Qult 1868253 N⋅=
This value includes skin friction during driving which was set in the program to be 9% of the ultimate resistance. Therefore, point resistance at this driving stress would be:
Qp 91% Qult⋅= Qp 1700110N=
and:
φ 0.65=
QR φ Qp⋅= QR 1105072N=
P-48

SdQultAs
=Driving Stress
It can be seen from the results of the wave equation analysis that the driving stress times the pile area is about equal to the mobilized pile capacity. Thus, if the factored structural resistance determined in step P.8 is used as the final design pile resistance, then the ultimate required dynamic capacity determined above is valid and the driving stress associated with this capacity can be estimated by:
In this case The Delmag 12-32 produced acceptable driving results.
Since option 2 involves little or no additional cost and option 1 will result in significant increase in cost due to required additional piles, select option 2
311MPa<Sd
0.9 φ⋅ Fy⋅ 311 MPa=
Fy 345 MPa⋅=Steel yield stress:
S6.5.4φ 1=Resistance factor for driving:
where:
(Equation modified to yield stress instead of load)
S10.7.1.16Sd 0.9 φ⋅ Fy⋅<Driving Stress:
Using grade 345 steel
Increase the yield strength of the pile without increasing the previously computed factored resistance
2)
P-49

Qp 2327589N=
As defined previouslyQs 222411N=
Qp Qult Qs−=
Qult 2550000N=
Qult Sd_min As⋅=
Sd_min 255 MPa⋅=Using a minimum driving stress of
Thus, so long as the contractor selects a hammer that will produce a driving stress between about 255 and 310 MPa at refusal, an acceptable driven capacity should be achieved during construction.
Sd 253.01MPa=
SdQultAs
=Driving Stress
As 10000 mm2⋅=Pile area, from Design Step 9.5:
Qult 2530103 N⋅=Ultimate required capacity as previously determined by wave equation analysis:
where:
P-50

Pn 3450000N=
λ 0=
As 10000mm2=
Fy 345 MPa=
PnNominal compressive resistance:
where
Pn 0.66λ Fy⋅ As⋅= SEquation 6.9.4.1-1
Recompute structural resistance based on higher yield steel, as in Design Step P.6
QR 1512933N=
QR φ Qp⋅=
Qp 2327589N=
φ 0.65=
QR φ Qp⋅=
and the minimum driven resistance is
Again, side friction is subtracted from the ultimate capacity since it will be present during driving but will not be present in the final condition. Resistance is based on the point resistance achieved during driving the pile to refusal.
P-51

The factored axial structural resistance, as in Design Step P.8 is:
SEquation 6.9.2.1-1Pr φc Pn⋅=
φc 1=
Pr 2070000N=
Driven capacity controls
Thus final axial resistance of driven pile:
Q QR=
Q 1512933N=
P-52

RBACK 596062 N⋅=RFRONT 9425782N=
From Design Step P.5, the maximum load that needed to be supported by each row of piles was calculated.
Additional piles will be required to resist the over turning moment.
PilesNp 6.6=
NpPvert
Pf=
Pf QR=
QR 1512933N=The final controlling factored resistance for the selected pile type, from Design Step P.10:
Pvert 10021840 N⋅=The maximum factored vertical load on the abutment, from Design Step P.3, Load Case STR I max:
where:
NpPvertQR
=
The minimum number of piles to support the maximum factored vertical load is:
The purpose of this step is to produce a suitable pile layout beneath the pile cap that results in predicted factored axial loads in any of the piles that are less than the final factored resistance for the selected piles. A brief evaluation of lateral resistance is also included but lateral resistance is more fully investigated in step P.13
Design Step P.11 - Do Preliminary Pile Layout Based on Factored Loads and Overturning Moments
P-53
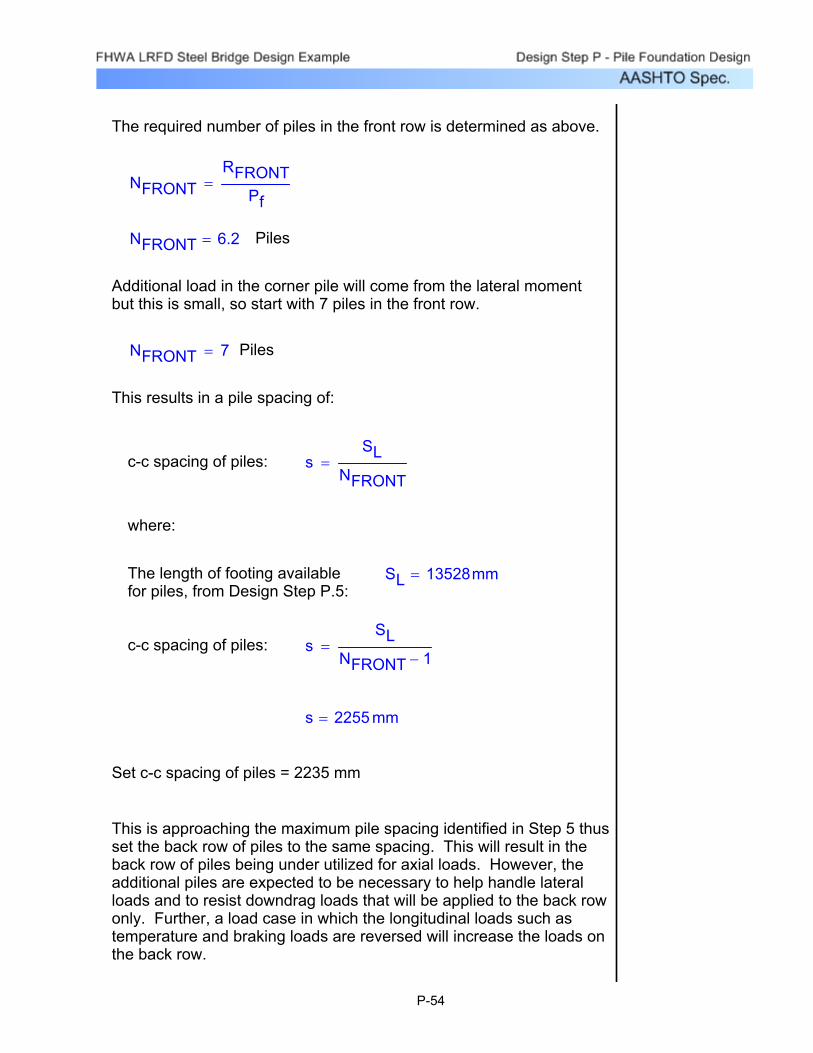
This is approaching the maximum pile spacing identified in Step 5 thus set the back row of piles to the same spacing. This will result in the back row of piles being under utilized for axial loads. However, the additional piles are expected to be necessary to help handle lateral loads and to resist downdrag loads that will be applied to the back row only. Further, a load case in which the longitudinal loads such as temperature and braking loads are reversed will increase the loads on the back row.
Set c-c spacing of piles = 2235 mm
s 2255 mm=
sSL
NFRONT 1−=c-c spacing of piles:
SL 13528mm=The length of footing available for piles, from Design Step P.5:
where:
sSL
NFRONT=c-c spacing of piles:
This results in a pile spacing of:
Piles NFRONT 7=
Additional load in the corner pile will come from the lateral moment but this is small, so start with 7 piles in the front row.
PilesNFRONT 6.2=
NFRONTRFRONT
Pf=
The required number of piles in the front row is determined as above.
P-54
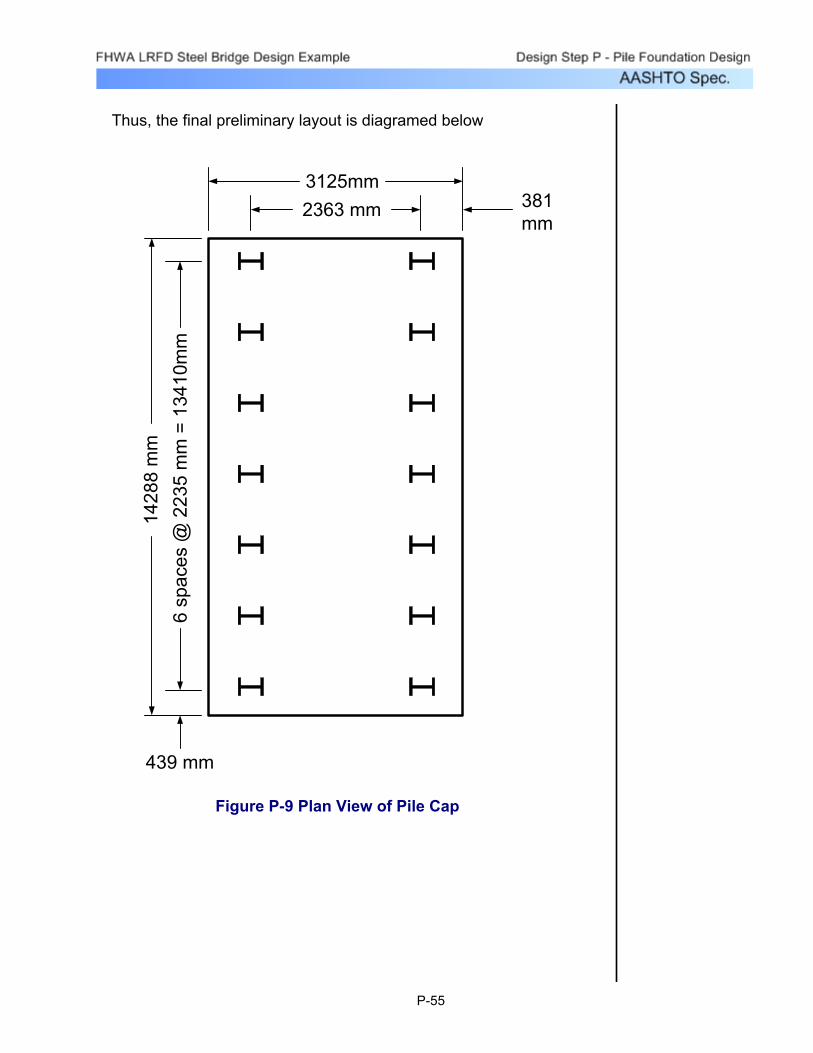
Thus, the final preliminary layout is diagramed below
3125mm2363 mm
6 sp
aces
@ 2
235
mm
= 1
3410
mm
1428
8 m
m
439 mm
381mm
Figure P-9 Plan View of Pile Cap
P-55

Figure P-10 Coordinate System
+z
+x
+y
The coordinate system for the following calculations is provided in Figure P.10:
My 10430308 N⋅ m⋅=
Mx 0 N⋅ m⋅=
Fz 10021844− N⋅=
At x = 0, y = 0
Input Applied Loads:
Calculation of Individual Pile Loads on an Eccentrically Loaded Footing:
Iyy Ixx,Moment of inertia of the pile group about the y and x axis respectively:
x' y',Distance from centroid of pile group to pile in the x and y directions:
F'z M'x, M'y,Vertical load and moments applied at the centroid of the pile group:
where:
PF'zN
M'xx'Iyy
⋅+ M'yy'Ixx
⋅+=y'
The spreadsheet below is used to calculate individual pile loads using the following formula:
P-56

Table P-10 is used to calculate the vertical load and moments, and the moment of inertia of the pile group.
Pile Number
x y x' y' x' 2 y' 2 Pile load
1 -1181.5 -6705 -1181.5 -6705 1395942 44957025 -917102 1181.5 -6705 1181.5 -6705 1395942 44957025 -13528563 -1181.5 -4470 -1181.5 -4470 1395942 19980900 -917104 1181.5 -4470 1181.5 -4470 1395942 19980900 -13528565 -1181.5 -2235 -1181.5 -2235 1395942 4995225 -917106 1181.5 -2235 1181.5 -2235 1395942 4995225 -13528567 -1181.5 0 -1181.5 0 1395942 0 -917108 1181.5 0 1181.5 0 1395942 0 -13528569 -1181.5 2235 -1181.5 2235 1395942 4995225 -91710
10 1181.5 2235 1181.5 2235 1395942 4995225 -135285611 -1181.5 4470 -1181.5 4470 1395942 19980900 -9171012 1181.5 4470 1181.5 4470 1395942 19980900 -135285613 -1181.5 6705 -1181.5 6705 1395942 44957025 -9171014 1181.5 6705 1181.5 6705 1395942 44957025 -1352856
Input Pile Location Calculated Values
Table P-10 Pile Calculations
Sum of the distances in the x direction is zero.
Sum of the distances in the y direction is zero.
Centroids:
yc 0 mm⋅=
xc 0 mm⋅=
Moment of Inertia about the y axis: Iyy 279732600 mm4⋅=
Moment of Inertia about the x axis: Ixx 19543192 mm4⋅=
P-57

Resolved loads at Centroid:
F'z Fz=
F'z 10021844− N=
M'x F'z− yc⋅ Mx+=
M'x 0N m⋅=
M'y F'z− xc⋅ My+=
M'y 10430308N m⋅=
Summary of individual pile loads for all load cases:
This table was generated by inserting each load case in the spreadsheet above and recording the resulting pile loads for that load combination.
Load Case
STR-I MAX/FIN
SER-I MAX/FIN
STR-I MIN/FIN
SER-I MIN/FIN
STR-III MAX/FIN
SER-I MAX/FIN
Fz = -10111960 -8038402 -8348089 -8038402 -8146119 -8038402Mx = 0 219642527 0 219642527 688755577 219642527My = 10430308379 6472675445 9885269516 6384547271 8641984350 6472675445
1 -91710 -188125 1330 -193453 -75916 -1881252 -1352856 -970747 -1193914 -965419 -1120833 -9707473 -91710 -186370 1330 -191698 -70413 -1863704 -1352856 -968992 -1193914 -963665 -1115330 -9689925 -91710 -184615 1330 -189943 -64910 -1846156 -1352856 -967237 -1193914 -961910 -1109827 -9672377 -91710 -182861 1330 -188188 -59407 -1828618 -1352856 -965483 -1193914 -960155 -1104324 -9654839 -91710 -181106 1330 -186434 -53904 -18110610 -1352856 -963728 -1193914 -958400 -1098821 -96372811 -91710 -179351 1330 -184679 -48401 -17935112 -1352856 -961973 -1193914 -956645 -1093318 -96197313 -91710 -177596 1330 -182924 -42898 -17759614 -1352856 -960218 -1193914 -954890 -1087815 -960218
Max -1352856 -970747 -1193914 -965419 -1120833 -970747Min -91710 -177596 1330 -182924 -42898 -177596
Pile No.
Table P-11 Individual Loads for All Load Cases
P-58

Pile loads range between -1352856 N in compression and 1330 N in tension for all load cases.
The maximum compressive load is reasonably close to the factored resistance for the selected pile and the tension load is minimized thus this is a reasonable layout with respect to axial load.
Evaluate lateral loads:
If all piles are vertical they can all be assumed to take an equal portion of the applied horizontal load since group effects have been minimized by keeping the pile spacing large enough.
The controlling criterion with respect to horizontal loads on vertical piles is usually deflection which is a service load case. Looking at the maximum horizontal loads in section P.3, it can be seen that the transverse loads are relatively small and can be ignored for the purposes of this step. The maximum longitudinal service load is:
Plong 2539935 N⋅=
Number of piles: Npile 14=
Thus, load per pile: PPlongNpile
=
P 181424N=
Lateral Capacity
The design chart used below to estimate the lateral capacity of steel H-Piles is one of many methods available to the designer. Brohms method can be used to estimate ultimate capacity (strength limit state) and various published elastic solutions may be used to estimate deflection (service limit state). Pressumptive allowable lateral capacities based on the designer's experience (service limit state) may be used or a preliminary P-y analysis using COM624 may be performed at this point to assist in initial pile group layout
P-59

Based on the design chart below, the maximum service load per pile for an assumed 1.5" deflection (38mm) is:
92KN 20.6K=92KN 20.6K=
From PennDOT DM4 Appendix F-20:
92 KN
Figure P-11 Maximum Service Load Per Pile
P-60

Notes on chart:
Solid lines represent load vs deflection for full depth loose saturated sand
I values are moment of inertia for pile about axis perpendicular to applied load (shown in mm4 x 108)
For HP 310 x 79
Ixx 164000000mm4=
Load in KN is applied at ground surface and pile head is assumed to be 50% fixed
Thus, there probably will not be sufficient lateral load capacity with 14 vertical piles. To resolve this, it will be necessary to add more piles or batter some of the piles. Since at least twice as many piles would be required to handle the anticipated horizontal loads, battering the piles makes more sense.
Investigate battering front row of piles at 1:3 (back row of piles not battered due to lack of vertical load and potential for downdrag)
Total vertical load on front row for each of the load cases is computed by summing the individual pile loads computed above.
P-61

From Design Step P.3:
Load CaseSTR-I
MAX/FINSER-I
MAX/FINSTR-I
MIN/FINSER-I
MIN/FINSTR-III
MAX/FINSER-I
MAX/FIN
9426226 6723487 8321733 6686122 7695423 6723487
Batter = 0.333333333
3142224 2241014 2773911 222856 2565289 2241014
Plong = (N) 3803229 2539935 3803229 2526590 3500750 2539935
661006 298921 1029318 298031 935461 298921
Force per pile (N) 47151 21352 73396 21352 66723 21352
Total vertical load on front row of piles (N)
Available resisting force due to horizontal component of axial pile load = Batter x vertical load on front row (N)
Remaining force to be handled by bending of pile = Plong - available horizontal force (N)
Table P-12 Vertical Load on Front Row of Piles for Each Load Case
The remaining force per pile to be handled in bending is in the reasonable range thus this may be a workable configuration but it must be confirmed by interaction analysis. Thus proceed to next step with a 14 pile group with the front row battered at 3V:1H.
P-62

Design Step P.12 - Evaluate Pile Head Fixity
The performance of the pile group and the resulting pile stresses are greatly influenced by the degree to which piles are fixed against rotation at the pile head. This fixity is provided by the pile cap and is a function of the embedment of the pile into the cap, the geometry of the pile group, the stiffness of the pile cap, and the deflection. Each of these is evaluated below.
S10.7.3.8
Embedment
Research has shown that a pile needs to be embedded 2-3 times its diameter into the pile cap in order to develop full fixity. These piles will be embedded the minimum of 300 mm since the thickness of the pile cap is expected to be only 762 mm. Embedding the piles 610 mm into a 762 mm thick cap places the tops of the piles near the top layer of reinforcing and increases the probability of the pile punching through the top of the cap under load. Thus full pile head fixity will likely not develop regardless of other factors.
S10.7.1.5
Group geometryIn the transverse direction, there will be 7 rows of piles that when deflected force the pile cap to remain level. This condition will result in full fixity of the pile head pending evaluation of other factors. In the longitudinal direction there will be only 2 rows of piles which should be sufficient to enforce fixity pending evaluation of other factors. However, if the front row of piles is battered and the back row of piles is left vertical, the pile cap will tend to rotate backwards as it deflects. This could conceivably result in a moment applied to the pile heads greater than that required to fix the head (i.e. greater than 100% fixity) This backwards rotation of the pile cap is accounted for in the group analysis so it does not need to be considered here.
Pile cap stiffness
Flexing of the pile cap due to applied loads and moments tends to reduce the fixity at the head of the pile. In this case the pile cap is expected to be relatively thin so this effect becomes important. The stiffness of the pile cap is accounted for in the group interaction analysis so this does not effect the evaluation of fixity.
P-63

Deflection
The fixity of a pile is reduced at large deflections due to cracking of the concrete at the bottom of the pile cap. For the vertical pile group deflections are expected to be large but for the battered group deflections are likely to be small.
Conclusion
Since the group analysis will account for the group geometry and the stiffness of the pile cap, the remaining factors of embedment and deflection need to be accounted for. Both of these indicate that pile head fixity is likely to be somewhere between 25 and 75% with the higher values for the battered group. To be conservative, the group will be analyzed with 0 and 100% fixity to determine the critical conditions for pile stress (usually 100% fixity) and deflection (0 % fixity)
P-64

Each is evaluated below:
Other miscellaneous considerations6)
The torsional response of the soil and rock (T- q)5)
The lateral response of soil (P-y)4)
The axial response of the soil and rock (T-z and Q-z)3)
The location and distribution of applied loads.2)
The location and thickness of the abutment stem. This controls the relative stiffness of the pile cap.
1)
In order to properly use the program, a few additional soil and pile cap properties need to be established. These are:
S10.7.3.11Group interaction analysis will be performed using the computer program FB-Pier developed by FHWA, FloridaDOT and University of Florida. This program is available from the Bridge Software Institute associated with the University of Florida. Version 3 of the program is used in this example.
Design Step P.13 - Perform Pile Soil Interaction Analysis
P-65

Location and thickness of stem.
Previous analysis has developed a preliminary stem thickness of 1067 mm located 838 mm from the toe of the footing. The stem is 4572 mm tall thus the footing will be thickened to 4572 mm in this zone as shown on the sketch below:
3125 mm
2363 mm
6 sp
aces
@ 2
235
mm
= 1
3410
mm
1428
6 m
m
438 mm
381 mm
1067 mm 838 mm
CL of pilecap
ZONE OFTHICKENEDFOOTING TO
ACCOUNT FORSTEM
ASSUMEDLOCATIONS OFAPPLIED LOADS(typical 3 spots)
Y
X
Figure P-12 Location and Thickness of Stem
P-66

Location of applied loads
The loads as supplied so far were resolved to a point at the center of the footing and the bottom of the pile cap. The loads actually consist of numerous loads due to earth pressure, superstructure, self weight etc. that are distributed over the proposed structure. To simplify the analysis, only the pile cap will be modeled in FB-Pier. The supplied loads will be divided by 3 and applied to the pile cap at 3 locations along the length of the stem at the centerline of the pile group. Since the cap will be modeled as a membrane element at an elevation that corresponds to the base of the pile cap and the loads were supplied at the base of the pile cap, no additional changes to the supplied loads and moments are required. The assumed locations of the applied loads are shown above.
The magnitude of loads and moments are computed from those provided in section P.3 as shown below. The terminology and sign convention has been converted to that used in FB-Pier. The coordinate system used is a right handed system as shown in the sketch above with Z pointing down.
Note the loads at each point provided below are in N-m units
LIMIT STATE
FB-Pier Load Case
Fz (N) My (N-m)
Mx (N-m)
Fx (N) Fy (N)
STR-I MAX/FIN
1 3340614 -3476765 0 1267743 0
SER-I MAX/FIN
2 2655588 -2157554 73214 846630 14827
STR-I MIN/FIN
3 2757897 -3295086 0 1267743 0
SER-I MIN/FIN
4 2655588 -2128187 73214 842182 14827
STR-III MAX/FIN
5 2691174 -2880666 229540 1166902 54860
SER-I MAX/FIN 6 2655588 -2158367 73214 846630 14827
Table P-13 Loads for Each Limit State
P-67

The axial response of the soil and rock (T-z and Q-z)
Since the piles will be point bearing, friction response of the soil will be small compared to the point resistance and can be ignored. However, for cases that develop tension in the piles, frictional response of the soil will be the only thing that resists that tension. Therefore, two cases will need to be run, one with the frictional response set to zero by specifying a custom T-z curve and the second with the friction response set to the default for a driven pile in granular material.
Point response of the pile bearing on rock (Q-z) will be a function of the elastic properties of the rock and will be input as a custom Q-z curve as defined below.
Q maxPoint 2 Point 3
Point 1
Z @
Q m
ax Z
Q
Figure P-13 Q-z Curve
From Design Step P.7:
Qmax 8829720 N⋅=
z @ Qmax is estimated using the methods for a drilled shaft socketed in rock.
z @ Qmax: ρbaseΣPi Ip⋅
Ds Er⋅=
Ip CEquation 10.8.3.5-2
P-68

ρbase 2.888mm=
ρbaseΣPi Ip⋅
Ds Er⋅=
and:
Er 10842MPa=
CEquation 10.8.3.5-3
Er Ke Ei⋅=
Thus,
Ei 14652 MPa⋅=Modulus of elasticity of intact rock, from Design Step P.1:
CFigure 10.8.3.5-3
Ke 0.74=
RQD 90.4%=Modulus modification ratio based on RQD, from Design Step P.1:
where:
ErModulus of elasticity of rock mass (TSF):
Ds 310 mm⋅=Diameter of socket, for HP310 pile:
DIMIp 1.1=Influence coefficient (DIM):
CFigure 10.8.3.5-1
HsDs
0=HsDs
0=Since
ΣPi 8825272 N⋅=Load at top of socket:
where:
P-69

Thus Q-z curve is defined by the following points
(refer to the sketch above for location of the points)
Point Q (N) z (mm)1 0 0.002 8829720 3.053 8829720 50.80
Table P-14 Q-z Curve Points
P-70

qu 3830421 Pa⋅=Say shear strength:
12
10%qu( )⋅ 3959314Pa=Shear strength, 1/2 qu:
10% qu⋅ 7918628Pa=10% of Average qu:
Arbitrarily reduce to 10% of this value to account for weathering
quave 79.186MPa=
quave 79186281Pa=Average qu, Design Step P.1:
Shear strength
The embedment of the pile into the rock will provide some amount of lateral restraint at the pile tip. The response of the rock will be relatively stiff compared to the soil. To simulate this response, use the built in P-y curve for a stiff clay above the water table since the shape of this curve is closest to actual rock response. Input parameters for this curve are estimated below:
Assume pile will drive into top weathered portion of rock estimated to be 300 mm thick.
k 5430 kN
m3=
Υwet 1762 kg
m3=
oφ'f 31=
For Soil, use built in P-y curve for sand (Reese) with
The lateral response of soil and rock (P-y)
P-71

Unit weight
Average Υ, Design Step P.1:
Υave 2409 kg
m3=
Strain at 50% ultimate shear strength (ε50)
ε50 0.002=
This is based on experience with similar rocks or it can be determined from the results of the unconfined tests if stress and strain data was recorded during the test.
The torsional response of the soil and rock (T- q)
From Design Step P.1:
φ'f 31= o
Υwet 1762 kg
m3=
Go 2275270 Pa⋅=
From Design Step P.10:
Tmax 19966 Pa⋅=
Note: Τmax calculated as the total skin friction calculated by DRIVEN analysis divided by surface area of pile embedded in soil during that analysis. This represents an average value along the length of the pile and is not truly representative of the torsional response of the pile. However, a more sophisticated analysis is not warranted since torsional response of the piles will be minimal in a multi pile group that is not subject to significant eccentric horizontal loading.
P-72

Lfront 10281 mm⋅=Front row of piles:
(3V:1H)Btr 0.3333=Batter
Lback 9754 mm⋅=Back row of piles:
Since top of rock is level and front row of piles is battered, front row of piles will be slightly longer than back row so set up front row as a second pile set.
Pile lengths
νc 0.2=
Assume:
Poisson's ratio for concrete
Ec 21830 kg
m3⋅=
Ec 21830=kg
m3
Ec 4800 f'c0.5⋅=
Then, modulus of elasticity of concrete
MPaf'c 20.68427=Assume pile cap is constructed of concrete with
Modulus of elasticity of concrete in pile cap
Miscellaneous other considerations
P-73

Group Interaction
c-c spacing in direction of load: sload 7.75 D⋅=
c-c spacing in direction perpendicular to load:
sperp_load 7.33 D⋅=
The C-C spacing in direction of load is almost 8D and since it gets larger with depth due to the batter on the front row, there should be no horizontal group effects.
The C-C spacing in both directions is greater than 3D thus there should be no horizontal or vertical group effects.
Therefore set all group interaction factors to 1.0
Deflection measurement location
See previous design sections for geometry of abutment
The critical point for evaluation of deflections is at the bearing locations which are 5334 mm above the bottom of the pile cap as modeled. To account for pile cap rotations in the computation of displacement, add a 5334 mm column to the center of the footing. This is a stick only with nominal properties and sees no load due to the way the problem is modeled.
P-74

Results of Analyses
Four runs were made with different combinations of pile head fixity and considering frictional resistance from the soil. These are expected to bracket the extremes of behavior of the pile group. The results of the four runs are summarized in the table below.
The results in Table P-15 are summarized from the FB-Pier Output files
Units 1 2 3 4Fixed Pinned Fixed Pinned
No No Yes Yes
N 1512395 1476810 1512395 1476810Pile 8 LC1
Pile 8 LC1
Pile 8 LC1
Pile 8 LC1
N 267 6450 68058 10009Pile 7 LC3
Pile 7 LC3
Pile 1 LC3
Pile 13 LC3
N 1281088 1285536 1494602 1289984N-m 0 0 0 0N-m 145073 135582 35252 131515
Pile 8 LC3
Pile 8 LC3
Pile 6 LC1
Pile 8 LC3
mm 2439 2439 2439 2439
N 80513 80958 70727 80513Pile 7 LC3
Pile 7 LC3
Pile 7 LC3
Pile 7 LC3
N 15124 13345 15124 13345Pile 2 LC5
Pile 13 LC5
Pile 2 LC5
Pile 13 LC5
mm 12.2 12.4 11.7 12.1mm 3.4 3.1 3.2 2.8
LC6 LC6 LC6 LC6mm 0.51 1.35 0.51 1.35
LC6 LC6 LC6 LC6
Max Vertical DisplacementLoad CaseMax Y displacementLoad Case
Max X DisplacementService Limit State
Max combined load
Max V3
Pile number and LC
Max V2
Pile number and LC
M2 M3
Pile number and LC
Depth
Axial
Pile number and LC
Maximum Tension
Maximum Axial load
Pile number and LC
Run #Pile head conditionSoil Friction
Strength Limit State
Table P-15 Results
P-75

View of model
Beam Seat Elevation (Displacement Measurement Location)
Loose Sand
Rock
Figure P-14 Model
P-76

S10.5.3The geotechnical resistance in compression and tension exceeds the maximum factored compressive and tensile pile loads. Thus geotechnical resistance is adequate.
QR 89658N=
QR φu Qs⋅=
thus:
The computer program Driven employs the Nordlund method to compute shaft friction. No resistance factor is provided for the Nordlund method applied to granular soils but the method is similar to the b method and has similar reliability.
STable 10.5.5-2
φu 0.4=Resistance factor for tension loading:
QsThe ultimate shaft resistance in compression:
where:
QR φu Qs⋅= φu
Factored resistance:
Qs 224146 N⋅=
S10.7.3.7.2The ultimate geotechnical tension resistance can be taken as the reverse of what was computed in step P.10 using driven
(Controlled by drivability considerations)Qr 1512395 N⋅=
The maximum factored geotechnical axial resistance, from Design Step P.10 is:
These occurred when the pile was assumed to be fully fixed in the pile cap and when soil friction was considered
Pmax_t 68058 N⋅=Max factored tension pile load:
Pmax_a 1512395 N⋅=Max factored axial pile load:
From the FB-Pier analyses, and Design Step P.13:
Design Step P.14 - Check Geotechnical Axial Capacity
P-77

Design Step P.15 - Check Structural Axial Capacity (in lower portion of pile)
From the FB-Pier analyses, and Design Step P.13:
Max factored axial pile load: Pmax_a 1512395 N⋅=
Max factored tension pile load: Pmax_t 68058 N⋅=
These occurred when the pile was assumed to be fully fixed in the pile cap and when soil friction was considered
The maximum factored structural axial resistance in the lower portion of the pile, from Design Step P.10 is:
Pr 2070000N=
This is also applicable to tension.
The factored structural resistance far exceeds the maximum factored loads. Thus, the piles are adequately sized to transmit axial loads.
P-78

Pu_maxPr
0.619=to Pu_min
Pr0.53=
so:
Pu_max 1494602 N⋅=toPu_min 1281088 N⋅=
From Design Step P.13, maximum combined loadings range from:
Pr 2415000N=
Pr φc Pn⋅=
so:
S6.5.4.2φc 0.7=For combined axial and bending (undamaged section of pile):
Pn 3450000N=From Design Step P.10:
where:
Pr φc Pn⋅=Factored compressive resistance:
PuAxial compressive load:
where:
S6.9.2.2PuPr
The equation to use to evaluate combined axial load and bending is determined by the ratio:
Design Step P.16 - Check Structural Axial Capacity in Combined Bending and Axial Load
(upper portion of pile)
P-79
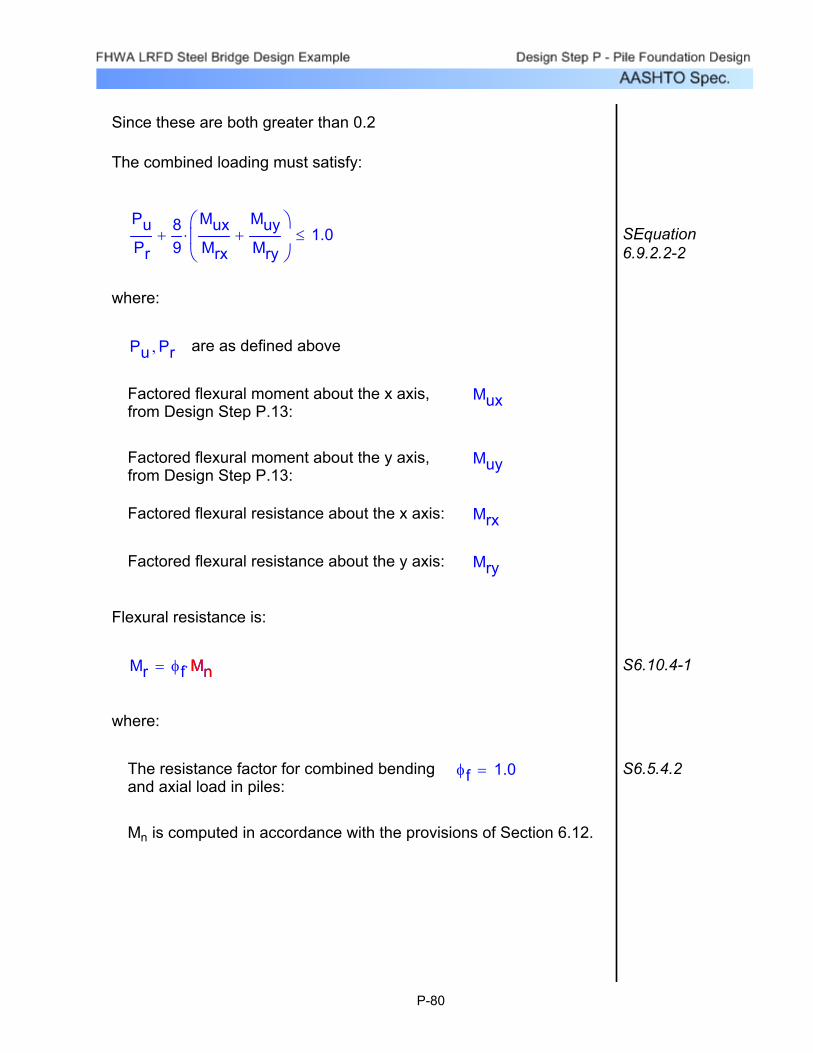
Mn is computed in accordance with the provisions of Section 6.12.
S6.5.4.2φf 1.0=The resistance factor for combined bending and axial load in piles:
where:
S6.10.4-1Mr φf Mn⋅= Mn
Flexural resistance is:
MryFactored flexural resistance about the y axis:
MrxFactored flexural resistance about the x axis:
MuyFactored flexural moment about the y axis, from Design Step P.13:
MuxFactored flexural moment about the x axis, from Design Step P.13:
are as defined abovePu Pr,
where:
SEquation 6.9.2.2-2
PuPr
89
MuxMrx
MuyMry
+⎛⎜⎝
⎞
⎠⋅+ 1.0≤
The combined loading must satisfy:
Since these are both greater than 0.2
P-80

3.76 EFyc
⎛⎜⎝
⎞⎠
0.5⋅ 91=
2 Dcp⋅
tw25=
Check:
Fyc 345 MPa⋅=As in Design Step P.10:
E 200000 MPa⋅=Modulus of Elasticity:
tw 0m=From Design Step P.5:
Dcp 138.5 mm⋅=Dcpd 2 tf⋅−
2=
d 2 tf⋅−
for HP 310 x 79 Grade 345 piles:
SEquation 6.10.4.1.2-1
2 Dcp⋅
tw3.76 E
Fyc⎛⎜⎝
⎞⎠
0.5⋅≤
Criteria from Section 6.10.4.1.2:
S6.12.2.2.1For bending about the x axis, the provisions of Section 6.10.4 apply as follows:
Deep Foundations Surrounded by Soil
In most cases where deep foundations are completely surrounded by soil, lateral support from even the weakest soil is sufficient such that the unbraced length can be considered zero. When the unbraced length is zero, the buckling considerations of section 6.10.4 generally result in no reduction of the ultimate bending stress and Mn=the plastic moment or Mn=fy*Z where Z is the plastic section modulus. Note that the plastic section modulus is used in LRFD design, not the elastic section modulus. The evaluation of buckling criteria on the following pages is presented for completeness.
P-81

S6.10.4.1.4However, this criteria is intended for welded sections to prevent distortion of the flange during welding. Since this is a rolled section, this practical limit does not apply.
Condition is NOT SATISFIED12>bf
2 tf⋅14=
Check:
bf2 tf⋅
12≤
Criteria from Section 6.10.4.1.4:
Proceed with criteria of Section 6.10.4.1.4:
NOT SATISFIEDbf
2 tf⋅0.382 E
Fyc⎛⎜⎝
⎞⎠
0.5⋅≤
Therefore:
0.382 EFyc
⎛⎜⎝
⎞⎠
0.5⋅ 9=
bf2 tf⋅
14=
Check:
tf 11mm=
bf 306 mm=
where:
SEquation 6.10.4.1.3-1
bf2 tf⋅
0.382 EFyc
⎛⎜⎝
⎞⎠
0.5⋅≤
Criteria from Section 6.10.4.1.3:
is satisfied.2 Dcp⋅
tw3.76 E
Fyc⎛⎜⎝
⎞⎠
0.5⋅≤
Therefore:
P-82

RbLoad shedding factor specified in Section 6.10.4.3.2:
S6.10.4.3.1aRh 1.0=Hybrid factor as specified in Section 6.10.4.3.1 for a homogeneous section:
and:
Fcr 345 MPa⋅=
so:
Fyc 345 MPa=cannot exceed Fcr
but:
Fcr 392 MPa=
Fcr1.904 E⋅
bf2 tf⋅
⎛⎜⎝
⎞
⎠
2 2 Dcp⋅
tw
⎛⎜⎝
⎞
⎠
0.5
⋅
=
where:
SEquation 6.10.4.2.4a-2
Fn Rb Rh⋅ Fcr⋅= Fcr
For compression flange:
Proceed to noncompact section flange flexural resistance of Section 6.10.4.2.4
S6.10.4.1.9The pile is laterally braced along its entire length by the adjacent soil thus the unbraced length (Lb) is zero and this condition is always satisfied.
Criteria from Section 6.10.4.1.9:
Therefore proceed to bracing requirements of Section 6.10.4.1.9:
P-83

is satisfied2 Dcp⋅
twλb
Efc
⎛⎜⎝
⎞⎠
0.5⋅≤
Therefore:
λbEfc
⎛⎜⎝
⎞⎠
0.5⋅ 139=
2Dcptw
25=
Check:
fc 345 MPa=fc Fyc=
Compressive stress in the flange due to factored loads. Since this condition will be critical when fc is the largest, assume fc = the maximum possible stress which is the yield stress of the steel.
λb 5.76=
Dcpd2
≤Since
where:
SEquation 6.10.4.3.2a-1
2 Dcp⋅
twλb
Efc
⎛⎜⎝
⎞⎠
0.5⋅≤
Check:
P-84

Mp Fy Zx⋅=
Mn Mp= Mp
Since the nominal plastic stress in all components of the pile is equal to the yield stress, The nominal moment capacity may be computed as the plastic moment.
Fn 345 MPa=
Fn Rb Rh⋅ Fyt⋅=
Therefore:
Fyt 345 MPa⋅=
S6.10.4.3.2bfor tension flangeRb 1=
Rh 1=
where:
SEquation 6.10.4.2b-1
Fn Rb Rh⋅ Fyt⋅= Fyt
For tension flange:
Fn 345 MPa=
Fn Rb Rh⋅ Fcr⋅=
so:
Rb 1.0=
thus:
P-85

Mny 181125N m⋅=
Mny Fy Zy⋅=
From Design Step P.5.
Zy 525000mm3=
Mp Fy Zy⋅=
SEquation 6.12.2.2.1-1
Mny Mp=
For bending about the y axis, provisions of Section 6.12.2.2.1 apply.
Mnx 417450N m⋅=
Mp 417450N m⋅=Mp Fy Zx⋅=
Mnx Mp=
so:
Zx 1210000mm3=The plastic section modulus about the x axis, from Design Step P.5:
where:
P-86

Mry 181125N m⋅=
Mry φf Mny⋅=
and:
Mrx 417450N m⋅=
Mrx φf Mnx⋅=
so:
SEquation 6.10.4-1
Mr φf Mn⋅= Mn
The factored moment resistances are now determined as:
Mny 181125N m⋅=Mny Fy Zy⋅=Use
close to that computed aboveMny 178 N m⋅=
Mny 1.5 Fy⋅ Sy⋅=
Sy 344 mm3⋅=The elastic section modulus about the y axis:
where:
CEquation 6.12.2.2.1
Mny 1.5 Fy⋅ Sy⋅= Sy
Check using alternate method from Section C6.12.2.2.1
P-87

From the maximum combined loads from Design Step P.13:
The interaction equation is now applied to the maximum combined loading conditions determined in the 4 FB-Pier analyses as follows
Pu2415000
89
Mux417450
Muy181125
+⎛⎜⎝
⎞⎠
⋅+ 1.0≤ SEquation 6.9.2.2-2
FB-Pier Run #
Pu (N)
Mux (N-m)
Muy (N-m)
1 1281088 145073 02 1285536 135582 03 1494602 35252 04 1289984 131515 0 0.81
Results of interaction equation
0.840.820.69
Table P-16 Results of Interaction Equation
All conditions satisfy the interaction equation thus piles are acceptable under combined loading.
P-88
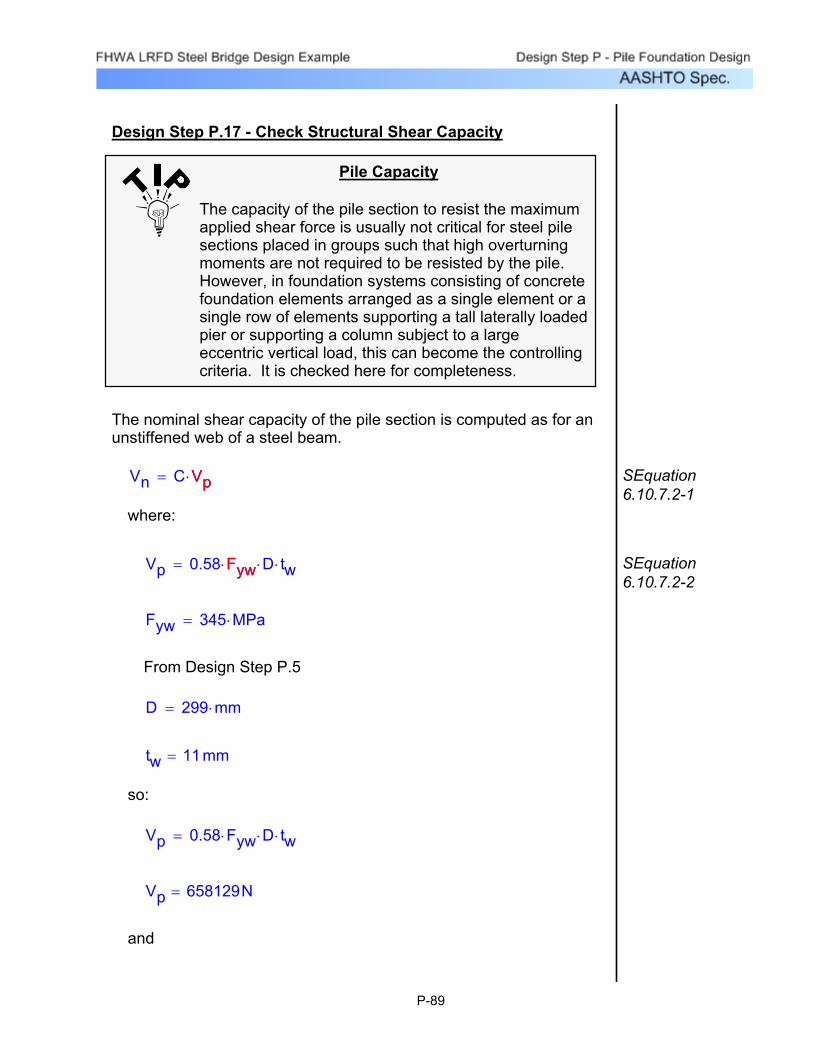
and
Vp 658129N=
Vp 0.58 Fyw⋅ D⋅ tw⋅=
so:
tw 11mm=
D 299 mm⋅=
From Design Step P.5
Fyw 345 MPa⋅=
SEquation 6.10.7.2-2
Vp 0.58 Fyw⋅ D⋅ tw⋅= Fyw
where:
SEquation 6.10.7.2-1
Vn C Vp⋅= Vp
The nominal shear capacity of the pile section is computed as for an unstiffened web of a steel beam.
Pile Capacity
The capacity of the pile section to resist the maximum applied shear force is usually not critical for steel pile sections placed in groups such that high overturning moments are not required to be resisted by the pile. However, in foundation systems consisting of concrete foundation elements arranged as a single element or a single row of elements supporting a tall laterally loaded pier or supporting a column subject to a large eccentric vertical load, this can become the controlling criteria. It is checked here for completeness.
Design Step P.17 - Check Structural Shear Capacity
P-89
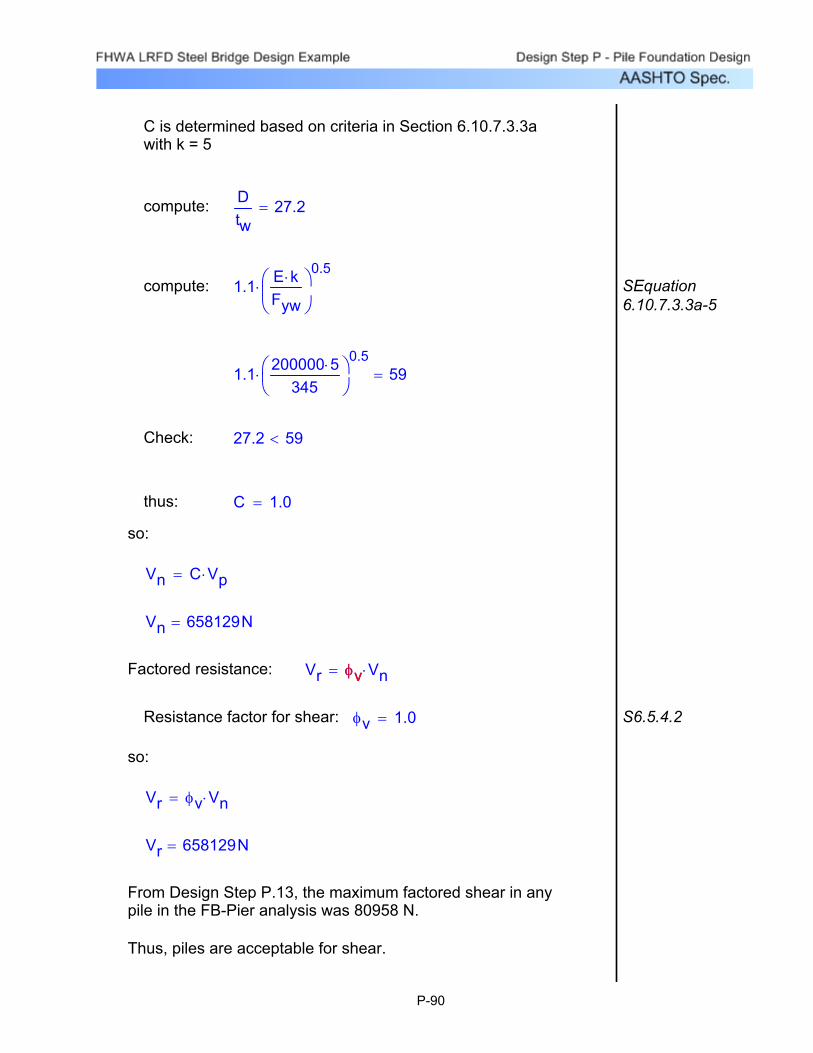
Thus, piles are acceptable for shear.
From Design Step P.13, the maximum factored shear in any pile in the FB-Pier analysis was 80958 N.
Vr 658129N=
Vr φv Vn⋅=
so:
S6.5.4.2φv 1.0=Resistance factor for shear:
Vr φv Vn⋅= φvFactored resistance:
Vn 658129N=
Vn C Vp⋅=
so:
C 1.0=thus:
27.2 59<Check:
1.1 200000 5⋅345
⎛⎜⎝
⎞⎠
0.5⋅ 59=
SEquation 6.10.7.3.3a-5
1.1 E k⋅Fyw
⎛⎜⎝
⎞⎠
0.5⋅compute:
Dtw
27.2=compute:
C is determined based on criteria in Section 6.10.7.3.3a with k = 5
P-90

S10.7.2.4 and S10.7.2.3.1
Thus deflections are within tolerances and Service limit states are satisfied.
S10.7.2.3.1∆v_all 13 mm⋅=The maximum vertical deflection allowed is
S10.7.2.2∆h_all 38 mm⋅=The maximum horizontal deflection allowed is
The structural engineer has determined allowable deflections as
∆v 3.4 mm⋅=The maximum vertical deflection observed is
∆h 12.4 mm⋅=The maximum horizontal deflection observed is
From Design Step P.13:
It can be seen from the results that the horizontal displacements at the beam seat elevation are slightly higher for the cases of pinned head piles. This is expected and the difference is usually much greater. In this case, the battered piles in the front row resist the majority of the lateral load so pile head fixity is not critical to performance of the foundation system.
Displacements were determined in the interaction analysis with FB-Pier
Design Step P.18 - Check Maximum Horizontal and Vertical Deflection of Pile Group at Beam Seats
Using Service Load Case
P-91

q0 130713 Pa⋅=209 kg
m3⋅Υ of fill =
6401 mm⋅h of fill =
Es 5745631 Pa⋅=
ν 0.25=
9449 mm⋅Depth of layer =Compute settlement at back edge of pile cap (Point A)
Figure P-15 Plan View of Approach Embankment
45720 mm 2744mm
9144 mm BA
Edge of pile cap
Abutment
WingwallToe of slope
Top of slope
R1
R2 R4
R3
Figure P-15 shows the location and dimensions of rectangles used to simulate approach embankment loading. The 45720 mm length was arbitrarily selected as representative of the length beyond which additional influence from the approach embankment at the abutment location is not significant. The final approach embankment geometry relative to existing grade may decrease or increase this value. However, use of 45720 mm is considered a reasonable upper bound.
Compute Settlement for consideration of Downdrag
As indicated in step P.1 elastic settlement of the loose sand will occur after construction of the pile foundation and abutment as the backfill behind the abutment is placed and the approach embankment is constructed.
S10.7.1.4Downdrag
Design Step P.19 - Additional Miscellaneous Design Issues
P-92
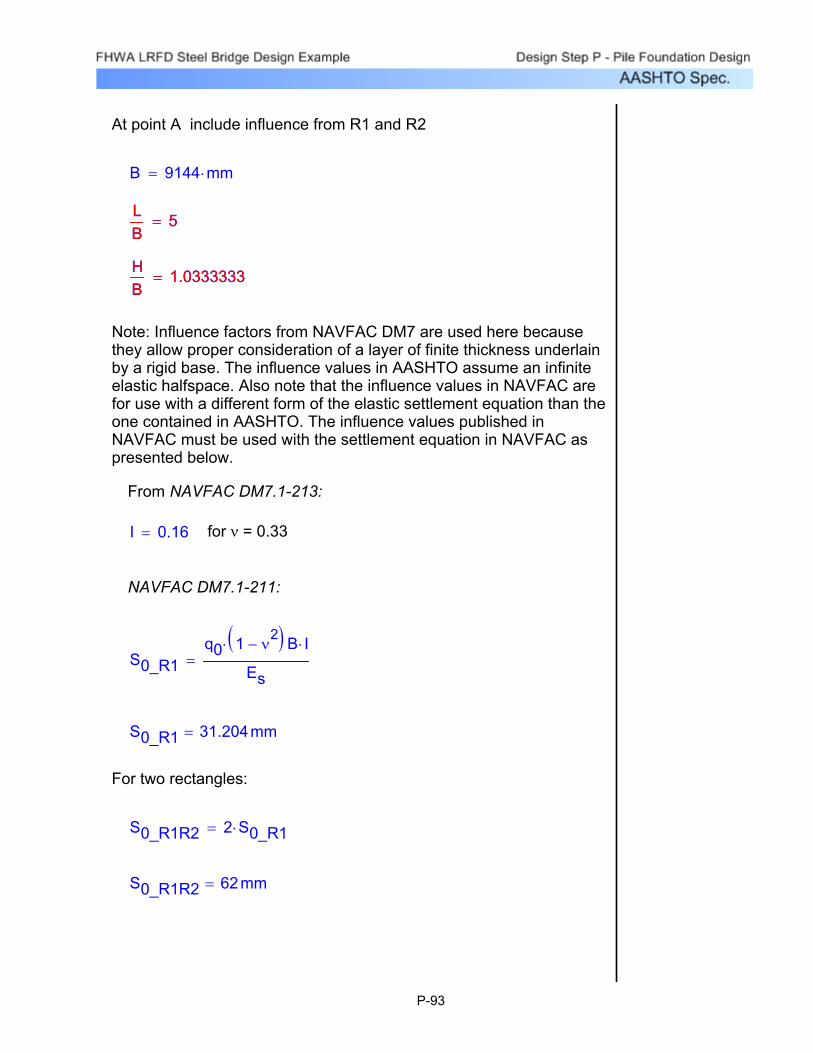
At point A include influence from R1 and R2
B 9144 mm⋅=
LB
5=LB
5=
HB
1.0333333=HB
1.0333333=
Note: Influence factors from NAVFAC DM7 are used here because they allow proper consideration of a layer of finite thickness underlain by a rigid base. The influence values in AASHTO assume an infinite elastic halfspace. Also note that the influence values in NAVFAC are for use with a different form of the elastic settlement equation than the one contained in AASHTO. The influence values published in NAVFAC must be used with the settlement equation in NAVFAC as presented below.
From NAVFAC DM7.1-213:
I 0.16= for ν = 0.33
NAVFAC DM7.1-211:
S0_R1q0 1 ν
2−( )⋅ B I⋅
Es=
S0_R1 31.204mm=
For two rectangles:
S0_R1R2 2 S0_R1⋅=
S0_R1R2 62mm=
P-93

Compute settlement at front row of piles (Point B)
To simulate this case; the corner of R1 and R2 are shifted forward to be coincident with point B, and the settlement due to the approach fill weight will be equal to that computed for Point A. However, the weight of the approach embankment above the heel of the footing will be supported by the pile foundation and will not contribute to elastic settlement. Thus the settlement at point B can be computed by subtracting the influence of rectangles R3 and R4 from the settlement computed for rectangles R1 and R2 alone.
Contribution of R3 and R4 only
B 2744 mm⋅=
LB
3.333333=LB
3.333333=
HB
3.444444=HB
3.444444=
From NAVFAC DM7.1-213
I 0.45= for ν = 0.33
S0_R3q0 1 ν
2−( )⋅ B I⋅
Es=
S0_R3R4 2 S0_R3⋅=
S0_R3R4 53mm= (for two rectangles)
R1 R2+ R3 R4+( )− S0_R1R2 S0_R3R4−=R1 R2+ R3 R4+( )− S0_R1R2 S0_R3R4−=
S0_R1R2 S0_R3R4− 9.736mm=
P-94

Thus downdrag loads can be safely supported by the back row of piles as designed.
Q 1512933N=
This is well below the factored resistance computed in Design Step P.10
508877K
If the factored downdrag is added to the maximum observed factored pile load on the back row, the total factored load is:
Note: higher loads were observed for service load cases.
From FB-Pier analysis, the maximum factored Axial load on back row of piles is 106090 N.
Qdd 403463N=
Qdd φdd Qs⋅=
Maximum factored drag load per pile
(maximum)φdd 1.8=
STable 3.4.1-2
Since downdrag is a load, it is factored in accordance with Section 3.4.1-2.
Qs 224146N=
S10.7.1.4 and C10.7.1.4
The maximum possible downdrag force per pile is equal to the ultimate tension capacity computed in step P.14. This conservatively assumes that downdrag is mobilized along the entire length of the pile and is not reduced by the live load portion of the axial load.
Sufficient settlement to mobilize downdrag forces is expected at the back row of piles but not at the front row of piles. This is because the loading producing the settlement is transmitted to the soil starting at the back edge of the footing. Evaluation of downdrag loads is required for the back row of piles but not the front row. Since the back row of piles is lightly loaded and vertical, they can probably handle the downdrag load without any special details. To verify this, the following conservative approach is used.
This is not sufficient settlement to mobilize downdrag on the front row of piles as per FHWA HI-96-033, Section 9.9.1
P-95
The pile cap connection should be designed to resist this force.
68058 N⋅
From Design Step P.13, the maximum factored tension force is
However, The cases run in FB-Pier that used no skin friction effectively simulate the case of a pile pulling out of the bottom of the footing under tension load. Review of these runs indicate that the pile could be pulled completely out of the bottom of the footing thus design of a tension connection should be included in the design of the pile cap.
Pile CapacityTo adequately transfer the tension load from the pile to
the pile cap, a special connection detail involving reinforcing passing through a hole in the pile web or
shear studs would be normally required.
The FB-Pier analysis showed some of the piles in the back row to be in tension under some of the strength limit states. None of the service limit states showed piles in tension.
S10.7.1.9Uplift and Pile to Pile Cap Connection
Design Step P.1 determined soils and ground water were non corrosive thus no special protection scheme or sacrificial steel is required.
S10.7.1.8Protection Against Deterioration
No downdrag is expected at the front row of piles thus batter of front row is OK
This bridge is not in seismic zones 3 or 4 thus battered piles are OK
S10.7.1.6Battered Piles
P-96
Based on the above, the design is optimized to the greatest extent practical
A brief evaluation of this possibility using FB-Pier indicates that removing 3 piles from the back row could cause the combined bending and axial stress in the front row of piles to exceed that allowed by the interaction equation. This is because elimination of the piles in the back row causes more of the horizontal loads to be absorbed by the front piles which produces higher bending moments in these piles.
However, load cases in which the longitudinal forces are reversed will result in higher loads on the back row of piles. These loads will not exceed the loads on the front row since some longitudinal loads can not be reversed (earth pressure). Still, it may be possible to eliminate every other pile in the back row and still meet all criteria.
The back row of piles is severely under utilized for the loads investigated.
Some of the front row are not fully loaded due to flexing of the relatively thin pile cap but the front row can be considered optimized.
84% of resistanceFrom Table P.16, the maximum results of the interaction equation yields:
Maximum factored combined load is:
of resistance Pmax_a
Qr100 %=
Maximum factored axial load is:
Determine if the pile system could be improved to reduce cost
Is Pile System Optimized?
Design Steps P.14 through P.19 indicate that all the applicable criteria are met
Does Pile Foundation Meet all Applicable Criteria?
Evaluation of the Pile Group Design
P-97

Summary of Final Design Recommendations
Final Pile Cap Layout
All Piles are HP 310 x 79 Grade 345All dimensions shown at bottom of pile cap
3125 mm
2363 mm
6 sp
aces
@ 2
235
mm
= 1
3410
mm
1428
6 m
m
438 mm
381 mm
1067 mm 838 mm
CL of pilecap
STEM
Battered at1H:3V
Figure P-16 Final Pile Cap Layout
P-98

Design considerations for design of pile cap
Piles to be embedded 300 mm into pile cap
Piles to have bar through web or shear stud to transfer 66724 N tension load to cap
For structural design of the cap, the factored axial load per pile is summarized in tables below.
From FB-Pier File FHWA_bat_fix_noskin.out
CASE: Fixed Pile Heads No Skin FrictionFB-Pier
Load Case
LC1 LC2 LC3 LC4 LC5 LC6
Limit State
STR-I MAX/FIN
SER-I MAX/FIN
STR-I MIN/FIN
SER-I MIN/FIN
STR-III MAX/FIN
SER-I MAX/FIN
Pile Number
1 -30512 -155563 258 -160567 7 -1555632 -1402435 -985148 -1215566 -979810 -1224284 -9851483 -56546 -178445 258 -183689 8 -1784454 -1469959 -1032788 -1277218 -1027228 -1266275 -10327885 -68565 -186220 257 -191505 10 -1862206 -1494825 -1049513 -1300616 -1043909 -1273704 -10495137 -75442 -190348 257 -195691 13 -1903488 -1511817 -1061212 -1300571 -1055563 -1272903 -10612129 -68271 -181114 257 -186403 17 -181114
10 -1491889 -1044976 -1283001 -1039416 -1242566 -104497611 -55950 -167956 258 -173205 22 -16795612 -1470938 -1026605 -1279976 -1021045 -1212363 -102660513 -29601 -139269 258 -144278 27 -13926914 -1403859 -975584 -1219302 -970246 -1140658 -975584
Table P-17 Factored Axial Load per Pile Fixed Pile Heads - No Skin Friction
P-99

From FB-Pier File FHWA_bat_pin_noskin.out
CASE: Pinned Pile Heads No Skin Friction
FB-Pier Load Case
LC1 LC2 LC3 LC4 LC5 LC6
Limit State
STR-I MAX/FIN
SER-I MAX/FIN
STR-I MIN/FIN
SER-I MIN/FIN
STR-III MAX/FIN
SER-I MAX/FIN
Pile Number
1 -60785 -162912 6437 -168014 -64993 -1629122 -1371787 -975228 -1221170 -969801 -1131272 -9752283 -86878 -185598 6436 -190944 -74846 -1855984 -1440290 -1024426 -1283045 -1018821 -1187987 -10244265 -98862 -193048 6436 -198440 -74383 -1930486 -1465556 -1042352 -1306309 -1036658 -1208760 -10423527 -105650 -196825 6435 -202274 -70273 -1968258 -1477744 -1054318 -1307733 -1048579 -1210495 -10543189 -98346 -187181 6436 -192581 -55087 -187181
10 -1458038 -1039238 -1290118 -1033544 -1193058 -103923811 -85820 -173503 6436 -178867 -35052 -17350312 -1442514 -1022958 -1285536 -1017308 -1186519 -102295813 -59130 -144265 6437 -149394 -3619 -14426514 -1375034 -973049 -1224596 -967577 -1129137 -973049
Table P-18 Factored Axial Load per Pile Pinned Pile Heads - No Skin Friction
P-100

From FB-Pier File FHWA_bat_fix_skin.out
CASE: Fixed Pile Heads Skin Friction
FB-Pier Load Case
LC1 LC2 LC3 LC4 LC5 LC6
Limit State
STR-I MAX/FIN
SER-I MAX/FIN
STR-I MIN/FIN
SER-I MIN/FIN
STR-III MAX/FIN
SER-I MAX/FIN
Pile Number
1 -25122 -151035 67898 -156021 -6963 -1510352 -1398921 -981144 -1276417 -975806 -1208760 -9811443 -52347 -175020 65669 -180269 -6171 -1750204 -1469114 -1031053 -1339627 -1025493 -1258135 -10310535 -64851 -183173 64473 -188471 885 -1831736 -1494736 -1048446 -1362935 -1042841 -1270902 -10484467 -72030 -187577 63872 -192942 3440 -1875778 -1511951 -1060456 -1375791 -1054807 -1275083 -10604569 -64570 -178040 64557 -183360 7823 -17804010 -1491311 -1043686 -1357197 -1038082 -1248660 -104368611 -51782 -164446 65838 -169740 12912 -16444612 -1470137 -1025137 -1340605 -1019532 -1222638 -102513713 -24261 -134568 68142 -139625 19587 -13456814 -1400389 -971981 -1277796 -966554 -1153513 -971981
Table P-19 Factored Axial Load per Pile Fixed Pile Heads - Skin Friction
P-101

From FB-Pier File FHWA_bat_fix_skin.out
CASE: Pinned Pile Heads Skin Friction
FB-Pier Load Case
LC1 LC2 LC3 LC4 LC5 LC6
Limit State
STR-I MAX/FIN
SER-I MAX/FIN
STR-I MIN/FIN
SER-I MIN/FIN
STR-III MAX/FIN
SER-I MAX/FIN
Pile Number
1 -59304 -161030 9193 -166106 -63538 -1610302 -1367606 -969668 -1221571 -964241 -1131450 -9696683 -86527 -184824 6308 -190153 -74361 -1848244 -1438866 -1021134 -1286381 -1015485 -1190834 -10211345 -98991 -192684 4801 -198057 -74397 -1926846 -1465066 -1039772 -1310669 -1034078 -1212407 -10397727 -106090 -196767 4088 -202198 -70673 -1967678 -1476988 -1051649 -1312403 -1045910 -1214231 -10516499 -98497 -186865 5069 -192243 -55403 -186865
10 -1456526 -1035946 -1294121 -1030297 -1196038 -103594611 -85504 -172805 6844 -178147 -35127 -17280512 -1441268 -1019844 -1289540 -1014195 -1189410 -101984413 -57702 -142472 9995 -147565 -2933 -14247214 -1371031 -967711 -1226019 -962284 -1129315 -967711
Table P-20 Factored Axial Load per Pile Pined Pile Heads - Skin Friction
Absolute maximum from above: 68142
Absolute minimum from above: 1511951−
FB-Pier may be used to print out all stresses in each element of the pile cap as a check on manual methods if desired.
P-102
Notes to be placed on Final Drawing
Maximum Factored Axial Pile Load = 1512395 N
Required Factored Axial Resistance = 1512395 N
Piles to be driven to absolute refusal defined as a penetration resistance of 240 Blows Per 300 mm (BP300MM) using a hammer and driving system components that produces a driving stress between 255 and 310 MPa at refusal. Driving stress to be estimated using wave equation analysis of the selected hammer.
Verify capacity and driving system performance by performing stress wave measurements on a minimum of 2 piles in each substructure. One test shall be on a vertical pile and the other shall be on a battered pile.
Perform a CAPWAP analysis of each dynamically tested pile. The CAPWAP analysis shall confirm the following:
Driving stress is in the range specified above.
The ultimate pile point capacity (after subtracting modeled skin friction) is greater than:
Qp 2326420 K⋅=
This is based on a resistance factor (φ) of 0.65 for piles tested dynamically.
References:
FHWA HI-96-033 Design and Construction of Driven Pile Foundations, Hannigan, P.J., Gobel, G.G, Thedean, G., Likins, G.E., and Rausche, F. for FHWA, December 1996, Volume 1 and 2
NAVFAC DM7 Design Manual 7; Volume 1 - Soil Mechanics; Volume 2 - Foundations and Earth Structures, Department of the Navy, Naval Facilities Engineering Command, May 1982.
P-103
PADOT DM4 Design Manual Part 4, Pennsylvania Department of Transportation Publication 15M, April 2000
Reese and Wang (1991)
Unpublished paper presenting group efficiencies of pile groups subject to horizontal loads in diferent directions and at different spacings.
NCEER-97-0022 Proceedings of the NCEER Workshop on Evaluation of Liquefaction Resistance of Soils, Edited by T.L. Youd, I.M. Idriss. Summary Report, 1997. MCEER Publication NCEER-97-0022
P-104