pilbara workforce development plan 2013–2016 · 2017-01-24 · 3 the pilbara workforce...
TRANSCRIPT

Pilbara Workforce Development Alliance
Pilbara workforce development plan 2013–2016Executive summary

2
Acknowledgement This document summarises the content of the Pilbara workforce development plan which was prepared by the Pilbara Workforce Development Alliance in collaboration with the Department of Training and Workforce Development. The alliance comprised the following individuals who generously contributed their time and expertise:
Dr Ken King, (current alliance chair), Pilbara Development CommissionMr Stephen Webster (former alliance chair), Pilbara Development Commission (now Gascoyne Development Commission)Ms Deidre Willmott and Mr Ford Murray, Fortescue Metals Group LtdMs Jacky Finlayson and Mr Mark South, Small Business Development CorporationMs Lisa Taylor, Department of Regional Development and LandsMs Lyn Farrell, Pilbara InstituteDr Nancy Rees and Mr Steve Del Borrello, Pindan CollegeMs Nicole Roocke, Chamber of Minerals and EnergyMr Nigel Haywood, Resources Industry Training CouncilMr Peter Donovan, Department of Aboriginal AffairsMr Peter Jeffries, Yamatji Marlpa Aboriginal CorporationMr Robin Vandenberg, Chamber of Commerce and IndustryMs Shelley Pike, Pilbara Regional CouncilMr Stedman Ellis and Ms Roma Sharp, Australian Petroleum Production and Exploration AssociationMs Annette Newman, Australian Government Department of Education, Employment and Workplace RelationsMs Sue Cuneo and Ms Sharon McCawley, Department of EducationMr Gordon Duffy and Ms Karen Ho, Department of Training and Workforce Development
An electronic version of the executive summary and the full plan can be accessed from www.dtwd.wa.gov.au
Title: Pilbara workforce development plan 2013–2016: Executive summary ISBN 978-0-7307-9852-1
© Department of Training and Workforce Development 2013
Reproduction of this work in whole or part for educational purposes, within an educational institution and on condition that it is not offered for sale, is permitted by the Department of Training and Workforce Development. This material is available upon request in alternative formats. Published by the Department of Training and Workforce Development Optima Building 16 Parkland Road Osborne Park WA 6017
For further information please contact: State Workforce Planning T: +61 8 6551 5000 Email: [email protected]
Disclaimer: This publication was prepared under the direction of the Pilbara Workforce Development Alliance and published by the Department of Training and Workforce Development. While the information contained in the publication is provided in good faith and believed to be accurate at the time of publication, appropriate professional advice should be obtained in relation to any information in this publication. Members of the alliance, the State Government and the Department of Training and Workforce Development shall in no way be liable for any loss sustained or incurred by anyone relying on the information. While every effort has been made to vet the contents of this report, it may contain references to, or images of, people who are now deceased. The Department regrets any offence this might cause.
The term ‘Aboriginal’ people in this report is inclusive of Torres Strait Islanders. It is noted that the terms ‘Aboriginal’ and ‘Indigenous’ have both been used in this report as a result of the terminology used in sourced information.
2
Pilbara workforce development plan 2013–2016: Executive summary

3
The Pilbara workforce development plan 2013–2016 (the plan) aims to build, attract and retain a skilled workforce to meet the economic needs of the Pilbara. It contains a range of priority actions which were identified by local stakeholders to address local workforce development challenges.
The plan aligns with the State Government’s Skilling WA – A workforce development plan for Western Australia (Skilling WA), which provides a framework for government and industry’s response to Western Australia’s skill and workforce needs.
The Pilbara Workforce Development Alliance, which is made up of industry, community and government representatives from the region, will be responsible for overseeing the implementation of the plan. The alliance will identify those actions within the plan that should be given highest priority and facilitate their implementation. Progress will be reported to stakeholders annually and be included in Skilling WA’s annual progress report.
The plan has been designed as an important reference point for all stakeholders as it identifies the challenges, agreed solutions and organisations that have a key stake in its implementation.
For the Regional Development Council, as the peak advisory body to the Western Australian Government on regional development matters, the plan is used to identify workforce issues and solutions which require policy consideration across regions. This includes guidance on Royalties for Regions initiatives to support regional workforce needs.
For local government bodies the plan identifies workforce issues to be taken into account as part of local government decision making processes.
The plan will be used by industry associations and employer peak bodies as a reference when working directly with employers to implement industry and enterprise solutions to workforce development challenges.
The plan also captures the views and aspirations of the broader community and provides a useful reference when engaging on workforce development issues across the region.
The Department of Training and Workforce Development in conjunction with the Pilbara Workforce Development Alliance will facilitate the coordination of State Government responses outlined in the plan. This will include working with those agencies and training providers designated to take the lead on priority actions in the plan.
Guide to implementation
3

4
Introduction .............................................................................................................................6The Pilbara region .....................................................................................................................7Methodology ..............................................................................................................................8Stakeholder and regional consultations ....................................................................................8
Strategic context .................................................................................................................. 10Skilling WA ............................................................................................................................. 10Pilbara Cities initiative ............................................................................................................ 12
Workforce profile ................................................................................................................. 13Regional economy ................................................................................................................. 13Population demographics ...................................................................................................... 15Regional labour market .......................................................................................................... 16Education and training ........................................................................................................... 20Aboriginal participation ........................................................................................................... 22Regional infrastructure ........................................................................................................... 23Settlement pattern and land supply ....................................................................................... 24
Critical occupation shortages ............................................................................................ 25
Workforce challenges and opportunities .......................................................................... 28
Strategies for workforce development .............................................................................. 35Summary of actions – Increasing workforce participation ..................................................... 36Summary of actions – Skilled migration ................................................................................ 38Summary of actions – Workforce attraction and retention .................................................... 40Summary of actions – Education and training ....................................................................... 41Summary of actions – Planning and coordination ................................................................. 43
References ............................................................................................................................ 44
Appendix A: Consultation list ............................................................................................ 46
Contents
4
Pilbara workforce development plan 2013–2016: Executive summary

55

6
Introduction
The Pilbara workforce development plan 2013–2016 (the plan) was prepared by the Pilbara Workforce Development Alliance (the alliance), in collaboration with the Department of Training and Workforce Development. Under the Skilling WA workforce planning framework, the plan is a response to the increasing demand for skilled and semi-skilled labour in the Pilbara region of Western Australia.
The key objective of the plan is to identify current and future workforce development and skills needs and develop strategies to ensure that these needs can be addressed. The development of the plan involved:
• an assessment of regional economic and demographic dynamics and the associated implications for the region’s labour market;
• an examination of labour market characteristics;• the development of labour market projections for industries and occupations;• an assessment of the factors affecting the supply of labour; and• the preparation of a workforce development action plan for the region in consultation with
a wide range of stakeholders.
The plan is one of nine regional workforce development plans being prepared as a key part of the Skilling WA workforce planning framework.
Each of the plans is:• aligned to the five strategic goals of Skilling WA; • used to inform the implementation and updating of Skilling WA; • a whole of government, industry and community sector approach to workforce
development in the nine regions of Western Australia;• overseen by a local workforce development alliance; and • designed to identify specific industry, government and community-sector agencies
recommended as having the ‘lead’ responsibility for coordinating strategies and projects stemming from the plans.
6
Pilbara workforce development plan 2013–2016: Executive summary

7
Figure 1: Map of the Pilbara region – key towns
Source: Department of Health.
The Pilbara regionThe Pilbara covers 506 575 km² and consists of the three Shires of Ashburton, Roebourne, East Pilbara and the Town of Port Hedland. It had a resident population over 62 700 in 2011 and stretches from the Indian Ocean in the west to the Northern Territory border in the east. It adjoins the Kimberley region to the north and the Gascoyne, Mid West and Goldfields-Esperance regions to the south.
Key towns within the region include Port and South Hedland, Karratha, Roebourne, Onslow, Wickham, Tom Price and Newman. These towns also formed the key consultation sites as part of phase 3 of the project.
The Pilbara is currently undergoing significant growth and development which has generated significant demand for skilled and semi-skilled labour.
MIDWEST
KIMBERLEY
PILBARA
Port HedlandSouth Hedland
Marble Bar
Nullagine
NewmanParaburdoo
Tom Price
PannawonicaOnslow
Roebourne
WickhamKarratha
7

MethodologyThe methodology involved the preparation of a regional workforce profile through desktop research; stakeholder consultations to validate desktop research and identify issues impacting on workforce development; and development of recommendations agreed by the alliance.
Stakeholder and regional consultationsThe preparation of the plan involved extensive stakeholder consultation with over 60 representatives from government, industry, industry peak bodies, the Western Australian network of 10 industry training councils, training and employment service providers and community sector organisations, including Aboriginal corporations.
Consultation methods employed to gain stakeholder insight included face to face interviews; open forum-style workshops; telephone interviews; and a survey of employers in the region.
Face to face meetings and workshops were held in the major regional centres of Port Hedland, Karratha, Roebourne, Onslow, Tom Price and Newman. These consultations were complemented by interviews with stakeholders in Perth.
Appendix A contains a list of stakeholders involved in the consultation process.
8
Pilbara workforce development plan 2013–2016: Executive summary

9
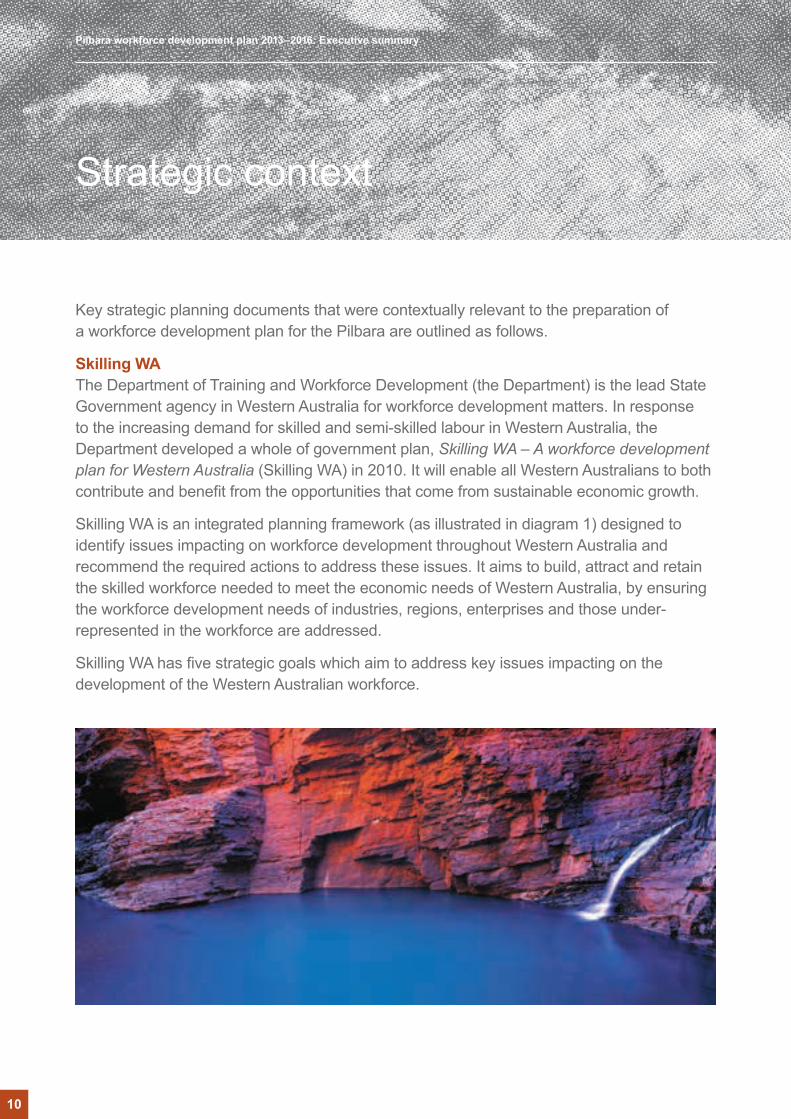
Strategic context
Key strategic planning documents that were contextually relevant to the preparation of a workforce development plan for the Pilbara are outlined as follows.
Skilling WAThe Department of Training and Workforce Development (the Department) is the lead State Government agency in Western Australia for workforce development matters. In response to the increasing demand for skilled and semi-skilled labour in Western Australia, the Department developed a whole of government plan, Skilling WA – A workforce development plan for Western Australia (Skilling WA) in 2010. It will enable all Western Australians to both contribute and benefit from the opportunities that come from sustainable economic growth.
Skilling WA is an integrated planning framework (as illustrated in diagram 1) designed to identify issues impacting on workforce development throughout Western Australia and recommend the required actions to address these issues. It aims to build, attract and retain the skilled workforce needed to meet the economic needs of Western Australia, by ensuring the workforce development needs of industries, regions, enterprises and those under-represented in the workforce are addressed.
Skilling WA has five strategic goals which aim to address key issues impacting on the development of the Western Australian workforce.
10
Pilbara workforce development plan 2013–2016: Executive summary

Diagram 1: Outputs from Western Australian workforce development planning
Skilling WA – A workforce development plan for Western Australia
Regional workforce
development plans
Industry workforce
development plans
Training together – working together
(Aboriginal workforce development
strategy)
Project focused workforce
development plans
Western Australianskilled migration strategy
Source: Department of Training and Workforce Development.
Strategic goal 1: Increase participation in the workforce, particularly among the under-employed and disengaged, mature-aged workers, Aboriginal and Torres Strait Islander and other under-represented groups.
Strategic goal 2: Supplement the Western Australian workforce with skilled migrants to fill employment vacancies unable to be filled by the local workforce and address those factors which support a growing population.
Strategic goal 3: Attract workers with the right skills to the Western Australian workforce and retain them by offering access to rewarding employment and a diverse and vibrant community and environment to live in.
Strategic goal 4: Provide flexible, responsive and innovative education and training which enables people to develop and utilise the skills necessary for them to realise their potential and contribute to Western Australia’s prosperity.
Strategic goal 5: Plan and coordinate a strategic State Government response to workforce development issues in Western Australia.
11

Pilbara Cities initiativeThe Pilbara Cities office was established within the Department of Regional Development and Lands in response to an announcement by the Premier in 2009 to address issues associated with significant growth in the region. The office was subsequently transferred to the Pilbara Development Commission in October 2012. Significant funding has been invested in the Pilbara, in line with this intitiative and the broader regional development agenda.
The Pilbara Cities’ vision is to transform key Pilbara towns into major urban centres and encourage settlement on a permanent basis.
A core theme of the vision, as well as ensuring growth plans for Karratha and the Town of Port Hedland, is to transform the Pilbara from a region of cyclical economic activity linked to energy and natural resource investments to a more balanced and sustainable economy and community. Key commonalities in both growth plans include:• economic diversification; • housing diversity and affordability; and• provision of a high level of social and community services to standards comparable to other
metropolitan areas.
It is important to recognise that the above three domains are inter-linked.
Economic diversification can only occur if appropriate skills are available. Appropriate skills for economic diversification cannot be attracted or retained without the availability of sufficient housing at affordable prices and without the provision of adequate community services. Similarly, provision of high quality community services and sufficient affordable housing, will require an appropriately skilled labour force.
In this sense, the Pilbara workforce development plan 2013–2016 is critical to the successful delivery of the Pilbara Cities vision and the respective growth plans.
12
Pilbara workforce development plan 2013–2016: Executive summary

1 GRP per capita for 2010–11 was estimated at approximately $268 800 for Pilbara; $179 400 for the Goldfields-Esperance region and $101 700 for the Midwest region – Department of Regional Development and Lands, unpublished data, January 2013.
Workforce profile
The following provides a summary of the relevant indicators and trends identified in the Pilbara workforce development plan 2013–2016.
Regional economyGross regional productAccording to Department of Regional Development and Lands estimates, the gross regional product (GRP) of the Pilbara was estimated to be $18.7 billion in 2011–12, equivalent to 7.8% of the gross State product (GSP) of Western Australia.
In 2010–11, the Pilbara had the highest per capita GRP of the nine regional areas across Western Australia, at approximately $268 800. This figure is more than triple the GSP per capita for Western Australia (approximately $94 200).
This high level of GRP is driven by export activies from the energy and natural resources sector with extensive, new and expanding operations in the Pilbara. The scale of activity has resulted in a substantially higher GRP per capita in the Pilbara than for other resource oriented regions (eg Goldfields-Esperance and the Mid West)1.
Pilbara industriesThe Pilbara is the core mining region of the State, with almost half of the State’s mining (in terms of value) occuring in this region. Iron ore dominates production and accounts for 93.3% of regional mining production. Industry production for the region was valued at $34.5 billion in 2009–10 (Department of Regional Development and Lands 2011a).
In addition, the Pilbara is the base of Australia’s largest offshore oil and gas reserves located in the Carnarvon Basin. This is the State’s second most valuable resource (by value of production) after iron ore. According to the Pilbara Development Commission (2012), sale of oil and gas from the Basin generated $23 billion in revenue in 2011.
Other industries that contribute to regional production include construction, manufacturing, retail, tourism and agriculture. However, the output of these industries pales in comparison to iron ore.
13

Enterprise structureThere were 2283 businesses registered in the Pilbara in June 2007 (Australian Bureau of Statistics 2010)2, with nearly half of these located in the Shire of Roebourne.
However, the mining sector accounts for only 2.2% of the 2283 registered businesses. This is likely due to a relatively small number of large corporations in the mining industry. By comparison, the construction industry accounts for the greatest number of business registrations (24%) and employs 13% of workers in the region. Other prominent industries, represented by locally registered businesses include: property and business services; retail trade; and transport and storage.
Of the businesses registered, 56% employed no staff (for example, were owner operator businesses or individual ABN registrations) and a further 24% employed between one and four staff.
Dwelling approvalsIt is broadly accepted that housing shortages are a concern in the Pilbara. Dwelling approvals are a lead indicator for population growth and generally a broad indicator of business and consumer confidence. Strong growth in approvals, interrupted only briefly in 2010, is indicative of a growing regional workforce and an expanding construction industry.
The value of approvals has increased, suggesting an increased cost of delivery, associated with growing wage pressures in the region.
Income distributionAverage salary income in the Pilbara is substantially higher than that of the State as a whole and is growing at a relatively faster pace.
High average income estimates in the Pilbara are driven by a heavily skewed income distribution. While there are relatively similar levels of low income earners across the Pilbara and Western Australia, there is significant divergence in the number of low to middle income earners (under-represented in the Pilbara) and high income earners (over-represented in the Pilbara). This is reflective of the skewed employment profile in the region (heavily skewed toward the higher wage resources sector) and has the potential to crowd-out employers in other sectors that are unable to compete with the high pay currently available in these industries.
State investment in the PilbaraSignificant State funding has been invested in the Pilbara, in line with the State Government’s Pilbara Cities initiative and the broader regional development agenda. In 2010–11 the State Government contributed $335 million in Royalties for Regions funding to the region accounting for 46% of regional funding across the State. By comparison, 20% of the Royalties for Regions funding was allocated to the Kimberley and all other regions received 10% or less (Department of Regional Development and Lands 2011b).
2 Data for the number of registered businesses in the Town of Port Hedland and the Shire of East Pilbara was excluded from ABS reporting. These figures are, however, represented in the total number of business registrations for the Pilbara.
14
Pilbara workforce development plan 2013–2016: Executive summary

These investments align strongly with Skilling WA through their capacity to offer potential employees a ‘diverse and vibrant community and environment to live in’. Education investments also increase the capacity of the local State Training Provider, Pilbara Institute, to provide ‘flexible, responsive and innovative education’.
Population demographicsPopulation growth in the Pilbara is strongly linked to the employment opportunities offered in the region. Recently, this strong growth has been driven by employment demand from the resources sector.
Population projectionsIn 2012, The Chamber of Minerals and Energy (CME) forecast Pilbara resident population growth of between 12 700 and 16 300 (on a weighted basis) to 2020, based on the Australian Bureau of Statistics 2011 Census count of usual residents of 59 894. It should be noted, however, that the Australian Bureau of Statistics has subsequently re-estimated the 2011 population to be 62 736.
These figures are unlikely to include the majority of those employed directly in fly-in fly-out (FIFO) employment. The 2011 Census counted 80 728 people in the region on Census night, a figure which includes FIFO workers, but also tourists, transient workers, business visitors and usual residents.
Age and sex structureAccording to Australian Bureau of Statistics (2010c), the Pilbara population is predominantly male and strongly represented in the working, 25–54 year age brackets. Key secondary and tertiary student age brackets are largely under-represented when compared with Western Australia (15–24 years) as are mature-aged worker and retiree cohorts (55 years+). People may leave the region for alternative locations in pursuit of improved services at key points in their life (for example, to obtain an education or upon retirement). Relatively younger retirement age averages for mining industry employees are also likely to contribute to the under-representation of mature-aged residents in the region.
Gender structureThe Pilbara population has a higher proportion of males than Western Australia as a whole. This difference is most pronounced in the East Pilbara, where males account for 62% of the population, compared with the average of 51% across Western Australia (Australian Bureau of Statistics 2010c). This gender imbalance is likely driven by high rates of male employment in industries such as mining and construction that have contributed most to overall population growth and migration.
Household and family compositionAs at the 2011 Census, Pilbara households are predominantly family households (76.0% compared with 72.2% in Western Australia), with fewer lone and group households represented. Within family households, the majority were couple families with children (54.0% compared with 45.5% in Western Australia).
15

Regional labour marketLabour force growthGrowth in the Pilbara labour force between the 2006 and 2011 Census was 58.6%. At the time of the Census this increase was largely attributable to employment demand from the resources sector, observed most prominently in the Shire of Roebourne.
Unemployment trendsUnemployment rates across the Pilbara were typically lower than the State average, reflecting the trend that people move to the Pilbara for employment (and typically when a job has been secured).
The town of Port Hedland has consistently presented the highest rate of unemployment in the region peaking at 7.7% in March 2010 (compared with 4.6% in the Pilbara and 5.0% in Western Australia). However, by September 2012 unemployment in Port Hedland had reduced to 3.1%.
Figure 2: Unemployment trend, Pilbara and Western Australia, March 2002–March 2011
Une
mpl
oym
ent r
ate
9%
Mar–02
Mar–03
Mar–04
Mar–05
Mar–06
Mar–07
Mar–08
Mar–09
Nov–0
9Ju
l–02
Jul–0
3Ju
l–04
Jul–0
5Ju
l–06
Jul–0
7Ju
l–08
Jul–0
9Ju
l–10
Nov–0
2
Nov–0
3
Nov–0
4
Nov–0
5
Nov–0
6
Nov–0
7
Nov–0
8
Mar–10
Mar–11
Nov–1
0
8%
7%
6%
5%
4%
2%
0
Source: Department of Education, Employment and Workplace Relations 2011.
Ashburton East Pilbara
3%
1%
Port Hedland Roebourne Pilbara WA
Ashburton
Roebourne
Pilbara
East Pilbara
WA
Port Hedland
16
Pilbara workforce development plan 2013–2016: Executive summary

Labour force participationAs shown in table 1, the Shires of Ashburton and East Pilbara have higher labour force participation rates than the State and regional average. The Shire of Roebourne and the Town of Port Hedland have relatively lower rates of participation compared to the rest of the region but are also still ahead of the State average.
The substantially higher rate of participation in Ashburton, combined with the low unemployment rate, reinforces the potential for local labour shortages.
Comparing the four Pilbara local government areas (LGAs), the lowest labour force participation rate was recorded for Aboriginal people in the Shire of Roebourne; people with disabilities in the Town of Port Hedland; and 15–19 year olds in the Shire of East Pilbara. Participation rates among mature-aged persons were substantially higher than the State average.
Table 1: Labour market indicators, Pilbara and Western Australia, August 2011
Working age estimated resident population
Labour force
Participation rate
Shire of Ashburton 8217 6144 74.8%
Shire of Roebourne 18 197 12 235 67.2%
Shire of East Pilbara 10 123 6997 69.1%
Town of Port Hedland 11 837 7835 66.2%
Pilbara 48 374 33 211 68.7%
Western Australia 1 799 102 1 152 198 64.0%
Source: Australian Bureau of Statistics 2011c, Population Census (based on place of usual residence).
Employment by industry sectorThe mining and construction industries accounted for approximately 51.7% of employment in 2011, with both industries demonstrating strong employment growth. Similarly the professional, scientific and technical services sector showed significant employment growth over the period 2006–11 (124.0%) as did transport, postal and warehousing (84.9%). In contrast, the arts and recreation services, financial and insurance services sectors, all accounted for a relatively low proportion of employment over the same period.
17

Table 2: Employment by industry sector, Pilbara, between 2006 and 2011
Industry sector2006 2011 2011 2006–11
Persons Persons % distribution % growth
Mining 5754 11 431 35.3% 98.7%
Construction 2087 5303 16.4% 154.1%
Accommodation and food services 990 1637 5.1% 65.4%
Transport, postal and warehousing 916 1694 5.2% 84.9%
Professional, scientific and technical services 409 916 2.8% 124.0%
Manufacturing 835 1111 3.4% 33.1%
Education and training 1359 1544 4.8% 13.6%
Health care and social assistance 1293 1358 4.2% 5.0%
Retail trade 1416 1442 4.5% 1.8%
Public administration and safety 1124 1300 4.0% 15.7%
Administrative and support services 716 1052 3.3% 46.9%
Other services 568 938 2.9% 65.1%
Inadequately described/Not stated 589 938 2.9% 59.3%
Rental, hiring and real estate services 415 588 1.8% 41.7%
Wholesale trade 397 512 1.6% 29.0%
Electricity, gas, water and waste services 203 350 1.1% 72.4%
Agriculture, forestry and fishing 169 162 0.5% -4.1%
Financial and insurance services 141 145 0.4% 2.8%
Information media and Telecommunications 83 90 0.3% 8.4%
Arts and recreation services 76 108 0.3% 42.1%
Total 19 531 32 368 100.0% 65.7%
Source: Australian Bureau of Statistics 2011c, Population Census (based on place of usual residence).
18
Pilbara workforce development plan 2013–2016: Executive summary

Occupation structureAs a consequence of the large number of jobs in the resources sector and associated industries, technicians and trade workers was the predominant occupation (28.0%) for those employed in the Pilbara in 2011.
This was followed by machinery operators and drivers in the Shires of Ashburton and East Pilbara and professionals in the Shire of Roebourne. Labourers accounted for a greater proportion of occupations in each local government area when compared with the State (Australian Bureau of Statistics 2011).
Internal migrationPilbara residents are more mobile than residents elsewhere across the State according to the Australian Bureau of Statistics (2011b) data. Only 29.0% of residents were living at the same address as five years previously (as compared to 54.2% of residents for Western Australia).
For the same period, 30.2% of the Pilbara population declared their usual residence to be outside Western Australia. This compared to 6.2% for the State as a whole. Pilbara residents also have a higher rate of interstate mobility than Western Australia as a whole. In addition to these figures, the reliance of the resources sector on FIFO arrangements to supplement their local workforce further adds to the transient nature of regional populations in the Pilbara.
International migrationAt the 2011 Census (Australian Bureau of Statics 2011a), 19.5% of the Pilbara population (11 657 residents) were born abroad. While international immigration can complement the capacity of the local labour force to meet employment demand, it can create workforce challenges, in particular: the willingness of migrants to remain in regional areas; inter-regional competition for migrants; and the social match between migrants and their host communities.
Workforce supply projectionsAccording to the Pilbara Industry’s Community Council population projections, the resident labour force in the Pilbara will have grown from a 2010 base of 51 067 persons to 61 085 persons by 2015 (Waller 2010, p 3). By projecting the average annual growth rate of each demographic age group over the same period, an estimate of the working population (aged 15 years and over) can be established.
Workforce demand projectionsA set of projections have been synthesised for workforce demand to identify industries that are likely to experience significant growth in employment3. The Chamber of Minerals and Energy of Western Australia’s (2011) State Growth Outlook provides projections of construction and mining workforces for the Pilbara. These projections highlight $148 billion in project capital expenditure (approximately 75.0% of projected State expenditure) attributed to the region4. The projections also highlight a peak construction workforce in 2012, which declines over the subsequent three years to 2015.
3 Note that the objective here is not to ‘forecast’ the exact level of employment demand but rather to get some sense of the industries that are likely to experience significant growth to 2015.
4 A full list of projects included in these projections is available from the November 2010 Prospect Magazine, downloadable from the Department of State Development website (www.dsd.wa.gov.au).
19

Meanwhile, Pilbara Cities projections anticipate the transition of the economy toward a more diversified employment distribution by 2035.
Industries expected to grow under the Pilbara Cities scenario between 2012 and 2015 include retail trade; health care and social assistance; manufacturing; and education and training. These industries are all relatively under-represented in the current profile and their growth will drive the diversification of the economy.
Industry critical/skills shortage occupationsJoblink Enterprises Incorporated (2011) and the Pilbara Institute (2011) each undertook an external scanning exercise to identify occupations in the Pilbara that are experiencing critical workforce shortages. These findings reinforce the 2010 assessment by the Department of Education, Employment and Workplace Relations’ Survey of Employers Recruitment Experiences which nominated specific occupations in the region that were ‘difficult to fill’.
Occupations experiencing critical workforce shortages consistently identified across the three reviews included trade, education, professional services, health care, mining, hospitality and community service workers.
Education and trainingEducation participationAs identified in the Pilbara Education Study (Pilbara Development Commission, August 2011), there are 49 education and training institutions available in the Pilbara5. However, low attendance is a particular concern in the Pilbara, leading to lower levels of skilled labour being available to take up employment locally. Low retention of students to higher levels of secondary school is also an issue. This reduces both the skilled labour available and those eligible to attend tertiary education.
Literacy and numeracy results for Pilbara students are below State averages, resulting in a working age population with less capacity to meet industry demand. The literacy and numeracy levels for the Pilbara Aboriginal population are also low, which create barriers for the Aboriginal population in gaining sustainable employment and participation in the economy.
Attendance figures for Pilbara schools are lower than the State average. The Pilbara has a relatively lower retention rate of students through to senior secondary education (when compared with the State as a whole). Lower education outcomes can result in poorer rates of workforce participation or a working age population with lower capacity to meet industry demand.
Pilbara schools have difficulties attracting school leaders, teachers and support staff. This reduces the capacity of institutions to deliver quality education outcomes.
5 Comprising 21 primary schools, six high schools, six community schools, 10 State Training Provider campuses and two college campuses, together with four other education outlets.
20
Pilbara workforce development plan 2013–2016: Executive summary

6 ‘In training’ is a snapshot count of apprentices and trainees with a training contract at a point in time.
Highest level of schoolingThe highest level of schooling achieved by residents in the Pilbara is lower than the State average. In 2010, only 80.0% of year 12 students at Pilbara public schools graduated compared with 87.0% for all public schools in Western Australia (Pilbara Development Commission August 2011).
The 2011 Census data shows Aboriginal residents in the Pilbara have a lower average level of schooling completed relative to Western Australia’s Aboriginal population. In the Pilbara, 19.4% of Aboriginal adult residents had completed year 12. This compares to 20.6% rate for total Western Australia’s Aboriginal population (Australian Bureau of Statistics 2011b).
Post school qualificationsThe pool of post school qualifications for the Pilbara is insufficient to meet the requirements of the employment market. The tertiary qualified Pilbara labour force has an over-representation of certificate qualified participants, when compared to the State. In the Pilbara an average of 66.8% of adult residents have post school qualifications as per the 2011 Census (Australian Bureau of Statistics 2011e).
Training deliveryVocational education and training is likely to be the key means of providing the post school qualified workforce in the Pilbara. The Department of Training and Workforce Development’s VET Enrolments Data Collection (2011) indicates that in 2010 there were a total of 5150 students funded under the National Training Agreement enrolled in vocational education and training courses in the Pilbara, predominantly studying certificate II and III level qualifications.
As at 31 December 2011, 1472 people were undertaking apprenticeships and traineeships in the Pilbara (these people were also registered as living in the region). The majority were males undertaking certificate III level courses. There is a relatively small pipeline of certificate I and II participants in training 6. This reduces the pipeline for subsequent training and ultimately for skilled capacity in the local labour force.
Partnerships for deliveryEducation delivery arrangements in the Pilbara are unique due to the geographical remoteness of the region, the scale of the resource sector demand for skilled workers and the predominance of the resource sector. Currently, all levels of government, education stakeholders and industry are actively participating in partnerships to increase participation, workforce development and training outcomes. In particular, partnerships around service delivery is needed to address the challenges for education delivery in the Pilbara.
Challenges for education and training deliveryAccess to quality education has been identified as one of the main reasons families/households are reluctant to move to and remain in the Pilbara. Remoteness and distances between major towns has resulted in challenges in education access and delivery. Challenges also exist for the higher number of FIFO personnel seeking to up-skill, for whom it is difficult to attend classes in person or even online.
21

In some instances, there are cultural barriers to education in Aboriginal communities, requiring tailored teaching approaches and additional staff training/resources (which may often be limited).
Aboriginal participationThe Aboriginal and Torres Strait Islander population in the Pilbara is a key demographic for consideration. In addition to accounting for approximately 17% of the regional population (Department of Regional Development and Lands 2011a) the participation of Aboriginal people in the workforce is a particular strategic focus of Skilling WA.
Accurately characterising the Pilbara’s Aboriginal population is relatively difficult. The majority of readily quantifiable data is sourced from the 2011 Census. The Census figures are subject to undercount, as well as responses with unknown Aboriginal status, and as a result the Census figures underestimate the region’s actual Aboriginal population. The Census figures are best interpreted as broad indicators and actual numbers should be treated with caution.
Age and gender structureThe region’s Aboriginal population is typically older than the State’s Aboriginal population as a whole, which places constraints on the likelihood of their participation in the workforce.
There is a significant over-representation of Aboriginal male youths and young adults in the Pilbara (0–24 years) when compared with the non-Aboriginal population. There is also a commensurate under-representation of Aboriginal males in all older age brackets (between 25 and 64 years). This reduces community diversity, though is consistent with trends across the Pilbara.
Labour force participationAboriginal labour force participation rates are substantially lower than the non-Aboriginal population. This is potentially driven by a variety of factors, including lower education attainment, higher rates of morbidity and mortality, higher rates of incarceration, community remoteness and challenges in transport access.
UnemploymentAccording to the Australian Bureau of Statistics 2011 Census, the Pilbara Aboriginal population has a moderately lower rate of unemployment (13.8%) than the State average for Aboriginal persons (17.8%)7. Both figures are significantly higher than the broader rate of 2.5% unemployment across the Pilbara population in 2011.
Employment by industryConsistent with the workforce demand across the region, mining was the predominant employer for the Pilbara’s Aboriginal population (41.3% of the Aboriginal workforce in the Pilbara) in 2011. Outside of mining, service industries, including construction; health care and social assistance; public administration and safety; and education and training are also major employers for Aboriginal workers (Australian Bureau of Statistics 2011).
7 These rates include Aboriginal persons engaged in the Community Development Employment Project.
22
Pilbara workforce development plan 2013–2016: Executive summary

Education and trainingAboriginal persons residing in the Pilbara were more likely to have left school in year 8 or earlier, when compared with Aboriginal persons across the State. Poor education participation and completion rates constrain employment opportunities and increase the likelihood of unemployment. Year 12 completion rates are lower for Aboriginal persons in the Pilbara.
Regional infrastructureInfrastructure and services are concentrated in the key residential towns across the region, with large tracts of open space between them. As such, distance is a critical issue for service delivery and workforce development in the Pilbara. This reinforces the need for an effective strategy to assist the local workforce to meet the employment demand in each of the key towns across the region.
The delivery of the infrastructure priorities8 identified in the Pilbara Planning and Infrastructure Framework (Western Australian Planning Commission, January 2012) will be critical to supporting the attraction and retention of workers to the region, the expansion of the residential footprint in key towns and the ongoing growth and diversification of the local economy. The infrastructure priorities in the framework are a succinct summary pertinent to the Pilbara workforce development plan 2013–2016.
Utility infrastructure prioritiesMost of the Pilbara’s urban infrastructure was constructed in the 1960s and 1970s and is reaching the end of its functional life. These ageing networks are now constraining economic productivity and impacting on the functionality of communities. There is now a strong need to upgrade and replace much of the region’s infrastructure and, in turn, this will provide the impetus to look at new approaches and technologies for utility infrastructure provision.
Community infrastructure prioritiesThe expansion of the Pilbara’s population to more than 140 000 by 2035 will require a higher threshold of facilities and services. The enhancement of these facilities and services will greatly assist the region’s ability to attract and retain workers and their families.
Transport infrastructure prioritiesThe Pilbara will require a transport system that provides equitable access for residents and industry and practical, safe and affordable opportunities for intra-regional, intra-state, inter-state and international travel, to meet the Pilbara’s projected expansion of economic activity and population. This encompasses all modes of transport including road, rail, marine, air and urban/public transport.
Key infrastructure issues and trends There have been constraints on access to the region across road, rail, marine and air modes of transport, as well as public transport. This also places negative impacts on the growth of the resource sector.
8 Further details pertaining to these priorities are contained in the Pilbara Planning and Infrastructure Framework, which can be accessed from http://www.planning.wa.gov.au/publications/6661.asp
23

There are also gaps in services supporting the workforce including utility, health, education, telecommunications, community safety, support and entertainment. This was mainly driven by the shortage of labour as well as the shortage of housing to accommodate the workforce.
Settlement pattern and land supplyResident accommodationHousing is recognised as a key issue to attracting workers to the Pilbara. Accommodation cost pressures on non-mining workers are well documented and the resolution of these issues is an integral component of the Pilbara Cities vision.
Transient workforce accommodationDue to the growth of the resources industry over the last decade, urban areas of the Pilbara are required to accommodate a large transient workforce. Temporary accommodation facilities that largely consist of single rooms with shared facilities are located in several locations in urban centres. A number of hotels and motels also let rooms to transient and longer term workers.
In recognition of the prevalence of transient workforce accommodation, six hectares of land in Port Hedland and 22 hectares of land in Karratha have been zoned specifically for transient workforce accommodation use.
Land salesLand sales have increased in the Pilbara due to increased focus from the State Government to bring more land to the market to address housing affordability, as well as an increased level of economic activity in the region.
Residential landAccording to the Western Australian Planning Commission, there are large amounts of undeveloped zoned land around Karratha (1164 hectares) and comparatively limited undeveloped land around Port Hedland, Onslow and Newman (115 hectares, 94 hectares and 72 hectares respectively). Development of this land however, is constrained by a number of factors.
Firstly, while the cost of materials is high, house prices have been volatile, making it difficult to attract finance for developments. Secondly, in addition to the long construction timeframe, the timeframe taken to seek government approvals is also lengthy. Finally, developers also face issues surrounding supporting infrastructure capacity as well as community related issues namely issues with Aboriginal heritage and native title as well as issues related to environment impact management.
24
Pilbara workforce development plan 2013–2016: Executive summary

Critical occupational shortages identified through the literature review9; consultation findings; and regional employer survey, have been collated to inform a regional priority occupation list (RPOL) for the Pilbara. For further details refer to chapter 4 of the plan.
The RPOL is intended to assist State Government initiatives to target and grow specific areas of the Pilbara’s workforce. The occupations recommended for inclusion in the RPOL reflect the breadth of critical occupation shortages identified by key stakeholders in the Pilbara. While the majority of occupations identified were professionals or technicians and trade workers, a broad variety of community, clerical and labourer positions were also identified. Furthermore, a broad cross section of industries was represented in the RPOL, reflecting workforce concerns for the entire region, not solely the mining or construction industries.
Table 3 provides a succinct RPOL for the Pilbara. This list represents the occupations that have been repeatedly nominated as critical shortages in the Pilbara. Nominated drivers of these shortages consistently included wage competition with the resources sector, the cost of housing associated with employee attraction, and the rapid rate of project expansion and construction workforce demand. Difficulties in attracting and retaining specialist skills in a remote region were also noted as an ongoing challenge.
Critical occupation shortages
9 Such as, Joblink Entreprises Incorporated and Pilbara Institute’s individual external scanning exercise in 2011, and the Department of Education, Employment and Workplace Relations’ Survey of Employers’ Recruitment Experience.
25

Table 3: Pilbara regional priority occupation list
ANZSCO Code Descriptor Literature
review SPOL ITC priorities
Managers
133111 Construction Project Manager SPOL 1
133112 Project Builder SPOL 1
Professionals
221111 Accountant (General) SPOL 1
223111 Human Resource Adviser SPOL 2
223112 Recruitment Consultant SPOL 2
223113 Workplace Relations Adviser
223311 Training and Development Professional SPOL 1
232212 Surveyor SPOL 1
232611 Urban and Regional Planner SPOL 1
233111 Chemical Engineer SPOL 1
233211 Civil Engineer SPOL 1
233311 Electrical Engineer SPOL 1
233411 Electronics Engineer SPOL 2
233511 Industrial Engineer
233512 Mechanical Engineer SPOL 1
233513 Production or Plant Engineer SPOL 2
252311 Dental Specialist SPOL 2
252312 Dentist SPOL 2
253111 General Medical Practitioner
253112 Resident Medical Officer
Technicians and trades workers
322114 Metal Casting Trades Worker SPOL 2
322211 Sheetmetal Trades Worker SPOL 2
331111 Bricklayer SPOL 1
333212 Solid Plasterer SPOL 1
26
Pilbara workforce development plan 2013–2016: Executive summary

ANZSCO Code Descriptor Literature
review SPOL ITC priorities
333411 Wall and Floor Tiler SPOL 2
334111 Plumber (General) SPOL 1
341111 Electrician (General) SPOL 1
Community and personal service workers
411711 Community Worker SPOL 1
421111 Child Care Worker SPOL 1
422116 Teachers’ Aide SPOL 2
431111 Bar Attendant SPOL 1
431112 Barista
431211 Cafe Worker
431411 Hotel Service Manager SPOL 1
431511 Waiter SPOL 1
Clerical and administrative workers
511111 Contract Administrator SPOL 1
511112 Program or Project Administrator
512111 Office Manager SPOL 2
531111 General Clerk SPOL 2
551211 Bookkeeper SPOL 1
599411 Human Resource Clerk
599999 Clerical and Administrative Workers nec
Sales workers
621111 Sales Assistant (General) SPOL 2
27

Workforce challenges and opportunities
The remote nature of the Pilbara, its highly transient workforce and a significant and growing demand for workers in the region combine to create a unique set of workforce development challenges and opportunities. Key issues identified through the stakeholder consultation process that contributes to these challenges and opportunities have been grouped according to their relevance to the five Skilling WA strategic goals summarised as follows.
Strategies to address these key issues are outlined in chapter 6.
Workforce participation
Stakeholders identified key issues that are likely to influence the Pilbara workforce in relation to strategic goal 1:
• The Pilbara workforce is predominantly male and ageing. Youth populations are growing at a relatively slow rate. There is a need to identify employment opportunities for the ageing workforce and to attract stay-at-home parents into the workforce through part time employment incentives.
• The Pilbara has generally high participation rates among most under-represented groups, when compared with State averages. Although, this was particularly high for mature-aged workers, this is largely a function of the significant number of mature age residents leaving the region on retirement. These high rates of participation mean that initiatives to increase workforce participation among these groups will yield relatively small workforce increases.
• Despite the above trend, Aboriginal participation was low when compared to regional trends. Workforce planning to increase participation of Aboriginal people needs to be cognisant of the significant barriers to participation in the region, including education, health, housing, isolation, transport and cultural concerns. An encouraging trend for the participation of Aboriginal people was apparent in the high representation of Aboriginal workers in key service industries.
• Local people in social housing are hesitant to seek full time employment as it results in them being paid above the social housing threshold, leading to them potentially losing housing security.
Strategic goal 1 Increase participation in the workforce, particularly among the under-employed and disengaged, mature-aged workers, Aboriginal and Torres Strait Islander and other under-represented groups.
28
Pilbara workforce development plan 2013–2016: Executive summary

Stakeholder consultation issues specifically related to Aboriginal workforce participation in the Pilbara are summarised as follows.
• The majority of ‘stream 1 and stream 2’10 participants that are readily employable are typically already engaged in the workforce. Those that are currently not employed are the ‘stream 3 and stream 4’ who require significant support services and assistance to re-engage with employment.
• Current vacancy advertising processes typically assume a degree of computer literacy and computer access, which may not always be available amongst the unemployed Aboriginal population.
• Current requirements for obtaining a drivers licence in the region were consistently raised as prohibitive.
• Aboriginal service providers have commented that key performance indicators for grant funding do not necessarily always fit with the staged outcomes and support needed for disengaged Aboriginal people in remote communities.
• Some of the cultural issues for Aboriginal people (for example, lore time and attendance at funerals) pose challenges in managing absences in a workforce environment.
• Unemployed Aboriginal persons are often not able to meet minimum literacy and numeracy requirements. There is also often no understanding of the mutual obligation between the worker and the employer.
• The transient nature of members of the Aboriginal workforce is problematic.• The appetite from local Aboriginal people for mining roles has past its peak. It is perceived
that those with an interest in mining related employment have already sought roles.
10 When job seekers make their first contact with Centrelink, a Job Seeker Classification Instrument (and where necessary, A Job Capacity Assessment) is used to place job seekers into one of four streams based on their level of disadvantage. Work ready job seekers are classified as ‘stream 1’ while job seekers whose pathway to employment may be longer are classified as stream 2, 3 or 4. Further details are available at www.deewr.gov.au
29

Stakeholder consultation issues specifically related to female and mature age workforce participation in the Pilbara are summarised as follows.
• It is slightly easier to recruit female workers. Businesses in key towns across the Pilbara indicated that they rely heavily on the ‘partner workforce’ that is drawn to the region courtesy of mining employment.
• There is a large, under engaged female workforce in the Pilbara. The key issue driving this under engagement is the availability of affordable and suitable child care. Access to culturally appropriate and sustainable child care is important to young single mothers.
• Although female students are typically not disposed to trade occupations, local education providers perceive there is an opportunity to increase promotion of trade associated courses to female students.
• Small business start ups in South and Port Hedland are typically driven by females. This sector struggles to grow, however, given the expense of taking on employees and the availability of housing.
• There is a large proportion of mature-aged workers in the local government workforce that fit into the ‘baby boomer’ category. These people are seeking a higher quality of local services and amenity if they are to remain in the region.
Migration
Stakeholders identified key issues that are likely to influence the Pilbara workforce in relation to strategic goal 2:
• Shortages were identified in trade, post-trade, education, professional services, health care, mining, hospitality and community service occupations. Further details on critical occupation shortages in the region are provided in chapter 4.
• Previous modelling has indicated that demand for workers in 2012–15 will significantly outstrip supply. Workforce demand in the Shire of Ashburton will be high and will require migration to meet demand.
• The mining sector has the greatest demand for workers. This trend is likely to continue to 2015, underscoring the need for initiatives to attract skilled migrants.
• FIFO arrangements will continue to be prevalent, along with growth of residents through migration. There are social issues associated with the growth in temporary/permanent workforce migrants.
• There are challenges with workers transferring trade related licenses from interstate. Harmonisation of occupational licensing between Western Australia, interstate and overseas labour markets is considered a critical issue for local businesses considering migration alternatives.
Strategic goal 2 Supplement the Western Australian workforce with skilled migrants to fill employment vacancies unable to be filled by the local workforce and address those factors which support a growing population.
30
Pilbara workforce development plan 2013–2016: Executive summary

• There is a worldwide shortage of labour in the mining sector, not purely in Australia. To this extent, migration can supplement domestic mining workforce supply, however it will never replace the need for ongoing local training and workforce development.
• Aboriginal workers are participating as FIFO workers from communities across the Pilbara and elsewhere. This is reflective of the small pool of local work ready Aboriginal labour.
• Lifestyle issues and a lack of preparation for the region in relation to the remoteness, climate and ability to access services are the most common issues for migrants. Language and cultural nuances were also acknowledged as key challenges for some employers.
• Department of Immigration and Citizenship does have regional migration agents that travel to the Pilbara, but local businesses have suggested there is some confusion regarding how and when to access them.
Attraction and retention
Stakeholders identified key issues that are likely to influence the Pilbara workforce in relation to strategic goal 3:
• Relatively low economic diversification in the Pilbara has resulted in the under-representation of service and other non-resources sector businesses. Reasons for this include high cost pressures on non-resources sector businesses to attract and retain staff.
• Large FIFO populations have, anecdotally, been noted as having a negative impact on community cohesion and on the appeal of residence in Pilbara towns. This is a critical issue for local planning.
• Service industry employment is relatively concentrated in the Shire of Roebourne and Town of Port Hedland. This is in line with the Pilbara Cities vision and provides a base for industry growth and diversity in these areas.
• Pilbara residents are highly mobile creating challenges for workforce retention. Investments in community infrastructure and programs will be needed to improve the amenity, community cohesion and services that will help develop a sense of community.
• Key infrastructure and service shortages include investment in road maintenance and improvement; public transport options; housing; broadband and mobile service coverage; health and education service delivery; urban amenity investments; and child care centres and services. Of these, housing was the most prevalent concern.
• Low competitiveness of salaries that can be offered by local government and sectors other than mining was commonly highlighted as a critical retention issue. Other employers are unable to offer salaries that are as attractive for employees. Young residents in particular have an expectation that they are going to earn substantial incomes in the mining sector and are reluctant to consider opportunities in other sectors.
Strategic goal 3 Attract workers with the right skills to the Western Australian workforce and retain them by offering access to rewarding employment and a diverse and vibrant community and environment to live in.
31

• Salary competition has led to workers (particularly low skilled) quickly gaining an expectation that they are worth very high wages which the sectors can not match.
• Housing affordability along with the availability of land and housing was consistently nominated as the greatest challenge for workforce attraction and retention. To employ local workers, employers rely heavily on the worker’s spouse having accommodation provided. For example, a resource sector or government worker that already has accommodation provided as a part of their employment conditions.
• While all major towns are experiencing a constraint on housing, Ashburton in particular suffers from a land constraint for housing and commercial premises. Because of the high cost of land and high cost of building, start up costs for new businesses are very high and this creates additional risk for investors.
• Small businesses cannot afford the investment necessary to attract employees from Perth and instead rely on the local labour market for their employees. The inability to attract workers prevents small business growth.
• Attracting professionals to the region to work in local government is very challenging. • The development of service worker accommodation in Karratha has been welcomed by
representatives of the not for profit and key services sectors. Simultaneously however, some stakeholders have advocated the need for the model to transition toward a not for profit housing model rather than the establishment of a third tier of government housing in the region.
Throughout stakeholder consultation, a variety of critical retention issues were nominated as leading to workers leaving the Pilbara. These included:• the quality of local education for children and young people; • ageing parents/family commitments;• better lifestyle options elsewhere;• residents having a 2–3 year plan to work regionally, build experience and savings and only
staying for this length of time;• a lack of personal support services and general community facilities;• a lack of retail options and child care services;• a lack of health services;• parental concern regarding the distance to hospital services; and• inability to access suitable/affordable housing alternatives.
Many of these are common retention issues for regional communities, not unique to the Pilbara. However, where continual improvement in these areas can be delivered in line with the Pilbara Cities vision, this will contribute toward workforce retention in the region.
32
Pilbara workforce development plan 2013–2016: Executive summary

Skills development and utilisation
Stakeholders identified key issues that are likely to influence the Pilbara workforce in relation to strategic goal 4:
• The Pilbara population typically has lower education participation, retention and achievement outcomes when compared to the State average. This is particularly the case for the region’s Aboriginal population.
• The majority of apprentices in training are male, further exacerbating existing gender imbalances in the workforce.
• Industry partnerships play a critical role in providing training and employment pathways for Pilbara residents. Contributions include financial, facility, work placement and human resource contributions to assist in developing a potential pipeline for their workforce needs.
• The size and distribution of Pilbara towns and their remoteness creates unique challenges. These include challenges to teacher retention, student and teacher transport, and class size requirements and ratios. Investment in broadband infrastructure to support e-learning initiatives and in accommodation and transport to encourage participation will need to be considered as a component of workforce planning.
• Trends for youth and young adults to leave the region for education detract from the labour force pipeline and from the capacity of the workforce to retain working parents.
• A significant proportion of tertiary students currently study via external studies. The remainder of students at the Pilbara Institute are typically engaged in part time or full time employment. In contrast to the typical trend in metropolitan areas, there are very few school leavers studying full time at the institute. Pilbara school leavers instead typically leave the region to pursue a university qualification, obtain an apprenticeship while working or transition straight into full time employment. There is currently no culture of full time learning in the region.
• There is a need to lower student–teacher ratios in Pilbara schools, particularly because Aboriginal children often need greater attention and varied teaching mediums.
• A wide variety of education and training products were perceived to be under supplied across the region. Examples included cross-cultural awareness and competency training; leadership, governance and management training for government/public servants in the Pilbara; hospitality courses; child care courses; and first aid training.
• Training courses were identified as a valued opportunity for members of the ‘partner workforce’ in the region to connect with other members of the Pilbara community and develop their own skills. Nevertheless, feedback was received that available training options for desired courses are limited.
Strategic goal 4 Provide flexible, responsive and innovative education and training which enables people to develop and utilise the skills necessary for them to realise their potential and contribute to Western Australia’s prosperity.
33

• There was a perception that schools have a limited perspective on employment and training pathways for students and that schools have a high staff turnover, limiting continuity in programs that support students in their education pathways beyond school.
• The current apprentice minimum wage is perceived as insufficient to support an individual to live and train in the Pilbara.
• The Pilbara Institute indicated that wage competition with the resources sector is a particular challenge to the retention of trainers for electrical trade and other resource related course trainers.
Planning and coordination
Stakeholders identified key issues that are likely to influence the planning and coordination of Pilbara workforce in relation to strategic goal 5:
• A lack of ownership of responsibility between local, State and Australian Government over key workforce development issues, which is complicated by the sheer breadth of issues relevant for consideration, will be partly addressed by the Pilbara workforce development plan 2013–2016.
• There is a need for a clear delineation of funding responsibility for key strategies. A particular concern was raised that royalties from oil and gas are Federal, while royalties from mining are State level.
• There was a perception of governance overlap between the Pilbara Development Commission, the Pilbara Regional Council, Regional Development Australia – Pilbara, Pilbara Cities and other State agencies working in the region.
Strategic goal 5 Plan and coordinate a strategic State Government response to workforce development issues in Western Australia.
34
Pilbara workforce development plan 2013–2016: Executive summary

Strategies for workforce development
In order to address the workforce challenges and opportunities identified in chapter 5, a series of priority actions have been workshopped with the Pilbara Workforce Development Alliance. These have drawn on inputs from local and State level stakeholder consultations and have been refined through the input of the alliance and nominated lead agencies to ensure both relevance and practicality of action implementation.
The overall timeframe for implementation of priority actions is over a three year period to 2016. The alliance has recommended a lead agency to drive the implementation of each action. The Department of Training and Workforce Development has consulted with various State government agencies identified as lead agencies, on the nature of the strategy and its capacity for ready implementation.
In addition to the nomination of the lead agency, it is recommended that the alliance continue to oversee the implementation of actions and act as the custodians of the strategy. It will be critical that local buy-in continues to be maintained through the alliance.
The alliance will also regularly review the Pilbara workforce development plan 2013–2016 along with other initiatives, which will inform Skilling WA, thereby providing the bottom-up feedback to the statewide planning framework.
The summary priority actions are provided overleaf. (For details of each action refer to chapter 6 of the full plan.)
35

Summary of actions – Increasing workforce participation
Action ID
Recommended priority actions Skilling WA –
strategic goal(s)
1.1 The Department of Aboriginal Affairs, in partnership with the Department of Finance to revise and oversee procurement processes to allow State Government entities to directly contract for the provision of goods and services with Aboriginal businesses for contracts up to $150 000.
1.3
Lead agencies: Department of Aboriginal Affairs and Department of Finance
1.2 The Department of Training and Workforce Development and the Department of Aboriginal Affairs, together with the Small Business Development Corporation and the Chamber of Commerce and Industry Western Australia to jointly promote the recently established Aboriginal Business Directory WA, through ProjectConnect.
1.2
Lead agencies: Department of Training and Workforce Development and Department of Aboriginal Affairs
1.3 The Department of Training and Workforce Development to provide a central information resource promoting available programs in support of Aboriginal workforce development in the Pilbara.
1.2 and 1.3
Lead agency: Department of Training and Workforce Development
1.4 The Pilbara Institute to determine the need for Aboriginal supervisory skills training courses and where appropriate develop a response.
1.2
Lead agency: Pilbara Institute
1.5 The Department of Transport to evaluate driver’s licence application processes, with consideration given to the various challenges faced by Aboriginal people seeking to obtain a licence.
1.3
Lead agency: Department of Transport
1.6 The Department of Regional Development to work with the Department of Transport and Department of the Attorney General to develop a joint approach to tackling the issues facing Aboriginal people in remote communities with respect to driver’s licences.
1.3
Lead agency: Department of Regional Development
1.7 The Department of Housing to consider investigating an increased provision of residential boarding facilities with 24 hour wrap around support services for Aboriginal apprentices and trainees.
1.3
Lead agency: Department of Housing
36
Pilbara workforce development plan 2013–2016: Executive summary

Action ID
Recommended priority actions Skilling WA –
strategic goal(s)
1.8 The Department of Training and Workforce Development to review existing Aboriginal pre-employment pathways, with a view to improving access and outcomes.
1.3
Lead agency: Department of Training and Workforce Development
1.9 The Department of Training and Workforce Development to develop a support package in the form of a web portal to support small to medium enterprises with the engagement, attraction and retention of employees (including female, Aboriginal and mature-aged workers).
1.1 and 1.2
Lead agency: Department of Training and Workforce Development
1.10 The Pilbara Development Commission to advocate for and work with the Pilbara Industry’s Community Council to develop and seek agreement on a joint policy position, whereby annual health check certificates are transferable between companies and sites.
1.3
Lead agency: Pilbara Development Commission
1.11 Department of Education, Employment and Workplace Relations to coordinate and support a transition to a new service model for employment, training and economic participation in the Pilbara’s remote Aboriginal communities.
1.3
Lead agency: Department of Education, Employment and Workplace Relations
1.12 The Pilbara Workforce Development Alliance to support the development of remote workforce development plans and community action plans under the Remote Jobs and Communities Program.
1.3
Lead agency: Pilbara Workforce Development Alliance
1.13 Karratha and Port Hedland local governments to review their local infrastructure, amenity and program offering and strategies to help employers attract and retain mature-aged workers.
1.2
Lead agencies: Town of Port Hedland and Shire of Roebourne
1.14 The Karratha Small Business Centre, in conjunction with the Pilbara Development Commission and key stakeholders to progress planning and funding applications for the establishment of a small business incubator.
1.2
Lead agency: Karratha Small Business Centre
37

Action ID
Recommended priority actions Skilling WA –
strategic goal(s)
1.15 The Department of Education and the Department of Training and Workforce Development, in collaboration with industry and service providers, to explore opportunities to enhance in-school career guidance and support for school to work transition, particularly for remote communities and females seeking a structured employment and training pathway after leaving school.
1.2
Lead agencies: Department of Education and Department of Training and Workforce Development
1.16 The Pilbara Development Commission to facilitate industry and government collaboration to increase the number of available child care places.
1.3
Lead agency: Pilbara Development Commission
Summary of actions – Skilled migration
Action ID
Recommended priority actions Skilling WA –
strategic goal(s)
2.1 The Department of Commerce to review its dissemination of, and access to, information for small and medium sized enterprises regarding the process for interstate migrants to obtain relevant licenses and trade certificates.
2.1
Lead agency: Department of Commerce
2.2 The Department of Training and Workforce Development to work with the Office of Multicultural Interests to investigate the development of support materials and information to assist overseas migrants to settle in regional Western Australia.
2.1
Lead agency: Department of Training and Workforce Development
38
Pilbara workforce development plan 2013–2016: Executive summary

39

Summary of actions – Workforce attraction and retention
Action ID
Recommended priority actions Skilling WA –
strategic goal(s)
3.1 The Department of Housing and LandCorp to continue to drive initiatives that improve access to a variety of housing types, while improving affordability.
3.2
Lead agencies: Department of Housing and LandCorp
3.2 Pilbara Workforce Development Alliance to advocate for and support the expansion of affordable accommodation for key service workers, including the employees of non-government organisations.
3.2
Lead agency: Pilbara Workforce Development Alliance
3.3 Resources sector companies to continue to invest in local housing infrastructure as one component of a strategy to mitigate their cumulative social and economic impact on Pilbara communities.
3.2
Lead agencies: Pilbara Workforce Development Alliance and Local Government Authorities
3.4 The Pilbara Development Commission, in partnership with the Pilbara Industry’s Community Council to collate and promote case studies of best practice employer incentives to support and reward workers who choose to live in the Pilbara region.
3.1 and 3.2
Lead agency: Pilbara Development Commission
3.5 The Pilbara Workforce Development Alliance to advocate for the Department of Treasury to make further representations to the Commonwealth concerning regional taxation rebates.
3.1
Lead agency: Pilbara Workforce Development Alliance
3.6 The Pilbara Development Commission to advocate for the priority roll out of National Broadband Network (NBN) infrastructure to the Pilbara, including the prioritisation of Port Hedland in the current three year NBN plan.
3.2
Lead agency: Pilbara Development Commission
3.7 Pilbara Development Commission to play an active role in marketing the benefits of employment and residence in the Pilbara to interstate labour markets.
3.1
Lead agency: Pilbara Development Commission
3.8 The Department of Commerce to continue to participate in the development of the National Occupational Licensing System.
3.1
Lead agency: Department of Commerce
40
Pilbara workforce development plan 2013–2016: Executive summary

Summary of actions – Education and training
Action ID
Recommended priority actions Skilling WA –
strategic goal(s)
4.1 The Pilbara Development Commission to support the establishment of an ‘education alliance’ as recommended in the Pilbara Education Study.
4.3
Lead agency: Pilbara Development Commission
4.2 The Pilbara Workforce Development Alliance to explore the opportunity of the Pilbara Industry Community Council working with the Department of Education to identify and negotiate a consistent role for industry in education across the region.
4.3
Lead agency: Pilbara Workforce Development Alliance
4.3 Pilbara Institute to review the demand for vocational training across the Pilbara and ensure that the current scope of courses meets this demand.
4.3
Lead agency: Pilbara Institute
4.4 The Pilbara Development Commission to consult with the Department of Industry, Innovation, Climate, Science, Research and Tertiary Education to identify opportunities and barriers for the delivery of Workplace English Language and Literacy programs in Pilbara towns.
4.2
Lead agency: Pilbara Development Commission
4.5 The Department of Industry, Innovation, Climate, Science, Research and Tertiary Education to evaluate funding opportunities for expansion of apprentice case management and mentoring in the Pilbara. The Department of Training and Workforce Development to be involved on a consultative basis.
4.1
Lead agency: Department of Industry, Innovation, Climate, Science, Research and Tertiary Education
4.6 The Department of Industry, Innovation, Climate, Science, Research and Tertiary Education to consider the feasibility of a regional weighting for apprentice wages in the Pilbara.
4.1
Lead agency: Department of Industry, Innovation, Climate, Science, Research and Tertiary Education
4.7 The Pilbara Development Commission to guide the strategic workforce infrastructure priorities highlighted in the Pilbara Education Study through cabinet process.
4.3
Lead agency: Pilbara Development Commission
41

Action ID
Recommended priority actions Skilling WA –
strategic goal(s)
4.8 The Pilbara Development Commission to continue to support the UWA feasibility study on the establishment of a physical presence in the Pilbara. Where appropriate, the alliance to advocate for Federal endorsement of tertiary education investment in a physical presence in the Pilbara.
4.3
Lead agency: Pilbara Development Commission
4.9 Pilbara Institute to evaluate the feasibility of providing on site accommodation for students and trainers who are visiting the campus.
4.1 and 4.2
Lead agencies: Pilbara Institute and Department of Housing
4.10 The Pilbara Education Alliance to develop and implement an information strategy for the education, training and career pathways available in the Pilbara.
4.1
Lead agency: Pilbara Development Commission/Pilbara Education Alliance
42
Pilbara workforce development plan 2013–2016: Executive summary

Summary of actions – Planning and coordination
Action ID
Recommended priority actions Skilling WA –
strategic goal(s)
5.1 The Government will establish a ministerially endorsed and mandated governance arrangement to strengthen the integration and alignment of statutory land use planning, regional development and local government service delivery within existing legislative planning frameworks for the Pilbara region.
5.2
Lead agencies: Department of Regional Development and Department of Lands
5.2 Government agencies to consider the relocation of senior personnel to the region to expedite policy implementation and improve service delivery.
5.2
Lead agency: Department of Premier and Cabinet
5.3 The Department of Regional Development and its network of Community Resource Centres to establish an online ‘Pilbara portal’ for residents and businesses seeking information on government services available in the Pilbara.
5.1
Lead agency: Department of Regional Development
5.4 The Pilbara Regional Council to establish a coordinated approach to local government knowledge management in the Pilbara.
5.1
Lead agency: Pilbara Regional Council
43

References
Australian Bureau of Statistics 2010, Cat. 8165.0, Counts of Australian Businesses including Entries and Exits, released June 2010.
Australian Bureau of Statistics 2010a, National Regional Profile – Pilbara (Statistical Division), ‘Total dwelling units’.
Australian Bureau of Statistics 2010b, National Regional Profile – Pilbara (Statistical Division), ‘Economy – Estimates of personal income’.
Australian Bureau of Statistics 2010c, National Regional Profile – Pilbara (Statistical Division), ‘Estimated resident population by age and sex – at 30 June’.
Australian Bureau of Statistics 2011, Cat. 3235.0, Population by Age and Sex, Regions of Australia, accessed November 2012, http://www.abs.gov.au/AUSSTATS/[email protected]/DetailsPage/3235.02011?OpenDocument
Australian Bureau of Statistics 2011, Population Census – Basic Community Profile, accessed November 2012, http://www.censusdata.abs.gov.au/census_services/getproduct/census/2011/communityprofile/50806?opendocument&navpos=230
Australian Bureau of Statistics 2011a, Population Census – Expanded Community Profile, accessed November 2012, http://www.censusdata.abs.gov.au/census_services/getproduct/census/2011/communityprofile/50806?opendocument&navpos=230
Australian Bureau of Statistics 2011b, Population Census – Indigenous Community Profile, accessed November 2012, http://www.censusdata.abs.gov.au/census_services/getproduct/census/2011/communityprofile/50806?opendocument&navpos=230
Australian Bureau of Statistics 2011c, Population Census (based on place of usual residence), Table builder accessed November 2012, http://www.abs.gov.au/websitedbs/censushome.nsf/home/tablebuilder?opendocument&navpos=240
Australian Bureau of Statistics 2011d, Population Census (based on place of enumeration), Time Series Profile accessed November 2012, http://www.censusdata.abs.gov.au/census_services/getproduct/census/2011/communityprofile/50806?opendocument&navpos=230
Australian Bureau of Statistics 2011e, Population Census, accessed November 2012, http://www.abs.gov.au/websitedbs/censushome.nsf/home/tablebuilder?opendocument&navpos=240
Australian Bureau of Statistics 2012, Cat 3218.0 Population Estimates by Local Government Area 2001 – 2011, Accessed April 2013 http://www.abs.gov.au/AUSSTATS/[email protected]/DetailsPage/3218.02011?OpenDocument
Chamber of Minerals and Energy of Western Australia 2011, State Growth Outlook, Chamber of Minerals and Energy, Perth, p 45.
Chamber of Minerals and Energy of Western Australia 2012, Pilbara Population and Employment Study, Chamber of Minerals and Energy, Perth, p 15.
Davies, A and Tonts, M 2009, Economic Diversity and Regional Socioeconomic Performance: An Empirical Analysis of the Western Australian Grain Belt, ‘Geographical Research’ vol. 48, 3, pp 223–234.
Department of Education, Employment and Workplace Relations 2010, Survey of Employers’ Recruitment Experiences Pilbara ESA – August 2010 p.6, Department of Education, Employment and Workplace Relations, Canberra.
Department of Education, Employment and Workplace Relations 2011, Small Area Labour Market Data, Department of Education, Employment and Workplace Relations, Canberra.
Department of Education, Employment and Workplace Relations 2011a, Labour force growth Pilbara March 2002–June 2011, Department of Education, Employment and Workplace Relations, Canberra.
44
Pilbara workforce development plan 2013–2016: Executive summary

Department of Training and Workforce Development 2010, Skilling WA – A workforce development plan for Western Australia, Department of Training and Workforce Development, Perth.
Department of Training and Workforce Development September 2011, State Priority Occupation List, Department of Training and Workforce Development, Perth.
Department of Training and Workforce Development 2011, VET Enrolment Data Collection, Department of Training and Workforce Development, Perth.
Department of Training and Workforce Development December 2011, TRS, Department of Training and Workforce Development, Perth.
Department of Regional Development and Lands 2011, Annual Report 2010–11, Government of Western Australia, Perth.
Department of Regional Development and Lands 2011a, Pilbara: a region in profile 2011, pp 1–7, Department of Regional Development and Lands, Perth.
Department of Regional Development and Lands 2011b, Royalties for Regions Snapshot 2010–11, p 7, (also available on http://www.point-ds.com.au/R4R/).
Department of Regional Development and Lands 2012, Pilbara Cities, accessed 8 November 2012, http://www.rdl.wa.gov.au/royalties/r4rpilbara/Pages/default.aspx.
Joblink Enterprises Incorporated 2011, School Business Community Partnership Brokers Environment Scan, (Pilbara Environmental Scan), Joblink Enterprises Incorporated.
Pilbara Development Commission August 2011, Pilbara Education Study, pp 13–18, CCS Strategic for Pilbara Development Commission, North Perth.
Pilbara Development Commission 2011, Pilbara Housing and Land Snapshot, Residential and Commercial (Quarter ending September 2011), Pilbara Development Commission, p 14.
Pilbara Development Commission 2012, Future Development of the Pilbara, Pilbara Development Commission, p 4.
Pilbara Institute 2011, Review of Education Training Needs, Pilbara Institute, Karratha.
Regional Development Australia 2010, Preliminary Pilbara Regional Plan, Regional Development Australia, Canberra.
Shire of East Pilbara 2010, Pilbara Cities: Newman Revitalisation Plan, Shire of East Pilbara, Newman.
Shire of Roebourne 2010, Pilbara Cities: Karratha City of the North Plan, Shire of Roebourne, Karratha.
Taylor, J and Scambary, B 2005, Indigenous People and the Pilbara Mining Boom – A Baseline for Regional Participation, Australian National University – Centre for Aboriginal Economic Policy Research, Research Monograph No.25, Canberra.
Town of Port Hedland March 2012, Draft Pilbara’s Port City Growth Plan, Town of Port Hedland, Port Hedland.
Waller, M 2010, Planning for Resources Growth in the Pilbara: Revised Employment and Population Projections to 2020, Pilbara Industry’s Community Council.
Western Australian Planning Commission November 2008, Newman Regional Hotspots Land Supply Update, Western Australian Planning Commission, Perth, p 5.
Western Australian Planning Commission December 2010, Karratha Regional Hotspots Land Supply Update, Western Australian Planning Commission, Perth, p 3.
Western Australian Planning Commission April 2011, Port Hedland Regional Hotspots Land Supply Update, Western Australian Planning Commission, Perth, p 3.
Western Australian Planning Commission November 2011, Onslow Regional Hotspots Land Supply Update, Western Australian Planning Commission, Perth, p 3.
Western Australian Planning Commission January 2012, Pilbara Planning and Infrastructure Framework, accessed January 2012, http://www.planning.wa.gov.au/publications/6661.asp
45

Appendix A: Consultation list
The table below lists the stakeholders consulted with during the four week consultation phase of the project. The majority of stakeholders were spoken with in a face to face forum (group or individual). A smaller number of consultations were undertaken via teleconference (necessitated by stakeholder availability).
Location Stakeholder – representative
Hedland Port Hedland Port Authority – Damian MylesStrelley Warralong Community School – Kate McKenziePort Hedland Primary School – Yvonne DenhamPort Hedland Chamber of Commerce and Industry – Michelle ScottIBN Corporation – Adriana MaraFAHCSIA ICC – Ingrid PaigeSmall Business Centre East Pilbara – Morag HoweRichard WhitnellWarraka Maya Health – Steven Magwenzi and Pascall BurtonPilbara Indigenous Womens Association – Leslie WoodsIndigenous Mining Services – Kara HawkePilbara Association of Non Government Organisations – Bob Neville
Newman Shire of East Pilbara – David KumarNewman Chamber of Commerce and Industry – Barbara O’DriscollNewman Hospital – Sharon BoggettiNewman Senior High School – Milanna Heberle
Tom Price Shire of Ashburton – Kerry White, Frank Ludovico and Lisa HannaganAshburton Aboriginal Corporation – Janet Brown and Sherylann HorobinTom Price Senior High School – Trevor Henderson and Nicki KellyAustralian Minerals Council – Prue Jenkins
Onslow Shire of Ashburton – Amanda O’HalloranDiscovery Parks (Beadon Bay) – Bob Heron and Glennis HeronOnslow General Store – John StuartAshburton Resort Motel – Scott Dagan and Nikki DaganOnslow Community Resource Centre – Lynnette Godfrey
46
Pilbara workforce development plan 2013–2016: Executive summary

Location Stakeholder – representative
Perth Small Business Development Corporation – Mark SouthEducation and Training International – Jodie WallacePilbara Regional Council – Shelley PikeSMYL Community Services – Tanya TurnerFortescue Metals Group – Ford Murray and Scott DassiraChevron – Kaye ButlerDepartment of Education, Employment and Workplace Relations – Shaynie Partridge, Jeff Dzodz and Annette NewmanDepartment of Aboriginal Affairs – Peter DonovanDepartment of Housing – Jacqui HerringDepartment of Planning – Philip WoodwardPilbara Industry Community Council – Warren PearceChamber of Minerals and Energy – Nicole RoockeResource Industry Training Council – Nigel HaywoodAustralian Petroleum Production and Exploration Association – Roma SharpFutureNow (Creative and Leisure Industries Training Council Inc) – Mal GammonPindan College – Nancy ReesRio Tinto – Adam Sydney-Smith and Paul TurringtonConstruction Training Council – Elaine McGrathEngineering and Automotive Training Council – Dave HicksElectrical, Utilities and Public Administration Training Council – David LoveRetail and Personal Services Training Council – Norma Roberts and Jane PierceyCommunity Services, Health and Education Training Council – Ian AndrewsFood, Fibre and Timber Industries Training Council – Diane SmithFinancial, Administrative and Professional Services Training Council – Allan Jones and Helen McNeillLogistics Training Council – Jillian Dielesen and Norma Nisbet
Roebourne Ngarliyarndu Bindirri Aboriginal Corporation – Susan ShirtliffYaandina Family Centre – Veronicca RodenburgRoebourne Hospital – Samantha ElrickRoebourne District High School – Ray McMillan
Karratha The Smith Family – Daphne TrevurzaShire of Roebourne – John Verbeek and Nancy WanePilbara Institute – Lyn FarrellDepartment of Education (Pilbara District Education Office) – Sharon McCawleyKarratha District Chamber of Commerce and Industry – John LalleyDepartment of Regional Development and Lands (Pilbara Cities Office) – Chris Adams and Lisa TaylorRegional Development Australia Pilbara – Diane PentzPilbara Development Commission – Stephen WebsterSmall Business Centre Karratha – Rachel Whiting
47

For further information or to provide comment on the plan, please contact:
State Workforce Planning Department of Training and Workforce Development T: +61 8 6551 5000 Email: [email protected]