pilbara institute annual report 2012
TRANSCRIPT

Pilbara Institute Annual Report 2012

Contents
Overview of Agency
Governing Council Chairperson’s Report 4
Managing Director’s Report 5
Organisational Structure 7
Performance Management Framework
Achievements in line with Government Goals 8
Agency Performance
Other Achievements During the Year 9
Significant Issues Impacting the Agency 14
Ministerial Directives 14
Pricing Policies on Services 14
Governance Disclosures
Enabling Legislation 14
Staffing Profile 15
Other Legal Requirements
Advertising 16
Disability Access and Inclusion Plan Outcomes 17
Compliance with Public Sector Standards and Ethical Codes
Human Resource Management Standards 18
Codes of Ethics and Codes of Conduct 19
Record Keeping Plans 19
Government Policy Requirements
Substantive Equity 20
Occupational Safety, Health and Injury Management 20

Financial Disclosures
Independent Auditor’s Opinion 24
Financial Statements 27
Annual Estimates Disclosure 73
Section 40s 74
Key Performance Indicators 79

Pilbara Institute’s Annual Report 2012 Overview of Agency
Governing Council Chairperson’s Report During 2012, Pilbara Institute’s Governing Council worked hard behind the scenes to ensure the organisation achieved a position of strength and maximised opportunities for growth in both the public and private sector.
To further this agenda, GC members visited most campuses in the region, including Newman, Pundulmurra, South Hedland, Karratha and Minurmarghali Mia to engage with staff at the local level and meet key stakeholders. As a result of this focus, the Institute published a Stakeholder Engagement Framework and Action Plan which identifies major clients and proposed comprehensive strategies to drive business and create training opportunities.
In 2011, the Governing Council acknowledged the issue of ageing infrastructure across the organisation. I am pleased to report that one year later, Pilbara Institute has written a dedicated Strategic Infrastructure Plan which maps out a clear vision for the future in terms of facilities, training demand and delivery. Using this document as a blueprint, the organisation will be well placed to meet the vision of Pilbara Cities as well as the opportunities inspired by Royalties for Regions.
In addition to overseeing the development of these fundamental frameworks for operation, the Council continues to engage in energetic discussion with industry and community stakeholders. One of the major highlights in 2012 was the culmination of the Woodside Project, which sets a standard for future partnerships with industry, not only in terms of upgrading training equipment but also in terms of raising the Institute’s profile in the region.
I would like to thank my fellow members for their contribution during the year, as well as Pilbara Institute staff and the Corporate Executive for their ongoing dedication to providing quality training and workforce development to the Pilbara region and its thriving communities.
Nicole Roocke
Chairperson Pilbara Institute
4

Pilbara Institute’s Annual Report 2012 Managing Director’s Report This has been a year of consolidation for Pilbara Institute. After a significant re-positioning in the marketplace in 2011, the organisation has forged a new direction in 2012 with a greater emphasis on strategic partnerships as well as commercial growth.
I am especially pleased to report on the success of our collaboration with Woodside Energy which has established a blueprint for future partnerships. This public/private alliance has facilitated the refurbishment of the Mechanical Fitting workshop in Karratha, and sets a benchmark for industry-standard training by allowing apprentices from all over the Pilbara to learn their trade on the latest machines, using cutting edge technology. Furthermore, to enhance the training experience, representatives from industry have attended the campus on a regular basis to share their workplace knowledge with lecturers and boost the currency of training content. Both these arrangements have been lauded as a model of best practice for the sector.
Pilbara Institute has also received positive feedback from many other industry partners, including Newcrest and Bloodwood Tree, Chevron and FMG, about individual staff as well as different programs that have been delivered. In particular the Hospitality program with Newcrest, Bloodwood Tree and the Ashburton Aboriginal Corporation has been successful in providing local Aboriginal people with vital skills for mine-site work in Housekeeping and Kitchen Operations.
In terms of student achievement, the Institute has been well represented at the WA Training Awards and the World Skills in the areas of Metal Fabrication, Warehousing & Logistics, Mechanical Fitting and Business, which is testament to our students’ commitment to excellence as well as the quality of our teaching staff. We look forward to showcasing more talent in 2013 at both the State and national level.
The organisation has also achieved in other key areas. Our Governing Council has been instrumental in overseeing the Strategic Infrastructure Plan for the Institute, which outlines a vision for future growth. In tandem with our business plan, this vision not only sets clear goals for performance but provides scope for capacity building and development over the next five years.
While 2012 provided some opportunities for expanding our business, the Institute’s plans were sidelined by the contracting of the resources market, which saw commodities prices fall sharply in the latter half of the year. As a result of this contraction, many of our key clients were forced to cancel their Work Ready programs, one of our main sources of revenue. Despite this downturn, we have received commitments for programs in 2013 and we look
5

Pilbara Institute’s Annual Report 2012 forward to building on these business opportunities and consolidating our position as the training provider of choice in the region.
On behalf of the Executive team, I would like to thank all Pilbara Institute staff for their excellent efforts during the year, especially in terms of team work and commitment to client service. Thanks to their ongoing commitment, Pilbara Institute is able to provide people with skills, opportunities and pathways into further education; outcomes which not only enhance individual lives but benefit whole communities.
I look forward to reporting on our achievements next year.
Lyn Farrell
Managing Director
6

Pilbara Institute’s Annual Report 2012 Organisational Structure
Minister for Training & Workforce Development; Corrective Services
The Hon. Murray Cowper MLA
Pilbara Institute’s Governing Council Chairperson
Nicole Roocke
Pilbara Institute’s Managing Director
Lyn Farrell
Director
Organisational Effectiveness
Colin Crocker
Director
Training & Innovation
Alison Traine
Director
Corporate Services
Craig Holland
Aboriginal Support &
Development
Marketing & Comms
Library & Records
Business Systems
Community & Industry
Skills
Health & Community
Services
Trades
Commerce
Planning & Facilities
Human Resources
Finance & Contract Services
Information Technology
Director
Business Development
Shaun Burgess
Commercial Activity: Pilbara
Skills Centres
Karratha Onslow
South Hedland Newman
Tom Price
7

Pilbara Institute’s Annual Report 2012 Performance Management Framework
State Building – Major Projects Building strategic infrastructure that will create jobs and underpin WA’s long-term economic
development
During 2012, works to Pilbara Institute’s Pundulmurra Campus progressed as part of the
Pundulmurra Education Infrastructure Fund project. This included the construction of new
workshops, significant upgrades to outdoor training areas, classroom upgrades and the
construction of a horticultural area.
Additionally, Pilbara Institute was awarded $15.54M as part of the Royalties for Regions
Maintenance and Capital Expenditure Program. This four-year program focuses on several
projects such as upgrading facilities in Karratha, Pundulmurra and South Hedland
Campuses.
Financial and Economic Responsibility Responsibly managing the State’s finances through the efficient and effective delivery of
services, encouraging economic activity and reducing regulatory burdens on the private
sector
At the start of 2012, the organisation implemented common user agreements and tenders for
the provision of specific training delivery. This not only strengthened the organisation’s
compliance within the WA State Government’s purchasing guidelines but ensured greater
efficiency in administering and delivering contracts.
Throughout the year the Institute implemented a number of initiatives to meet efficiency
targets provided by the Department of Treasury including reduced travel expenditure and a
more streamlined staffing structure.
Outcomes-Based Service Delivery Greater focus on achieving results in key service delivery areas for the benefit of all Western
Australians
8

Pilbara Institute’s Annual Report 2012 Pilbara Institute maintained and strengthened partnerships with key stakeholders including
schools, public and private Registered Training Providers, Universities, Aboriginal
Organisations, industry, community groups and Government agencies
Stronger Focus on the Regions Greater focus on service delivery, infrastructure investment and economic development to
improve the overall quality of life in remote and regional areas
In 2012 the organisation developed the Strategic Infrastructure Plan, which takes into
account Pilbara Cities’ goals and investment through Royalties for Regions, and proposes
significant infrastructure upgrades to ensure the Institute remains competitive in the long-
term.
Social & Environmental Responsibility Ensuring that economic activity is managed in a socially and environmentally responsible
manner for the long-term benefit of the State
Alongside day-to-day initiatives incorporating cost and power saving measures, Pilbara
Institute developed a Sustainability Plan to raise staff awareness about sustainable business
practices & waste management.
Agency Performance: Achievements During The Year 1. Increased Education and Employment Opportunities for Aboriginal People in the Pilbara Work Ready is a training program developed by Pilbara Institute seven years ago. Since its
inception, it has evolved into an intensive hands-on program delivered in partnership with
major resource companies. The principal objective of Work Ready is to provide Aboriginal
people with relevant and meaningful vocational training, which results in direct employment.
In 2012, Pilbara Institute delivered 17 Work Ready programs in partnership with Woodside,
Fortescue Metals Group, Rio Tinto and BHP Billiton.
9

Pilbara Institute’s Annual Report 2012 Other strategies to increase participation training included:
The appointment of two Aboriginal Development Officers at Hedland and Newman
campuses. The major focus of the ADO role is to increase retention rates among Aboriginal
students by facilitating communication and providing advice on culturally appropriate training.
The development and implementation of the 2012 Aboriginal Training Plan in consultation
with Aboriginal communities in the Pilbara. Outcomes included the delivery of the Certificate
II in Construction program at the Warralong Community, where participants refurbished and
upgraded community buildings, as well as a GATE program in partnership with the Ashburton
Aboriginal Corporation
Another successful partnership with Ashburton Aboriginal Corporation was the delivery of a
Certificate I in Gaining Access to Training & Education (GATE) program that concentrated on
the retail services industry. As part of the course, nineteen participants undertook work
experience at Coles, Woolworths and K Mart and more than 60% of the graduates obtained
full time work upon completion of their training.
In addition to these initiatives, other examples included:
• In partnership with Bloodwood Tree, the development of a Community Services
program, focusing on Aged Care and Youth Work.
• The delivery of Certificate II in Horticulture at Warralong which not only increased food
producing capacity in the community but promoted sustainable gardening practices.
2. Leading eLearning Opportunities in the Pilbara Pilbara Institute sought to increase its eLearning capacity in 2012. Steps included:
• The promotion of tools such as Moodle and GoToMeeting
• The development of course content in several programs which incorporated web-
conferencing, digital tablets, video content and QR codes
• Continued exploration of point-of-view camera glasses and 3G streaming for real-time
engagement between teachers, and learners at remote locations
10

Pilbara Institute’s Annual Report 2012
• The development of video assessment as an alternative for gathering evidence for
learners with literacy challenges
3. Continued Responsiveness to Resource Industry Training Needs through Collaboration and Partnerships
In terms of collaboration with industry, the greatest achievement in 2012 was the culmination
of the Woodside project, which delivered hundreds of thousands of dollars in new equipment
and machinery to the Mechanical Fitting workshop in Karratha. Thanks to this partnership,
training spaces were fitted with metal lathes, metal milling machines, a new bandsaw and
surface grinders, allowing apprentices to practise on machines which use the latest
technology. To enhance the training content, professional tradespeople from Woodside
visited the workshop on a regular basis to provide advice and practical instruction.
In addition to Woodside, Pilbara Institute strengthened its relationships with other major
resource companies, including BHP Billiton, Rio Tinto, Fortescue Metals Group and Chevron.
As part of this strategy, focus groups from different organisations participated in team
meetings to discuss and improve delivery methods and learner engagement.
Other achievements in 2012 included:
• Greater input from industry representatives into practical components of Certificate III
delivery.
• Equipment upgrades for several workshops, including the installation of new fault
boards for Electrical, new welding machines for Fabrication, new gearboxes for Fitting
and Machining and new engine analysis equipment for Automotive.
• The introduction of Fast Track apprenticeship options for mature-age workers to gain
their qualifications.
• Following consultation with industry, a Hand Skills program was developed for
Apprenticeships Australia/BHP apprentices. This course had to be completed prior to
commencement on site. (The program was so successful that it was increased from
six to eight weeks with improved literacy and numeracy support to engage ‘at risk’
learners.)
11

Pilbara Institute’s Annual Report 2012
• The implementation of a fly in/fly out network of lecturers to cover lecturing staff
shortages at different campuses.
• The restructuring of the Trades portfolio to improve its focus on local issues and
stimulate greater engagement between apprentices, employers and industry partners.
Twenty one Certificate III level and above were added to Pilbara Institute’s scope. Ten courses were Certificate IV and above. A further 15 courses were added to the Institute’s scope of Registration in industry areas such as Children’s services, Aged Care, Information Technology, Business and Horticulture.
4. Continued Increase in the Capacity to Deliver Flexible, Reliable and Quality Training and Education
As part of a broader strategy to increase staff capacity and improve the quality and reliability
of training programs, Pilbara Institute implemented a Workforce Development Plan which
focuses on facilitated learning opportunities to encourage and promote professional
development. Among the main activities, staff participated in consultation sessions,
coaching, communities of practice, lesson study, mentoring and coursework.
In addition, the organisation introduced a Senior Leadership Development Program for
Directors and Managers to encourage greater levels of engagement and communication
across the organisation and improve attraction and retention rates among staff.
The Institute also developed the 10-year Strategic Infrastructure Plan incorporating Master
Plans for each campus to meet current and future industry training needs in the region.
5. Provide Training and Education Services to Support Economic Diversification in the Pilbara In order to support economic diversification across the region, Pilbara Institute has planned
for future growth in a comprehensive Strategic Infrastructure Plan, in line with Pilbara Cities’
vision and investment from Royalties for Regions.
12

Pilbara Institute’s Annual Report 2012 Throughout the year, the organisation engaged stakeholders to provide specific training
programs such as in-time skill development and Recognition of Prior Learning for current
projects, particularly in the small business sector.
13

Pilbara Institute’s Annual Report 2012 Significant Issues Impacting the Agency In the second half of 2012, Pilbara Institute experienced a significant downturn in SCH. This
decrease in enrolments was directly attributed to the global commodities crisis, and resulted
in cancellation of several Work Ready programs as major resource companies were forced to
contain expenditure.
On a positive note, the increase in District Allowance to public sector employees attracted a
higher calibre of applicants for job roles at the agency. It also increased the organisation’s
capacity to retain productive employees, rather than lose them to higher paying roles in the
resource sector.
Ministerial Directives Treasurer’s Instruction 903 (12) required the agency to disclose details of any ministerial
directives relevant to the setting of desired outcomes or operational objectives, the
achievement of desired outcomes or operational objectives, investment activities and
financial activities.
No such directives were issued by the Minister during 2012.
Pricing Policies on Services As a statutory authority and publicly funded provider of Vocational Education and Training,
Pilbara Institute follows policy guidelines contained in the Fees and Charges Policy
Guidelines for Publicly Funded Registered Training Organisations and Programs, published
by the Western Australian Department of Training and Workforce Development. Resource
Fees are set by the College to cover materials to be used by students in the course of
instruction. Fee for Services courses are priced on a commercial basis.
Governance Disclosures Enabling Legislation Pilbara TAFE was established on the 1st of January 2003 as a result of the amalgamation of
Eastern Pilbara College of TAFE and West Pilbara College of TAFE. In September 2011 the
14

Pilbara Institute’s Annual Report 2012 Institute was renamed Pilbara Institute. The organisation operates under the Vocational
Education and Training Act 1996.
At the date of reporting, other than normal contracts of employment of service, no Board
Members or Senior Officers, or firms of which Members or Senior Officers are members, or
entities in which Members or Senior Officers have substantial interests, had any interests in
existing or proposes contracts with Pilbara Institute and Members of Senior Officers.
Staffing Profile 2009 %
Total FTE
2010 % Total FTE
2011 % Total FTE
2012 % Total FTE
FTE for year *211.3 *184.9 182.65 196 Academic Delivery
85.92 40.7% 85.2 46.1% 84.9 45% 91 46.42%
Academic Support Services/ Corporate Services
125.38 59.3% 98.7 53.4% 101.7 55% 106 54.08%
Unattached/ Redeployees**
1 0.5% 0 0 0 0
Sourced from Pilbara Institute’s Electronic Information Management System and Empower HRMIS. * Includes unattached and registered re-deployee employees. ** Unattached/Redeployees unable to be reported on separately. NB: Information provided as at December 2012. FTE figures can vary across the year by +/- 10% due to training demand fluctuations
15

Pilbara Institute’s Annual Report 2012 Other Legal Requirements Advertising Electoral Act 1907 Section 175ZE
In accordance with the requirements of section 175ZE of the Electoral Act 1907 the following
expenditures were incurred by the College (or on behalf of the College) in advertising, market
research, polling, direct mail and media advertising. Total expenditure for 2011/2012 was $
$75,713.05. Expenditure was broken down as follows:
Total Expenditure Amounts paid
Advertising agencies $40,711.62 Media Decisions OMD
Staff advertising (Recruitmen $35,001.43 Adcorp
Direct Mail organisations nil nil
Market Research Organisatio nil nil
Polling Organisations nil nil
16

Pilbara Institute’s Annual Report 2012 Disability Access and Inclusion Plan Outcomes Disability Services Act 1993, S29
With reference to Pilbara Institute’s Disability Access and Inclusion Plan, the number of strategies that were planned, completed or partially completed included:
Number of
planned strategies
Number of strategies completed
Number of strategies partially completed
Number of contractors undertaking DAIP activity
Outcome One
Outcome Two
Outcome Three
Outcome Four
Outcome Five
Outcome Six
6
8
4
4
3
4
5
7
3
3
3
4
0
0
0
0
0
0
0
0
0
0
0
0
17

Pilbara Institute’s Annual Report 2012 Compliance with Public Sector Standards and Ethical Codes Public Sector Management Act 1994, S31 (1)
Human Resource Management Standards During 2012 several initiatives were implemented. These included:
• The Pilbara Institute Workforce & Diversity Plan 2012-2016
• The re-introduction of Accountability and Ethical Decision Making training. Further online
training modifications are currently in development
• The improved version of Online Induction training with better tracking of participant
completions and improved modifications for tracking purposes
• A renewed version of Pilbara Institute’s Code of Conduct incorporating current examples
• A comprehensive review of the Disability Access & Inclusion Plan
• Staff participation in the Public Sector Commission’s Employee Perspective Survey
• The Pilbara Institute Leadership program for senior management
Breach claims against the Public Sector Standards in Human Resource Management lodged
under the Public Sector Management (Breaches of Public Sector Standards) Procedures
2005 at Pilbara Institute during 2012 were: Standard Outcome Actions(s) Disciplinary Issues
Raised 2011 4
Reprimand &/or
Warning 2
18

Pilbara Institute’s Annual Report 2012 Codes of Ethics and Codes of Conduct (Ethical Codes)
Equal Opportunity Management Plan Outcomes 2012
Indicator 2011 Target 2011 Outcome 2012 Target 2012 Outcome
Women represented in
management Tiers 2 & 3
60% 50% 60% 42.5%
Employees from
culturally-diverse backgrounds
5% 11.8% 5% 14%
Aboriginal Australia employees 10% 7.6% 10% 8%
Employees who identify
as people with disabilities
5% 2.5% 5% 4%
Employees who are youth 6% 1.3% 6% 7.5%
Record Keeping Plans Pilbara Institute is a signatory to the sector wide Recordkeeping Plan (RKP) which was
approved by the State Records Commission on the 7 December, 2012. As part of the
organisation’s ongoing commitment to Record Keeping, a review of the RKP will be
completed and submitted to the State Records Office by 7 December, 2017. This RKP
complies with s19 of the State Records Act 2000.
Pilbara Institute had anticipated migrating from its current records management system to
TRIM in line with the rest of the Publicly Funded Training Providers and the Department of
Training and Workforce Development (DTWD) under a shared arrangement. However, the
sharing option was withdrawn. Pilbara Institute was unable to obtain an exemption from
going to tender and is now in the process of working through the Request for Quote
procedure. It is anticipated that the Institute will implement a new records management
system in 2013.
19

Pilbara Institute’s Annual Report 2012 The Institute initiated an evaluation of the efficiency and effectiveness of the current
recordkeeping system in Karratha, South Hedland and Pundulmurra Campuses. This
evaluation will extend to the whole of the organisation over the next twelve months.
In 2012, a new one-on-one training schedule for all new managers and directors was
introduced, focusing on records awareness and compliance.
Government Policy Requirements Substantive Equity The Equity and Diversity Plan for 2011 – 2014 is the Institute’s commitment to providing a
workplace free from unfair practices and all forms of harassment. This plan evolved into the
Workforce & Diversity Plan 2012 – 2016 and ensures compliance with current legislation.
Occupational Safety, Health and Injury Management During 2012, Pilbara Institute was committed to achieving a workplace with zero in juries by
providing, maintaining and improving a healthy and safe working environment for staff, clients
and members of the public and to maximise every opportunity for continuous improvement in
safety performance and prevention of harm.
Statement of Commitment to OSH Pilbara Institute implemented and displayed a public Statement of Commitment to OSH,
signed by the Managing Director and a Representative of the Safety and Health Standing
Committee which commits the senior management of the Institute to the process of
continuous improvement in all areas of OSH compliance.
Commitment to Consultation with employees (OSH) As with previous years, in 2012, the Institute utilised and actively maintained consultative
mechanisms via Occupational Safety & Health Representatives, local OSH Committees and
the Safety & Health Standing Committee to provide forums for the discussion of safety and
health policies and practices in accordance with the Occupational Safety & Health Act 1984
Section 40. The Institute utilised internal audio/video conferencing facilities to ensure full
20

Pilbara Institute’s Annual Report 2012 participation and active involvement of all campuses in the Pilbara region of operations. At
the micro level, OSH Committees were empowered to deal with local issues and had
capacity to refer other issues through to the Safety and Health Standing Committee for
discussion and resolution. The Committee advised and recommended measures to promote
the safety and health of staff, students and visitors at the Institute. The Agenda for the OSH
Standing Committee was amended to include a standing Agenda Item: ‘Information to take
back to Teams’. Minutes for all meetings were available to all employees via the Pilbara
Institute intranet.
Statement of Compliance with Injury Management Requirements Pilbara Institute has an ongoing commitment to full and active compliance with the
requirements of the Workers Compensation and Injury Management Act 1981. In 2012, the
organisation implemented a review of Injury Management Policy and Procedures, and
developed transition plans to take over the function from Education & Training Shared
Services Centre (ETSSC). As part of this process, the Institute strengthened its relationship
with RiskCover, as well as the Medical providers of treatment to injured employees, and has
implemented a number of successful Return to Work Plans.
Assessment of OSH Management System In 2012, the Institute committed to reinstating the role of an OSH Coordinator to drive
Occupational Health and Safety compliance, with the commitment and support of Senior
Management. The appointment was made in May 2012 and the OSH Coordinator was
provided with information and expectations in relation to the 5 key elements requiring
improvement. As a result of this audit, an Action Plan was developed and is in the process of
being implemented with an achieved level of completed agreed actions of 75%.
21

Pilbara Institute’s Annual Report 2012 Annual performance for 2011/2012 against the following targets
Indicator
Target 2011/2012
Actual 2011
Actual 2012 Number of fatalities
Zero (0)
0
0
Lost time injury/disease (LTI/D) incident rate
Zero (0) or 10% reduction on previous year
7
0.99
Lost time injury severity rate
Zero (0) or 10% reduction on previous year
42.8571
0
Percentage of injured workers returned to work within 28 weeks
Actual percentage to be reported
99.5%
100%
Percentage of managers trained in occupational safety health and injury management responsibilities
≥ 50%
70%
92.5%
Summary of Findings Pilbara Institute managers maintained and demonstrated a strong commitment to
occupational health and safety and were actively involved in the continuous improvement
processes. Well established processes were in place during the year, and are subject to
ongoing review, in relation to OSH Planning, Consultation, Hazard Management and
Training.
22

Pilbara Institute’s Annual Report 2012 Occupational Safety and Health Initiatives Occupational Safety and Health initiatives in 2012/2013 include:
• The implementation of an email based program of weekly Central Induction Guides
sent to all Institute employees.
• Distribution of Draft Reviews of OSH Policies, Procedures and Forms to all Managers
and elected Safety Representatives in order to consult as widely as possible prior to
amendment.
• Introduction of OSH principles into the Health and Wellbeing Program and the
incorporation into the activities and everyday business of the Pilbara Institute.
• Implementation and introduction of Non Workers Compensation related Return to
Work Plans for employees returning after non work related illness or injury.
• Introduction and implementation of a computer based OSH, Injury and Record
Management System (MYOSH).
• Development and introduction of e-learning modules of OSH training to all staff in an
Open Learning and Training environment.
• Review of the Occupational Health and Safety Policy and internal Audit of all OSH
related Policies and Procedures for compliance.
• Implementation of a specific Pilbara Institute Safety Health Environment Management
Plan (SHEMP) for use with our corporate customers
• Regular updating of staff intranet concerning policy changes and the effect of
legislative changes, as well as dedicated section in staff newsletter.
23

Auditor General
Page 1 of 3
7th Floor Albert Facey House 469 Wellington Street Perth MAIL TO: Perth BC PO Box 8489 Perth WA 6849 TEL: 08 6557 7500 FAX: 08 6557 7600
INDEPENDENT AUDITOR’S REPORT To the Parliament of Western Australia PILBARA INSTITUTE Report on the Financial Statements I have audited the accounts and financial statements of the Pilbara Institute. The financial statements comprise the Statement of Financial Position as at 31 December 2012, the Statement of Comprehensive Income, Statement of Changes in Equity and Statement of Cash Flows for the year then ended, and Notes comprising a summary of significant accounting policies and other explanatory information. Governing Council’s Responsibility for the Financial Statements The Governing Council is responsible for keeping proper accounts, and the preparation and fair presentation of the financial statements in accordance with Australian Accounting Standards and the Treasurer’s Instructions, and for such internal control as the Governing Council determines is necessary to enable the preparation of financial statements that are free from material misstatement, whether due to fraud or error. Auditor’s Responsibility As required by the Auditor General Act 2006, my responsibility is to express an opinion on the financial statements based on my audit. The audit was conducted in accordance with Australian Auditing Standards. Those Standards require compliance with relevant ethical requirements relating to audit engagements and that the audit be planned and performed to obtain reasonable assurance about whether the financial statements are free from material misstatement. An audit involves performing procedures to obtain audit evidence about the amounts and disclosures in the financial statements. The procedures selected depend on the auditor’s judgement, including the assessment of the risks of material misstatement of the financial statements, whether due to fraud or error. In making those risk assessments, the auditor considers internal control relevant to the Institute’s preparation and fair presentation of the financial statements in order to design audit procedures that are appropriate in the circumstances. An audit also includes evaluating the appropriateness of the accounting policies used and the reasonableness of accounting estimates made by the Governing Council, as well as evaluating the overall presentation of the financial statements. I believe that the audit evidence obtained is sufficient and appropriate to provide a basis for my audit opinion. Opinion In my opinion, the financial statements are based on proper accounts and present fairly, in all material respects, the financial position of the Pilbara Institute at 31 December 2012 and its financial performance and cash flows for the year then ended. They are in accordance with Australian Accounting Standards and the Treasurer’s Instructions.
24

Page 2 of 3
Report on Controls I have audited the controls exercised by the Pilbara Institute during the year ended 31 December 2012. Controls exercised by the Pilbara Institute are those policies and procedures established by the Governing Council to ensure that the receipt, expenditure and investment of money, the acquisition and disposal of property, and the incurring of liabilities have been in accordance with legislative provisions. Governing Council’s Responsibility for Controls The Governing Council is responsible for maintaining an adequate system of internal control to ensure that the receipt, expenditure and investment of money, the acquisition and disposal of public and other property, and the incurring of liabilities are in accordance with the Financial Management Act 2006 and the Treasurer’s Instructions, and other relevant written law. Auditor’s Responsibility As required by the Auditor General Act 2006, my responsibility is to express an opinion on the controls exercised by the Pilbara Institute based on my audit conducted in accordance with Australian Auditing and Assurance Standards. An audit involves performing procedures to obtain audit evidence about the adequacy of controls to ensure that the Institute complies with the legislative provisions. The procedures selected depend on the auditor’s judgement and include an evaluation of the design and implementation of relevant controls. I believe that the audit evidence obtained is sufficient and appropriate to provide a basis for my audit opinion. Opinion In my opinion, the controls exercised by the Pilbara Institute are sufficiently adequate to provide reasonable assurance that the receipt, expenditure and investment of money, the acquisition and disposal of property, and the incurring of liabilities have been in accordance with legislative provisions during the year ended 31 December 2012. Report on the Key Performance Indicators I have audited the key performance indicators of the Pilbara Institute for the year ended 31 December 2012. The key performance indicators are the key effectiveness indicators and the key efficiency indicators that provide information on outcome achievement and service provision. Governing Council’s Responsibility for the Key Performance Indicators The Governing Council is responsible for the preparation and fair presentation of the key performance indicators in accordance with the Financial Management Act 2006 and the Treasurer’s Instructions and for such controls as the Governing Council determines necessary to ensure that the key performance indicators fairly represent indicated performance. Auditor’s Responsibility As required by the Auditor General Act 2006, my responsibility is to express an opinion on the key performance indicators based on my audit conducted in accordance with Australian Auditing and Assurance Standards.
25

Page 3 of 3
An audit involves performing procedures to obtain audit evidence about the key performance indicators. The procedures selected depend on the auditor’s judgement, including the assessment of the risks of material misstatement of the key performance indicators. In making these risk assessments the auditor considers internal control relevant to the Governing Council’s preparation and fair presentation of the key performance indicators in order to design audit procedures that are appropriate in the circumstances. An audit also includes evaluating the relevance and appropriateness of the key performance indicators for measuring the extent of outcome achievement and service provision. I believe that the audit evidence obtained is sufficient and appropriate to provide a basis for my audit opinion. Opinion In my opinion, the key performance indicators of the Pilbara Institute are relevant and appropriate to assist users to assess the Institute’s performance and fairly represent indicated performance for the year ended 31 December 2012. Independence In conducting this audit, I have complied with the independence requirements of the Auditor General Act 2006 and Australian Auditing and Assurance Standards, and other relevant ethical requirements. Matters Relating to the Electronic Publication of the Audited Financial Statements and Key Performance Indicators This auditor’s report relates to the financial statements and key performance indicators of the Pilbara Institute for the year ended 31 December 2012 included on the Institute’s website. The Institute’s management is responsible for the integrity of the Institute’s website. This audit does not provide assurance on the integrity of the Institute’s website. The auditor’s report refers only to the financial statements and key performance indicators described above. It does not provide an opinion on any other information which may have been hyperlinked to/from these financial statements or key performance indicators. If users of the financial statements and key performance indicators are concerned with the inherent risks arising from publication on a website, they are advised to refer to the hard copy of the audited financial statements and key performance indicators to confirm the information contained in this website version of the financial statements and key performance indicators.
GLEN CLARKE DEPUTY AUDITOR GENERAL Delegate of the Auditor General for Western Australia Perth, Western Australia 13 March 2013
26

PILBARA INSTITUTE
FINANCIAL STATEMENTS
FOR THE
YEAR ENDED 31 DECEMBER 2012
27
FINANCIAL STATEMENTS
Certification of Financial Statements 2012
The accompanying financial statements of Pilbara Institute have been prepared in compliance with the provisions of the Financial Management Act 2006 from proper accounts and records to present fairly the financial transactions for the financial year ended 31 December 2012 and the financial position as at 31 December 2012.
At the date of signing we are not aware of any circumstances which would render the particulars included in the financial statements misleading or inaccurate.
Nicole Roocke 6 March 2013
Chairperson, Governing Council
Pilbara Institute
Lyn Farrell
Managing Director 6 March 2013
Member, Governing Council
Pilbara Institute
Esnart Nyemba 6 March 2013
Chief Finance Officer
Pilbara Institute
28

STATEMENT OF COMPREHENSIVE INCOME 2012 2011
FOR THE YEAR ENDED 31 DECEMBER 2012
Notes $ $
COST OF SERVICES
Expenses
Employee benefits expense 6 33,786,147 28,586,082
Supplies and services 7 9,708,818 10,608,547
Depreciation and amortisation expense 8 4,263,449 3,996,534
Finance costs 9 31,051 27,318
Cost of sales 14 21,272 16,021
Other expenses 10 2,672,868 2,042,308
Total cost of services 50,483,605 45,276,809
Income
Revenue
Fee for service 11 2,429,563 2,106,686
Student fees and charges 12 1,514,440 1,925,296
Ancillary trading 13 11,688 136,668
Sales 14 31,212 179,090
Commonwealth grants and contributions 15 - 12,190,000
Interest revenue 16 927,541 707,512
Other revenue 17 2,847,024 3,073,207
Total revenue 7,761,468 20,318,458
Gains
Gain on disposal of non-current assets 18 17,375 11,180
Total gains 17,375 11,180
Total income other than income from State Government 7,778,843 20,329,638
NET COST OF SERVICES (42,704,762) (24,947,171)
INCOME FROM STATE GOVERNMENT 19Service appropriation 35,054,821 34,021,676
Liabilities assumed/Assets transferredResources received free of charge 646,789 345,933
Royalties for Regions Fund 4,988,500 -
Total income from State Government 40,690,110 34,367,609
(2,014,652) 9,420,438
OTHER COMPREHENSIVE INCOME
Changes in asset revaluation surplus 19,834,459 10,619,739
Other gains/(losses) recognised directly in equityTotal other comprehensive income 19,834,459 10,619,739
TOTAL COMPREHENSIVE INCOME/(DEFICIT) FOR THE
PERIOD 17,819,807 20,040,177
The Statement of Comprehensive Income should be read in conjunction with the accompanying notes.
Pilbara Institute
SURPLUS/(DEFICIT) FOR THE PERIOD
29
Pilbara Institute
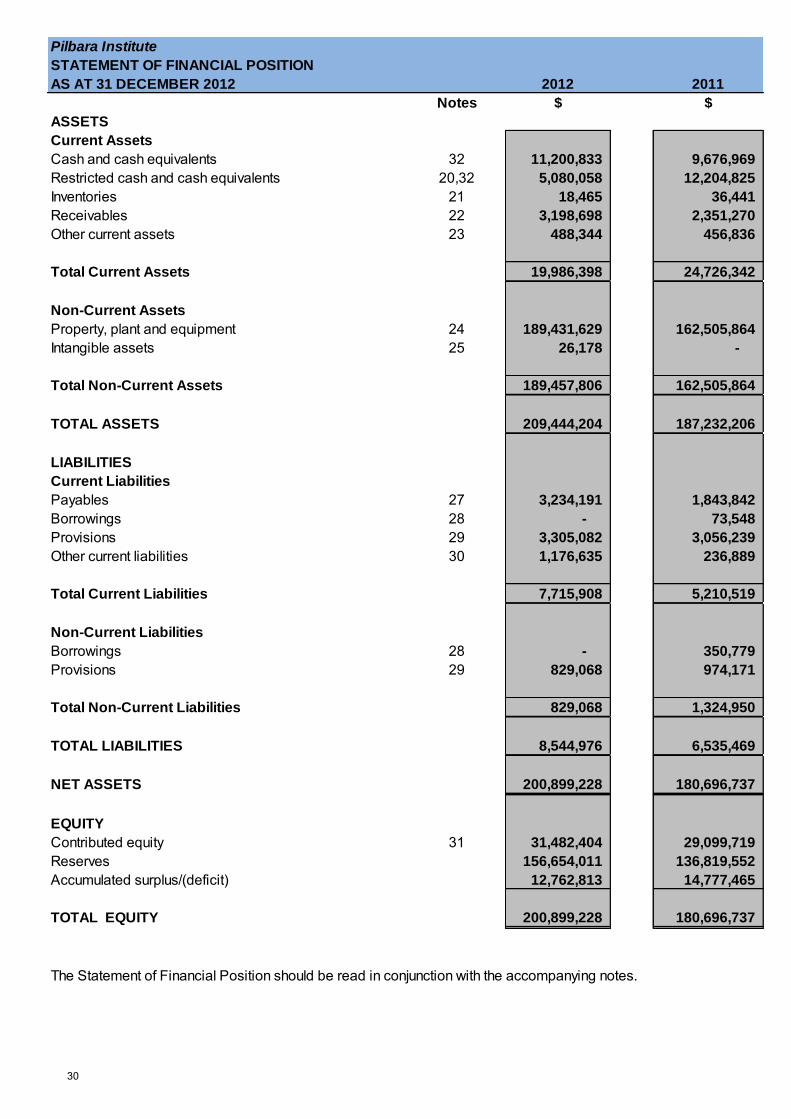
STATEMENT OF FINANCIAL POSITION
AS AT 31 DECEMBER 2012 2012 2011
Notes $ $
ASSETS
Current Assets
Cash and cash equivalents 32 11,200,833 9,676,969
Restricted cash and cash equivalents 20,32 5,080,058 12,204,825
Inventories 21 18,465 36,441
Receivables 22 3,198,698 2,351,270
Other current assets 23 488,344 456,836
Total Current Assets 19,986,398 24,726,342
Non-Current Assets
Property, plant and equipment 24 189,431,629 162,505,864
Intangible assets 25 26,178 -
Total Non-Current Assets 189,457,806 162,505,864
TOTAL ASSETS 209,444,204 187,232,206
LIABILITIES
Current Liabilities
Payables 27 3,234,191 1,843,842
Borrowings 28 - 73,548
Provisions 29 3,305,082 3,056,239
Other current liabilities 30 1,176,635 236,889
Total Current Liabilities 7,715,908 5,210,519
Non-Current Liabilities
Borrowings 28 - 350,779
Provisions 29 829,068 974,171
Total Non-Current Liabilities 829,068 1,324,950
TOTAL LIABILITIES 8,544,976 6,535,469
NET ASSETS 200,899,228 180,696,737
EQUITY
Contributed equity 31 31,482,404 29,099,719
Reserves 156,654,011 136,819,552
Accumulated surplus/(deficit) 12,762,813 14,777,465
TOTAL EQUITY 200,899,228 180,696,737
The Statement of Financial Position should be read in conjunction with the accompanying notes.
30

Pilbara Institute
STATEMENT OF CASH FLOWS
FOR THE YEAR ENDED 31 DECEMBER 2012 2012 2011
Notes $ $
CASH FLOWS FROM STATE GOVERNMENT
Service appropriation - Department of Training and Workforce Development 34,684,093 31,712,216
Royalties for Regions Fund 4,988,500 -
Net cash provided by State Government 39,672,593 31,712,216
Utilised as follows:
CASH FLOWS FROM OPERATING ACTIVITIES
Payments
Employee benefits (32,971,122) (26,046,192)
Supplies and services (8,331,481) (9,097,361)
Finance costs (31,051) (27,318)
GST payments on purchases (1,771,027) (1,192,587)
Other payments (2,309,461) (1,939,895)
Receipts
Fee for service 2,570,619 1,344,903
Student fees and charges 1,598,582 1,856,662
Ancillary trading 11,688 136,668
Commonwealth grants and contributions - 12,190,000
Interest received 972,549 653,211
GST receipts on sales 270,461 319,881
GST receipts from taxation authority 1,263,447 713,710
Other receipts 2,279,013 3,314,762
Net cash provided by/(used in) operating activities 32 (36,447,781) (17,773,557)
CASH FLOWS FROM INVESTING ACTIVITIES
Payments
Purchase of non-current physical assets (8,440,178) (889,590)
Receipts
Proceeds from sale of non-current physical assets 38,790 11,180
Net cash provided by/(used in) investing activities (8,401,388) (878,410)
CASH FLOWS FROM FINANCING ACTIVITIES
Payments
Repayment of borrowings (424,328) (73,822)
Net cash provided by/(used in) financing activities (424,328) (73,822)
Net increase/(decrease) in cash and cash equivalents (5,600,903) 12,986,426
Cash and cash equivalents at begining of period 21,881,794 8,895,368
CASH AND CASH EQUIVALENTS AT THE END OF
PERIOD 32 16,280,891 21,881,794
The Statement of Cash Flows should be read in conjunction with the accompanying notes.
31

Pilbara Institute
STATEMENT OF CHANGES IN EQUITY Accumulated
FOR THE YEAR ENDED 31 DECEMBER 2012 Contributed Equity Reserves Surplus / (Deficit) Total Equity
Notes $ $ $ $
Balance at 1 January 2011 36 29,099,719 126,199,814 5,298,253 160,597,785
Surplus/(deficit) - - 9,420,438 9,420,438 Other adjustments - - 58,775 58,775 Other comprehensive income - Revaluation of Land & Buildings - 10,619,739 - 10,619,739 Total comprehensive income for the period - 10,619,739 9,479,213 20,098,952
Transaction with owners in their capacity as owners :
Capital appropriations - - - - Other contributions by owners - - - - Distribution to owners - - - - Total - - - -
Balance at 31 December 2011 29,099,719 136,819,552 14,777,465 180,696,737
Balance at 1 January 2012 29,099,719 136,819,552 14,777,465 180,696,737
Surplus/(deficit) - - (2,014,652) (2,014,652) Other comprehensive income - 19,834,459 - 19,834,459 Total comprehensive income for the period - 19,834,459 (2,014,652) 17,819,807
Transaction with owners in their capacity as owners:
Capital appropriations - - - - Other contributions by owners 2,382,685 - - 2,382,685 Distribution to owners - - - - Total 2,382,685 - - 2,382,685
Balance at 31 December 2012 31,482,404 156,654,011 12,762,813 200,899,228
The Statement of Changes in Equity should be read in conjunction with the accompanying notes. 32

PILBARA INSTITUTE NOTES TO THE FINANCIAL STATEMENTS FOR THE YEAR ENDED 31 DECEMBER 2012 1. Australian Accounting Standards
(a) General The Institute's financial statements for the year ended 31 December 2012 have been prepared in accordance with Australian Accounting Standards. The term 'Australian Accounting Standards' refers to Standards and Interpretations issued by the Australian Accounting Standard Board (AASB). The Institute has adopted any applicable new and revised Australian Accounting Standards from their operative dates. (b) Early adoption of standards
The Institute cannot early adopt an Australian Accounting Standard unless specifically permitted by Treasurer's Instruction (TI) 1101 'Application of Australian Accounting Standards and Other Pronouncements'. There has been no early adoption of Australian Accounting Standards that have been issued or amended (but not operative) by the Institute for the annual reporting period ended 31 December 2012. 2. Summary of significant accounting policies
The following accounting policies have been adopted in the preparation of these financial statements. Unless otherwise stated, these policies are consistent with those adopted in the previous year. (a) General statement
The Institute is a not-for-profit reporting entity that prepares general purpose financial statements in accordance with the Australian Accounting Standards, the Framework, Statements of Accounting Concepts and other authoritative pronouncements of the AASB as applied by the Treasurer‟s instructions. Several of these are modified by the Treasurer‟s instructions to vary application, disclosure, format and wording. (For example, AASB 116 requires land and buildings to be measured at either cost or fair value; TI 954 mandates the fair value option). The Financial Management Act and the Treasurer‟s instructions impose legislative provisions that govern the preparation of financial statements and take precedence over the Australian Accounting Standards, the Framework, Statements of Accounting Concepts and other authoritative pronouncements of the AASB. Where modification is required and has had a material or significant financial effect upon the reported results, details of that modification and the resulting financial effect are disclosed in the notes to the financial statements. (b) Basis of preparation
The financial statements have been prepared on the accrual basis of accounting using the historical cost convention, except for land, buildings and infrastructure which have been measured at fair value.
33
The accounting policies adopted in the preparation of the financial statements have been consistently applied throughout all periods presented unless otherwise stated. The financial statements are presented in Australian dollars ($). Note 3 „Judgements made by management in applying accounting policies‟ discloses judgements that have been made in the process of applying the Institute‟s accounting policies resulting in the most significant effect on amounts recognised in the financial statements. Note 4 „Key sources of estimation uncertainty‟ discloses key assumptions made concerning the future, and other key sources of estimation uncertainty at the end of the reporting period, that have a significant risk of causing a material adjustment to the carrying amounts of assets and liabilities within the next financial year. (c) Reporting entity
The reporting entity comprises the Institute and entities listed at note 40 „Related bodies‟. (d) Contributed equity
AASB Interpretation 1038 „Contributions by Owners Made to Wholly-Owned Public Sector Entities‟ requires transfers in the nature of equity contributions, other than as a result of a restructure of administrative arrangements, to be designated by the Government (the owner) as contributions by owners (at the time of, or prior to transfer) before such transfers can be recognised as equity contributions. Capital appropriations have been designated as contributions by owners by TI 955 'Contributions by Owners Made to Wholly Owned Public Sector Entities' and have been credited directly to Contributed Equity. The transfers of net assets to/from other agencies, other than as a result of a restructure of administrative arrangements, are designated as contributions by owners where the transfers are non-discretionary and non-reciprocal. See note 31 'Equity'. (e) Income
Revenue recognition
Revenue is recognised and measured at the fair value of consideration received or receivable. The majority of operating revenue of the Institute represents revenue earned from student fees and charges, fee for service, ancillary services, trading activities and Commonwealth grants and contributions. The following specific recognition criteria must also be met before revenue is recognised for the major business activities as follows:
34

Sale of goods
Revenue is recognised from the sale of goods and disposal of other assets when the significant risks and rewards of ownership transfer to the purchaser and can be measured reliably. Provision of services
Revenue is recognised by reference to the stage of completion of the transaction. Interest
Revenue is recognised as the interest accrues. Interest shall be recognised using the effective interest method, which is the rate that exactly discounts estimated future cash receipts through the expected life of the financial asset to the net carrying amount of the financial asset, where applicable. Grants, donations, gifts and other non-reciprocal contributions
Revenue is recognised at fair value when the Institute obtains control over the assets comprising the contributions, usually when cash is received. Other non-reciprocal contributions that are not contributions by owners are recognised at their fair value. Contributions of services are only recognised when a fair value can be reliably determined and the services would be purchased if not donated. Royalties for Regions funds are recognised as revenue at fair value in the period in which the Institute obtains control over the funds. The Institute obtains control of the funds at the time the funds are deposited into the Institute‟s bank account. Service appropriations
Service Appropriations are recognised as revenues at fair value in the period in which the Institute gains control of the appropriated funds. The Institute gains control of appropriated funds at the time those funds are deposited to the bank account. State funds
The funds received from the Department of Training and Workforce Development in respect of the delivery of services forming part of the Delivery Performance Agreement are included in State funds, disclosed under „Income from State Government'. They are the result of training successfully tendered for under competitive tendering arrangements. This revenue is recognised at nominal value in the period in which the Institute meets the terms of the Agreement. See note 19 'Income from State Government'. Gains
Realised and unrealised gains are usually recognised on a net basis. These include gains arising on the disposal of non-current assets and some revaluations of non-current assets. (f) Borrowing costs
Borrowing costs for qualifying assets are capitalised net of any investment income earned on the unexpended portion of the borrowings. Other borrowing costs are expensed when incurred.
35

(g) Property, plant and equipment
Capitalisation/expensing of assets
Items of property, plant and equipment and infrastructure costing $5,000 or more are recognised as assets and the cost of utilising assets is expensed (depreciated) over their useful lives. Where applicable in accordance with TI 1101, the capitalisation threshold has been applied to the aggregate value of a group or network of assets where the cost of individual item may be below the threshold but collectively the cost of the items in the group or network exceeds the threshold. Items of property, plant and equipment and infrastructure costing less than $5,000 are immediately expensed direct to the Statement of Comprehensive Income (other than where they form part of a group of similar items which are significant in total). Initial recognition and measurement
Property, plant and equipment and infrastructure are initially recognised at cost. For items of property, plant and equipment and infrastructure acquired at no cost or for nominal cost, the cost is the fair value at the date of acquisition. Subsequent measurement
Subsequent to initial recognition as an asset, the revaluation model is used for the measurement of land, buildings and infrastructure and historical cost for all other property, plant and equipment. Land, buildings and infrastructure are carried at fair value less accumulated depreciation (buildings and infrastructure only) and accumulated impairment losses. All other items of property, plant and equipment are stated at historical cost less accumulated depreciation and accumulated impairment losses. Where market-based evidence is available, the fair value of land and buildings is determined on the basis of current market buying values determined by reference to recent market transactions. When buildings are revalued by reference to recent market transactions, the accumulated depreciation is eliminated against the gross carrying amount of the asset and the net amount restated to the revalued amount. In the absence of market-based evidence, fair value of land and buildings is determined on the basis of existing use. This normally applies where buildings are specialised or where land use is restricted. Fair value for existing use assets is determined by reference to the cost of replacing the remaining future economic benefits embodied in the asset, i.e. the depreciated replacement cost. Where the fair value of buildings is determined on the depreciated replacement cost basis, accumulated depreciation is eliminated against the gross carrying amount of the asset and the net carrying amount restated to the revalued amount. Land and buildings are independently valued annually by the Western Australian Land Information Authority (Valuation Services) and recognised annually to ensure that the carrying amount does not differ materially from the asset's fair value at the end of the reporting period.
36

The most significant assumptions in estimating fair value are made in assessing whether to apply the existing use basis to assets and in determining estimated useful life. Professional judgement by the valuer is required where the evidence does not provide a clear distinction between market type assets and existing use assets. Refer to note 24 'Property, plant and equipment' for further information on revaluations. The agency has recognised revaluations annually. However, AASB 116.31 only requires revaluations to be made with sufficient regularity to ensure that the carrying amount does not differ materially from that would be determined using fair value at the end of the reporting period. See also note 24 “Property, plant and equipment‟. Derecognition
Upon disposal or derecognition of an item of property, plant and equipment and infrastructure, any revaluation surplus relating to that asset is retained in the asset revaluation surplus. Asset revaluation surplus
The asset revaluation surplus is used to record increments and decrements on the revaluation of non-current assets as described in note 24 „Property, plant and equipment‟. Depreciation
All non-current assets having a limited useful life are systematically depreciated over their estimated useful lives in a manner that reflects the consumption of their future economic benefits. Depreciation is calculated using the straight line method, using rates which are reviewed annually. Estimated useful lives for each class of depreciable asset are: Buildings 40 years Motor vehicles, caravans and trailers 4 to 23 years Plant, furniture and general equipment 4 to 28 years Computing, communications and software (a) 1 to 15 years Marine craft 6 to 8 years (a) Software that is integral to the operation of related hardware. Works of art controlled by the Institute are classified as property, plant and equipment. These are anticipated to have indefinite useful lives. Their service potential has not, in any material sense, been consumed during the reporting period and so no depreciation has been recognised. Land is not depreciated.
(h) Intangible assets
Capitalisation/Expensing of assets
Acquisitions of intangible assets costing $5,000 or more and internally generated intangible assets costing $5,000 or more are capitalised. The cost of utilising the assets is expensed (amortised) over their useful life. Costs incurred below these thresholds are immediately expensed directly to the Statement of Comprehensive Income.
37

Intangible assets are initially recognised at cost. For assets acquired at no cost or for nominal cost, the cost is their fair value at the date of acquisition. The cost model is applied for subsequent measurement requiring the asset to be carried at cost less any accumulated amortisation and accumulated impairment losses. Amortisation for intangible assets with finite useful lives is calculated for the period of the expected benefit (estimated useful life which is reviewed annually) on the straight line basis. All intangible assets controlled by the Institute have a finite useful life and zero residual value. The expected useful lives for each class of intangible asset are: Licences up to 10 years Development costs 3 to 5 years Software (a) 3 to 5 years Website costs 3 to 5 years (a) Software that is not integral to the operation of any related hardware. Licences
Licences have a finite useful life and are carried at cost less accumulated amortisation and accumulated impairment losses. Development costs
Research costs are expensed as incurred. Development costs incurred for an individual project are carried forward when the future economic benefit can reasonably be regarded as assured and the total project costs are likely to exceed $50,000. Other development costs are expensed as incurred. Computer software
Software that is an integral part of the related hardware is recognised as property, plant and equipment. Software that is not an integral part of the related hardware is recognised as an intangible asset. Software costing less than $5,000 is expensed in the year of acquisition. Web site costs
Website costs are charged as expenses when they are incurred unless they relate to the acquisition or development of an asset when they may be capitalised and amortised. Generally, costs in relation to feasibility studies during the planning phase of a website, and ongoing costs of maintenance during the operating phase are expensed. Costs incurred in building or enhancing a web site, to the extent that they represent probable future economic benefits that can be reliably measured, are capitalised. (i) Impairment of assets
Property, plant and equipment, infrastructure and intangible assets are tested for any indication of impairment at the end of each reporting period. Where there is an indication of impairment, the recoverable amount is estimated. Where the recoverable amount is less than the carrying amount, the asset is considered impaired and is written down to the recoverable amount and an impairment loss is recognised. As the Institute is a not-for-profit entity, unless an asset has been identified as a surplus asset, the recoverable amount is the higher of an asset‟s fair value less costs to sell and depreciated replacement cost. 38

The risk of impairment is generally limited to circumstances where an asset‟s depreciation is materially understated, where the replacement cost is falling or where there is a significant change in useful life. Each relevant class of assets is reviewed annually to verify that the accumulated depreciation/amortisation reflects the level of consumption or expiration of assets' future economic benefits and to evaluate any impairment risk from falling replacement costs. Intangible assets with an indefinite useful life and intangible assets not yet available for use are tested for impairment at the end of each reporting period irrespective of whether there is any indication of impairment. The recoverable amount of assets identified as surplus assets is the higher of fair value less costs to sell and the present value of future cash flows expected to be derived from the asset. Surplus assets carried at fair value have no risk of material impairment where fair value is determined by reference to market-based evidence. Where fair value is determined by reference to depreciated replacement cost, surplus assets are at risk of impairment and the recoverable amount is measured. Surplus assets at cost are tested for indications of impairment at the end of each reporting period. See note 26 „Impairment of assets‟ for the outcome of impairment reviews and testing. See note 2(o) 'Receivables' and note 22 'Receivables' for impairment of receivables. (j) Leases
The Institute has entered into operating lease arrangements for computing equipment, motor vehicles and buildings. Lease payments are expensed on a straight line basis over the lease term as this represents the pattern of benefits derived from the leased. See note 33 “Commitments”. (k) Financial instruments
In addition to cash and bank overdraft, the Institute has two categories of financial instruments:
Loans and receivables; and Financial liabilities measured at amortised cost.
These have been disaggregated into the following classes: Financial assets
Cash and cash equivalents Restricted cash and cash equivalent Receivables
Financial liabilities
Payables WATC/Bank borrowings
Initial recognition and measurement of financial instruments is at fair value which normally equates to the transaction cost or face value. Sub-sequent measurement is at amortised cost using the effective interest method.
39
The fair value of short-term receivables and payables is the transaction cost or the face value because there is no interest rate applicable and subsequent measurement is not required as the effect of discounting is not material. (l) Cash and cash equivalents
For the purpose of the Statement of Cash Flows, cash and cash equivalents include restricted cash and cash equivalents. These are comprised of cash on hand and short-term deposits with original maturities of three months or less that are readily convertible to a known amount of cash and which are subject to insignificant risk of changes in value. (m) Accrued salaries
Accrued salaries (see note 27 'Payables') represent the amount due to staff but unpaid at the end of the financial year, as the end of the last pay period for that financial year does not coincide with the end of the financial year. Accrued salaries are settled within a fortnight of the financial year end. The Institute considers the carrying amount of accrued salaries to be equivalent to its fair value. The accrued salaries suspense account (see note 20 „Restricted cash and cash equivalents‟) consists of amounts paid annually into a suspense account over a period of ten financial years to largely meet the additional cash outlay in each eleventh year when 27 pay days occur instead of the normal 26. No interest is received on this account. (n) Inventories
Inventories are measured at the lower of cost and net realisable value. Costs are assigned by the method most appropriate to each particular class of inventory, with the majority being measured on a first in first out basis. Inventories not held for resale are measured at cost unless they are no longer required, in which case they are measured at net realisable value. See note 21 'Inventories'. (o) Receivables
Receivables are recognised at original invoice amount less an allowance for any uncollectible amounts (i.e. impairment). The collectability of receivables is reviewed on an ongoing basis and any receivables identified as uncollectible are written off against the allowance account. The allowance for uncollectible amounts (doubtful debts) is raised when there is objective evidence that the Institute will not be able to collect the debts. The carrying amount is equivalent to fair value as it is due for settlement within 30 days. See note 2(k) „Financial instruments‟ and note 22 „Receivables‟. (p) Payables
Payables are recognised when the Institute becomes obliged to make future payments as a result of a purchase of assets or services. The carrying amount is equivalent to fair value, as settlement is generally within 30 days. See note 2(k) „Financial instruments‟ and note 27 'Payables'.
40

(q) Borrowings
All loans payable are initially recognised at the fair value of the net proceeds received. Subsequent measurement is at amortised cost using the effective interest method. See note 2(k) „Financial instruments‟ and note 28 „Borrowings‟.
(r) Provisions
Provisions are liabilities of uncertain timing or amount and are recognised where there is a present legal or constructive obligation as a result of a past event and when the outflow of resources embodying economic benefits is probable and a reliable estimate can be made of the amount of the obligation. Provisions are reviewed at the end of each reporting period. See note 29 „Provisions‟.
(i) Provisions - employee benefits
All annual leave and long service leave provisions are in respect of employees‟ services up to the end of the reporting period. Annual leave
The liability for annual leave that is expected to be settled within twelve months after the end of the reporting period is recognised and measured at the undiscounted amounts expected to be paid when the liability is settled. Annual leave that is not expected to be settled within 12 months after the end of the reporting period is recognised and measured at the present value of amounts expected to be paid when the liabilities are settled using the remuneration rate expected to apply at the time of settlement. When assessing expected future payments consideration is given to expected future wage and salary levels including non-salary components such as employer superannuation contributions, as well as the experience of employee departures and periods of service. The expected future payments are discounted using market yields at the end of the reporting period on national government bonds with terms to maturity that match, as closely as possible, the estimated future cash outflows. The provision for annual leave is classified as a current liability as the Institute does not have an unconditional right to the defer settlement of the liability for at least 12 months after the end of the reporting period. Long service leave
The liability for long service leave expected to be settled within 12 months after the end of the reporting period is recognised and measured at the undiscounted amounts expected to be paid when the liability is settled. Long service leave that is not expected to be settled within 12 months after the end of the reporting period is recognised and measured at the present value of amounts expected to be paid when the liabilities are settled using the remuneration rate expected to apply at the time of settlement. When assessing expected future payments consideration is given to expected future wage and salary levels including non salary components such as employer superannuation contributions, as well as the experience of employee departures and periods of service. The expected future payments are discounted using market yields at the end of the reporting period on national government bonds with terms to maturity that match, as closely as possible, the estimated future cash outflows. 41

An actuarial assessment of long service leave undertaken by PricewaterhouseCoopers Actuaries at 31December 2012 determined that the liability measured using the short hand measurement technique above was not materially different from the liability determined using the present value of expected future payments. This calculation is consistent with the Institute's experience of employee retention and leave taken. Unconditional long service leave provisions are classified as current liabilities as the Institute does not have an unconditional right to defer settlement of the liability for at least 12 months after the end of the reporting period. Pre-conditional and conditional long service leave provisions are classified as non-current liabilities because the Institute has an unconditional right to defer the settlement of the liability until the employee has completed the requisite years of service. Deferred Leave
The provision for deferred leave relates to Public Service employees who have entered into an agreement to self-fund an additional twelve months leave in the fifth year of the agreement. The provision recognises the value of salary set aside for employees to be used in the fifth year. This liability is measured on the same basis as annual leave. Deferred leave is reported as a current provision as employees can leave the scheme at their discretion at any time. Superannuation
The Government Employees Superannuation Board (GESB) and other funds administer public sector superannuation arrangements in Western Australia in accordance with legislative requirements. Eligibility criteria for membership in particular schemes for public sector employees vary according to commencement and implementation dates. Eligible employees contribute to the Pension Scheme, a defined benefit pension scheme now closed to new members since 1987, or the Gold State Superannuation Scheme (GSS), a defined benefit lump sum scheme also closed to new members since 1995. The GSS is a defined benefit scheme for the purposes of employees and whole-of-government reporting. However, it is a defined contribution plan for Institute purposes because the concurrent contributions (defined contributions) made by the Institute to GESB extinguishes the Institute‟s obligations to the related superannuation liability. The Institute has no liabilities under the Pension schemes or the GSS. The liabilities for the unfunded Pension Scheme and the unfunded GSS transfer benefits attributable to members who transferred from the Pension Scheme, are assumed by the Treasurer. All other GSS obligations are funded by concurrent contributions made by the Institute to the GESB. Employees commencing employment prior to 16 April 2007 who were not members of either the Pension Scheme or the GSS became non-contributory members of the West State Superannuation Scheme (WSS). Employees commencing employment on or after 16 April 2007 became members of the GESB Super Scheme (GESBS). From 30 March 2012, existing members of the WSS or GESBS and new employees were able to choose their preferred superannuation fund. 42

The Institute makes concurrent contributions to GESB or other funds on behalf of employees in compliance with the Commonwealth Government’s Superannuation Guarantee (Administration) Act 1992. Contributions to these accumulation schemes extinguish the Institute‟s liability for superannuation charges in respect of employees who are not members of the Pension Scheme or GSS. The GESB makes all benefit payments in respect of the Pension Scheme and GSS, and is recouped from the Treasurer for the employer's share. See also note 2(s) 'Superannuation expense'. (ii) Provisions - other
Employment on-costs
Employment on-costs, including workers‟ compensation insurance, are not employee benefits and are recognised separately as liabilities and expenses when the employment to which they relate has occurred. Employment on-costs are included as part of 'Other expenses' and are not included as part of the Institute's 'Employee benefits expense‟. The related liability is included in 'Employment on-costs provision'. (See note 10 'Other expenses' and note 29 'Provisions'.)
(s) Superannuation expense
The superannuation expense in the Statement of Comprehensive Income comprises of employer contributions paid to the GSS (concurrent contributions), the West State Superannuation Scheme (WSS), the GESB Super Scheme (GESBS) and other superannuation funds. (t) Resources received free of charge or for nominal cost
Resources received free of charge or for nominal cost that can be reliably measured are recognised as income at fair value. Where the resource received represents a service that the authority would otherwise pay for, a corresponding expense is recognised. Receipts of assets are recognised in the Statement of Financial Position. Assets or services received from other State Government agencies are separately disclosed under Income from State Government in the Statement of Comprehensive Income. (u) Comparative figures
Comparative figures are, where appropriate, reclassified to be comparable with the figures presented in the current financial year. 3. Judgements made by management in applying accounting policies
The preparation of financial statements requires management to make judgements about the application of accounting policies that have a significant effect on the amounts recognised in the financial statements. The Institute evaluates these judgements regularly.
43

Operating Lease Commitments The Institute has entered into a commercial lease and has determined that the lessor retains substantially all the significant risks and rewards incidental to ownership of the property. Accordingly, the lease has been classified as an operating lease. 4. Key sources of estimation uncertainty
Key estimates and assumptions concerning the future are based on historical experience and various other factors that have a significant risk of causing a material adjustment to the carrying amount of assets and liabilities within the next financial year. Long Service Leave
Several estimations and assumptions in calculating the Institute‟s long service leave provision include expected future salary rates, discount rates, employee retention rates and expected future payments. Changes in these estimations and assumptions may impact on the carrying amount of the long service leave provision. Student Receivables
Student receivable under 120 days is considered collectable and a provision is made for those greater than 120 days on the following basis: Raised in the current financial year,< $100 debt, written off after the third reminder letter (GC Resolution 5/2007) Raised in the current financial year 70% of the total value of >120 days debt Raised in the previous financial year 85% of the total value of >120 days debt Raised in the previous two or more financial years 100% of the total value of >120 days debt General Receivables
General receivables from other government agencies are considered risk free, no provision is made and all others are by individual assessment with a provision to the full value required. Inventory Inventory stocks (bookshop) are ordered on a just in time basis to match current year teaching requirements. Obsolescence is considered to be less than 5% of the annual trading purchases and therefore no provision is made. Sick Leave
No provision has been made for sick leave as the Institute‟s annual costs do not exceed the annual value of entitlements. Invalid Enrolment and under delivery of the Delivery & Performance Agreement
Included in Current Liabilities is a value refundable to the Department of Training and Workforce Development for under delivery in the Institute‟s training programs. An estimate has been made based on student information held at the year end with final results determined by the Department the following year.
44

5. Disclosure of changes in accounting policy and estimates
Initial application of an Australian Accounting Standard The Institute has applied the following Australian Accounting Standards effective for annual reporting periods beginning on or after 1 January 2012 that impacted on the Institute.
AASB 1048 Interpretation of Standards This Standard identifies the Australian Interpretations and classifies them into two groups: those that correspond to an IASB Interpretation and those that do not. There is no financial impact.
AASB 1054 Australian Additional Disclosures
This Standard, in conjunction with AASB 2011-1 Amendments to Australian Accounting Standards arising from the Trans-Tasman Convergence Project, removes disclosure requirements from the other Standards and incorporates them in a single Standard to achieve convergence between Australian and New Zealand Accounting Standards. There is no financial impact.
AASB 2010-6
Amendments to Australian Accounting Standards – Disclosures on Transfers of Financial Assets [AASB 1 & 7]
This Standard introduces additional disclosure relating to transfers of financial assets in AASB 7. An entity shall disclose all transferred financial assets that are not derecognised and any continuing involvement in a transferred asset, existing at the reporting date, irrespective of when the related transfer transaction occurred. There is no financial impact.
AASB 2011-1
Amendments to Australian Accounting Standards arising from the Trans-Tasman Convergence Project [AASB 1, 5, 101, 107, 108, 121, 128, 132 & 134 and Int 2, 112 & 113]
This Standard, in conjunction with AASB 1054, removes disclosure requirements from other Standards and incorporates them in a single Standard to achieve convergence between Australian and New Zealand Accounting Standards. There is no financial impact.
AASB 2011-5
Amendments to Australian Accounting Standards – Extending Relief from Consolidation, the Equity Method and Proportionate Consolidation [AASB 127, 128 & 131]
This Standard extends the relief from consolidation, the equity method and proportionate consolidation by removing the requirement for the consolidated financial statements prepared by the ultimate or any intermediate parent entity to be IFRS compliant, provided that the parent entity, investor or venturer and the ultimate or intermediate parent entity are not-for-profit non-reporting entities that comply with Australian Accounting Standards. There is no financial impact.
45

The Institute considers the following Australian Accounting Standards as not applicable to the public sector as they have no impact or do not apply to not-for-profit entities.
AASB 2010-8
Amendments to Australian Accounting Standards – Deferred Tax: Recovery of Underlying Assets [AASB 112]
AASB 2010-9
Amendments to Australian Accounting Standards – Severe Hyperinflation and Removal of Fixed Dates for First-time Adopters [AASB 1]
Voluntary changes in accounting policy
No voluntary changes in accounting policy have been made.
Future impact of Australian Accounting Standards not yet operative
The Institute cannot early adopt an Australian Accounting Standard unless specifically permitted by TI 1101 'Application of Australian Accounting Standards and Other Pronouncements'. Consequently, the Institute has not applied early any of the following Australian Accounting Standards that may impact the Institute. Where applicable, the Institute plans to apply these Australian Accounting Standards from their application date.
46

Operative for reporting periods beginning on / after
AASB 9 Financial Instruments This Standard supersedes AASB 139 Financial Instruments: Recognition and Measurement, introducing a number of changes to accounting treatments. The mandatory date of this Standard was amended to 1 January 2015. The Institute has not yet determined the application or the potential impact of the Standard for agencies.
1 Jan 2015
AASB 10 Consolidated Financial Statements
This Standard supersedes requirements under AASB 127 Consolidated and Separate Financial Statements and Interpretation 112 Consolidation – Special Purpose Entities, introducing a number of changes to accounting treatments. The Standard was issued in August 2011. The Institute has not yet determined the application or the potential impact of the Standard.
1 Jan 2013
AASB 11 Joint Arrangements This Standard supersedes AASB 131 Interests in Joint Ventures, introducing a number of changes to accounting treatments. The Standard was issued in Aug 2011. The Institute has not yet determined the application or the potential impact of the Standard.
1 Jan 2013
AASB 12 Disclosure of Interests in Other Entities This Standard supersedes disclosure requirements under AASB 127 Consolidated and Separate Financial Statements and AASB 131 Interests in Joint Ventures. The Standard was issued in Aug 2011. The Institute has not yet determined the application or the potential impact of the Standard.
1 Jan 2013
AASB 13 Fair Value Measurement
This Standard defines fair value, sets out a framework for measuring fair value and requires disclosures about fair value measurements. The Authority has liaised with the Western Australian Land Information Authority (Valuation Services) to ensure that sufficient information will be provided to meet the disclosure requirements of this Standard. There is no financial impact.
1 Jan 2013
47

Operative for reporting periods beginning on / after
AASB 119
Employee Benefits This Standard supersedes AASB 119 (October 2010), making changes to the recognition, presentation and disclosure requirements. The Institute will assess employee leave patterns to determine whether annual leave is short-term or other long-term employee benefit. The resultant discounting of annual leave liabilities that were previously measured at the undiscounted amounts is not material.
1 Jan 2013
AASB 127 Separate Financial Statements This Standard supersedes requirements under AASB 127 Consolidated and Separate Financial Statements, introducing a number of changes to accounting treatments. The Standard was issued in Aug 2011. The Institute has not yet determined the application or the potential impact of the Standard.
1 Jan 2013
AASB 1053 Application of Tiers of Australian Accounting Standards
This Standard establishes a differential financial reporting framework consisting of two tiers of reporting requirements for preparing general purpose financial statements. There is no financial impact.
1 July 2013
AASB 2009-11
Amendments to Australian Accounting Standards arising from AASB 9 [AASB 1, 3, 4, 5, 7, 101, 102, 108, 112, 118, 121, 127, 128, 131, 132, 136, 139, 1023 & 1038 and Interpretations 10 & 12]. [modified by AASB 2010-7.]
1 Jan 2013
AASB 2010-2 Amendments to Australian Accounting Standards arising from Reduced Disclosure Requirements [AASB 1, 2, 3, 5, 7,8, 101, 102, 107, 108, 110, 111, 112, 116, 117, 119, 121,123, 124, 127, 128, 131, 133, 134, 136, 137, 138, 140, 141,1050 & 1052 and Interpretations 2, 4, 5, 15, 17, 127, 129 & 1052]
This Standard makes amendments to many Australian Accounting Standards, including Interpretations, to introduce reduced disclosure requirements for certain types of entities. There is no financial impact.
1 July 2013
Operative for 48

reporting periods beginning on / after
AASB 2010-7 Amendments to Australian Accounting Standards arising from AASB 9 (December 2010) [AASB 1, 3, 4, 5, 7, 101,102, 108, 112, 118, 120, 121, 127, 128, 131, 132, 136, 137,139, 1023 & 1038 and Int 2, 5, 10, 12, 19 & 127]
This Standard makes consequential amendments to other Australian Accounting Standards and Interpretations as a result of issuing AASB 9 in December 2010. The Institute has not yet determined the application or the potential impact of the Standard.
1 Jan 2013
AASB 2011-2 AASB 2011-6
Amendments to Australian Accounting Standards arising from the Trans-Tasman Convergence Project – Reduced Disclosure Requirements [AASB 101 & 1054] This Standard removes disclosure requirements from other Standards and incorporates them in a single Standard to achieve convergence between Australian and New Zealand Accounting Standards for reduced disclosure reporting. There is no financial impact. Amendments to Australian Accounting Standards – Extending Relief from Consolidation, the Equity Method and Proportionate Consolidation – Reduced Disclosure Requirements [AASB 127, 128 & 131]
This Standard extends the relief from consolidation, the equity method and proportionate consolidation by removing the requirement for the consolidated financial statements prepared by the ultimate or any intermediate parent entity to be IFRS compliant, provided that the parent entity, investor or venturer and the ultimate or intermediate parent entity comply with Australian Accounting Standards or Australian Accounting Standards – Reduced Disclosure Requirements. There is no financial impact.
1 July 2013 1 Jul 2013
49

Operative for reporting periods beginning on / after
AASB 2011-7 Amendments to Australian Accounting Standards arising from the Consolidation and Joint Arrangements Standards [AASB 1, 2, 3, 5, 7, 9, 2009-11, 101, 107, 112, 118, 121, 124, 132, 133, 136, 138, 139, 1023 & 1038 and Interpretations 5, 9, 16 & 17]
This Standard gives effect to consequential changes arising from the issuance of AASB 10, AASB 11, AASB 127 Separate Financial Statements and AASB 128 Investments in Associates and Joint Ventures. The institute has not yet determined the application or the potential impact of the Standard.
1 Jan 2013
AASB 2011-8 Amendments to Australian Accounting Standards arising from AASB 13 [AASB 1, 2, 3, 4, 5, 7, 9, 2009-11, 2010-7, 101, 102, 108, 110, 116, 117, 118, 119, 120, 121, 128, 131, 132, 133, 134, 136, 138, 139, 140, 141, 1004, 1023 & 1038 and Interpretations 2, 4, 12, 13, 14, 17, 19, 131 & 132]
This Standard replaces the existing definition and fair value guidance in other Australian Accounting Standards and Interpretations as the result of issuing AASB 13 in September 2011. There is no financial impact.
1 Jan 2013
AASB 2011-9 Amendments to Australian Accounting Standards – Presentation of Items of Other Comprehensive Income [AASB 1, 5, 7, 101, 112, 120, 121, 132, 133, 134, 1039 &1049]
This Standard requires to group items presented in other comprehensive income on the basis of whether they are potentially reclassifiable to profit or loss subsequently (reclassification adjustments). The Institute has not yet determined the application or the potential impact of the Standard.
1 Jul 2012
AASB 2011-10
Amendments to Australian Accounting Standards arising from AASB 119 (September 2011) [AASB 1, 8, 101, 124, 134, 1049 & 2011-8 and Interpretation 14]
This Standard makes amendments to other Australian Accounting Standards and Interpretations as a result of issuing AASB 119 in September 2011. There is limited financial impact.
1 Jan 2013
50

Operative for reporting periods beginning on / after
AASB 2011-11
Amendments to AASB 119 (September 2011) arising from Reduced Disclosure Requirements
This Standard gives effect to Australian Accounting Standards – Reduced Disclosure Requirements for AASB 119 (September 2011). There is no financial impact.
1 Jul 2013
AASB 2012-1 Amendments to Australian Accounting Standards - Fair Value Measurement - Reduced Disclosure Requirements [AASB 3, 7, 13, 140 & 141] This Standard establishes and amends reduced disclosure requirements for additional and amended disclosures arising from AASB 13 and the consequential amendments implemented through AASB 2011-8. There is no financial impact.
1 Jul 2013
AASB 2012-2 Amendments to Australian Accounting Standards – Disclosures – Offsetting Financial Assets and Financial Liabilities [AASB 7 & 132] This Standard amends the required disclosures in AASB 7 to include information that will enable users of an entity‟s financial statements to evaluate the effect or potential effect of netting arrangements, including rights of set-off associated with the entity‟s recognised financial assets and recognised financial liabilities, on the entity‟s financial position. The Standard was issued in June 2012. The Institute has not yet determined the application or the potential impact of the Standard.
1 Jan 2013
AASB 2012-3 Amendments to Australian Accounting Standards – Offsetting Financial Assets and Financial Liabilities [AASB 132] This Standard adds application guidance to AASB 132 to address inconsistencies identified in applying some of the offsetting criteria, including clarifying the meaning of “currently has a legally enforceable right of set-off” and that some gross settlement systems may be considered equivalent to net settlement. The Standard was issued in June 2012. The Institute has not yet determined the application or the potential impact of the Standard.
1 Jan 2014
51
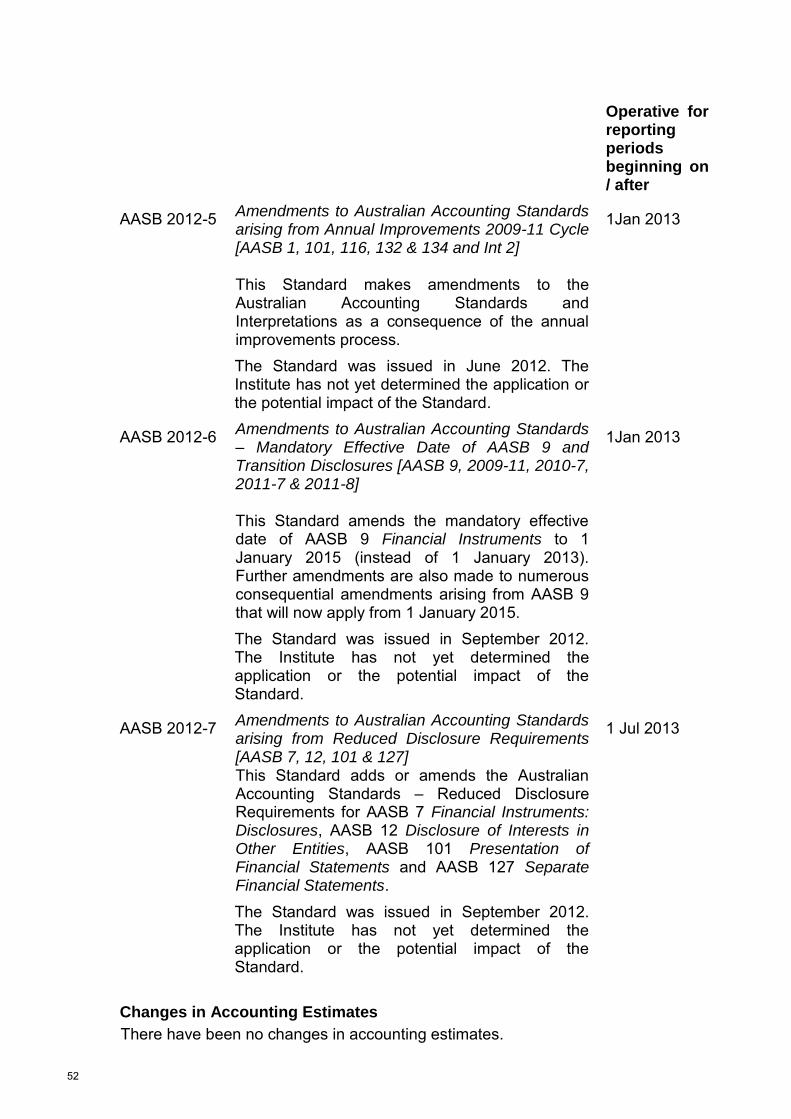
Operative for reporting periods beginning on / after
AASB 2012-5 Amendments to Australian Accounting Standards arising from Annual Improvements 2009-11 Cycle [AASB 1, 101, 116, 132 & 134 and Int 2] This Standard makes amendments to the Australian Accounting Standards and Interpretations as a consequence of the annual improvements process. The Standard was issued in June 2012. The Institute has not yet determined the application or the potential impact of the Standard.
1Jan 2013
AASB 2012-6 Amendments to Australian Accounting Standards – Mandatory Effective Date of AASB 9 and Transition Disclosures [AASB 9, 2009-11, 2010-7, 2011-7 & 2011-8] This Standard amends the mandatory effective date of AASB 9 Financial Instruments to 1 January 2015 (instead of 1 January 2013). Further amendments are also made to numerous consequential amendments arising from AASB 9 that will now apply from 1 January 2015. The Standard was issued in September 2012. The Institute has not yet determined the application or the potential impact of the Standard.
1Jan 2013
AASB 2012-7 Amendments to Australian Accounting Standards arising from Reduced Disclosure Requirements [AASB 7, 12, 101 & 127] This Standard adds or amends the Australian Accounting Standards – Reduced Disclosure Requirements for AASB 7 Financial Instruments: Disclosures, AASB 12 Disclosure of Interests in Other Entities, AASB 101 Presentation of Financial Statements and AASB 127 Separate Financial Statements. The Standard was issued in September 2012. The Institute has not yet determined the application or the potential impact of the Standard.
1 Jul 2013
Changes in Accounting Estimates
There have been no changes in accounting estimates.
52

Pilbara Institute
NOTES TO THE FINANCIAL STATEMENTS
FOR THE YEAR ENDED 31 DECEMBER 2012
2012 2011
$ $
6 Employee benefits expense
Wages and salaries (a) 31,039,233 27,105,635 Superannuation - defined contribution plans (b) 2,746,914 1,480,446
33,786,147 28,586,082
7 Supplies and services
Consumables and minor equipment 1,090,378 1,289,391 Communication expenses 198,335 196,788 Utilities expenses 1,512,749 1,087,678 Consultancies and contracted services 3,401,294 3,619,468 Minor works 1,349,107 1,715,003 Repairs and maintenance 118,439 269,694 Operating lease and hire charges 662,840 854,603 Travel and passenger transport 574,864 776,164 Advertising and public relations 150,652 161,311 Supplies and services - other 650,159 638,446
9,708,818 10,608,547
8 Depreciation and amortisation expense
Depreciation
Buildings 3,601,147 3,339,739 Motor vehicles, caravans and trailers 137,313 178,485 Plant, furniture and general equipment 322,556 268,934 Computers and communication network 198,448 206,150 Marine craft 2,393 3,226 Total depreciation 4,261,856 3,996,534
Amortisation
Software 1,593 - Total amortisation 1,593 -
Total depreciation and amortisation 4,263,449 3,996,534
(a) (i) Includes the value of the fringe benefit to the employees plus the fringe benefits tax component, leave entitlements including superannuation contribution component. (ii) Includes GROH rent contributions recouped from staff against the GROH rental expense.(b) Defined contribution plans include West State, and Gold State and GESBS and other eligible funds.
Employment on-costs expenses, such as workers' compensation insurance, are included at note 10 'Other expenses'. Employment on-costs liability is included at note 29 'Provisions'.
53

Pilbara Institute
NOTES TO THE FINANCIAL STATEMENTS
FOR THE YEAR ENDED 31 DECEMBER 2012
2012 2011
$ $
9 Finance costs
Interest paid to WA Treasury Corporation 31,051 27,318 Finance costs expensed 31,051 27,318
10 Other expenses
Building maintenance 443,149 532,795 Doubtful debts expense 403,041 112,049 Employment on-costs (a) 1,627,342 1,285,353 Student prizes and awards 15,825 125 Losses and write-offs 5,491 804 Interest on arrears of superannuation guarantee payments 169,438 - Other (b) 8,580 111,182
2,672,868 2,042,308
11 Fee for service
Fee for service - general 2,304,795 2,044,386 Fee for service - Department of Training and Workforce Development 66,181 -
Fee for service - Government (other than Department of Training and Workforce Development) 3,000 6,082 International division fees 55,586 56,219
2,429,563 2,106,686
12 Student fees and charges
Tuition fees 848,019 1,000,127 Resource fees 558,972 735,924 Other college fees 107,448 189,244
1,514,440 1,925,296
13 Ancillary trading
Live works (not a trading activity) 11,151 10,336 Pindan College - 104,252 Other ancillary revenue 536 22,080
11,688 136,668
Finance costs include borrowing costs. AASB 123.5 defines borrowing costs as interest and other costs incurred by an entity in connection with the borrowing of funds, including finance charges associated with AASB 117 finance leases (AASB 123.6(d)). Other finance costs would include discounting expense incurred under AASB 5.17 and AASB 137.60. AASB 119 requires the discounting of employee benefits to be recognised in the nature of the expense rather than separately as a finance cost. See also AASB 7, AASB 102 and AASB 141 and related information at note 10 ‘Other expenses’ and note 29 ‘Provisions’.
(a) Employment on-costs - Includes workers' compensation insurance and payroll tax. The on-costs liability associated with the recognition of annual and long service leave liability is included at note 29 'Provisions'. Superannuation contributions accrued as part of the provision for leave are employee benefits and are not included in employment on-costs.(b) Includes: refunds of unspent funds for specific projects and Occupational Safety and Health costs
54

Pilbara Institute
NOTES TO THE FINANCIAL STATEMENTS
FOR THE YEAR ENDED 31 DECEMBER 2012
2012 2011
$ $
14 Trading profit/(loss)
(a) Bookshop:Sales 27,629 33,489 Cost of sales: Opening inventory (36,441) (10,287) Purchases (12,358) (10,439) Adjustments to inventory 6,196 (32,540)
(42,604) (53,265) Inventory write off 2,867 804 Closing inventory 18,465 36,441 Cost of goods sold (21,272) (16,021) Trading profit/(loss) - Bookshop 6,356 17,469
(b) Other tradingSales - Theatre / Cafeteria 443 138,199 Sales - Video Conferencing and other goods and services 3,140 7,401 Trading profit/(loss) - Other trading 3,584 145,600
Total sales 31,212 179,090
See note 2(n) 'Inventories' and note 21 'Inventories'.
15 Commonwealth grants and contributions
Commonwealth specific purpose grants and contributions - 12,190,000 - 12,190,000
These grants relates to the Pundulmurra Campus Education Investment Funding $12,190,000 received in 2011
16 Interest revenue
Interest revenue (Commonwealth Bank Trading and Business On Line Accounts) 927,541 707,512 927,541 707,512
17 Other revenue
Bookshop inventory adjustments - 32,540 Chevron Gorgon Project - Indigenous Trades Training - 61,851 Donations revenue 22,879 - Expense recoveries 1,153 10,209 Insurance recovery 20,079 176,718 Library 12,389 14,730 Local Government Grants and Contributions (Theatre and Community Libraries) 107,412 533,458 Ngarda Civil Mining 20,254 - Other direct grants and subsidy revenue - 18,209 Pindan College 54,639 363,838 Pundulmurra Village (Facilities Income) 860,446 579,244 Rental and facilities fees 578,046 664,019 Shire of Roebourne & Pilbara Iron Early Learning Scholarship Program 68,511 - Walkington Theatre - 46,028 Woodside Sponsorship - Karratha Electrical & Instrumentation Centre 1,000,000 342,300 Miscellaneous revenue 101,215 230,063
2,847,024 3,073,207
55

Pilbara Institute
NOTES TO THE FINANCIAL STATEMENTS
FOR THE YEAR ENDED 31 DECEMBER 2012
2012 2011
$ $
18 Net gain/(loss) on disposal of non-current assets
Proceeds from disposal of non-current assetsMotor vehicles, caravans and trailers 21,364 12,500 Plant, furniture and general equipment 17,426 - Total proceeds from disposal of non-current assets 38,790 12,500
Costs of disposal of non-current assetsPlant, furniture and general equipment (21,415) - Computers and communication network - (1,320) Total cost of disposal of non-current assets (21,415) (1,320)
Net gain/(loss) 17,375 11,180
See note note 24 ‘Property, plant and equipment’.
19 Income from State Government
Appropriation received during the yearService appropriation (a) (State funds received from Department of Training and Workforce Development):
Delivery and Performance Agreement (DPA) 33,759,209 31,345,568 Superannuation (arrears and interest on Superannuation guarantee for 2012) 857,915 1,390,142 Other recurrent funds 4,459 485,667 Non Cash Grant 433,238 800,299 Total State funds 35,054,821 34,021,676
Resources received free of charge(c) :Determined on the basis of the following estimates provided by agencies :
Department of Training and Workforce Development- Corporate systems support 471,210 237,515 - Human resources, and industrial relations support 16,950 14,216 - Other 158,629 94,202 Total resources received free of charge 646,789 345,933
Royalties for Regions Fund:
- Regional Infrastructure & Headworks Account (d) - Capital and Maintenance upgrades 94,000 - - Regional Community Services Account (d) - Employee District Allowances 4,894,500 -
Total royalties for regions fund 4,988,500 -
Total income from State Government 40,690,110 34,367,609
(b) Discretionary transfers of assets (including grants) between State Government agencies are reported as assets assumed/(transferred) under Income from State Government. Non discretionary non reciprocal transfers of net assets (ie. restructuring of administrative arrangements) designated as Contributions by Owners (CBOs) under TI 955 and are recognised directly to equity.(c) Assets or services received free of charge or for nominal cost are recognised as revenue at the fair value of the assets and/or the fair value of those services that can be reliably measured and which would have been purchased if they were not donated. Contribution of assets or services in the nature of contributions by owners are recognised directly to equity.(d) This is a sub-fund within the over-arching ‘Royalties for Regions Fund’. The recurrent funds are committed to projects and programs in WA regional areas.
(a) Service appropriations fund the net cost of services delivered. Appropriation revenue comprises a cash component and a receivable (asset). The receivable (holding account) comprises the budgeted depreciation expense for the year and any agreed increase in leave liability during the year.
56

Pilbara Institute
NOTES TO THE FINANCIAL STATEMENTS
FOR THE YEAR ENDED 31 DECEMBER 2012
2012 2011
$ $
20 Restricted cash and cash equivalents
CurrentSpecific capital funding under Pundulmurra Education Investment Funding 4,604,563 11,807,261 27th Pay - Restricted Cash 475,495 397,564 Total Restricted Cash and cash equivalents 5,080,058 12,204,825
21 Inventories
Inventories held for resale:Bookshop (at cost) 18,465 36,441 Less: Provision for obsolete stock - -
Total 18,465 36,441
See also note 2(n) 'Inventories' and note 14 'Trading profit/(loss)'.
22 Receivables
CurrentReceivables - trade 1,225,111 1,366,167 Receivables - Woodside Sponsorship funding 1,000,000 342,150 Receivables - students 103,279 162,029 Accrued revenue 1,163,008 545,626 Allowance for impairment of receivables (405,678) (138,716) GST receivable 112,977 74,014 Total receivables 3,198,698 2,351,270
Reconciliation of changes in the allowance for impairment of receivables:
Balance at start of year 138,716 70,574 Doubtful debts expense 403,041 112,049 Amount written off during the year (136,898) (44,104) Amount recovered during the year 819 197 Balance at end of year 405,678 138,716
The Institute does not hold any collateral or other credit enhancements as security for receivables.See also note 2(o) 'Receivables' and note 37 'Financial instruments'.
23 Other assets
CurrentPrepayments 426,527 352,734 Other current assets (b) 61,817 104,103 Total current 488,344 456,836
Other current assets consist of Apprentice travel
57
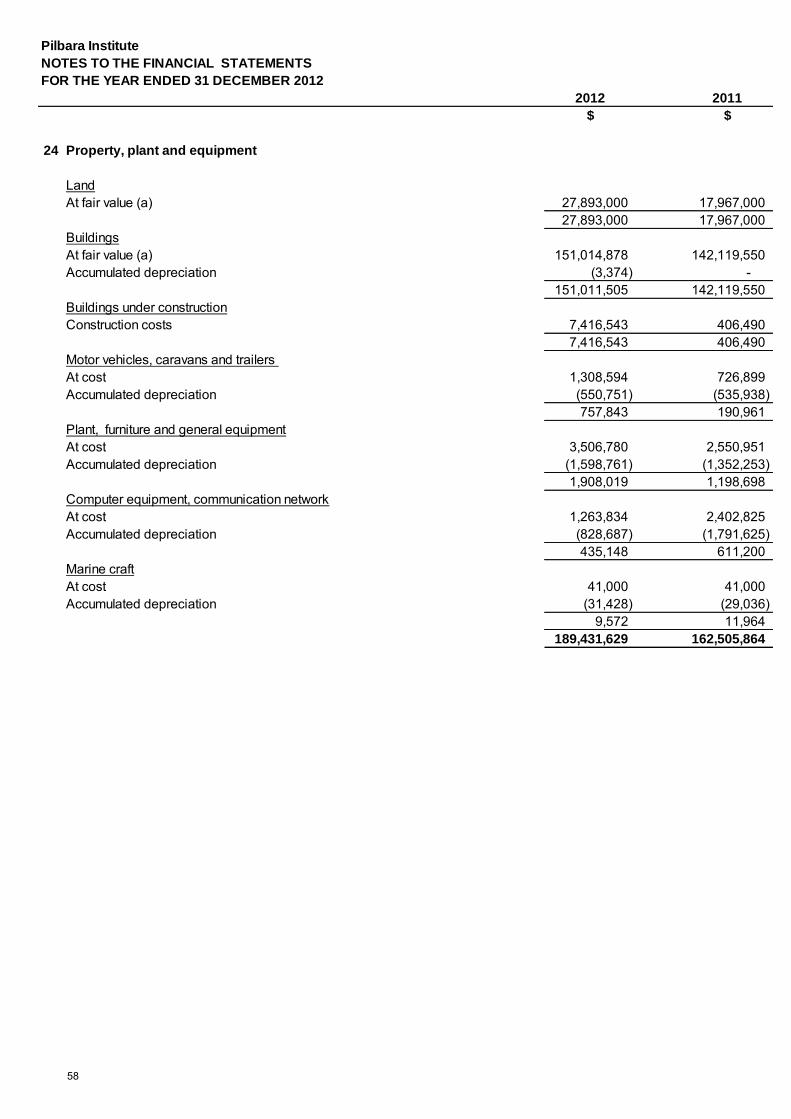
Pilbara Institute
NOTES TO THE FINANCIAL STATEMENTS
FOR THE YEAR ENDED 31 DECEMBER 2012
2012 2011
$ $
24 Property, plant and equipment
LandAt fair value (a) 27,893,000 17,967,000
27,893,000 17,967,000 BuildingsAt fair value (a) 151,014,878 142,119,550 Accumulated depreciation (3,374) -
151,011,505 142,119,550 Buildings under constructionConstruction costs 7,416,543 406,490
7,416,543 406,490 Motor vehicles, caravans and trailers At cost 1,308,594 726,899 Accumulated depreciation (550,751) (535,938)
757,843 190,961 Plant, furniture and general equipmentAt cost 3,506,780 2,550,951 Accumulated depreciation (1,598,761) (1,352,253)
1,908,019 1,198,698 Computer equipment, communication networkAt cost 1,263,834 2,402,825 Accumulated depreciation (828,687) (1,791,625)
435,148 611,200 Marine craftAt cost 41,000 41,000 Accumulated depreciation (31,428) (29,036)
9,572 11,964 189,431,629 162,505,864
58

(a) Land and buildings were revalued as at 1 July 2012 by the Western Australian Land Information Authority (Valuation Services).
Land Buildings
Buildings under
construction
Motor vehicles, caravans
and trailers
Plant, furniture
and general equipment
Computer equipment,
communication network
Marine craft Total
2012 $ $ $ $ $ $ $ $
Carrying amount at start of year 17,967,000 142,119,550 406,490 190,961 1,198,698 611,200 11,964 162,505,863
Additions - 192,878 7,010,053 704,195 1,055,916 28,851 - 8,991,892
Cost Adjustment - 9,080 - - - (6,455) - 2,625
Transfers - 2,382,685 - - - - - 2,382,685
Disposals - - - (122,500) (92,814) (1,161,386) - (1,376,701)
Write-off of assets - - - (7,273) - - (7,273)
Revaluation increments/(decrements) 9,926,000 9,908,459 - - - - - 19,834,459
Depreciation Write Back on Disposal - - - 122,500 71,399 1,161,386 - 1,355,286
Depreciation Write Back on Write-Offs - - - - 4,649 - - 4,649
Depreciation - (3,601,147) - (137,313) (322,556) (198,448) (2,393) (4,261,856)
Carrying amount at end of period 27,893,000 151,011,505 7,416,543 757,843 1,908,018 435,148 9,572 189,431,629
The valuations were performed during the year ended 31 December 2012 and recognised at 31 December 2012. Fair value of all land and buildings was determined by reference to market values. See note 2(g) 'Property, plant and equipment'.
Reconciliations of the carrying amounts of property, plant and equipment at the beginning and end of the reporting period are set out in the table below.
59

Land Buildings
Buildings under
construction
Motor vehicles, caravans
and trailers
Plant, furniture
and general equipment
Computer equipment,
communication network
Marine craft Total
2011 $ $ $ $ $ $ $ $
Carrying amount at start of year 19,217,000 133,589,550 - 347,196 1,149,185 674,946 15,191 154,993,068
Cost Adjustment - - - - (18,000) - - (18,000)
Additions - - 406,490 22,250 336,446 142,404 - 907,590
Disposals - - - (103,500) - - - (103,500)
Revaluation increments/(decrements) (a) (1,250,000) 11,869,739 - - - - - 10,619,739
Depreciation Write Back on Disposal - - - 103,500 - - - 103,500
Depreciation expense - (3,339,739) - (178,485) (268,934) (206,150) (3,226) (3,996,534)
Carrying amount at end of period 17,967,000 142,119,550 406,490 190,961 1,198,698 611,200 11,964 162,505,863
(a) Recognised in the Statement of Comprehensive Income. Where an asset measured at cost is written down to recoverable amount, an impairment loss is recognised in the Statement of Comprehensive Income. Where an previously revalued asset is written down to recoverable amount, the loss is recognised as a revaluation decrement in the Statement of Changes in Equity.
60

Pilbara Institute
NOTES TO THE FINANCIAL STATEMENTS
FOR THE YEAR ENDED 31 DECEMBER 2012
2012 2011
$ $
25 Intangible assets
Computer softwareAt cost 392,992 365,221 Accumulated amortisation (366,814) (365,221)
26,178 -
Computer softwareCarrying amount at start of period - - Additions 27,771 - Amortisation expense (1,593) - Carrying amount at end of period 26,178 -
26 Impairment of assets
27 Payables
Current Accrued expenses 1,500,123 821,060 Accrued salaries and related costs 1,721,726 1,022,782 Paid parental leave payable 12,342 - Total current 3,234,191 1,843,842
See also note 2(p) 'Payables' and note 37 'Financial Instruments'.
28 Borrowings
CurrentBorrowings from WA Treasury Corporation - 73,548 Total current - 73,548
Non-currentWATC/Bank borrowings - 350,779 Total non-current - 350,779
The Walkington Theatre building is considered impaired as at 31 December 2011 (refer note 2(i) Impairment of assets, for more information). An impairment amount of $9m was recognised in equity (2011), as this building had previously been revalued.
The Institute held no goodwill or intangible assets with an indefinite useful life during the reporting period. At the end of the reporting period there were no intangible assets not yet available for use.All surplus assets as at 31 December 2012 have either been classified as assets held for sale or written off.
29 Provisions
CurrentEmployee benefits provision
Annual leave (a) 1,457,972 1,454,686 Long service leave (b) 1,285,124 1,113,689 Superannuation 217,710 208,117 Deferred Salary Scheme ( c) 154,038 107,290
3,114,844 2,883,781 Other provisions
Employment on-costs (d) 190,238 172,458 190,238 172,458
Total current 3,305,082 3,056,239
61

Pilbara Institute
NOTES TO THE FINANCIAL STATEMENTS
FOR THE YEAR ENDED 31 DECEMBER 2012
2012 2011
$ $
Non-currentEmployee benefits provision
Long service leave (b) 718,677 841,387 Superannuation 60,357 73,929
779,034 915,316 Other provisions
Employment on-costs (d) 50,034 58,855 Total non-current 829,068 974,171
Within 12 months of the end of the reporting period (2011 figure restated to reflect correct settlement of the liabilities) 1,466,309 1,333,647 More than 12 months after the end of the reporting period 49,982 179,226
1,516,291 1,512,873
Within 12 months of the end of the reporting period 421,383 479,461 More than 12 months after the end of the reporting period 1,727,278 1,623,842
2,148,661 2,103,303
Within 12 months of the end of the reporting period 81,089 - More than 12 months after the end of the reporting period 72,949 107,290
154,038 107,290
(a) Annual leave liabilities have been classified as current as there is no unconditional right to defer settlement for at least 12 months after the end of the reporting period. Assessments indicate that actual settlement of the liabilities will occur as follows:
(b) Long service leave liabilities have been classified as current where there is no unconditional right to defer settlement for at least 12 months after the end of the reporting period. Assessments indicate that actual settlement of the liabilities will occur as follows:
(c) Deferred salary scheme liabilities have been classified as current where there is no unconditional right to defer settlement for at least 12 months after the end of the reporting period. Actual settlement of the liabilities is expected to occur as follows(2011 figure restated to reflect correct settlement of the liabilities):
(d) The settlement of annual and long service leave liabilities gives rise to the payment of employment on-costs including workers' compensation insurance. The provision is the present value of expected future payments. The associated expense, apart from the unwinding of the discount (finance cost), is disclosed in note 10 'Other expenses'.
Movements in other provisions
Movements in each class of provisions during the financial year, other than employee benefits, are set out below.
Employment on-cost provisionCarrying amount at start of period 231,313 213,830 Additional provisions recognised 8,959 17,483 Carrying amount at end of period 240,272 231,313
30 Other liabilities
Current Income received in advance (a) 43,538 18,964 Grants and advances (DPA Clawback provision) (a) 1,105,903 185,478 Money/deposits held in trust 16,752 16,752 Other 10,441 15,695 Total current 1,176,635 236,889
(a) Income received in advance comprises:Department of Training and Workforce Development - Invalid Enrolments 1,105,903 185,478 Student fees and charges 43,538 18,964
1,149,442 204,442
62
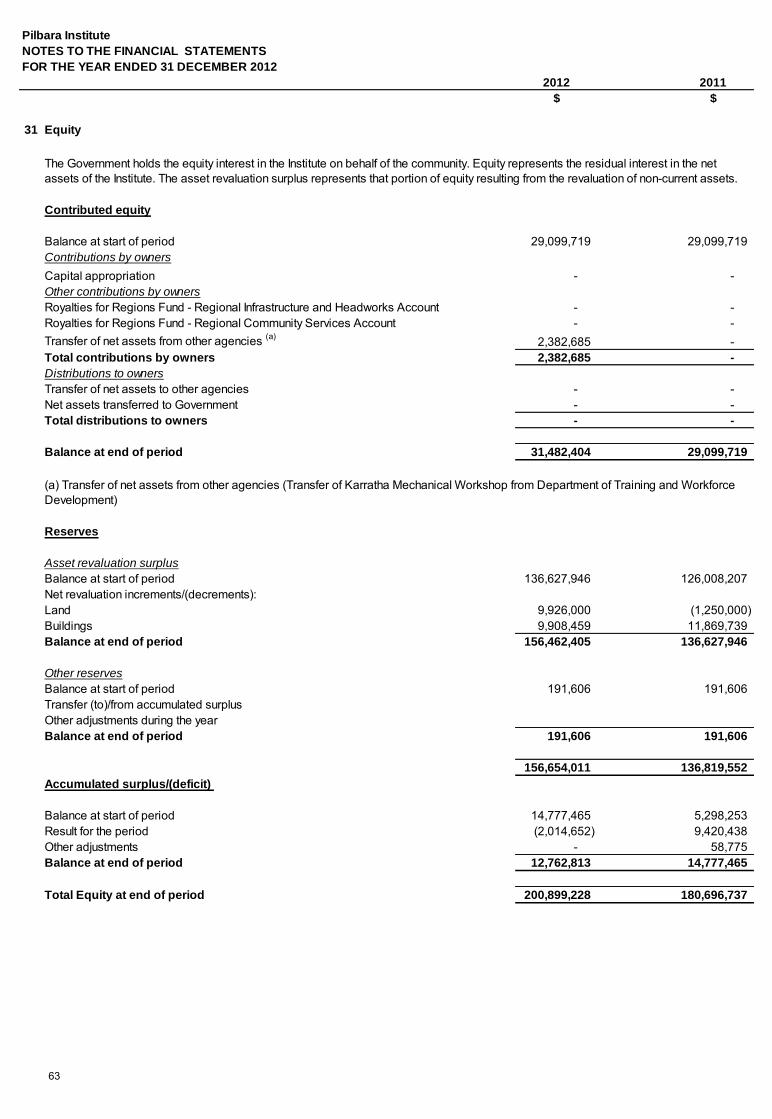
Pilbara Institute
NOTES TO THE FINANCIAL STATEMENTS
FOR THE YEAR ENDED 31 DECEMBER 2012
2012 2011
$ $
31 Equity
Contributed equity
Balance at start of period 29,099,719 29,099,719 Contributions by owners
Capital appropriation - - Other contributions by owners
Royalties for Regions Fund - Regional Infrastructure and Headworks Account - - Royalties for Regions Fund - Regional Community Services Account - - Transfer of net assets from other agencies (a) 2,382,685 - Total contributions by owners 2,382,685 -
Distributions to owners
Transfer of net assets to other agencies - - Net assets transferred to Government - - Total distributions to owners - -
Balance at end of period 31,482,404 29,099,719
Reserves
Asset revaluation surplus
Balance at start of period 136,627,946 126,008,207 Net revaluation increments/(decrements):Land 9,926,000 (1,250,000) Buildings 9,908,459 11,869,739 Balance at end of period 156,462,405 136,627,946
Other reserves
Balance at start of period 191,606 191,606 Transfer (to)/from accumulated surplusOther adjustments during the yearBalance at end of period 191,606 191,606
156,654,011 136,819,552
Accumulated surplus/(deficit)
Balance at start of period 14,777,465 5,298,253 Result for the period (2,014,652) 9,420,438 Other adjustments - 58,775 Balance at end of period 12,762,813 14,777,465
Total Equity at end of period 200,899,228 180,696,737
The Government holds the equity interest in the Institute on behalf of the community. Equity represents the residual interest in the net assets of the Institute. The asset revaluation surplus represents that portion of equity resulting from the revaluation of non-current assets.
(a) Transfer of net assets from other agencies (Transfer of Karratha Mechanical Workshop from Department of Training and Workforce Development)
63

Pilbara Institute
NOTES TO THE FINANCIAL STATEMENTS
FOR THE YEAR ENDED 31 DECEMBER 2012
2012 2011
$ $
32 Notes to the Statement of Cash Flows
Reconciliation of cash
Cash on hand 4,040 4,530 Cash at bank 11,196,793 9,672,439
11,200,833 9,676,969 Restricted cash and cash equivalents (refer to note 20 'Restricted cash and cash equivalents') 5,080,058 12,204,825
16,280,891 21,881,794
Reconciliation of net cost of services to net cash flows provided by/(used in) operating activities
Net cost of services (42,704,762) (24,947,171) Non-cash items:Depreciation and amortisation expense (note 8 'Depreciation and amortisation expense) 4,263,449 3,996,534 Doubtful debts expense (note 10 ‘Other expenses’) 403,041 112,049 Superannuation expense - 1,390,142 Resources received free of charge (note 19 ‘Income from State Government’) 646,789 345,933 Net (gain)/loss on sale of property, plant and equipment (note 18 ‘Net gain/(loss) on sale of non-current assets’) (17,375) (11,180) Losses and write-offs (excludes cash shortages/thefts of money) (note 10 ‘Other expenses’) 5,491 804 Prior year errors - 58,777 FBT expense offset from GST refunds 237,119 158,996 Non Cash Grant from DTWD (note 19 ‘Income from State Government’) 433,238 800,299 (Increase)/decrease in assets:Current receivables (a) (594,123) (837,599) Current inventories 15,110 (26,958) Prepayments (73,793) (102,385) Other current assets 282,818 (8,881) Increase/(decrease) in liabilitiesCurrent payables (a) 808,239 858,271 Current provisions 248,843 216,991 Other current liabilities 19,320 (7,930) Non-current provisions (145,103) 343,239 Net GST receipts/(payments) (b) (237,119) (158,996) Change in GST in receivables/payables (c) (38,963) 45,509 Net cash provided by/(used in) operating activities (36,447,781) (17,773,557)
(b) This is the net GST paid/received, i.e. cash transactions(c) This reverses out the GST in receivables and payables
33 Commitments
The commitments below are inclusive of GST where relevant.
Non-cancellable operating lease commitmentsCommitments for minimum lease payments are payable as follows:Within 1 year 220,731 336,125
Later than 1 year and not later than 5 years 115,999 170,578
Later than 5 years - -
336,730 506,703
Cash at the end of the financial year, as shown in the Statement of Cash Flows is reconciled to the related items in the Statement of Financial Position as follows:
(a) Note that the Australian Taxation Office (ATO) receivable/payable in respect of GST and the receivable/payable in respect of the sale/purchase of non-current assets are not included in these items as they do not form part of the reconciling items.
64

Pilbara Institute
NOTES TO THE FINANCIAL STATEMENTS
FOR THE YEAR ENDED 31 DECEMBER 2012
2012 2011
$ $
34 Contingent liabilities and contingent assets
Contingent liabilitiesThe following contingent liabilities are additional to the liabilities included in the financial statements:
Contaminated sites
Contingent assetsAs at the reporting date the Institute has no contingent assets.
35 Events occurring after the reporting period
There are no significant events occuring after balance sheet date that materially impact the financial statements.
36 Explanatory statement
Significant variances between estimated and actual result for the financial year 2012
2012 2012Estimate Actual Variation
$ $ $Income
Student fees and charges 2,212,559 1,514,440 698,119 Sales 242,573 31,212 211,361 Commonwealth grants and contributions 5,190,000 - 5,190,000 Other revenue 3,121,000 2,847,024 273,976 Service appropriation 34,426,640 35,054,821 (628,181) Royalties for Regions Fund - 4,988,500 (4,988,500) Expense
Employee benefits expense 28,686,648 33,786,147 (5,099,499) Supplies and services 10,326,108 9,708,818 617,290 Depreciation and amortisation expense 3,980,223 4,263,449 (283,226) Other expenses 7,408,280 2,672,868 4,735,412
Student fees and charges
SalesBudget included income from Theatre operations which ceased earlier than planned in December 2011Commonwealth Grants and Contributions
Other revenue
Under the Contaminated Sites Act 2003, the Institute is required to report known and suspected contaminated sites to the Department of Environment and Conservation (DEC). In accordance with the Act, DEC classifies these sites on the basis of the risk to human health, the environment and environmental values. Where sites are classified as contaminated - remediation required or possibly contaminated - investigation required, the Institute may have a liability in respect of investigation or remediation expenses.
Government asbestos guidelines state that any building or building product manufactured prior to 1987 should be treated as containing the asbestos product. Under this determination, the Institute deems that all of its sites would need to be reasonably suspected of containing asbestos. Sites that are confirmed as being suspected of containing asbestos include Roebourne, Pundulmurra, Pannawonica and Onslow.
This statement provides details of any significant variations between estimates and actual results for 2012 and between actual results for 2011 and 2012. Significant variations are considered to be those greater than $200,000.
Budget was based on delivery of higher SCH of 820,000 which was later on reduced to 800,000 SCH as the Institute was unable to deliver the higher SCH
Budget was based on $7m to be received in 2011 and $5,190m to be received in 2012, however the full funding amount of $12,190m received in 2011
Higher revenue due to receipt of donation/sponsorship funding received from Woodside and Chevron, higher revenue received from Pundulmurra Village
65

Pilbara Institute
NOTES TO THE FINANCIAL STATEMENTS
FOR THE YEAR ENDED 31 DECEMBER 2012
2012 2011
$ $
Service Appropriation
Royalties for Regions Fund
Employee expenses
Higher employment costs due toa) Increase in Government Regional Officers' Housing rental expensesb) Increase in District Allowances
Supplies and services
Depreciation
Higher depreciation due to revaluation of buildings by Landgate in December 2011
Other expenses
Significant variances between actual results for 2011 and 2012
2012 2011 Variance$ $ $
Income
Fee for service 2,429,563 2,106,686 322,877 Student fees and charges 1,514,440 1,925,296 (410,856) Commonwealth grants and contributions - 12,190,000 (12,190,000) Interest revenue 927,541 707,512 220,030 Other revenue 2,847,024 3,073,207 (226,184) Expense
Employee benefits expense 33,786,147 28,586,082 5,200,066 Supplies and services 9,708,818 10,608,547 (899,729) Depreciation and amortisation expense 4,263,449 3,996,534 266,915 Other expenses 2,672,868 2,042,308 630,560
Fee for Service
Student Fees and ChargesReduced revenue due to non achievement of SCH in 2012Commonwealth Grants and ContributionsPundulmurra Education Investment Funding of $12,190,000 received in 2011Interest revenueHigher interest due to a) change in funding model from fortnightly to quarterly in advance resulting in higher bank balances.b) interest on Pundulmurra Education Investment Funding ($12,190,000)Other revenuea) reduced rental and facilities fees received in 2012 b) insurance claim received in 2011c) reduced revenue received from Pindan College as a result of cessation of agreement in December 2011d) reduced Local Government grants and contributions due to the closure of the Walkington Theatre because of moulde) reduced revenue from Theatre operations due to the closure of the Walkington Theatre because of mouldf) increase in sponsorship revenue from Woodside for the Karratha Electrical & Instrumentation CentreEmployee expenses
Higher employment costs due to
a) Increase in Government Regional Officers' Housing rental expensesb) Increase in District Allowancesc) Increase in Superannuation contributions due to arrears and interest of Superannuation on allowances
Lower costs due to change in the treatment of Pundulmurra Education Investment project from recurrent to capital works in progress
Higher appropriation due to increase in Government Regional Officers' Housing funding and increase in award rates for 2012
Change in funding for District Allowances which are now funded by Royalties for Regions Funds as well as significant increases in District Allowances effective 1 July 2011 but finalised and paid in January 2012
Budget was based on delivery of higher SCH of 820,000 which was later on reduced to 800,000 SCH as the Institute was unable to deliver the higher SCH
Increased revenue due to growth in commercial services delivery, Competitive Allocated Training revenue received from DTWD and increase in examination supervision revenue.
66

Pilbara Institute
NOTES TO THE FINANCIAL STATEMENTS
FOR THE YEAR ENDED 31 DECEMBER 2012
2012 2011
$ $
Supplies and servicesLower supplies and services costs due toa) Testing and remediation costs of mould at Karratha, South Hedland and Pundulmurra Campuses in 2011 b) Reduced staff and non staff travel expenses in 2012c) Reduced student materials due to achievement of lower SCH in 2012d) Reduced contracted lecturing services in 2012DepreciationIncrease in depreciation due to revaluation of Buildings in December 2011Other expenses
37 Financial instruments
(a) Financial risk management objectives and policies
Credit risk
Liquidity risk
Market risk
(b) Categories of financial instruments
2012 2011
$ $
Financial AssetsCash and cash equivalent 11,200,833 9,676,969 Restricted cash and cash equivalent 5,080,058 12,204,825 Receivables (a) 3,085,720 2,277,256 Financial LiabilitiesPayables 3,234,191 1,843,842 WATC/bank borrowings - 424,328
(a) The amount of loans and receivables excludes GST recoverable from the ATO (statutory receivable).
In addition to cash and bank overdraft, the carrying amounts of each of the following categories of financial assets and financial liabilities at the end of the reporting period are :
Financial instruments held by the Institute are cash and cash equivalents, restricted cash and cash equivalents, borrowings, receivables and payables. The Institute has limited exposure to financial risks. The Institute's overall risk management program focuses on managing the risk identified below:
Credit risk arises when there is the possibility of the Institute’s receivables defaulting on their contractual obligations resulting in financial loss to the Institute. The maximum exposure to credit risk at the end of the reporting period in relation to each class of recognised financial assets is the gross carrying amount of those assets inclusive of any allowance for impairment as shown in the table at note 37(c) ‘Financial instruments disclosures’ and note 22 ‘Receivables’. Credit risk associated with the Institute’s financial assets is minimal because the Institute trades only with recognised, creditworthy third parties. The Institute has policies in place to ensure that sales of products and services are made to customers with an appropriate credit history. In addition,receivable balances are monitored on an ongoing basis with the result that the Institute's exposure to bad debt is minimal. At the end of the reporting period there are no significant concentrations of credit risk.
Market risk is the risk that changes in market prices such as foreign exchange rates and interest rates will affect the Institute's income or the value of its holdings of financial instruments. the Institute is not exposed to interest rate risk because the majority of cash and cash equivalents and restricted cash arerates relates primarily to the long-term debt obligations. All borrowings are due to the Western Australian Treasury Corporation (WATC)equity securities or commodity prices changes). The Institute's exposure to market risk for changes in interestThe Institute does not trade in foreign currency and is not materially exposed to other price risks (for example, and have been repaid in 2012. Other than as detailed in the Interest rate sensitivity analysis table at Note 37(c), non-interest bearing and it has no borrowings in 2012.
Increase due to increase in doubful debt expense, employment on-costs and interest on arrears of superannuation guarantee payments
Liquidity risk arises when the Institute is unable to meet its financial obligations as they fall due. The Institute is exposed to liquidity risk through its trading in the normal course of business. The Institute has appropriate procedures to manage cash flows including drawdowns of appropriations by monitoring forecast cash flows to ensure that sufficient funds are available to meet its commitments.
67
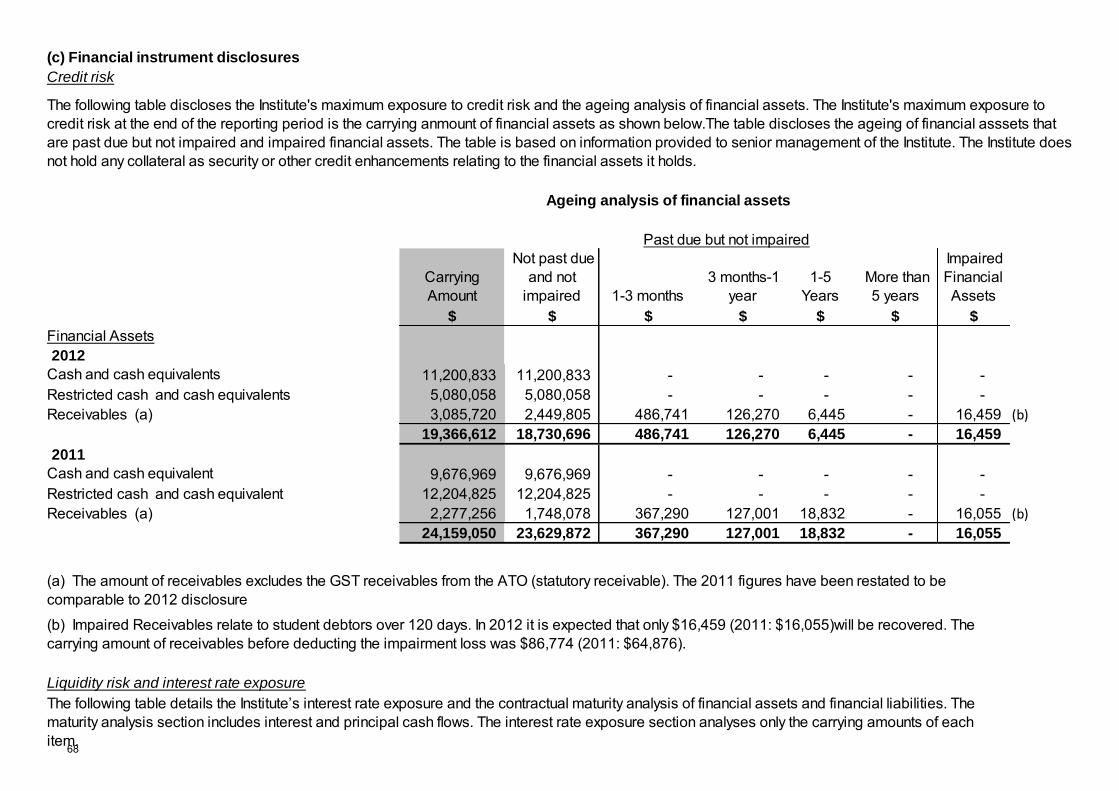
(c) Financial instrument disclosures
Credit risk
Carrying Amount
Not past due and not
impaired 1-3 months 3 months-1
year 1-5
Years More than
5 years
Impaired Financial Assets
$ $ $ $ $ $ $
Financial Assets2012
Cash and cash equivalents 11,200,833 11,200,833 - - - - - Restricted cash and cash equivalents 5,080,058 5,080,058 - - - - - Receivables (a) 3,085,720 2,449,805 486,741 126,270 6,445 - 16,459 (b)
19,366,612 18,730,696 486,741 126,270 6,445 - 16,459
2011
Cash and cash equivalent 9,676,969 9,676,969 - - - - - Restricted cash and cash equivalent 12,204,825 12,204,825 - - - - - Receivables (a) 2,277,256 1,748,078 367,290 127,001 18,832 - 16,055 (b)
24,159,050 23,629,872 367,290 127,001 18,832 - 16,055
Liquidity risk and interest rate exposure
The following table discloses the Institute's maximum exposure to credit risk and the ageing analysis of financial assets. The Institute's maximum exposure to credit risk at the end of the reporting period is the carrying anmount of financial assets as shown below.The table discloses the ageing of financial asssets that are past due but not impaired and impaired financial assets. The table is based on information provided to senior management of the Institute. The Institute does not hold any collateral as security or other credit enhancements relating to the financial assets it holds.
Ageing analysis of financial assets
Past due but not impaired
(a) The amount of receivables excludes the GST receivables from the ATO (statutory receivable). The 2011 figures have been restated to be comparable to 2012 disclosure
(b) Impaired Receivables relate to student debtors over 120 days. In 2012 it is expected that only $16,459 (2011: $16,055)will be recovered. The carrying amount of receivables before deducting the impairment loss was $86,774 (2011: $64,876).
The following table details the Institute’s interest rate exposure and the contractual maturity analysis of financial assets and financial liabilities. The maturity analysis section includes interest and principal cash flows. The interest rate exposure section analyses only the carrying amounts of each item.68

Interest rate exposure and maturity analysis of financial assets and financial liabilities
Weighted Average Effective
Interest RateCarrying Amount
Fixed Interest Rate
Variable Interest Rate
Non-Interest Bearing
Nominal Amount
Up to 1 month
1-3 months
3 months-1 year 1-5 Years
More than 5 years
% $ $ $ $ $ $ $ $ $ $
2012
Financial AssetsCash and cash equivalent 3.00% 11,200,833 - 11,200,833 - - - - - - - Restricted cash and cash equivalent - 27th Pay - Restricted Cash 3.00% 475,495 - 475,495 - - - - - - - Pudulmurra Education Investment Funding3.00% 4,604,563 - 4,604,563 - - - - - - - Receivables (a) 3,085,720 - - 3,085,720 - 2,449,805 486,741 141,712 7,463 -
19,366,612 - 16,280,891 3,085,720 - 2,449,805 486,741 141,712 7,463 -
Financial LiabilitiesPayables 3,234,191 - - 3,234,191 - 3,234,191 - - - - WATC/Bank borrowings - - - - - - - - - -
3,234,191 - - 3,234,191 - 3,234,191 - - - -
(a) The amount of receivables excludes the GST receivables from the ATO (statutory receivable).
Weighted Average Effective
Interest RateCarrying Amount
Fixed Interest Rate
Variable Interest Rate
Non-Interest Bearing
Nominal Amount
Up to 1 month
1-3 months
3 months-1 year 1-5 years
More than 5 years
% $ $ $ $ $ $ $ $ $ $
2011
Financial AssetsCash and cash equivalent 4.20% 9,676,969 - 9,676,969 - - - - - - - Restricted cash and cash equivalent - - - - - - 27th Pay - Restricted Cash 4.20% 397,564 - 397,564 - Pudulmurra Education Investment Funding4.75% 11,807,261 - 11,807,261 - Receivables (a) 2,277,256 - - 2,277,256 - 1,748,078 367,290 143,577 18,311 -
24,159,050 - 21,881,794 2,277,256 - 1,748,078 367,290 143,577 18,311 -
Financial LiabilitiesPayables 1,843,842 - - 1,843,842 - 1,843,842 - - - - WATC/Bank borrowings 5.61% 424,328 - 424,328 - - 38,346 43,366 108,607 196,989 37,020
2,268,169 - 424,328 1,843,842 - 1,882,188 43,366 108,607 196,989 37,020
(a) The amount of receivables excludes the GST receivables from the ATO (statutory receivable). The 2011 figures have been restated to be comparable to 2012 disclosure
Maturity dates
Interest rate exposure Maturity dates
Interest rate exposure
69

Pilbara Institute
NOTES TO THE FINANCIAL STATEMENTS
FOR THE YEAR ENDED 31 DECEMBER 2012
2012 2011
$ $
Interest rate sensitivity analysis
Carrying amount Surplus Equity Surplus Equity
2012 $ $ $ $ $
Financial AssetsCash and cash equivalent 11,200,833 (112,008) (112,008) 112,008 112,008 Restricted cash and cash equivalent 5,080,058 (50,801) (50,801) 50,801 50,801
Financial LiabilitiesWATC/bank borrowings - - - - - Payables 3,234,191 32,342 32,342 (32,342) (32,342) Total Increase/(Decrease) 13,046,700 (130,467) (130,467) 130,467 130,467
Carrying amount Surplus Equity Surplus Equity
2011 $ $ $ $ $
Financial AssetsCash and cash equivalent 9,676,969 (96,770) (96,770) 96,770 96,770 Restricted cash and cash equivalent 12,204,825 (122,048) (122,048) 122,048 122,048
Financial LiabilitiesWATC/bank borrowings 424,328 4,243 4,243 (4,243) (4,243) Payables 1,843,842 18,438 18,438 (18,438) (18,438) Total Increase/(Decrease) 19,613,625 (196,136) (196,136) 196,136 196,136
Fair values
38 Remuneration of members of the Institute and senior officers
$ 2012 2011
$0 - $10,000 12 9 $300,001 - $310,000 0 1 $320,001 - $330,000 1 0
$ $
Cash remuneration received in relation to 2012 241,955 213,775 Annual leave and long service leave accruals (a) 10,999 15,196 Other benefits 71,745 74,007 The total remuneration of the members of the Institute 324,699 302,978
Total remuneration includes the superannuation expense incurred by the Institute in respect of members of the Institute.
The following table represents a summary of the interest rate sensitivity of the Institute's financial assets and liabilities at the end of the reporting period on the surplus for the period and equity for a 1% change in interest rates. It is assumed that the change in interest rates is held constant throughout the reporting period.
All financial assets and liabilities recognised in the Statement of Financial Position, whether they are carried at cost or fair value, are recognised at amounts that represent a reasonable approximation of fair value unless otherwise stated in the applicable notes.
The number of members of the Institute whose total of fees, salaries, superannuation, non-monetary benefits and other benefits for thefinancial year, fall within the following bands are:
- 100 Basis Points + 100 Basis Points
Remuneration of members of the Institute
- 100 Basis Points + 100 Basis Points
70

Pilbara Institute
NOTES TO THE FINANCIAL STATEMENTS
FOR THE YEAR ENDED 31 DECEMBER 2012
2012 2011
$ $
Remuneration of senior officers
2012 2011
$$40,001 - $50,000 *1 0$50,001 - $60,000 0 *1
$150,001 - $160,000 *1 *1$180,001 - $190,000 0 1$230,001 - $240,000 2 1$240,001 - $250,000 0 1$310,001 - $320,000 1 0$320,001 - $330,000 1 0$380,001 - $390,000 1 0
$ $
Cash remuneration received in relation to 2012 1,216,632 567,124 Annual leave and long service leave accruals (a) (35,333) 349 Other benefits 512,061 309,847 The total remuneration of senior officers 1,693,359 877,320
* Includes senior officers where periods of service are less than 12 months.
(a) To comply with TI952:
No senior officers are members of the Pension Scheme.
39 Remuneration of auditor
Remuneration payable to the Auditor General in respect to the audit for the current financial year is as follows:
2012 2011
$ $
Auditing the accounts, financial statements and performance indicators 69,000 65,500
The expense is included in note 10 'Other expenses'.
40 Related bodies
The Institute has no related bodies.
41 Affiliated bodies
The Institute has no affiliated bodies.
The total remuneration includes the superannuation expense incurred by the Institute in respect of senior officers other than senior officers reported as members of the Institute for.
(i) 2011 disclosure for this note has been restated to include annual & long service leave accruals, Government Regional Officers' Housing costs and Fringe Benefits in the calculation of total remuneration of members and senior officers of the Institute (ii) The members and senior officers of the Institute have been reclassified to include the Managing Director and Executive Directors only, 2011 disclosure has been restated accordingly
The number of senior officers other than senior officers reported as members of the Institute, whose total of fees, salaries,superannuation, non-monetary benefits and other benefits for the financial year, fall within the following bands are:
71

Pilbara Institute
NOTES TO THE FINANCIAL STATEMENTS
FOR THE YEAR ENDED 31 DECEMBER 2012
2012 2011
$ $
42 Supplementary financial information
2012 2011
Write-Offs $ $
Public property (a) 2,625 - Bad debts 136,898 44,104 Inventory 2,867 804
142,389 44,908
(a) Walkington Theatre Amplifier stolen
43 Schedule of income and expenditure by service
The Institute provides only one service (as defined by Treasurer's Instruction 1101 (9)) and that is Vocational Education and Training Delivery.
72

ANNUAL ESTIMATES
In accordance with Treasurer’s Instruction 953, the annual estimates for the 2013 year are hereby included in the 2012 Annual Report. These estimates do not form part of the 2012 financial statements and are not subject to audit.
73

PILBARA INSTITUTE
S40 SUBMISSION
Statement of Comprehensive Income
2013
Estimate
$
COST OF SERVICES
Expenses
Employee benefits expense 32,104,808Supplies and services 8,794,913Depreciation and amortisation expense 4,731,039Cost of sales 21,256Other expenses 2,302,488
Total Cost of Services 47,954,505
Income
Revenue
Fee for service 2,227,945Student charges and fees 1,875,716Ancillary trading 7,056Sales 35,845Interest revenue 238,000Other revenue 1,713,642
Total Revenue 6,098,203
NET COST OF SERVICES (41,856,302)
INCOME FROM STATE GOVERNMENT
State funds 35,087,431Resources received free of charge 354,285Royalties for regions 4,973,234Total income from State Government 40,414,949
TOTAL COMPREHENSIVE INCOME FOR THE PERIOD (1,441,352)
74

PILBARA INSTITUTE
S40 SUBMISSION
BALANCE SHEET
2013
Estimate
$
ASSETS
Current Assets
Cash and cash equivalents 9,420,806Restricted cash and cash equivalents 499,987Inventories 37,321Receivables 2,314,345Other current assets 467,866Total Current Assets 12,740,325
Non-Current Assets
Property, plant and equipment 174,432,031Total Non-Current Assets 174,432,031
TOTAL ASSETS 187,172,356
LIABILITIES
Current Liabilities
Payables 1,895,434Provisions 3,289,736Other current liabilities 242,204Total Current Liabilities 5,427,374
Non-Current Liabilities
Provisions 1,048,598Total Non-Current Liabilities 1,048,598
TOTAL LIABILITIES 6,475,971
NET ASSETS 180,696,384
EQUITY
Contributed Equity 31,482,404Reserves 136,819,552Accumulated surplus/(deficiency) 12,394,428
TOTAL EQUITY 180,696,384
75

PILBARA INSTITUTE
S40 SUBMISSION
CHANGES IN EQUITY STATEMENT
2013
Estimate
$
Balance of equity at start of period 182,137,736
CONTRIBUTED EQUITY
Balance at start of period 31,482,404Capital contribution 0Other contributions by owners 0Distributions to owners 0Balance at end of period 31,482,404
RESERVES
Asset Revaluation Reserve
Balance at start of period 136,819,552Changes in accounting policy or correction of prior period errors 0Restated balance at start of period 136,819,552Gains/(losses) from asset revaluation 0Balance at end of period 136,819,552
ACCUMULATED SURPLUS (RETAINED EARNINGS)
Balance at start of period 13,835,780Changes in accounting policy or correction of prior period errors 0Restated balance at start of period 13,835,780Surplus/(deficit) or profit/(loss) for the period (1,441,352)Gains/(losses) recognised directly in equity 0Balance at end of period 12,394,428
0
Balance of equity at end of period 180,696,384
Total income and expense for the period (1,441,352)
76

PILBARA INSTITUTE
S40 SUBMISSION
CASH FLOW STATEMENT
2013
Estimate
$
CASH FLOWS FROM STATE GOVERNMENT
State funds 35,087,431Royalties for regions 4,973,234Net cash provided by State Government 40,060,665
Utilised as follows:
CASH FLOWS FROM OPERATING ACTIVITIES
Payments
Employee benefits (31,937,949)Supplies and services (8,766,974)GST payments on purchases (1,149,276)Other payments (1,971,892)
Receipts
Fee for service 2,247,599Student fees and charges 1,877,091Ancillary trading 7,056Interest received 238,000GST receipts on sales 64,024GST receipts from taxation authority 722,462Other receipts 2,153,514
Net cash provided by/(used in) operating activities (36,516,345)
CASH FLOWS FROM INVESTING ACTIVITIES
Purchase of non-current physical assets (6,122,155)
Net cash provided by/(used in) investing activities (6,122,155)
Net increase/(decrease) in cash held and cash equivalents (2,577,836)
Cash and cash equivalents at the beginning of the period 12,498,628
CASH AND CASH EQUIVALENTS AT THE END OF THE PERIOD 9,920,793
77

PILBARA INSTITUTE
KEY PERFORMANCE INDICATORSFOR THE
YEAR ENDED 31 DECEMBER 2012
78

PILBARA INSTITUTE
KEY PERFORMANCE INDICATORS
FOR THE YEAR ENDED 31 December 2012
We hereby certify that the performance indicators are based on proper records, are
relevant and appropriate for assisting users to assess the Pilbara Institute’s
performance, and fairly represent the performance of the Pilbara Institute for the
financial year ended 31 December 2012
Nicole Roocke 7 March 2013
Chairperson, Governing Council
Pilbara Institute
Lyn Farrell
Managing Director 7 March 2013
Member, Governing Council
Pilbara Institute
Esnart Nyemba 7 March 2013
Chief Finance Officer
Pilbara Institute
79

PILBARA INSTITUTE DETAILED KEY PERFORMANCE INDICATORS INFORMATION 2012
EFFECTIVENESS INDICATORS
The effectiveness indicators measure the achievement of vocational education and
training in meeting community and industry needs via student and graduate
satisfaction, labour force status of graduates and profile achievement.
STUDENT SATISFACTION SURVEY
The 2012 Student Satisfaction Survey was administered on behalf of the Department
of Training and Workforce Development by Patterson Market Research. The key
focus was to attain an understanding of students’ training requirements and to
measure the quality of the delivery of training and services provided by Pilbara
Institute. The survey was distributed via direct mail to a random sample of students
who had undertaken training, either in the first or second semester of the
corresponding reference period. The option to complete the survey on‐online or via
the use of computer assisted telephone interviewing was also provided.
STUDENT SATISFACTION RATING: EFFECTIVENESS INDICATOR
The overall student satisfaction rating expresses the number of 'satisfied' and 'very
satisfied' respondents. The results provide an overall expression of how satisfied
students are with various services provided by the Institute. The table below
represent the result using the new method of calculating the data.
Table 1
2008 2009 2010 2011 2012
Target 2012
Pilbara Institute 86.7% 86.1% 83.6% 89.9% >85.0% 85.1%* Western Australia 86.2% 85.4% 86.3% 88.2% 86.3% Notes: Source: Patterson Market Research (2012) Student Satisfaction Survey. Derivation: Confidence interval is ± 3.5% and a confidence level of 95%. Total population of 1,537 with a sample size of 314 students. Comments: In 2012 a new weighting system has been implemented compared to past annual reports. The figures from 2008 have been restated in line with the new weighting. The new weighting method uses the students’ age, gender and training provider to weight the data to representative proportions.
80

STUDENT OUTCOMES SURVEY
The Student Outcomes Survey is conducted on behalf of National Centre for
Vocational Education Research (NCVER) by I‐view Pty Ltd every two years. The aim
of the survey is to measure vocational education and training students' employment,
further study and the opinions of the training undertaken. Every two years,
questionnaires are sent to a stratified (field of education, sex and age), randomly
selected sample of Pilbara Institute graduates, who have successfully completed a
qualification in the previous reporting period.
The graduate achievement is a key performance indicator that measures the extent
to which Pilbara Institute Graduates have wholly or partly achieved their main reason
for undertaking the course.
Table 2
2009 2011
Pilbara Institute
92.9% 93.3%
Western Australia
87.1% 87.5%
Australia
85.9% 85.7%
Notes: Comments: This is a biennial survey and 2012 was not a collection year. The Student Outcomes Survey covers students who have an Australian address as their usual address and are awarded a qualification (graduates), or who successfully complete part of a course and then leave the VET system (module completers). The scope of the survey is for Commonwealth, State funded and fee for service funding types. Students who undertake recreational, leisure or personal enrichment (short) courses are excluded. This scope has been in place since 2005. Prior to 2005, information was only collected from students undertaking Commonwealth/State funded programs.
81

GRADUATES IN EMPLOYMENT
This particular KPI involves the proportion of graduates in employment,
demonstrating the extent to which the Institute is providing relevant quality training
that improves student employability. The performance indicator shows the proportion
of graduates responding to the NCVER Student Outcomes Survey who were in paid
employment as at 25th May, the year following graduation.
Table 3
2009 2011
Pilbara Institute
86.7% 92.2%
Western
Australia
78% 79.7%
Australia
77.1% 77.1%
Notes: Comments: This is a biennial survey and 2012 was not a collection year.
82

EFFICIENCY INDICATOR
COST PER STUDENT CURRICULUM HOUR (SCH)
This is a measure of the extent to which the Institute is able to efficiently use
resources for the delivery of vocational education and training. The overall cost per
SCH is an efficiency measure that shows the aggregate unit cost of delivery output
per SCH based on the delivery costs (Total Cost of Services) as detailed in the
Financial Statements.
Table 4
2008 2009 2010 2011 2012 Target 2012
Pilbara
Institute
$39.49 $40.39 $43.95* $50.65 $54.58** $51.72
Notes: Source: Financial Statements and Institute Management Information System. Derivation: The total delivery cost per SCH is calculated by dividing the total cost of services measured on an accrual basis by the total SCH delivered. The total SCH is the total number of enrolments multiplied by the hourly duration of these modules as registered in the Institute Management Information System in accordance with the Australian Vocational Education and Training Management Information Statistical Standard. Delivery from all funding sources is included. The total cost of services figure is obtained from the Annual Financial Statements. Comments:* The reason for the significant increase in cost per SCH for 2010 is that Building Maintenance funds received through Better INSTITUTE Facilities were received in 2009 but spent in 2010. **The 2012 target was based on a higher profile SCH of 820,000 and lower FFS SCH of 128,222:
83

ACHIEVEMENT OF THE 2012 INSTITUTE PROFILE
Pilbara Institute is resourced to deliver courses under Government-purchased
funding guidelines to meet consumer demand and respond to local community
needs, individual requirements and workforce development plans. This performance
indicator reports the effectiveness of the Institute in meeting Delivery and
Performance Agreement targets.
The diversity of the delivery indicates the extent to which the Institute has met its
strategic training needs as defined in the State Training Profile as well as additional
delivery provided under a fee‐for‐service arrangement.
Table 5
2009 2010 2011 2012 2012 %
WADTE Group Title Actual Actual Actual Planned
Actual Variance%
01B - Visual & Performing Arts
12,670 21,025 13,865 19,215 17,970 -6%
02A - Automotive 22,215 16,192 13,404 16,061 16,982 6%
03A - Building & Construction
124,484 121,619 112,683 108,388 64,737 -40%
04A - Community Service Workers
29,999 22,195 12,728 16,650 10,142 -39%
04B - Education & Childcare
64,194 70,980 89,250 72,295 117,670 63%
04C - Health 18,615 24,041 27,171 45,612 23,440 -49%
05A - Finance Insurance Property Service Workers
3,366 10,532 11,908 11,040 14,219 29%
09A - Engineering & Drafting
18,830 37,825 31,835 36,534 13,489 -63%
09B - Metal & Mining 118,537 123,302 101,363 99,354 105,734 6%
10B - Forestry, Farming & Landcare
6,718 2,301 1,675 5,256 210 -96%
10D - Horticulture 6,632 9,019 11,218 17,040 8,371 -51%
12A - Personal Service 8,687 7,645 9,435 19,261 12,020 -38%
13A - Cooking 12,681 10,884 14,008 6,166 23,583 282%
84

Notes: Comments: Targets have been adjusted and revised throughout the year. Targets
are based on the original DPA for 2012
2009 2010 2011 2012 2012 %
13B - Hospitality 7,968 8,148 9,040 7,586 10,851 43%
13C - Tourism 1,500 420 270 0 0 0%
14A - Transport Trades, Storage & Associated
13,468 13,010 21,250 24,712 8,171 -67%
15B - Electrical Trades 35,364 35,410 33,841 37,440 42,472 13%
16A - Accounting & Other Business Services
11,830 23,635 25,565 17,965 19,520 9%
16B - Management 28,000 36,180 50,775 77,500 55,875 -28%
16C - Office &Clerical 56,135 50,030 54,780 51,890 83,587 61%
17A - Computing 3,350 740 2,445 8,750 1,060 -88%
18A – Science & Technical Workers
18,980 27,290 46,900 55,850 34,500 -38%
19B - Adult Literacy/ESL 43,360 34,525 41,820 39,730 50,875 28%
19E - Targeted Access &Participation Courses
29,404 44,513 35,710 25,750 25,880 1%
Total Profile Delivery 696,987 751461 772,939 820,000
761,358 -7%
Non Profile Delivery 229,013 180,234 177,222 209,814
Institute Total Delivery 926,000 931,695 950,161 971,172
85
Profile Analysis for Pilbara Institute
Definition: The table indicates the quota and actual achievement of SCH in the
profiled Department of Education and Training Industry Group categories. The
classification of these Industry Groups is based on the occupation or outcome the
course is intended to serve, and highlights the Institute’s performance in achieving
industry delivery targets.
Derivation: DPA data represents the actual achievement of SCH in respective years.
Planned data is obtained from the DPA and actual SCH from the Institute Unified
Enrolments System (UE). Non‐profile delivery SCH is the actual SCH count of
enrolments not funded under the DPA in UE. These are Fee‐For‐Service programs
that are delivered to meet local industry and community demands for specialised
training.
Variances in delivery by more than 10% are explained by the following reasons:
1. Demand less than expected (WADT Groups 4A, 09A, 10B, 10D, 12A, 14A,
16B, 17A)
2. Demand greater than expected due to emerging markets (WADT Groups 4B,
5A, 13A, 13B, 15B, 16C, 19B)
3. Delays in attracting suitable new lecturing staff (WADT Groups 4C, 18A)
4. New training package that required resource development prior to delivery
(WADT Group 3A)
Planning for delivery continues to be a challenge in the Pilbara due to the strong
economic drivers and constantly changing market demands.
86

PROFILE ACHIEVEMENT (DPA) of 2012 PROFILE, PLANNED vs ACHIEVED
SCH
This performance indicator shows the percentage of Student Curriculum Hours
(SCH) achieved for activities as contracted with the Department of Training and
Workforce Development for vocational education and training delivery through the
Delivery and Performance Agreement.
Profile Achievement = Actual Delivery and Performance Agreement SCH Target SCH contained within Delivery and Performance Agreement
Table 6
Planned Actual % Achieved
2009
730,910 696,987 95%
2010
730,910* 751,461 103%
2011
730,910* 772,939 106%
2012
820,000 761,358 93%
Notes: Source: Pilbara Institute Delivery and Performance Agreement for planned SCH and Institute Management Information System for Actual SCH Comments: Planned targets are based on the original DPA. Targets have been adjusted and revised throughout the year. In 2012 planned targets were revised on the 2nd addendum from 820,000 SCH to 800,000 SCH Note *: Planned SCH figures for 2010 -2011 have been revised to reflect original DPA targets
87