pieces together - annualreports.co.uk€¦ · 1 financial highlights 2 letter to shareholders 8...
TRANSCRIPT

2 0 0 5 a n n u a l r e p o r t
w e p u t a l l t h e p i e c e s t o g e t h e r

1 f i nancial h i g hl i g hts
2 le t ter to shareh olders
8 oper at i o ns re v i e w
28 board o f d irec tors
30 corp or ate o ff icers
32 f i nancial re v i e w
80 glossary o f ter ms
81 i nvestor i n for m at i o n
table of con t en ts
abo ut the cover
Sonoco has positioned itself as a total solutions provider for consumer
product companies. By “putting all the pieces together” for its customers,
Sonoco is able to offer beginning-to-end packaging supply chain products
and services. The Company’s business model is unique in the packaging
industry and is one of the reasons why 2005 produced one of the strongest
operating performances in Sonoco’s history. Sonoco’s capabilities include
design, development and testing of leading technology packaging; global
graphics management to enhance customers’ brand image; graphics
reproduction including laser engraved cylinders to ensure the highest quality
packaging graphics reproduction; and service centers to provide packing,
fulfillment, purchasing, inventory control and delivery capabilities. Sonoco
also offers its customers a full range of packaging options, including rigid
paper or plastic containers, flexible packaging, metal or plastic ends and
closures and point-of-purchase displays.
Shown on the cover: Whether choosing temporary, semipermanent or perma-
nent displays, Sonoco CorrFlex provides design and engineering innovation
and expertise in managing beginning-to-end complex promotional programs
for retail-focused customers. Point-of-purchase displays and fulfillment are
important pieces of Sonoco’s Total Solutions offering of packaging supply
chain products and services.
s o n o c o 2 0 0 5

FINANCIAL HIGHL IGHTS
Net sales $3,528,574 $3,155,433
Gross profi t1 660,951 574,790
Net income 161,877 151,229
Return on total equity 13.5% 14.2%
Return on net assets2 7.9% 8.3%
Return on net sales 4.6% 4.8%
Approximate number of employees 17,600 17,100
Approximate number of shareholder accounts 46,000 46,000
Per common share:
Net income – basic $ 1.63 $ 1.54
– diluted 1.61 1.53
Cash dividends – common .91 .87
Ending common stock market price 29.40 29.65
Price/earnings ratio 18.26 19.38
COMPARAT IVE H IGHL IGHTS UNAUDITED
($ AND SHARES IN THOUSANDS EXCEPT PER SHARE DATA)
YEARS ENDED DECEMBER 31 2005 2004
NET SALES
(BILL IONS OF DOLLARS)
$4.0
3.0
2.0
1.0
01 02 03 04 05
2.46 2.
70 2.76
3.16
3.53
NET INCOME FROM CONTINUING OPERAT IONS
(MILL IONS OF DOLLARS)
$200
150
100
50
01 02 03 04 05
81.5
125.
5
78.2
151.
2 161.
9
NET INCOME FROM CONTINUING OPERAT IONSPER D I LUTED SHARE
(DOLLARS)
$2.00
1.50
1.00
.50
01 02 03 04 05
.85
1.29
.80
1.53
1.61
STR ATEGIC MISS ION STATEMENT
Sonoco intends to be the low-cost global leader in providing customer-
preferred packaging solutions to selected value-added segments, where we
expect to be either number one or two in market share. Shareholder return,
customer and employee satisfaction, commitment to excellence, integrity,
environmental stewardship and a safe workplace will be the hallmarks of our
culture.
STR ATEGIC OBJECT IVE
To achieve average annual double-digit total return to shareholders, with
returns on capital and equity in the top quartile of the Standard & Poor’s
(S&P) 500 Index.
1 Gross profi t: Net sales minus cost of sales.
2 Return on net assets: Tax-affected earnings before interest and taxes, plus equity in earnings of affi liates, divided by the net of average total assets, minus average cash, minus average current liabilities, plus average short-term debt.
1A N N U A L R E P O R T
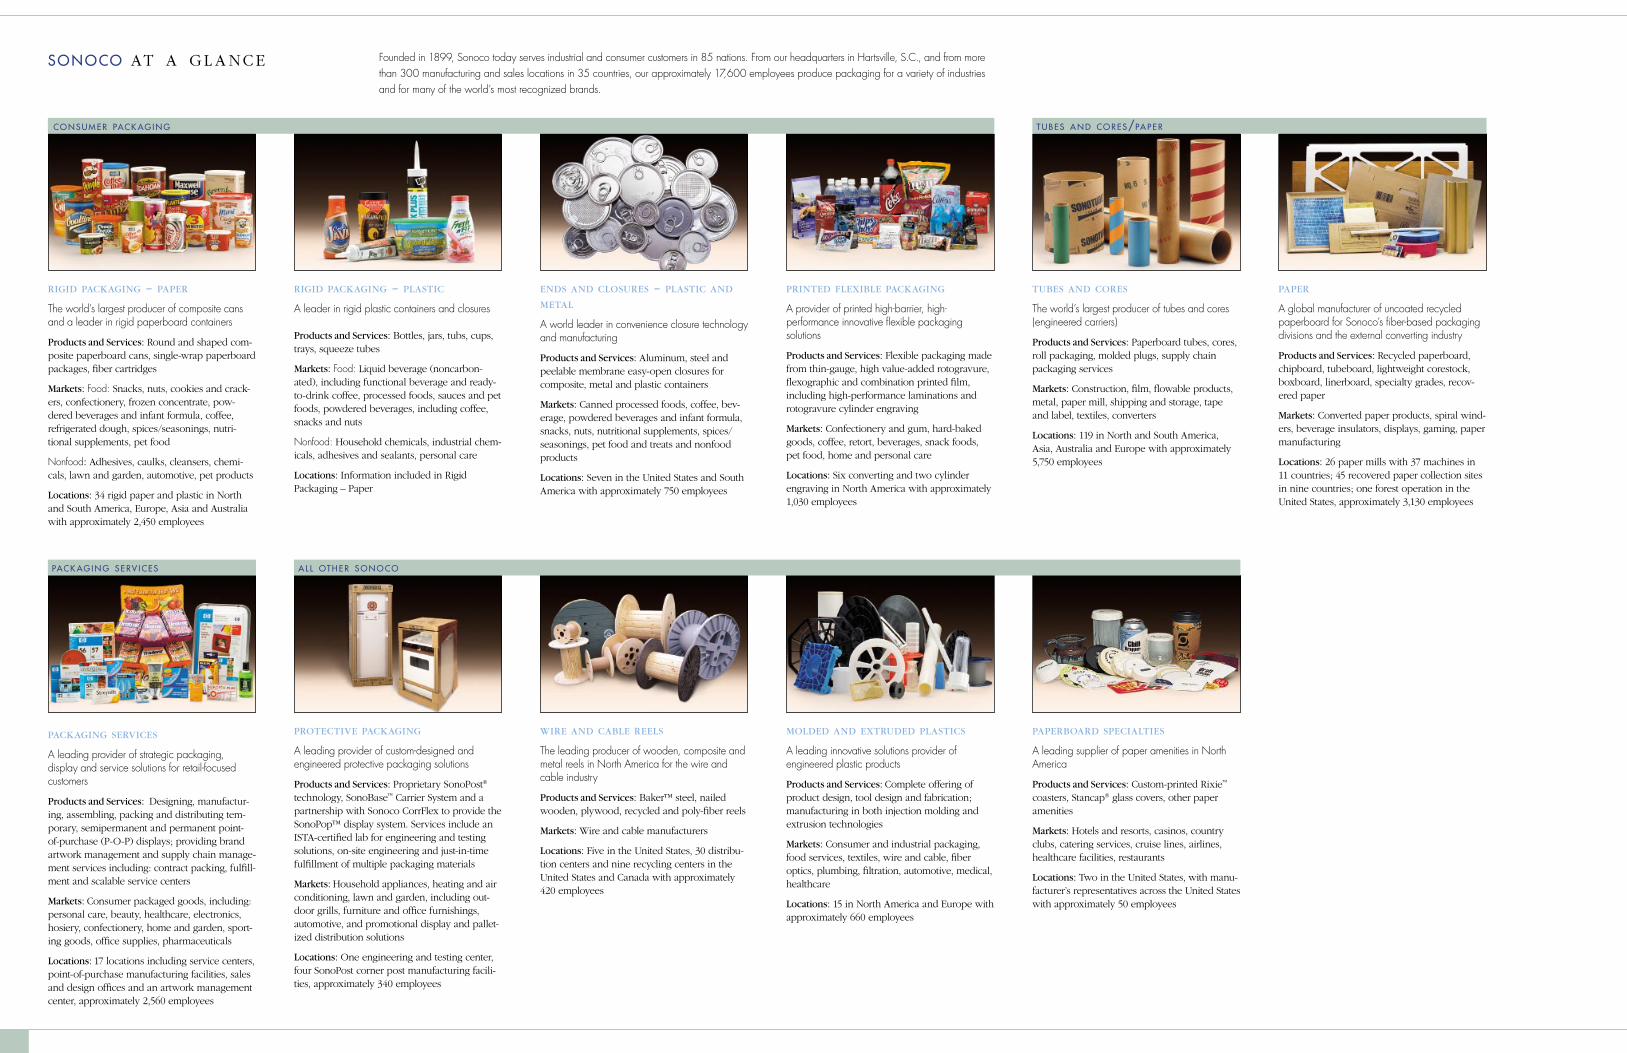
rigid packaging – paper
The world’s largest producer of composite cans and a leader in rigid paperboard containers
Products and Services: Round and shaped com-posite paperboard cans, single-wrap paperboard packages, fiber cartridges
Markets: Food: Snacks, nuts, cookies and crack-ers, confectionery, frozen concentrate, pow-dered beverages and infant formula, coffee, refrigerated dough, spices/seasonings, nutri-tional supplements, pet food
Nonfood: Adhesives, caulks, cleansers, chemi-cals, lawn and garden, automotive, pet products
Locations: 34 rigid paper and plastic in North and South America, Europe, Asia and Australia with approximately 2,450 employees
rigid packaging – plastic
A leader in rigid plastic containers and closures Products and Services: Bottles, jars, tubs, cups, trays, squeeze tubes
Markets: Food: Liquid beverage (noncarbon-ated), including functional beverage and ready-to-drink coffee, processed foods, sauces and pet foods, powdered beverages, including coffee, snacks and nuts
Nonfood: Household chemicals, industrial chem-icals, adhesives and sealants, personal care
Locations: Information included in Rigid Packaging – Paper
ends and closures – plastic and metal
A world leader in convenience closure technology and manufacturing
Products and Services: Aluminum, steel and peelable membrane easy-open closures for composite, metal and plastic containers
Markets: Canned processed foods, coffee, bev-erage, powdered beverages and infant formula, snacks, nuts, nutritional supplements, spices/seasonings, pet food and treats and nonfood products
Locations: Seven in the United States and South America with approximately 750 employees
printed flexible packaging
A provider of printed high-barrier, high- performance innovative flexible packaging solutions
Products and Services: Flexible packaging made from thin-gauge, high value-added rotogravure, flexographic and combination printed film, including high-performance laminations and rotogravure cylinder engraving
Markets: Confectionery and gum, hard-baked goods, coffee, retort, beverages, snack foods, pet food, home and personal care
Locations: Six converting and two cylinder engraving in North America with approximately 1,030 employees
paper
A global manufacturer of uncoated recycled paperboard for Sonoco’s fiber-based packaging divisions and the external converting industry
Products and Services: Recycled paperboard, chipboard, tubeboard, lightweight corestock, boxboard, linerboard, specialty grades, recov-ered paper
Markets: Converted paper products, spiral wind-ers, beverage insulators, displays, gaming, paper manufacturing
Locations: 26 paper mills with 37 machines in 11 countries; 45 recovered paper collection sites in nine countries; one forest operation in the United States, approximately 3,130 employees
tubes and cores
The world’s largest producer of tubes and cores (engineered carriers)
Products and Services: Paperboard tubes, cores, roll packaging, molded plugs, supply chain packaging services
Markets: Construction, film, flowable products, metal, paper mill, shipping and storage, tape and label, textiles, converters
Locations: 119 in North and South America, Asia, Australia and Europe with approximately 5,750 employees
paperboard specialties
A leading supplier of paper amenities in North America
Products and Services: Custom-printed Rixie™ coasters, Stancap® glass covers, other paper amenities
Markets: Hotels and resorts, casinos, country clubs, catering services, cruise lines, airlines, healthcare facilities, restaurants
Locations: Two in the United States, with manu-facturer’s representatives across the United States with approximately 50 employees
wire and cable reels
The leading producer of wooden, composite and metal reels in North America for the wire and cable industry
Products and Services: Baker™ steel, nailed wooden, plywood, recycled and poly-fiber reels
Markets: Wire and cable manufacturers
Locations: Five in the United States, 30 distribu-tion centers and nine recycling centers in the United States and Canada with approximately 420 employees
molded and extruded plastics
A leading innovative solutions provider of engineered plastic products
Products and Services: Complete offering of product design, tool design and fabrication; manufacturing in both injection molding and extrusion technologies
Markets: Consumer and industrial packaging, food services, textiles, wire and cable, fiber optics, plumbing, filtration, automotive, medical, healthcare
Locations: 15 in North America and Europe with approximately 660 employees
packaging services
A leading provider of strategic packaging, display and service solutions for retail-focused customers
Products and Services: Designing, manufactur-ing, assembling, packing and distributing tem-porary, semipermanent and permanent point- of-purchase (P-O-P) displays; providing brand artwork management and supply chain manage-ment services including: contract packing, fulfill-ment and scalable service centers
Markets: Consumer packaged goods, including: personal care, beauty, healthcare, electronics, hosiery, confectionery, home and garden, sport-ing goods, office supplies, pharmaceuticals
Locations: 17 locations including service centers, point-of-purchase manufacturing facilities, sales and design offices and an artwork management center, approximately 2,560 employees
protective packaging
A leading provider of custom-designed and engineered protective packaging solutions
Products and Services: Proprietary SonoPost® technology, SonoBase™ Carrier System and a partnership with Sonoco CorrFlex to provide the SonoPop™ display system. Services include an ISTA-certified lab for engineering and testing solutions, on-site engineering and just-in-time fulfillment of multiple packaging materials
Markets: Household appliances, heating and air conditioning, lawn and garden, including out-door grills, furniture and office furnishings, automotive, and promotional display and pallet-ized distribution solutions
Locations: One engineering and testing center, four SonoPost corner post manufacturing facili-ties, approximately 340 employees
sonoco at a gl a nce Founded in 1899, Sonoco today serves industrial and consumer customers in 85 nations. From our headquarters in Hartsville, S.C., and from more than 300 manufacturing and sales locations in 35 countries, our approximately 17,600 employees produce packaging for a variety of industries and for many of the world’s most recognized brands.
t u b es a n d co res/pa per
pack ag i n g serv i ces a l l oth er s o n o co
co n su m er pack ag i n g

TO OUR SHAREHOLDERS
onoco achieved one of its strongest operating performances during 2005. We
realized double-digit sales growth, including increased revenues from new
products; strong operating profi ts; and substantial cash fl ow generation.
Furthermore, we improved margins, increased Companywide volumes and
realized a positive price/cost relationship. At year end, the accumulated ben-
efi t obligation of our United States defi ned benefi t pension plan was fully
funded, and our debt-to-total capital ratio had been reduced to 35.7%.
These accomplishments were attained despite rapidly ris-
ing raw material, energy, freight and labor costs, and con-
tinued weak general economic conditions in Europe.
However, the Company responded to these issues by
implementing timely surcharges for steel and energy plus
general price increases for the majority of its products
serving consumer and industrial markets. Additionally,
we continued to aggressively improve productivity to
help offset infl ationary costs, reduced our global cost
structure with selective plant consolidation and hedged
much of our natural gas requirements to provide more
certainty of costs. Perhaps most gratifying, our Sonoco
family achieved another record year for improved safety
performance.
While we accomplished much in 2005, including further
improving the Company’s ability to sustain sales and
earnings growth, there remain signifi cant opportunities to improve the
Company’s overall performance going forward. These include reducing work-
ing capital, particularly related to inventories; reducing the number of under-
performing plants that adversely impact our margins; providing adequate
capacity to continue growing our fl exible packaging business, such as the
February 2006 acquisition of a Texas rotogravure printing facility; adding
more market differentiating rigid plastic technologies; seeking additional geo-
graphic expansion opportunities for our tubes and cores; and, of course, con-
tinuing to focus on execution and people.
SUMM ARY OF 2005 RESULTS
Earnings per diluted share for 2005 were $1.61, compared with $1.53 for 2004.
Base earnings per diluted share for 2005, a non-GAAP measure that excludes
certain unusual items, were $1.92, versus $1.65 for 2004. (A reconciliation of
base earnings per share to reported earnings per share is provided on page 31.)
Net income for 2005 was $161.9 million, compared with $151.2 million
in 2004. The 2005 results included the following unusual expenses:
$10.1 million in additional tax expense associated with the repatriation of
$124.7 million in foreign earnings under the American Jobs Creation Act of
S
Harris E. DeLoach, Jr.Chairman, President and Chief Executive Offi cer
2 S O N O C O 2 0 0 5

CASH D IV IDENDS PA ID TO SHAREHOLDERS
(DOLLARS PER SHARE)
$1.00
.75
.50
.25
01 02 03 04 05
.80 .8
3 .84 .8
7 .91
2004, $7.6 million (after tax) to increase an environmental reserve and
$13 million (after tax) in previously announced restructuring costs. Net
income for 2004 was negatively impacted by restructuring charges of
approximately $14.4 million (after tax), a $3.6 million (after tax) charge
related to the cost of replacing certain executive life insurance policies and a
$2.9 million (after tax) charge for claims against the Company as a result of
a legal judgment. 2004 net income was positively impacted by $9.3 million
as a result of the recognition of certain tax benefi ts.
Base earnings for 2005 totaled $192.6 million, compared with $162.8 million
for 2004. (A reconciliation of base earnings per share to reported earnings
per share is provided on page 31.) The increase in base earnings for 2005
was primarily due to increased volume in the Consumer Packaging seg-
ment, higher service revenues in the Packaging Services segment, reduced
costs resulting from ongoing productivity and purchasing initiatives and a
favorable price/cost relationship, as well as the full-year impact of the sec-
ond quarter 2004 acquisition of CorrFlex Graphics, LLC (CorrFlex), one of
the largest point-of-purchase and fulfi llment companies in North America.
These increases were partially offset by costs associated with the integration
of the Sonoco-Alcore joint venture, consisting of the European tube, core
and paper operations of Sonoco and Ahlstrom Corporation of Finland;
weaker demand for tubes and cores/paper in Europe and the Americas;
continued weak general economic conditions in Europe; higher energy,
freight and labor costs; and startup costs associated with the Company’s
new rigid plastic container plant in Wisconsin.
Net sales for 2005 were $3.5 billion, up about 12%, versus $3.2 billion for
2004. This increase resulted primarily from higher average prices Company-
wide, foreign currency exchange and increased volume, principally in the
Consumer Packaging and the Packaging Services segments, which included
the CorrFlex acquisition. Volume also benefi ted from the formation of the
Sonoco-Alcore joint venture in Europe.
Sonoco generated $227.4 million in cash from operations during 2005, ver-
sus $252.2 million in 2004. The cash generated from operations for 2005
was used to fund capital expenditures of $129.1 million and to pay divi-
dends of $90.1 million. Debt was reduced by $117.8 million as a result of
cash generated from operations and the use of accumulated cash balances.
Cash generated from operations in 2005 included the impact of $77 million
for funding defi ned benefi t pension plans during 2005, compared with
$33.4 million during 2004.
GENER AL GROW TH STR ATEGY
To help meet our objective of achieving average annual double-digit total
returns, we are employing a three-pronged growth strategy. First, we will
3A N N U A L R E P O R T

continue to effectively manage our capital based on a foundation of signifi -
cant strengths. Our balance sheet is one of the most substantial in the pack-
aging industry. It is buttressed by our historical generation of strong cash
fl ow which has allowed us to reinvest in our businesses, make acquisitions,
fund our pension plans and to pay consecutive dividends since 1925.
Sonoco’s dividends currently have a yield of about double that of the S&P
500 Index. We will continue to focus on effective capital management, with
particular emphasis on working capital during 2006.
A second component of our growth strategy is to aggressively manage the
fundamentals of our business, ranging from operating costs to productivity
improvement. In 2005, the Company initiated the fi nal plant closings associ-
ated with restructuring programs that have yielded approximately $115 million
in cost reductions since 2001. In today’s environment of frequent market and
customer migration from country to country, we will continue to vigilantly
review our global plant structure and alter it as needed to ensure a low-cost
position. We will also continue to emphasize annual productivity improve-
ment with an objective of offsetting general infl ationary factors, such as
wage and medical benefi t increases.
Another important component of managing the fundamentals is our initia-
tive to reverse the historical ratio of sales generated by businesses serving
the industrial and consumer markets of about 55% and 45%, respectively.
Our strong results for 2005 refl ect, in part, the progress made to date by this
initiative, with sales from businesses serving the consumer markets already
reaching virtual parity with those from the industrial sector. While we will
certainly continue to grow our market-leading businesses serving the indus-
trial sector, we expect to grow those serving the faster growing and less
cyclical consumer markets more rapidly.
We believe that by successfully managing the fundamentals, Sonoco can
continue to improve its operating profi t margins toward their more historic
levels. We are progressing toward that objective with such actions as struc-
tural cost reductions; price micromanagement to ensure that pricing truly
refl ects the market; swift implementation of price increases to cover higher
costs; and through continuous improvement in operating execution, with
such actions as Six Sigma, Lean Manufacturing and scrap reduction.
The third prong of our strategy is focused on sustainable and profi table top-
line growth, which has received increased emphasis since 2000. Excluding
divested businesses, our compound average sales growth over the last fi ve
years was 6.7%, compared with just over 4.6% for the prior fi ve years. This
growth has been driven principally by acquisitions and by new product and
market development. (This non-GAAP fi nancial measure is reconciled to
reported sales on page 31.)
CHANGING REVENUE MIX
(PERCENT)
100
75
50
25
01 02 03 04 05
45
55
INDUSTRIAL MARKET RELATED SALES
CONSUMER MARKET RELATED SALES
46
54
45
55
46
54
49
51
4 S O N O C O 2 0 0 5

SALES GROW TH IN IT IAT IVES
We are driving sales with three primary and equally weighted growth ini-
tiatives. One is acquisitions and joint ventures. Additional acquisitions will
most likely be predominately in our fl exible packaging and rigid plastics
operations, though not exclusively. Another is continued geographic expan-
sion in response to customer requirements and as the primary growth
driver for our more mature businesses. The third is providing total solutions
to consumer product companies’ packaging supply chain requirements,
including new products and services.
ACQUIS IT IONS/JOINT VENTURES
We have three criteria for acquisitions: they must not be dilutive to earnings
in their fi rst year, they must meet Sonoco’s cost of capital within three to
four years after completion and they have to be complementary to our
existing businesses. For example, the CorrFlex acquisition, which has
exceeded expectations, was not only accretive in its fi rst year but was also
one of the primary reasons why Sonoco achieved strong operating profi ts
in 2005.
We also view joint ventures as potential growth vehicles. For example, in
November 2004, we completed the Sonoco-Alcore joint venture, the largest
tube and core operation in Europe. Sonoco owns a 64.5% interest. The
joint venture carries put/call provisions that could result in Sonoco acquir-
ing 100% of the operation. A similar arrangement exists with Demolli, the
largest tube and core manufacturer in Italy.
GEOGR APHIC EXPANSION
Another important growth tool is geographic expansion in response to
changing customer and market needs. During 2004, we opened a steel
easy-open closures operation in Brazil for export and to serve the Brazilian
market. Sonoco is also the largest producer of tubes and cores in Brazil.
During late 2004 and 2005, we added three additional tube and core facili-
ties in China, where we are the largest producer of tubes and cores;
acquired a tube and core plant in New Zealand; and a second tube and
core plant commenced operation in Turkey. New packaging Service Centers
were opened in Germany, England and Poland. In February 2006, we
acquired a small tube and core converting operation in western Canada.
And, we are currently reviewing entry opportunities for tubes, cores and
composite cans in India.
TOTAL PACK AGING SOLUT IONS FOR THE CONSUMER M ARKET
The third leg to our top-line strategy is unique to Sonoco. We have posi-
tioned ourselves as a total packaging solutions provider for consumer prod-
uct companies, offering a full range of packaging supply chain products
and services.
CUMULAT IVE TOTAL SHAREHOLDER RETURN
(DOLLARS)
$180
135
90
45
00 01 02 03 04 05
127.
00
113.
21
161.
34
157.
47
126.
40
100.
00
5-YEAR TOTAL = 61.34%
5-YEAR COMPOUND AVERAGE GROWTH RATE (CAGR) = 10.04%
ASSUMES $100 INVESTED IN SONOCO COMMON STOCK ON DEC. 31, 2000, WITH REINVESTMENT OF DIVIDENDS.
5A N N U A L R E P O R T

A major component of our Total Solutions strategy is the development of
new products and services. Since 2000, we have signifi cantly increased
new product and market development, including having doubled the num-
ber of new patent applications and invention disclosures. In 2000, we had
no signifi cant sales from new products. In 2005, we generated sales from
new products alone of about $75 million. Our goal over the next few years
is annual sales from new products in the $100 million to $125 million
range. We defi ne new products as those that have been commercial for
two years or less.
CONCLUSIONS AND OUTLOOK
Sonoco delivered on its key performance initiatives in 2005. The Company
sustained year-over-year quarterly base earnings increases, coupled with
margin improvement and double-digit sales growth. We again generated
strong cash fl ow and aggressively protected it through productivity improve-
ment, cost control and price management. For example, we continued to
effectively hedge the majority of our natural gas needs in the United States
to provide more certainty of energy costs, and we achieved a positive price/
cost relationship during a highly volatile period of rising raw material costs.
Furthermore, during 2005, our balance sheet was bolstered by debt reduc-
tion, thus helping us maintain ample fl exibility to take advantage of growth
opportunities.
We believe the Company’s 2005 results validate our overall growth strategy
and specifi cally our unique Total Solutions initiative for consumer product
companies. The year 2005 may well prove to have been a “breakout” year
for Sonoco’s Consumer Packaging and Packaging Services segments, refl ect-
ing the addition of CorrFlex and volume growth, particularly in fl exible
packaging and ends and closures. Furthermore, our Consumer Packaging
segment has now achieved six consecutive quarters of year-over-year earn-
ings and margin improvement.
Looking ahead, we expect our Consumer Packaging and Packaging Services
segments to provide a strong foundation for continued growth. And, we
expect our Tubes and Cores/Paper segment to continue leading our strong
cash fl ow from operations, which should be in the $300 million range annu-
ally, before any discretionary pension funding, over the next several years.
We plan to use available cash in 2006 to fund capital spending, to reduce
debt, to continue paying dividends as we have done without interruption
since 1925 and to repurchase stock as a means of offsetting options dilution,
when appropriate.
During 2006, we will remain focused on growing our top line and improv-
ing margins by managing productivity and costs within our businesses. The
Company expects base earnings per diluted share for the full-year 2006 to
DEBT TO TOTAL CAP ITAL RAT IO
(PERCENT)
52
39
26
13
01 02 03 04 05
49.3
44.5
36.4
40.7
35.7
6 S O N O C O 2 0 0 5

be at the upper end of the $1.90 to $1.94 range, which includes approxi-
mately $.03 per diluted share related to expensing of stock options; excludes
any restructuring charges, which cannot be estimated at this time; and
assumes no signifi cant changes in volume or pricing.
I have never been more confi dent in our ability to achieve sustainable and
profi table growth. Sonoco has the appropriate strategy and fi nancial
strength to achieve its objective of average annual double-digit total returns.
The key to our success in 2006 and beyond will be our ability to execute
our strategy. That requires us to have the right people in the right jobs.
I believe we have such a team in place today, and we are committed to
continuing to do so.
Sincerely,
HARRIS E. DELOACH, JR.Chairman, President and Chief Executive Offi cer
March 10, 2006
7A N N U A L R E P O R T

OPER ATIONS REV IEW
GAME NIGHT PHOTO
�
Sonoco’s businesses work together to meet the changing market needs of its customers. In response to consumer demand for a sturdier shortening can, Sonoco’s molded plastics team developed a cost-effective alternative to the traditional composite can.
8 S O N O C O 2 0 0 5

Sonoco’s operations consist of three segments, Consumer Packaging, Tubes
and Cores/Paper and Packaging Services. Several smaller businesses are dis-
cussed as All Other Sonoco. While Sonoco’s businesses provide a variety of
products and services, these businesses coordinate their offerings and lever-
age synergies to provide customers beginning-to-end packaging and ser-
vices to meet their supply chain needs. This Total Solutions strategy is
unique in the packaging industry and is one of the reasons why 2005 pro-
duced one of the strongest operating performances in Sonoco’s history.
EXPANDING “ONE SONOCO FACE” To complement the Company’s Total Solutions strategy, Sonoco has
developed and implemented an initiative to build better relationships with
its large global consumer product company customers who are looking for
fewer, larger suppliers to whom they can outsource a greater amount of
their packaging supply chain needs. This “One Sonoco Face” initiative was
expanded in 2005 by offering major consumer product companies the
added benefi t of having a seasoned senior Sonoco executive assigned to
manage their relationship with Sonoco. This centralized account leadership
has the authority to bring to bear all the necessary solutions, along with
expedited decision making, to meet the customer’s packaging requirements.
IMPROVING PRODUCTIV IT Y
To protect cash fl ow and improve margins, Sonoco initiated fi ve plant
closings in the Tubes and Cores/Paper segment and two plant closings
in the Consumer Packaging segment in 2005. The Company’s 2005
restructuring activities were part of a program that began in 2003. These
actions have been focused on reducing the Company’s operating costs
and sizing the business to changing markets. The Company is currently
conducting an in-depth review of its global Tubes and Cores/Paper
operations. This review, expected to be completed by mid-2006, is intended
to examine markets served by the Company (principally textiles, paper and
fi lm) and address issues such as market growth and migration, capacity,
technology and competition. Depending upon the conclusions reached,
a further restructuring of operations may result. In December 2005, the
Company divested its single-plant folding cartons business since it was not
core to the Company’s growth strategy. Sonoco achieved approximately
$77 million in total productivity improvements in 2005. The Company is
also focusing on price micromanagement to improve price recovery in light
of rising energy and raw material costs.
9A N N U A L R E P O R T

CONSUMER PACK AGING SEGMENT
10 S O N O C O 2 0 0 5

T
� Nothing says fresh like cookies, snacks and candy presented in Sonoco packaging. Throw in some cold drinks with Sonoco shrink wrap and you have a formula for fun. Featuring bright colors, metallic inks and a choice of barrier options, Sonoco packages are easy-to-handle, carry and reseal.
he Consumer Packaging segment represents approximately 35% of Sonoco’s
2005 consolidated net sales. The operations in this segment consist of 49
plants throughout the world. This segment develops and produces the pack-
aging for many of the food and nonfood brands that consumers around the
world use daily. Packaging in this
segment includes round and shaped
composite paperboard cans, for
which Sonoco is the global market
leader; single-wrap paperboard con-
tainers; fi ber and plastic cartridges;
rigid plastic containers; and squeeze
tubes. In addition, this segment
includes printed fl exible packaging
made from thin-gauge, high value-
added rotogravure, fl exographic and
combination printed fi lm, including
laminations, and rotogravure cylin-
der engraving. This segment also
includes ends and closures, includ-
ing aluminum, steel, plastic and
peelable membrane easy-open
closures for composite, metal and plastic containers.
Net sales for the Consumer Packaging segment increased approximately
10% in 2005 to $1.25 billion, compared with $1.13 billion in 2004. Sales in
the segment increased due to higher selling prices of closures, composite
cans and plastic packaging. Greater volumes throughout the segment, par-
ticularly in fl exible packaging, also contributed signifi cantly to the sales
increases. In addition, favorable exchange rates helped sales as the dollar
weakened against foreign currencies. Overall, volumes were up nearly
5% in the segment. Domestic sales for the segment were approximately
$894 million, up 7% from 2004, and international sales were approximately
$353 million, up 21% from 2004.
Operating profi ts for the Consumer Packaging segment were $103.5 mil-
lion, compared with $83.1 million in 2004. Operating profi ts in this segment
were favorably impacted by increased volumes as well as productivity and
purchasing initiatives, partially offset by increased costs of energy, freight
and labor. Continued high startup costs at the Company’s rigid plastics con-
tainer plant in Wisconsin also negatively impacted operating profi ts in the
segment. Higher raw material costs, primarily steel and aluminum, were
largely offset by increased selling prices.
RIG ID PAPER PACK AGING
Volume in the Company’s rigid paper packaging business increased
year-over-year due to global customer demand for new single-wrap tapered
canisters and increased preference for composite cans as a cost-effective
alternative to all-metal packaging, due to higher steel and aluminum prices.
�
Add life to your next party with snacks and nuts in Sonoco packag-ing. From the newly introduced extra clear thermoformed plastic containers to rigid paper packages, Sonoco offers a variety of sizes, shapes, colors and opening features designed to meet con-sumers’ demand for convenience.
NET SALESCONSUMER PACKAGING SEGMENT
(BILL IONS OF DOLLARS)
$1.5
1.1
.7
.3
03 04 05
1.04 1.
13 1.25
11A N N U A L R E P O R T

SONOCO’S TOTAL SOLUTIONS OFFERING
Sonoco has positioned itself as a total packaging solutions provider for consumer product companies, offering a full range of packaging supply chain products and services. Sonoco’s Total Solutions strategy incorporates:
Design, Development and Testing – Sonoco scientists, engineers and designers use leading-edge technology at the Company’s Packaging Development Center, in Hartsville,
S.C., to take concepts and turn them into prototype packaging that is thoroughly tested before it goes to market.
Global Graphics Management – Through Sonoco’s proprietary global graphics management system, the Company uses technology to manage and enhance the
reproduction of its customers’ brand image, regardless of medium.
Graphics Reproduction – Sonoco offers its customers laser engraved cylinders to ensure the highest quality packaging graphics reproduction.
Full-range Packaging Options – Whether a customer’s packaging needs are for rigid paper or plastic containers, fl exible packaging, metal or plastic closures or point-of-purchase displays, Sonoco has the capability of providing customers with innovative, market-differentiating products.
Custom Packing and Inventory Control – In addition to developing custom packaging, Sonoco provides “speed to market” by offering packing, fulfi llment, purchasing and inventory control.
Delivery to Marketplace – Sonoco completes its beginning-to-end, Total Solutions offering by providing just-in-time delivery of customers’ packaged products to their distribution centers or directly to retail outlets.
� For the ultimate in on-the-go convenience, Sonoco blow-molded plastic retort bottles are ideal for coffees, dairy and soy-based nutritional beverages, supplements or other drinks. Engi-neered to meet advanced barrier requirements, the multilayer bottles can withstand high process-ing temperatures and are manufactured in custom shapes and sizes.
NEW RIGID PAPER PRODUCTS. Sonoco introduced several market-
differentiating applications of its unique SonoWrap® single-wrap package
design for cookies and snack foods in the United States and Europe in 2005.
Targeting the growing health food market, Sonoco produced a new oval-
shaped, single-wrap canister for the launch of Readifoods’ new fruit and nut
snack mixes —Tesco Temptations—in the United Kingdom.
Sonoco also teamed with Kimberly-Clark de Mexico to develop a new
concept composite cup for Kleenex®
tissues. This low-cost package,
which is available in six distinct
colors, provides a clear market
differentiation on the store shelf
from traditional folding cartons.
In Brazil, Sonoco developed a new
composite can with the Company’s
Sealed Safe® end for a customer’s
powdered milk product. This new
packaging provides a cost-saving
application when compared with the
previous steel can.
12 S O N O C O 2 0 0 5

RIG ID PL AST IC PACK AGING
Sonoco’s new technology driven rigid plastics products continued to
show volume growth in 2005 enhanced by the opening of a new
production facility in Wisconsin. The Company offers a complete line of
rigid plastic products, including injection molding, blow molding,
thermoforming, tube extrusion and sheet extrusion designs to meet
customers changing needs for high-performance packaging.
NEW RIGID PLASTIC PRODUCTS. Sonoco’s material scientists developed
North America’s fi rst round retort bottle, suitable for shelf-stable dairy-based
beverages and ready-to-drink coffees. This new packaging permitted Kan-
Pack, LLC to convert its Cool Java™ brand ready-to-drink coffee beverage
�
Hot or cold, coffee hits the spot. In Europe, Nestle® brand Coffee-Mate® nondairy creamer, along with copackers of coffee, turn to Sonoco for innovative rigid paper canisters with a choice of barriers, closures and shapes.
13A N N U A L R E P O R T

Sonoco introduced a number of innovations to the market during 2005. Featured are, (l-r) the special paper used by Hallmark for its line of paper plates; the Snack ‘n Seal™ closure for Nabisco® Chips Ahoy!® cookies; a plastic can for shortening; a retort fl exible pouch; Sonomet, a metallic ink look with-out the expense, and the laser score seal for Cadbury Adams’ Trident® gum. �
from glass to a transparent plastic container that is able to withstand the
high temperatures and pressure of the retort process to provide for shelf
stability. The curved structure provides for the application of an attractive,
shrink-sleeve label.
Sonoco also worked with Hampton Farms to launch a line of gourmet
roasted nuts in a new multilayer, thermoformed oval-tapered plastic tub. The
unique package is new to the nut segment and offers a 12-month shelf life,
an easy-to-open re-sealable top and compact size for on-the-go snacking.
The container’s high-clarity polypropylene design features eye-catching
graphics and allows consumers to view the product before opening.
FLEXIBLE PACK AGING
Sales, earnings and margins improved year-over-year in Sonoco’s fl exible
packaging business due to new product introductions and improved
productivity following the realignment of North American production assets.
Further growth in fl exible packaging volumes and sales are targeted in 2006
as Sonoco expands its rotogravure printing production capability with the
acquisition of the fl exible packaging assets of Waco, Texas-based Wycon
Corporation. This acquisition is a strategic fi t for Sonoco as it provides an
existing business with two 12-color rotogravure presses and the capability
of expanding its state-of-the-art 135,000-square-foot facility to meet the
growing fl exible packaging needs of customers in the southwest U.S. and
Mexico. The Company also added a new eight-color fl exographic printing
press at its Terrebonne, Canada, operation, primarily to serve the
confectionery market.
NEW FLEXIBLE PRODUCTS. One of Sonoco’s most revolutionary and
successful new packaging launches in 2005 was the Snack ‘n Seal™ easy
opening and closing fl exible package that was jointly developed with Kraft
for its Nabisco® brand Chewy Chips Ahoy!® cookies. This unique patent-
pending technology with a peel-back fl ap in the top of the fl exible package
is designed to keep cookies fresh and to make opening and closing the
package easier. Follow-up designs, utilizing new technology that is
proprietary to Sonoco, will be available in other food lines in the future.
As consumers
become more
conscious of
healthy lifestyles,
Sonoco has
been working
with its
customers in
developing
reduced portion
packaging to
promote sensible
snacking for
reduced calorie
diets. A new
fl exible
packaging
14 S O N O C O 2 0 0 5
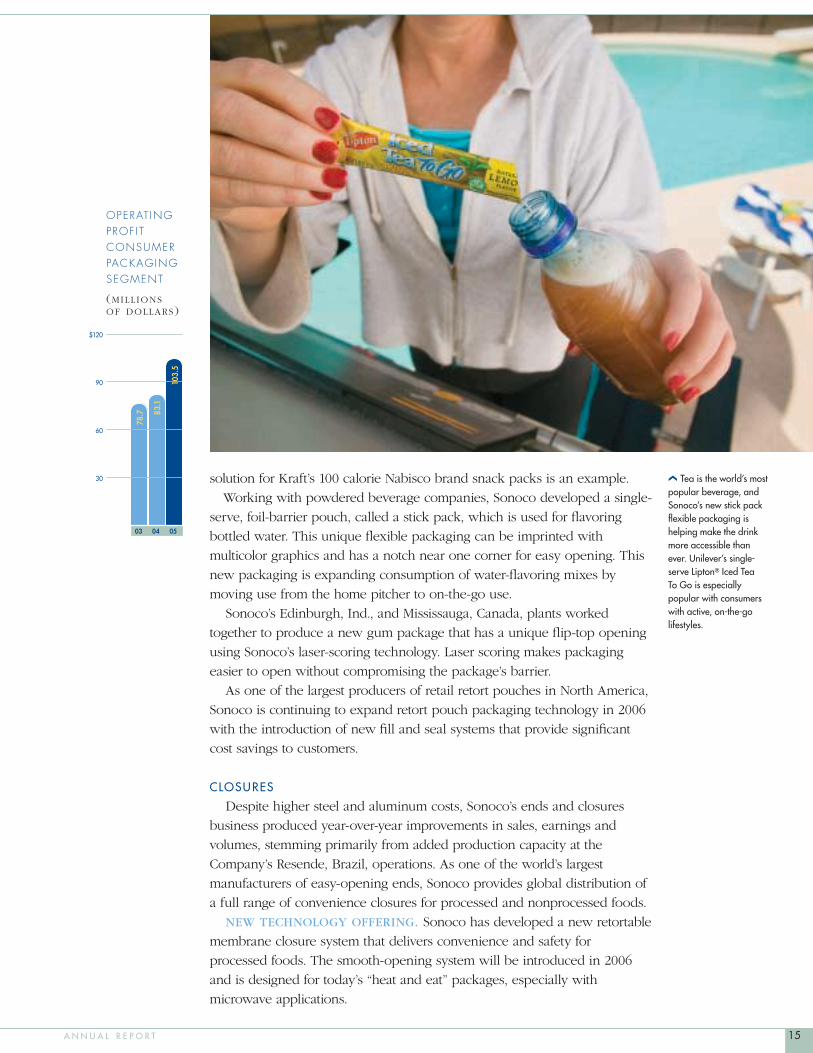
OPERAT ING PROF ITCONSUMER PACKAGING SEGMENT
(MILL IONS OF DOLLARS)
$120
90
60
30
03 04 05
78.7 83
.1
103.
5
�
Tea is the world’s most popular beverage, and Sonoco’s new stick pack fl exible packaging is helping make the drink more accessible than ever. Unilever’s single-serve Lipton® Iced Tea To Go is especially popular with consumers with active, on-the-go lifestyles.
solution for Kraft’s 100 calorie Nabisco brand snack packs is an example.
Working with powdered beverage companies, Sonoco developed a single-
serve, foil-barrier pouch, called a stick pack, which is used for fl avoring
bottled water. This unique fl exible packaging can be imprinted with
multicolor graphics and has a notch near one corner for easy opening. This
new packaging is expanding consumption of water-fl avoring mixes by
moving use from the home pitcher to on-the-go use.
Sonoco’s Edinburgh, Ind., and Mississauga, Canada, plants worked
together to produce a new gum package that has a unique fl ip-top opening
using Sonoco’s laser-scoring technology. Laser scoring makes packaging
easier to open without compromising the package’s barrier.
As one of the largest producers of retail retort pouches in North America,
Sonoco is continuing to expand retort pouch packaging technology in 2006
with the introduction of new fi ll and seal systems that provide signifi cant
cost savings to customers.
CLOSURES
Despite higher steel and aluminum costs, Sonoco’s ends and closures
business produced year-over-year improvements in sales, earnings and
volumes, stemming primarily from added production capacity at the
Company’s Resende, Brazil, operations. As one of the world’s largest
manufacturers of easy-opening ends, Sonoco provides global distribution of
a full range of convenience closures for processed and nonprocessed foods.
NEW TECHNOLOGY OFFERING. Sonoco has developed a new retortable
membrane closure system that delivers convenience and safety for
processed foods. The smooth-opening system will be introduced in 2006
and is designed for today’s “heat and eat” packages, especially with
microwave applications.
15A N N U A L R E P O R T

TUBES AND CORES/PAPER SEGMENT
�
With sales on the rise, the plasma television market represents a growth opportunity for Sonoco. The high-performance fi lm that gives these televisions their crystal-clear picture is wound on Sonoco’s most sophisticated paper and plastic cores.
16 S O N O C O 2 0 0 5
The Tubes and Cores/Paper segment, formerly known as Engineered Carriers
and Paper, was renamed to better refl ect the nature of its products. This
segment accounted for 42% of the Company’s consolidated net sales in 2005.
The products and services of the Tubes and Cores/Paper segment include
paperboard tubes, cores, roll packaging, supply chain packaging services,
molded plugs, recycled paperboard and recovered paper.
Net sales for the Tubes and Cores/Paper segment were $1.48 billion in 2005,
about a 7% increase from $1.39 billion reported in 2004. The increase in sales
was due primarily to the recognition of a full-year’s impact of the Sonoco-
Alcore joint venture, which resulted in $86.6 million of higher sales. The
impact of favorable exchange rates as the dollar weakened against foreign
currencies, along with increased selling prices, was partially offset by lower
volume in North American and
European tubes and cores. Volume,
excluding the impact of the joint
venture, decreased approximately
2%, due primarily to declines in the
textile and newsprint industries.
Domestic sales decreased approx-
imately $4 million, about 1%, to
$758 million, and international sales
increased approximately $98 million,
or 16%, to $724.1 million.
Operating profi t in this segment
was $107.1 million, compared with
$113 million in 2004. Operating profi t
was unfavorably impacted by a
charge of $12.5 million related to an
increase in the environmental reserve
at a Company subsidiary’s paper
operations in Wisconsin; decreased
volume, primarily in the textile and
newsprint markets; and increased
costs of energy, freight and labor.
These increased costs were partially
offset by year-over-year savings from
productivity and purchasing
initiatives and a favorable price/cost
relationship. A $5.6 million charge associated with an accounting adjustment
from a wholly owned subsidiary in Spain, which was related to prior years,
was recorded in 2004, while 2005 results were impacted by a $3 million asset
impairment charge related to operations in Asia.
TUBES AND CORES
Sonoco is the world’s leading producer of tubes and cores from 119
converting facilities located on fi ve continents. Sonoco’s tubes and cores
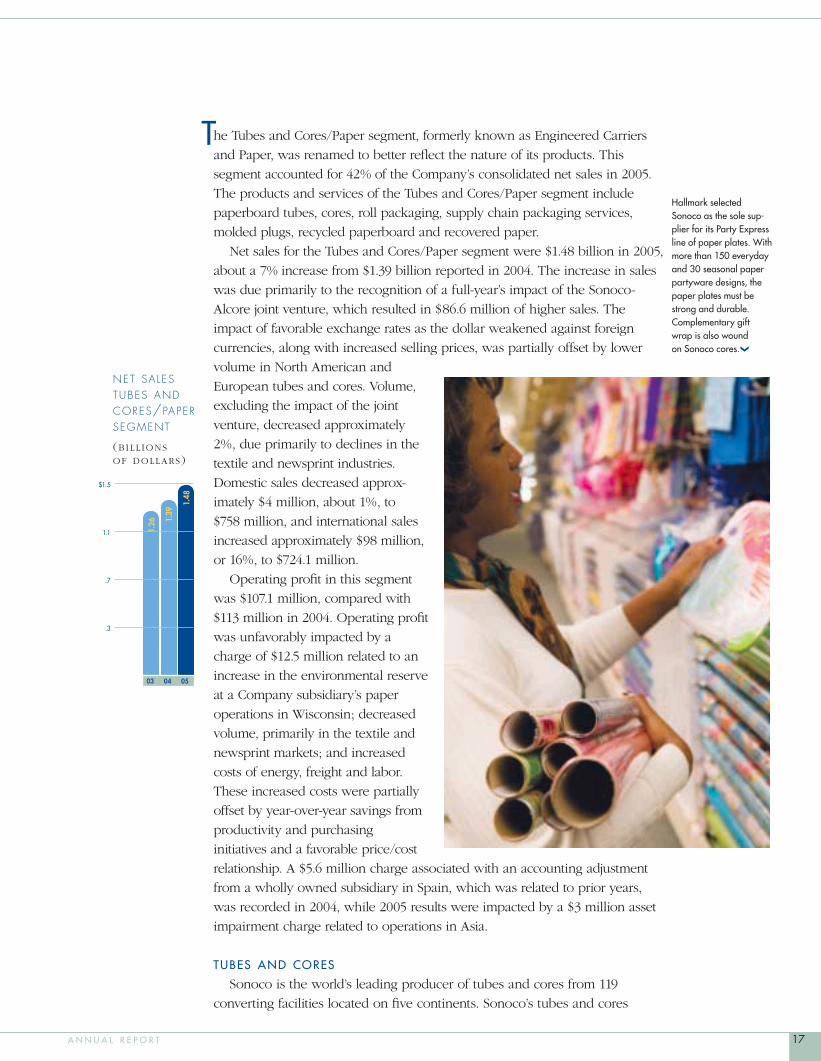
NET SALESTUBES AND CORES/PAPER SEGMENT
(BILL IONS OF DOLLARS)
$1.5
1.1
.7
.3
03 04 05
1.39
1.48
1.26
Hallmark selected Sonoco as the sole sup-plier for its Party Express line of paper plates. With more than 150 everyday and 30 seasonal paper partyware designs, the paper plates must be strong and durable. Complementary gift wrap is also wound on Sonoco cores. �
17A N N U A L R E P O R T

�
Sonoco’s introduction of RainGuard™ technol-ogy for its Sonotube® line of concrete forming tubes enables contractors to set forms in wet weather. These strong, rain-resistant concrete forms provide fl exibility on the job site as well as reduce material and labor costs.
business primarily serves industrial customers, including those in the paper,
fi lm, textile, tape and label and construction industries. Examples of
products include the core around which newsprint is rolled, the tubes used
to wind thread and cloth textiles, the high-performance cores used to wind
specialized fi lms used for audio, video and industrial packaging industries,
and paperboard tubes used in construction. This segment also manufactures
products for customers that produce consumer products. An example is the
tubes for rolls of fi lm used to make plasma televisions. While overall tube
and core volume declined year-over-year, the Company did experience
volume growth in a number of subsegments that have retail or consumer
applications, including nonwoven pulp, construction, household wraps, tape
and label, carpet and cloth.
GEOGRAPHIC EXPANSION. Sonoco continued its expansion in China by
adding three converting operations in late 2004 and 2005, bringing the
Company’s total to fi ve facilities. This expansion is primarily focused on
meeting the needs of China’s growing textile industry. Sonoco is the largest
18 S O N O C O 2 0 0 5

�
Hengli Textile Co. Ltd., uses Sonoco textile tubes at its Shaoxing, China, operation. Sonoco tubes are enhanced with pro-prietary notches, scores and grooves to improve string-up effi ciency. Color coding identifi cation sys-tems add an extra dimen-sion to quality assurance.
OPERAT ING PROF ITTUBES ANDCORES/PAPER SEGMENT
(MILL IONS OF DOLLARS)
$140
105
70
35
03 04 05
102.
9
113.
0
107.
1
tube and core producer in China,
and the Company expects to add a
sixth facility in 2006. The Company
also acquired a tube and core
manufacturer in New Zealand in
2005 and is exploring entry
opportunities for tubes and cores
and composite cans production in
India. Original consolidation plans
for the Sonoco-Alcore joint venture
were completed ahead of schedule
as seven of the joint venture’s 47
facilities were closed in 2005.
NEW TUBES AND CORES PRODUCT EXTENSION. Sonoco
expanded its market leadership in
fi ber-based concrete column forms with the North American launch of a
new water-resistant Sonotube® concrete form with RainGuard™ technology.
The new Sonotube forms incorporate a proprietary, high-strength, water-
resistant paper that allows contractors to set the concrete forms in wet
weather and pour concrete the next day, thus providing fl exibility and
material and labor cost savings. The new Sonotube forms with RainGuard
technology are available in a number of sizes in round and square forms
through the Company’s North American distributor network. In addition,
the new technology is available in the Company’s Finish Free® forms that,
when stripped, require no manual fi nishing, thus further reducing costs.
Sonoco is exploring opportunities to expand international markets with the
new concrete forms.
PAPER
VERTICALLY INTEGRATED OPERATIONS. One of Sonoco’s competitive
strengths is its vertical integration strategy. With 26 paper mills and 37 paper
machines around the world, Sonoco’s paper operations provide the primary
raw material for the Company’s fi ber-based packaging.
The Company’s paper operations serve such markets as
converted paper products, spiral winders, beverage
insulators, displays, gaming and paper manufacturing.
In 2005, Sonoco recycled paperboard manufacturing
capacity was approximately two million tons. Of that
production, the Company sells approximately 550,000
tons annually of various grades of paper to outside
customers. Completing the vertical integration strategy is
the Company’s worldwide recovered paper operations
which provide the raw material for the Company’s paper
manufacturing. With 45 primary collection facilities
worldwide, Sonoco’s recovered paper operations sell
approximately 70% of its collections to outside customers.
In the fourth quarter of 2005, Sonoco’s North American
paperboard mills operated at approximately 99% capacity,
compared with about 93% in the same period in 2004.
Purolator® air fi lters with pleated media trap pollen, dust and pet dander to meet the needs of the do-it-yourself resi-dential market. Sturdy paper from Sonoco holds the pleated media in place.
�
19A N N U A L R E P O R T

PACKAGING SERVICES SEGMENT
20 S O N O C O 2 0 0 5

T
� Market-differentiating displays drive impulse-driven purchases. That is why Cadbury Adams USA relied upon Sonoco CorrFlex to develop a unique fl oorstanding wing display to intro-duce its new Trident Splash™ sugar-free,center-fi lled gum.
he Packaging Services segment represents approximately 13% of the
Company’s consolidated net sales in 2005. This segment consists of pack-
aging supply chain management services, such as scalable Service Centers
operated by Sonoco for major consumer product companies. In addition,
this segment includes design, manufacture and ful-
fi llment services for point-of-purchase (P-O-P) dis-
plays; brand artwork management; and on-line and
off-line prepress management services.
The Packaging Services segment reported a 42%
increase in net sales of $455.9 million, compared
with $321 million reported in 2004. Sales in this
segment increased primarily due to the recognition
of a full-year’s impact of the May 2004 acquisition
of CorrFlex. In addition, higher volume contributed
$56.5 million to the increase in sales. Domestic
sales increased to $356.7 million, a 44% increase,
while international sales increased to $99.2 million,
or 36%.
Operating profi ts for this segment increased 48%
to $44.8 million in 2005, compared with $30.3 mil-
lion in 2004. Although the increase in operating
profi ts in this segment is largely attributable to the
full-year’s impact of the acquisition of CorrFlex,
productivity and purchasing initiatives in the ser-
vice centers also contributed to the improvement.
SERVICE CENTERS
Sonoco’s Service Centers provide supply chain
management services on a global basis to some of
the largest consumer product companies. For
Procter & Gamble (P&G), Sonoco packages all Gillette® brand razors and
blades for North America at facilities in Devens, Mass., under an extended
contract. In addition to managing multiple stockkeeping units (SKUs),
Sonoco handles inventory control and all logistical requirements for
incoming materials and Gillette razors and blades. Sonoco worked with
P&G in fulfi lling the introduction of the new Gillette brand Fusion™ razor
that was launched with a major marketing campaign tied to the Super
Bowl. Sonoco also provides Service Center management for Gillette razors
and blades in Europe. In 2005, the Company transitioned Service Center
operations from England to a new facility in Lodz, Poland. In addition,
Sonoco operates a Service Center for P&G in Euskirchen, Germany, where
it fulfi lls P-O-P displays for its European Babycare Division and a Service
Center in Dunstable, England, for promotional razors and blades products.
Sonoco also operates a Service Center for Hewlett-Packard (HP) in
Virginia, where the Company packs ink cartridges for inkjet printers
serving HP’s markets in the Americas.
NET SALESPACKAGING SERV ICES SEGMENT
(BILL IONSOF DOLLARS)
$.48
.36
.24
.12
03 04 05
.321
.456
.185
�
Procter & Gamble’s successful launch of its new Gillette brand Fusion™ razor was sup-ported by Sonoco’s packaging supply chain management services.
21A N N U A L R E P O R T
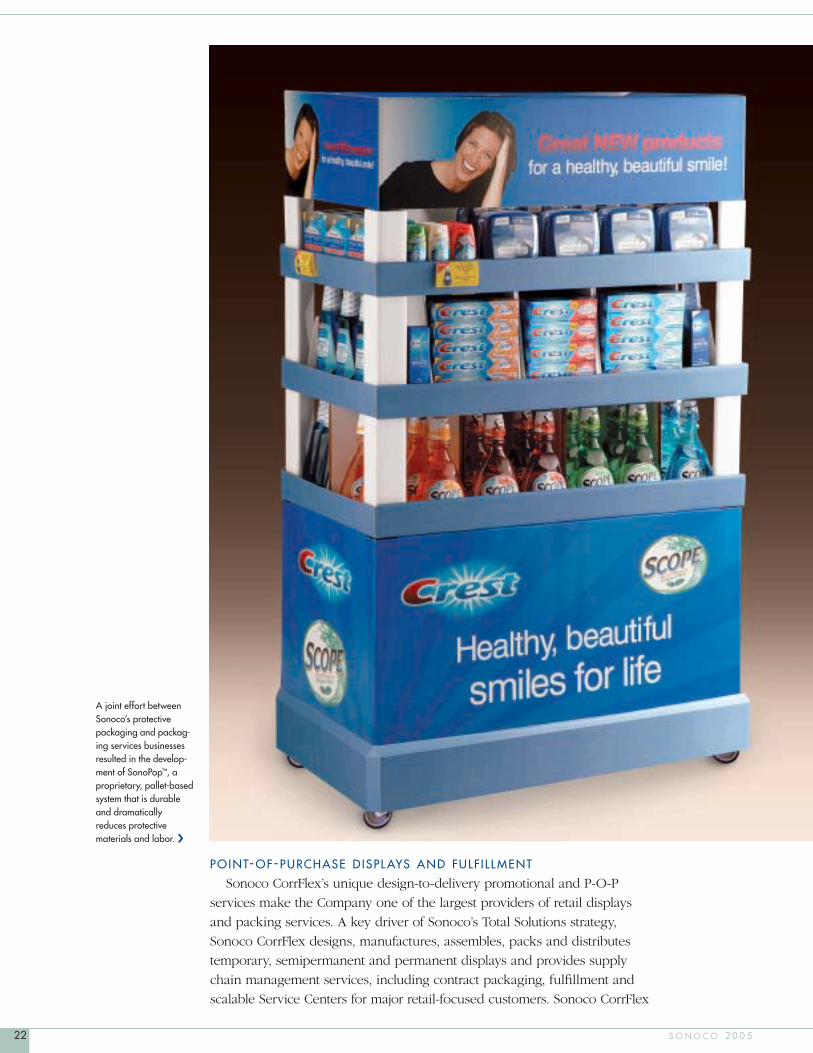
POINT-OF-PURCHASE D ISPL AYS AND FULFI L L MENT
Sonoco CorrFlex’s unique design-to-delivery promotional and P-O-P
services make the Company one of the largest providers of retail displays
and packing services. A key driver of Sonoco’s Total Solutions strategy,
Sonoco CorrFlex designs, manufactures, assembles, packs and distributes
temporary, semipermanent and permanent displays and provides supply
chain management services, including contract packaging, fulfi llment and
scalable Service Centers for major retail-focused customers. Sonoco CorrFlex
A joint effort between Sonoco’s protective packaging and packag-ing services businesses resulted in the develop-ment of SonoPop™, a proprietary, pallet-based system that is durable and dramatically reduces protective materials and labor.
�
22 S O N O C O 2 0 0 5

operates a national network of nine regional sales and design offi ces, four
in-house manufacturing operations and fi ve Service Centers.
Sonoco CorrFlex markets the Company’s SonoPop™ modular palletized
display system using Sonoco’s proprietary Sonopost® technology. This sys-
tem incorporates Sonoco engineered corrugated components produced by
its protective packaging business to create a cost-effective custom display
system that safely delivers consumer products to grocery, club and mass
merchandising retail stores. Sonoco CorrFlex introduced SonoPop displays to
P&G for the fi rst
time in 2005
with the launch
of a custom-
designed “Brand
Savers Event”
fl oor display. The
displays were
placed in a large
grocery super-
store chain fea-
turing seven
P&G brand
health and
beauty products
with 498 SKUs.
Because gum
is an extremely
impulse-driven purchase, market-differentiating, in-store displays are critical
to drive sales. Sonoco CorrFlex developed a unique fl oorstanding wing dis-
play to introduce Cadbury Adams USA’s Trident Splash™ sugar-free, center-
fi lled pellet gum. The display was designed with vibrant graphics that com-
plemented the product by drawing upon the bright colors of the gum’s
packaging. Trays containing the blister packaged gum cascade down and
across the front of the display simulating the “splash.” Developed to accom-
modate fl exible off-shelf placement, the display worked well across all retail
sectors and arrived prepacked at retail outlets to ensure ease of implementa-
tion and eliminate stocking costs.
POPAI, an international trade association for the marketing of the
at-retail industry, recognized Sonoco CorrFlex in 2005 with four Outstanding
Merchandizing Achievement Awards for unique design and functionality.
The Company received a gold award for its Elizabeth Arden skinsimple end-
cap display, a silver award for its Cadbury Adams fruit gum trio fl oorstand
and counter display, and bronze awards for Pride Golf Tee – Softspikes®
fl oorstand display and Costa Del Mar sunglasses permanent fl oor display.
GR APHICS M ANAGEMENT
Sonoco’s United Kingdom-based Sonoco-Trident offers global brand
graphics management. Through the use of proprietary systems, the
Company helps ensure quality packaging graphics reproduction for all
media to enhance the brands of its customers. Sonoco-Trident will expand
its services in 2006 by establishing a location in the United States.
�
Point-of-purchase displays from Sonoco CorrFlex capture the attention of consumers and industry experts. In 2005, the Company earned one gold, one silver and two bronze outstanding achievement awards from the Point-of-Purchase Advertising Institute (POPAI) for its creative, eye-catching displays.
OPERAT ING PROF ITPACKAGING SERV ICES SEGMENT
(MILL IONS OF DOLLARS)
$48
36
24
12
03 04 05
7.9
30.3
44.8
23A N N U A L R E P O R T

I
ALL OTHER SONOCO
n addition to the products and services provided by Sonoco in its Consumer
Packaging, Tubes and Cores/Paper and Packaging Services segments,
Sonoco produces wire and cable reels, protective packaging, molded and
extruded plastics, and glass covers and coasters. The results of these opera-
tions are refl ected as All Other Sonoco. In 2005, these businesses accounted
for approximately 10% of the Company’s consolidated net sales.
All Other Sonoco net sales increased about 9% in 2005 to $343.2 million,
compared with $313.8 million in 2004. Sales in these businesses increased
due to higher prices for molded and extruded plastics, wire and cable reels
and protective packaging along with increased volume in wire and cable
reels and protective packaging. Domestic sales for these businesses were
approximately $283 million, up about 12% from 2004, and international
sales were approximately $60 million, essentially fl at with 2004.
Operating profi ts for All Other Sonoco were $40.6 million in 2005, up
27%, from $32 million in 2004. Operating profi ts for these businesses
increased due primarily to manufacturing productivity and purchasing
�
Retailers know Whirlpool® washers and dryers will arrive in tip-top condition thanks to pro-tective packaging from Sonoco. Sturdy, impact-resistant Sonopost® corner posts protect the home appliances from damage during shipping, storing and stacking.
Whirlpool® is a registered
trademark of Whirlpool USA.
24 S O N O C O 2 0 0 5

initiatives and a favorable price/cost relationship, as the
Company was able to recover increases in raw material
costs, including lumber, resin and paper. Although higher
volume was a signifi cant reason for increased sales, oper-
ating profi ts were not impacted materially as changes in
the mix of products resulted in lower profi t margins.
PROTECTIVE PACK AGING
Sonoco provides engineered protective packaging
solutions, including Sonopost® corner posts, Sonobase™
transport base and Sonoview™ clear view packaging for
a total systems approach to product protection. This
business also contributes to the Company’s vertical inte-
gration strategy by being one of Sonoco’s internal con-
sumers of paper. Sonoco has established strong relation-
ships with companies in the large appliance industry,
where it provides protective packaging for such products
as washers, dryers, ranges and refrigerators to global
companies such as Whirlpool Corporation, Bosch and
Electrolux Home Products (Frigidaire).
WIRE AND CABLE REELS
Sonoco is the leading producer of wooden, composite and metal reels for
North America’s wire and cable industry. Sales and volume improved in 2005,
driven by coastal utility reconstruction and replacement efforts following two
severe hurricane seasons, along with an overall strong U.S. housing market.
MOLDED AND EXTRUDED PL AST ICS
Sonoco’s molded and extruded plastics operations supply customers in the
textile, fi ber optic, wire and cable, automotive, plumbing, fi ltration, food ser-
vices, medical, healthcare and packaging markets.
CROSS-SELLING SOLUTIONS. This business works closely with Sonoco’s
Consumer Packaging segment in North America and Europe to provide
“One Sonoco Face” to consumer product companies in meeting their
packaging supply chain needs. As an example, a molded plastics’ materials
scientist worked to develop a new injection-molded plastic container for an
existing Sonoco rigid paper customer who was planning to move its product
from an existing composite can. The coordinated efforts resulted in Sonoco
obtaining a new fi ve-year contract to supply plastic containers to the food
service supplier. In addition to expanding its relationship with the customer,
Sonoco is working to leverage the new plastic container with other food
service companies.
GL ASS COVERS AND COASTERS
Sonoco is the North American market leader in supplying paper coasters
and glass covers to the hospitality, restaurant and healthcare industries.
�
Alcoa uses an injec-tion molded plastic spool designed and manufac-tured by Sonoco to wind and dispense its zipper closure into the fi nal manufacturing stage of the rapidly growing zippered bag market.
25A N N U A L R E P O R T

�
Sonoco’s sustainability efforts are best refl ected in its stewardship approach to packaging. The Company supports recycling efforts with customers around the world by taking back used product, such as tubes and cores and using the recap-tured products as raw mate-rials for its papermaking operations.
SUSTAINABIL IT Y
Through its actions, Sonoco is proving that building a successful global pack-
aging company is compatible with making a signifi cant contribution to the
economic, social and environmental well-being of the communities in which
it operates. Together with business partners, employees, shareholders, cus-
tomers, community leaders and governmental and regulatory authorities,
Sonoco is pursuing business opportunities in an ethical and responsible
manner that will enable the Company to grow in ways that ensure a sustain-
able future for generations to come.
BENEFIT ING FROM D IVERS IT Y
Sonoco believes that valuing and supporting diversity in its workforce and
with suppliers is good business. Sonoco purchases a variety of products and
services through well-qualifi ed, customer-focused suppliers, including those
that are minority- and women-owned. In 2005, Sonoco was recognized by
one of its customers for its supplier diversity efforts as it increased its annual
spending with identifi ed minority- and women-owned suppliers by nearly 35%.
26 S O N O C O 2 0 0 5

Sonoco is listed in KLD
Indexes’ Domini 400
Social IndexSM (DSI).
DSI consists of 400 U.S.
companies that
demonstrate leadership
in corporate and social
responsibility. Sonoco
was listed in the index
following an evaluation
of the Company’s positive
performance on the
environment, community
relations, diversity,
employee relations,
human rights, product
quality, safety and
corporate governance.
Working with a diversity supplier in 2005, Sonoco expanded a distribution
channel to supply tubes and cores to a major consumer product company
that the Company would not have achieved without the diversity association.
COMMUNIT Y OUTREACH
In 2005, Sonoco made contributions to benefi t victims of natural disasters
in areas where Sonoco has operations. This effort included donations to the
Salvation Army and American Red Cross for providing relief effort to
Hurricane Katrina victims in the Gulf Coast region of the United States.
Sonoco also contributed to relief agencies in Indonesia and Thailand that
provided assistance to tsunami victims.
Overall, Sonoco budgets approximately 1% of its consolidated pretax
income annually for contributions to nonprofi ts representing education, health
and welfare, arts and the environment. All philanthropic, community,
employee and general citizenship activities and policies are reviewed by the
Employee and Public Responsibility Committee of Sonoco’s Board of Directors.
In addition to Sonoco’s fi nancial support, individual employees contribute
in countless ways to make the communities where the Company operates
better places in which to live by donating their personal resources, time and
expertise to worthwhile organizations and projects. As an example, many
employees give generously to United Way, participate in education and
mentoring programs in local schools and provide support during the holi-
days for low-income families by purchasing clothing and gifts.
A SAFET Y RECORD
In 2005, Sonoco employees around the world produced the Company’s
safest year ever, with a total incident rate (TIR) of .84 (annualized number of
reportable injuries per 100 full-time employees), signifi cantly surpassing the
2004 national average of 6.6 for all of U.S. manufacturing. Sonoco is recog-
nized worldwide as a leader in employing safe work practices as illustrated by
210 Sonoco operations receiving the Company’s President’s Safety Award in
recognition for achieving 200,000 hours or more of injury-free work in 2005.
EXPANDING ENVIRONMENTAL LEADERSH IP
Long known for its leadership in reclaiming and recycling packaging
materials, Sonoco is also committed to helping its customers reduce disposal
costs and meet their recycling goals. The Company operates a global recla-
mation system that annually collects approximately three million tons of
recovered paper and packaging for recycling into new packaging products.
In addition, the Company collects used wooden reels from utility companies
and contractors throughout the United States so that they can be refurbished
and delivered to wire and cable manufacturers for reuse. Since its inception,
this initiative has saved more than 300,000 trees. Sonoco also recycles used
and obsolete cell phones, laser and inkjet printer cartridges, rechargeable
batteries, and computers and computer components, helping prevent poten-
tially harmful materials from entering landfi lls.
SAFETY RECORD
(TOTAL INCIDENT RATE PER 100 EMPLOYEES)
1.60
1.20
.80
.40
01 02 03 04 05
1.49
1.19
1.03
.98
.84
27A N N U A L R E P O R T

BOARD OF DIRECTORS
HARRIS E. DELOACH, JR., 61 Chairman of the Board since 2005, President and Chief Executive Offi cer since 2000. Served on the Board since 1998. Member of the Executive Committee. CHARLES J. BRADSHAW, 69 President and director of Bradshaw Investments, Inc. (private invest-ments), Georgetown, S.C., since 1986. Formerly President and Chief Operating Offi cer of Transworld Corporation 1984-1986; Chairman and Chief Executive Offi cer of Spartan Food Systems, Inc. 1961-1986. Served on the Board since 1986. Member of the Corporate Governance and Nominating, Financial Policy and Executive Compensation Committees.
ROBERT J. BROWN, 71 Founder, Chairman and Chief Executive Offi cer, B&C Associates (management consulting, marketing research and public relations fi rm), High Point, N.C., since 1973. Served on the Board since 1993. Member of the Corporate Governance and Nominating and Employee and Public Responsibility Committees.
FITZ L.H. COKER, 70 Retired. Formerly President and a director of Sea Corporation of Myrtle Beach, Inc. (private investments), Myrtle Beach, S.C. 1983-1989; Sr. Vice President at Sonoco 1976-1979. Served on Board since 1964. Member of the Employee and Public Responsibility Committee.
�
First row, left to right, Charlie Bradshaw,
Bob Brown, Paul Fulton, James Micali, John Mullin,
Marc Oken. Second row, Tom Whiddon, Ed Lawton,
Pamela Davies, Caleb Fort and James Coker. Third
row, Jack Linville, Fitz Coker, Bernard Kasriel and
Harris DeLoach.
28 S O N O C O 2 0 0 5

JAMES L. COKER, 65President, JLC Enterprises (private investments), Stonington, Conn., since 1979. Formerly Secretary of the Company 1969-1995; President of Sonoco Limited, Canada 1972-1979. Served on the Board since 1969. Member of the Audit and Financial Policy Committees.
DR. PAMELA L. DAVIES, 49President of Queens University of Charlotte (institute of higher learning), Charlotte, N.C., since 2002. Formerly Dean of the McColl School of Business at Queens University of Charlotte 2000-2002; Professor of Management and Dean of the LeBow College of Business at Drexel University 1997-2000. Served on the Board since 2004. Member of the Audit and Employee and Public Responsibility Committees.
CALEB C. FORT, 44 Co-Chairman, The Merit Group, Inc. (distributors of residential and com-mercial paint-related products and various industrial supplies), Spartanburg, S.C., since 1998. Formerly a principal of Lancaster Distributing Company 1990-1998. Served on the Board since 2001. Member of the Audit, Employee and Public Responsibility and Corporate Governance and Nominating Committees.
PAUL FULTON, 71 Chairman since 2000 and director since 1997, Bassett Furniture Industries, Inc. (furniture maker), Bassett, Va. Formerly Chief Executive Offi cer of Bassett Furniture Industries, Inc. 1997-2000; Dean of The Kenan-Flagler Business School, The University of North Carolina 1994-1997; President of Sara Lee Corporation 1988-1993. Served on the Board since 1989. Member of the Executive, Corporate Governance and Nominating and Executive Compensation Committees.
BERNARD L.M. KASRIEL, 59 Vice Chairman of the Board, Lafarge (construction materials group), Paris, France, since January 2006. Formerly Chief Executive Offi cer of Lafarge 2003-2006; Vice Chairman and Chief Operating Offi cer of Lafarge 1995-2003; Vice Chairman and Chief Operating Offi cer of Lafarge 1995-2003; Managing Director of Lafarge 1989-1995; Sr. Executive Vice President 1987-1989; Executive Vice President 1982-1987. Served on the Board since 1995. Member of the Executive Compensation and Financial Policy Committees.
EDGAR H. LAWTON, III, 45President and Treasurer, Hartsville Oil Mill (vegetable oil processor), Darlington, S.C., since 2000, and a director since 1991. Formerly Vice President of Hartsville Oil Mill 1991-2000. Served on the Board since 2001. Member of the Audit and Employee and Public Responsibility Committees.
JOHN E. (JACK) LINVILLE, 60Attorney in private practice in New York, N.Y., since 2004. Formerly coun-sel with Manatt, Phelps & Phillips, LLP 2003-2004, joining the fi rm through its merger with his prior fi rm, Kalkines, Arky, Zall & Bernstein, LLP 1990-2003; General Counsel and then Acting President of the New York Health & Hospitals Corporation prior to 1990. Served on the Board since 2004. Member of the Executive Compensation and Financial Policy Committees.
JAMES M. MICALI, 58 Chairman and President, Michelin North America, Inc. (tire manufac-turer), Greenville, S.C., since 1996 and a member of Michelin Group’s Executive Council since 2001. Formerly Executive Vice President, Legal and Finance of Michelin North America 1990-1996; General Counsel and Secretary 1985-1990. Served on the Board since 2003. Member of the Audit and Financial Policy Committees.
JOHN H. MULLIN, III, 64 Chairman, Ridgeway Farm LLC, Brookneal, Va. (privately held timber and farming business), since 1989. Formerly Managing Director of Dillon, Read & Co. Inc., 1969-1989. Served on the Board since 2002. Member of the Corporate Governance and Nominating, Financial Policy, Executive and Executive Compensation Committees.
MARC D. OKEN, 59Managing Partner of Falfurrias Capital Partners (private equity fi rm), Charlotte, N.C., since January 2006. Formerly held executive offi cer posi-tions at Bank of America Corporation 1989-2006, most recently as Chief Financial Offi cer; partner at Price Waterhouse LLP for 13 years; a Fellow with the Securities and Exchange Commission 1981-1983. Joined the Board in February 2006. Member of the Audit and Executive Compensation Committees.
THOMAS E. WHIDDON, 53 Advisory Director of Berkshire Partners, LLC (private equity fi rm), Boston, Mass., since October 2005; and acting Chief Operating Offi cer of Waterworks, Inc. (luxury bath retailer), Danbury, Conn., a Berkshire portfolio company, since January 2006. Formerly Executive Vice President-Logistics and Technology of Lowe’s Companies, Inc. 2000-2003; Executive Vice President and Chief Financial Offi cer of Lowe’s 1996-2000; also held senior fi nancial positions at Zale Corporation and Eckerd Corporation. Served on the Board since 2001. Member of the Audit Committee.
29A N N U A L R E P O R T
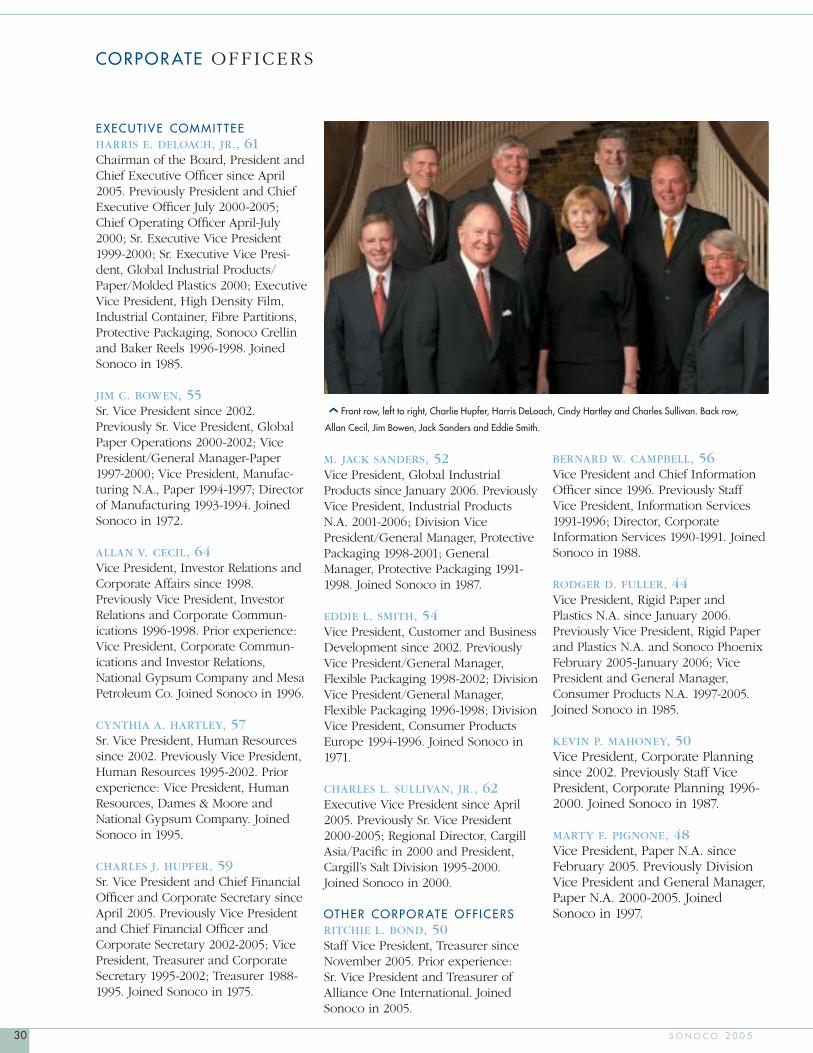
CORPOR ATE OFF ICERS
EXECUTIVE COMMIT TEEHARRIS E. DELOACH, JR., 61 Chairman of the Board, President and Chief Executive Offi cer since April 2005. Previously President and Chief Executive Offi cer July 2000-2005; Chief Operating Offi cer April-July 2000; Sr. Executive Vice President 1999-2000; Sr. Executive Vice Presi-dent, Global Industrial Products/Paper/Molded Plastics 2000; Executive Vice President, High Density Film, Industrial Container, Fibre Partitions, Protective Packaging, Sonoco Crellin and Baker Reels 1996-1998. Joined Sonoco in 1985.
JIM C. BOWEN, 55 Sr. Vice President since 2002. Previously Sr. Vice President, Global Paper Operations 2000-2002; Vice President/General Manager-Paper 1997-2000; Vice President, Manufac-turing N.A., Paper 1994-1997; Director of Manufacturing 1993-1994. Joined Sonoco in 1972.
ALLAN V. CECIL, 64 Vice President, Investor Relations and Corporate Affairs since 1998. Previously Vice President, Investor Relations and Corporate Commun-ications 1996-1998. Prior experience: Vice President, Corporate Commun-ications and Investor Relations, National Gypsum Company and Mesa Petroleum Co. Joined Sonoco in 1996.
CYNTHIA A. HARTLEY, 57 Sr. Vice President, Human Resources since 2002. Previously Vice President, Human Resources 1995-2002. Prior experience: Vice President, Human Resources, Dames & Moore and National Gypsum Company. Joined Sonoco in 1995.
CHARLES J. HUPFER, 59Sr. Vice President and Chief Financial Offi cer and Corporate Secretary since April 2005. Previously Vice President and Chief Financial Offi cer and Corporate Secretary 2002-2005; Vice President, Treasurer and Corporate Secretary 1995-2002; Treasurer 1988-1995. Joined Sonoco in 1975.
M. JACK SANDERS, 52Vice President, Global Industrial Products since January 2006. Previously Vice President, Industrial Products N.A. 2001-2006; Division Vice President/General Manager, Protective Packaging 1998-2001; General Manager, Protective Packaging 1991-1998. Joined Sonoco in 1987.
EDDIE L. SMITH, 54Vice President, Customer and Business Development since 2002. Previously Vice President/General Manager, Flexible Packaging 1998-2002; Division Vice President/General Manager, Flexible Packaging 1996-1998; Division Vice President, Consumer Products Europe 1994-1996. Joined Sonoco in 1971.
CHARLES L. SULLIVAN, JR., 62Executive Vice President since April 2005. Previously Sr. Vice President 2000-2005; Regional Director, Cargill Asia/Pacifi c in 2000 and President, Cargill’s Salt Division 1995-2000. Joined Sonoco in 2000.
OTHER CORPOR ATE OFFICERS RITCHIE L. BOND, 50Staff Vice President, Treasurer since November 2005. Prior experience: Sr. Vice President and Treasurer of Alliance One International. Joined Sonoco in 2005.
BERNARD W. CAMPBELL, 56 Vice President and Chief Information Offi cer since 1996. Previously Staff Vice President, Information Services 1991-1996; Director, Corporate Information Services 1990-1991. Joined Sonoco in 1988.
RODGER D. FULLER, 44Vice President, Rigid Paper and Plastics N.A. since January 2006. Previously Vice President, Rigid Paper and Plastics N.A. and Sonoco Phoenix February 2005-January 2006; Vice President and General Manager, Consumer Products N.A. 1997-2005. Joined Sonoco in 1985.
KEVIN P. MAHONEY, 50Vice President, Corporate Planning since 2002. Previously Staff Vice President, Corporate Planning 1996-2000. Joined Sonoco in 1987.
MARTY F. PIGNONE, 48 Vice President, Paper N.A. since February 2005. Previously Division Vice President and General Manager, Paper N.A. 2000-2005. Joined Sonoco in 1997.
�
Front row, left to right, Charlie Hupfer, Harris DeLoach, Cindy Hartley and Charles Sullivan. Back row,
Allan Cecil, Jim Bowen, Jack Sanders and Eddie Smith.
30 S O N O C O 2 0 0 5

RECONCIL IAT ION OF NON-GA AP F INANCIAL MEASURES
FIRST SECOND THIRD FOURTH YEAR ENDED2005 QUARTER QUARTER QUARTER QUARTER 12/31/2005 ANNUAL EPS ($ IN MILLIONS) ($ IN MILLIONS) ($ IN MILLIONS) ($ IN MILLIONS) ($ IN MILLIONS) (IN DOLLARS)
Net income, as reported (GAAP) $ 37.0 $ 40.2 $ 45.9 $ 38.8 $ 161.9 $ 1.61 Adjusted for: Restructuring charges, net of tax 3.1 5.6 2.5 1.8 13.0 .13 Environmental reserve, net of tax 7.6 7.6 .08 Taxes on repatriation of foreign earnings 10.1 10.1 .10
Base earnings (NON-GAAP) $ 40.1 $ 45.8 $ 48.4 $ 58.3 $ 192.6 $ 1.92
FIRST SECOND THIRD FOURTH YEAR ENDED2004 QUARTER QUARTER QUARTER QUARTER 12/31/2004 ANNUAL EPS ($ IN MILLIONS) ($ IN MILLIONS) ($ IN MILLIONS) ($ IN MILLIONS) ($ IN MILLIONS) (IN DOLLARS)
Net income, as reported (GAAP) $ 38.6 $ 36.7 $ 40.9 $ 35.0 $ 151.2 $ 1.53 Adjusted for: Restructuring charges, net of tax 1.0 4.6 1.0 7.8 14.4 .14 Legal judgment, net of tax 3.6 (0.7) 2.9 .03 Executive life insurance, net of tax 3.6 3.6 .04 Recognition of tax benefits (9.3) (9.3) (.09)Base earnings (NON-GAAP) $ 33.9 $ 41.3 $ 45.5 $ 42.1 $ 162.8 $ 1.65
In accordance with the SEC’s Regulation G, the following provides defi nitions of the non-GAAP fi nancial mea-
sures discussed in the Company’s 2005 Annual Report to Shareholders together with the most directly comparable
fi nancial measures calculated in accordance with Generally Accepted Accounting Principles (GAAP), and a recon-
ciliation of the differences between the non-GAAP fi nancial measures disclosed and the most directly comparable
fi nancial measures calculated in accordance with GAAP:
BASE EARNINGS AND BASE EARNINGS PER SHARE
Base earnings is a non-GAAP fi nancial measure of net income and base EPS is a non-GAAP fi nancial measure
of earnings per share, which exclude the impact of restructuring charges and of non-recurring or infrequent and
unusual items. The following table sets forth the reconciliation of quarterly and annual GAAP net income to base
earnings and the reconciliation of annual GAAP diluted earnings per share to base earnings per share:
NET SALES, EXCLUDING D IVESTED BUSINESSES
Net sales, excluding divested businesses is a non-GAAP fi nancial measure of revenue, which retroactively
excludes the net sales of all subsequently divested businesses and is used in the calculation of the compound
annual growth rate of sales. The following table sets forth the reconciliation of GAAP net sales to net sales, exclud-
ing divested businesses:
YEAR ENDED DECEMBER 31 (DOLLARS IN MILLIONS) 1995 2000 2005
Net sales, as reported (GAAP) $2,556,248 $2,570,708 $3,528,574
Adjusted for:
Net sales from businesses subsequently divested (522,429) (25,206)
Net sales, excluding divested businesses (NON-GAAP) $2,033,819 $2,545,502 $3,528,574
Five-year compound annual growth rate 4.6% 6.7%
31A N N U A L R E P O R T

MANAGEMENT’S D ISCUSSION AND ANALYSIS OF F INANCIAL CONDIT ION AND RESULTS OF OPER AT IONS
OVERVIEW
Sonoco achieved a number of key performance goals
in 2005 despite a challenging operating and market
environment. The Company experienced sustained
year-over-year quarterly earnings increases, margin
improvement and double-digit sales growth, driven
principally by acquisitions, improved Companywide vol-
ume coming from signifi cant new consumer product
and market development and geographic expansion.
Integration of the CorrFlex acquisition was successfully
completed. In addition, the Company’s businesses con-
tinued to produce signifi cant cost savings from manufac-
turing and purchasing improvements and a positive
price/cost relationship was attained, despite rising costs
in most raw materials.
Effective December 31, 2005, the Company changed
the name of the Engineered Carriers and Paper segment
to Tubes and Cores/Paper, because the term “tubes and
cores” is more generally understood than “engineered
carriers” in the marketplace for the primary products
offered by the businesses in this segment. There has
been no change in the businesses included in this
segment.
Net sales for the Company in 2005 were $3.53 billion,
versus $3.16 billion in 2004, primarily due to higher vol-
ume, including the impact of having a full-year of the
CorrFlex Graphics, LLC (“CorrFlex”) acquisition and the
joint venture between Sonoco and Ahlstrom
Corporation (“Ahlstrom”) of Helsinki, Finland (“Sonoco-
Alcore”). In addition to the impact of acquisitions, the
Companywide volume increase during the year was
driven by higher sales in the Consumer Packaging and
Packaging Services segments, partially offset by volume
declines for the Tubes and Cores/Paper (formerly called
Engineered Carriers and Paper) segment. Also contribut-
ing to the sales gain were higher selling prices for rigid
paper and plastic packaging, wire and cable reels, and
molded and extruded plastics, along with the favorable
impact of exchange rates as the dollar weakened against
foreign currencies.
The Company reported net income of $161.9 million
for 2005, compared with $151.2 million for 2004.
Earnings growth in 2005 resulted in large part from
strong sales, which were driven by the full-year impact
of acquisitions completed in 2004, and from higher pro-
ductivity improvement in virtually all of the Company’s
businesses. Volume and mix had a disproportionately
lower impact on operating profi ts than implied by the
increase in sales, as the change in the mix of products
sold had an unfavorable effect on operating profi ts. In
addition, approximately $24.8 million of the increased
sales in the Packaging Services segment were on a pass-
through basis and had very little impact on profi ts.
Rising infl ation and escalating energy and freight prices
negatively impacted operating profi ts. The Company
was able to maintain a favorable selling price/material
cost (“price/cost”) relationship during the year, most
notably in the Tubes and Cores/Paper segment. Net
income for 2005 and 2004 included after-tax restruc-
turing charges of approximately $13.1 million and
$14.4 million, respectively. Net income for 2005 was
also negatively impacted by an after-tax charge of
$7.6 million related to an increase in the environmental
reserve at a Company subsidiary’s paper operations
in Wisconsin, and additional tax expense totaling
$10.1 million associated with the repatriation of
$124.7 million in foreign earnings under the American
Jobs Creation Act of 2004 (“AJCA”).
Cash fl ow remained strong, with cash generated from
operations totaling $227.4 million in 2005, which
includes global pension funding totaling $77 million.
Cash fl ow was used to fund capital expenditures, pay
dividends and decrease debt by $117.8 million. To sus-
tain strong cash fl ow, the Company remains focused on
growing sales by developing new products and markets,
expanding geographically and making appropriate
acquisitions. At the same time, the Company is commit-
ted to aggressively controlling costs and effectively
employing its capital by paying close attention to work-
ing capital management and capital expenditures.
RESTRUCTURING CHARGES, UNUSUAL ITEMS AND OTHER ACTIV IT IES
RESTRUCTURING CHARGES
During 2005, the Company recognized restructuring
charges, net of adjustments, of $21.2 million ($14.3 mil-
lion after tax), primarily related to eleven plant closings
in the Tubes and Cores/Paper segment and three plant
closings in the Consumer Packaging segment. Restruc-
turing charges recognized during 2005 consisted of sev-
erance and termination benefi ts of $6.2 million, asset
impairment charges of $6.5 million and other exit costs
32 S O N O C O 2 0 0 5

of $8.5 million, consisting of building lease termination
charges and other miscellaneous exit costs. These costs
are associated with the Company’s general plans,
announced in August 2003, to reduce its overall cost
structure by approximately $54 million pretax. The
Company expects to recognize, in the future, an addi-
tional cost of approximately $6.8 million pretax associ-
ated with these actions. The objectives of these restruc-
turing actions are to realign and centralize a number of
staff functions and eliminate excess plant capacity. With
the exception of ongoing pension subsidies and certain
building lease termination expenses, costs associated
with the 2005 restructuring actions are expected to be
paid by the end of the third quarter 2006 using cash
generated from operations.
Of the $6.5 million previously mentioned asset
impairment charges (related to the writeoff/down of
assets associated with eleven plant closings), the
Company recognized writeoffs/downs of impaired
equipment of $5.9 million and writeoffs/downs related
to facilities held for sale of $.6 million. Impaired assets
are valued at the lower of carrying amount or fair value,
less estimated costs to sell, if applicable. During 2005,
the Company also recorded noncash income of $1.3 mil-
lion after tax to refl ect Ahlstrom’s portion of restructur-
ing costs that were charged to expense. This income,
which resulted from the closure of certain plants that the
Company contributed to Sonoco-Alcore S.a.r.l. (“Sonoco-
Alcore”), is included in “Equity in earnings of affi liates/
minority interest in subsidiaries” in the Company’s
Consolidated Statements of Income.
During the fourth quarter of 2005, the Company
began an in-depth review of its global Tubes and Cores/
Paper operations. This review, expected to be completed
by mid-2006, is intended to examine the Company’s
served markets in this segment (principally textiles,
paper and fi lm) and address issues such as market
growth, capacity, technology and competition.
Depending upon the conclusions reached, a further
restructuring of operations may result.
During 2004, the Company recognized restructuring
charges, net of adjustments, of $19 million ($16.2 million
after tax), primarily related to 10 plant closings in the
Tubes and Cores/Paper segment, fi ve plant closings in
the Consumer Packaging segment and one plant closing
in All Other Sonoco. Included in this amount is $2.2 mil-
lion in restructuring charges, which resulted from a cor-
rection to previously reported fi nancial statements at the
Company’s wholly owned subsidiary in Spain.
Restructuring charges recognized during 2004 consisted
of severance and termination benefi ts of $6.5 million,
asset impairment charges of $6.2 million and other exit
costs of $6.3 million, consisting of building lease termi-
nation charges and other miscellaneous exit costs.
During 2004, the Company also recorded noncash
income in the amount of $1.8 million after tax to refl ect
Ahlstrom’s portion of restructuring costs that were
charged to expense. This income,
which resulted from the closure
of certain plants that the
Company contributed to Sonoco-
Alcore, is included in “Equity in
earnings of affi liates/minority
interest in subsidiaries” in the
Company’s Consolidated
Statements of Income.
During 2003, the Company
recognized restructuring charges,
net of adjustments, of $50.1 mil-
lion pretax ($35.3 million after
tax). Additionally, the Company’s
High Density Film business,
which was divested in 2003,
incurred restructuring charges of
$.2 million pretax ($.1 million
after tax) in 2003. The 2003
restructuring charges were primarily related to six plant
closings in the Tubes and Cores/Paper segment, three
plant closings in the Consumer Packaging segment,
three plant closings in All Other Sonoco and a global
reduction in salaried positions. These restructuring
charges consisted of severance and termination benefi ts
of $37.7 million, asset impairment charges of $8.4 mil-
lion and other exit costs of $4 million, consisting of
building lease termination charges and other miscella-
neous exit costs.
During 2003, the Company also recorded restructur-
ing charges of $1.5 million after tax related to expenses
at a non-consolidated affi liate. The restructuring charges
are included in “Equity in earnings of affi liates/minority
interest in subsidiaries” in the Company’s Consolidated
Statements of Income.
SHAREHOLDERS’ EQUITY
(MILL IONS
OF DOLLARS)
$1300
975
650
325
01 02 03 04 05
804 86
7
1,26
3
1,01
4
1,15
3
33A N N U A L R E P O R T
ACQUISITIONS/JOINT VENTURES
The Company completed three acquisitions during
2005, with an aggregate cost of approximately $3.6 mil-
lion, all of which was paid in cash. Acquisitions in the
Company’s Tubes and Cores/Paper segment included a
tube and core manufacturer in New Zealand and a
small molded plug recycler in the United States.
Additionally, the Company purchased the remaining
ownership interest in a Chilean tubes and cores busi-
ness. The Company also acquired certain assets of a
rigid plastic packaging manufacturer in Brazil, which is
reported in the Consumer Packaging segment.
The Company completed nine acquisitions during
2004, with an aggregate cost of approximately $367 mil-
lion, of which $267 million was paid in cash. During
2004, the Company acquired CorrFlex, one of the
nation’s largest point-of-purchase display companies.
The acquired business, which is known as Sonoco
CorrFlex, LLC, is refl ected in the Packaging Services seg-
ment. Acquisitions in the Company’s Consumer
Packaging segment included a composite can manufac-
turer in Australia, a manufacturer of rotogravure cylin-
ders in Canada and the remaining ownership interest in
a manufacturer of rotogravure cylinders in Charlotte,
N.C. Acquisitions in the Company’s Tubes and Cores/
Paper segment included tube and core manufacturers in
Australia, China and the United States. The Company
also completed a business combination with Ahlstrom
to combine each of the companies’ respective European
paper-based tube/core and coreboard operations into a
joint venture that operates under the name Sonoco-
Alcore, and is refl ected in the Company’s Tubes and
Cores/Paper segment. The Company contributed owner-
ship positions in 25 tube and core plants, and fi ve paper
mills to Sonoco-Alcore and holds a 64.5% interest in the
joint venture. Ahlstrom, a leader in high-performance
fi ber-based materials serving niche markets worldwide,
contributed 14 tube and core plants and one paper mill
to Sonoco-Alcore and holds a 35.5% interest in the joint
venture. The Company has accounted for this transac-
tion as an acquisition and, therefore, consolidates the
results of the joint venture and reports Ahlstrom’s
minority interest as such in its fi nancial statements. The
recognition of minority interest is included in “Income
before equity in earnings of affi liates/minority interest in
subsidiaries” on the Company’s Consolidated Statements
of Income. The Company also acquired certain assets of
a wooden reel refurbisher in Alabama, which are classi-
fi ed as components of All Other Sonoco.
The Company completed four acquisitions during
2003, with an aggregate cost of approximately $11.1 mil-
lion. Acquisitions in the Company’s Tubes and Cores/
Paper segment included a tube and core manufacturer
in Australia and a recovered paper operation in
Savannah, Ga. The Company also acquired certain
assets of a wooden reel manufacturer in Canada and the
United States, which were classifi ed as components of
All Other Sonoco. In addition, the Company increased
its ownership interest in a manufacturer of rotogravure
cylinders in Charlotte, N.C., that is included in the
Company’s Consumer Packaging segment.
DISPOSITIONS
In December 2005, the Company divested its single-
plant folding cartons business for a note receivable of
approximately $11 million, which was collected in early
2006. This transaction resulted in a gain of $2.4 million
($1.6 million after tax). The results of this business unit
were immaterial to the Company’s consolidated net
income for all periods presented.
In December 2003, the Company divested its High
Density Film business to Hilex Poly Co., LLC, of Los
Angeles, Calif., at a price of approximately $81 million
in cash and the balance in subordinated notes, and pre-
ferred nonvoting membership interests, resulting in a
gain of approximately $63.1 million pretax ($49.4 million
after tax). Operating results of this business are pre-
sented as “Income from discontinued operations, net
of income taxes” in the Company’s Consolidated
Statements of Income for 2003. After-tax income con-
tributed by the High Density Film business was approxi-
mately $60.8 million in 2003.
OTHER SPECIAL CHARGES AND INCOME ITEMS
During the fourth quarter of 2005, the United States
Environmental Protection Agency (“EPA”) notifi ed
Sonoco U.S. Mills, Inc. (“U.S. Mills”), a wholly owned
subsidiary of the Company, that U.S. Mills and another
party would be jointly held responsible to undertake a
program to remove and dispose of certain PCB-
contaminated sediments at a particular site on the lower
Fox River in Wisconsin. U.S. Mills and the other party
have reached agreement that each would fund 50% of
the costs of remediation, which is currently estimated to
be between $25 million and $30 million for the project
as a whole. Project implementation will begin shortly,
with most of the project costs expected to be incurred
in 2007. Although the agreement reached does not
acknowledge responsibility or prevent the other party
from seeking reimbursement from any other parties
34 S O N O C O 2 0 0 5

(including each other), the Company has accrued
$12.5 million as an estimate of the portion of costs that
U.S. Mills expects to fund under the current agreement.
The charges recognized for this environmental reserve
are included in “Selling, general and administrative
expenses” in the Company’s Consolidated Statements
of Income. The actual costs associated with cleanup of
this particular site are dependent upon many factors,
and it is reasonably possible that remediation costs
could be higher than the current estimate of project
costs. The Company acquired U.S. Mills in 2001, and
the alleged contamination predates the acquisition.
Based on information currently known to the
Company, it does not appear that U.S. Mills is respon-
sible for the alleged contamination. Some or all of any
costs incurred may be covered by insurance or be sub-
ject to recoupment from third parties, but no amounts
have been recognized in the fi nancial statements for
such recovery.
During 2005, the Company repatriated $124.7 million
from foreign subsidiaries under the provisions of AJCA.
Under this temporary incentive, a portion of the repa-
triated funds qualifi ed for an 85% dividends-received
deduction. The Company recorded an additional tax
expense of $10.1 million for the U.S. federal and state
taxes due on the repatriated funds, which will ulti-
mately be used to fund investment in plant and equip-
ment and U.S.-based research and development costs,
as permitted by AJCA.
In 2004, the Company recognized charges of
approximately $5.6 million, which the Company
incurred to recognize vested commitments to pay
future costs associated with new executive life insur-
ance benefi ts that replaced split-dollar life agreements
made with key executives since 1995. Due to regulatory
changes, the Company was not able to maintain those
split-dollar agreements, and the replacement benefi ts
for the affected employees have been provided by the
Company to meet the intent and commitments of the
previous plan. Also in 2004, the U.S. District Court for
the Southern District of Ohio entered a judgment
against the Company’s subsidiary, Sonoco-U.S. Mills,
and the Company. The Company accrued approxi-
mately $4.5 million related to this legal proceeding. The
charges recognized for the new executive life insurance
benefi ts and the legal proceeding are included in
“Selling, general and administrative expenses” in the
Company’s Consolidated Statements of Income.
Additionally, 2004 net income was positively affected
by approximately $9.3 million due to the recognition of
certain tax benefi ts as a result of the Internal Revenue
Service (“IRS”) closing its examination of the Company’s
tax returns for years 1999 through 2001.
During the fourth quarter of 2004, the Company
determined that misstatements were made in the fi nan-
cial statements of its wholly owned subsidiary in Spain,
which consists of two tube and core plants. The pri-
mary impact of these misstatements was an underre-
porting of expenses over a six-year period totaling
approximately $9.4 million, before and after tax, of
which $2.2 million was related to restructuring charges
as previously discussed. Of the remaining $7.2 million,
approximately $1.6 million was associated with the fi rst
three quarters of 2004, approximately $1.3 million was
associated with 2003, approximately $.3 million was
associated with 2002, approximately $1.9 million was
associated with 2001 and the remaining amount of
approximately $2.1 million was associated with 2000
and prior. As the impact of these misstatements was not
material to the reported results of any of the prior peri-
ods affected or to the period in which it was recorded,
the Company recorded the charge in the fourth quarter.
RESULTS OF OPER ATIONS 2005 VERSUS 2004OPERATING REVENUE
Consolidated net sales for 2005 were $3.53 billion,
versus $3.16 billion in 2004, resulting in an increase of
approximately $373 million.
The components of the sales change were
approximately:
($ IN MILLIONS)
Volume $100
Selling price 60
Currency exchange rate 43
Acquisitions 167
Other 3
Total sales increase $373
Sales increased primarily due to the full year of the
CorrFlex acquisition and the Sonoco-Alcore joint ven-
ture, which increased sales by $80 million and $87 mil-
lion, respectively. Companywide volume, excluding the
increased service revenue in the Service Centers, which
was on a pass-through basis, was approximately 2.4%
higher than 2004 levels, driven by increases in the
Consumer Packaging and Packaging Services segments.
Higher selling prices for rigid paper and plastic packag-
ing, closures, North American tubes and cores, paper-
35A N N U A L R E P O R T
was the $12.5 million expense of establishing an
environmental reserve at the Company’s subsidiary in
Wisconsin, while 2004 costs included charges of
approximately $5.6 million pretax, which the Company
incurred to recognize commitments to pay future costs
associated with new executive life insurance benefi ts
and a charge of approximately $4.5 million pretax
associated with an unfavorable legal judgment that was
entered against the Company. All of these unusual
charges are discussed under the section above titled,
“Restructuring Charges, Unusual Items and Other
Activities – Other Special Charges and Income Items.”
In 2006, as part of selling, general and administrative
expenses, the Company will recognize stock-based
compensation expense as required by the revision to
Statement of Financial Accounting Standards No. 123,
‘Share-Based Payment’ (FAS 123R). These costs are
estimated to be approximately $5.5 million pretax, of
which approximately 50% will be recognized in the fi rst
quarter.
During 2005, the Company experienced postretire-
ment and defi ned-benefi t pension expense of approxi-
mately $43 million, versus $45.8 million in 2004, a
decrease of approximately $2.3 million pretax. The mar-
ket value of U.S.-defi ned benefi t pension plan assets
increased approximately 7% and 13% in 2005 and 2004,
respectively. Investment returns earned on assets held
by the Company’s benefi t plans are used to lower the
Company’s cost of providing pension and postretirement
benefi ts. Although there were no requirements under
the Employee Retirement Income Security Act of 1974
(“ERISA”) to fund the U.S. defi ned benefi t pension plan,
the Company contributed $68 million to the plan during
the year to maintain its fully funded status. Other pen-
sion plans in the Company were not fully funded as of
December 31, 2005. These plans, including the
Supplemental Executive Retirement Plan, and several
international plans had accrued liabilities associated
with their plans of $82.3 million and $51.3 million as of
December 31, 2005, respectively. For 2005, the Company
used 8.5% as its expected long-term rate of return for
U.S. pension and postretirement benefi t plan assump-
tions. The Company will continue to use this 8.5%
assumption rate in 2006. A new mortality table assump-
tion was adopted by the Company in 2005, moving
from the 1983 GAM mortality table to the RP-2000 CH
table. This mortality table change increased pension lia-
bilities by approximately 2%.
In the fourth quarter of 2005, the Company
announced changes in eligibility for retiree medical
board, wire and cable reels, and molded and extruded
plastics, along with the favorable impact of exchange
rates as the dollar weakened against foreign currencies,
also contributed to the sales gain. Domestic sales were
$2.3 billion, up 9.1% from 2004, and international sales
were $1.2 billion, up 17.4% over 2004, driven primarily
by the impact of a full year of sales from Sonoco-Alcore
and the impact of currency translation discussed above.
OPERATING PROFITS
Consolidated operating profi ts, which represent
“Income before income taxes” on the Consolidated
Statements of Income for 2005 and 2004, are comprised
of the following:
($ IN MILLIONS) 2005 2004 % CHANGE
Consumer Packaging Segment $103.5 $83.1 24.5%
Tubes and Cores/Paper Segment 107.0 113.0 (5.3)%
Packaging Services Segment 44.8 30.3 47.9%
All Other Sonoco 40.6 32.0 26.9%
Restructuring and Related
Impairment charges (21.2) (19.0) (11.6)%
Interest expense, net (43.6) (42.1) (3.6)%
Consolidated operating profi ts $231.1 $197.3 17.1%
Operating profi ts for 2005 increased primarily due
to savings resulting from ongoing productivity and pur-
chasing initiatives. The Company experienced a favor-
able price/cost relationship as sales price increases more
than offset higher material costs, most notably in the
Tubes and Cores/Paper segment. The full-year impact
of acquisitions also contributed to earnings growth.
Operating profi ts for 2005 were negatively impacted by
higher energy, labor and freight costs, as well as startup
costs associated with the Company’s new rigid plastic
container plant in Wisconsin. Volume, excluding acqui-
sitions, while contributing favorably to the sales growth,
had a negligible impact on profi ts, as the change in the
mix of products sold had an unfavorable effect on oper-
ating profi ts. In addition, approximately $24.8 million
of the increased sales in the Service Centers were on a
pass-through basis, with no gross margin, and therefore
had very little impact on profi ts. Gross profi t as a per-
centage of net sales was 18.7% in 2005, compared with
18.2% in 2004. As previously discussed, operating prof-
its included $21.2 million and $19 million of restructur-
ing charges in 2005 and 2004, respectively.
Selling, general and administrative expenses as a
percentage of sales increased slightly during the year to
10.3% from 9.8% in 2004. Included in 2005 expenses
36 S O N O C O 2 0 0 5

benefi ts effective January 1, 2006. These changes
included the elimination of a Company subsidy toward
the cost of retiree medical benefi ts if certain age and
service criteria were not met, as well as the elimination
of Company-provided prescription
drug benefi ts for the majority of its
retired and active employees. These changes, which will be amortized over a period of approximately fi ve years, will not have a notable impact on year-over-year expense
in 2006 as previous favorable plan
changes that had lowered expense
were fully amortized by the end of
2005.
Research and development
costs, all of which were charged to
expense, totaled $14.7 million and
$15.4 million in 2005 and 2004,
respectively. Signifi cant projects in
Sonoco’s Tubes and Cores/Paper
segment during 2005 included
efforts to design and develop a new
generation of products for the construction industry, and
to enhance performance characteristics of the
Company’s tubes and cores in the textile, fi lm and paper
packaging areas, as well as projects aimed at enhancing
productivity. The Consumer Packaging segment contin-
ued to invest in new materials technology and new pro-
cess technology for a range of packaging options.
Net interest expense increased by approximately
$1.5 million from $42.1 million in 2004 to $43.6 million
in 2005. The increase in net interest expense resulted
primarily from higher average interest rates, partially
offset by decreased debt levels and increased interest
income.
The effective tax rate for continuing operations in
2005 was 36.4%, compared with 29.8% in 2004.
Included in the effective tax rate for 2005 was the
impact of an additional $10.1 million expense associated
with the repatriation of $124.7 million in foreign earn-
ings under the AJCA. Included in the effective tax rate
for 2004 was the impact of the recognition of tax ben-
efi ts totaling approximately $9.3 million, resulting from
the IRS closing its examination of the Company’s tax
returns for years 1999 through 2001.
Net income for 2005 was $161.9 million, compared
with $151.2 million in 2004. This year-over-year increase
in net income is largely attributable to higher operating
profi ts, as previously discussed. In addition to the
unusual items impacting operating profi ts discussed
above and restructuring charges of approximately
$13.1 million, net income in 2005 was negatively
impacted by $10.1 million in additional tax expense
associated with the repatriation of foreign earnings.
Income for 2004 was positively impacted by $9.3 million
as a result of the recognition of certain tax benefi ts, and
was negatively impacted by after-tax charges for restruc-
turing of approximately $14.4 million along with other
unusual items previously discussed.
OPERATING SEGMENTS
In 2004, in conjunction with its acquisition of
CorrFlex, the Company reviewed the appropriateness of
disclosures about its reportable segments in accordance
with Statement of Financial Accounting Standards No.
131, ‘Disclosures about Segments of an Enterprise and
Related Information’ (FAS 131). As a result of this review,
the Company revised its reportable segments on a pro-
spective basis beginning with the third quarter of 2004.
Prior period information related to the Company’s
reportable segments in this report has been restated to
conform to the current presentation.
Prior to the third quarter of 2004, the Company
reported its results in two segments, Industrial
Packaging and Consumer Packaging. Beginning with
the third quarter of 2004, the Company began reporting
results in three segments – Tubes and Cores/Paper
(formerly known as Engineered Carriers and Paper),
Consumer Packaging and Packaging Services. Certain
smaller operations are reported as All Other Sonoco.
As part of the segment reporting changes in 2004,
certain businesses previously reported in the Industrial
Packaging reportable segment have been reclassifi ed as
components of All Other Sonoco. Upon the removal of
these businesses from the Industrial Packaging report-
able segment, the remaining operating segments are
those specifi cally related to the production of tubes and
cores, paper and recovered paper and, therefore, the
name of this reportable segment was changed to
Engineered Carriers and Paper. The Company’s specialty
paperboard business, which was previously a compo-
nent of the Consumer Packaging reportable segment,
has been reclassifi ed as a component of All Other
Sonoco. In conjunction with the acquisition of CorrFlex
in May 2004, the Company’s existing packaging services
operations, which were previously included in the
Consumer Packaging reportable segment, were com-
bined with those of CorrFlex, which resulted in a newly
created reportable segment – Packaging Services.
665
1,00
9 975 92
4
1,00
7
886
944
678
ASSETS BY CATEGORY
(MILL IONS OF DOLLARS)
$3000
2250
1500
750
922
663
01 02 03 04 05
798
755
842 1,
152
1,11
2
PP&E, NET
CURRENT ASSETS
OTHER
37A N N U A L R E P O R T

Effective December 31, 2005, the Company changed
the name of the Engineered Carriers and Paper segment
to Tubes and Cores/Paper because the term “tubes and
cores” is more generally understood than “engineered
carriers” in the marketplace for the primary products
offered by the businesses in this segment. There has been
no change to the businesses
included in the segment.
Operating profi ts at the segmen-
tal level is defi ned as the segments’
portion of “Income before income
taxes” on the Company’s Consoli-
dated Statements of Income,
adjusted for restructuring charges
and net interest expense. Because
segmental results are computed
based on the manner in which the
Company’s management reviews
fi nancial results, restructuring and
net interest charges are not consid-
ered in the calculation of operating
profi ts at the segmental level.
General corporate expenses, with
the exception of restructuring
charges, interest and income taxes,
have been allocated as operating
costs to each of the Company’s reportable segments and
All Other Sonoco.
See Note 16 to the Company’s Consolidated Financial
Statements for more information on reportable
segments.
Consumer Packaging Segment – Results for this seg-
ment are presented below:
($ IN MILLIONS) 2005 2004 % CHANGE
Trade sales $1,247.5 $1,132.1 10.2%
Operating profits 103.5 83.1 24.5%
Depreciation, depletion
and amortization 56.3 59.4 (5.2)%
Capital spending 50.8 50.7 0.2%
Sales in this segment increased due to increased sell-
ing prices of closures, composite cans and plastic pack-
aging. Higher volumes throughout the segment, but spe-
cifi cally in fl exible packaging, also contributed signifi -
cantly to the sales increases, as did the impact of favor-
able exchange rates, as the dollar weakened against for-
eign currencies. Overall, volumes were up nearly 5%
in the segment. Domestic sales were approximately
$894 million, up 6.6% from 2004, and international sales
were approximately $353 million, up 20.6% from 2004.
Operating profi ts in this segment were favorably
impacted by increased volumes, as well as productivity
and purchasing initiatives, partially offset by increased
costs of energy, freight and labor. Continued high
startup costs at the Company’s rigid plastics container
plant in Wisconsin also reduced operating profi ts in the
segment. Higher raw material costs, primarily steel and
aluminum, were largely offset by increased selling
prices.
Signifi cant spending included numerous productivity
and customer development projects in the United States
and Europe. The closures business continued to invest
in new capacity in Brazil to support increasing global
demand.
Tubes and Cores/Paper Segment – Results for this seg-
ment are presented below:
($ IN MILLIONS) 2005 2004 % CHANGE
Trade sales $1,482.1 $1,388.5 6.7%
Operating profits 107.1 113.0 (5.2)%
Depreciation, depletion
and amortization 83.7 85.2 (1.8)%
Capital spending 62.3 59.4 4.9%
The increase in sales was due primarily to the recog-
nition of a full-year’s impact of the Sonoco-Alcore joint
venture, which resulted in $86.6 million of higher sales.
The impact of favorable exchange rates as the dollar
weakened against foreign currencies along with
increased selling prices, was partially offset by lower
volume in North American and
European tubes and cores.
Volume, excluding the impact of
the joint venture, declined approx-
imately 2%, due primarily to
declines in the textile and news-
print industries. Domestic sales
decreased approximately $4 mil-
lion, or .5%, to $758 million and
international sales increased
approximately $98 million, or
15.6% to $724.1 million.
Operating profi ts in this seg-
ment was unfavorably impacted
by a charge of $12.5 million
related to an increase in the envi-
ronmental reserve at a Company
subsidiary’s paper operations in
Wisconsin; decreased volume, pri-
IDENT IF IABLE ASSETSCONSUMER PACKAGING SEGMENT
(BILL IONS OF DOLLARS)
$.8
.6
.4
.2
03 04 05
.74
.68 .7
4
IDENT IF IABLE ASSETSTUBES AND CORES/PAPER SEGMENT
(BILL IONS OF DOLLARS)
$1.2
.9
.6
.3
03 04 05
1.26
1.08 1.
11
38 S O N O C O 2 0 0 5

sales in the Company’s Service Centers were on a pass-
through basis and, therefore, had very little impact on
profi ts. The impact of infl ation partially offset the favor-
able variances discussed above.
Signifi cant spending included numerous productivity
and customer development projects in the United States
and Europe.
All Other Sonoco – Results for all other businesses not
included in the segments above are presented below:
($ IN MILLIONS) 2005 2004 % CHANGE
Trade sales $343.2 $313.8 9.3%
Operating profits 40.6 32.0 26.9%
Depreciation, depletion
and amortization 11.1 11.1 0.0%
Capital spending 11.1 6.4 73.4%
Sales for All Other Sonoco increased due to price
increases for molded and extruded plastics, wire and
cable reels, and protective packaging, along with higher
volumes in wire and cable reels and protective packag-
ing. Domestic sales were approximately $283 million, up
11.5% from 2004, and international sales were approxi-
mately $60 million, basically fl at compared with the
prior year.
Operating profi ts in All Other Sonoco increased due
primarily to manufacturing productivity and purchasing
initiatives and a favorable price/cost relationship, as the
Company was able to recover increases in raw material
costs, including lumber, resin and paper, via price
increases to the customers. Although higher volume was
a signifi cant reason for the increased sales, operating
profi ts were not impacted materially as changes in the
mix of products resulted in lower profi t margins.
Signifi cant spending included investing in customer
development projects in the United States and Europe
for molded and extruded plastics, protective packaging
and wire and cable reels.
FINANCIAL POSITION, LIQUIDITY AND CAPITAL RESOURCES
CASH FLOW
Cash fl ow from operations totaled $227.4 million in
2005, compared with $252.2 million in 2004. This
decrease is primarily attributed to higher contributions
to the Company’s pension plans, as $77 million was
contributed in 2005, versus $33.4 million in 2004. These
higher contributions were partially offset by increased
earnings, along with slightly lower inventory levels. The
U.S. Defi ned Benefi t Pension Plan was fully funded as
of December 31, 2005, and the Company froze partici-
marily in the textile and newsprint markets; and
increased costs of energy, freight and labor. These
increased costs were partially offset by year-over-year
savings from productivity and purchasing initiatives, and
a favorable price/cost relationship. A $5.6 million charge
associated with an accounting adjustment from a wholly
owned subsidiary in Spain, which
was related to prior years, was
recorded in 2004, as discussed
above under “Other Special Charges
and Income Items,” while 2005
results were impacted by a $3 mil-
lion asset impairment charge related
to operations in Asia.
This segment benefi ted by
approximately $8.9 million by hav-
ing energy hedges in place during
the period. However, the nature of
hedges is such that no assurances
can be made concerning future
benefi ts that may be realized from
these hedges.
Signifi cant capital spending
included the rebuilding and modifi -
cation of several paper mills, pri-
marily in the United States, Mexico
and Europe, and building new tube
and core plants in Asia.
Packaging Services Segment – Results for this segment
are presented below:
($ IN MILLIONS) 2005 2004 % CHANGE
Trade sales $455.9 $321.0 42.0%
Operating profits 44.8 30.3 47.9%
Depreciation, depletion
and amortization 12.0 8.2 46.3%
Capital spending 4.9 3.3 48.5%
Sales in this segment increased primarily due to the
recognition of a full-year’s impact of the May 2004
acquisition of CorrFlex. In addition, higher volumes
contributed $56.5 million to the increase in sales.
Domestic sales increased to $356.7 million, a 43.9%
increase, while international sales increased to $99.2
million, or 35.5%.
Although the increase in operating profi ts in this
segment is largely attributable to the full-year’s impact of
the acquisition of CorrFlex, productivity and purchasing
initiatives in the Service Centers also contributed to the
improvement. Approximately $25 million of increased
IDENT IF IABLE ASSETSPACKAGING SERV ICES SEGMENT
(BILL IONS OF DOLLARS)
$.4
.3
.2
.1
03 04 05
.32
.05
.32
39A N N U A L R E P O R T

CONTRACTUAL OBLIGATIONS
The following table summarizes contractual obliga-
tions at December 31, 2005:
PAYMENTS DUE IN 2007- 2009- BEYOND ($ IN MILLIONS) TOTAL 2006 2008 2010 2010
Debt obligations $ 781.6 $124.5 $ 4.5 $103.6 $549.0
Interest payments1 272.3 25.0 50.0 48.2 149.1
Operating leases 132.6 31.3 45.2 26.4 29.7
Environmental
remediation
(U.S. Mills) 12.5 .5 12.0
Purchase obligations2 149.0 15.3 20.7 19.1 93.9
Total contractual
obligations $1,348.0 $196.6 $132.4 $197.3 $821.7
1 Includes interest payments on outstanding fi xed-rate, long-term debt obligations that do not have associated fair value hedges as well as fi nancing fees on the backstop line of credit.
2 Includes only long-term contractual commitments. Does not include short-term obligations for the purchase of goods and services used in the ordinary course of business.
In December 2003, the Company entered into an
agreement with the majority shareholders of Demolli
Industria Cartaria S.p.A. (“Demolli”), an Italy-based man-
ufacturer of paperboard and tubes and cores, which is
currently 25% owned by the Company and reported as
an equity investment. This agreement allows the major-
ity shareholder to require (through a put option arrange-
ment) the Company to buy the shares not currently
owned by the Company at any time between the date
of the agreement and December 2006. The agreement
also gives the Company the right to purchase the shares
(through a call option arrangement) any time after
December 2006 through December 2009. The price of
the share purchase will be determined by a preset for-
mula, which the Company believes approximates fair
value, based on average adjusted earnings at a predeter-
mined multiplier at the time such shares might be put or
called. The Company is in discussion with the majority
shareholders of Demolli to potentially extend the terms
(both the put and the call) of this agreement.
In November 2004, and in conjunction with the
Sonoco-Alcore joint venture, the Company entered into
an agreement with Ahlstrom, the minority shareholder
of Sonoco-Alcore. This agreement states that, following
a two and one-half year standstill period, subject to cer-
tain conditions, Ahlstrom shall have the right, over the
next three and one-half years, to require (through a put
pation for newly hired salaried and non-union hourly
U.S. employees effective December 31, 2003. Based on
the current actuarial estimates and as a result of a
$68 million contribution, the Company anticipates that
only minimal contributions to this plan will be required
in 2006. The nature of pension plans, however, is that
estimates are made regarding investment returns and
actuarial assumptions and no assurances can be made
about the future funding requirements.
Cash fl ows used by investing activities decreased
from $378.2 million in 2004 to $119.3 million in 2005. In
2004, the Company invested $267 million in eight acqui-
sitions, the largest of which was CorrFlex. There were
no signifi cant acquisitions in 2005. Capital expenditures
increased by $9.3 million to $129.1 million from
$119.8 million in 2004. Capital expenditures in 2006 are
expected to continue to be in the $130 million range.
Net cash used by fi nancing activities totaled
$165.6 million in 2005, compared with net cash pro-
vided by fi nancing activities of $156 million in 2004.
Debt was reduced by $117.8 million as a result of cash
generated from operations and use of accumulated cash
balances. Cash dividends increased 6% to $90.1 million
during 2005.
Current assets decreased by $36.6 million to
$885.5 million at December 31, 2005. This decrease is
largely attributable to lower levels of cash, as a result of
repatriating foreign earnings under the AJCA, allowing
for the use of accumulated cash
balances. In 2004, current assets
increased by $166.8 million to
$922.1 million. This increase, due
in part to the impact of acquisi-
tions, resulted from higher levels
of cash, accounts receivable and
inventory. Current liabilities
decreased by $19.4 million to
$620.5 million at December 31,
2005. This decrease was due to
lower accounts payable, accrued
expenses and taxes payable, par-
tially offset by increases in current
portion of long-term debt. In
2004, current liabilities decreased
by $39.7 million to $639.9 million. This decrease resulted
from the repayment of $150 million in debentures in
November 2004, partially offset by increases in accounts
payable and accrued expenses. The current ratio was 1.4
at the end of 2005, compared with 1.4 and 1.1 at the end
of 2004 and 2003, respectively.
CURRENT RAT IO
1.6
1.2
.8
.4
01 02 03 04 05
1.4
1.2
1.4
1.1
1.4
40 S O N O C O 2 0 0 5

option arrangement) the Company to purchase its
shares in Sonoco-Alcore. During the seventh year, the
Company will have the right to purchase the shares
(through a call option arrangement). The price of the
share purchase will be determined by a preset formula,
which the Company believes approximates fair value,
related to an earnings multiple at the time such shares
might be put or called.
CAPITAL RESOURCES
Debt decreased by $125.4 million to $781.6 million at
December 31, 2005, primarily due to funds from opera-
tions, and use of accumulated cash balances. These
items were partially offset by increased international
borrowings at the Sonoco-Alcore joint venture in
Europe, in Australia and Canada, in Brazil for acquisi-
tions, and expansion at the Consumer Products joint
venture, and for the startup of the Packaging Services
plant in Poland.
The Company currently operates a commercial paper
program totaling $350 million and has fully committed
bank lines of credit supporting the program by a like
amount. In July 2004, the Company entered into a new
fi ve-year, $350 million credit agreement that also pro-
vides the Company with the option to increase its credit
line to $450 million subject to the concurrence of its
lenders. The Company intends to indefi nitely maintain
line of credit agreements fully supporting its commer-
cial paper program. The fi ve-year term on the existing
line of credit allows commercial paper borrowings up
to the maximum amount of the line of credit to be clas-
sifi ed as long-term debt. In 2003, the Company’s com-
mercial paper program totaled $450 million with a 364-
day backstop line of credit of the same amount that
could be extended under a term-out option. This credit
line expired in July 2004 and was replaced by the fi ve-
year line of credit discussed above. At December 31,
2005, the amount of the Company’s outstanding com-
mercial paper was $30 million, compared to $180 mil-
lion at December 31, 2004.
Interest expense totaled $51.6 million for the year
ended December 31, 2005, compared with $47.5 million
and $52.4 million for the years ended December 31,
2004 and 2003, respectively. The increase in 2005, com-
pared with 2004, was due to higher average interest
rates in the United States, partially offset by lower U.S.
debt levels, and the higher international debt levels
referred to above. The increased interest expense was
partially offset by an increase in interest income result-
ing from higher cash balances internationally (before
the repatriation dividends mentioned above).
Shareholders’ equity increased $110.4 million from
December 31, 2004, to $1.26 billion at December 31,
2005. The increase resulted mainly from net income of
$161.9 million in 2005 and stock option exercises of
$37.4 million, reduced by dividends of $90.1 million, a
foreign currency translation loss of $12.8 million, and
minimum pension liability adjustments of $.6 million.
Shareholders’ equity increased $138.7 million from
December 31, 2003, to $1.15 billion at December 31,
2004. The increase resulted mainly from net income
of $151.2 million in 2004, stock option exercises of
$34.5 million and foreign currency translation of
$36.9 million, reduced by dividends of $85.1 million
and minimum pension liability adjustments of $4.5 mil-
lion. The Company did not repurchase any of its com-
mon stock in 2005, but plans to repurchase between
2 million and 2.5 million shares of its outstanding stock
by the end of the fi rst quarter of 2006. At December 31,
2005 and 2004, the Company had remaining authoriza-
tions from its Board of Directors to repurchase approxi-
mately 5,290,000 shares of common stock.
Although the ultimate determination of whether to
pay dividends is within the sole discretion of the Board
of Directors, the Company plans to increase dividends
as earnings grow. Dividends per common share were
$.91 in 2005, $.87 in 2004 and $.84 in 2003.
OFF-BALANCE SHEET ARRANGEMENTS
The Company had no material off-balance sheet
arrangements at December 31, 2005.
RISK MANAGEMENT
As a result of operating globally, the Company is
exposed to market risk from changes in foreign
exchange rates. The exposure is well diversifi ed as the
Company’s facilities are spread throughout the world,
and the Company generally sells in the same countries
where it produces. The Company monitors these expo-
sures and may use traditional currency swaps and for-
ward foreign exchange contracts to hedge a portion of
the forecasted transactions that are denominated in for-
eign currencies, foreign currency assets and liabilities or
net investment in foreign subsidiaries. The Company’s
foreign operations are exposed to political and cultural
risks, but they are mitigated by diversifi cation and the
relative stability of the countries in which the Company
has signifi cant operations.
The Company is exposed to interest-rate fl uctuations
as a result of using debt as a source of fi nancing its
41A N N U A L R E P O R T

local environmental laws and regulations concerning,
among other matters, solid waste disposal, wastewater
effl uent and air emissions. Although the costs of compli-
ance have not been signifi cant due to the nature of the
materials and processes used in manufacturing opera-
tions, such laws also make generators of hazardous
wastes and their legal successors fi nancially responsible
for the cleanup of sites contaminated by those wastes.
The Company has been named a potentially responsible
party at several environmentally contaminated sites,
both owned and not owned by the Company. These
regulatory actions and a small number of private party
lawsuits are believed to represent the Company’s largest
potential environmental liabilities. Accordingly, the
Company has accrued approximately $16.8 million
(including $12.5 million associated with U.S. Mills) at
December 31, 2005, compared with approximately
$4.4 million at December 31, 2004, with respect to these
sites. See Note 14 to the Consolidated Financial
Statements for more information on environmental
matters.
RESULTS OF OPER ATIONS 2004 VERSUS 2003OPERATING REVENUE
Consolidated net sales for 2004 were $3.16 billion,
versus $2.76 billion in 2003, an increase of approxi-
mately $397 million.
The components of the sales change were
approximately:
($ IN MILLIONS)
Volume $124
Selling price 43
Currency exchange rate 70
Acquisitions 148
Other 12
Total sales increase $397
Sales for the year were higher due to increased vol-
umes, higher selling prices, the impact of acquisitions
and the favorable impact of foreign exchange rates, as
the dollar weakened against foreign currencies.
Companywide volume, including the impact of acquisi-
tions, was approximately 10% higher than 2003. Domes-
tic sales were $2.11 billion, up 13.6% from 2003, and
international sales were $1.05 billion, up 16.1% over 2003.
OPERATING PROFITS
Consolidated operating profi ts, which represent
“Income before income taxes” on the Consolidated
operations. When necessary, the Company uses tradi-
tional, unleveraged interest-rate swaps to manage its mix
of fi xed and variable rate debt to maintain its exposure
to interest rate movements within established ranges. All
interest-rate swaps qualifi ed as fair-value hedges, where-
by fi xed interest rates are swapped for fl oating rates.
The Company is a purchaser of commodities such as
recovered paper, energy, steel, aluminum and resin. The
Company does not engage in material hedging of many
commodities, other than energy, because there is usu-
ally a high correlation between the commodity cost and
the ultimate selling price of its products. Commodities
are generally purchased at market or fi xed prices that
are established with the vendor as part of the purchase
process for quantities expected to be consumed in the
ordinary course of business. On occasion, where the
correlation between selling price and commodity price
is less direct, the Company may enter into commodity
futures or swaps to reduce the effect of price
fl uctuations.
At the end of 2005, the Company had commodity
swaps outstanding to fi x the costs of a portion of raw
materials and energy for 2006 through June 2008. The
swaps qualify as cash fl ow hedges under Statement of
Financial Accounting Standards No. 133, ‘Accounting for
Derivative Instruments and Hedging Activities’ (“FAS
133”). As of December 31, 2005, the Company had
swaps to cover approximately 4.4 million MMBTUs
(million British thermal units) of natural gas at an aver-
age cost of $5.91 per MMBTU. The use of derivatives to
hedge other commodities or foreign exchange was not
material as of that date.
The fair market value of commodity swaps was a net
favorable position of $17.5 million ($11.2 million after
tax) and $3.4 million ($2.2 million after tax) at
December 31, 2005 and 2004, respectively. Commodity
swaps having a favorable position are refl ected as a
component of “Other Assets” on the Company’s
Consolidated Financial Statements while those having
an unfavorable position are refl ected as a component of
“Other Liabilities.” Derivatives are marked to fair value
using published market prices, if available, or estimated
values based on current price quotes and a discounted
cash fl ow model. See Note 10 to the Consolidated
Financial Statements for more information on fi nancial
instruments.
Except for the impact on energy and raw material
prices, infl ation did not have a material effect on the
Company’s operations in 2005, 2004 or 2003.
The Company is subject to various federal, state and
42 S O N O C O 2 0 0 5

Statements of Income for 2004 and 2003, are comprised
of the following:
($ IN MILLIONS) 2004 2003 % CHANGE
Consumer Packaging Segment $ 83.1 $ 78.7 5.6%
Tubes and Cores/Paper Segment 113.0 103.0 9.7%
Packaging Services Segment 30.3 7.9 >100%
All Other Sonoco 32.0 19.0 68.4%
Restructuring and Related
Impairment charges (19.0) (50.1) 62.1%
Interest expense, net (42.1) (50.2) 16.1%
Consolidated operating profits $197.3 $108.3 82.2%
Operating profi ts for 2004 increased due to higher
volumes, the accretive impact of acquisitions and savings
resulting from ongoing productivity and purchasing ini-
tiatives. Operating profi ts for 2004 were negatively
impacted by higher energy costs, product startup costs
associated with the Company’s new multiline steel easy-
open closure operation in Brazil and new rigid plastic
container plants in California and Wisconsin, as well as
the costs associated with the movement of production
between plants. The Company experienced increased
costs for raw materials, primarily for old corrugated con-
tainers (“OCC”), the Company’s primary raw material,
and steel. The higher OCC costs were nearly offset
through price increases for tubes and cores and for trade
sales of recovered paper, and a signifi cant portion of the
increased steel costs were offset in the fi rst quarter of
2005, due to contractual pass through provisions. Gross
profi t as a percentage of net sales was 18.2% in 2004,
compared with 18.1% in 2003. As previously discussed
under “Restructuring Charges, Unusual Items and Other
Activities,” operating profi ts included $19 million and
$50.1 million of restructuring charges in 2004 and 2003,
respectively.
Selling, general and administrative expenses as a per-
centage of sales remained relatively fl at at approximately
10%. In 2004, the Company continued to focus on con-
trolling fi xed cost spending, as it realized the majority of
the benefi ts from restructuring actions started in 2003.
During 2004, income before income taxes was nega-
tively impacted by charges of approximately $5.6 million
pretax, which the Company incurred to recognize com-
mitments to pay future costs associated with new execu-
tive life insurance benefi ts as discussed above under
“Restructuring Charges, Unusual Items and Other
Activities – Other Special Charges and Income Items.”
Income before income taxes for 2004 was also nega-
tively impacted by a charge of approximately $4.5 mil-
lion pretax associated with an unfavorable legal judg-
ment that was entered against the Company.
During 2004, the Company experienced lower year-
over-year pension and postretirement expense of
approximately $11 million pretax, primarily related to the
impact of the Company’s adoption of FASB Staff Position
106-2, ‘Accounting and Disclosure Requirements Related
to the Medicare Prescription Drug, Improvement and
Modernization Act of 2003’ (“FSP 106-2”). As a result of
the Company’s adoption of FSP 106-2, the accumulated
postretirement benefi t obligation was reduced by
approximately $48.9 million, and net periodic benefi t
costs were reduced by approximately $9.1 million for
2004. The market value of U.S. benefi t plan assets
increased approximately 13% and 26% in 2004 and
2003, respectively. Investment returns earned on assets
held by the Company’s benefi t plans are used to lower
the Company’s cost of providing pension and postretire-
ment benefi ts. There were no requirements under ERISA
to fund the plan. For 2004, the Company used 8.5% as
its expected long-term rate of return for U.S. pension
and postretirement benefi t plan assumptions.
Research and development costs charged to expense
were $15.4 million and $14.2 million in 2004 and 2003,
respectively. Signifi cant projects in Sonoco’s Tubes and
Cores/Paper segment during 2004 included efforts to
design and develop a new generation of products for the
construction industry, and to enhance performance char-
acteristics of the Company’s tubes and cores in the tex-
tile, fi lm and paper packaging areas, as well as projects
aimed at enhancing productivity. The Consumer
Packaging segment continued to invest in new materials
technology and new process technology for a range of
packaging options, including composite cans and other
forms of shaped packaging during 2004.
Net interest expense decreased by approximately
$8.2 million from 2003. The decrease in net-interest
expense resulted primarily from lower average interest
rates and increased interest income.
The effective tax rate for continuing operations in
2004 was 29.8%, compared with 34.8% in 2003.
Included in the effective tax rate for 2004 was the impact
of the recognition of certain tax benefi ts. These tax ben-
efi ts totaled approximately $9.3 million and resulted from
the IRS closing its examination of the Company’s tax
returns for years 1999 through 2001. Also included in the
effective tax rate for 2004 are tax benefi ts associated
with the Medicare Prescription Drug, Improvement and
Modernization Act of 2003, which were partially offset
by certain non-deductible foreign restructuring charges.
43A N N U A L R E P O R T

Included in the effective tax rate for 2003 is the impact
of certain non-deductible foreign restructuring charges.
Net income for 2004 was $151.2 million, versus
$138.9 million (including discontinued operations) in
2003. Income from continuing operations for 2004 was
$151.2 million, compared with $78.2 million in 2003. Net
income included restructuring charges of $14.4 million
after tax, compared with restructuring charges of
$36.8 million after tax in 2003. 2004 net income also
included after-tax charges of $3.6 million, which the
Company incurred to recognize vested commitments to
pay future costs associated with the new executive life
insurance benefi ts that replaced split-dollar life agree-
ments made with key executives since 1995; $5.6 million
related to prior years for an adjustment in the expenses
reported for the Company’s wholly owned subsidiary in
Spain; and approximately $2.9 million related to an
unfavorable legal judgment against the Company.
Although foreign exchange rates had an impact on sales,
they did not have a signifi cant impact on earnings in
2004.
OPERATING SEGMENTS
Consumer Packaging Segment – Results for this seg-
ment are presented below:
($ IN MILLIONS) 2004 2003 % CHANGE
Trade sales $1,132.1 $1,044.4 8.4%
Operating profits 83.1 78.7 5.6%
Depreciation, depletion
and amortization 59.4 52.5 13.1%
Capital spending 50.7 51.0 (0.6)%
Sales for the segment increased due to higher vol-
ume, price increases and the favorable impact of foreign
exchange translation. Overall, volumes in this segment,
excluding the impact of acquisitions, increased approxi-
mately 5%. Domestic sales were approximately
$839 million, up 4.8% from 2003, and international sales
were approximately $293 million, up 20.4% from 2003.
Earnings in this segment were favorably impacted by
increased volumes, as well as productivity and purchas-
ing initiatives, partially offset by infl ation and product
startup costs associated with the Company’s new multi-
line steel easy-open closure operation in Brazil and new
rigid plastic container plants in California and
Wisconsin, as well as the costs associated with the
movement of production between plants. Earnings in
this segment were negatively impacted by an unfavor-
able price/cost relationship, as material costs, primarily
steel, increased signifi cantly. In response to those cost
increases, the Company began raising prices in the sec-
ond half of 2004, and continued to raise prices in 2005,
as allowed by contractual pass-through provisions.
Signifi cant spending in 2004 included building two
new plants in the United States and numerous produc-
tivity and customer development projects in the United
States and Europe. The closures business continued to
invest in new capacity in Brazil to support increasing
global demand.
Tubes and Cores/Paper Segment (formerly known as
Engineered Carriers and Paper) – Results for this seg-
ment are presented below:
($ IN MILLIONS) 2004 2003 % CHANGE
Trade sales $1,388.5 $1,259.8 10.2%
Operating profits 113.0 103.0 9.8%
Depreciation, depletion
and amortization 85.2 83.6 1.9%
Capital spending 59.4 48.6 22.2%
The increase in sales was due primarily to the impact
of favorable exchange rates, as the dollar weakened
against foreign currencies, higher average selling prices,
increased volume and the impact of two months of sales
resulting from the formation of Sonoco-Alcore. Overall,
volumes in this segment, excluding the impact of acqui-
sitions and the formation of Sonoco-Alcore, increased
approximately 2%. Domestic sales increased approxi-
mately $45 million, or 6.2%, and international sales
increased approximately $84 million, or 15.5%.
Earnings in this segment were favorably impacted by
increased volumes and by productivity and purchasing
initiatives, partially offset by higher energy costs, the
impact of infl ation and an adjustment in expenses at the
Company’s subsidiary in Spain. This segment also expe-
rienced higher OCC costs, as the domestic price of OCC
increased by an average of approximately 28% from
2003 to 2004. These increased costs were largely offset
through price increases for tubes and cores and for trade
sales of recovered paper.
Signifi cant capital spending included the rebuilding
and modifi cation of several paper mills, primarily in the
United States, Mexico and Europe and building new
tube and core plants in Asia.
Packaging Services Segment – Results for this seg-
ment are presented in the table following:
44 S O N O C O 2 0 0 5
($ IN MILLIONS) 2004 2003 % CHANGE
Trade sales $321.0 $184.6 73.9%
Operating profits 30.3 7.9 >100%
Depreciation, depletion
and amortization 8.2 3.5 >100%
Capital spending 3.3 5.1 (35.3)%
Sales in this segment increased primarily due to the
acquisition of CorrFlex in May 2004. See Note 2 to the
Company’s Consolidated Financial Statements for further
information about the impact of this acquisition. Sales in
pre-existing operations in this segment increased due to
volume and mix changes. Overall, volumes in this seg-
ment, excluding the impact of acquisitions, were up
approximately 8%. Domestic sales were $248 million,
up over 100% from 2003, and international sales were
$73 million, up 16.7% from 2003.
Although the increase in earnings in this segment is
primarily attributable to the acquisition of CorrFlex, pro-
ductivity and purchasing initiatives in pre-existing oper-
ations also contributed to the improvement. A slight vol-
ume improvement was offset by the impact of infl ation.
Signifi cant spending included numerous productivity
and customer development projects in the United States
and Europe.
All Other Sonoco – Results for all other businesses not
included in the segments above are presented below:
($ IN MILLIONS) 2004 2003 % CHANGE
Trade sales $313.8 $269.5 16.4%
Operating profi ts 32.0 19.0 68.4%
Depreciation, depletion
and amortization 11.1 13.0 (14.6%)
Capital spending 6.4 3.8 68.4%
Sales for All Other Sonoco increased due to volume
and price increases in molded and extruded plastics,
wire and cable reels, and protective packaging. In addi-
tion, the impact of favorable foreign exchange transla-
tion, along with the impact of a small acquisition,
increased sales in All Other Sonoco. Domestic sales
were approximately $253 million, up 15.6% from 2003,
and international sales were approximately $60 million,
up 20.2% from 2003.
Operating profi ts in All Other Sonoco increased due
to volume improvements, along with manufacturing pro-
ductivity and purchasing initiatives. All Other Sonoco
also recognized a slightly positive price/cost relation-
ship, as the Company was able to recover increases in
raw material costs, including lumber, resin and paper,
via price increases to the customers as well as material
purchasing initiatives.
Signifi cant spending included investing in customer
development projects in the United States and Europe
for molded and extruded plastics.
CRIT ICAL ACCOUNTING POL IC IES AND EST IM ATES
The Company’s analysis and discussion of its fi nan-
cial condition and results of operations are based upon
its Consolidated Financial Statements, which have been
prepared in accordance with accounting principles gen-
erally accepted in the United States (“US GAAP”). The
preparation of fi nancial statements in conformity with
US GAAP requires management to make estimates and
assumptions that affect the reported amounts of assets,
liabilities, revenues and expenses, and the disclosure of
contingent assets and liabilities. The Company evaluates
these estimates and assumptions on an ongoing basis,
including but not limited to those related to inventories,
bad debts, derivatives, income taxes, intangible assets,
restructuring, pension and other postretirement benefi ts,
environmental liabilities and contingencies and litigation.
Estimates and assumptions are based on historical and
other factors believed to be reasonable under the cir-
cumstances. The results of these estimates may form the
basis of the carrying value of certain assets and liabili-
ties and may not be readily apparent from other sources.
Actual results, under conditions and circumstances, dif-
ferent from those assumed, may differ from estimates.
The impact and any associated risks related to estimates,
assumptions and accounting policies are discussed in
Management’s Discussion and Analysis of Financial
Condition and Results of Operations, as well as in the
Notes to the Consolidated Financial Statements, if appli-
cable, where such estimates, assumptions and account-
ing policies affect the Company’s reported and expected
fi nancial results.
The Company believes the accounting policies dis-
cussed in the Notes to the Consolidated Financial
Statements on pages 53 through 75 are critical to its
business operations, and the understanding of results of
operations. The following represents those policies
which most involve the more signifi cant judgments and
estimates used in the preparation of its Consolidated
Financial Statements.
IMPAIRMENT OF LONG-LIVED AND INTANGIBLE ASSETS
The Company evaluates its long-lived assets (prop-
erty, plant and equipment) and defi nite-lived intangible
assets for impairment whenever indicators of impair-
45A N N U A L R E P O R T

ment exist, or when it commits to sell the asset. The
accounting standards require that if the sum of the
undiscounted expected future cash fl ows from a long-
lived asset or defi nite-lived intangible asset is less than
the carrying value of that asset, an asset impairment
charge must be recognized. The amount of the impair-
ment charge is calculated as the excess of the asset’s
carrying value over its fair value, which generally repre-
sents the discounted future cash fl ows from that asset,
or in the case of assets the Company evaluates for sale,
at fair value less costs to sell. A number of signifi cant
assumptions and estimates are involved in developing
operating cash fl ow forecasts for the Company’s dis-
counted cash fl ow model, including markets and market
share, sales volumes and prices, costs to produce, work-
ing capital changes and capital spending requirements.
The Company considers historical experience, and all
available information at the time the fair values of its
assets are estimated. However, fair values that could be
realized in an actual transaction may differ from those
used to evaluate the impairment of long-lived assets and
defi nite-lived intangible assets. Therefore, assumptions
and estimates used in the determination of impairment
losses may affect the carrying value of long-lived and
intangible assets, and possible impairment expense in
the Company’s Consolidated Financial Statements.
IMPAIRMENT OF GOODWILL
In accordance with Statement of Financial Accounting
Standards No. 142, ‘Goodwill and Other Intangible
Assets’ (“FAS 142”), the Company evaluates its goodwill
for impairment at least annually, and more frequently if
indicators of impairment are present. FAS 142 requires
that if the fair value of a reporting unit is less than its
carrying value including goodwill (Step I), an impair-
ment charge for goodwill must be recognized. The
impairment charge is calculated as the difference
between the implied fair value of the reporting unit
goodwill and its carrying value (Step II).
The Company’s reporting units are the same as its
operating segments, as determined in accordance with
FAS 131. Accordingly, these reporting units refl ect the
way the Company manages its business, and impair-
ment testing at this reporting unit level refl ects how the
Company is managed overall. The components within
these reporting units serve similar types of customers,
provide similar services and operate in similar regula-
tory environments. The benefi ts of goodwill are shared
by each component.
In performing the impairment evaluation required by
FAS 142, the Company estimates the fair value of each
reporting unit and compares it to the carrying amount
of that reporting unit. To the extent the carrying amount
of a reporting unit exceeds the fair value of that report-
ing unit; the Company is required to perform the sec-
ond step of the impairment test. In this step, the
Company compares the implied fair value of the report-
ing unit goodwill with the carrying amount of the
reporting unit goodwill. The implied fair value of good-
will is determined by allocating the fair value of the
reporting unit to all of the assets (recognized and unrec-
ognized), and liabilities of the reporting unit. The resid-
ual fair value after this allocation is the implied fair
value of the reporting unit goodwill.
The Company uses a discounted cash fl ow model to
estimate the fair value of each reporting unit. The
Company considers historical experience and all avail-
able information at the time the fair values of its busi-
nesses are estimated. However, fair values that could be
realized in an actual transaction may differ from those
used to evaluate the impairment of goodwill. Therefore,
assumptions and estimates used in the determination of
impairment losses may affect the carrying value and
possible impairment expense in the Company’s
Consolidated Financial Statements. The annual evalua-
tion of goodwill impairment that was completed during
2005 used forward-looking projections, including
expected improvement in results at certain reporting
units, most notably, the European operations within the
Tubes and Cores/Paper segment, to which $66,900 of
goodwill is attributed. The assessment of the relevant
facts and circumstances is ongoing, and if actual perfor-
mance in this reporting unit falls signifi cantly short of
the projected results, it is reasonably possible that a non-
cash impairment charge would be required.
INCOME TAXES
The Company records an income tax valuation allow-
ance when the realization of certain deferred tax assets,
net operating losses and capital loss carryforwards is not
likely. These deferred tax assets represent expenses rec-
ognized for fi nancial reporting purposes, which will
result in tax deductions over varying future periods.
Certain judgments, assumptions and estimates may
affect the carrying value of the valuation allowance and
deferred income tax expense in the Company’s Conso-
lidated Financial Statements. Additionally, the Company
periodically reviews assumptions and estimates of the
Company’s probable tax obligations using historical
experience in tax jurisdictions and informed judgments.
46 S O N O C O 2 0 0 5

STOCK COMPENSATION PLANS
As permitted by Statement of Financial Accounting
Standards No. 123, ‘Accounting for Stock-based
Compensation’ (“FAS 123”), the Company has chosen to
continue to account for stock-based compensation using
the intrinsic value method prescribed in Accounting
Principles Board Opinion No. 25, ‘Accounting for Stock
Issued to Employees,’ and its related interpretations.
Accordingly, compensation cost for stock options is mea-
sured as the excess, if any, of the quoted market price of
the Company’s stock at the date of the grant over the
amount an employee must pay to acquire the stock.
Compensation cost for performance stock options is rec-
ognized over the vesting period, and is recorded based
on the quoted market price of the Company’s stock at
the end of the period.
The Company records compensation expense associ-
ated with performance-based stock compensation plans
using vesting assumptions that are derived from perfor-
mance measures as defi ned in the plans. In 2005, per-
formance measures consisted of Earnings Per Share and
Return on Net Assets Employed. Certain judgments,
assumptions and estimates in connection with the future
achievement of these performance measures may affect
the amount of accrued compensation expense and per-
formance-based stock compensation expense in the
Company’s Consolidated Financial Statements.
PENSION AND POSTRETIREMENT BENEFIT PLANS
The Company has signifi cant pension and postretire-
ment benefi t costs that are developed from actuarial val-
uations. The actuarial valuations employ key assump-
tions, which are particularly important when determin-
ing the Company’s projected liabilities for pension and
other postretirement benefi ts. Key actuarial assumptions
used in determining the projected benefi t obligation, the
accumulated benefi t obligation, and net periodic benefi t
cost (income) for U.S. retirement and retiree health and
life insurance plans include: a discount rate of 5.5% to
determine benefi t obligations, a discount rate of 5.75%
to determine net periodic benefi t cost (income), an
expected long-term rate of return of 8.5% and a rate of
compensation increase of 4.6%. These assumptions are
as of December 31, 2005.
The Company adjusts its discount rate annually in
relationship to movements in high-quality debt instru-
ments. The long-term rate of return assumption is based
on the Company’s historical plan return performance.
The rate of compensation assumption is generally based
on salary and incentive increases. A key assumption for
the U.S. health and life insurance plan is a medical trend
rate beginning at 13.3% and trending down to an ulti-
mate rate of 6.0% in 2014. The ultimate trend rate of
6.0% represents the Company’s best estimate of the long-
term average annual medical cost increase over the dura-
tion of the plan’s liabilities. It provides for real growth in
medical costs in excess of the overall infl ationary level.
During 2005, the Company incurred total pension
and postretirement benefi t expenses of approximately
$43 million, compared with $45.8 million during 2004.
The 2005 amount is net of $75.2 million of expected
returns on plan assets at the assumed rate of 8.5%, and
includes interest cost of $67.6 million at a discount rate
of 5.75%. The 2004 amount is net of $69.5 million of
expected returns on plan assets at the assumed rate of
8.5%, and includes interest cost of $66.4 million at a dis-
count rate of 6.25%. During 2005, the Company made
contributions to pension plans of $77 million and post-
retirement plans of approximately $8.1 million. The con-
tribution amount varies from year to year depending on
factors including market asset volatility and interest rates.
Although the cash portion of these contributions
reduced cash fl ows from operations during the year,
under Statement of Financial Accounting Standards No.
87, ‘Employers’ Accounting for Pensions’ (FAS 87), they
did not have an immediate signifi cant impact on pen-
sion expense. Unrecognized net actuarial losses were
approximately $496.8 million at December 31, 2005, and
are primarily the result of poor asset performance dur-
ing 2000 through 2002. The amortization period for
unrecognized losses/gains is approximately 11 years for
the portion outside the 10% corridor as defi ned by FAS
87, except for curtailments, which would result in accel-
erated expense.
The projected liability of these plans will be affected
by assumptions regarding infl ation, investment returns,
market interest rates, changes in the number of plan
participants and changes in the benefi t obligations, and
laws and regulations pertaining to benefi t obligations.
The Company annually reevaluates assumptions used in
projecting the pension and postretirement liabilities and
associated expense. These judgments, assumptions and
estimates may affect the carrying value of pension and
postretirement plan assets and liabilities and pension
and postretirement plan expenses in the Company’s
Consolidated Financial Statements. The effect of lower-
ing the selected assumptions, excluding any changes to
the investment base, is shown below for the year ended
December 31, 2005, for U.S. plans, assuming no changes
in benefi t levels in 2005:
47A N N U A L R E P O R T
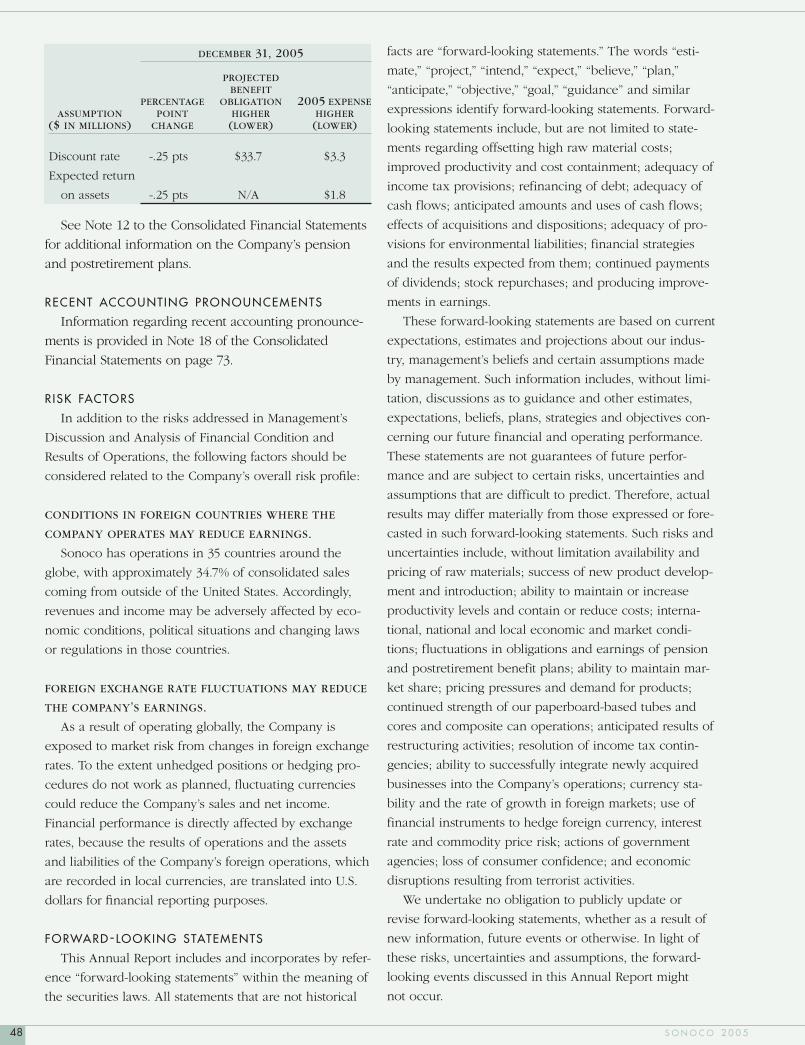
DECEMBER 31, 2005
PROJECTED BENEFIT PERCENTAGE OBLIGATION 2005 EXPENSE ASSUMPTION POINT HIGHER HIGHER ($ IN MILLIONS) CHANGE (LOWER) (LOWER)
Discount rate -.25 pts $33.7 $3.3
Expected return
on assets -.25 pts N/A $1.8
See Note 12 to the Consolidated Financial Statements
for additional information on the Company’s pension
and postretirement plans.
RECENT ACCOUNTING PRONOUNCEMENTS
Information regarding recent accounting pronounce-
ments is provided in Note 18 of the Consolidated
Financial Statements on page 73.
R ISK FACTORS
In addition to the risks addressed in Management’s
Discussion and Analysis of Financial Condition and
Results of Operations, the following factors should be
considered related to the Company’s overall risk profi le:
CONDITIONS IN FOREIGN COUNTRIES WHERE THE
COMPANY OPERATES MAY REDUCE EARNINGS. Sonoco has operations in 35 countries around the
globe, with approximately 34.7% of consolidated sales
coming from outside of the United States. Accordingly,
revenues and income may be adversely affected by eco-
nomic conditions, political situations and changing laws
or regulations in those countries.
FOREIGN EXCHANGE RATE FLUCTUATIONS MAY REDUCE THE COMPANY’S EARNINGS. As a result of operating globally, the Company is
exposed to market risk from changes in foreign exchange
rates. To the extent unhedged positions or hedging pro-
cedures do not work as planned, fl uctuating currencies
could reduce the Company’s sales and net income.
Financial performance is directly affected by exchange
rates, because the results of operations and the assets
and liabilities of the Company’s foreign operations, which
are recorded in local currencies, are translated into U.S.
dollars for fi nancial reporting purposes.
FORWARD-LOOKING STATEMENTS
This Annual Report includes and incorporates by refer-
ence “forward-looking statements” within the meaning of
the securities laws. All statements that are not historical
facts are “forward-looking statements.” The words “esti-
mate,” “project,” “intend,” “expect,” “believe,” “plan,”
“anticipate,” “objective,” “goal,” “guidance” and similar
expressions identify forward-looking statements. Forward-
looking statements include, but are not limited to state-
ments regarding offsetting high raw material costs;
improved productivity and cost containment; adequacy of
income tax provisions; refinancing of debt; adequacy of
cash flows; anticipated amounts and uses of cash flows;
effects of acquisitions and dispositions; adequacy of pro-
visions for environmental liabilities; financial strategies
and the results expected from them; continued payments
of dividends; stock repurchases; and producing improve-
ments in earnings.
These forward-looking statements are based on current
expectations, estimates and projections about our indus-
try, management’s beliefs and certain assumptions made
by management. Such information includes, without limi-
tation, discussions as to guidance and other estimates,
expectations, beliefs, plans, strategies and objectives con-
cerning our future financial and operating performance.
These statements are not guarantees of future perfor-
mance and are subject to certain risks, uncertainties and
assumptions that are difficult to predict. Therefore, actual
results may differ materially from those expressed or fore-
casted in such forward-looking statements. Such risks and
uncertainties include, without limitation availability and
pricing of raw materials; success of new product develop-
ment and introduction; ability to maintain or increase
productivity levels and contain or reduce costs; interna-
tional, national and local economic and market condi-
tions; fluctuations in obligations and earnings of pension
and postretirement benefit plans; ability to maintain mar-
ket share; pricing pressures and demand for products;
continued strength of our paperboard-based tubes and
cores and composite can operations; anticipated results of
restructuring activities; resolution of income tax contin-
gencies; ability to successfully integrate newly acquired
businesses into the Company’s operations; currency sta-
bility and the rate of growth in foreign markets; use of
financial instruments to hedge foreign currency, interest
rate and commodity price risk; actions of government
agencies; loss of consumer confidence; and economic
disruptions resulting from terrorist activities.
We undertake no obligation to publicly update or
revise forward-looking statements, whether as a result of
new information, future events or otherwise. In light of
these risks, uncertainties and assumptions, the forward-
looking events discussed in this Annual Report might
not occur.
48 S O N O C O 2 0 0 5

CONSOLIDATED BA LANCE SHEETS
SONOCO PRODUCTS COMPANY AND CONSOLIDATED SUBSIDIARIES
(Dollars and shares in thousands)AT DECEMBER 31 2005 2004AssetsCurrent Assets
Cash and cash equivalents $ 59,608 $ 117,725Trade accounts receivable, net of allowances of
$8,325 in 2005 and $8,286 in 2004 413,209 390,024Other receivables 45,225 37,457Inventories
Finished and in process 124,891 123,924Materials and supplies 193,425 191,087
Prepaid expenses 23,068 36,386Deferred income taxes 26,074 25,509
885,500 922,112Property, Plant and Equipment, Net 943,951 1,007,295Goodwill 573,903 570,508Other Intangible Assets 73,037 88,790Prepaid Pension Costs 281,904 237,200Other Assets 223,445 215,414
Total Assets $ 2,981,740 $ 3,041,319
Liabilities and Shareholders’ EquityCurrent Liabilities
Payable to suppliers $ 265,219 $ 274,224Accrued expenses and other 186,559 219,123Accrued wages and other compensation 44,082 36,850Notes payable and current portion of long-term debt 124,530 93,754Accrued taxes 96 15,935
620,486 639,886Long-term Debt 657,075 813,207Pension and Other Postretirement Benefits 173,939 148,214Deferred Income Taxes 146,981 168,776Other Liabilities 119,945 118,357Commitments and ContingenciesShareholders’ Equity
Serial preferred stock, no par valueAuthorized 30,000 shares0 shares issued and outstanding as of December 31, 2005 and 2004
Common shares, no par valueAuthorized 300,000 shares99,988 and 98,500 shares issued and outstanding
at December 31, 2005 and 2004, respectively 7,175 7,175Capital in excess of stated value 418,668 376,750Accumulated other comprehensive loss (106,389) (103,155)Retained earnings 943,860 872,109
Total Shareholders’ Equity 1,263,314 1,152,879Total Liabilities and Shareholders’ Equity $ 2,981,740 $ 3,041,319
The Notes beginning on page 53 are an integral part of these financial statements.
49A N N U A L R E P O R T

CONSOLIDATED STATEMENTS OF INCOME
SONOCO PRODUCTS COMPANY AND CONSOLIDATED SUBSIDIARIES
(Dollars and shares in thousands except per share data)YEARS ENDED DECEMBER 31 2005 2004 2003Net sales $ 3,528,574 $ 3,155,433 $ 2,758,326Cost of sales 2,867,623 2,580,643 2,259,887Selling, general and administrative expenses 364,967 316,403 289,839Restructuring charges 21,237 18,982 50,056Income before interest and taxes 274,747 239,405 158,544Interest expense 51,559 47,463 52,399Interest income (7,938) (5,400) (2,188)Income before income taxes 231,126 197,342 108,333Provision for income taxes 84,174 58,858 37,698Income before equity in earnings of affiliates/minority interest
in subsidiaries 146,952 138,484 70,635Equity in earnings of affiliates/minority interest in subsidiaries 14,925 12,745 7,543Income from continuing operations 161,877 151,229 78,178Income from discontinued operations, net of income taxes 60,771Net income $ 161,877 $ 151,229 $ 138,949
Average common shares outstanding:Basic 99,336 98,018 96,819Assuming exercise of options 1,082 929 310Diluted 100,418 98,947 97,129
Per common shareNet income
Basic:From continuing operations $ 1.63 $ 1.54 $ .81From discontinued operations $ $ $ .63Net income $ 1.63 $ 1.54 $ 1.44
Diluted:From continuing operations $ 1.61 $ 1.53 $ .80From discontinued operations $ $ $ .63Net income $ 1.61 $ 1.53 $ 1.43
Cash dividends - common $ .91 $ .87 $ .84
The Notes beginning on page 53 are an integral part of these financial statements.
50 S O N O C O 2 0 0 5

SONOCO PRODUCTS COMPANY AND CONSOLIDATED SUBSIDIARIES
AccumulatedCapital in Other
Comprehensive Common Shares Excess of Comprehensive Retained(Dollars and shares in thousands) Income Outstanding Amount Stated Value Loss EarningsJanuary 1, 2003 96,380 $ 7,175 $ 324,295 $ (212,164) $ 748,119Net income $ 138,949 138,949Other comprehensive
income (loss):Translation gain 77,903Minimum pension liability
adjustment, net of tax (3,403)Derivative financial
instruments, net of tax 1,573Other comprehensive income 76,073 76,073
Comprehensive income $ 215,022Cash dividends (81,128)Exercise of stock options 589 8,752Stock-based compensation 4,089December 31, 2003 96,969 7,175 337,136 (136,091) 805,940Net income $ 151,229 151,229Other comprehensive
income (loss):Translation gain 36,917Minimum pension liability
adjustment, net of tax (4,479)Derivative financial
instruments, net of tax 498Other comprehensive income 32,936 32,936
Comprehensive income $ 184,165Cash dividends (85,060)Exercise of stock options 1,531 34,463Stock-based compensation 5,151December 31, 2004 98,500 7,175 376,750 (103,155) 872,109Net income $ 161,877 161,877Other comprehensive
income (loss):Translation loss (12,844)Minimum pension liability
adjustment, net of tax 568Derivative financial
instruments, net of tax 9,042Other comprehensive loss (3,234) (3,234)
Comprehensive income $ 158,643Cash dividends (90,126)Exercise of stock options 1,488 37,370Stock-based compensation 4,548December 31, 2005 99,988 $ 7,175 $ 418,668 $ (106,389) $ 943,860
The Notes beginning on page 53 are an integral part of these financial statements.
CONSOLIDATED STATEMENTS OF CHANGES IN SHAREHOLDERS’ EQUIT Y
51A N N U A L R E P O R T

CONSOLIDATED STATEMENTS OF CASH FLOWS
SONOCO PRODUCTS COMPANY AND CONSOLIDATED SUBSIDIARIES
(Dollars in thousands)YEARS ENDED DECEMBER 31 2005 2004 2003Cash Flows from Operating ActivitiesNet income $ 161,877 $ 151,229 $ 138,949Adjustments to reconcile net income to net cash provided
by operating activitiesAsset impairment 9,515 6,153 8,381Depreciation, depletion and amortization 163,074 163,928 163,234Equity in earnings of affiliates/minority interest
in subsidiaries (14,925) (12,745) (7,543)Cash dividends from affiliated companies 6,758 7,114 11,327(Gain) loss on disposition of assets (555) 2,460 1,228Gain on sale of High Density Film business (49,433)Noncash tax effect of nonqualified stock options 2,753 3,013 410Deferred taxes (24,722) 5,310 11,175Change in assets and liabilities, net of effects from
acquisitions, dispositions, assets held for sale andforeign currency adjustments
Receivables (24,026) (23,893) 5,324Inventories (6,447) (38,395) (10,117)Prepaid expenses 2,298 1,272 (7,955)Payables and taxes (10,554) 12,082 70,727Cash contribution to pension plans (77,024) (33,360) (22,946)Other assets and liabilities 39,341 8,020 19,487
Net cash provided by operating activities 227,363 252,188 332,248Cash Flows from Investing ActivitiesPurchase of property, plant and equipment (129,112) (119,800) (113,574)Cost of acquisitions, net of cash acquired (3,566) (267,016) (6,232)Proceeds from the sale of assets 13,377 8,638 2,709Proceeds from sale of High Density Film business 81,177Net cash used by investing activities (119,301) (378,178) (35,920)Cash Flows from Financing ActivitiesProceeds from issuance of debt 43,859 206,157 20,715Principal repayment of debt (11,699) (168,528) (120,287)Net (decrease) increase in commercial paper borrowings (150,000) 180,000 (65,500)Net increase (decrease) in bank overdrafts 7,765 (7,976) (8,075)Cash dividends – common (90,126) (85,060) (81,128)Common shares issued 34,617 31,450 8,342Net cash (used) provided by financing activities (165,584) 156,043 (245,933)Effects of Exchange Rate Changes on Cash (595) 2,818 3,054(Decrease) Increase in Cash and Cash Equivalents (58,117) 32,871 53,449Cash and cash equivalents at beginning of year 117,725 84,854 31,405Cash and cash equivalents at end of year $ 59,608 $ 117,725 $ 84,854Supplemental Cash Flow Disclosures
Interest paid, net of amounts capitalized $ 46,650 $ 41,530 $ 50,079Income taxes paid, net of refunds $ 115,253 $ 72,647 $ 27,182Value of stock issued for acquisition $ 2,700
Prior year data has been reclassified to conform to the current presentation.The Notes beginning on page 53 are an integral part of these financial statements.
52 S O N O C O 2 0 0 5
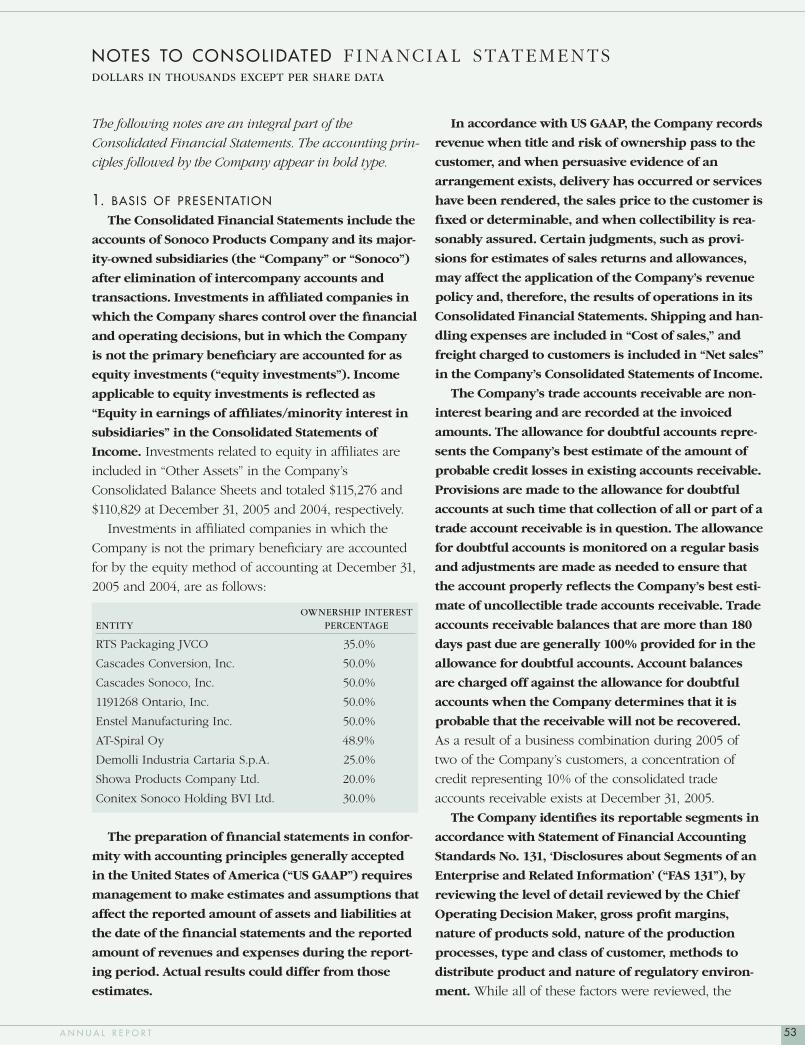
NOTES TO CONSOLIDATED F INANCIAL STATEMENTSDOLLARS IN THOUSANDS EXCEPT PER SHARE DATA
In accordance with US GAAP, the Company records
revenue when title and risk of ownership pass to the
customer, and when persuasive evidence of an
arrangement exists, delivery has occurred or services
have been rendered, the sales price to the customer is
fi xed or determinable, and when collectibility is rea-
sonably assured. Certain judgments, such as provi-
sions for estimates of sales returns and allowances,
may affect the application of the Company’s revenue
policy and, therefore, the results of operations in its
Consolidated Financial Statements. Shipping and han-
dling expenses are included in “Cost of sales,” and
freight charged to customers is included in “Net sales”
in the Company’s Consolidated Statements of Income.
The Company’s trade accounts receivable are non-
interest bearing and are recorded at the invoiced
amounts. The allowance for doubtful accounts repre-
sents the Company’s best estimate of the amount of
probable credit losses in existing accounts receivable.
Provisions are made to the allowance for doubtful
accounts at such time that collection of all or part of a
trade account receivable is in question. The allowance
for doubtful accounts is monitored on a regular basis
and adjustments are made as needed to ensure that
the account properly refl ects the Company’s best esti-
mate of uncollectible trade accounts receivable. Trade
accounts receivable balances that are more than 180
days past due are generally 100% provided for in the
allowance for doubtful accounts. Account balances
are charged off against the allowance for doubtful
accounts when the Company determines that it is
probable that the receivable will not be recovered.
As a result of a business combination during 2005 of
two of the Company’s customers, a concentration of
credit representing 10% of the consolidated trade
accounts receivable exists at December 31, 2005.
The Company identifi es its reportable segments in
accordance with Statement of Financial Accounting
Standards No. 131, ‘Disclosures about Segments of an
Enterprise and Related Information’ (“FAS 131”), by
reviewing the level of detail reviewed by the Chief
Operating Decision Maker, gross profi t margins,
nature of products sold, nature of the production
processes, type and class of customer, methods to
distribute product and nature of regulatory environ-
ment. While all of these factors were reviewed, the
The following notes are an integral part of the
Consolidated Financial Statements. The accounting prin-
ciples followed by the Company appear in bold type.
1. BASIS OF PRESENTATION
The Consolidated Financial Statements include the
accounts of Sonoco Products Company and its major-
ity-owned subsidiaries (the “Company” or “Sonoco”)
after elimination of intercompany accounts and
transactions. Investments in affi liated companies in
which the Company shares control over the fi nancial
and operating decisions, but in which the Company
is not the primary benefi ciary are accounted for as
equity investments (“equity investments”). Income
applicable to equity investments is refl ected as
“Equity in earnings of affi liates/minority interest in
subsidiaries” in the Consolidated Statements of
Income. Investments related to equity in affi liates are
included in “Other Assets” in the Company’s
Consolidated Balance Sheets and totaled $115,276 and
$110,829 at December 31, 2005 and 2004, respectively.
Investments in affi liated companies in which the
Company is not the primary benefi ciary are accounted
for by the equity method of accounting at December 31,
2005 and 2004, are as follows:
OWNERSHIP INTEREST ENTITY PERCENTAGE
RTS Packaging JVCO 35.0%
Cascades Conversion, Inc. 50.0%
Cascades Sonoco, Inc. 50.0%
1191268 Ontario, Inc. 50.0%
Enstel Manufacturing Inc. 50.0%
AT-Spiral Oy 48.9%
Demolli Industria Cartaria S.p.A. 25.0%
Showa Products Company Ltd. 20.0%
Conitex Sonoco Holding BVI Ltd. 30.0%
The preparation of fi nancial statements in confor-
mity with accounting principles generally accepted
in the United States of America (“US GAAP”) requires
management to make estimates and assumptions that
affect the reported amount of assets and liabilities at
the date of the fi nancial statements and the reported
amount of revenues and expenses during the report-
ing period. Actual results could differ from those
estimates.
53A N N U A L R E P O R T

Company feels that the most signifi cant factors are the
nature of its products, the nature of the production pro-
cess and the type of customers served.
Effective December 31, 2005, the Company changed
the name of the Engineered Carriers and Paper segment
to Tubes and Cores/Paper, because the term “tubes and
cores” is more generally understood than “engineered
carriers” in the marketplace for the primary products
offered by the businesses in this segment. There has
been no change in the businesses included in this
segment.
2. ACQUIS IT IONS/DISPOSIT IONS/JOINT VENTURES
The Company completed three acquisitions during
2005, with an aggregate cost of approximately $3,566 in
cash. In connection with these acquisitions, the
Company recorded fair value of identifi ed intangibles of
$25, goodwill of $1,081 and other net tangible assets of
$2,460. Acquisitions in the Company’s Tubes and Cores/
Paper segment included a tube and core manufacturer
in New Zealand and a small molded plug recycler in the
United States. Additionally, the Company purchased the
remaining ownership interest in a Chilean tubes and
cores business. The Company also acquired certain
assets of a rigid plastic packaging manufacturer in
Brazil, which is reported in the Consumer Packaging
segment.
In December 2005, the Company divested its single-
plant folding cartons business for a note receivable of
approximately $11,000, which was collected in early
2006. This transaction resulted in a gain of $2,417
($1,634 after tax). The results of this business unit were
immaterial to the Company’s consolidated net income,
for all periods presented.
The Company completed nine acquisitions during
2004, with an aggregate cost of approximately $367,000.
This amount included cash, assumption of debt and
contribution of assets. In connection with these acquisi-
tions, the Company recorded fair value of identifi able
intangibles of approximately $51,000, goodwill of
approximately $178,000 and net tangible assets of
approximately $138,000. In May 2004, the Company
acquired CorrFlex Graphics, LLC (“CorrFlex”), one of the
nation’s largest point-of-purchase display companies.
The acquired business, which is known as Sonoco
CorrFlex, LLC, is refl ected in the Packaging Services seg-
ment. Acquisitions in the Company’s Tubes and Cores/
Paper segment included tube and core manufacturers in
Australia, China and the United States. During the fourth
quarter of 2004, the Company also completed a busi-
ness combination with Ahlstrom Corporation, Helsinki,
Finland (“Ahlstrom”), to combine each of the companies’
respective European paper-based tube/core and core-
board operations into a joint venture that operates under
the name Sonoco-Alcore S.a.r.l. (“Sonoco-Alcore”) and is
refl ected in the Tubes and Cores/Paper segment. The
Company contributed ownership positions in 25 tube
and core plants and fi ve paper mills to Sonoco-Alcore,
and holds a 64.5% interest in the joint venture. Ahlstrom,
a leader in high-performance fi ber-based materials serv-
ing niche markets worldwide, contributed 14 tube and
core plants and one paper mill to Sonoco-Alcore, and
holds a 35.5% interest in the joint venture. The Company
has accounted for this transaction as an acquisition and,
therefore, consolidates the results of the joint venture
and reports Ahlstrom’s minority interest as such in its
fi nancial statements. The recognition of minority interest
is included in “Income before equity in earnings of affi l-
iates/minority interest in subsidiaries” on the Company’s
Consolidated Statements of Income. Acquisitions in the
Company’s Consumer Packaging segment included a
composite can manufacturer in Australia, a manufacturer
of rotogravure cylinders in Canada and the remaining
ownership interest in a manufacturer of rotogravure cyl-
inders in Charlotte, N.C. The Company also acquired
certain assets of a wooden reel refurbisher in Alabama,
which are classifi ed as components of All Other Sonoco.
The Company completed four acquisitions during
2003, with an aggregate cost of approximately $11,077
in cash, assumption of debt, relief of notes receivable
and issuance of common stock. In connection with
these acquisitions, the Company recorded fair value of
identifi ed intangibles of $3,150, goodwill of $2,897 and
other net tangible assets of $5,030. Acquisitions in the
Company’s Tubes and Cores/Paper segment included a
tube and core manufacturer in Australia and a recovered
paper operation in Savannah, Ga. The Company also
acquired certain assets of a wooden reel manufacturer
in Canada and the United States, which are classifi ed as
components of All Other Sonoco. In addition, the
Company increased its ownership interest in a manufac-
NOTES TO CONSOL IDATED F INANCIAL STATEMENTSDOLLARS IN THOUSANDS EXCEPT PER SHARE DATA
54 S O N O C O 2 0 0 5

turer of rotogravure cylinders in Charlotte, N.C., in the
Company’s Consumer Packaging segment.
During 2003, the Company decided to divest itself of
the High Density Film business in order to redirect the
value of those assets to primary-growth vehicles,
thereby enhancing the opportunity to increase total
returns to shareholders and signifi cantly reduce the
Company’s exposure to highly cyclical resin markets.
In December 2003, the Company completed this divesti-
ture by selling the business to Hilex Poly Co., LLC, of
Los Angeles, Calif., for a price of approximately
$118,800, including approximately $80,800 in cash;
$28,000 in subordinated notes bearing a 4.95% interest
rate maturing in 10 years; and, a $10,000 nonvoting pre-
ferred membership interest yielding 10%. This transac-
tion resulted in a gain of $63,112 ($49,433 after tax).
Operating results of this business have been presented
for all periods as “Income from discontinued operations,
net of income taxes” in the Company’s Consolidated
Statements of Income.
The Company has accounted for all of its acquisitions
as purchases and, accordingly, has included their results
of operations in consolidated net income from the date
of acquisition.
3. D ISCONTINUED OPER ATIONS
The Company accounts for discontinued opera-
tions in accordance with Statement of Financial
Accounting Standards No. 144, ‘Accounting for the
Impairment or Disposal of Long-lived Assets’ (“FAS
144”). Accordingly, the results of operations of a
material business component are reported in discon-
tinued operations when the component has either
been disposed of, or is classifi ed as held for sale, and
the operations and cash fl ows of the component have
been or will be eliminated and the Company will not
have any signifi cant continuing involvement in the
operations of the component.
Income from discontinued operations for 2003 repre-
sents the results of operations of the Company’s High
Density Film business, which was sold in December
2003. See Note 2 for a discussion of this disposition.
The following table sets forth the operating results for
the High Density Film business, which was previously
reported in the Company’s Consumer Packaging
segment:
2003
Net sales $ 198,759
Operating income before income taxes 17,758
Gain on sale 63,112
Income tax expense (20,099)
Income from discontinued operations $ 60,771
Income from discontinued
operations – per basic share $ .63
Income from discontinued
operations – per diluted share $ .63
No interest expense or income was allocated to this
business unit.
The Company has no continuing involvement in the
management or operations of the divested business.
4. RESTRUCTURING PROGR A MS
The Company accounts for restructuring charges
in accordance with Statement of Financial Accounting
Standards No. 146, ‘Accounting for Costs Associated
with Exit or Disposal Activities’ (“FAS 146”), whereby
the liability is recognized when exit costs are
incurred. If, as a result of the restructuring action,
assets become impaired, the assets are written down to
the lower of carrying amount or fair value, less esti-
mated costs to sell, if applicable. A number of signifi cant
estimates and assumptions are involved in the applica-
tion of these techniques. The Company considers his-
torical experience and all available information at the
time the estimates are made; however, the fair values
that are ultimately realized upon the sale of the assets to
be divested may differ from the estimated fair values
refl ected in the Company’s Consolidated Financial
Statements.
In August 2003, the Company announced general
plans to reduce its overall annual cost structure by
approximately $54,000 pretax by realigning and central-
izing a number of staff functions and eliminating excess
plant capacity. Pursuant to these plans, the Company
has initiated or completed 22 plant closings and has
reduced its workforce by approximately 1,000 employ-
ees. As of December 31, 2005, the Company had
incurred cumulative charges, net of adjustments, of
approximately $94,536 pretax associated with these
activities. The following table provides additional details
of these net charges:
NOTES TO CONSOL IDATED F INANCIAL STATEMENTSDOLLARS IN THOUSANDS EXCEPT PER SHARE DATA
55A N N U A L R E P O R T

SEVERANCE ASSET AND IMPAIRMENT/ OTHER TERMINATION DISPOSAL EXIT BENEFITS OF ASSETS COSTS TOTAL
Tubes and Cores/Paper Segment $35,982 $16,012 $12,415 $64,409
Consumer Packaging Segment 10,334 4,586 6,154 21,074
Packaging Services Segment 333 333
All Other Sonoco 2,995 326 92 3,413
Corporate 5,094 213 5,307
Cumulative restructuring charges, net of adjustments $54,738 $20,924 $18,874 $94,536
The Company expects to recognize an additional cost
of approximately $6,810 pretax in the future associated
with these activities, which is comprised of approxi-
mately $1,334 in severance and termination benefi ts and
$5,476 in other exit costs. Of the additional cost, approx-
imately $5,585 is related to the Tubes and Cores/Paper
segment and approximately $1,225 is related to the
Consumer Packaging segment.
Other exit costs consist primarily of building lease
termination charges and other miscellaneous exit costs.
During 2005, the Company recognized restructuring
charges, net of adjustments, of $21,237 ($14,343 after
tax). The following table provides additional details of
these net charges:
SEVERANCE ASSET AND IMPAIRMENT/ OTHER TERMINATION DISPOSAL EXIT BENEFITS OF ASSETS COSTS TOTAL
Tubes and Cores/Paper Segment $4,834 $4,999 $6,194 $16,027
Consumer Packaging Segment 733 1,557 2,321 4,611
All Other Sonoco 640 (41) 599
Total $6,207 $6,515 $8,515 $21,237
The net charges for 2005 relate primarily to the
closure of tube and core plants in the United States and
Europe, fl exible packaging plants in the United States
and Canada, and a paper mill in the United States.
During 2005, the Company also recorded noncash
income in the amount of $1,260 after tax in order to
refl ect Ahlstrom’s portion of restructuring costs that
were charged to expense. This income, which resulted
from the closure of certain plants that the Company con-
tributed to Sonoco-Alcore, is included in “Equity in earn-
ings of affi liates/minority interest in subsidiaries” in the
Company’s Consolidated Statements of Income.
During 2004, the Company recognized restructuring
charges, net of adjustments, of $18,982 ($16,154 after
tax). Included in this amount, is $2,200 in restructuring
charges, which resulted from a correction to previously
reported fi nancial statements at the Company’s wholly
owned subsidiary in Spain. The following table provides
additional details of these net charges:
SEVERANCE ASSET AND IMPAIRMENT/ OTHER TERMINATION DISPOSAL EXIT BENEFITS OF ASSETS COSTS TOTAL
Tubes and Cores/Paper Segment $7,021 $4,459 $3,254 $14,734
Consumer Packaging Segment 1,513 1,327 2,439 5,279
All Other Sonoco 559 367 92 1,018
Corporate (2,548) 499 (2,049)
Total $6,545 $6,153 $6,284 $18,982
The net charges for 2004 relate primarily to the clo-
sure of a fl exible packaging plant in Canada, and a tube
and core plant, a paper mill and a molded plastics plant
in the United States. The consolidation of plants in the
Company’s European operations also contributed to the
restructuring charges recognized during 2004.
Restructuring charges associated with plants contributed
to Sonoco-Alcore by Ahlstrom were recorded as an
increase in goodwill in accordance with Emerging Issues
Task Force Issue No. 95-3, ‘Recognition of Liabilities in
Connection with a Business Combination’ (“EITF 95-3”).
The Corporate credit is an adjustment in severance relat-
ing to the restructuring plan announced in August 2003.
During 2004, the Company also recorded noncash
income in the amount of $1,778 after tax, in order to
refl ect Ahlstrom’s portion of restructuring costs that
were charged to expense. This income, which resulted
from the expected closure of certain plants that the
Company contributed to Sonoco-Alcore, is included in
“Equity in earnings of affi liates/minority interest in sub-
sidiaries” in the Company’s Consolidated Statements of
Income.
During 2003, the Company recognized restructuring
NOTES TO CONSOL IDATED F INANCIAL STATEMENTSDOLLARS IN THOUSANDS EXCEPT PER SHARE DATA
56 S O N O C O 2 0 0 5

charges, net of adjustments, of $50,056 ($35,329 after
tax). The following table provides additional details of
these net charges:
SEVERANCE ASSET AND IMPAIRMENT/ OTHER TERMINATION DISPOSAL EXIT BENEFITS OF ASSETS COSTS TOTAL
Tubes and Cores/Paper Segment $22,306 $6,621 $2,486 $31,413
Consumer Packaging Segment 6,253 1,760 1,456 9,469
Packaging Services Segment 335 335
All Other Sonoco 1,806 1,806
Corporate 7,033 7,033
Total $37,733 $8,381 $3,942 $50,056
The net charges for 2003 relate primarily to the clo-
sure of tube and core plants in the United States and
France, a paper mill in the United States, a fl exible pack-
aging plant in the United States and corporate severance.
Additionally, the Company’s High Density Film business,
which was divested in 2003, incurred restructuring
charges of $200 pretax ($128 after tax), which are
included in “Income from discontinued operations” in
the Company’s Consolidated Statements of Income.
During 2003, the Company also recorded restructur-
ing charges of $1,455 after tax related to expenses at a
non-consolidated affi liate. The restructuring charges are
included in “Equity in earnings of affi liates/minority
interest in subsidiaries” in the Company’s Consolidated
Statements of Income.
The following table sets forth the activity in the
restructuring accrual included in “Accrued expenses and
other” on the Company’s Consolidated Balance Sheets.
Restructuring charges are included in “Restructuring
charges” in the Consolidated Statements of Income,
except for the restructuring charges applicable to the
High Density Film business and equity method invest-
ments, which are included in “Income from discontin-
ued operations” and “Equity in earnings of affi liates/
minority interest in subsidiaries,” respectively. In accor-
dance with the agreement of sale for the High Density
Film business, the liability associated with the restructur-
ing has been retained by the Company and is, therefore,
included in the table following:
SEVERANCE ASSET AND IMPAIRMENT/ OTHER TERMINATION DISPOSAL EXIT BENEFITS OF ASSETS COSTS TOTAL
LIABILITY, DECEMBER 31, 2002 $ 9,162 $ — $ 5,214 $ 14,376
2003 Charges 40,526 8,709 3,142 52,377Cash payments (21,953) (2,970) (24,923)Asset impairment (noncash) (8,381) (8,381)Reclassifications to pension liability (10,234) (10,234)Adjustments (2,793) (328) 1,000 (2,121)
LIABILITY, DECEMBER 31, 2003 14,708 6,386 21,094
2004 Charges 9,815 5,894 5,970 21,679Cash payments (16,595) (5,642) (22,237)Asset impairment/ pension curtail- ment (noncash) (6,153) (1,926) (8,079)Foreign currency translation 2,016 66 2,082Adjustments (3,270) 259 314 (2,697)
LIABILITY, DECEMBER 31, 2004 6,674 5,168 11,842
2005 Charges 6,232 7,099 8,992 22,323Cash payments (8,600) (7,329) (15,929)Asset impairment (noncash) (6,515) (6,515)Foreign currency translation (859) 140 (719)Adjustments (538) (584) 36 (1,086)
LIABILITY
DECEMBER 31, 2005 $ 2,909 $ — $ 7,007 $ 9,916
The Company expects to pay the majority of the
remaining restructuring costs, with the exception of
ongoing pension subsidies and certain building lease
termination expenses, by the end of the third quarter of
2006, using cash generated from operations.
During 2005, the Company recognized writeoffs of
impaired equipment and facilities held for disposal in
the Tubes and Cores/Paper segment in the amount of
$4,312, in the Consumer Packaging segment in the
amount of $1,367 and in All Other Sonoco in the
amount of $(41). Also, during 2005, the Company recog-
nized writeoffs of inventory in the Tubes and Cores/
Paper segment in the amount of $687, and in the
Consumer Packaging segment in the amount of $190.
Writeoffs of impaired equipment, facilities and inventory
in the Tubes and Cores/Paper segment related primarily
to the closure of tube and core plants and a paper mill
in the United States. Writeoffs of impaired equipment,
facilities and inventory in the Consumer Packaging seg-
ment related primarily to the closure of two fl exible
NOTES TO CONSOL IDATED F INANCIAL STATEMENTSDOLLARS IN THOUSANDS EXCEPT PER SHARE DATA
57A N N U A L R E P O R T

packaging plants. Impaired assets were written down to
the lower of carrying amount or fair value, less esti-
mated costs to sell, if applicable.
During 2004, the Tubes and Cores/Paper segment
recognized writeoffs of impaired equipment and facili-
ties held for disposal of $4,459, attributed to the closing
of six plant locations. Additionally, the Consumer
Packaging segment recognized writeoffs of impaired
equipment and facilities held for disposal of $1,327 and
pension curtailment of $1,926, related to the closing of
two plant locations. Finally, during 2004, All Other
Sonoco recognized writeoffs of impaired equipment and
facilities held for disposal of $367, attributed to the clos-
ing of one plant location. Impaired assets were written
down to the lower of carrying amount or fair value, less
estimated costs to sell, if applicable.
During 2003, the Tubes and Cores/Paper segment
recognized writeoffs of impaired equipment and facili-
ties held for disposal of $6,621, attributed to the closing
of four plant locations. Additionally, the Consumer
Packaging segment recognized writeoffs of impaired
equipment of $1,760 related to the closing of one plant
location. Impaired assets were written down to the
lower of carrying amount or fair value, less estimated
costs to sell, if applicable.
5. CASH AND CASH EQUIVALENTS
Cash equivalents are composed of highly liquid
investments with an original maturity of three months
or less, and are recorded at market. At December 31,
2005 and 2004, outstanding checks totaling $22,406 and
$14,611, respectively, were included in “Payable to sup-
pliers” on the Company’s Consolidated Balance Sheets.
In addition, outstanding payroll checks of $1,161 and
$1,192 as of December 31, 2005 and 2004, respectively,
were included in “Accrued wages and other compensa-
tion” on the Company’s Consolidated Balance Sheets.
6. INVENTORIES
Inventories are stated at the lower of cost or mar-
ket. The last-in, fi rst-out (“LIFO”) method was used to
determine costs of approximately 23% of total invento-
ries at both December 31, 2005 and 2004. The remain-
ing inventories are determined on the fi rst-in, fi rst-out
(“FIFO”) method.
If the FIFO method of accounting had been used for
all inventories, total inventory would have been higher
by $11,568 and $10,701 at December 31, 2005 and 2004,
respectively.
7. PROPERT Y, PL ANT AND EQUIPMENT
Plant assets represent the original cost of land,
buildings and equipment, less depreciation, com-
puted under the straight-line method over the esti-
mated useful life of the asset, and are reviewed for
impairment whenever events indicate the carrying
value may not be recoverable.
Equipment lives generally range from three to 11
years, and buildings from 15 to 40 years.
Timber resources are stated at cost. Depletion is
charged to operations based on the estimated num-
ber of units of timber cut during the year.
Depreciation and depletion expense amounted to
$155,412 in 2005, $158,212 in 2004 and $148,843 in 2003.
Depreciation expense amounted to $9,696 during 2003
for the High Density Film business, which was divested
in 2003 and has, therefore, been reclassifi ed as discon-
tinued operations. Details at December 31 are as follows:
2005 2004
Land $ 46,541 $ 51,041
Timber resources 38,224 37,695
Buildings 388,414 396,083
Machinery and equipment 1,995,737 1,981,331
Construction in progress 68,886 76,428
2,537,802 2,542,578
Accumulated depreciation
and depletion (1,593,851) (1,535,283)
Property, plant and
equipment, net $ 943,951 $ 1,007,295
During 2005, the Company recorded an impairment
charge of approximately $3,000 associated with its Tubes
and Cores/Paper segment in Asia.
Estimated costs for completion of authorized capital
additions under construction totaled approximately
$58,338 at December 31, 2005.
The Company has certain properties and equipment
that are leased under noncancelable operating leases.
Future minimum rentals under noncancelable operating
leases with terms of more than one year are as follows:
2006 – $31,300; 2007 – $26,000; 2008 – $19,200;
NOTES TO CONSOL IDATED F INANCIAL STATEMENTSDOLLARS IN THOUSANDS EXCEPT PER SHARE DATA
58 S O N O C O 2 0 0 5

2009 – $15,400; 2010 – $11,000; and thereafter – $29,700.
Total rental expense under operating leases was approxi-
mately $41,900 in 2005, $35,600 in 2004 and $34,000 in
2003.
Research and development costs are charged to
expense as incurred and include salaries and other
various expenses. Research and development costs
included as “Selling, general and administrative
expenses” on the Company’s Consolidated Statements
of Income charged to the expense were $14,668 in 2005,
$15,404 in 2004 and $14,225 in 2003.
8. GOODWILL AND OTHER INTANGIBLE ASSETS
GOODWILL
The Company accounts for goodwill in accordance
with Statement of Financial Accounting Standards No.
142 ‘Goodwill and Other Intangible Assets’ (“FAS 142”).
Under FAS 142, purchased goodwill and intangible
assets with indefi nite lives are not amortized. The
Company evaluates its goodwill for impairment at least
annually, and more frequently if indicators of impair-
ment are present. The Company completed its annual
goodwill impairment testing required by FAS 142 during
the third quarters of 2005, 2004 and 2003. In performing
the impairment test, the Company uses discounted
future cash fl ows to determine fair value of assets of
each reporting unit, which is then compared to the car-
rying value of these assets. If, after completing this test,
certain reporting units are deemed impaired, further
analysis is completed to calculate the impairment charge
required. Based on this impairment testing, no adjust-
ment to the recorded goodwill balance was necessary.
The evaluation of goodwill impairment that was com-
pleted during the third quarter of 2005 used forward-
looking projections, which included expected improve-
ment in results at certain reporting units, most notably,
the European operations within the Tubes and Cores/
Paper segment, to which $66,900 of goodwill is attrib-
uted. The assessment of the relevant facts and circum-
stances is ongoing, and if actual performance in this
reporting unit falls signifi cantly short of the projected
results, it is reasonably possible that a non cash impair-
ment charge would be required.
The changes in the carrying amount of goodwill for
the year ended December 31, 2005, are as follows:
TUBES AND CORES CONSUMER PACKAGING ALL /PAPER PACKAGING SERVICES OTHER SEGMENT SEGMENT SEGMENT SONOCO TOTAL
Balance as of January 1, 2005 $183,671 $172,630 $148,268 $65,939 $570,508 Goodwill purchase price adjustments 12,936 (4,015) 16 8,937 Goodwill on 2005 acquisitions 1,022 59 1,081 Other adjustments (2,686) (2,686) Foreign currency translation (5,308) 1,709 (159) (179) (3,937) Balance as of December 31, 2005 $189,635 $170,383 $148,125 $65,760 $573,903
During 2005, the Company made adjustments to the
purchase price allocation related to the Sonoco-Alcore
business combination, which was consummated during
the fourth quarter of 2004. In conjunction with the fi nal-
ization of the valuation analysis, the Company reduced
the amount of the purchase price that had been allo-
cated to customer lists by $6,048, identifi ed approxi-
mately $6,888 of additional purchase price adjustments,
related primarily to closing certain plants contributed by
Ahlstrom, and adjusted certain assets to fair value. Other
adjustments include $1,603 associated with the sale of a
business.
OTHER INTANGIBLE ASSETS
Intangible assets are amortized, usually on a
straight-line basis, over their respective useful lives,
which generally range from three to 15 years. The
Company evaluates its intangible assets for impair-
ment whenever indicators of impairment exist. The
Company has no intangibles with indefi nite lives.
NOTES TO CONSOL IDATED F INANCIAL STATEMENTSDOLLARS IN THOUSANDS EXCEPT PER SHARE DATA
59A N N U A L R E P O R T
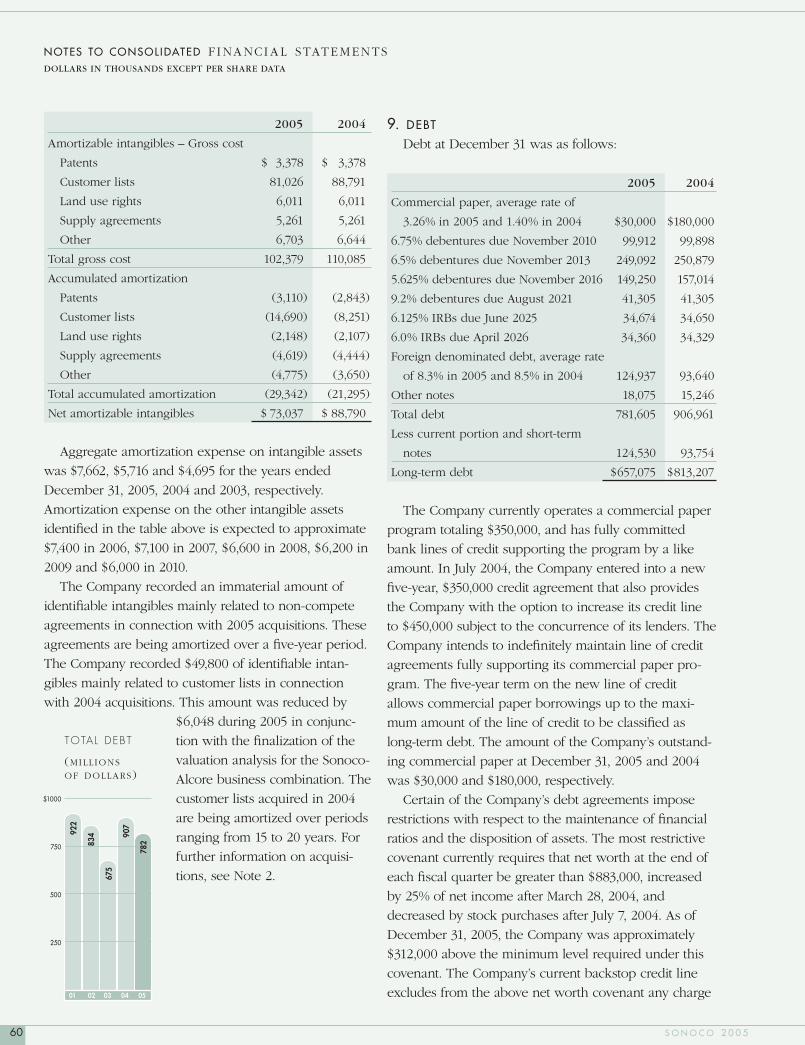
2005 2004
Amortizable intangibles – Gross cost
Patents $ 3,378 $ 3,378
Customer lists 81,026 88,791
Land use rights 6,011 6,011
Supply agreements 5,261 5,261
Other 6,703 6,644
Total gross cost 102,379 110,085
Accumulated amortization
Patents (3,110) (2,843)
Customer lists (14,690) (8,251)
Land use rights (2,148) (2,107)
Supply agreements (4,619) (4,444)
Other (4,775) (3,650)
Total accumulated amortization (29,342) (21,295)
Net amortizable intangibles $ 73,037 $ 88,790
Aggregate amortization expense on intangible assets
was $7,662, $5,716 and $4,695 for the years ended
December 31, 2005, 2004 and 2003, respectively.
Amortization expense on the other intangible assets
identifi ed in the table above is expected to approximate
$7,400 in 2006, $7,100 in 2007, $6,600 in 2008, $6,200 in
2009 and $6,000 in 2010.
The Company recorded an immaterial amount of
identifi able intangibles mainly related to non-compete
agreements in connection with 2005 acquisitions. These
agreements are being amortized over a fi ve-year period.
The Company recorded $49,800 of identifi able intan-
gibles mainly related to customer lists in connection
with 2004 acquisitions. This amount was reduced by
$6,048 during 2005 in conjunc-
tion with the fi nalization of the
valuation analysis for the Sonoco-
Alcore business combination. The
customer lists acquired in 2004
are being amortized over periods
ranging from 15 to 20 years. For
further information on acquisi-
tions, see Note 2.
9. DEBT
Debt at December 31 was as follows:
2005 2004
Commercial paper, average rate of
3.26% in 2005 and 1.40% in 2004 $30,000 $180,000
6.75% debentures due November 2010 99,912 99,898
6.5% debentures due November 2013 249,092 250,879
5.625% debentures due November 2016 149,250 157,014
9.2% debentures due August 2021 41,305 41,305
6.125% IRBs due June 2025 34,674 34,650
6.0% IRBs due April 2026 34,360 34,329
Foreign denominated debt, average rate
of 8.3% in 2005 and 8.5% in 2004 124,937 93,640
Other notes 18,075 15,246
Total debt 781,605 906,961
Less current portion and short-term
notes 124,530 93,754
Long-term debt $657,075 $813,207
The Company currently operates a commercial paper
program totaling $350,000, and has fully committed
bank lines of credit supporting the program by a like
amount. In July 2004, the Company entered into a new
fi ve-year, $350,000 credit agreement that also provides
the Company with the option to increase its credit line
to $450,000 subject to the concurrence of its lenders. The
Company intends to indefi nitely maintain line of credit
agreements fully supporting its commercial paper pro-
gram. The fi ve-year term on the new line of credit
allows commercial paper borrowings up to the maxi-
mum amount of the line of credit to be classifi ed as
long-term debt. The amount of the Company’s outstand-
ing commercial paper at December 31, 2005 and 2004
was $30,000 and $180,000, respectively.
Certain of the Company’s debt agreements impose
restrictions with respect to the maintenance of fi nancial
ratios and the disposition of assets. The most restrictive
covenant currently requires that net worth at the end of
each fi scal quarter be greater than $883,000, increased
by 25% of net income after March 28, 2004, and
decreased by stock purchases after July 7, 2004. As of
December 31, 2005, the Company was approximately
$312,000 above the minimum level required under this
covenant. The Company’s current backstop credit line
excludes from the above net worth covenant any charge
NOTES TO CONSOL IDATED F INANCIAL STATEMENTSDOLLARS IN THOUSANDS EXCEPT PER SHARE DATA
TOTAL DEBT
(MILL IONS
OF DOLLARS)
$1000
750
500
250
01 02 03 04 05
922
834
782
675
907
60 S O N O C O 2 0 0 5

to shareholders’ equity arising from minimum pension
liability adjustments for its U.S. defi ned benefi t pension
plan. No such charge existed for the Company’s U.S.
defi ned benefi t pension plan at December 31, 2005,
2004 or 2003.
The 6.125% IRBs and the 6.0% IRBs are collateralized
by property, plant and equipment at several locations.
The Company had committed availability under
unused short-term lines of credit in the amount of
approximately $140,704 at December 31, 2005. These
short-term lines of credit are for general Company pur-
poses, with interest at mutually agreed-upon rates.
The approximate principal requirements of debt
maturing in the next fi ve years are: 2006 – $124,530;
2007 – $3,200; 2008 – $1,300; 2009 – $1,600 and
2010 – $102,000.
10. FINANCIAL INSTRUMENTS
The following table sets forth the carrying amounts
and fair values of the Company’s signifi cant fi nancial
instruments where the carrying amount differs from the
fair value.
DECEMBER 31, 2005 DECEMBER 31, 2004 CARRYING FAIR CARRYING FAIR AMOUNT OF VALUE OF AMOUNT OF VALUE OF LIABILITY LIABILITY1 LIABILITY LIABILITY2
Long-term debt $657,075 $705,989 $813,207 $880,223
1 The fair value of long-term debt at December 31, 2005 does not include the impact of interest-rate swaps. The fair value of long- term debt is $692,489, when the impact of interest rate swaps is included.2 The fair value of long-term debt at December 31, 2004 does not include the impact of interest-rate swaps. The fair value of long- term debt is $861,430, when the impact of interest-rate swaps is included.
The carrying value of cash and cash equivalents,
short-term debt and long-term variable-rate debt approx-
imates fair value. The fair value of long-term debt is
based on quoted market prices or is determined by dis-
counting future cash fl ows using interest rates available
to the Company for issues with similar terms and aver-
age maturities.
The Company records derivatives based on
Statement of Financial Accounting Standards No. 133,
‘Accounting for Derivative Instruments and Hedging
Activities’ (“FAS 133”), and related amendments. This
Statement requires that all derivatives be recognized
as assets or liabilities in the balance sheet and mea-
sured at fair value. Changes in the fair value of deriv-
atives are recognized in either net income or in other
comprehensive income, depending on the designated
purpose of the derivative.
The Company uses derivatives from time to time to
partially mitigate the effect of raw material and energy
cost fl uctuations, exposure to foreign currency fl uctua-
tions and exposure to interest rate movements. The
Company purchases commodities such as recovered
paper, metal and energy generally at market or fi xed
prices that are established with the vendor as part of the
purchase process for quantities expected to be con-
sumed in the ordinary course of business. The
Company may enter into commodity futures or swaps to
reduce the effect of price fl uctuation. In addition, the
Company may use foreign currency forward contracts
and other risk management instruments to manage
exposure to changes in foreign currency cash fl ows and
the translation of monetary assets and liabilities on the
Company’s Consolidated Financial Statements. The
Company is exposed to interest rate fl uctuations as a
result of using debt as a source of fi nancing for its oper-
ations. When necessary, the Company uses traditional,
unleveraged interest-rate swaps to manage its mix of
fi xed and variable-rate debt to maintain its exposure to
interest rate movements within established ranges. The
Company uses published market prices or estimated val-
ues based on current price quotes and a discounted
cash fl ow model to estimate the fair market value of the
derivatives.
All interest-rate swaps qualifi ed as fair value hedges,
under which fi xed interest rates are swapped for fl oating
rates. In January 2004, the Company entered into an
agreement to swap the interest rate from fi xed to fl oat-
ing on $100,000 of its $250,000 6.5% notes maturing in
2013. During June 2004, the Company entered into an
agreement to swap the interest rates from fi xed to fl oat-
ing on all of its newly issued $150,000 of 5.625% notes
maturing in 2016. The fair market value of these interest-
rate swaps was an unfavorable position of $1,098 and a
favorable position of $4,483, respectively, at December
31, 2005, and was refl ected in “Other Liabilities” and
“Other Assets,” respectively, on the Company’s Consoli-
dated Balance Sheets in accordance with FAS 133.
NOTES TO CONSOL IDATED F INANCIAL STATEMENTSDOLLARS IN THOUSANDS EXCEPT PER SHARE DATA
61A N N U A L R E P O R T

NOTES TO CONSOL IDATED F INANCIAL STATEMENTSDOLLARS IN THOUSANDS EXCEPT PER SHARE DATA
In 2005, the Company entered into certain cash fl ow
hedges to mitigate exposure to commodity and foreign
exchange risks in 2005 through June 2008. The fair mar-
ket value of these derivatives as of December 31, 2005,
was $11,181 on a tax-adjusted basis, and will be reclassi-
fi ed to earnings in the same periods that the forecast pur-
chases or payments affect earnings. Based on the current
amount of the derivative gain in other comprehensive
income, $6,721 after tax would be reclassifi ed to income
in 2006. As a result of the high correlation between the
hedged instruments and the underlying transactions, inef-
fectiveness did not have a material impact on the
Company’s Consolidated Statements of Income for the
years ended December 31, 2005, 2004 and 2003.
11. STOCK PL ANS
STOCK OPTION PLANS
The Company has stock option plans under which
common shares are reserved for sale to certain employ-
ees and nonemployee directors. The exercise price of
options granted under the plans is the market value of
the shares at the date of grant. Options are generally
exercisable one year after the date of grant and expire 10
years after the date of grant, although options granted in
2005 vested immediately. There were 4,476,838 shares
reserved for future grants at December 31, 2005.
A summary of the status of the Company’s stock
option plans is presented below:
WEIGHTED- AVERAGE OPTION EXERCISE SHARES PRICE
2003 Outstanding at beginning of year 10,875,626 $25.12 Granted 1,419,694 $21.19 Exercised (438,470) $20.96 Canceled (518,209) $24.59 Outstanding at end of year 11,338,641 $24.81 Options exercisable at end of year 9,943,286 $25.32 2004 Granted 1,085,817 $24.08 Exercised (1,579,386) $20.95 Canceled (1,091,928) $29.16 Outstanding at end of year 9,753,144 $24.87 Options exercisable at end of year 8,700,656 $24.97 2005 Granted 1,140,648 $27.26 Exercised (1,469,431) $23.75 Canceled (51,056) $26.41 Outstanding at end of year 9,373,305 $25.33 Options exercisable at end of year 9,373,305 $25.33
The weighted-average fair value of options granted
was $5.42, $4.97 and $4.85 in 2005, 2004 and 2003,
respectively. The fair value of each option grant is esti-
mated on the date of the grant using the binomial
option-pricing model with the following assumptions:
2005 2004 2003
Expected dividend yield 3.5% 3.6% 3.6%
Expected stock price volatility 26.2% 27.4% 31.8%
Risk-free interest rate 3.7% 3.2% 3.0%
Expected life of options 4.5 years 4.5 years 4.5 years
The following tables summarize information about
stock options outstanding and stock options exercisable
at December 31, 2005:
OPTIONS OUTSTANDING
WEIGHTED- AVERAGE WEIGHTED- REMAINING AVERAGE RANGE OF NUMBER CONTRACTUAL EXERCISE EXERCISE PRICES OUTSTANDING LIFE PRICE
$17.25 - $23.80 3,238,329 5.5 years $21.75
$23.83 - $26.81 2,963,137 5.2 years $24.51
$27.31 - $37.10 3,171,839 4.8 years $29.74
$17.25 - $37.10 9,373,305 5.2 years $25.33
OPTIONS EXERCISABLE
RANGE OF NUMBER WEIGHTED-AVERAGE EXERCISE PRICES OUTSTANDING EXERCISE PRICE
$17.25 - $23.80 3,238,329 $21.75
$23.83 - $26.81 2,963,137 $24.51
$27.31 - $37.10 3,171,839 $29.74
$17.25 - $37.10 9,373,305 $25.33
PERFORMANCE-BASED STOCK PLANS
As of December 31, 2005 and 2004, the Company
had granted awards in the form of contingent-share
units to certain of its executives and other members of
its management team. These awards vest over fi ve years
with accelerated vesting of three years if performance
targets are met. The performance vesting of the awards,
which can range from 161,388 to 484,162 shares, is tied
to growth in earnings and improved capital effectiveness
over a three-year period. The 2004 awards are tied to
performance targets through fi scal year 2006, and can
range from 76,338 to 229,012 shares. The 2005 awards
are tied to performance targets through fi scal year 2007,
and can range from 85,050 to 255,150 shares. The
62 S O N O C O 2 0 0 5

Company’s 2003 performance plan completed its three-
year performance cycle on December 31, 2005, and par-
ticipants to whom awards had previously been granted
earned 99,005 shares of common stock based on meet-
ing performance goals set by the plan. These shares will
be issued during the fi rst quarter of 2006. Noncash
stock-based compensation associated with these
performance-based plans totaled $3,198, $4,254 and
$460 pretax for 2005, 2004 and 2003, respectively.
RESTRICTED STOCK PLAN
Since 1994, the Company has granted one-time
awards of contingent shares units to certain of the
Company’s executives. These awards vest over a fi ve-
year period with one-third vesting on the third, fourth
and fi fth anniversaries of the grant. An executive must
be actively employed by the Company on the vesting
date for shares to be issued. Once vested, these awards
do not expire. As of December 31, 2005, a total of
482,804 contingent shares granted under this plan
remained outstanding, 406,995 of which are vested.
Noncash stock-based compensation associated with
these restricted stock plans totaled $1,356, $890 and
$930 pretax for 2005, 2004 and 2003, respectively.
As permitted by Statement of Financial Accounting
Standards No. 123, ‘Accounting for Stock-based
Compensation’ (“FAS 123”), the Company has chosen
to continue to account for stock-based compensation
using the intrinsic value method prescribed in
Accounting Principles Board Opinion No. 25,
‘Accounting for Stock Issued to Employees,’ and its
related interpretations. Accordingly, compensation
cost for stock options is measured as the excess, if
any, of the quoted market price of the Company’s
stock at the date of the grant over the amount an
employee must pay to acquire the stock.
Compensation cost for performance stock options is
recognized over the vesting period and is recorded
based on the quoted market price of the Company’s
stock at the end of the period.
The following table illustrates the effect on net
income and earnings per share if the Company had
applied the fair value recognition provisions of FAS 123
to stock-based employee compensation.
2005 2004 2003
Net income, as reported $161,877 $151,229 $138,949
Add: Stock-based
employee compensation
cost, net of related tax
effects included in net
income, as reported 3,078 3,430 869
Deduct: Total stock-based
employee compensation
expense determined
under fair value based
method for all awards,
net of related tax effects (7,647) (6,355) (5,889)
Pro forma net income $157,308 $148,304 $133,929
Earnings per share:
Basic – as reported $ 1.63 $ 1.54 $ 1.44
Basic – pro forma $ 1.58 $ 1.51 $ 1.38
Diluted – as reported $ 1.61 $ 1.53 $ 1.43
Diluted – pro forma $ 1.57 $ 1.50 $ 1.38
12. EMPLOYEE BENEFIT PL ANS
RETIREMENT PLANS AND RETIREE HEALTH AND LIFE INSURANCE PLANS
The Company provides non-contributory defi ned
benefi t pension plans for a majority of its employees in
the United States, and certain of its employees in Mexico
and Belgium. Effective December 31, 2003, the
Company froze participation for newly hired salaried
and non-union hourly U.S. employees in its traditional
defi ned benefi t pension plan. The Company adopted a
defi ned contribution plan, the Sonoco Investment and
Retirement Plan, which covers its U.S. employees hired
on or after January 1, 2004. The Company also sponsors
contributory pension plans covering the majority of its
employees in the United Kingdom, Canada and the
Netherlands.
The Company also provides postretirement health-
care and life insurance benefi ts to the majority of its
retirees and their eligible dependents in the United
States and Canada. In the fourth quarter of 2005, the
Company announced changes in eligibility for retiree
medical benefi ts effective January 1, 2006, for its U.S.
plan. These changes included the elimination of a
Company subsidy toward the cost of retiree medical
benefi ts if certain age and service criteria were not met,
as well as the elimination of Company-provided pre-
scription drug benefi ts for the majority of its retired and
NOTES TO CONSOL IDATED F INANCIAL STATEMENTSDOLLARS IN THOUSANDS EXCEPT PER SHARE DATA
63A N N U A L R E P O R T

active employees. In 2005, these changes resulted in an
overall reduction in the accumulated postretirement ben-
efi t obligation of $38,132, which will be amortized over
a period of 4.6 years.
The components of net periodic benefi t cost include
the following:
2005 2004 2003
Retirement Plans
Service cost $ 25,994 $ 22,880 $ 20,209
Interest cost 60,489 57,953 51,767
Expected return on plan assets (72,316) (65,967) (55,290)
Amortization of net translation
(asset) obligation 575 615 576
Amortization of prior service cost 1,770 1,558 1,665
Amortization of net actuarial loss 22,705 21,153 22,223
Special termination benefit cost 203 198 10,234
Other 70
Effect of curtailment loss 611
Net periodic benefit cost $ 39,420 $ 38,390 $ 52,065
2005 2004 2003
Retiree Health and Life Insurance Plans
Service cost $ 3,487 $ 3,608 $ 4,360
Interest cost 7,097 8,431 11,558
Expected return on plan assets (2,881) (3,543) (3,650)
Amortization of prior service cost (7,679) (6,160) (6,581)
Amortization of net actuarial loss 4,896 5,031 9,026
Special termination benefit gain (1,096)
Effect of curtailment gain (1,344)
Net periodic benefit cost $ 3,576 $ 7,367 $ 13,617
The following tables set forth the Plans’ obligations
and assets at December 31:
RETIREE HEALTH AND LIFE RETIREMENT INSURANCE PLANS PLANS
2005 2004 2005 2004
Change in Benefit
Obligation
Benefit obligation
at January 1 $1,080,525 $ 911,083 $146,764 $186,363
Service cost 25,994 22,880 3,487 3,608
Interest cost 60,489 57,953 7,097 8,431
Plan participant
contributions 1,557 1,332 4,586 3,558
Plan amendments 4,082 715 (38,132)
Actuarial loss (gain) 96,078 110,923 (2,396) (36,261)
Benefits paid (53,255) (53,031) (19,251) (18,982)
Impact of foreign
exchange rates (19,869) 19,574 58 47
Special termination
benefit cost 203 198
Other 579 8,898
Benefit obligation
at December 31 $1,196,383 $1,080,525 $102,213 $ 146,764
Change in Plan Assets
Fair value of plan assets
at January 1 $ 893,384 $ 790,470 $ 42,347 $ 50,081
Actual return on plan
assets 75,435 94,969 2,270 5,238
Company contributions 82,163 39,975 2,930 2,704
Plan participant
contributions 1,557 1,332 4,586 3,558
Benefits paid (53,255) (53,031) (19,251) (18,982)
Impact of foreign
exchange rates (14,093) 13,721
Expenses paid (4,245) (3,104) (177) (252)
Other 496 9,052
Fair value of plan assets
at December 31 $ 981,442 $ 893,384 $ 32,705 $ 42,347
Reconciliation of Funded
Status, December 31
Funded status of plan $ (214,941) $ (187,565) $ (69,508) $(104,417)
Unrecognized net
actuarial loss 439,287 372,669 57,560 64,127
Unrecognized prior
service cost 9,356 7,048 (37,917) (8,782)
Unrecognized net
transition obligation 5,627 5,914
Net amount recognized $ 239,329 $ 198,066 $ (49,865) $ (49,072)
NOTES TO CONSOL IDATED F INANCIAL STATEMENTSDOLLARS IN THOUSANDS EXCEPT PER SHARE DATA
64 S O N O C O 2 0 0 5

RETIREMENT PLANS
2005 2004
Total Recognized Amounts in the
Consolidated Balance Sheets
Prepaid benefit cost $281,904 $237,200
Accrued benefit liability (133,545) (129,555)
Intangible asset 6,486 5,228
Accumulated other comprehensive loss 84,484 85,193
Net amount recognized $239,329 $198,066
The accumulated benefi t obligation for all defi ned
benefi t plans was $1,099,747 and $1,010,596 at December
31, 2005 and 2004, respectively.
The projected benefi t obligation (“PBO”), accumu-
lated benefi t obligation (“ABO”) and fair value of plan
assets for pension plans with accumulated benefi t obli-
gations in excess of plan assets were $375,655, $348,384
and $216,841, respectively, as of December 31, 2005, and
$344,355, $329,740 and $200,458, respectively, as of
December 31, 2004. As of December 31, 2005, the ABO
of the Company’s U.S. qualifi ed pension plan was fully
funded.
The following table sets forth the Company’s pro-
jected benefi t payments for the next ten years:
RETIREE HEALTH AND LIFE YEAR RETIREMENT PLANS INSURANCE PLANS
2006 $51,214 $10,347
2007 52,492 10,069
2008 54,459 9,561
2009 55,662 9,472
2010 58,230 9,404
2011-2015 334,398 44,840
ASSUMPTIONS
The following tables set forth the major actuarial
assumptions used in determining the PBO, ABO and
net periodic cost.
Weighted-average assumptions
used to determine benefit
obligations at December 31 U.S. FOREIGN PLANS
Retirement Plans and Retiree Health and Life Insurance Plans:
Discount Rate
2005 5.50% 4.00 - 5.25%
2004 5.75% 4.50 - 6.25%
Rate of Compensation Increase
2005 4.80% 3.00 - 5.50%
2004 4.60% 1.50 - 4.00%
Weighted-average assumptions
used to determine net periodic
benefit cost for years ended
December 31 U.S. FOREIGN PLANS
Retirement Plans and Retiree Health and Life Insurance Plans:
Discount Rate
2005 5.75% 4.25 - 6.00%
2004 6.25% 5.00 - 6.50%
2003 6.75% 5.00 - 7.00%
Expected Long-term Rate of Return
2005 8.50% 3.75 - 8.00%
2004 8.50% 4.00 - 8.00%
2003 8.75% 5.50 - 8.50%
Rate of Compensation Increase
2005 4.60% 3.00 - 5.50%
2004 4.60% 1.50 - 4.00%
2003 4.60% 1.50 - 5.00%
The expected long-term rate of return assumption is
based on the Company’s current and expected future
portfolio mix by asset class, and expected nominal
returns of these asset classes.
The Company sets its annual discount rate for the
various Plans after analyzing the year-over-year change
in published benchmark rates (e.g. Moody’s AA Bond
Rate). In setting these rates, the Company also uses
yield curve models in order to validate the appropriate-
ness of the discount rates selected for each of the plans.
A new mortality table assumption was adopted by
the Company for the measurement of the December 31,
2005, benefi t obligations, moving from the 1983 GAM
mortality table to the RP-2000 CH table. This change in
mortality table increased pension liabilities by approxi-
mately 2%.
NOTES TO CONSOL IDATED F INANCIAL STATEMENTSDOLLARS IN THOUSANDS EXCEPT PER SHARE DATA
65A N N U A L R E P O R T

MEDICAL TRENDS
The U.S. Retiree Health and Life Insurance Plan
makes up 97% of the retiree health liability. Therefore,
the following information relates to the U.S. plan only.
HEALTHCARE COST TREND RATE 2005 13.30% 2004 10.0% ULTIMATE TREND RATE 2005 6.0% 2004 6.0%
YEAR AT WHICH THE RATE REACHES THE ULTIMATE TREND RATE
2005 2014 2004 2008
Increasing the assumed trend rate for healthcare costs
by one percentage point would increase the accumu-
lated postretirement benefi t obligation (the “APBO”) and
total service and interest cost component approximately
$2,369 and $174, respectively. Decreasing the assumed
trend rate for healthcare costs by one percentage point
would decrease the APBO and total service and interest
cost component approximately $2,094 and $152, respec-
tively. Based on amendments to the U.S. plan approved
in 1999, which became effective in 2003, cost increases
borne by the Company are limited to the Urban CPI, as
defi ned.
RETIREMENT PLAN ASSETS
The following table sets forth the weighted-average
asset allocations of the Company’s retirement plans at
December 31, 2005 and 2004, by asset category.
ASSET CATEGORY U.S. U.K. CANADA
Equity securities 2005 56.0% 74.0% 62.6% 2004 66.6% 71.4% 59.9% Debt securities 2005 25.7% 20.7% 37.4% 2004 28.1% 22.8% 40.1% Alternative 2005 10.2% 4.4% 0.0% 2004 5.3% 4.4% 0.0% Cash 20051 8.1% 0.9% 0.0% 2004 0.0% 1.4% 0.0% Total 2005 100.0% 100.0% 100.0% 2004 100.0% 100.0% 100.0%
1 A contribution of $63,000 made to the U.S. Defi ned Benefi t Pension Plan in late December 2005 is included in cash.
The Company employs a total-return investment
approach whereby a mix of equities and fi xed income
investments is used to maximize the long-term return of
plan assets for a prudent level of risk. Alternative assets
such as real estate, private equity and hedge funds may
be used judiciously to enhance long-term returns while
improving portfolio diversifi cation. Risk tolerance is
established through careful consideration of plan liabili-
ties, plan funded status and corporate fi nancial condi-
tion. Investment risk is measured and monitored on an
ongoing basis through quarterly investment portfolio
reviews, annual liability measurements and periodic
asset/liability studies.
U.S. DEFINED BENEFIT PLAN
The equity investments are invested in U.S. and non-
U.S. stocks, and further diversifi ed in small and large
capitalizations. The current target allocation for the
investment portfolio is Equity Securities – 60%, Debt
Securities – 30%, Alternative – 10% and Cash – 0%.
U.K. PLAN
The equity investments are diversifi ed across domes-
tic and international stocks of small and large capitaliza-
tions. The current target allocation (midpoint) for the
investment portfolio is Equity Securities – 72%, Debt
Securities – 22%, Alternative – 5% and Cash – 1%.
CANADIAN PLAN
The equity investments are diversifi ed across domes-
tic and international stocks of primarily large capitaliza-
tions. The current target allocation (midpoint) for the
investment portfolio is Equity Securities – 50%, Debt
Securities – 50%, Alternative – 0% and Cash – 0%.
RETIREE HEALTH AND LIFE INSURANCE PLAN ASSETS
The following table sets forth the weighted-average
asset allocations of the Company’s retiree health and life
insurance plans at December 31, 2005 and 2004, by
asset category. As mentioned previously, the U.S. Retiree
Health and Life Insurance Plan makes up 97% of the
Retiree Health liability. Therefore, the following informa-
tion relates to the U.S. Plan only.
NOTES TO CONSOL IDATED F INANCIAL STATEMENTSDOLLARS IN THOUSANDS EXCEPT PER SHARE DATA
66 S O N O C O 2 0 0 5

ASSET CATEGORY Equity securities 2005 54.8% 2004 63.1% Debt securities 2005 30.4% 2004 31.2% Alternative 2005 6.9% 2004 3.9% Cash 2005 7.9% 2004 1.8% Total 2005 100.0% 2004 100.0%
CONTRIBUTIONS
The Company estimates that it will make minimal
voluntary contributions to its defi ned-benefi t retirement
and retiree health and life insurance plans in 2006.
MEDICARE PRESCRIPTION DRUG, IMPROVEMENT AND MODERNIZATION ACT OF 2003 In May 2004, the Financial Accounting Standards
Board (“FASB”) issued FASB Staff Position 106-2,
‘Accounting and Disclosure Requirements Related to
the Medicare Prescription Drug, Improvement and
Modernization Act of 2003’ (“FSP 106-2”), which requires
measures of the accumulated postretirement benefi t
obligation and net periodic postretirement benefi t costs
to refl ect the effects of the Medicare Prescription Drug,
Improvement and Modernization Act of 2003 (the “Act”).
FSP 106-2 was effective for interim or annual reporting
periods beginning after June 15, 2004. The Company
adopted and retroactively applied FSP 106-2 as of the
effective date. In response to the Company’s refl ection
of the Act and the adoption of FSP 106-2, the accumu-
lated postretirement benefi t obligation was reduced by
$48,940 and net periodic benefi t costs were reduced by
$9,080 in 2004. The reduction in obligation directly
related to the subsidy was $3,942 and $28,655 in 2005
and 2004, respectively.
The projected subsidy as of December 31, 2005, was
substantially less than the projected subsidy as of
December 31, 2004, because the Company changed the
eligibility for retiree medical benefi ts during 2005. As
part of these changes, prescription drug benefi ts for
Medicare-eligible retirees were eliminated for those
employees who retired after 1981 and for all future retir-
ees, thereby signifi cantly reducing the projected subsidy.
YEAR PROJECTED SUBSIDY
2006 $ 188
2007 198
2008 206
2009 213
2010 218
2011-2015 1,181
SONOCO SAVINGS PLAN
The Company sponsors the Sonoco Savings Plan for
its U.S. employees, a defi ned contribution retirement
plan. Beginning in 2002, the Company adopted the IRS
“Safe Harbor” matching contributions and vesting provi-
sions which provide 100% Company matching on the
fi rst 3% of pretax contributions, 50% Company matching
on the next 2% of pretax contributions and 100% imme-
diate vesting. The plan also provides for participant con-
tributions of 1% to 30% of gross pay beginning in 2004.
For 2003 and 2002, the plan provided that all eligible
employees could contribute 1% to 20% of their gross
pay. The Company’s expenses related to the plan for
2005, 2004 and 2003 were approximately $13,000,
$11,000 and $12,000, respectively.
SONOCO INVESTMENT AND RETIREMENT PLAN
The Company also sponsors the Sonoco Investment
and Retirement Plan, a defi ned contribution pension
plan, for its salaried and non-union U.S. employees who
were hired on or after January 1, 2004, the Plan’s effec-
tive date. The Company makes an annual contribution
of 4% of all eligible pay plus 4% of eligible pay in excess
of the Social Security wage base to eligible participant
accounts. The fi rst such contribution was made in
January 2005, in the amount of $35, for those partici-
pants eligible to participate in the plan during 2004, and
the 2005 expense was $414. Participants are fully vested
after fi ve years of service or upon reaching age fi fty-fi ve,
if earlier.
13. INCOME TA XES
The Company provides for income taxes using the
asset and liability method. Under this method,
deferred tax assets and liabilities are determined
NOTES TO CONSOL IDATED F INANCIAL STATEMENTSDOLLARS IN THOUSANDS EXCEPT PER SHARE DATA
67A N N U A L R E P O R T

based on differences between fi nancial reporting
requirements and tax laws. Assets and liabilities are
measured using the enacted tax rates and laws that
will be in effect when the differences are expected to
reverse.
The provision for taxes on income for the years
ended December 31 consists of the following:
2005 2004 2003
Pretax income
Domestic $ 185,089 $ 151,707 $ 157,889
Foreign 46,037 45,635 31,317
Total pretax income $ 231,126 $ 197,342 $ 189,206
Current
Federal $ 85,047 $ 30,427 $ 26,831
State 4,311 199 2,682
Foreign 19,538 22,922 17,109
Total current $ 108,896 $ 53,548 $ 46,622
Deferred
Federal $ (27,110) $ 5,971 $ 9,644
State 4,116 1,995 1,813
Foreign (1,728) (2,656) (282)
Total deferred $ (24,722) $ 5,310 $ 11,175
Total taxes $ 84,174 $ 58,858 $ 57,797
Deferred tax liabilities (assets) are comprised of the
following at December 31:
2005 2004
Depreciation $ 100,623 $ 123,874
Employee benefits 116,090 107,380
Other 10,516 10,524
Gross deferred tax liabilities 227,229 241,778
Retiree health benefits (26,429) (21,345)
Foreign loss carryforwards (39,023) (36,617)
Capital loss carryforwards (4,448) (7,176)
Employee benefits (45,659) (44,528)
Accrued liabilities and other (33,785) (32,037)
Gross deferred tax assets (149,344) (141,703)
Valuation allowance on deferred
tax assets 43,022 43,192
Total deferred taxes, net $ 120,907 $ 143,267
The net decrease in the valuation allowance in 2005
for deferred tax assets of $170 is due to an increase of
net operating and capital losses of foreign subsidiaries of
$1,778, for which tax benefi t has not been recognized,
offset by a decrease of $1,948 related to loss carryfor-
wards and other deferred tax assets for which a valua-
tion allowance was no longer required.
Approximately $131,799 of foreign subsidiary loss car-
ryforwards remain at December 31, 2005. Their use is
limited to future taxable earnings of the respective for-
eign subsidiaries. Of these loss carryforwards, approxi-
mately $97,756 has no expiration date. The remaining
loss carryforwards expire at various dates in the future.
Approximately $5,498 of state loss carryforwards and
$3,634 of state credit carryforwards remain at December
31, 2005. The loss and credit carryforwards expire at
various dates in the future.
A reconciliation of the U.S. federal statutory tax rate
to the actual consolidated tax expense is as follows:
2005 2004 2003
Statutory
tax rate $ 80,894 35.0% $ 69,070 35.0% $ 66,222 35.0%
State income
taxes, net
of federal
tax benefit 1,204 .5 1,425 .7 3,085 1.6
Repatriation 9,891 4.3
Valuation
allowance 5,001 2.2 7,777 3.9 (8,790) (4.6)
IRS examination (9,261) (4.7)
Other, net (12,816) (5.6) (10,153) (5.1) (2,720) (1.5)
Total taxes $ 84,174 36.4% $ 58,858 29.8% $ 57,797 30.5%
Undistributed earnings of international subsidiaries
totaled $71,705 at December 31, 2005. Deferred taxes
have not been provided on the undistributed earnings,
as the Company considers these amounts to be indefi -
nitely reinvested to fi nance international growth and
expansion. If such amounts were remitted, loaned to the
Company or the stock in the foreign subsidiaries sold,
these earnings could become subject to tax.
During 2005, the Company repatriated $124,658 from
foreign subsidiaries under the provisions of the
American Jobs Creation Act of 2004 (“AJCA”). Under this
temporary incentive, a portion of the repatriated funds
qualifi ed for an 85% dividends-received deduction. The
Company has accrued the U.S. federal and state taxes
due on the repatriated funds of $10,074. During 2004,
the IRS closed its examination of the Company’s tax
NOTES TO CONSOL IDATED F INANCIAL STATEMENTSDOLLARS IN THOUSANDS EXCEPT PER SHARE DATA
68 S O N O C O 2 0 0 5

returns for years 1999 through 2001, which resulted in
the reversal of previously accrued taxes totaling approxi-
mately $9,261. The Company has resolved all issues with
the IRS for all years through 2001. The Company
believes that it has made adequate provision for income
taxes with respect to open years.
14. COMMITMENTS AND CONTINGENCIES
CONTINGENCIES
The Company is a party to various legal proceed-
ings incidental to its business, and is subject to a vari-
ety of environmental and pollution control laws and
regulations in all jurisdictions in which it operates.
The Company also faces exposure from actual or
potential claims and legal proceedings. The Company
cannot currently determine the fi nal outcome of the
proceedings described below or the ultimate amount
of potential losses. Pursuant to Statement of Financial
Accounting Standards No. 5, ‘Accounting for
Contingencies’ (“FAS 5”), management records accru-
als for estimated losses at the time that information
becomes available indicating that losses are probable
and that the amounts can be reasonably estimated.
Accrued amounts are not discounted. Although the
level of future expenditures for legal and environ-
mental matters is impossible to determine with any
degree of probability, it is management’s opinion that
such costs, when fi nally determined, will not have a
material adverse effect on the consolidated fi nancial
position of the Company.
ENVIRONMENTAL MATTERS
During the fourth quarter of 2005, the United States
Environmental Protection Agency (“EPA”) notifi ed
Sonoco U.S. Mills, Inc. (“U.S. Mills”), a wholly owned
subsidiary of the Company, that U.S. Mills and another
party would be jointly held responsible to undertake a
program to remove and dispose of certain PCB-contam-
inated sediments at a particular site on the lower Fox
River in Wisconsin. U.S. Mills and the other party have
reached agreement that each would fund 50% of the
costs of remediation, which is currently estimated to be
between $25,000 and $30,000 for the project as a whole.
Although project implementation will begin shortly,
most of the project cost is expected to be incurred in
2007. Although the agreement reached does not
acknowledge responsibility or prevent the other party
from seeking reimbursement from any other parties
(including each other), the Company has accrued
$12,500 as an estimate of the portion of costs that U.S.
Mills expects to fund under the current agreement. This
charge is included in “Selling, general and administrative
expenses” in the Company’s Consolidated Statements of
Income. The actual costs associated with cleanup of this
particular site are dependent upon many factors and it is
reasonably possible that remediation costs could be
higher than the current estimate of project costs. The
Company acquired U.S. Mills in 2001, and the alleged
contamination predates the acquisition. Based on infor-
mation currently known to the Company, it does not
appear that U.S. Mills is responsible for the alleged con-
tamination. Some, or all, of any costs incurred may be
covered by insurance, or be subject to recoupment from
other parties, but no amounts have been recognized in
the fi nancial statements for such recovery.
The Company has also been named as a potentially
responsible party at several other environmentally con-
taminated sites not owned by the Company. These regu-
latory actions (including those described in the prior
paragraph) and a small number of private-party lawsuits
represent the Company’s largest potential environmental
liabilities. All of the sites are also the responsibility of
other parties. The Company’s liability, if any, is shared
with such other parties, but the Company’s share has
not been fi nally determined in most cases. In some
cases, the Company has cost-sharing agreements with
other potentially responsible parties with respect to a
particular site. Such agreements relate to the sharing of
legal defense costs or cleanup costs, or both. The
Company has assumed, for purposes of estimating
amounts to be accrued, that the other parties to such
cost-sharing agreements will perform as agreed. It
appears that fi nal resolution of some of the sites is years
away. Accordingly, the ultimate cost to the Company
with respect to such sites cannot be determined.
As of December 31, 2005 and 2004, the Company
had accrued $16,789 (which includes $12,500 for U.S.
Mills) and $4,440, respectively, related to environmental
contingencies. Actual costs to be incurred for these envi-
ronmental matters in future periods may vary from cur-
rent estimates because of the inherent uncertainties in
evaluating environmental exposures.
NOTES TO CONSOL IDATED F INANCIAL STATEMENTSDOLLARS IN THOUSANDS EXCEPT PER SHARE DATA
69A N N U A L R E P O R T

INCOME TAXES
The Company is subject to ongoing examinations by
tax authorities of the jurisdictions in which it operates.
The Company regularly assesses the status of these
examinations and the potential for adverse outcomes to
determine the adequacy of the provision for income and
other taxes. The Company believes that adequate provi-
sion has been made for tax adjustments that are prob-
able as a result of any examination. While the status of
the Company’s ongoing tax examinations is constantly
changing due to new tax law developments, statute
expirations and other factors, the Company does not
expect the outcome of any tax examination to have a
material effect on its consolidated fi nancial position,
results of operations or cash fl ows.
COMMITMENTS
In December 2003, the Company entered into an
agreement with the majority shareholders of Demolli
Industria Cartaria S.p.A., an Italy-based manufacturer of
paperboard and tubes and cores that is 25% owned by
the Company and reported as an equity method invest-
ment. This agreement allows the majority shareholder to
require (through a put option arrangement) the
Company to buy the shares not currently owned by the
Company at any time between the date of the agree-
ment and December 2006. The agreement also gives the
Company the right to purchase the shares (through a
call option arrangement) any time after December 2006
through December 2009. The price of the share pur-
chase will be determined by a preset formula, which the
Company believes approximates fair value, related to an
earnings multiple at the time such shares might be put
or called. The Company is in discussion with the major-
ity shareholders of Demolli Industria Cartaria S.p.A. to
potentially extend the terms (both the put and the call)
of this agreement.
In November 2004, and in conjunction with the
Sonoco-Alcore joint venture, the Company entered into
an agreement with Ahlstrom, the minority shareholder
of Sonoco-Alcore. This agreement states that, following
a two and one-half year standstill period, subject to cer-
tain conditions, Ahlstrom shall have the right over the
following three and one-half years to require (through a
put option arrangement) the Company to purchase its
shares in Sonoco-Alcore. During the seventh year, the
Company will have the right to purchase the shares
(through a call option arrangement). The price of the
share purchase will be determined by a preset formula,
which the Company believes approximates fair value,
related to an earnings multiple at the time such shares
might be put or called.
As of December 31, 2005, the Company had long-
term obligations to purchase electricity and steam,
which it uses in its production processes. The purchase
contracts require the Company to make total payments
of approximately $148,432 through 2018.
15. SHAREHOLDERS’ EQUIT Y STOCK REPURCHASES
In 2001, the Company’s Board of Directors approved
a stock repurchase program authorizing the repurchase
of up to 5,000,000 shares of the Company’s common
stock, in addition to approximately 290,000 shares that
were authorized for repurchase prior to 2001. Therefore,
the Company had authorizations to repurchase approxi-
mately 5,290,000 shares of common stock as of
December 31, 2005. In December 2005, the Company
announced its intention to repurchase between
2,000,000 and 2,500,000 of its outstanding common
stock during the fi rst quarter of 2006.
EARNINGS PER SHARE
The following table sets forth the computation of
basic and diluted earnings per share:
2005 2004 2003
Numerator:
Net income $ 161,877 $ 151,229 $ 138,949
Denominator:
Average
common shares
outstanding 99,336,000 98,018,000 96,819,000
Dilutive effect of
stock based
compensation 1,082,000 929,000 310,000
Diluted outstanding
shares 100,418,000 98,947,000 97,129,000
Net income per
common share
Basic $ 1.63 $ 1.54 $ 1.44
Diluted $ 1.61 $ 1.53 $ 1.43
NOTES TO CONSOL IDATED F INANCIAL STATEMENTSDOLLARS IN THOUSANDS EXCEPT PER SHARE DATA
70 S O N O C O 2 0 0 5

The Company declared dividends totaling $.91 and
$.87 per share in 2005 and 2004, respectively.
Stock options to purchase approximately 1,147,000,
2,192,000 and 7,876,000 shares for 2005, 2004 and 2003,
respectively, were not dilutive and, therefore, were not
included in the computations of diluted income per
common share amounts. These options may become
dilutive in future periods if the market price of the
Company’s common stock appreciates. No adjustments
were made to reported net income in the computation
of earnings per share.
The number of prior years’ common shares outstand-
ing on the Consolidated Statements of Changes in
Shareholders’ Equity has been restated to exclude out-
standing, vested, contingent shares units awarded pursu-
ant to the Restricted Stock Plan. These units have, how-
ever, been included in both basic and diluted common
shares outstanding, and the related calculation of net
income per common share, for all periods presented.
These share units totaled 406, 293, and 248 for 2005,
2004 and 2003, respectively.
16. FINANCIAL REPORTING FOR BUSINESS SEGMENTS
The Company identifi es its reportable segments in
accordance with Statement of Financial Accounting
Standards No. 131, ‘Disclosures about Segments of an
Enterprise and Related Information’ (“FAS 131”), by
evaluating the level of detail reviewed by the Chief
Operating Decision Maker, gross profi t margins,
nature of products sold, nature of the production
processes, type and class of customer, methods to
distribute product and nature of regulatory environ-
ment. While all of these factors were reviewed, the
Company feels that the most signifi cant factors are the
nature of its products, the nature of the production pro-
cess and the type of customers served.
Effective December 31, 2005, the Company changed
the name of the Engineered Carriers and Paper segment
to Tubes and Cores/Paper, because the term “tubes and
cores” is more generally understood than “engineered
carriers” in the marketplace for the primary products
offered by the businesses in this segment. There has
been no change in the businesses included in this
segment.
The Tubes and Cores/Paper segment includes the fol-
lowing products and services: high-performance paper
and composite paperboard tubes and cores; fi ber-based
construction tubes and forms; recycled paperboard; lin-
erboard; and supply-chain packaging services.
The Consumer Packaging segment includes the fol-
lowing products: round and shaped rigid packaging,
both composite and plastic; printed fl exible packaging;
and metal and plastic ends and closures.
The Packaging Services segment provides the follow-
ing products and services: point-of-purchase displays;
packaging fulfi llment; contract packing; brand manage-
ment; and supply chain management.
All Other Sonoco represents the activities and busi-
nesses of the Company’s consolidated subsidiaries that
do not meet the aggregation criteria outlined in FAS 131,
and therefore cannot be combined with other operating
segments into a reportable segment. All Other Sonoco
includes the following products: wooden, metal and
composite reels; molded and extruded plastics; custom-
designed protective packaging; and paper amenities
such as coasters and glass covers.
NOTES TO CONSOL IDATED F INANCIAL STATEMENTSDOLLARS IN THOUSANDS EXCEPT PER SHARE DATA
71A N N U A L R E P O R T

1 Intersegment sales are recorded at a market-related transfer price.
2 Corporate 2005, 2004 and 2003 include restructuring costs of $(16,020), $(14,752) and $(31,413), respectively, associated with the Tubes and Cores/Paper segment; $(4,617), $(5,261) and $(9,469), respectively, associated with the Consumer Packaging segment; $0, $0 and $(335), respectively, associated with the Packaging Services segment; $(600), $(1,018) and $(1,806), respec-tively, associated with All Other Sonoco; a reversal of previously recorded restructuring charges of $2,049 in 2004 and $(7,033) for 2003, for Corporate related restructuring. Interest expense and interest income are also shown under Corporate.
3 Identifi able assets are those assets used by each segment in its operations. Corporate assets consist primarily of cash and cash equivalents, investments in affi liates, headquarters facilities and pre-paid expenses.
Included in Corporate operating profi ts are restructuring charges, interest expense and interest income.
Total Revenue
2005 $ 1,569,170 $ 1,250,916 $ 456,161 $ 377,968 $ 3,654,215
2004 1,470,213 1,134,782 321,251 343,813 3,270,059
2003 1,334,223 1,046,525 185,006 295,029 2,860,783
Intersegment Sales1
2005 $ 87,113 $ 3,465 $ 284 $ 34,779 $ 125,641
2004 81,701 2,712 206 30,007 114,626
2003 74,391 2,143 386 25,537 102,457
Sales to Unaffiliated Customers
2005 $ 1,482,057 $ 1,247,451 $ 455,877 $ 343,189 $ 3,528,574
2004 1,388,512 1,132,070 321,045 313,806 3,155,433
2003 1,259,832 1,044,382 184,620 269,492 2,758,326
Operating Profits2
2005 $ 107,060 $ 103,505 $ 44,813 $ 40,607 $ (64,859) $ 231,126
2004 113,032 83,111 30,266 31,978 (61,045) 197,342
2003 102,938 78,733 7,935 18,995 (100,268) 108,333
Identifiable Assets3
2005 $ 1,258,166 $ 738,023 $ 321,742 $ 189,369 $ 474,440 $ 2,981,740
2004 1,107,223 735,162 320,401 191,975 686,558 3,041,319
2003 1,075,707 683,284 49,191 195,799 516,652 2,520,633
Depreciation, Depletion
and Amortization
2005 $ 83,737 $ 56,281 $ 11,994 $ 11,062 $ 163,074
2004 85,153 59,413 8,236 11,126 163,928
2003 83,647 52,549 3,453 13,040 152,689
Capital Expenditures
2005 $ 62,312 $ 50,802 $ 4,913 $ 11,085 $ 129,112
2004 59,410 50,686 3,279 6,425 119,800
2003 48,612 50,951 5,069 3,785 108,417
YEARS ENDED TUBES AND CONSUMER PACKAGING ALL OTHER DECEMBER 31 CORES/PAPER PACKAGING SERVICES SONOCO CORPORATE CONSOLIDATED
NOTES TO CONSOL IDATED F INANCIAL STATEMENTSDOLLARS IN THOUSANDS EXCEPT PER SHARE DATA
72 S O N O C O 2 0 0 5

GEOGRAPHIC REGIONS
Sales to unaffi liated customers and long-lived assets
by geographic region are as follows:
2005 2004 2003
Sales to Unaffiliated
Customers
United States $ 2,303,890 $ 2,112,248 $ 1,859,609
Europe 539,918 443,463 392,198
Canada 340,532 315,978 262,826
All other 344,234 283,744 243,693
Total $ 3,528,574 $ 3,155,433 $ 2,758,326
Long-lived Assets
United States $ 1,054,430 $ 1,090,187 $ 884,863
Europe 342,601 277,088 187,588
Canada 165,243 164,550 157,587
All other 143,894 130,409 120,886
Total $ 1,706,168 $ 1,662,234 $ 1,350,924
Sales information from the United States does not
include the impact of the High Density Film business,
which is classifi ed as discontinued operations.
Sales are attributed to countries/regions based upon
the plant location from which products are shipped.
Long-lived assets are comprised of property, plant and
equipment, goodwill, intangible assets and investment in
affi liates (see Notes 7 and 8).
17. ACCUMUL ATED OTHER COMPREHENSIVE LOSS
The following table summarizes the components of
accumulated other comprehensive loss, and the changes
in accumulated comprehensive loss, net of tax as appli-
cable, for the years ended December 31, 2005 and 2004:
FOREIGN MINIMUM ACCUMULATED CURRENCY PENSION DERIVATIVE OTHER TRANSLATION LIABILITY FINANCIAL COMPREHENSIVE ADJUSTMENTS ADJUSTMENTS INSTRUMENTS LOSS
Balance at
Dec. 31, 2003 $ (83,906) $ (53,826) $ 1,641 $ (136,091)
Change during
2004 36,917 (4,479) 498 32,936
Balance at
Dec. 31, 2004 (46,989) (58,305) 2,139 (103,155)
Change during
2005 (12,844) 568 9,042 (3,234)
Balance at
Dec. 31, 2005 $ (59,833) $ (57,737) $ 11,181 $ (106,389)
The cumulative tax benefi t of the Minimum Pension
Liability Adjustments was $26,746 and $26,888 in 2005
and 2004, respectively. Additionally, the tax liability of
Derivative Financial Instruments was $6,289 and $1,211
in 2005 and 2004, respectively. The 2005 tax effect on
the Minimum Pension Liability Adjustments and
Derivative Financial Instruments was $(142) and
$(5,078), respectively. The 2004 tax effect on the
Minimum Pension Liability Adjustments and Derivative
Financial Instruments was $1,576 and $(271),
respectively.
18. NEW ACCOUNTING PRONOUNCEMENTS
During 2005, there were no new accounting pro-
nouncements that had a material impact on the
Company.
In May 2004, the FASB issued FASB Staff Position
106-2, ‘Accounting and Disclosure Requirements Related
to the Medicare Prescription Drug, Improvement and
Modernization Act of 2003’ (“FSP 106-2”), which requires
measures of the accumulated postretirement benefi t
obligation and net periodic postretirement benefi t costs
to refl ect the effects of the Medicare Prescription Drug,
Improvement and Modernization Act of 2003. FSP 106-2
was effective for interim or annual reporting periods
beginning after June 15, 2004. The Company adopted
and retroactively applied FSP 106-2 as of the effective
date. See Note 12 for further information about the
reduction in net periodic benefi t costs.
In December 2004, the FASB issued FASB Staff
Position 109-1, ‘Application of FASB Statement No. 109,
“Accounting for Income Taxes,” to the Tax Deduction on
Qualifi ed Production Activities Provided by the
American Jobs Creation Act of 2004’ (“FSP 109-1”).
Under the guidance of FSP 109-1, the deduction will be
treated as a “special deduction” as described in
Statement of Financial Accounting Standards No. 109,
‘Accounting for Income Taxes’ (“FAS 109”). As such, the
special deduction has no effect on deferred tax assets
and liabilities existing at the enactment date. Rather, the
impact of this deduction will be reported in the period
in which the deduction is claimed on the Company’s tax
return.
In December 2004, the FASB issued FASB Staff
Position 109-2, ‘Accounting and Disclosure Guidance for
the Foreign Earnings Repatriation Provision within the
NOTES TO CONSOL IDATED F INANCIAL STATEMENTSDOLLARS IN THOUSANDS EXCEPT PER SHARE DATA
73A N N U A L R E P O R T

American Jobs Creation Act of 2004’ (“FSP 109-2”).
Under the guidance of FSP 109-2, an enterprise is
allowed time beyond the fi nancial reporting period of
enactment to evaluate the effect of the AJCA on its plan
for reinvestment, or repatriation, of foreign earnings for
purposes of applying FAS 109. The deduction is subject
to a number of limitations. The Company repatriated
$124,658 of foreign earnings during 2005, resulting in a
tax liability of $10,074.
In December 2004, the FASB issued a revision to
Statement of Financial Accounting Standards No. 123,
‘Share-Based Payment’ (“FAS 123R”), which requires
companies to expense the value of employee stock
options and similar awards. Under FAS 123R, share-
based payment awards result in a cost that will be mea-
sured at fair value on the awards’ grant date, based on
the estimated number of awards that are expected to
vest. FAS 123R is effective for the Company on
January 1, 2006. The Company is planning to use the
“modifi ed prospective” transition method, which does
not require restating previous periods’ results. No addi-
tional compensation expense will be recorded for any
vested awards outstanding as of the effective date. The
Company did not have any unvested awards outstanding
that will be affected by FAS 123R as of the effective date.
Based on its current expectations, the Company expects
that earnings per diluted share will decrease by approxi-
mately $.03 in 2006 and annually thereafter. The histori-
cal impact on net income and earnings per share if stock
options had been expensed is set forth in Note 11.
1 Includes restructuring charges of $5,042 ($3,646 after tax), $9,143 ($6,126 after tax), $4,275 ($2,599 after tax) and $2,777 ($1,972 after tax) in the fi rst, second, third and fourth quarter, respectively. The fi rst, second, third and fourth quarters also include income of $528, $536, $140 and $56 after tax, respec-tively, associated with the allocation of restructuring charges to the minority interest shareholder of Sonoco-Alcore.
2 The fourth quarter of 2005 includes $10,074 for additional tax expense associated with the repatriation of $124,658 in foreign earnings under AJCA and a charge of $12,500 ($7,596 after tax) related to an increase in the environ-mental reserve at a Company subsidiary’s paper operations in Wisconsin.
3 Includes restructuring charges of $1,328 ($1,091 after tax), $5,768 ($4,604 after tax), $1,148 ($952 after tax) and $10,738 ($9,507 after tax) in the fi rst, second, third and fourth quarter, respectively. The fourth quarter also includes income of $1,778 ($1,778 after tax) associated with the allocation of restruc-turing charges to the minority interest share-holder of Sonoco-Alcore.
4 The fourth quarter of 2004 includes the correction associated with the misstatement of expenses in the Company’s wholly owned sub-sidiary in Spain. This correction totaled approximately $9,400, before and after tax, of which $2,200 was related to restructuring charges. Of the remaining $7,200, approxi-mately $1,600 was associated with the fi rst three quarters of 2004, approximately $1,300 was associated with 2003, approximately $300 was associated with 2002, approximately $1,900 was associated with 2001 and the remaining amount of approximately $2,100 was associated with years prior to 2001.
19. SELECTED QUARTERLY FINANCIAL DATA The following table sets forth selected quarterly fi nancial data of the
Company:
FIRST SECOND THIRD FOURTH (UNAUDITED) QUARTER QUARTER QUARTER QUARTER
2005
Net sales $ 814,438 $ 878,170 $ 881,058 $ 954,908
Gross profi t 148,316 160,744 163,392 188,499
Net income1,2 36,989 40,176 45,913 38,799
Per common share
Net income - basic $ .37 $ .40 $ .46 $ .39
- diluted .37 .40 .46 .38
Cash dividends - common .22 .23 .23 .23
Market price - high 30.24 29.13 28.84 30.64
- low 25.58 25.46 25.79 25.43
2004
Net sales $ 695,416 $ 763,902 $ 811,117 $ 884,998
Gross profi t 121,582 143,149 153,545 156,514
Net income3,4 38,590 36,705 40,940 34,994
Per common share
Net income - basic $ .40 $ .37 $ .42 $ .36
- diluted .39 .37 .41 .35
Cash dividends - common .21 .22 .22 .22
Market price - high 25.21 25.99 26.50 29.73
- low 22.92 23.70 24.53 25.12
NOTES TO CONSOL IDATED F INANCIAL STATEMENTSDOLLARS IN THOUSANDS EXCEPT PER SHARE DATA
74 S O N O C O 2 0 0 5

21. SUBSEQUENT EVENTS
STOCK APPRECIATION RIGHTS
On January 31, 2006, the Company’s Board of
Directors approved the issuance of 760,650 stock appre-
ciation rights (“SARs”) to certain employees and non-
employee directors under its shareholder approved Key
Employee Stock Plan (the “Plan”).
On February 1, 2006, the Company issued SARs on
249,000 shares of its common stock to executive offi cers
under the Plan. The SARs were granted at the prevailing
market price on the date of grant, and will vest one year
from the date of the grant.
PERFORMANCE-BASED STOCK PLANS
On February 1, 2006, the Company also issued per-
formance contingent share units to executive offi cers
and other members of management under the Plan. Key
provisions of the grants are:
1) Awards vest in three years if performance targets are
met, or in fi ve years otherwise.
2) The fi nancial performance measures used to deter-
mine the amount of share units vested are corporate
earnings per share (as adjusted to exclude certain items)
and average return on net assets employed (“RONAE”).
In order for a recipient to receive the maximum num-
ber of share units under the plan, cumulative corporate
earnings per share growth must average 10% a year
over the three-year period and RONAE must average
between 9.5% to 10.5%, depending on capital invested
in acquisitions over the three-year period.
If less than the threshold number of share units vest
during the three-year performance period, the remain-
ing number of threshold shares will vest in fi ve years
from the date of grant, subject to a participant’s contin-
ued employment.
For recipients, the threshold number of share units
granted under the plan in 2006 is 72,250, and the maxi-
mum number of share units granted under the plan in
2006 is 216,750.
ACQUISITIONS
On February 24, 2006, in two separate transactions,
the Company acquired a fl exible packaging business in
the United States and a tube and core manufacturer in
Canada for an aggregate cash purchase price of approxi-
mately $35,000. These acquisitions will become compo-
nents of the Consumer Packaging segment and the
Tubes and Cores/Paper segment, respectively.
1 Includes amounts written off.
2 Includes translation adjustments.
3 Includes adjust-ments based on pric-ing and inventory levels.
4 Includes utilization and expiration of domestic capital loss carryforwards and increases from foreign net operating losses for which no tax benefi t can be realized.
5 Includes utilization of domestic capital loss carryforwards and increases from foreign net operating losses for which no tax benefi t can be realized.
20. VALUATION AND QUAL IFY ING ACCOUNTS
COLUMN A COLUMN B – ADDITIONS COLUMN C COLUMN D BALANCE AT CHARGED TO BEGINNING COSTS AND CHARGED BALANCE AT OF YEAR EXPENSES TO OTHER DEDUCTIONS END OF YEAR
2005
Allowance for Doubtful Accounts $ 8,286 $ 3,6612 $ (162)2 $ 3,4601 $ 8,325
LIFO Reserve $ 10,701 $ 8673 $ 11,568
Valuation Allowance on
Deferred Tax Assets $ 43,192 $ 5,0015 $ 5,1712,4 $ 43,022
2004
Allowance for Doubtful Accounts $ 8,199 $ 4,1862 $ 4,0991 $ 8,286
LIFO Reserve $ 10,462 $ 2393 $ 10,701
Valuation Allowance on
Deferred Tax Assets $ 26,941 $ 7,7774 $ 8,4742,4 $ 43,192
2003
Allowance for Doubtful Accounts $ 8,335 $ 5,1322 $ 5,2681 $ 8,199
LIFO Reserve $ 10,284 $ 1783 $ 10,462
Valuation Allowance on
Deferred Tax Assets $ 35,731 $ 13,6174 $ 22,4072,4 $ 26,941
NOTES TO CONSOL IDATED F INANCIAL STATEMENTSDOLLARS IN THOUSANDS EXCEPT PER SHARE DATA
75A N N U A L R E P O R T

SELECTED ELEVEN-YEAR F INANCIAL DATA (unaudited)
(DOLLARS AND SHARES IN THOUSANDS EXCEPT PER SHARE DATA)
Years ended December 31 2005 2004 2003 2002Operating Results1
Net sales $ 3,528,574 $ 3,155,433 $ 2,758,326 $ 2,701,419Cost of sales and operating expenses 3,232,590 2,897,046 2,549,726 2,455,357Other expense, net2 21,237 18,982 50,056 10,409Interest expense 51,559 47,463 52,399 54,196Interest income (7,938) (5,400) (2,188) (1,649)Income before income taxes 231,126 197,342 108,333 183,106Provision for income taxes3 84,174 58,858 37,698 65,075Equity in earnings of affiliates/minority interest4 14,925 12,745 7,543 7,437Income from continuing operations 161,877 151,229 78,178 125,468Income from discontinued operations,
net of income taxes 60,771 9,848Income before extraordinary loss 161,877 151,229 138,949 135,316Extraordinary loss, net of income tax benefitNet income 161,877 151,229 138,949 135,316Preferred dividendsNet income available to common shareholders $ 161,877 $ 151,229 $ 138,949 $ 135,316Per common share
Net income available to common shareholders:Basic $ 1.63 $ 1.54 $ 1.44 $ 1.40Diluted 1.61 1.53 1.43 1.39
Cash dividends – common .91 .87 .84 .83Average common shares outstanding:
Basic 99,336 98,018 96,819 96,373Diluted 100,418 98,947 97,129 97,178
Actual common shares outstanding at December 31 99,988 98,500 96,969 96,380Financial PositionNet working capital $ 265,014 $ 282,226 $ 75,671 $ 104,671Property, plant and equipment, net 943,951 1,007,295 923,569 975,368Total assets 2,981,740 3,041,319 2,520,633 2,436,439Long-term debt 657,075 813,207 473,220 699,346Total debt 781,605 906,961 674,587 833,846Shareholders’ equity 1,263,314 1,152,879 1,014,160 867,425Current ratio 1.4 1.4 1.1 1.2Total debt to total capital5 35.7% 40.7% 36.4% 44.5%Other DataDepreciation, depletion and amortization expense1 $ 163,074 $ 163,928 $ 153,538 $ 145,923Cash dividends declared – common 90,126 85,060 81,128 79,768Market price per common share (ending) 29.40 29.65 24.62 22.93Return on total equity (including preferred stock)1,2,6 13.5% 14.2% 15.0% 16.0%Return on net sales1,2 5.0% 4.8% 5.0% 5.0%
1 Operating results for 2004 and 2005 are not comparable to previous years due to the impact of the CorrFlex acquisition that occurred in May2004, and the formation of the Sonoco-Alcore joint venture that occurred in November 2004. Operating results for 1995 through 2002 havebeen restated to classify the High Density Film business, which was sold in 2003, as discontinued operations.
2 2005 data reflects net charges of $21,237 pretax, $14,343 after tax, for restructuring cost. 2004 data reflects net charges of $18,982 pretax,$16,154 after tax, for restructuring costs. 2003 data reflects net charges of $50,056 pretax, $35,329 after tax, for restructuring costs. 2002 datareflects net charges of $10,409 pretax, $6,663 after tax, for restructuring costs. 2001 data reflects net charges of $51,175 pretax, $49,028 aftertax, for the net gain from legal settlements, costs of corporate-owned life insurance (COLI) and restructuring costs. 2000 data reflects netcharges of $5,543 pretax, $1,372 after tax, for the net gain on the sale of divested businesses, restructuring costs and executive severancecharges. 1999 data reflects the gain on the sale of divested businesses of $(3,500). 1998 data reflects the net gain on the sale of divestedbusinesses of $(100,354) pretax, or $(41,554) after tax. 1997 data reflects the asset impairment charges of $226,358 pretax, or $174,500 aftertax.
3 The provision for income taxes included $10,074 in 2005 related to the repatriation of foreign earnings under the American Jobs Creation Actof 2004, $(9,261) associated with the closing of previous years’ examinations in 2004 and $14,613 and $12,000 in 2001 and 2000,respectively, related to COLI.
4 2005, 2004, 2003 and 2001 data includes restructuring charges of $(1,260), $(1,778), $1,455 and $6,591, respectively.
5 Calculated as Total Debt divided by the sum of Total Debt, Shareholders’ Equity and Long-term Deferred Tax Liability. Debt levels for 1995through 2000 have been adjusted for cash related to the issuance of restricted-purpose bonds.
6 Calculated by dividing net income into the average of quarterly Total Shareholders’ Equity.
76 S O N O C O 2 0 0 5

2001 2000 1999 1998 1997 1996 1995
$ 2,464,445 $ 2,570,708 $ 2,391,666 $ 2,409,045 $ 2,702,700 $ 2,638,414 $ 2,556,2482,204,874 2,250,793 2,085,434 2,149,853 2,382,327 2,344,455 2,275,942
51,175 5,543 (3,500) (100,354) 226,35852,217 59,604 52,466 54,779 57,194 55,481 44,004(3,800) (3,794) (5,314) (5,916) (4,971) (6,191) (4,905)
159,979 258,562 262,580 310,683 41,792 244,669 241,20777,269 107,463 98,333 142,857 51,647 93,837 94,984(1,214) 7,702 6,830 6,387 (991) (1,777) 36981,496 158,801 171,077 174,213 (10,846) 149,061 146,592
10,113 7,497 16,728 17,783 13,463 21,810 17,92791,609 166,298 187,805 191,996 2,617 170,871 164,519
(11,753)91,609 166,298 187,805 180,243 2,617 170,871 164,519
(3,061) (7,196) (7,763)$ 91,609 $ 166,298 $ 187,805 $ 180,243 $ (444) $ 163,675 $ 156,756
$ .96 $ 1.67 $ 1.84 $ 1.76 $ .00 $ 1.64 $ 1.56.96 1.66 1.83 1.73 .00 1.58 1.49.80 .79 .75 .704 .641 .586 .524
95,370 99,725 101,886 102,632 100,981 99,564 100,25395,807 99,900 102,780 104,275 107,350 108,487 110,11195,453 94,681 101,134 101,683 105,417 98,850 100,229
$ 204,899 $ 258,713 $ 306,450 $ 225,347 $ 438,896 $ 262,533 $ 229,3281,008,944 973,470 1,032,503 1,013,843 939,542 995,415 865,6292,352,197 2,212,611 2,297,020 2,082,983 2,159,932 2,365,896 2,098,157
885,961 812,085 819,540 686,826 696,669 791,026 591,894921,810 857,641 904,137 783,632 796,359 893,088 686,792804,122 801,471 901,220 821,592 848,819 920,613 918,749
1.4 1.6 1.7 1.5 2.0 1.6 1.549.3% 48.5% 47.5% 46.7% 46.1% 47.2% 39.6%
$ 144,709 $ 137,041 $ 130,945 $ 131,103 $ 140,166 $ 129,825 $ 113,77476,080 78,718 76,434 72,028 64,639 58,480 53,14526.58 21.63 22.75 29.63 31.54 23.53 23.8611.5% 19.1% 21.9% 22.0% .3% 18.3% 18.7%3.7% 6.5% 7.9% 7.5% .0% 6.2% 6.1%
77A N N U A L R E P O R T

REPORT OF MANAGEMENT
The management of Sonoco Products Company is respon-sible for the integrity and objectivity of the fi nancial state-ments and other fi nancial information included in this annual report. These statements have been prepared in conformity with accounting principles generally accepted in the United States of America. Sonoco’s accounting systems are supported by internal control systems augmented by written policies, internal audits and the selection and training of qualifi ed personnel. The Board of Directors, through its Audit Committee consisting of outside directors, is responsible for reviewing and monitoring the Company’s fi nancial reporting and accounting practices. This committee meets regularly with Sonoco’s management, internal auditors and independent auditors to assure each is carrying out its responsibilities. PricewaterhouseCoopers LLP, the Company’s indepen-dent registered public accounting fi rm, have audited the Company’s consolidated fi nancial statements, and their report is included herein.
Charles J. HupferChief Financial Offi cer
Our management is responsible for establishing and main-taining adequate internal control over fi nancial reporting, as such term is defi ned in Exchange Act Rule 13a-15(f). Under the supervision and with the participation of our management, including our principal executive offi cer and principal fi nancial offi cer, we conducted an evaluation of the effectiveness of our internal control over fi nancial reporting based on the framework in Internal Control – Integrated Framework issued by the Committee of Sponsoring Organizations of the Treadway Commission. Based on our evaluation under the framework in Internal Control – Integrated Framework, our management con-cluded that our internal control over fi nancial reporting was effective as of December 31, 2005. PricewaterhouseCoopers LLP, our independent registered public accounting fi rm, has audited our management’s assessment of the effectiveness of our internal control over fi nancial reporting as of December 31, 2005, as evidenced by their attestation report, which appears on page 79 of this report.
Harris E. DeLoach Jr.Chief Executive Offi cer
Charles J. HupferChief Financial Offi cer
Barry L. SaundersChief Accounting Offi cer
MANAGEMENT’S REPORT ON INTERNAL CONTROL
OVER F INANCIAL REPORT ING
CERT IF ICAT IONS
The Certifi cation of the Company’s chief executive offi cer required to be submitted to the New York Stock Exchange pursuant to Section 303A.12(a) of the listing standards for the year ended 2004 has been submitted to the New York Stock Exchange.
The Certifi cations of the Company’s principal executive offi cer and principal fi nancial offi cer required by Section 302 of the Sarbanes-Oxley Act of 2002 and 17 C.F.R. 13a-14(a) have been fi led as Exhibit 31 to the Company’s Annual Report on Form 10-K for the year ended December 31, 2005, which report has been fi led with the Securities and Exchange Commission.
78 S O N O C O 2 0 0 5

REPORT OF INDEPENDENT REGISTERED PUBL IC ACCOUNT ING F IR M
TO THE SHAREHOLDERS AND DIRECTORS OF SONOCO PRODUCTS COMPANY:
We have completed integrated audits of Sonoco Products Company’s 2005 and 2004 consolidated fi nancial state-ments and of its internal control over fi nancial reporting as of December 31, 2005, and an audit of its 2003 consoli-dated fi nancial statements in accordance with the stan-dards of the Public Company Accounting Oversight Board (United States). Our opinions on Sonoco Products Company’s 2005, 2004 and 2003 consolidated fi nancial statements and on its internal control over fi nancial report-ing as of December 31, 2005, based on our audits, are pre-sented below.
Consolidated fi nancial statements In our opinion, the consolidated fi nancial statements appearing on pages 49 through 75 of this report present fairly, in all material respects, the fi nancial position of Sonoco Products Company and its subsidiaries at December 31, 2005 and 2004, and the results of their oper-ations and their cash fl ows for each of the three years in the period ended December 31, 2005, in conformity with accounting principles generally accepted in the United States of America. These fi nancial statements are the responsibility of the Company’s management. Our respon-sibility is to express an opinion on these fi nancial state-ments based on our audits. We conducted our audits of these statements in accordance with the standards of the Public Company Accounting Oversight Board (United States). Those standards require that we plan and perform the audit to obtain reasonable assurance about whether the fi nancial statements are free of material misstatement. An audit of fi nancial statements includes examining, on a test basis, evidence supporting the amounts and disclosures in the fi nancial statements, assessing the accounting princi-ples used and signifi cant estimates made by management, and evaluating the overall fi nancial statement presentation. We believe that our audits provide a reasonable basis for our opinion.
Internal control over fi nancial reportingAlso, in our opinion, management’s assessment, included in Management’s Report on Internal Control Over Financial Reporting appearing on page 78 of this report, that the Company maintained effective internal control over fi nan-cial reporting as of December 31, 2005, based on criteria established in Internal Control – Integrated Framework issued by the Committee of Sponsoring Organizations of the Treadway Commission (COSO), is fairly stated, in all material respects, based on those criteria. Furthermore, in our opinion, the Company maintained, in all material respects, effective internal control over fi nancial reporting as of December 31, 2005, based on criteria established in Internal Control – Integrated Framework issued by the
COSO. The Company’s management is responsible for maintaining effective internal control over fi nancial report-ing and for its assessment of the effectiveness of internal control over fi nancial reporting. Our responsibility is to express opinions on management’s assessment and on the effectiveness of the Company’s internal control over fi nan-cial reporting based on our audit. We conducted our audit of internal control over fi nancial reporting in accordance with the standards of the Public Company Accounting Oversight Board (United States). Those standards require that we plan and perform the audit to obtain reasonable assurance about whether effective internal control over fi nancial reporting was maintained in all material respects. An audit of internal control over fi nancial reporting includes obtaining an understanding of internal control over fi nancial reporting, evaluating management’s assess-ment, testing and evaluating the design and operating effectiveness of internal control, and performing such other procedures as we consider necessary in the circumstances. We believe that our audit provides a reasonable basis for our opinions.
A company’s internal control over fi nancial reporting is a process designed to provide reasonable assurance regard-ing the reliability of fi nancial reporting and the preparation of fi nancial statements for external purposes in accordance with generally accepted accounting principles. A company’s internal control over fi nancial reporting includes those poli-cies and procedures that (i) pertain to the maintenance of records that, in reasonable detail, accurately and fairly refl ect the transactions and dispositions of the assets of the company; (ii) provide reasonable assurance that transac-tions are recorded as necessary to permit preparation of fi nancial statements in accordance with generally accepted accounting principles, and that receipts and expenditures of the company are being made only in accordance with authorizations of management and directors of the com-pany; and (iii) provide reasonable assurance regarding pre-vention or timely detection of unauthorized acquisition, use, or disposition of the company’s assets that could have a material effect on the fi nancial statements.
Because of its inherent limitations, internal control over fi nancial reporting may not prevent or detect misstate-ments. Also, projections of any evaluation of effectiveness to future periods are subject to the risk that controls may become inadequate because of changes in conditions, or that the degree of compliance with the policies or proce-dures may deteriorate.
Charlotte, North CarolinaFebruary 27, 2006
79A N N U A L R E P O R T
GLOSSARY OF TER MS
BLOW MOLDING Extruded molten plastic is captured in molds that defi ne the shape of the fi nal part design. Air at pre-determined pressures is added forcing the plastic to take on the shape of the mold. After cooling, the mold is opened and the fi nal plastic part, component or product is removed for trimming and packaging.
COMPOSITE CAN/PAPERBOARD CAN The composite or paperboard package is a container comprised of a body with two ends made from a variety of materials. The package can be produced in a variety of shapes and sizes. The container body is made from paper, various liner materials to achieve barrier requirements and a printed label for package graphics.
END CLOSURE A rigid metal, foil, plastic or paper structure that is mechanically or adhesively attached to the end of a package or a laminated plas-tic fi lm, foil or paper membrane heat sealed to the end of a rigid package.
EXTRUSION A continuous process where plastic resin is melted using a screw and cylinder combina-tion along with heat and pressure, and forced through a die to obtain a resultant profi le shape.
FLEXIBLE PACKAGING Non-rigid packaging structures used to pack-age and protect various food and nonfood products in the retail and industrial business forum. Snacks and confectionery, home and personal care, beverages, pet food, etc., are a sampling of products packaged in this medium.
INJECTION MOLDING The process where plastic resin is melted and then forced into a mold containing sin-gle or multiple cavities. Once in the mold, the plastic is cooled to a shape refl ecting the cavity.
LASER SCORINGUse of a high-energy narrow light beam to partially cut through a material in a straight line or shaped patterns. This process is used to provide an easy-opening feature to vari-ous types of fl exible packaging materials.
MEMBRANE CLOSURE A fl exible material attached to the end of a rigid package with a heat seal. This mem-brane can be comprised of plastic, foil, paper or a combination of these materials.
PACKAGING SUPPLY CHAIN The steps required to create and manufac-ture the packaging, package the product, distribute the packaged product and sell it in stores, through point-of-purchase (P-O-P) displays or other means.
POINT-OF-PURCHASE (P-O-P)Displays, signs, structures and devices that are promotional and are used to identify, advertise or merchandise an outlet, service or product and serve as an aid to retail selling.
RECOVERED PAPER Paper and paper byproducts that have been separated, removed or diverted from solid waste disposal and are intended for sale, use, reuse or recycling, whether or not such paper requires subsequent separation and processing.
RETORT The thermal processing or cooking of pack-aged food or other products in a pressurized vessel for purposes of sterilizing the con-tents to maintain freshness for extended storage times.
RETORTABLE ENDMetal or fl exible closure for a rigid package that is designed to withstand the retort process.
ROTOGRAVURE PRINTING A printing process in which letters and pic-tures are transferred from an etched cylinder to a web of paper, plastic, foil or similar material on a printing press.
SERVICE CENTERS (FORMERLY REFERRED TO AS PACK CENTERS)A facility where client’s product/compo-nents/packaging/display/fulfi llment/logistics come together.
STICK PACKSA narrow fl exible packaging pouch com-monly used to package single-serve powder beverage mixes such as fruit drinks, instant coffee and tea, and sugar and creamer products.
THERMOFORMING A process by which plastic sheet material is heated to close the softening point, moved over a male or female mold and shaped by forcing the softened sheet by movement of plug, application of air pressure and or vac-uum. The shaped article is solidifi ed in the mold prior to ejection from the mold cavity. This process is commonly used to form blis-ters, trays, cups, tubs and other open con-tainers and forms.
OTHER TERMSBRITISH THERMAL UNITThe amount of energy required to raise the temperature of one pound of water one degree Fahrenheit when the water is near 39.2 degrees Fahrenheit.
DEBT TO TOTAL CAPITAL RATIO Used by the Company to access its fi nancing leverage. Calculated by dividing total debt by the summation of total equity, total debt and deferred income taxes.
EARNINGS PER SHARE (EPS) (BASIC) Calculated by dividing the reported earnings available to common stockholders (net income) by the weighted average number of shares outstanding.
EARNINGS PER SHARE (EPS) (DILUTED) Calculated by dividing the reported earnings available to common stockholders (net income) by the weighted average number of shares outstanding, including the assump-tion of the exercise of all potentially dilutive securities such as stock options. Diluted EPS are always less than or equal to basic EPS.
PRICE/COST RELATIONSHIP The net dollar impact to the Company, or its segments, of the year-over-year change in the selling price of its products and the pur-chase cost of the raw materials consumed in making the product.
RETURN ON NET ASSETS Tax-affected earnings before interest and taxes, plus equity in earnings of affi liates, divided by the net of average total assets, minus average cash, minus average current liabilities, plus average short-term debt.
RETURN ON TOTAL EQUITY Net income divided by average total equity.
SUSTAINABILITYMeeting the economic, social and environ-mental needs of today, without damaging the ability of future generations to provide for themselves.
80 S O N O C O 2 0 0 5

investor and gen er a l in for m at ion
i nvestor i n for m at i o n Sonoco (NYSE: SON) offers its shareholders a wide range of services and several ways to access important Company information.
sonoco on the internet Sonoco’s Internet site, www.sonoco.com, provides a variety of infor-mation about its businesses, products and markets. The site also has a robust Media Center for news releases, financial presentations, annual reports, proxy statements, various SEC filings, events, safety performance and more.
transfer agent and registrarThe Bank of New York800/524-4458 +212/815-3700 (Outside the U.S.) 888/269-5221 (Hearing impaired – TTY Phone) Address shareholder inquiries to:The Bank of New York Investor Services Department P.O. Box 11258 New York, NY 10286-1258 Email: [email protected]
The Bank of New York’s stock transfer Web site:www.stockbny.com
Send certificates for transfer and address changes to:The Bank of New York Receive and Deliver Department P.O. Box 11002 New York, NY 10286-1002Featuring:• Automated voice-response system available 24/7• Service representatives available during normal business hours• Registered shareholder account access via the Internet at www.stockbny.com.
shareholder servicesSonoco – B01 1 North Second Street Hartsville, SC 29550
electronic payment of dividends Shareholders may elect to have their dividends deposited directly to their bank accounts at www.stockbny.com or by contacting Sonoco Shareholder Services. shareholder investment program Allows participants to purchase Sonoco stock and reinvest dividends directly without contacting a broker. You do not have to be a share-holder to participate. For more information and a prospectus, go to www.sonoco.com or www.stockbny.com.
duplicate annual reports To eliminate duplicate report mailings, mark your proxy card or contact Sonoco Shareholder Services (www.stockbny.com).
sonoco publications Annual reports, current and past; annual reports on Form 10-K and the Investor News Quarterly can be found on www.sonoco.com. They are also available in paper copies without charge from:
Sonoco – A09 Corporate Communications 1 North Second Street Hartsville, SC 29550-3305
gener al i n for m at i o n addressCorporate Headquarters and Investor Relations1 North Second Street Hartsville, SC 29550-3305 Main: +843/383-7000 Investor Relations: +843/383-7862 Tollfree: 800/377-2692 Fax: +843/383-7008 Email: [email protected]
annual meeting The annual meeting of shareholders’ will be held at 11 a.m. Eastern time on Wednesday, April 19, at:
The Center Theater 212 North Fifth Street Hartsville, SC 29550-4136
A live audiocast will be available, with a replay archived for six months. Instructions for listening to this audiocast will be available at www.sonoco.com approximately one week prior to the event.
legal counsel Haynsworth Sinkler Boyd, P.A. P.O. Box 11889 Columbia, SC 29211-1889
independent registered public accounting firm PricewaterhouseCoopers LLP Hearst Tower 214 North Tryon Street, Suite 3600 Charlotte, NC 28202-2137
intellectual capital management Sonoco Development, Inc. manages the Company’s intellectual assets, including patents, licenses and agreements. Company trademarks, domain names and patents are managed by SPC Resources, Inc.The address for both companies is:
125 West Home Avenue Hartsville, SC 29550-4123
equal opportunity employer Sonoco believes that a diverse workforce is required to compete successfully in today’s global marketplace. The Company provides equal employment opportunities in its global operations without regard to race, color, age, gender, religion, national origin or physical disability.
references to web site addresses References to Sonoco’s Web site address and The Bank of New York’s Web site address are for informational purposes only and are not intended to, and do not, incorporate those Web sites or their contents by reference into this annual report.
a n n u a l r e p o r t
1 n o r t h s e c o n d s t r e e t
h a r t s v i l l e , s c 2 9 5 5 0 - 3 3 0 5 u s a
8 4 3 / 3 8 3 - 7 0 0 0
w w w . s o n o c o . c o m