pickup ions at dione and enceladus - nasa
TRANSCRIPT

NASA/TM_2002-211612
Pickup Ions at Dione and Enceladus
E. Sittlel; R.E. Johnson, S. Jurac, ,L Richardson,
M. McGrath, E Crai3; D. Young, and J.E. No_ffholt
August 2002

The NASA STI Program Office ... m Profile
Since its founding, NASA has been dedicated to
the advancement of aeronautics and spacescience. The NASA Scientific and Technical
hlf()rmation (STI) Program Office plays a key
part in helping NASA maintain this importantrole.
The NASA STI Program Office is operated by
Langley Research Center, the lead center forNASA's scientific and technical information.
The NASA STI Program Office provides access
to the NASA STI Database, the largest collection
of aeronautical and space science STI in the
world. The Program Office i s also NASA' s
institutional mechanism for disseminating the
results of its research and development activi-
ties. These results are published by NASA in the
NASA STI Report Series, which includes the
following report types:
, TECHNICAL PUBLICATION. Reports of
completed research or a major significant
phase of research that present the results of
NASA programs and include extensive data or
theoretical analysis. Includes compilations of
significant scientific and technical data and
information deemed to be of continuing
reference value. NASA's counterpart of
peer-reviewed formal professional papers but
has less stringent limitations on manuscript
length and extent of graphic presentations.
, TECHNICAl, MEMORANDUM. Scientific
and technical findings that are preliminary or
of specialized interest, e.g., quick release
reports, working papers, and bibliographiesthat contain minimal annotation. Does not
contain extensive analysis.
, CONTRACTOR REPORT. Scientific and
technical findings by NASA-sponsored
contractors and grantees.
CONFERENCE PUBLICATION. Collected
papers from scientific and technical
conferences, symposia, seminars, or other
meetings sponsored or cosponsored by NASA.
SPECIAL PUBLICATION. Scientific, techni-
cal, or historical information from NASA
programs, projects, and mission, often con-
cemed with subjects having substantial publicinterest.
TECHNICAL TRANSLATION.
English-I angu age translations of foreign scien-
tific and technical material pertinent to NASA'smission.
Specialized services that complement the STI
Program Office's diverse offerings include creat-
ing custom thesauri, building customized data-
bases, organizing and publishing research results...
even providing videos.
For more information about the NASA STI Program
Office, see the following:
, Access the NASA STI Program Home Page at
http://ww w.sti.nasa.gov/STI-homepage.html
o E-mail your question via the Internet to
help@ sti.nasa.gov
* Fax your question to the NASA Access Help
Desk at (301) 621-0134
, Telephone the NASA Access Help Desk at
(301) 621-0390
Write to:
NASA Access Help Desk
NASA Center for AeroSpace Information7121 Standard Drive
Hanover, MD 21076---.1320

NASA/TM_2002-211612
Pickup Ions at Dione and Enceladus
E. Sittler
Goddard Space Flight Centez Greenbelt, MD
R.E. Johnson
University of Virginia, Charlottsville, VA
S. Jur_lc, J. Richardson
Massachusetts Institute of Technology, Cambridge, MA
M, McGrath
Space Telescope Institute, Baltimore, MD
E Cra_, D. _bungUniversi_ of Michigan, Ann Arbor, M1
,liE. Nordholt
los Alamos National Laboratory, NM
National Aeronautics and
Space Administration
Goddard Space Flight CenterGreenbelt, Maryland 20771
August 2002

NASA Center for AeroSpace Inlk_rmation7121 Standard Drive
Hanover, MD 21076-1320
Price Code: A17
Available from:
National Technical In[i)rmation Service
5285 Port Royal Road
Springfield, VA 22161Price Code: A10

Pickup ions at Dione and Enceladus
by Ed Sittler 1, R. E. Johnson :_,S. Jurac _, J. Richardson 3,
M. McGrafl_: I , IF. Crary 5, I). Young 5 and J.E. Nordholt 6
1NASA/Goddard Space Flight Center
2University of Virginia, Charlottsville, VA
3Massachusetts Institute of Technology, Cambridge, MA
4Space Telescope Science Institute, Baltimore, MD
5University of Michigml, Ann Arbor, MI
6Los Alamos National Laboratory, NM
Abstract
Voyager images of the icy satellites of Saturn, Dione and Enceladus, suggest they have been geologically
active and are not only composed of ice. Recent observations by HST have shown the presence of ozone
at both Dione and Rhea which also implies the presence of molecular oxygen at these bodies. The Cassini
Plasma Spectrometer (CAPS) will provide the capability to determine the global composition of these
bodies by measuring tile pickup ions produced by the ionization of their sputter produced atmospheres.
We will present a model of these atmospheres and associated pickup ions and demonstrate CAPS ability
to distinguish the freshly produced picked up ions from the ambient plasma. Such ions are expected to
form a ring distribution that will have a uniquely different energy-angle dependence than the ambient
plasma ions. In the case of Dione we expect the potential for a moderate strength interaction for which
both Voyager 1 and Pioneer 11 spacecraft measured ion cyclotron waves centered on the Dione L shell
and near the equatorial plane. Since Enceladus may be the source of the E-ring, some surprises may be
encountered during its close encounter with the Cassini spacecraft. In the case of Dione we will show that
a wake pass at 500 km altitude is more than an order of magnitude better than an upstream pass at 500
km altitude. Pickup ion detection for minor ion species such as NH_ + is possible for 500 km altitude wake
pass but not for " 500 km altitude upstream pass at closest approach. For navigation reasons a 100 km
pass is not allowed and therefore it is essential to have a wake pass to maximize the science return for a
targeted flyby with Dione. The CAPS observations when combined with magnetometer, plasma wave and
energetic particle obserw_tions will allow us to estimate tile source of ions into Saturn's magnetosphere
due to these two bodies and to characterize the nature of the interaction with Saturn's magnetosphere.

Contents
1. Introduction ...................................................................................................................... 1
2. CAPS Instrument Description and Capabilities with Respect to Targeted
Icy Satellite Encounters .................................................................................................... 4
3. Model of Sputtered Atmospheres for Dione and Enceladus ............................................ 5
4. Estimates of Pickup Ion Densities as a function of Height for Dione andEnceladus ........................................................................................................................ 7
4.1 Wake Pass ................................................................................................................ 7
4,2 Upstream Passes ................................................................................................... 15
5, Ring Distribution Simulations ......................................................................................... 20
6. Simulated E/Q Versus TOF Spectrograms ..................................................................... 25
7. Summary and Conclusion .............................................................................................. 37
8. References ..................................................................................................................... 39
111

1. introduction
In Ihis paper we will be primarily concerned
with the interaction of Saturn's magnetosphere
with its icy satellites Dione and Enceladus. In
the future we plan to also look at the other icy
satellites Mimas, Tethys and Rhea; in the case of
Rhea finite gyro-radii effects will be important.
The icy satellite interaction with Saturn's mag-
netosphere can provide very important informa-
tion about the bulk properties and surface
properties of these bodies by detecting the
pickup ions produced by the ionization of their
sputtered neutral atmosphere (see Johnson and
Sittler, 1990). The icy satellites are believed to
be composed primarily of ice with trace
amounts of O 2, 03 and other possible frozen
volatiles such as CH4, NH s, CO 2 , and possible
dark components such as C and S (see Morrison
et al., 1984).
At present, most of our knowledge of the Satur-
nian system can be traced to the pioneering
observations of Saturn's plasma population,
energetic particle population, magnetic fields,
plasma waves and remote sensing observations
from the Pioneer 11 and Voyager 1 and 2 en-
counters. The papers by Frank et al. (1980),
Lazarus and McNuU (1983), Sittler et al. (1983),
and Richardson (1986) summarize the first
observations of Saturn's plasma environment.
The energetic particle populations of Saturn's
magnetosphere were smnmarized in papers by
Fillius and McIlwain (1980), Van Allen (1980),
Fillius et al. (1980), Vogt et al. (1982), Krimigis
and Armstrong (1982), Schardt and McDonald
(1983), Krimigis et al. (1983), and Van Allen
(1984). More recently, Maurice et al. (1996),
Paranicus et al (1997) and Jurac et al. (2001)
have reanalyzed the Voyager plasma and ener-
getic particle data to put it in a more synergistic
form. Richardson and Sittler (1990) combined
tile Voyager ion and electron plasma observa-
tions to construct an empirical model of Saturn's
plasma environment inside of about 15 R s. Inconcert Johnson et al. (1989) constructed from
all these observations a model of a neutral cloud
toms that surrounds Saturn and is primarily due
to sputtered neutrals coming from the icy satel-
lites of Saturn. RichmTdson et al. (1986) made
the first attempt at combining all these various
data sets to construct a semi-empirical model of
Saturn's plasma and neutral enviromnent includ-
ing various collisional and ionization processesand radial diffusion which enlk-_rced constraints
on the plasma source strength and the rate ofradial diffusion.
This work was followed by the discovery by
using HST of a relalively large toroidal cloud of
OH that was surrounding Saturn with densities
as high as 500 cm -s near the L shell of Enceladus
(Shelnansky et al., 1993; Hall et al. 1996; and
Richardson et al. 1998). This discovery put into
question the original work by Johnson et al.
(1989) for which it was believed that the icysatellites dominated the neutral environment
around Saturn. In order to reconcile these new
observations Richardson et al. (1998) invoked
rapid radial transport with time scales at 6 R s of
only 5 days while in tile original work by
Richardson et al. (1986) it was 700 days. Results
by Shi et al. (1995) and Jurac et al. (2001) now
show that the icy satellites and the observed
grains in the E ring each contribute less than
10% of the observed neutral population. The
detection of ozone, O s, in tile surface ice ofRhea mid Dione (Noll et al. (1997)) for which
the column densities were ~ 2x10 _ mol/cm 2
meant that column densities of O 2 could be as
high a 1019 mol/clIl 2 within the icy mantles of
these bodies. Since the temperature of these
bodies are _ 75°K to 100°K (Hmlel et al.,
1981,1982), there could exist a significant
gravitationally bound (2)2, ()s (i.e., since ozone is
unstable it might not contribute to an atmo-
sphere around these bodies) atmosphere at
Dione and Enceladus with the scale heights for
O 2 of 117 km and 227 kin, respectively. If the
O:, believed to be trapped in the icy surfaces ofthese bodies, contribute to these atmospheres
then the peak neutral densities could be as highas 8.3x10¹¹ IIlol/c[n 3 for Dione and 4.3x10 Mtool/
cm 3 for Enceladus. Therefore, a wake pass of
Dione may see large quantities of pickup Oa+
and 03 +near the limb of l)ione; while an up-

streampassat500km altitudewouldprobablynotdetectsuchanatmosphere.In thecaseofEnceladusthealmospherewouldbelessboundwithasignificantfractionof the02andOsonescapetrajectories.Wemayalsoexpectsignifi-cantamountsof CO_to bepresent,sinceCOawasdetectedattheGalileanmoons(McCordetal., 1998)andin theatmosphereof Titan(Samuelsonetal., 1983)whereCOwasalsodetected(Lutzetal., 1983).Theplannedcloseencountersby Cassiniof thesebodieswill allowusto developamoreaccuratepictureof theirrolein neutralcloudproductionand,thus,in theplasmaandenergeticpm-ticleproductionwithinSaturn'smagnetosphere.
Sincethesebodies rote deep within the magneto-
sphere of Saturn and its radiation belts, they are
expected to have, at minimum, a tenuous atmo-
sphere due to sputtering induced by energetic
particle bombardment and bombardment by the
ambient plasma. The icy satellites should also be
exposed to micrometeorite bombardment which
will produce a porous regolith on the their
surface and the emission of pai'ticulates into
Satm'n's magnetosphere (see Ip, 1997). Knowl-
edge about the composition of their atmospheres
can provide information about the surface
composition (Johnson and Siltler, 1990). In the
case of Dione the leading hemisphere is brighter
than the trailing hemisphere (Morrison et al.,
1984) which suggests darkening by plasma and
energetic particle bombardment. There is also
evidence of a global tectonic system of fractures
and faults for Dione (Morrison et al., 1984). In
the case of Enceladus fiTactured and smooth
plains dominale which indicates its surface is
relatively young _ 10' years (Morrison et al.,
1984). Enceladus is also associated with
Saturn's E ring whose brightness peaks at
Enceladus' L shell (Baum et al., 198l). The
evidence for tectonic activity for both bodies
could indicate the presence oE for example, awater-ammonia eutectic which melts at 170°K
within the interior of these bodies (Morrison et
al., 1984). The close encounters planned for
these bodies by Cassini will provide accurate
measurements of the plasma and energetic
particle populations at these bodies. This data,
when combined with the latest laboratory
measurements of the sputtering processes
(Johnson, 1990; Johnson, 1998; Baragiola et al.,
1999) can provide accurate models of their
sputtered atmospheres at the time of the encoun-
ters.
Saturn's icy satellites are different than ourmoon since their surfaces are made of ice and
energetic heavy ions will have sputtering yields
~ 50 to 1000 I--I_Omol/ion (Johnson, 1990).
Because of the large yields, trace refractory
species are expected to be carried off with the
water molecules. Although some information
about the icy satellite composition can be ac-
quired at large distances, the detected species
will be partially equilibrated and dissociated
and, therefore, the origins difficult to determine.
Furthermore, when sampling the sputtering
atmosphere, of these bodies the freshly picked up
ions will form unique ring distributions which
can be readily distinguished from the ambient
ions which obey bi-Maxwelliml distributions.
Pickup ions formed from what we call ambient
neutrals will also form ring distributions, but
they will have accumulated over periods _10
hour rotation period of Saturn and are expected
to have pitch angle scattered to shell distribu-
tions or bi-Maxwellians before being observed
(see Vasyliunas and Siscoe, 1976). The atmo-
spheres of these bodies can be sampled by their
conversion to ions (photoionization, electron
impact ionization and charge exchange) in the
form of pickup ions which can then be measured
by the ion mass spectrometer (IMS) of the
Cassini Plasma Spectrometer Experiment
(CAPS) (see Young et al., 2002 for instrument
description). The CAPS experiment will also
provide measurements of the ambient plasma,
ions and electrons, which will be important lk-_r
estimaling the charge exchange m_d electron
impact ionization rates for the pickup ions. The
Magnetospheric Imaging Instmlnent (MIMI)
(see Krimigis et al., 2002 for instmlnent descrip-
tion) will provide the hot plasma and energetic
particle observations required to estimate the
sputtering rates at the time of the targeted
2

flybys.As discussedbelowthepickupionsareexpectedto formringdistributionswhichwillhavemarkedlydifferentenergy-anglepropertiesthantheambientionswhicharetypically ap-proximatedby convectedbi-Maxwelliandistri-butions.Wenotethatthepickupionswith theiruniqueenergy-anglesignaturecanprovidethemostdirectinformationabouttheatmospherecomposition.
As discussedinJohnsonandSiltler(1990)anextensivelysputteredsurfacewill displaythefollowingproperties:1)volatilespeciesarehighlydepletedsotracespeciesmaybehardtodetectusingreflectancespectra;2) sputteringratesfor extensivelysputteredsurfacesarerelatedto bulkcompositionhenceCAPScanbemoresensitivethanreflectanceexperiment;and3)youngersurfacessuchasthatpresentatEnceladuswill havehigheryields.CAPS,whichprovidesaverysensitivemeasurementof theicysatellitesbulk atomicandmolecularcomposi-tion, iscomplementaryto the informationprovidedbytheVisibleInfraredMappingSpectrometer(VIMS) (seeBrownetal.,2000for descriptionof instrument)onCassiniwhichwill providespatialmapsof surfacecomposi-tion.TheCompositionInfraredSpectrometer(CIRS)experimentonCassini(seeKundeetal.,2002for instrumentdescription)will providetemperaturemapsof theicy satellitesurfaceswhichwill beimportantfor estimatingsputter-ing rateswhicharetemperaturedependent(seeJohnson,1990andBar-Nunetal., 1985).
HerewenotethatPioneer11andVoyager1observationsshowthattheremaybeastronginteractionbetweenDioneandSaturn'smag-netospherewhichisalsosupportedbythesimulationspresentedin thispaper.Forex-ample,Pioneer11(SmithandTsumtani,1983)andVoyager1 (Barbosa,1993)magnetometerobservationsshowedthepresenceof ion cyclo-tronwavesin thevicinity of Dione'sL shellandthefrequencyof thewavesareconsistentwiththedominantpickupion being a heavy ion such
as H20 +, OH + or O + . These waves, which are
observed to be confined close to the equatorial
plane, provide indirect evidence for the forma-
tion of pickup ions in the vicinity of Dione.
Galileo results (Russell and Huddleston, 2000;
Russell et al., 2000) show that peaks in the
magnetometer spectra give infk-)rmation about
the composition of the pickup ions being pro-
duced at a satellite body and will thus comple-ment the CAPS observations. If the interaction
is strong enough then the pickup process will
also generate an ion beam instability (Ma et al.,
1987) in the plasma. Such instabilities produce a
spectrum of electric and magnetic waves which
can be measured by the Radio and Plasma Wave
Science (RPWS) instrument on Cassini (see
Gurnett et al., 2000 for instrument description).If the satellite has a conductive interior then
there may be a magnetic signature which could
be measured by Cassini as was the case for
Galileo at Europa and and Callisto (see,
Kivelson et al., 2000; Zilnmer et al., 2000).
Since the discovery of an internal magnetic field
at the Jovian satellite Ganymede (Kivelson et
al., 1998) we cannot rule out the presence of an
internal magnetic field which would complicate
the interaction and infer the presence of a
dynamo operating in the core of the icy satellite.
Although we think this unlikely Cassini would
be able to measure the presence of such a field if
present and the flyby were close enough to the
icy satellite. Finally, we note that the satellites
me not expected to have significant conductive
ionospheres and that the atmosphere (iono-
sphere) is optically thin and will not be able to
prevent the flowing plasma from reaching the
surface of the icy satellites. The importance of
these observations during targeted flybys of
these various bodies by Cassini, emphasizes the
need for wake encounters as close as possible to
the icy satellite. This will maximize the science
return from these targeted flybys which willbecome clearer in later discussions.

2. CAPS instrument Descriptionand Capabilities with Respectto Targeted icy SatelliteEncounters
The overall capabilities of the CAPS instrumen-
tation are described in detail by Young et al.
(2002). The CAPS instrument is composed of an
Ion Mass Spectrometer (IMS), Electron Spec-
trometer (ELS) and an Ion Beam Spectrometer
(IBS). With regard to the targeted icy satellite
encounters the primary instruments are IMS andELS. Here we focus our discussion on the IMS.
Papers describing the IMS in detail can be found
in McComas and Nordholt (1990), McComas et
al. (1998) and Nordholt et al. (1998). Basically,
the IMS uses time-of-flight technology with
cylindrical geometry providing an instantaneous
2D view of the plasma over an angular range of
160 °; the angular resolution is 8.3 °x20°. The
energy resolution AE/E _ 17%. The spectrom-
eter has a medium mass resolution feature (M/
AM _ 8) called straight through, S], and a high
mass resolution feature (M/AM _ 60) using
linear electric field technique, I,EK which can
also be referred to as an isochronous (time
focusing) technique. The present estimates of
the IMS geometric factors are G _ 10-3cm2-ster -eV/eV for ST feature and G _ 10..4cnf-ster-eV/
eV for LEF feature. We will assume these values
for our simulations. CAPS also has an actualor
which Nlows the IMS to have nearly 2x cover-
age in about 3 minutes (1 °/sec scan rate). During
the targeted flybys with an equatorial pass we
recommend the collimator plane to be in the
equatorial plane of Saturn and have the actuator
dither above and below this plane to look for
pitch angle scattering of the pickup ions which
are expected to have ring distributions.
The relatively large geometric factor for CAPS
allows it to detect ambient and pickup ions with
high sensitivity. By combining ST and LEF
measurements and using the mass de-
convolution capabilities of the IMS Spectrum
Analyzer Module (SAM) (see Sittler, 1993) the
IMS will be able to resolve the water group ions
(Hz O+, OH +, and H30÷), organics such as CU4 +,
NH3+ , molecular oxygen Oz+, ozone 03 +, and
other species such as MgO +. For example, a
standard M/Q analyzer would not be able to
distinguish between O + and CU4 +, but because ofthe non-linear characteristics of the LEF
technique the CH4 + ion will breakup in the
carbon foil and the C+ ion exiting the foil will
appear near the atomic C+ ion TOF position but
shifted in TOF enough to allow it to be resolved
by the IMS. Our simulations, which are based
on calibration data, will demonstrate this effect.
With the collimator in the equatorial plane and
with an instrument energy-per-charge (E/Q)
sweep time of 4 seconds (1 eV - E/Q _ 42 keV
with logarithmically spaced 63 E/Q steps),
CAPS should be able to provide 52 kin spatial
resolution of the pickup ions. Telemetry limita-tions confine our measurements of the dominant
ambient and pickup ions to only 7 ions. But,
CAPS has the ability to alternate between 7
different ion species after each energy sweep
and thus provide the sampling up to 14 ions,
every 8 seconds. But, in addition to the ion data
(i.e., 7 to 14 ion species with full energy and
pitch angle coverage), the IMS will also provide
TOF versus E/Q spectrograms for both ST and
LEF data (i.e., data summed over 64 E/Q
sweeps and collapsed in angle for high sensitiv-
ity so no angular inlk-_rmation is available in this
data set). This data set will allow us to detect
both major and minor ions with very high
sensitivity. The time resolution of this data set is
about 4 minutes or an equivalent spatial resolu-
tion of about 3,000 kin, which is much larger
than the dimensions of either Dione and
Enceladus. Therefore, this data set provides no
spatial information. We will present simulations
of both data products in the form of 2D energy-
angle contours of ion count rate for dominant
ion species and some minor ion species and 2D
E/Q versus TOF contours of ion counts for all
ion species used in our model calculations. The
ion count rote data is referred to as A cycle dala,
while the E/Q versus TOF data is referred to as
B cycle data. An A cycle data product is com-
posed of 8 E/Q sweeps and for the highest data
4

ratetherewill be8AcyclesperB cycle.EachAcycleis 32secondslong,whileaB cycleis4minuteslong.
3. Model of SputteredAtmospheres for Dione andEnceladus
In order to construct a model of Ihe sputtered
atmospheres for either Dione or Enceladus one
needs the total sputtering source rate and the
energy spectrum of the sputtered neutrals. For
simplicity we assume spherical symmetry, but
before the actual targeted flybys we will con-
sider models which include asymmetries due to
ion Mach numben ion and electron pressure
anisotropies and spatial in-homogeneities of the
satellite surfaces. The latter can be temperature
maps, surface properties that the imagers might
detect and possible compositional spatial varia-
tions that VIMS might detect. A Monte Carlo
calculation of the spultered atmosphere includ-
ing asymmetries caused by Saturn's gravita-
tional field should also be carried out. However,
to obtain preliminary estimates of the molecular
species to be detected by CAPS we will use a
simple spherically symmetric formula given in
Johnson (1990) (see also Watson, 1982 and
Sieveka, 1983). For this cNculation we could
use the energy spectrum for the sputtered
neutrals assuming planar binding (i.e., f(E,cosO)
= 4UEcos0/(E+U) 3) and spherical binding (i.e.,
f(E,cos0) = 2UcosO/(E+U)2), for which we refer
to Johnson (1990). For our calculations we will
use the formula assuming spherical binding
where U is a parameter related to the mean
energy of the sputtered neutrals. U is Nso
referred to as the chemical binding energy of the
particles in the salellite surface and at present is
not known with high accuracy.
For our source term S we will use the maxinmln
spultered flux estimated in Jurac et al. (2001) forboth l)ione and Enceladus. In their calculations
they included the enhancements due to finite
gyro-radius effects (i.e., effective satellite area)
and angular enhancement caused by the secq)
dependence of the sputtered flux where q) is the
angle of incidence of the impacting ion relaive
to the normal of the satellites surface. Jurac et
al. (2001) also included the photo sputter flux
term. Therefore, the sputter satellite source rates
are SD = 9.6x1025 mol/s and S_ = 2.1x1025 mol/s
for Dione and Enceladus, respectively.
Our sputtered atmospheric model assumes,
(Jurac et al. (2001)), that the incident ion flux is
dominated by heavies (i.e., O +) and that the
dominant sputtered neutral is water molecules.
We will include additional species in our model
atmosphere: H 2, O 2, CO 2 and NH 3 at the 10%
level relative to the sputtered flux for water. H 2
and O 2 are direct sputter products due to ener-
getic ion bombardment of ice (Johnson, 1990).
CO 2 has been seen by the Galileo spacecraft to
be an atmospheric constituent at Callisto
(Carlson, 1999) and NH 3 has been suggested asa volatile in the Saturnian satellites because of
Titan (Stevenson, 1982). Since the ejection of
trace species is telnperature dependent (Johnson,
1990; Brown et al. (1982)) mid depends on the
satellite composition the choice of 10% is for
convenience. For example, abundance of the
minor species such as CH 4 and NH:_ could belower at the few % level. These results can then
be scaled based on more detailed knowledge or
new observations. However, the results givenhere should allow the reader to determine the
ability of CAPS to detect the minor species for
either of the targeted flybys. We could also have
included CU 4 but since the surfaces are oxidiz-
ing we felt that having CO 2 was more appropri-ate.
In Figures l and 2 we show the result of our
model calculations for Dione and Enceladus,
respectivel> which shows neutral density
plotted as a function of height relative to thesm'face. In these calculations we used U = 0.055
eV R}r H20, CO e and NH3, while for H a and O ewe use U = 0.01 eV. For both bodies the maxi-
mum water molecule density is about 105 tool/cm 3 at their surfaces. In the case of Dione the
next most important neutral near the surface is
O_, while far from Dione, in order of impor-
tance, we have CO 2, NH 3, and H e. In the case of

Eo
x,.-6E
cID
tY3
Z
104
103
1O2
101
O 1000 2000 3000 4000 5000 6000
Height (km)
Figure I. Computed neulral densities of Dione's sputtered atmosphere as a function of height. Assumed
species are H_O, H 2, 02, COe and NH 3. The latter four species are minor and assumed to be 10% of water.
EO
8E
v
gl
CI
Z
Encelodus Neutrol Density10 '_ .... m .... i .... i .... i ....
H20 = _ _
H 2 = ...........
02 =: ......
CO 2 = -----, .
105 NH 3 ....
10 4
", , '%
103 ".')). "-. -...-.
..... -"- --"---L F_7102 ..... > - __ _..... --- ....... -'L:
101 , • . . l . , • , 1 • , • , 1 . . . • 1 • , , •
0 500 1000 1500 2000 2500
Height (kin)
Figure 2. Computed neutral densities of Enceladus' sputtered atmosphere as a function of height.
Assumed species are H20, tt 2, O 2, CO 2 and NIt 3. The latter four species are minor and assumed to be(rl _110 J,__f water.
6

Enceladus, 02 dominates relative to all the other
minor species for all heights. For the remaining
minor species in order of importance, we have
CO2, NH 3 and H u To some degree tt_e variationof the neutral atmospheric density with height
can be traced to the assumed energy spectrum of
the sputtered neutrals and the parameter U. With
4 second time resolution, CAPS should be able
to measure the height variation of the neutrals
from the pickup ion measurements which willthen allow us to estimate U for the different
neutral species. Deviations from spherical
symmetry are expected lk_r radial distances
Hill Lagrange Sphere which has radius 5.7 RD_on_
(i.e, 3,192 kin) for Dione and 3.4 REno_l_du_(i.e,
850 km for Enceladus). For this paper, we will
ignore these con'ections but when we do the fullMonte Carlo calculations we will include the
effects of Saturn's gravity field,
4. Estimates of Pickup ionDensities as a function of
Height for Dione and Enceladus
4.1 Wake Pass
In Figure 3 we show an assumed targeted l]yby
geometry where the spacecrafl passes through
the satellite's co-rotational wake al an unspeci-
fied height H = (c_-ro) at closest approach. Thereduction of this distance will enhance CAPS
ability to detect the pickup ions since they will
have less time to pitch angle scatter and spread
out in phase space (Wu and l)avidson, 1972;
Hartle and Wu, 1973). Pitch angle scattering
will tend to transform a ring distribution into a
shell distribution (Vasyliunas and Siscoe, 1976)
which will spread the ions in velocity space and
make the measured fluxes lower at a particular
energy. Also, pitch angle scattering will tend to
make the ions move along the magnetic field
line and thus dilute the pickup ion flux in coor-
dinate space. The net effect is to reduce our
ability to measure the pickup ions. An optimal
height liar a wake pass is 500 km since it is
optimal for the Cassini remote sensing instru-
ments because of the spacecrafls ability to lurn
in order to remove smearing effects and close
enough to measure ring distributions by CAPS.
The figure also shows a fluid element as it
passes through the satellites atmosphere to the
observation point where the spacecraft is lo-
cated. As the fluid element moves through the
atmosphere it will collect pickup ions as the
neutral atmosphere is ionized by charge ex-
change reactions (Table 1), electron impact
ionization reactions (Table 2) and photo-ioniza-
tion reactions (Table 3). In order to compute the
pickup ion densities correctly we will also need
estimates of the ambient densities and tempera-
tures of the ions and electrons in the vicinity of
Dione and Enceladus which are given in Table
4. Table 4 also gives the ambient densities of the
various neutral components at Dione andEnceladus. AH the numbers in 31)ble 4 were
derived from the papers by Richardson et al.
(1986) and Richardson et al. (1998). Since our
model calculations use a fluid approxilnation we
are ignoring the finite gyro-radius effects of the
pickup ions. In the case of Dione the gyro-radius_) +lcr tt20 is about 123 kin. which is small rela-
tive to a Dione radius (560 kin) and at
Enceladus the gyro-radius for H,20 + is about 20km which is much less than the radius of
Enceladus (250 kin). So, to a good approxima-
tion the fluid approximation should be accurate.Deviations from this will occur on the side
facing Saturn where the pickup ions can gyrate
into the bodies surface for heights less than the
ion gyro-radius. So, lk_r heights near the satel-
lites surface we would expect to see an asymlne-
try in the observed pickup ion densities. From
Richardson (1986) the observed plasma velocityat Dione is about 46 km/s and at Enceladus is 33
km/s. The magnetic field strength at Dione is
about 70 nT while that at Enceladus is 312 nT
(see Connerney et al., 1983).
7

ICY SATELLITE FLYBY GEOMETRY
()
V
Observation point
Figure 3. Shows encounter geometry and how we compute pickup ion densities as a fluid element passes through the
satelliles sputtered atmosphere and picks up ions as the neutrals are ionized due to photo-ionization, electron impact
ionization and charge exchange reactions.

Table 1. Charge Exchange Rates
Rates, cm3/s
Reaction Enceladus Dione Reference
H + + H --) H + H + 1.5E-8 1.5E-8
O + + H --) O + H + 6.2E-9 6.3E-9
O ÷ + OH --) 02 + H ÷ 1.2E- 10 1.2E- 10
H + + H2 "-) H + H2+ 1.7E-10 1.7E-10
H2+ + H2 "-) H2 + H2+ 6.6E-9 6.6E-9
H + + H20 "-_ H + H20 + 5.0E-8 5.0E-8
H + + H20 -') H + H20 + 8.2e-9 8.2e-9
O + + H20 --) O + H20 + 2.3E-9 2.3E-9
OH + + H20 --) OH + H20 ÷ 1.6E-9 1.6E-9
OH + + H2 "-) H + H20 + 1.1E-9 1.1E-9
H2+ ÷ H20 "-) H2 ÷ H20 + 3.9E-9 3.9E-9
OH + + OH --) H20 + ÷ O 7.0e-10 7.0e-10
H2 + ÷ OH --) H20 + ÷ H 7.6e-10 7.6e-10H + + O --) H + O + 5.5E-9 5.5E-9
O + + O --) O + O + 9.9E-9 9.9E-9
O2+ + O2 --) O2 + O2+ 6.4E-9 6.4E-9
H2+ ÷ 02 "-_ H2 ÷ 02 + 9.4E-9 9.4E-9
O + + O2 -') O + O2+ 2.1E-9 2.1E-9
OH + + O2 -') OH + O2+ 2.0E-10 2.0E-10
H20 + ÷ 02 "-_ H20 ÷ 02 + 5.0E-9 5.0E-9
H + + O2 -') H + O2+ 1.17E-9 1.17E-9
O + + CO2 --) CO + O2+ 1.1E-9 1.1E-9H + + OH --) H + OH + 3.0E-10 3.0E-10
H + + OH --) H + OH + 2.1 e-9 2.1 e-9
H2+ ÷ O "-) H + OH + 1.0E-9 1.0E-9
O + ÷ H2 "-) H + OH + 1.6E-9 1.6E-9
H2 + ÷ OH --) OH + + H2 7.6e-10 7.6e-10O + + OH --) O + OH + 3.0E-10 3.0E-10
O + + OH --) O + OH + 3.6e-10 3.6e-10
O + + NH3 --) NH2 + OH + 2.2E-9 2.2E-9
O + + C02 --_ O + C02 + 1.1E-10 1.1E-10
H + + CO2 --) H + CO2 + 1.1E-9 1.1E-9
H + + NH3 --) H + NH3 + 5.2E-9 5.2E-9
H2 + + NH3 --) H2 + NH3 + 5.7E-9 5.7E-9
OH + + NH3 --) OH + NH3 + 1.2E-9 1.2E-9
H20 + ÷ NH3 --) H20 ÷ NH3 + 2.2E-9 2.2E-9
H2+ ÷ H20 "-) H2 ÷ H30 + 3.4E-9 3.4E-9
OH + ÷ H20 "-) O ÷ H30 + 1.3E-9 1.3E-9
H20 + ÷ H2 "-) H + H30 + 6.1E-10 6.1E-10
H20 + ÷ H20 "-) OH ÷ H30 + 2.1E-9 2.1E-9
Neuman et al. [1982]
Stebbings and Rutherford [1968]
Giguere and Huebner [1978]
Tawara [1978]
Massay and Gilbody [1974]
Tawara [1978]
Ip [1997]
Albritton [1978]
Huntress [1977], Kim et al. [ 1974]
Huntress [1977]
Huntress [1977]
Ip [1997]
Ip [1997]
Stebbings et al. [1964]
Stebbings et al. [1964]
Banks' and Kockarts [1973]
Tawara [1978]
Albritton et al. [1977]
Bormer et al. [1972]
Fehsenfeld et al. [1967]
Rudd et al. [1985]
Giguere and Heubner [1978]
Giguere and Heubner [1978]
Ip [1997]
Giguere and Heubner [1978]
Huntress [1977], Kim et al. [ 1974]
Ip [1997]
Giguere and Heubner [1978]
Ip [1997]
Huntress [1977], Oppenheimer [1975]*
Rudd et al. [1985]*
Rudd et al. [1985]
Huntress [1977]
Huntress [1977]
Huntress [1977]
Huntress [1977]
Huntress [1977]
Huntress [1977]
Huntress [1977], Kim et al. [ 1974]
Huntress [1977]
*Estimated

Table 2. Electron impact ionization Rates
Rates, cm3/s
Reaction Enceladus Dione References
H + e --) H + + 2e 1.3E-10 2.45E-9
H + e* --) H + + 2e 3.1E-8 3.1E-8
H2 + e --) H + + H + 2e 7.3E-14 3.3E-11
H2 + e* --) H + + H + 2e 1.01E-8 1.92E-8
H20 + e --) H + + OH + 2e 1.66E-12 7.4E-11
H20 + e* --) H + + OH + 2e 4.06E-8 4.35E-8
NH3 + e --) H + + NH2 + 2e 2.58E-14 1.79E-12
NH3 + e* --) H ÷ + NH2 + 2e 5.28E-10 5.44E-10
H2 + e --) H2+ + 2e 2.26E-10 2.2E-9
H2 + e* --) H2 + + 2e 5.5E-8 5.5E-8
NH3 + e --) NH + H2+ + 2e 1.35E-13 1.86E-12
NH3 + e* --) NH + H2+ + 2e 9.51E-11 9.63E-11
H20 + e --) H20 + + 2e 8.6E-11 8.88E-10
H20 + e* --) H20 + + 2e 9.32E-8 9.3E-8
O + e --) O + + 2e 2.01E-10 2.0E-9
O + e* --) O + + 2e 8.2E-8 8.2E-8
H20 + e --) O + + OH + 2e 1.26E-13 9.72E-12
H20 + e* --) O + + OH + 2e 1.06E-8 1.16E-8
CO2 + e --) O + + CO + 2e 2.17E-12 7.4E-11
CO2 + e* --) O + + CO + 2e 1.22E-8 1.45E-8
02 + e --) 02 + + 2e 2.1E-10 1.98E-9
02 + e* --) 02 + + 2e 1.5E-7 1.72E-7OH + e --) OH + + 2e 3.7E-10 3.16E-9
H20 + e --) OH + + 2e 1.7E-11 3.7E-10
H20 + e* --) OH + + 2e 4.61E-8 4.6E-8
CO2 + e --) CO2 + + 2e 1.73E-10 2.36E-9
CO2 + e* --) CO2 + + 2e 1.63E-7 1.9E-7
CO2 + e --) CO + + 2e 4.45E-12 7.05E-11
CO2 + e* --) CO + + 2e 6.04E-9 6.99E-9
CO2 + e --) C + + 02 + 2e 9.5E-14 5.92E-12
CO2 + e* --) C + + 02 + 2e 3.33E-9 3.86E-9
NH3 + e --) NH3 ÷ + 2e 2.66E-10 2.03E-9
NH3 + e* --) NH3 ÷ + 2e 5.23E-8 5.26E-8
NH3 + e --) NH2 + + H + 2e 3.85E-11 6.6E-10
NH3 + e* --) NH2 + + H + 2e 4.2E-8 4.32E-8
NH3 + e --) NH + + H2 + 2e 1.71E-13 9.21E-12
NH3 + e* --) NH + + H2 + 2e 1.49E-9 1.52E-9
NH3 + e --) N + + H2 + H +2e 1.33E-14 1.26E-12
NH3 + e* --) N ÷ + H2+H+2e 5.44E-10 5.67E-10
Lotz [1967]
Lotz [1967]
Ip [1997]
Ip [1997]
Orient and Srivastava [1987]
Orient and Srivastava [1987]
Mark et al. [1977]
Mark et al. [1977]
Kieffer [1969]
Kieffer [1969]
Mark et al. [1977]
Mark et al. [1977]
Orient and Srivastava [1987]
Orient and Srivastava [1987]
Lotz [1967]
Lotz [1967]
Orient and Srivastava [1987]
Orient and Srivastava [1987]
Orient and Srivastava [1987]
Orient and Srivastava [1987]
Banks and Kockarts [1973]
Banks and Kockarts [1973]
Richardson et al. [1986]
Orient and Srivastava [1987]
Orient and Srivastava [1987]
Orient and Srivastava [1987]
Orient and Srivastava [1987]
Orient and Srivastava [1987]
Orient and Srivastava [1987]
Orient and Srivastava [1987]
Orient and Srivastava [1987]
Mark et al. [1977]
Mark et al. [1977]
Mark et al. [1977]
Mark et al. [1977]
Mark et al. [1977]
Mark et al. [1977]
Mark et al. [1977]
Mark et al. [1977]
* Hot Electron Component
10

Table 3. Photoionization Rates
-1Rates, s
Reaction Enceladus-Dione References
H + hv --) H+ + e
H2 +hv --) H++H+ e
H20 + hv --) H + + OH + e
NH3 + hv --) H + + NH2 + e
H2 + hv --) H2+ + e
H20 + hv --) H20 + + e
O + hv --) O+ + e
H20 + hv --) O + + H2 + e
02 +hv --) O++ O+ e
CO2 + hv --) O + + CO + e
02 -- hv --) O +2 +e
OH + hv --) OH + + e
CO2 + hv --) CO2 + + e
CO2 -- hv
CO2 -- hv
NH3 + hv
NH3 + hv
NH3 + hv
NH3 + hv
--) CO++ O + e
"-_ C + -- 02 -- e
"-) NH3 + + e
"-) NH2 + + H + e
--) NH + + H2 + e
--)N++Hz+H+e
8.0E- 10 Huebner
1.0E- 10 Huebner
1.4E- 10 Huebner
3.7E- 11 Huebner
5.9E- 10 Huebner
3.7E-9 Huebner
2.3E-9 Huebner
6.4E- 11 Huebner
5.8E- 10 Huebner
2.8E- 10 Huebner
5.6E-9 Huebner
3.7E-9 Huebner
2.6E-9 Huebner
1.68E- 10 Huebner
1.2E- 10 Huebner
6.8E-9 Huebner
1.96E-9 Huebner
7.66E- 11 Huebner
3.6E- 11 Huebner
and Giguere [1980]
and Giguere [1980]
and Giguere [1980]
et al. [1992]
and Giguere [1980]
and Giguere [1980]
and Giguere [1980]
and Giguere [1980]
and Giguere [1980]
et al. [1992]
and Giguere [1980]
and Giguere [1980]
et al. [1992]
et al. [1992]
et al. [1992]
et al. [1992]
et al. [1992]
et al. [1992]
et al. [1992]
11

Table 4.Enceladus Torus
Steady State Densities (cm -3)
Nce Nhe H
100.0 0.2 50
H + H2 + O O + OH OH + H20 H20 +
25 0.265* 100 50 500 10 100 15
Steady State Ion Electron Temperatures (eV)
02 02 +
0.0 0.03*
Tce The T(H +)
3.0 100 11
T(H2+) * T(O ÷) T(OH+) ** T(H20+) ** T(O2+) **
22 80 85 90 160
Dione Toms
Steady State Densities (cm -3)
Nce Nhe H
25.4 0.4 80
H + H2+ O O + OH OH + H20 H20 + 02 02 +
4.6 0.81" 180 11.8 250 4.45 30 3.6 0.0 0.15"
Steady State Ion Electron Temperatures (eV)
Tce The T(H +)
5.5 145 16.5
T(H2+) * T(O ÷) T(OH+) ** T(H20+) ** T(O2+) **
33 105 111 118 210
* Richardson et al. (1986)
** Assume temperature proportional to ion mass.
12

Theresultsof ourpickupion densitiesasafunctionof heightfor awakepassis showninFigures4 aand4b for DioneandFigure5aand5bfor Enceladus.Wearbitrarilysettheclosestapproachdistanceequalto thesatelliteradius(i.e.,560kmfor Dioneand250kin forEnceladus).Referringto Figure4afor DionetheH20+densitiesreachpeakvaluesof about1.0ions/cm_nearthesurface.H=+hasthelowestdensity,whileH+andO2+havepeakdensitiesofabout0.06ions/cm3and0.08ions/cm3,respec-tively.PickupO+is relativelylow in abundancerelativeto ambientdensitiesandwill probablybedifficult to detectsincethedominantambiention isexpectedtobeO+.Therelativelyflatprofilefor O+atall heightsexceptnearthesurfaceindicatesweareprimarilyseeingpickupionsproducedbyambientneutraloxygen.Figure4bshowspickupion densitiesatDionefor OH+,CO2+,Nt-[3+,H30+andNH=+.Within560km in heightall ionsshouldbedetectable.OH-'dominatesrelativeto theotherionsin thisfigureandsurprisingly,H3 O+ is relatively abun-
dant. Near Dione's surface the total pickup ion
density is about 1.4 ions/cm 3 which is about
5.6% the ambient density and we may expect tosee a modest interaction at Dione. Here we note
that because of the detection of ozone, Q, at
Dione (Noll et al., 1997) we may see significant
fluxes of pickup O2+and O:_+within a fewhundred kms above Dione's surface and there-
fore a strong interaction similar to that observed
by Voyager 1 at Titan (Neubauer et al., 1984).
In the case of Enceladus H=O + clearly domi-
nates over all other ions with peak densities nearthe surface of 2.2 ions/cm 3. The next most
important ion is O2+-with peak densities near0.15 ions/cm 3 at the surface. The other ions H +,
O + and He+ are of low abundance and will only
be detectable close to the bodies surface. Again,
because of the high abundance of ambient H +
and O + , pickup H + and O + will be undetectable.
In Figure 5b the ions H30+, OH +, CO2+ and N}-[3+
should all be detectable. The ion NH2+ may bedetectable close to Enceladus' surface. Here we
are using as a rule of thumb R_r CAPS ability ofdetection of 0.001 ions/cm 3 for ST data and 0.01
ions/cm 3 for LEF data. This will become more
apparent when we show our ring distribution
simulations.
Figures 4 and 5 also show the height variation of
the pickup ion densities and as mentioned
previously this height variation will allow us to
inter something about the energy distribution of
the sputtered neutrals.
10.0000
1.0000
Pickup Ion Density
Altitude = 560 km
E
-....v
O_
0.1000
0.0100
0.0010
0,0001
0
......... I ......... I ......... I ......... I ......... I .........
1000 2000 3000 4000 5000 6000
Height (kin)
Figure 4a. Computed ion densities at spacecraft for Dione wN<eflyby as a function of height fbr H=O-_,O=+,H=_-,O+and H+ions. The height is equal to the a - r0parameter in Figure 3.
13

17[
'_ a_n_j u! _alom_J_;d o_ _ _ oql o1 l_nbo s._lq_._oq oqj_ 'suo! +tt pu_, _-() + H L,.:O %0:H
.toj lq_Dq jo uoBatmJ _ s_ XqXlj o_ snp_ioau _ .toj l_.tao3_ds 1_ soBtstlop uo_ pamdmo D "_ oom_Lq
(w_i) lqD!aHOOg_ 000_ OOgL 000 t oog 0
- _- -- -- ' I I u u _LO00"O
\
m I
I
= _ _
= "_ _
..... y_H
-- = +OZH uu_ Og_ = apnl!llV
(SSOd a>lOM) snpolaOU3 Joj 4!suaa UOl dn_la!d
0_00"0
00_0"0
O00FO
0000"_
0000"0 _
8"
o
v
"f aan}_._d m ._olamP, ap,d o_ _ .,g,oql ol Fnbo st. lq_t.aq oqj_ "+O°H pup, +_HN "+°HN + OD
'+HO ._oj lq_Dq jo uoB,_unj _ese e{q£[I O:,[_a_ouoKI ._qI UP,.[aoaP,ds re sat._.suop uo._ pamdmo D "q_7a.mgLq
+_HN
....................... ,_03
-- = ,HO uJa ogg = aPnI!IIV
(SSOd mloAA) auo!(] Jol X_!sua(] uol dn>la!d
0LO00"O
0_00"0
-0
g
O0 _0"0 _%,,_
000 _'0
, 0000" t

Pickup Ion Density for Enceledus (Woke Pess)
1.0000 _: .... [ .... i .... i .... i ....F
I Altltude = 250 km OH* = _ _ _
C02 + = ...........NH * = .......Ha_ + = ......
0.1000_- NH2 _ = -- --
"_ 0.01 O0
..........--.27--
0.0001 .... _ .... i , •_ ,_ .... J ....
500 1000 1500 2000 2500
Height (km)
Figure 5t). Computed ien densities at spacecraft tbr Enceladus wake flyby as a function of height tbr Ott+
CO2 +, NtI:[L Nti2 + aid tt:_O +. The height is equal to the a - r 0 parameter in Figure 3.
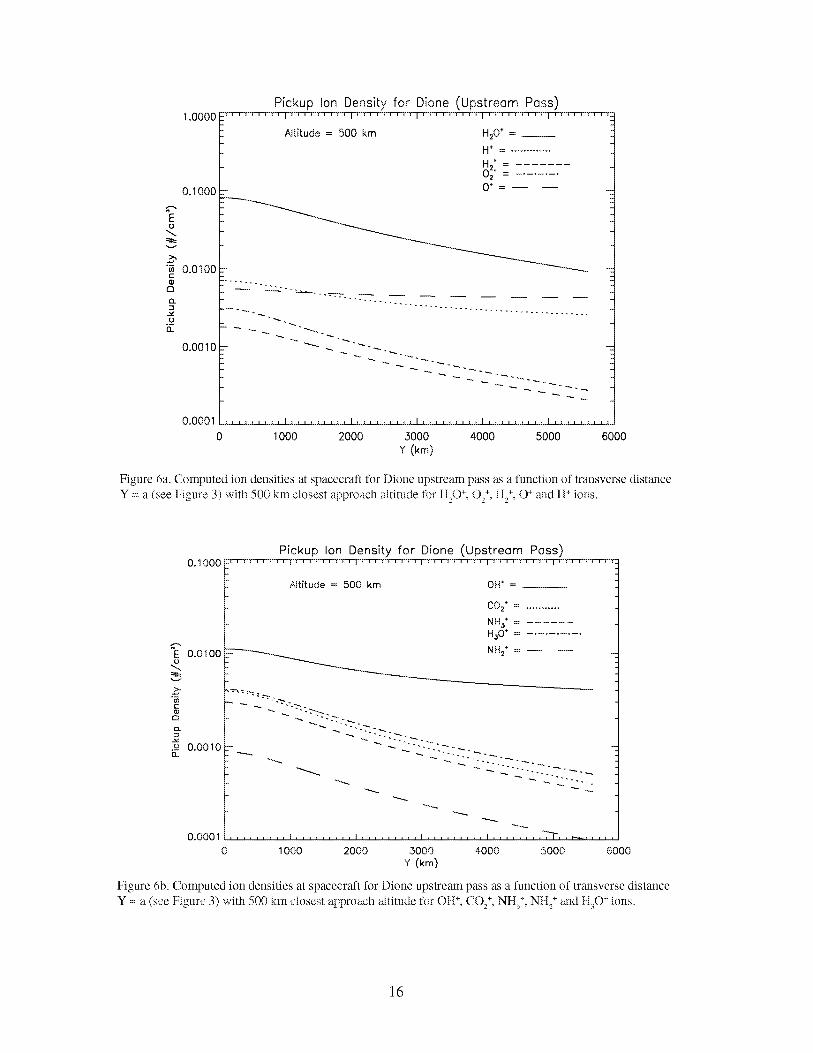
4.2 Upstream Passes
In Figures 6a and 6b we show the pickup ion
density as a [unction of distance Y for an up-
stream pass with closest approach altitude of
500 kin for Dione. Y is the distance along the
spacecrafl trajectory relative to the center of the
body (i.e., Y = 0 corresponds to closest
approach).In the case of t-[20 + we have detect-
able pickup ion fluxes for the ion measurements
by CAPS. The HI and O2'- measurements arealso possible for pickup ions since we can use
the ST measurements for them. H + and O +
pickup ions will be undetectable because of the
relatively high ambient densities of these spe-
cies. Referring to Figure 6b we see that OH +
(LEF detection), CO2 + (ST detection) pickup ion
detection is clearly possible while H_O + (LEF
detection) detection is very marginal at closest
approach and probably not possible. If we use
ST data for ()Ill + and H30 + detection will be
difficult since ambient O + and H20 + will domi-
nate. NH_ + (LEF detection) is not possible.
in Figures 7a and 7b we show the pickup ion
density as a function of distance Y for an up-
stream pass with closest approach altitude of
100 km for Dione (i.e., for navigation reasons
such a close encounter is not allowed but shown
to compare upstream pass versus wake pass).
Here, t-leO + (ST detection), O2+ (ST detection),
and I--I_+ (ST detection) pickup ion detection are
possible out to several thousand kilometers. H +
and O +pickup ions are not detectable because of
high ambient densities for these ion species. In
Figure 7b ions, OH +(LEF detection), and CO2 +
(ST detection) are possible to detect in the ion
data out to 1000 km for all. To detect NH3+ and
H3O+ we would need LEF detection but then
their peak densities would have to exceed 0.01
ions/cm 3. NH2+ (LEF detection) pickup ion
detection is not possible. The point should be
made that we are assuming 10% abundance,while the abundances could be a few % or less;
then detection for many of the minor species
will probably not be possible.
15
EO
c
C_
Q.
=._
Q.
1.0000
0.1000
0.0100
0.0010
0.0001
0
Pickup Ion Density for Dione (Upstreom Pass)J RIII , I J RI I I , I ,R Jl III ,R J RI I I , I J R Jl I , I ,R I RIII , I J RI I I , I J R Jl I
Altitude = 500 km H20 ÷ = __
---.._..
a ÷ = .............
H ÷2,
0 2 = ........
0 ÷ --
......... I ......... I ......... I ......... I ......... I .........
1000 2000 3000 4000 5000 6000Y (k_)
Figure 6a. Computed ion densities at spacecraft for Dione upstream pass as a function of transverse distanceY = a (see Figure 3) with 500 km closest approach altitude for H O +, O +,H.,+, O + and H +ions.
2 2
0.1000
E 0.0100o
gD
._ 0.0010
Pickup Ion Density for Dione (Upstream Poss)
Altitude = 500 km OH* = __
COz" = ...........
NHa*
HaO* = ..........
NHa ÷
"" -- 2i:-
0 1000 2000 ,3000 4000 5000 6000
Y (kin)
Figure 6b. Computed ion deusities at spacecraft [br Dione upstream pass as a functiou of transverse distance
Y = a (see Figure 3) with 500 km closest approach 'altitude for Oil*, COe +, Ntt:_+,Ntt_ + and H3O+ ions.
16

Pickup Ion Density for Dione (Upstream Pass)1.0000 ......... _ ......... i ......... T ......... r ......... _ .........
Altitude = 100 km H20" = __
H + _ .............
H2÷
[_. 02÷ = .......0.1000 O÷ = .......
E
v
O.OlOO#Z.........
#o - " " . ""-----::r:::::::-::::::-::T-:T:;7-iT
o.oolo - - 2L-L-:_ Z. "
0,0001 ......... u ......... i ......... _ ......... i ......... u .........
0 1000 2000 3000 4000 5000 600
Y (kin)
Figure 7a. Computed ion densities at spacecraft for Dione upstream pass as a l_nc[ion of transverse distance
Y = a (see Figure 3) with 100 km closest approach altitude for H2O+, O2+,H2÷, O + and H ÷ions.
0.1000
E 0.0100
a
._ o.oolo
0.0001
Pickup Ion Density for Dione (Upstremm Poss)I,IJRlll,lJRlll,lJRlll,lJRllllRJRllI,RJlllI,RJlllI,RJll,,,_
Altkude = 100 km OW = __
%'z-.
002 ÷ = ...........
NHa +
H_O_ = ..........
NH2 ÷
--,...
1000 2000 3000 4000 5000 6000Y (kin)
Figure 7b. Computed ion densities at spacecraf't for Dione upstream pass as a function of trat_sverse
distance Y = a (see Figure 3) with 100 km closest approach altitude tbr Ott _, COe _,Ntt:__, Nile _and H3O+ions.
17

In Figures 8a and 8b we show the pickup ion
density as a function of distance Y for an upstream
pass with closest approach altitude of 500 kin for
Enceladus. In Figure 8a t-I20 + (ST detection), and
Oa+ (ST detection) pickup ion detection at all
altitudes are possible. He+ (ST detection) pickup
ion detection is not possible at all heights. H + and
O + are not detectable because of the high ambient
1.0000
0.1000
Eo
"_ 0.0100
0.0010
0.0001
0
densities of these species. In Figure 8b, OH + (LEF
detection), H3 O+ (I,EF detection) arid NH3+ (LEF
detection) of pickup ions are below the detection
threshold of the instrument. We could try and
detect OH + and H30+ using ST data but will need
to compete with ambient O + and H20 +. NH2+ isnot detectable.
Pickup Ion Density for Enceladus (Upstreom Poss)I I I I
Altitude = 500 km H20 + -
H+ = .............
H_*
-------------.-.__ O;t+ = ........-- 0 +
.......................... -_-"].." ."2"..-..-:-. _ _.._: : .................................
x J _ t l x J J _ | t J J , "1[ "_ "_-x _ J J 1 t _ J J
500 1000 1500 2000 2500
Y (km)
Figure 8a. Computed ion densities at spacecraft for Enceladus upstream pass as a function of transversedistance Y = a (see Figure 3) with 500 km closest approach altitude for tteO+,()S%It: '- O+ mid tt +ions.
Pickup Ion Density for Encelodus (Upstreom Pass)0.1000 _ _ Y _ _ _ Y _ _ i T _ _ _ i _ _ _ Y i _ _ Y
AIUtude = 500 km OH* -
C02 + = ...........
NH3_HsO + ...........
E 0.0100 NHa*u
,.,..
o 0.0010- " ......
0,0001 .... _ r-_. , , l .... 1 .... l ....
0 500 1000 1500 2000 2500
Y (kin)
Figure 8b. Computed ion densities at spacecraft t\)r Enceladus upstream pass as a function of transversedistance Y = a (see Figure 3) with 500 km closest approach altitude for OH+,CO S, NIt3+, Nile+ and}t3 °+ ions.
18

In Figures9aand9bweshowthepickupionden-sity asafunctionof distanceY for anupstreampasswithclosestapproachaltitudeof 100km forEnceladus(i.e.,hereagainaflyby distanceof 100km isnotallowedbecauseof navigationissuesbutis shownto compareupstreampassesversuswakepasses).In Figure9aH[20+(STdetection),and02+(STdetection)pickupion detectionispossibleatalldistances.H2+(STdetection)pickupion detectionisnotpossible.Thedetectionof H_andO+pickupiondetectionis notpossiblebecauseof thelargealnbi-
10.0000
1.0000
if-.,E
.913..
0.1000
0.0100
0.0010
0.0001
0
Pickup Ion Density form
ent ion densities for these species. In Figure 9b,
OI-{+(I,EF detection) and H[_O+ (I,El" detection)
pickup ion detection may be possible inside 1000
km; if we use ST data instead their detection may
be possible at all heights, but then they have to
compete with ambient 0% OH + and H=O +. NH3+
(I]:;F detection) pickup ion detection is not possible
at all heights. C,O2+ (ST detection) pickup ion
detection is possible at all heights. NH2 + (ST orLEF detection) pickup ion detection is not possible
at all heights.
Encelodus (Upstream Pass)U I I
Altffude = 100 km H20* -
o°_"2 _--..-2L-2i
J J _ _ 1 L L L L _ _ _ J J J J J _ "1 "t _ _L L L
500 1000 1500 2000 2500
Y (kin)
Figure 9a. Computed ion densities at spacecraft for Enceladus upstream pass as a function of transverse distanceY = a (see Figure 3) with 10Dkm closest approach altitude fbr tleO-_,Oe+,1H2%O+and H+ions.
Pickup Ion Density for Enceladus (Upstream Pass)O.lOOO .... ] .... _ .... r .... [ ....
Aft]rude = 100 km OH* = __
CO2" = ...........
NHs* = ......H_O÷ = ......
"_ NH2÷ = .......E 0.0100
0 500 1000 1500 2000 2500
Y (kin)
Figure 9b. Computed ion densities at spacecraft for Enceladus upstream pass as a function of transverse distanceY = a (see Figure 3) with 100 km closest approach altitude for OH+,CO_+,NHs+,NH_+and H._O÷ions.
19

At thispointwewouldlike to addthefollowingcaveatthatmanyof theminorionsfor whichdetectionusingeitherSTorLEFdatawasruledoutasnotbeingdetectablereferredto theioncountmeasurementsorA cycledata,whilewithregardtotheB cycledata,whichis considerablymoresensitive,wemaybeableto detecttheseminorions.But, suchdetectionwouldprovideminimalinfommtionaboutthepitchangledistributionsof thevariousion specieswhichisneededto distinguishbetweenambientionsandpickupionswhichareexpectedto bein thefl-)rmof ring distributions.
5. Ring Distribution Simulations
Here we derive the expressions used to computetile simulaled ion count rates for CAPS of the
pickup ions. These calculations assume that the
ions are in the form of a ring distribution and
have not had sufficient time to pitch angle
scatter belk-_re they are observed by CAPS (see
Wu and Davison, 1972 and Hartle and Wu,
1973). In the plasma frame of reference one can
write the velocity distribution for a fresh pickup
ion (Hartle and Wu, 1973)
n-V0z)
v° tile particle velocity in the plasma frame with
v0the mean velocity of the plasma which will be
in the direction of co-rotation. The component
perpendicular to the magnetic field is indicated
by the symbol ^ and the component along the
magnetic field is along the z axis. One can then
re-write the above expression in tile appropriate
form when viewed in tile spacecrafl frame
ignoring for now spacecraft motion
4 x ' _ " " •
where V is the flow speed of the ambient ions
with x along the co-rotation direction, v is tile
velocity of the pickup ion in the spacecraft
frame. Finally, this expression can be further
refommlated into a more useful forln
f(V)= n_6 (v_- _ Vx V_)6 (v_)
in Figure 10 we show a schematic of the ring
distribution in the spacecraft frame. We are now
in a position to incorporate this expression in the
equation defining the observed count rate for a
given distribution function f(v). The general
expression for the count rate that CAPS wouldobserve is
CR = e A fJ'R([,:IQ,O,_;_,) f(_) _. h v_dv_ dv_ d_bAt'A_
for which _(E/Q,O,,:V) is the response function of
the IMS with E/Q the tuned energy-per-charge
of the IMS, {1the angle relative to the collimator
normal of the IMS and q)the angular sector of
the IMS. This equation reduces to the following
expression after substituting the above expres-
sion for f
CR=2=
Here, e represems the detection efficiency of the
IMS, A is its efl)ctive area of detection, and Aq)
is the angular width of tile IMS angular sectors
which are _ 20 °. We then introduce the geomet-
ric factor G = e AA _) A E /E_10 -3 cln2-ster-eV/
eV from which we get
AfDAh;'l E
for which A£2 = 0.05 ster, AEfE = 0.17, and 0 -<
v -<2 V. In the limit of v = 2V and setting V--_50 km/s we get
CR= 1.2x10 5 n cps.
for ST data where n is the density of the pickup
ion in units of ions/cm 3. So, it can be seen that
modest densities can produce very high count
rates in CAPS if we sample the ring distribution
function before it can pitch angle scatter and
spread out in phase space.
20

(DO3
\.
E
>
0 50 10 0 1S,0
vx (kin/see)
2 00
Figure l 0. Ring velocity distribution for pickup ions with drift speed V X.
Simulations of the pickup ions plus ambient ions
for various species are shown in Figure 11 for
Dione and Figure 12 for Enceladus (i.e., A cycle
data) for which we assumed for Dione densities
of 1.0 ions/cm s for H20+, 0.08 ions/cm _ for O2+,
0.06 ions/cm s lor CO2 +, and 0.03 ions/cm _ for
NH3+ and lor Enceladus we assumed densities of
2.2 ions/cm s for H20 +, 0.15 ions/cm :_for O2+,
0.025 ions/cm s for CO[, and 0.04 ions/era 3 for
NH3+. These pickup ion densities were derivedfrom our wake pass calculations at zero height.
For the ambient ions we assumed convected
Maxwellians and used the ion parameters in
Table 4. For reference we show the energy-angle
coverage provided by CAPS in Figure 13 a and
13b for O2+ at Dione and Enceladus, respec-
tively. It should be clear l_om Figures 11, 12 and13 that in most cases CAPS will be able to
measure the ring distributions of the pickup ions
for such species as H20+, 02 +, CO2 +, and NH:$during a wake pass. This should also be true for
some of the other ion species such as OH + and
His()+. As can be seen that the count rates can
exceed several 100 kl-[z for the pickup ions and
in many cases should allow us to see them many1000 of kilometers above the satellites surface.
Here, we note that for the molecule NH3+ we
will need to use LEF data, so the displayed
counts in Figure 1 ld and 12d will be an order of
magnitude lower for I_,EF data.
21

'°°ta,) Dione H20' Ambient end Pickup Ions
I I
'°°f[3) Dione 0 + Ambient ond Pickup Ions2
I 1
Em= = 1422 eV
50 50
f_
-50 -50
-IO0
0
-100
50 1O0 150 0 50 1O0 150
Vx (km/sec) Vx (km/sec)
ge_
100
50
-50
-1000
C) D_one C02 + Ambient ond Pickup Ions7[ r , ]-
g
-lOO50 1oo 150
Vx (km/sec) 0 50 100 150Vx (km/sec)
Figure 11. Contour plots of simulated ion count rate at Dione [or a) tt20 +, b) O2+, c) CO2+ at_d d) Nil3+.
22

gc_
6O
4O
2O
-2O
-40
-60
0
a) Encelodus 1-420+ Ambient ond Pickup Ions
20 40 60 80 1 O0
Vx (km/sec)
ot
-601 J J _ I _ _ _ I _ _ _ I J _ _ I _
0 20 40 60 80
Vx (krn/sec)
1100
m
>.,
60
4O
2O
-60
0
C) Enceladus C02 + Ambient and Pickup Ions
Emo_ = 1012
20 40 60 80 1 O0
Vx (km,/sec)
m
60
40
2O
-20
.--40
-6O
0
d) Encelodus NHS Ambient end Pickup Ions
20 40 60 80 1 O0
Vx (km/sec)
Figure 12. Contour plots of simulated ion count rate at Enceladus fk_r a) H20 +. b) (L +, c) C()2 + and d) NH3L
23

a) IMS Energy-Angle Coveroge for Dione F-lybylOO
50
?
E o
-k
-5O
-100
0 50 100 150v× (k_/_)
b) IMS Er_ergy----Angle CoverQge for Enceladus Flyby6o
4o
2o
,-....E__ 0
">
-2O
....40
-6O
0 20 40 60 80 1O0v× (kin/s)
Figure 13. Example pilot of INIS energy-angle coverage for pickup ions at a) Dione and b) Enceladus.
24
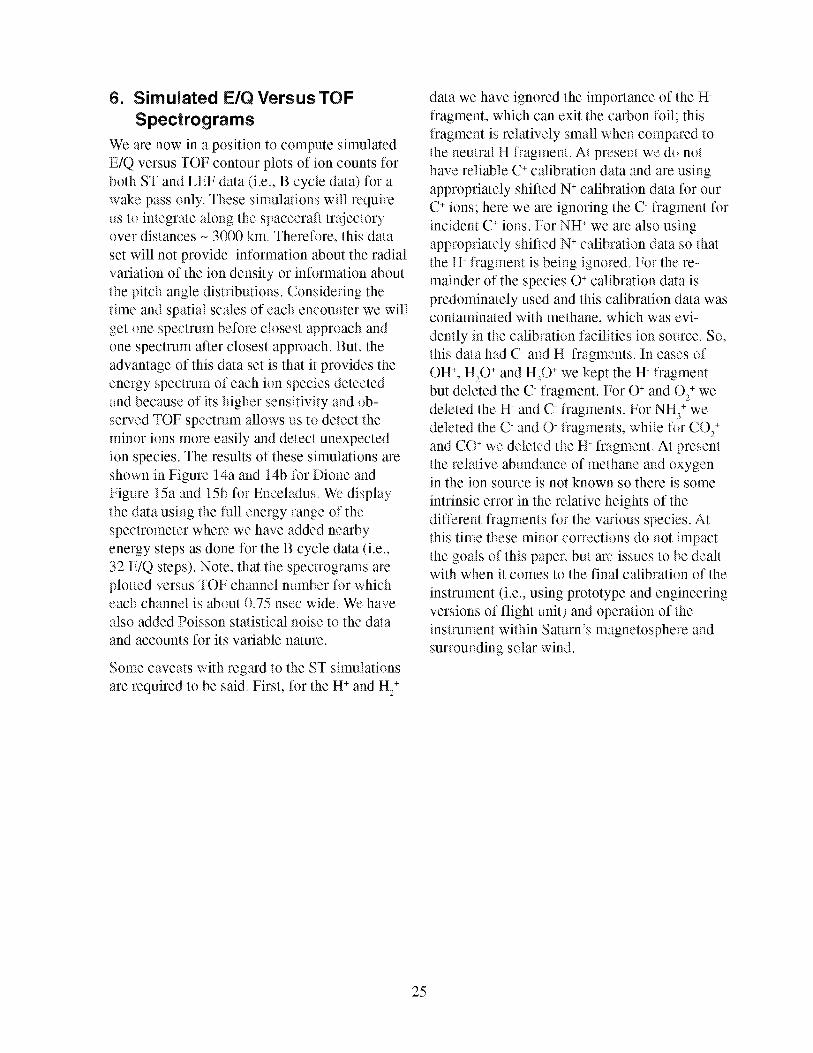
6. Simulated E/Q Versus TOF
Spectrograms
We are now in a position to compute simulated
E/Q versus TOF contour plots of ion counts for
both ST and LEF data (i.e., B cycle data) li-)r a
wane pass only. These simulations will require
us to integrate along the spacecrafl trajectory
over distances - 3000 kin. Therefore, this data
set will not provide information about the radial
variation of the ion density or information about
the pitch angle distributions. Considering the
time and spatial scales of each encounter we will
get one spectrum before closest approach and
one spectrum after closest approach. But, the
advantage of this data set is that it provides the
energy spectrum of each ion species detected
and because of its higher sensitivity and ob-
served TOF spectrum allows us to detect the
minor ions more easily and detect unexpected
ion species. The results of these simulations are
shown in Figure 14a and 14b for Dione and
Figure 15a and 15b for Enceladus. We display
the data using the full energy range of the
spectrometer where we have added nearby
energy steps as done for the B cycle data (i.e.,
32 E/Q steps). Note, that the spectrograms are
plotted versus TOF chalmel number for whicheach channel is about 0.75 nsec wide. We have
also added Poisson statistical noise to the data
and accounts li-)r its variable nature.
Some caveats with regard to the ST simulations
are required to be said. First, for the H + and H_+
data we have ignored the importance of the H-
fragment, which can exit the carbon foil; this
fragment is relatively small when compared to
the neutral H fragment. At present we do not
have reliable C+ calibration data and are using
appropriately shifted N + calibration data for our
C+ ions; here we are ignoring the C-fragment for
incident C+ ions. For NH + we are also using
appropriately shifted N +calibration dala so that
the H- fragment is being ignored. For the re-
mainder of the species 0 + calibration data is
predominately used and this calibration data was
contaminated with methane, which was evi-
dently in the calibration facilities ion source. So,this data had C- and H- fragments. In cases of
OH +, H20 _ and H:_O_ we kept the H- fragment
but deleted the C- fraglnent. For O+ and O2+ we
deleted the H- and C- fragments. For NH3+ we
deleted the C- and O- fragments, while for CO__+
and CO + we deleted the Ill fragment. At present
the relative abundance of methane and oxygen
in the ion source is not known so there is some
intrinsic error in the relative heights of the
different fragments li-)r the various species. At
this time these minor corrections do not impact
the goals of this paper, but are issues to be dealtwith when it comes to the final calibration of the
instmlnent (i.e., using prototype and engineering
versions of flight unit) and operation of the
instrument within Saturn's magnetosphere and
surrounding solar wind.
25

105 •
104 -
101 -_
10 o
0
._. 103>
>,,
lo 2
200
Diane• T
Simulated
!C÷N ÷
Data
400 1200
, i ,
1000TOF
Figure 14a. Energy versus time-of-flight (TOF) contour lnap of siirmlated ions coums for B cycle ST data
for Dione wake pass encounter. Vertical lines give approximate peak positions for w_rious incident ions.
105
104
Diane Simulated LEF B Cycle Data
101
10 o i
0 200 400 600 800TOF Channel
1000 1200
Figure 14b. Energy versus time-ol:flight (TOF) contour map of simulated ions counts for B cycle LEF dma
for Dione encounter. Vertical lines give approximate peak positions for various incident ions.
26

10 5 : , ,
10 4 .--
>
>_
? L _
_5 lO2 z.,._..,__
r
101
lOo
0
Enceladus Simulated
iCN _
4OO 6OO
ST B
IH,O ÷
Cycle Dot(]
. , io,2÷,
CO"
u
I d
f I
,/I
8OO
/
I000 1200TOF Channel
Figure 15a. Energy versus time-ol:flight (TOF) contour map of simulated ions counts for B cycle
ST dala for Enceladus encounter. Vertical lines give approximate peak posilions for warions incident
lolls.
10 5
104
.-. i0 3>
lO2
I01
I 00
0
I I! II|I_
NIR_t'_ gllllI I1"{_ I|1 III
lit|
, I , I I, .........
800 1000200 400 600 1200TOF Chennel
Figure 15b. Energy versus tilne-oi:flight (TOF) contour map of simulated ions counts for B cycle LEF
data for Enceladus encounter. Vertical lines give approximate peak positions for various incident ions.
27

The simulations of the ST data in Figures 14a
and 15a show that we can resolve the H + and t-I2+
in the ST data for which the I-I_+extend to higher
energy because of its greater mass. The same
can be said for the water group ions being
separated from both 02 + (i.e., note that in the ST
data 02 + cannot be distinguished uniquely from
S+) and CO2 +, respectively, in the ST data. Onecan also see that the accumulated counts for the
water group ions can exceed 104 counts. For the
water group ions we see the presence of several
ghost peaks in the ST data; they occur at chan-
nels _ 200, 475 and about 1100. The peaks at
200-250 channel nmnbers are probably Ill- ions
coming out of the carbon foil of tile IMS due to
OH +, H20 +, HsO + and NHs+ incident ions which
have hydrogen in them. The peak at 400 to 500
channel numbers are probably due to O- ions
coming out of the carbon foil of the IMS due to
incident waler group ions. The peak at channel
numbers near 1100 are the LEF ghost peaks due
to incident water group ions and ammonia ions.
At Dione H +peaks at around 80 eV and occursat ST channel 140 in TOF with its detectable
LEF ghost peak at channel 260 (i.e., LEF ghost
peak caused by H + ion striking I,EF stop detec-
tor and secondary electron from I,EF stop
detector striking ST stop detector). Between 100
eV to 200 eV the alnbient H2+ and pickup H2+
combine to form a single peak centered around
ST channel 195; these ions would also be
detectable using the I,EF data. The water groupions at Dione are centered around channel 250
and 900 eV for the primary peak. O[ peakoccurs at around 1 keV and ST channel 850 for
Dione, while the CO2 + peak is around 2 keV andST channel 980 lk-)rDione. In the case of
Enceladus we see a similar result except that
now the signal is confined below 1 keV, while
for Dione counts extended up to 3 keV. This can
be explained by the higher ambient co-rotation
speeds and temperatures at Dione, and corre-
spondingly larger pickup energies at Dione.
In the LEF data for Dione we see a clear peak
for CO2 + at channel number 700 and E/Q ~ 1-2
keV. At a slightly lower energy and LEF channel
number of 950-1000 we see evidence of O2+ and
NHs+. At around 500 eV we see clear evidence
of O + and H20 + ions between LEF channels1000 and 1100. This data set will allow us to
measure NHs+. In the case of Enceladus the ionpeaks are less pronounced, but we should be
able to measure NH3+ , H3 O+, CO2 + and O2+.
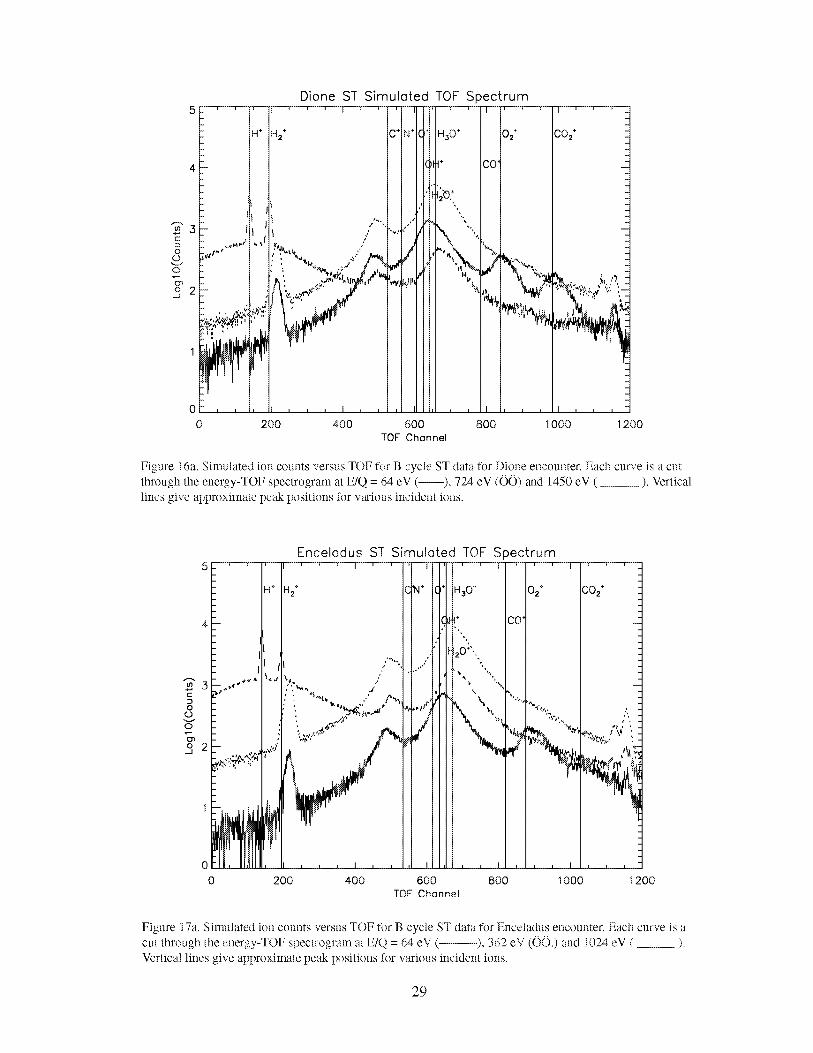
For a more quantitative determination we
consider several cuts of the ST contour maps at
specific E/Q. For Dione we consider E/Q = 64
eV, 724 eV and 1450 eV and are shown in
Figure 16a. For Enceladus we consider E/Q = 64
eV, 362 eV, and 1024 eV and are displayed in
Figure 17a. These cuts show the dominant
presence of H + mid H2+ below 100 eV, while at724 eV for Dione and 362 eV fk-)rEnceladus tile
spectra are dominated by waler group ions and
finally at 1450 eV for Dione the dominant
species are O[- and CO[. For Enceladus O[ is
important at 1024 eV and CO2 + which is impor-
tant at higher energies is barely seen at 1024 eV.
At higher energies the peak at 200 to 250 ST
channels is the H- ghost peak due to water group
ions, at ST channels 400 to 500 we are seeing O-
ghost peaks from the water group ions. Between
ST channels 1100 to 1200 we see the LEF ghost
peaks due to the water group ions. For each
individual cut of tile spectrogram we can apply
the SAM (Spectrmn Analyzer Module) algo-
rithm (see SiltleJ; 1993) and de-convolve the
mass peaks to obtain a more accurate estimate of
ion counts for each species present in the data.
The application of this algorithm is no more
accurate than tile accuracy of the calibration
data. In order to acquire the ion counts for
various ion species al specific E/Q from this
data set we need to use the SAM algorithm. For
this analysis we used a total of 10 ions which
required us to invert a 10X10 coupling coeffi-
cient matrix to get a 10X10 inverse coupling
coefficient matrix (Note, each individuN cut
contains the accun:mlated counts for 14 ions. For
our de-convolution algorithm we only used 10
of those ions and correspondingly only included
the accumulated counts for those 10 ions.). We
then bin the data (i.e., sum the ion counts for a
range of TOF channels centered on ion peak in
TOF) for 10 ion species and multiply the binned
28
5 r
Dione ST Simulated TOF Spectrumr , I- • " • II [1 r 1 • " • 11
C+NI01 _ C_2+ C% _
4 _
g0
o
%o 2_
i-n
O,0
, .I
J. :lr. :l
i ,_,, .,." /"%
t
/
200 400 600 800 1000 1200
TOF Channel
Figure 16a. Simulated ion counts versus TOF for B cycle ST data tbr Dione encounter. Each curve is a cut
through the energy-TOF spectrogram at E/Q = 64 eV (--), 724 eV (00) mid 1450 eV ( .....................). Vertical
lines give approximate peak positions for various incident ions.
3gO
(Dv
o
%o2
Enceladus ST Simulated TOF S
,_+ H_* C N÷ H_O +
J+
20÷',
k
)ectrum
i02 +
CO"
,
800 1000
0 I , , , I , , , I ,
0 200 400 600 1200
TOF Channel
Figure 17a. Simulated ion counts versus TOF for B cycle ST data for Enceladus encounter. Each curve is acul through the energy-TOF spectrogram at E/Q = d4 eV (....................), 362 eV (003 and 1024 eV ( __ ).
Verdcal lines give approximale peak positions for various incident ions.
29

data by the inverse coupling coefficient matrix
to get the ion counts for each individual ion
species. The details of applying this algorithm
are described in Sittler (1993).
In rI)bles 5a and 5b we show for l)ione and
Enceladus, respectively, the de-convolved ion
counts, <Covr>, with error bars, %xxJ.r, for the
w_rious ion species derived from a subset of the
ST simulated spectra similar to that shown in
Figures 16a and 17a. The <Couv> is an average
computed from 40 solutions for which we addedPoisson statistical noise to the simulated TOF
spectra. The same can be said for our estimate of
the standard deviation %xxJ.r. The tables also
show the input counts CrN for ambient ions only
and ambient ions plus pickup ions. We show the
ambient only counts to provide a baseline to
determine our ability to separate the ambient
ions from the pickup ions. In most cases,
<Covr> _ C>.(ambient+ring). The results showthat one can separate the water group ions very
well and shows the power of our de-convolution
algorithm which we refer to as the SAM algo-
rithm. For the water group ions the errors range
from 1% to 6%. By comparing the ambient only
and ambient plus pickup ion counts one can see
that with the B cycle data it will be difficult to
separate the pickup ions from the ambient ions
for H +, Ha+, and O +. For the remaining ions OH +,
H20 +, H30+, O2+, CO2 + and CO + we maybe ableto separate them from the ambient ions when
using the B cycle data when combined with the
Table 5a. Dione SAM ST Derived ion Counts
Ion Type
H +
E/Q (eV)
1450.0
Resolution
ST
GIN
(ambient)0.0
GIN
(ambient+ring)0.0
<Cous>
-1.65
OCOUT
8.82" 724.0 " 0.0 0.0 -1.71 35.6" 64.0 " 2.45E+5 2.61E+5 2.61E+5 637.0
H2 + 1450.0 ST 0.0 0.0 -1.36 10.6" 724.0 " 66.2 66.2 64.8 36.9
" 64.0 " 3.91E+4 4.87E+4 4.87E+4 317.0O+ 1450.0 ST 2.12E+4 2.31E+4 2.33E+4 3771.0
" 724.0 " 7.88E+5 8.11E+5 8.11E+5 1.22E+4" 64.0 " 4.48E+4 4.92E+4 4.88E+4 2809.0OH++NH3 + 1450.0 ST 1.25E+4 2.44E+4 2.36E+4 8618.0" 724.0 " 3.06E+5 3.66E+5 3.66E+5 2.66E+4" 64.0 " 1.48E+4 2.86E+4 2.96E+4 6096.0H20 + 1450.0 ST 1.47E+4 8.90E+4 8.99E+4 7728.0" 724.0 " 2.51E+5 6.26E+5 6.26E+5 2.29E+4" 64.0 " 1.05E+4 5.86E+4 5.76E+4 5154.0H30 + 1450.0 ST 0.0 3.83E+3 3.16E+3 3.84E+3" 724.0 " 0.0 1.85E+4 1.83E+4 1.11E+4" 64.0 " 0.0 2357.0 2821.0 2522.0O2+ 1450.0 ST 6373.0 3.05E+4 3.05E+4 286.0" 724.0 " 7445.0 2.17E+4 2.16E+4 270.0" 64.0 " 120.0 2250.0 2247.0 89.0
CO2+ 1450.0 ST 0.0 2.35E+4 2.35E+4 293.0" 724.0 " 0.0 7811.0 7800.0 184.0" 64.0 " 0.0 1991.0 1985.0 71.2CO + 1450.0 ST 0.0 681.0 699.0 160.0
" 724.0 " 0.0 482.0 482.0 224.0" 64.0 " 0.0 73.0 52.4 79.6
30

Table 5b. Enceiadus SAM ST Derived ion Counts
Ion Type
H ÷
E/Q (eV)
1024
Resolution
ST
GIN
(ambient)0.0
GIN
(ambient+ring)0.0
<CouT >
-0.22
OCOUT
5.82
" 362 " 0.0 0.0 -6.45 41.7
" 64 " 2.12E+7 4.29E+5 4.29E+5 869.0
H2 + 1024 ST 0.0 0.0 3.85 6.32" 362 " 456.0 456.0 446.0 48.0
" 64 " 3.10E+4 3.15E+4 3.15E+4 279.0O+ 1024 ST 4.49E+4 4.49E+4 4.51E+4 3228.0
" 362 " 2.01E+6 2.03E+6 2.03E+6 2.64E+4
" 64 " 3.64E+5 3.67E+5 3.65E+5 8019.0
OH++NH3 + 1024 ST 1.4E+4 1.40E+4 1.36E+4 7302.0" 362 " 4.21E+5 4.51E+5 4.53E+5 5.56E+4
" 64 " 6.47E+4 7.39E+4 7.94E+4 1.76E+4
H20 + 1024 ST 2.53E+4 2.53E+4 2.53E+4 6364.0" 362 " 6.24E+5 1.23E+6 1.23E+6 4.31E+4
" 64 " 9.56E+4 2.8E+5 2.75E+5 1.53E+4
H30 + 1024 ST 0.0 0.0 194.0 3065.0" 362 " 0.0 2.03E+4 2.0E+4 1.91E+4
" 64 " 0.0 6069.0 8673.0 7535.0
O2+ 1024 ST 0.0 1.57E+4 1.57E+4 177.0
" 362 " 0.0 2.3E+4 2.31E+4 256.0" 64 " 0.0 5572.0 5539.0 122.0
CO2+ 1024 ST 0.0 5565.0 5545.0 99.1" 362 " 0.0 3290.0 3254.0 183.0
" 64 " 0.0 538.0 536.0 97.3CO + 1024 ST 0.0 18.5 -3.8 83.0
" 362 " 0.0 74.9 54.2 295.0" 64 " 0.0 32.3 18.8 152.0
A cycle daa. The primary reason %r the ambi-
guity in the B cycle data is because we add the 8
angular sectors of the IMS together in the B
cycle data. In the A cycle data we retain the
energy-angle dependence of the ion counts. The
advantage of the B cycle data is its greater
sensitivity. Well determined ion counts lk-)rH +,
H2+, 02+ and CO2 + are estimated (i.e., errors
1%) because these species are well separated
from each other mid the water group ions. NHs+
overlaps with OH + and we are not able to distin-
guish between the two ions (i.e., one exception
is the OH +will produce an O- ghost peak and
NHs+ will not). The detection of HsO _ has a
large uncertainty - 60% due to its co-location
with the ambient ions O +, H20 + and OH +.
31

TheLEF simulatedB Cycledata,Figures14band15b,showssingularpeaksfor atomicH+,H2+,H20+andO+.Thesimulationsalsoshowshiftedpeakpositionsdueto thepresenceofmolecules;for example,thefigureshowsshiftedpeakfor C+andO+for whichtheparentmol-ecule isC,O_ CO+ispresentbut is notre-solvedbecauseof its low abundancerelativetotheotherspecies.Thisshiftresultsfromthemoleculebreakingupin thecarbonfoil suchthattheexitspeedfromthecarbonfoil of thefraglnentsisequaltotheentrancespeedof theparentmoleculeto thecarbonik-)il.Thiscausesa15keVCO+incidentoncarbonfoil to haveC+ion of energy6.42keV exitingcarbonfoil sothatthefi'agmenthassufficientlylow enoughenergythatthedetuningeffectof theLEFsectionis important(seeNordholtetal., 1998).Theenergydependenceof LEFmolecularpeaksis thaithepeakpositionshiftsto lowerTOFwithdecreasingion exitenergyfromthecarbonfoil. In orderto calibrateoursimulationswehavetakenasastandard,calibrationdatafor N+andcombinedwith thecalibrationdatabyNordholtetal. (1998)to extendthecoveragebellow15keV.For E/Q> 15keV wefit thedatawithapowerlawin energy(i.e.,TOF= a*E^c+bwherea,bandc aredeterminedfromnumeri-calfits to calibrationdata),while for E/Q_<15kV wehavefit thedatawith polynomialof order3 (i.e.,TOF= ap+ bp*E + cp*E^2+ dp*E^3forwhichap,bp,cpanddparedeterminedfromnumericalfits to calibrationdata).Fortheotherionswethenmultiplytheaboveexpressionbysqrt(M/14)whereM isthemassof thefragmentexitingthecarbonfoil. In thecaseof CO+_ C+themassM = 12andenergyE = E co+(12/28)whichis thensubstitutedintoourpolynomialexpressionfor TOEIn realitymoredetailedcalibrationdatawill berequiredunderrealconditions.Theseresultsareaccurateenoughtodisplaytheeffectsexpectedbasedoninstrumentresponse.
UsingthedatafrolnNordholtetal. (1998)Figure6wehavealsoestimatedtheprobabilitylk-)raC+fragment(P= 0.79)relativeto thatforanO+fragment(P= 0.21)for whichtheparent
moleculeis CO+.A similarcalculationcanbedonefor _'_ +C,(_)2 for whichP= 0.65for C+andP= 0.35for O+.Inspectionof Figure14bshowsnoevidenceof CO+atTOF- 780whichmeansthatthepeakataboutTOF- 980is dueto NHs+.Onecanseefromthesesamefigurestheshill ofH2+fromH+to lowerTOFsothatit iswellseparatedfromtheIll+peak.Wealsoseeawellseparatedpeakfor NI-{3+ from N + and I--I_O+ from
O +. We also see a well resolved peak for O,,+ --*
O+; because of this we can uniquely separate O2+from S+. While for the ST simulations this
separation of peaks is not always possible. The
simulations also underscore the importance of
having good calibration data. In some instances
the ST data can better separate the ions of
different M/Q, while the LEF data is best for
separating atomic and molecular species of
similar M/Q. It should also be emphasized that
in many cases the LEF feature of the IMS will
provide a unique separation of molecules from
molecules and atolnic ions of the same M/Q. For
example, the Nordholt et al. (1998) results in
Figure 6 of that paper show how the CO + -*C +
and CO + _ O + peaks are well separated from the
N + _ N +peak; for which CO + and N + have the2 2
same M/Q. Also, 4°Ar will be well sepmated
from CO,, which has M/Q=44. It should beclear from these results that CAPS should be
able to separate the molecules from the corre-
sponding atomic species. Again, the main
difference between Figure 14b and Figure 15b is
that for Enceladus the ion peaks are confined to
lower energy relative to that for Dione. Because
the ions are measured at lower energy for
Enceladus, the I,EF TOF peaks will be shifted tolower TOF for Enceladus relative to that for
Dione. In the case of the ST data the inverse is
true. Here, we emphasize the fact that the water
group ions are not well resolved in the ST data
while for the LEF data they are resolved to a
greater extent.
In Figures 16b and 17b we show cuts through
the LEF E/Q versus TOF spectrogralns for
Dione and Enceladus, respectively, with E/Q =
64 eV, 724 eV and 1450 eV for Dione and E/Q =
64 eV, 362 eV and 1024 eV for Enceladus. For
32

DioneweseeatEIQ< 100eVwell resolvedpeaksforH +,H2+, NH[s+ -* N +, H2()+ -* O + aid
O +.At E/Q = 724 eV for Dione we see well
resolved peaks for CO2 + --* C +, CO2+_ O +, 02 +
OL NHs+ --* N +, H20+ --* O + and O +. These
spectra show the power of the LEF feature of
the IMS in that the species NH3+, N +, H20+ and
O + can be separated, while for ST data it would
not be possible to do very accurately. At E/Q =
1450 eV for Dione the spectrum is dominated by
peaks for CO2 +--* C+, CO2 + --* O% 02 + --* OL
NH3+ --* N +, H20 + --* O + and O + . The cuts in E/
Q for Enceladus show peaks lk)r H +, H2+ at 64
eV and peaks for O2+_ O +, NH_ + -* IN+, I--I20+-* O + and O +. At 362 eV at Enceladus we have
the salne result except the H +, HI- ions are
missing, the CO2 +--* C+ peak appears and the
NH3+ peak is still well resolved from the Oa+ -'-*
O + peak. Finally, at 1024 eV lk)r Enceladus we
only see peaks due to CO2 +"'* C+, O2+-"* (2)+,
I--I20+---*O +and O +, For Enceladus we do not see
any obvious evidence of N + in the simulateddata.
Similar to what we did lk)r the ST data we are
now in a position to apply the SAM algorithm
(Sittler, 1993) to our cuts through the I,EF
spectrogralns. In Tables 5b and 5d we show for
Dione and Enceladus, respectively, the de-
convolved ion counts with error bars for the
various ion species derived from the LEF sinm-
lated spectra shown in Figures 16b and 17b. The
results show that one can separate the water
group ions fairly well (i.e., uncertainties _ 1%)
with only the HsO+ having relatively largeuncertainties _ 15 %. Well determined ion counts
for H +, Ha+, O2+and CO2 + are estimated because
these species are well separaled from each other
and the water group ions (i.e., errors _ 2%-3%).
For the LEF data we were able to include NH3+
in our solutions whose peak is well resolved
from the water group ions; estilnated errors are3-4%. The data also show that we should be
able to resolve the pickup ions from the ambient
ions using the A cycle and B cycle data for ions
H2+ , NH3+ , OH +, H20 +, HsO +, O2 +, CO2 + andCO +.
5 I
H_
4
I/,I
iI
11 Ii_ Ii ,_lt
' '_"lll' 0'l 'ii
0 200
3c
0
°,9_.0
%o2
Dione LEF Simuloted TOF Spectrum
400 600 800TOF Chonnel
i _
H, + -
I ÷
-2 1÷ _2-
I
i
Ii
It
tl _
;;MI1200
Figure 16b. Simulated ion counts versus TOF for B cycle LEF data l'or Dione encounter. Each curve is a
cut through the energy-TOF spectrogram at E/Q = 64 eV (..............), 724 eV (O0.) and 1450 eV ( __ ).
Vertical lines give approximate peak positions for various incident ions.
33
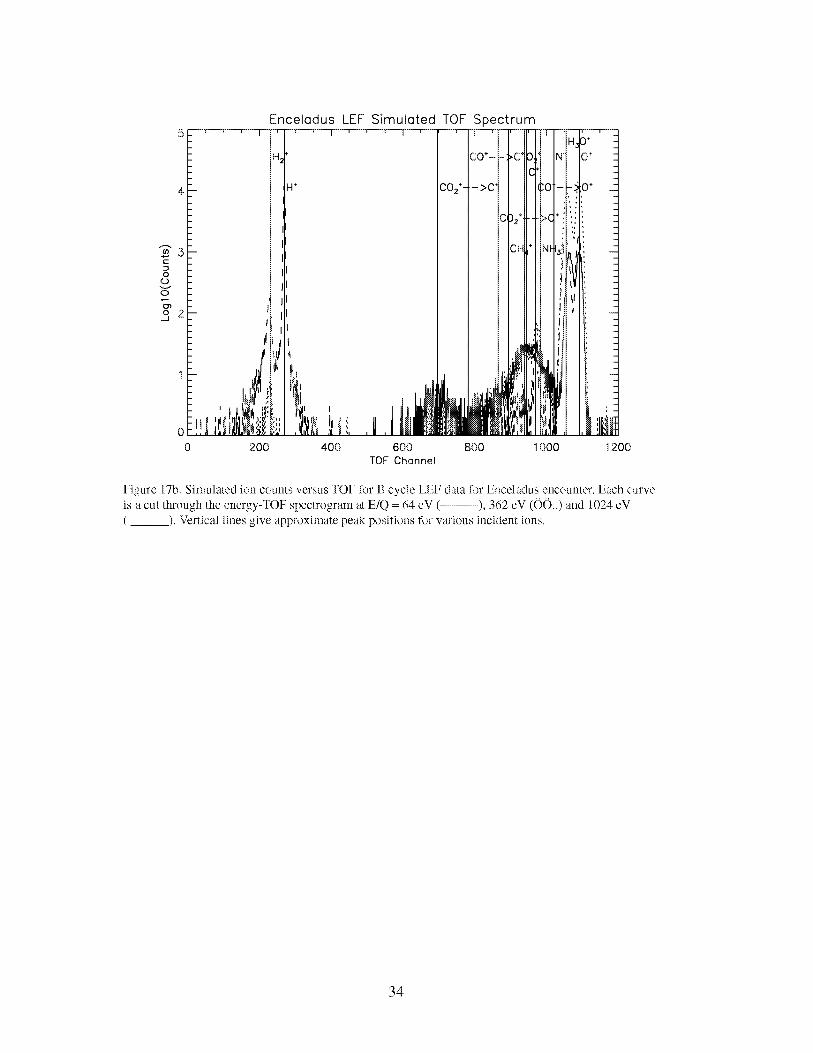
3E
O
OvO
so2
0
0
LEF Simulated TOF Spectrum
0 4
2
:H
400 600 800TOF Channel
II:lt
I]1
1000
Y
H, ÷ -
,÷ -
-_ J÷ _-
III .
fir -I| -
I :.Jill11200
Figure 17b. Simulated ion COUl_ltsversus TOF lk)r B cycle LEF data for Enceladus encounter. Each curve
is a cut through the energy-TOF spectrogram at E/Q = 64 eV (....................), 362 eV (0{}..) and 1024 eV
(__). Vertical lines give approximate peak positions l_)r various incident ions.
34

Table 5c. Dione SAM LEF Derived ion Counts
Ion Type E/Q (eV) Resolution GIN GIN (GouT > OCOUT
(ambient) (ambient+ring)H ÷ 1450.0 LEF 0.0 0.0 0.1 0.74
" 724.0 " 0.0 0.0 0.03 0.48
" 64.0 " 2.45E+4 2.61E+4 2.6E+4 172.0
H2+ 1450.0 LEF 0.0 0.0 0.23 1.2
" 724.0 " 6.62 6.62 6.14 2.78
" 64.0 " 3907.0 4872.0 4887.0 104.0
NH3 + 1450.0 LEF 0.0 271.0 266.0 20.7
" 724.0 " 0.0 1360.0 1355.0 49.7
" 64.0 " 0.0 313.0 306.0 19.3
O + 1450.0 LEF 2118.0 2309.0 2320.0 67.3
" 724.0 " 7.88E+4 8.11E+4 8.11E+4 313.0
" 64.0 " 4475.0 4923.0 4914.0 76.7
OH + 1450.0 LEF 1246.0 2168.0 2148.0 171.0
" 724.0 " 3.06E+4 3.52E+4 3.51E+4 422.0
" 64.0 " 1476.0 2542.0 2578.0 117.0
H20 + 1450.0 LEF 1470.0 8899.0 8878.0 205.0
" 724.0 " 2.51E+4 6.26E+4 6.27E+4 526.0
" 64.0 " 1054.0 5859.0 5819.0 160.0
H30 + 1450.0 LEF 0.0 368.0 379.0 100.0
" 724.0 " 0.0 1851.0 1873.0 292.0
" 64.0 " 0.0 236.0 250.0 67.3
O2+ 1450.0 LEF 637.0 3049.0 3039.0 69.4
" 724.0 " 745.0 2168.0 2163.0 52.6
" 64.0 " 12.0 225.0 223.0 22.2
CO2 + 1450.0 LEF 0.0 2350.0 2337.0 73.9
" 724.0 " 0.0 781.0 786.0 48.1
" 64.0 " 0.0 199.0 199.0 27.0
CO + 1450.0 LEF 0.0 68.0 70.4 30.4
" 724.0 " 0.0 48.2 46.4 19.5
" 64.0 " 0.0 7.3 7.84 10.0
35

Table 5d. Enceladus SAM LEF Derived ion Counts
Ion Type E/Q (eV) Resolution GIN GIN <GouT > OCOUT
(ambient) (ambient+ring)H + 1024 LEF 0.0 0.0 0.0 0.3
" 362 " 0.0 0.0 0.24 0.72
" 64 " 2.12E+6 4.29E+4 4.29E+4 228.0
H2 + 1024 LEF 0.0 0.0 0.0 0.44
" 362 " 45.6 45.6 47.2 9.3
" 64 " 3096.0 3150.0 3155.0 70.8
NH3 + 1024 LEF 0.0 0.0 4.58 11.4
" 362 " 0.0 879.0 879.0 36.8
" 64 " 0.0 265.0 262.0 24.7
O + 1024 LEF 4486.0 4486.0 4470.0 96.1
" 362 " 2.01E+5 2.03E+5 2.03E+5 530.0
" 64 " 3.64E+4 3.67E+4 3.67E+4 233.0
OH + 1024 LEF 1402.0 1402.0 1387.0 114.0
" 362 " 4.21E+4 4.42E+4 4.41E+4 627.0
" 64 " 6471.0 7125.0 7108.0 242.0
H20 + 1024 LEF 3095.0 3095.0 3102.0 145.0
" 362 " 6.5E+4 1.25E+5 1.25E+5 763.0
" 64 " 8679.0 2.67E+4 2.67E+4 325.0
H30 + 1024 LEF 0.0 0.0 -6.21 68.2
" 362 " 0.0 2031.0 1919.0 470.0
" 64 " 0.0 607.0 594.0 181.0
O2+ 1024 LEF 353.0 1570.0 1566.0 43.1
" 362 " 538.0 2304.0 2311.0 61.7
" 64 " 26.7 557.0 557.0 24.9
CO2 + 1024 LEF 0.0 556.0 555.0 36.5
" 362 " 0.0 329.0 342.0 26.0
" 64 " 0.0 53.8 55.2 11.4
CO + 1024 LEF 0.0 1.85 5.2 12.4
" 362 " 0.0 7.5 5.25 13.6
" 64 " 0.0 3.23 3.96 6.67
36

7. Summary and Conclusion
We have presented a model of the sputtered
atmospheres for Dione and Enceladus where for
simplicity we assumed spherical symmetry. Wehave used the maximum source rate estimated
by Jurac et al. (2001) for both these bodies. Here
the dominant sputtered species is H20 with a
10% contribution from O_, I--I2, C() 2 and NH 3. Inthe case of Dione and Enceladus the maxh:num
neutral density at the surface is a few times 105
mol/cm 3 for H20 with the neutral density vary-
ing roughly like l/r 3 with distance from the
satellite near the body and I/F far from the
body. A measurement of tile radial variation of
tile neutral density can provide information
about the energy spectrum of the sputtered
neutrals (i.e., determine parameter U). By
measuring the height dependence of the pickup
ion densities one can reconstruct the height
dependence of the neutrals. We also speculated
about the possibility of a gravitationally bound
atmosphere of O 3 and O2 because of the detec-tion of ozone at Dione (Noll et al., 1997). This
atmosphere, if present, would be considerab01y
denser than that estimated for a sputtered atmo-
sphere and pickup ion densities could be domi-
nated by O2+ and O3+. One could readily detect
the presence of Argon 40 as radioactive decay
product which would also be gravitationally
bound to Dione and Enceladus, respectively.
We computed the pickup ion densities as a
function of height by assuming a weak interac-
tion between the magnetosphere of Saturn and
tile icy satellites atmosphere. We also assumed a
fluid approximation and neglected finite gyro-
radius effects which was substantiated by the
smallness of the ion gyro-radius for pickup
water ions with respect to the satellite radius. In
both cases water ions dominated the pickup ion
density reaching peak values of 1.0 mol/cln 3 and
2.2 mol/cm _ for Dione mid Enceladus, respec-
tively. For a wake pass at the surface of Dione in
order of most abundant we have 02 +, OH +, CO2 +,
H +, H:_O+, NH3+, O +, H2+ and NH2+. In the case ofEnceladus we have in the order of most abun-
dant at the surface Oe+, H_O +, OH +, NH3+ and
CO2 +. At much lower abundance we have NH2+,
H +, O + and He+.
We used the pickup ion densities at the surface
to compute the ring distributions that would
result and plotted them as a function of E/Q and
angle in Saturn's equatorial plane. These simula-
tions showed the high degree of detection for the
pickup ions, even when the densities were low.
This is because the pickup ions obey a delta
function velocity distribution which translales
into a high concentration of tile ions in phase
space. The flux peaks at twice the pickup veloc-
ity. We used these results to show the energy-
mlgle coverage provided by CAPS gives us
ability to resolve the pickup ion distributions
from the ambient plasma ions. The energy-pitch
angle dependence of the pickup ions is consider-
ably different from that of the ambient ions
which obey convected Maxwellians.
We also computed simulated energy-TOF
spectrograms for the Dione flyby and the
Enceladus flyby. This data is referred to as B
cycle data (see Young et al. (2000)) and isaccumulated over several thousand kilometers
and thus provide no spatial resolution of theencounter. The simulations showed that the ST
data could be used to separate most of the ions
observed by CAPS but with considerable uncer-
tainty for some of the minor water group ions,
N + and NH3+. The other ions H +, He+, Oe+ and
CO2 + were well resolved by the CAPS ST data.While, the LEF data allowed us to resolve tile
water group ions, N + and NH3+. In the case of
CO2 +the LEF data was preferred since it gave a
unique identification of CO2 +, The same can be
said lk-_rO2+ and uniquely separating from S+.
The LEF data also provides tile potential for
uniquely detecting CO + or N2+. Therefore, when
we detect different ion species for high spatial,
energy and angle resolution we will use a
combination of ST and LEF data to make the
ion identification. This will be done by binning
the ions over specified intervals of TOF and
then applying the SAM algorithm. For the B
cycle data we will be able to analyze the energy-
TOF spectrogralns with the maxinmm resolution
37

inTOFandspeciesandto detectveryminorpickupspeciessuchasH2+.
In conclusion,CAPSprovidesauniquecapabil-ity indeterminingthecompositionof thesur-facesof theicy satellitesof Saturn(seeJohnsonandSittler,1990).OursimulationshaveshownCAPSability to detectthevariousion specieswell abovebackgroundin mostcases,andthusinferthebulkcompositionof theicy satellites.Oursimulationshavenot includedbackgroundeffects,butis notexpectedtobeimportantinmostcases;at mostit will just raisetheuncer-taintyin ourdeterminations.Thebackgroundcouldbeashighas1%.thepeakcountrateofthedominantspeciesattheenergythedominantspeciesismeasured.Thebackgroundwill tendto beflat inTOl.'with anincreasetowardsmallerTOF.Thesecorrections,whicharealsoa/'unction of the penetrating radiation flux, will beincluded under real measurement conditions.
For example, if the dominant ion has a peak
count of 105 and the background is 1% or 10 :_
counts, then the uncertainty due to background
3 (Here we note that thiswill be ,0 counts.
background is primarily caused by the scattering
of ions as they pass through the carbon foil of
the spectrometer and their accidental detection
by the start detectors.) With regard to back-
ground corrections they will be more severe forEnceladus than Dione because the radiation belt
intensities are greater at Enceladus; the back-
ground is made worse by penetrating radiation
as demonstrated by the Cassini Earth flyby data.
Then the background could be more than a few
percent. At present we are analyzing the back-
ground corrections due to pentrating radiation
using the Earth flyby data. We also emphasize,
because of background corrections, that if wewant to detect minor ions which could be around
the few % level relative to (2)"-such as NH3+ will
be very difficult to detect for an upstream pass
while possible for a wake pass. In the case of
NH3+ we must use LEF data which has a sensi-
tivity a factor of 10 less than ST data. We have
also argued that the closer the spacecraft en-
counters the moon the better, in order to mini-
mize the diluting effect of scattering which will
make the ion detection more difficult. A rough
calculation indicates that pitch angle scattering
of 5ce will dilute the pickup ions by a factor of
2; here the pickup ions are confined centrifu-
gally. We do plan to dither the entrance collima-
tor above and below Saturn's equatorial plane to
look for scattering effects. Finally, our calcula-
tions with regard to the interaction are not self-consistent since we have assumed a weak
interaction; here we note the possibility for a
strong strength interaction at Dione, for which
we note the detection of ion cyclotron waves
centered on the L shell of Dione by Pioneer 11
and Voyager 1. These waves are consistent with
pickup ions such as the water group ions.
38

References
. Baragiola, R. A., R. Vidal, M. Shi, W.
Svendsen, J. Schou and D. Bahr,
Sputtering of ices, submitted to Scanning
Microscopy, 1999.
. Barbosa, D.D., Theory and observations of
electromagnetic ion cyclotron waves in
Saturn's inner magnetosphere, J.
Geophys. Res., 98, 9345, 1993.
. Bar-Nun, A., G Herman, and Yu Melker,
Ejection of H20, 02, H 2 and H from waterice by 0.5-6 keV H + and Ne + ion
bombardment, Surface science, 150, 143,
1985.
. Brown, R., et al., Visible Infrared Mapping
Spectrometer (VIMS) on Cassini, Space
Science Reviews, submitted, 2002.
. Fillius, W. and C. E. Mcllwain, Trapped
radiation belts of Saturn: First Look,
Science, 207, 425, 1980a.
. Fillius, W. and C. E. McIlwain, Very
energetic protons in Saturn's radiation
belt, J. Geophys. Res., 85, 5803, 1980b.
. Frank, L. A., B. G. Burek, K. L. Ackerson, J.
H. Wolfe and J. D. Mihalov, Plasmas in
Saturn's magnetosphere, J. Geophys.
Res., 85, 5695, 1980.
. Gumett, D., et al., Radio and Plasma Wave
Science Investigation for Cassini, Space
Science Reviews, submitted, C. T. Russell
Editor, 2002.
. Hall, D. T., P. D. Feldman, J. B. Holberg, M.
A. McGrath, Florescent hydroxyl
emissions from Saturn's ring atmosphere,
Science, 272, 516, 1996.
10. Hamilton, D. P and J. A. Bums, Origin of
Saturn's E ring: Self sustained, naturally,
Science, 264, 550, 1994.
11. Hanel, R. A., B. J. Conrath, F. M. Flasar, V
G Kunde, W. Maguire, J. C. Pearl, J. A.
Pirraglia, R. Samuelson, L. Hearth, M.
Allison, D. R Cruikshank, D. Gautier, P
Gierrasch, L. Horn, R. Koppany and C.
Ponnamperuma, Infrared observations of
the Saturnian system from Voyager 2,
Science, 212, 192, 1981.
12. Hanel, R. A., B. J. Conrath, F. M. Flasar, V.
G Kunde, W. Maguire, J. C. Pearl, J. A.
Pirraglia, R. Samuelson, D. P
Cruikshank, D. Gautier, P Gierrasch, L.
Horn, R. Koppany and C.
Ponnamperuma, Infrared observations of
the Saturnian system from Voyager 2,
Science, 215, 544, 1982.
13. Ip, W. H., On neutral cloud distributions in
the Saturnian magnetosphere, Icarus, 126,
42, 1997.
14. Johnson, R. E., M. K. Pospieszalska, E. C.
Sittler Jr., A. E Cheng, L. J. Lanzerotti,
and E. M. Sievka, The neutral cloud and
heavy ion inner torus at Saturn, Icarus,
77, 311, 1989.
15. Johnson, R. E., Energetic charged-particle
interactions with atmospheres and
surfaces, Springer-Verlag, Berlin, 1990.
16. Johnson, R. E., Sputtering and desorption
form icy surfaces. In: B. Schmitt, C.
deBergh (Eds.), Solar System Ices,
Kluwer, Netherlands, 303, 1998.
17. Johnson, R. E. and E. C. Sittler Jr., Sputter-
produced plasma as a measure of satellite
surface composition: The Cassini
mission, Geophys. Res. Lett., 17, 1629,1990.
18. Jurac, S., R. E. Johnson, J. D. Richardson
and C. Paranicas, Satellite sputtering in
Saturn's magnetosphere, Planetary and
Space Science, 49, 319, 2001..
39

19.
20.
21.
22.
23.
24.
25.
26.
27.
Kivelson,M. G.,J.Wamecke,L. JoyS.Bennett,K. K. Khurana,J.A.Linker,C.T.Russell,R. J.Walker,andC.Polanskey,Ganymede'smagnetosphere:Magnetometeroverview,J. Geophys.
Res.-Planets, 103, 19963, 1998.
Kivelson, M. G., K. K. Khurana, C. T.
Russell, M. Volwerk, R. J. Walker and C.
Zimmer, Science, 289, 1340, 2000.
Krimigis, S. M. and T. P. Armstrong, Two-
component proton spectra in the inner
Saturnian magnetosphere, Geophys. Res.
Lett., 9, 1143, 1982.
Krimigis, S. M., J. E Carbary, E. P. Keath,
T. P. Armstrong, L. J. Lanzerotti, and G.
Gloeckler, General characteristics of hot
plasma and energetic particles in the
Saturnian magnetosphere: Results from
the Voyager spacecraft, J. Geophys. Res.,
88, 8871, 1983.
Krimigis et al., Magnetospheric Imaging
Instrument on Cassini, Space Science
Reviews, submitted, 2002.
Kunde, V. G, et al., The Composition
Infrared Spectrometer (CIRS) Experiment
on Cassini, Exploring the Saturn System
in the Thermal Infrared, manuscript in
preparation, C. T. Russell Editor, 2002.
Lazarus, A. J. and R. L. McNutt Jr., Low
energy plasma ion observations in
Saturn's magnetosphere, J. Geophys.
Res., 88, 8831, 1983.
Lutz, B. L., C. de Bergh and T. Owen,
Titan: Discovery of carbon monoxide in
its atmosphere, Science, 220, 1374, 1983.
Ma, T.Z., D.A. gumett and C.K. Goertz,
Interpretation of electrostatic noise
observed by Voyager 1 in Titan's wake, J.
Geophys. Res., 92, 8595, 1987.
28. Maurice, S., E. C. Sittler Jr., J. E Cooper, B.
H. Mauk, M. Blanc, and R. S. Selesnick,
Comprehensive analysis of electron
observations at Saturn: Voyager 1 and 2,
J. Geophys. Res., 101, 15211, 1996.
29. McCord, T. B. et al., Organics and other
molecules in the surfaces of Ganymede
and Callisto, Science, 280, 1242, 1998.
30. Morrison, D., T. V Johnson, E. M.
Shoemaker, L. A. Soderblom, P Thomas,
J. Veverka and B. A. Smith, Satellites of
Saturn: Geological Perspective, Saturn,
edited by T. Gehrels and M. S. Matthews,
The University of Arizona Press, 1984.
31. Neubauer, F.M., D.A. Gumett, J.D. Scudder,
and R.E. Hartle, Titan's magnetospheric
interaction, Saturn, edited by T. Gehrels
and M. S. Matthews, University of
Arizona Press, 760, 1984.
32. Noll, K. S., T. Rousch, D. Cruikshank and
R. E. Johnson, Detection of ozone on
Saturn's satellites Dione and Rhea,
Nature, 388, 45, 1997.
33. Paranicas, C., A. F. Cheng, B. H. Mauk, E.
F. Keath, S. M. Krimigis, Evidence of a
source of energetic ions at Saturn, J.
Geophys. Res., 104, 17459, 1997.
34. Richardson, J. D., Thermal ions at Saturn:
Plasma parameters and implications, J.
Geophys. Res., 91, 1381, 1986.
35. Richardson, J. D., A. Eviatar and G. L.
Siscoe, Satellite Tori at Saturn, J.
Geophys. Res., 91, 8749, 1986.
36. Richardson, J. D., A. Eviatar, M. A.
McGrath, and V. M. Vasyliunas, OH in
Saturn's magnetosphere: Observations
and implications, J. Geophys. Res., 103,
20245, 1998.
40

37.
38.
39.
40.
41
42.
43.
44.
45.
Richardson,J.D. andE.C. SittlerJr.,Aplasmadensitymodelfor SaturnbasedonVoyagerobservations,J. Geophys. Res.,
95, 12019, 1990.
Russell, C. T. and D. E. Huddleston, Ion-
cyclotron waves at Io, Planetary
ionospheres and magnetospheres, 26,
1505, 2000.
Russell, C. T., D. E. Huddleston, K. K.
Khurana and M. G. Kivelson, Planetary
ionospheres and magnetospheres, 26,
1489, 2000.
Samuelson, R. E., W. C. Maguire, R. A.
Hanel, V G. Kunde, D. E. Jennings, Y. L.
Yung, and A. C. Aikin, CO 2 on Titan, J.
Geophys. Res., 88, 8709, 1983.
Schardt, A. W. and F. B. McDonald, The
flux and source of energetic protons in
Saturn's inner magnetosphere, J.
Geophys. Res., 88, 8923, 1983.
Shemansky, D. E., P. Matherson, D. T. Hall,
H. Y. Hu and T. M. Tripp, Detection of
the hydroxyl radical in the Saturn
magnetosphere, Nature, 363, 329, 1993.
Shi, M., R. A. Baragiola, D. E. Grosjean, R.
E. Johnson, S. Jurac and J. Schou,
Sputtering of water ice surfaces and the
production of extended neutral
atmospheres, J. Geophys. Res., 100,
26387, 1995.
Sittler, E. C., Jr., K. W. Ogilvie and J. D.
Scudder, Survey of low energy plasma
electrons in Saturn's magnetosphere:
Voyager 1 and 2, J. Geophys. Res., 88,
8847, 1983.
Sittler, E.C., Jr., Real-time spectral analysis
algorithm for space plasma three-
dimension ion mass spectrometers, Rev.
Sci. Instr., 64, 2771, 1993.
46. Smith, E.J. and B. T. Tsurutani, Saturn's
magnetosphere: Observations of ion
cyclotron waves near the Dione L shell, J.
Geophys. Res., 88, 7831, 1983.
47. Stevenson, D.J., Volcanism and igneous
processes in small icy satellites, Nature,
298, 142, 1982.
48. Van Allen, J. A., Energetic particles in the
inner magnetosphere of Saturn, Saturn,
edited by T. Gehrels and M. S. Matthews,
The University of Arizona Press, 1984.
49. Vasyliunas, VM. and GL. Siscoe, On the
flux and the energy spectrum of
interstellar ions in the solar system, J.
Geophys. Res., 81, 1247, 1976.
50. Vogt, R. E., D. L. Chenette, A. C.
Cummings, T. L. Garrard, E. C. Stone, A.
W. Schardt, J. H. Trainor, N. Lal, and F.
B. McDonald, Energetic charged particles
in Saturn's magnetosphere: Voyager 1
results, Science, 212, 231, 1981.
51. Vogt, R. E., D. L. Chenette, A. C.
Cummings, T. L. Garrard, E. C. Stone, A.
W. Schardt, J. H. Trainor, N. Lal, and F.
B. McDonald, Energetic charged particles
in Saturn's magnetosphere: Voyager 2
results, Science, 215, 577, 1982.
52. Young, D. T., et al., Cassini Plasma
Spectrometer Investigation, Space
Science Reviews, submitted, C. T. Russell
Editor, 2002.
53. Zimmer, C., K. K. Khurana and M. G.
Kivelson, Subsurface oceans on Europaand Callisto: Constraints from Galileo
magnetometer observations, Icarus, 147,
329, 2000.
41

REPORT DOCUMENTATION PAGE 1Public reporting burden for this collection of information is estirnated to average 1 flour per response, inckldirlg the time for reviewing instructions, searching existing data sources,gathering and maintaining the data needed and completing and reviewing the collection of informatiorl. Send comments regarding this burden estimate or any other aspect of thiscollection of informatiorl, including suggestions for reducing this burden, to Washington Headquarters Services, Directorate for Informatiorl Operations and Reports, 1215 JeffersonDavis Highway, Suite 1204, Arlington, VA 22202-4302, and to the Office of Management and Budget, Paperwork Reduction Project (070,1-0188), Washington, DO 20503.
1. AGENCY USE OINLY (Leave blank) 2. REPORT DATE 3. REPORT TYPE AND DATES COVERED
Au._ust 2002 Technical Memorandum4, TITLE AND SUBTITLE 5. FUNDING NUMBERS
Pickup Ions at Dione and EnceladusCode 692
6. AUTHOR(S)
E. Sittler, R.E. Johnson, S. Jurac, J. Richardson,
M. McGrath, I:. Crary, D. "_ung, and J.E. Nordholt
7. PERFORMING ORGANIZATION NAME(S) AND ADDRESS (ES) 8. PEFORMING ORGANIZATIONREPORT NUMBER
2002-03030-0Goddard Space Flight Center
Greenbelt, Maryland 20771
9. SPONSORING / MONITORING AGENCY NAME(S) AND ADDRESS (ES) 10. SPONSORING / MONITORINGAGENCY REPORT NUMBER
National Aeronautics and Space AdministrationWashington, DC 20546-0001 TM---2002---211612
11. SUPPLEMENTARY NOTES
R.E. Johnson, University of Virginia, Charlottsville, VA: S. Jurac, J. Richardson, Massachusetts Institute of Tech-
nology, Cambridge, MA; M. McGrath, Space Telescope Institute, Baltimore, MD; E Crary, D. Young,UniversityMichi_an. Ann Arb(}r. M1: J.E. N(_rdh(H 1.1 ,(+sA1arn(_s Nail(real I ,ab(_rat(_rv. NI_
12a. DISTF_iBUTION / AVAILABILITY STATEMENT 12b, DISTRIBUTION CODE
Unclassified-Unlimited
Subject Category: 91
Report available from the NASA Center tOT AeroSpace Infotwnation,
7121 Standard Drive, Hanover, MD 21076-1320. (301) 621-0390.
13. ABSTRACT (Maxirnum200 wo_ds)Voyager images of the icy satellites of Saturn, Dione and Enceladus, suggest they have been geologic_ly active and are notonly composed of ice. Recent observations by liST have shown the presence of ozone at both Dione and Rhea which alsoimplies the presence of molecular oxygen at these bodies. The Cassini Plasma Spectrometer (CAPS) will provide the capabilil
to determine the global composition of these bodies by measuring the pickup ions produced by the ionization of their sputterproduced atmospheres. We will present a model of these atmospheres and associated pickup ions and demonstrate CAPS abili
to distinguish the tYeshly produced picked up ions from the ambient plasma. Such ions are expected to form a ring distributiorthat will have a uniquely different energy-angle dependence thma the ambient plasma ions. In the case of Dione we expect the
potential tbr a moderate strength interaction for which both Voyager 1 and Pioneer 11 spacecraft measured ion cyclotron way(
centered on the Dione L shell and near the equatorial plane. Since Enceladus may be the source of the E-ring, some surprisesmay be encountered during its close encounter with the Cassini spacecratl. In the case of Dione we will show that a wake pas_
at 500 km _titude is more than an order of magnitude better than an upstream pass at 500 km altitude. Pickup ion detection fc
manor ion species such as NIt,_ + is possible for 500 km altitude w_e pass but not for _500 km altitude upstream pass at
closest approach. For navigation reasons a 100 km pass is not allowed and therefore it is essential to have a wake pass tomaximize the science return for a targemd flyby with Dione. The CAPS observations when combined with magnetometer,plasma wave and energetic particle observations will allow us to estimale the source of ions into Saturrfs magnetosphere due
these two bodies and to characterize the nature of the interaction with Saturn's magnetosphere.
14. SUBJECT TERMS 15, NUMBER OF PAGES
42
Dione, Enceladus, Cassini Plasma Spectrometer (CAPS), Cassini, Saturn 16, PRICECODE
17, SECURITY CLASSIFICATION 18. SECURITY CLASSIFICATION 19. SECURITY CLASSIFICATION 20. LIMITATION OF ABSTRACTOF REPORT OF THIS PAGE OF ABSTRACT
Unclassified Unclassified Unclassified UL
NSN 7540-01-280-5500 Standard Form 298 (Rev. 2-89)Prescribed by ANSI Std. Z39.18298-102
