pi-swirl: a new technique for measuring wind blown …nas.cgrer.uiowa.edu/icartt/seminars and...
TRANSCRIPT

PI-SWIRL: A New Technique for Measuring
Wind Blown Dust Emission Potential
Vic Etyemezian, Sean Ahonen, John Gillies, Hampden Kuhns, Hans Moosmüller, Djordje Nikolic
DRI, Las Vegas, NV 89119
and
Marc PitchfordNOAA, Las Vegas, NV 89119

Sources of Windblown Dust
• Windblown dust – Vacant lands: Human disturbance makes it worse– Storage Piles– Construction sites
• Windblown Dust Requires wind– Emission Factor = where N is # disturbances/yr
– e.g. AP-42
∑=
N
iiPk
1
( ) ( )**2** 2558 tt uuuuP −+−=

Mechanisms of Windblown Dust Suspension
• “Creep”v0.5 - 2 mm particles roll due to pressure differential
• “Saltation”v0.1 - 0.5 mm particles suspended, travel parallel to
ground 1-5 m, re-impactvCause release of additional particles
• “Emission”v0.001 - 0.1 mm particles suspended and transported
between 10 – 10,000 m

USDA-ARS Wind Erosion Research Unit http://www.weru.ksu.edu/vids
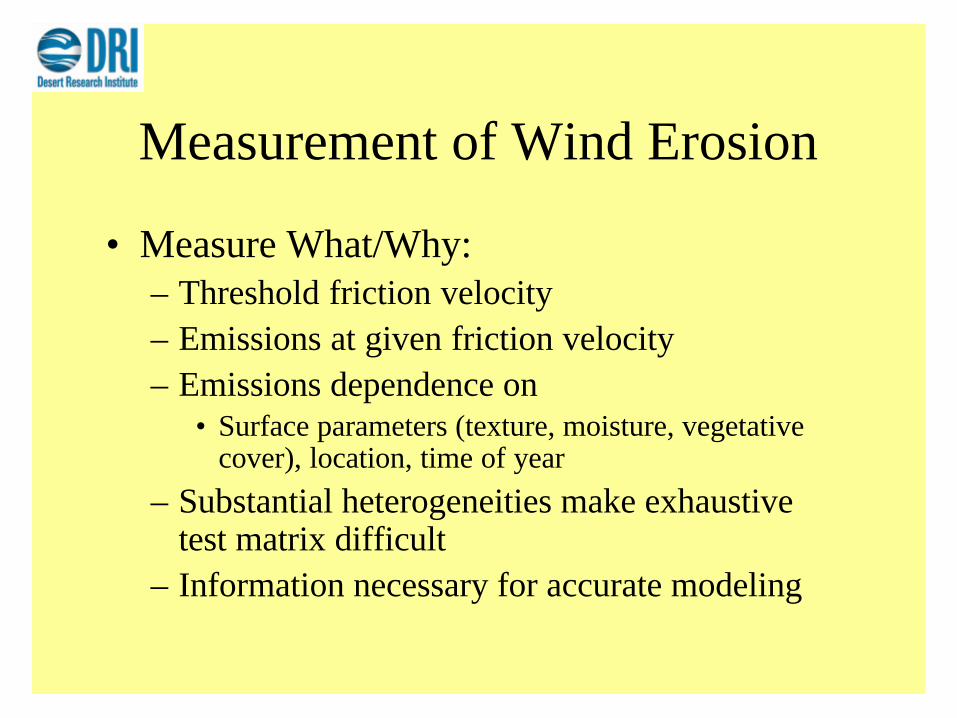
Measurement of Wind Erosion
• Measure What/Why:– Threshold friction velocity– Emissions at given friction velocity– Emissions dependence on
• Surface parameters (texture, moisture, vegetative cover), location, time of year
– Substantial heterogeneities make exhaustive test matrix difficult
– Information necessary for accurate modeling

In-Situ Surface Stability Tests• Several Alternatives
– Large Wind Tunnel (LWT): Probably best method, but requires ~10-30 man hours per sample location
– Small Wind Tunnel (SWT): Less accurate than LWT, but requires less time
– PI-SWIRL: Comparable to Small Wind Tunnel; requires ~10 minutes per sample; potentially man-portable
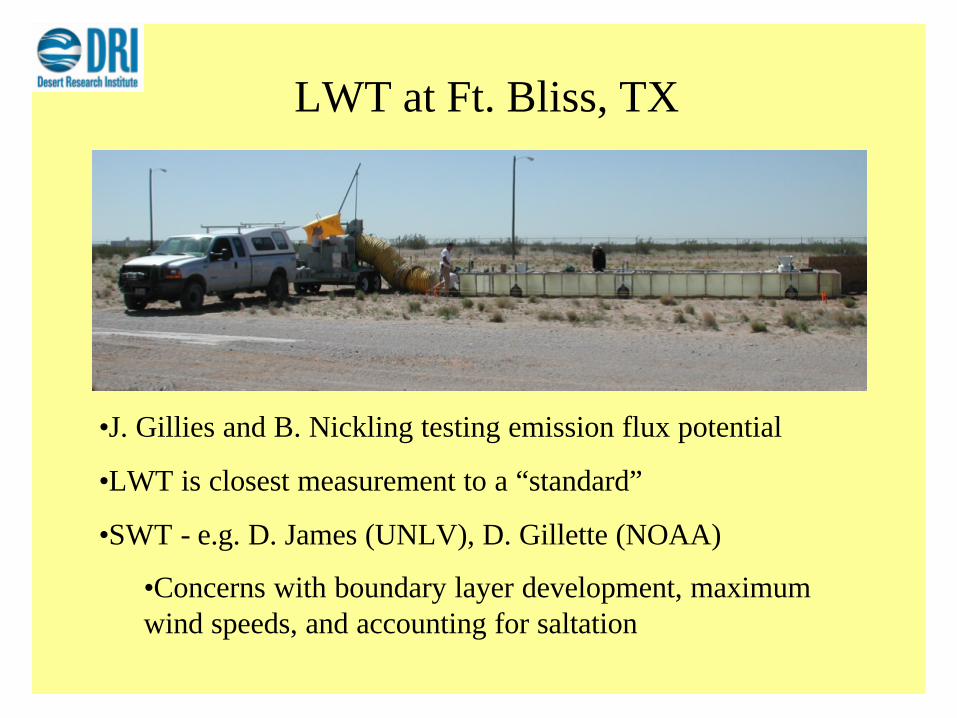
LWT at Ft. Bliss, TX
•J. Gillies and B. Nickling testing emission flux potential
•LWT is closest measurement to a “standard”
•SWT - e.g. D. James (UNLV), D. Gillette (NOAA)
•Concerns with boundary layer development, maximum wind speeds, and accounting for saltation

Portable In-Situ Wind Erosion Laboratory:The PI-SWIRL concept
Philosophy: Don’t try to simulate atmospheric flow, instead simulate shear stress experienced by soil surface (i.e. u*)
Plate moving with respect to ground
Ground
Velocity gradient results in shear at ground, suspending loose particles
Plate moving with respect to ground
Ground
Velocity gradient results in shear at ground, suspending loose particles

PI-SWIRL Schematic
Side View Bottom View
Computer Controller/ Data System PM Monitor
Sample Tube
Open-bottomed Cylindrical Chamber
Variable Speed Motor
Annular Ring
60 cm
40 cm
Side View Bottom View
Computer Controller/ Data System PM Monitor
Sample Tube
Open-bottomed Cylindrical Chamber
Variable Speed Motor
Annular Ring
Side View Bottom View
Computer Controller/ Data System PM Monitor
Sample Tube
Open-bottomed Cylindrical Chamber
Variable Speed Motor
Annular Ring
60 cm
40 cm
Blower for clean air injection

PI-SWIRL v.2

Wind Vectors in PI-SWIRL
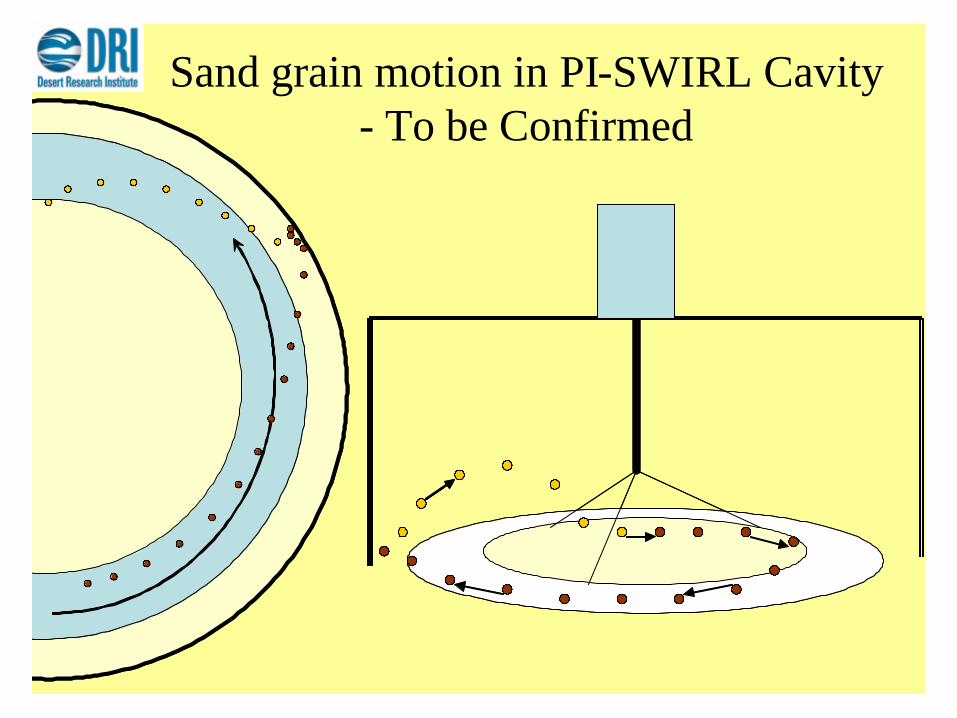
Sand grain motion in PI-SWIRL Cavity - To be Confirmed
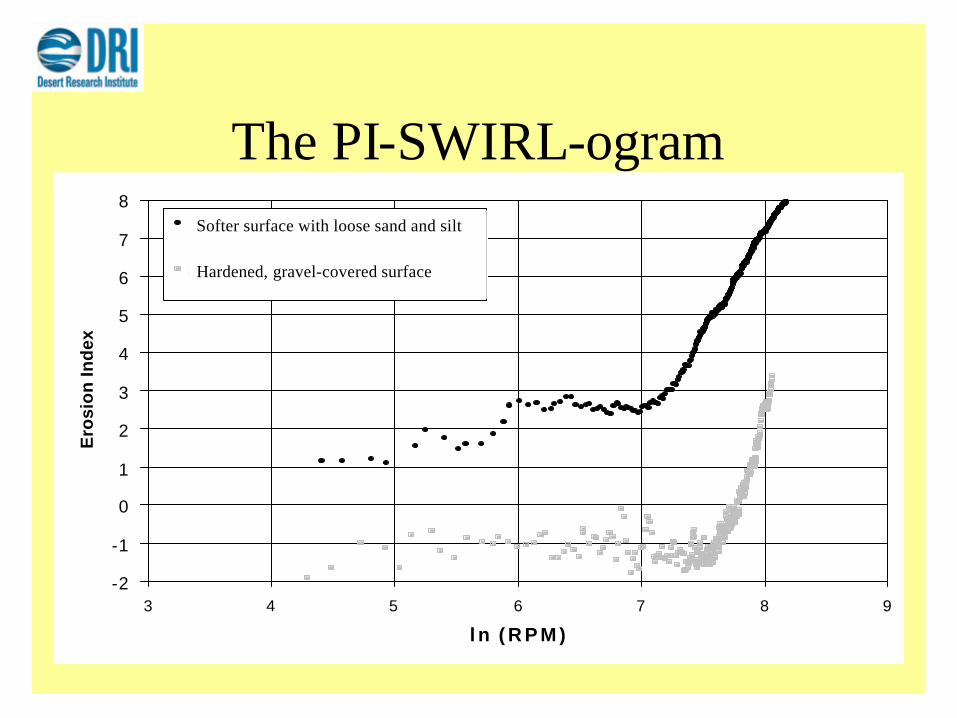
The PI-SWIRL-ogram
-2
-1
0
1
2
3
4
5
6
7
8
3 4 5 6 7 8 9
l n ( R P M )
Ero
sio
n In
dex
Hardened gravel -coveredsur faceSofet r sur face wi th loose sandand si l tSofter
Softer surface with loose sand and silt
Hardened, gravel-covered surface

PI-SWIRL-ogram Parts
-4
-2
0
2
4
6
8
10
3 4 5 6 7 8 9
ln (RPM)
Em
issi
on
Ind
ex
11:13:55
11:14:38
11:15:22
11:16:05
11:16:48
11:17:31
11:18:14
11:18:58
11:19:41
11:20:24
Tim
e
Emission Index vs. RPM (Left Axis)Ln (RPM) vs. Time (right axis)
Loose, suspendable PM10
Moderately Unstable “Puffs” region
Heavy saltation-like emission mode

PI-SWIRL: Advantages/Disadvantages
• Advantages: – Fast, semi-portable, measures index based on shear stress– Symmetry bypasses boundary layer issue– Geometry allows simulation of “saltation-like” emissions
• Disadvantage: At present – relative standard– calibrate against LWT?– characterize shear stresses distribution with
• Internal sensors?• Modeling?
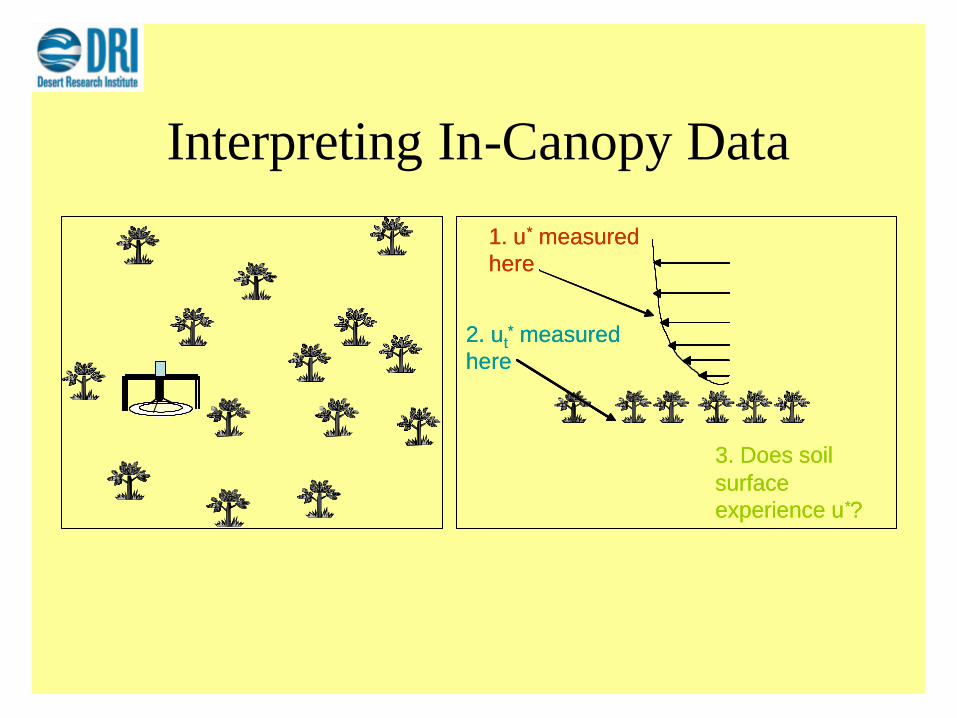
Interpreting In-Canopy Data
1. u* measured here
2. ut* measured
here
3. Does soil surface experience u*?
1. u* measured here
2. ut* measured
here
3. Does soil surface experience u*?

SWIRLER: Future priorities1. Characterize shear stresses/flow as f (RPM)2. Establish equivalent emission factors3. Investigate importance of dimensions
a. Does height have effect on measurement?b. Should rotor blade be wider/narrower?c. How small can you go without losing physics?
4. Establish equivalent u*t for in-canopy work
5. Replace DustTrak with rugged light-based measure

Thank you
• DRI• Encapco Inc – NTS Soil Stabilization