pi rads v2 - cdi · 1 pi‐rads v2 prostate imaging and reporting and data system: version 2...
TRANSCRIPT

1
PI‐RADS v2 Prostate Imaging and Reporting and Data System: Version 2
INTRODUCTION
SECTION I Clinical Considerations and Technical Specifications
SECTTION II Normal Anatomy and Benign Findings
SECTION III Assessment and Reporting
SECTION IV Multiparametric MRI (mpMRI)
SECTION V Staging
APPENDIX I Report Templates
APPENDIX II Sector Map
APPENDIX III Lexicon
APPENDIX IV Sample Protocols
APPENDIX V Atlas
REFERENCES
INTRODUCTION
Magnetic Resonance Imaging (MRI) has been used for noninvasive assessment of the prostate
gland and surrounding structures since the 1980s. Initially, prostate MRI was based solely on
morphologic assessment using T1‐weighted (T1W) and T2‐weighted (T2W) pulse sequences,

2
and its role was primarily for locoregional staging in patients with biopsy proven cancer.
However, it provided limited capability to distinguish benign pathological tissue and clinically
insignificant prostate cancer from significant cancer.
Advances in technology (both in software and hardware) have led to the development of
multiparametric MRI (mpMRI), which combines anatomic T2W with functional and physiologic
assessment, including diffusion‐weighted imaging (DWI) and its derivative apparent‐diffusion
coefficient (ADC) maps, dynamic contrast‐enhanced (DCE) MRI, and sometimes other
techniques such as in‐vivo MR proton spectroscopy. These technologic advances, combined
with a growing interpreter experience with mpMRI, have substantially improved diagnostic
capabilities for addressing the central challenges in prostate cancer care: 1) Improving
detection of clinically significant cancer, which is critical for reducing mortality; and 2)
Increasing confidence in benign diseases and dormant malignancies, which are not likely to
cause problems in a man’s lifetime, in order to reduce unnecessary biopsies and treatment.
Consequently, clinical applications of prostate MRI have expanded to include, not only
locoregional staging, but also tumor detection, localization (registration against an anatomical
reference), characterization, risk stratification, surveillance, assessment of suspected
recurrence, and image guidance for biopsy, surgery, focal therapy and radiation therapy.
In 2007, recognizing an important evolving role for MRI in assessment of prostate cancer, the
AdMeTech Foundation organized the International Prostate MRI Working Group, which
brought together key leaders of academic research and industry. Based on deliberations by
this group, a research strategy was developed and a number of critical impediments to the
widespread acceptance and use of MRI were identified. Amongst these was excessive
variation in the performance, interpretation, and reporting of prostate MRI exams. A greater
level of standardization and consistency was recommended in order to facilitate multi‐center
clinical evaluation and implementation.
In response, the European Society of Urogenital Radiology (ESUR) drafted guidelines, including
a scoring system, for prostate MRI known as PI‐RADS version 1 (PI‐RADS v1). Since it was
published in 2012, PI‐RADS v1 has been validated in certain clinical and research scenarios.
However, experience has also revealed several limitations, in part due to rapid progress in the
field. In an effort to make PI‐RADS standardization more globally acceptable, the American
College of Radiology (ACR), ESUR and the AdMeTech Foundation established a Steering
Committee to build upon, update and improve upon the foundation of PI‐RADS v1. This effort
resulted in the development of PI‐RADS v2.
PI‐RADS v2 was developed by members of the PI‐RADS Steering Committee, several working
groups with international representation, and administrative support from the ACR using the
3
best available evidence and expert consensus opinion. It is designed to promote global
standardization and diminish variation in the acquisition, interpretation, and reporting of
prostate mpMRI examinations, and it is intended to be a “living” document that will evolve as
clinical experience and scientific data accrue. PI‐RADS v2 needs to be tested and validated for
specific research and clinical applications.
PI‐RADS v2 is designed to improve detection, localization, characterization, and risk
stratification in patients with suspected cancer in treatment naïve prostate glands. The overall
objective is to improve outcomes for patients. The specific aims are to:
Establish mimimum acceptable technical parameters for prostate mpMRI
Simplify and standardize the terminology and content of radiology reports
Facilitate the use of MRI data for targeted biopsy
Develop assessment categories that summarize levels of suspicion or risk and can be used to select patients for biopsies and management (e.g., observation strategy vs. immediate intervention)
Enable data collection and outcome monitoring
Educate radiologists on prostate MRI reporting and reduce variability in imaging interpretations
Enhance interdisciplinary communications with referring clinicians
PI‐RADS v2 is not a comprehensive prostate cancer diagnosis document and should be used in
conjunction with other current resources. For example, it does not address the use of MRI for
detection of suspected recurrent prostate cancer following therapy, progression during
surveillance, or the use of MRI for evaluation of other parts of the body (e.g. skeletal system)
that may be involved with prostate cancer. Furthermore, it does not elucidate or prescribe
optimal technical parameters; only those that should result in an acceptable mpMRI
examination.
The PI‐RADS Steering Committee strongly supports the continued development of promising
MRI methodologies for assessment of prostate cancer and local staging (e.g.nodal metastases)
utilizing novel and/or advanced research tools not included in PI‐RADS v2, such as in‐vivo MR
spectroscopic imaging (MRSI), diffusion tensor imaging (DTI), diffusional kurtosis imaging (DKI),
multiple b‐value assessment of fractional ADC, intravoxel incoherent motion (IVIM), blood
oxygenation level dependent (BOLD) imaging, intravenous ultra‐small superparamagnetic iron
oxide (USPIO) agents, and MR‐PET. Consideration will be given to incorporating them into
future versions of PI‐RADS as relevant data and experience become available.

4
Section I: Clinical Considerations and Technical Specifications
A. Clinical Considerations
1. Timing of MRI Following Prostate Biopsy
Hemorrhage, manifested as hyperintense signal on T1W, may be present in the
prostate gland, most commonly the peripheral zone (PZ) and seminal vesicles,
following systematic transrectal ultrasound‐guided systematic (TRUS) biopsy and may
confound mpMRI assessment. When there is evidence of hemorrhage in the PZ on MR
images, consideration may be given to postponing the MRI examination until a later
date when hemorrhage has resolved. However, this may not always be feasible or
necessary, and clinical practice may be modified as determined by individual
circumstances and available resources. Furthermore, if the MRI exam is performed
following a negative TRUS biopsy, the likelihood of clinically significant prostate cancer
at the site of post biopsy hemorrhage without a corresponding suspicious finding on
MRI is low. In this situation, a clinically significant cancer, if present, is likely to be in a
location other than that with blood products. Thus, the detection of clinically
significant cancer is not likely to be substantially compromised by post biopsy
hemorrhage, and there may be no need to delay MRI after prostate biopsy if the
primary purpose of the exam is to detect and characterize clinically significant cancer in
the gland.
However, post biopsy changes, including hemorrhage and inflammation, may adversely
affect the interpretation of prostate MRI for staging in some instances. Although these
changes may persist for many months, they tend to diminish over time, and an interval
of at least 6 weeks or longer between biopsy and MRI should be considered for staging.
2. Patient Preparation
At present, there is no consensus concerning all patient preparation issues.
To reduce motion artifact from bowel peristalsis, the use of an antispasmodic agent (e.g.
glucagon, scopolamine butylbromide, or sublingual hyoscyamine sulfate) may be
beneficial in some patients. However, in many others it is not necessary, and the
incremental cost and potential for adverse drug reactions should be taken into
consideration.
The presence of stool in the rectum may interfere with placement of an endorectal coil
(ERC). If an ERC is not used, the presence of air and/or stool in the rectum may induce
5
artifactual distortion that can compromise DWI quality. Thus, some type of minimal
preparation enema administered by the patient in the hours prior to the exam may be
beneficial. However, an enema may also promote peristalsis, resulting in increased
motion related artifacts in some instances.
The patient should evacuate the rectum, if possible, just prior to the MRI exam.
If an ERC is not used and the rectum contains air on the initial MR images, it may be
beneficial to perform the mpMRI exam with the patient in the prone position or to
decompress the rectum using suction through a small catheter.
Some recommend that patients refrain from ejaculation for three days prior to the MRI
exam in order to maintain maximum distention of the seminal vesicles. However, a
benefit for assessment of the prostate and seminal vesicles for clinically significant
cancer has not been firmly established.
3. Patient Information
The following information should be available to the radiologist at the time of MRI exam
performance and interpretation;
Recent serum prostate‐specific antigen (PSA) level and PSA history
Date and results of prostate biopsy, including number of cores, locations and Gleason
scores of positive biopsies (with % core involvement when available).
Other relevant clinical history, including digital rectal exam (DRE) findings, medications
(particularly in the setting of hormones/hormone ablation), prior prostate infections,
pelvic surgery, radiation therapy, and family history.
B. Technical Specifications
Prostate MRI acquisition protocols should always be tailored to specific patients, clinical
questions, management options, and MRI equipment, but T2W, DWI, and DCE should be
included in all exams. Unless the MRI exam is monitored and no findings suspicious for
clinically significant prostate cancer are detected, at least one pulse sequence should use a
field‐of‐view (FOV) that permits evaluation of pelvic lymph nodes to the level of the aortic
bifurcation. The supervising radiologist should be cognizant that superfluous or inappropriate
sequences unnecessarily increase exam time and discomfort, and this could negatively impact
patient acceptance and compliance.

6
The technologist performing the exam and/or supervising radiologist should monitor the scan for quality control. If image quality of a pulse sequence is compromised due to patient motion or other reason, measures should be taken to rectify the problem and the sequence should be repeated.
1. Magnetic Field Strength
The fundamental advantage of 3T compared with 1.5T lies in an increased signal‐to‐noise
ratio (SNR), which theoretically increases linearly with the static magnetic field. This may
be exploited to increase spatial resolution, temporal resolution, or both. Depending on
the pulse sequence and specifics of implementation, power deposition, artifacts related
to susceptibility, and signal heterogeneity could increase at 3T, and techniques that
mitigate these concerns may result in some increase in imaging time and/or decrease in
SNR. However, current state‐of‐the‐art 3T MRI scanners can successfully address these
issues, and most members of the PI‐RADS Steering Committee agree that the advantages
of 3T substantially outweigh these concerns.
There are many other factors that affect image quality besides magnetic field strength,
and both 1.5T and 3.0T can provide adequate and reliable diagnostic exams when
acquisition parameters are optimized and appropriate contemporary technology is
employed. Although prostate MRI at both 1.5 T and 3T has been well established, most
members of the PI‐RADS Steering Committee prefer, use, and recommend 3T for
prostate MRI. 1.5T should be considered when a patient has an implanted device that
has been determined to be MR conditional at 1.5T but not at 3T. 1.5T may also be
preferred when patients are safe to undergo MRI at 3T but the location of an implanted
device may result in artifact that could compromise image quality (e.g. bilateral metallic
hip prosthesis).
The recommendations in this document focus only on 3T and 1.5T MRI scanners since
they have been the ones used for clinical validation of mpMRI. Prostate mpMRI at lower
magnetic field strengths (<1.5T) is not recommended unless adequate peer reviewed
clinical validation becomes available.
2. Endorectal Coil (ERC)
When integrated with external (surface) phased array coils, endorectal coils (ERCs)
increase SNR in the prostate at any magnetic field strength. This may be particularly
7
valuable for high spatial resolution imaging used in cancer staging and for inherently
lower SNR sequences, such as DWI and high temporal resolution DCE.
ERCs can also be advantageous for larger patients where the SNR in the prostate may be
compromised using only external phased array RF coils. However, use of an ERC may
increase the cost and time of the examination, deform the gland, and introduce artifacts.
In addition, it may be uncomfortable for patients and increase their reluctance to
undergo MRI.
With some 1.5T MRI systems, especially older ones, use of an ERC is considered
indispensable for achieving the type of high resolution diagnostic quality imaging needed
for staging prostate cancer. At 3T without use of an ERC, image quality can be
comparable with that obtained at 1.5 T with an ERC, although direct comparison of both
strategies for cancer detection and/or staging is lacking. Importantly, there are many
technical factors other than the use of an ERC that influence SNR (e.g. receiver
bandwidth, coil design, efficiency of the RF chain), and some contemporary 1.5T scanners
that employ a relatively high number of external phased array coil elements and RF
channels (e.g. 16 or more) may be capable of achieving adequate SNR in many patients
without an ERC.
Credible satisfactory results have been obtained at both 1.5T and 3T without the use of
an ERC. Taking these factors into consideration as well as the variability of MRI
equipment available in clinical use, the PI‐RADS Steering Committee recommends that
supervising radiologists strive to optimize imaging protocols in order to obtain the best
and most consistent image quality possible with the MRI scanner used. However, cost,
availability, patient preference, and other considerations cannot be ignored.
If air is used to inflate the ERC balloon, it may introduce local magnetic field
inhomogeneity, resulting in distortion on DWI, especially at 3T. The extent to which
artifacts interfere with MRI interpretation will vary depending on specific pulse sequence
implementations, but they can be diminished using correct positioning of the ERC and
distention of the balloon with liquids (e.g. liquid perflurocarbon or barium suspension)
that will not result in susceptibility artifacts. When liquid is used for balloon distention,
all air should be carefully removed from the ERC balloon prior to placement. Solid, rigid
reusable ERCs that avoid the need for inflatable balloons and decrease gland distortion
have been developed.
3. Computer‐Aided Evaluation (CAE) Technology
8
Computer‐aided evaluation (CAE) technology using specialized software or a dedicated
workstation is not required for prostate mpMRI interpretation. However, CAE may
improve workflow (display, analysis, interpretation, reporting, and communication),
provide quantitative pharmacodynamic data, and enhance lesion detection and
discrimination performance for some radiologists, especially those with less experience
interpreting mpMRI exams. CAE can also facilitate integration of MRI data with some
forms of MR targeted biopsy systems.
Section II: Normal Anatomy and Benign Findings
A. Normal Anatomy
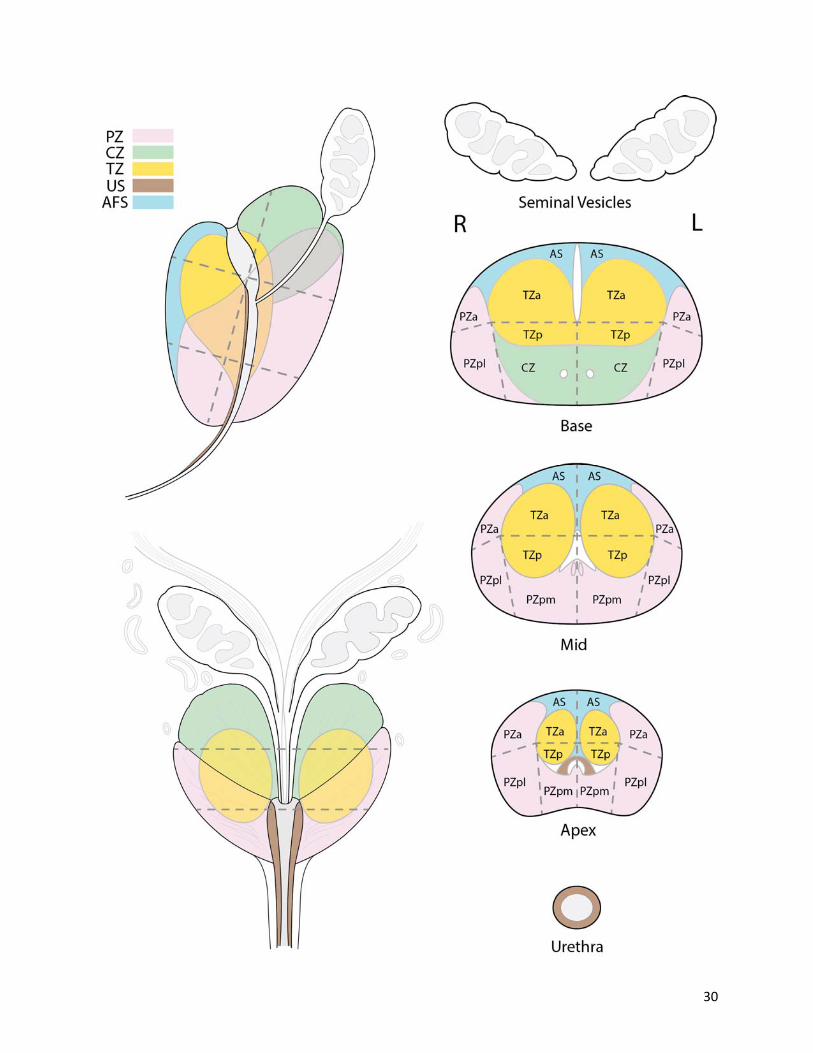
From superior to inferior, the prostate consists of the base (just below the urinary bladder),
the midgland, and the apex. It is divided into four histologic zones: (a) the anterior
fibromuscular stroma, contains no glandular tissue; (b) the transition zone (TZ), surrounding
the urethra proximal to the verumontanum, contains 5% of the glandular tissue; (c) the
central zone (CZ), surrounding the ejaculatory ducts, contains about 20% of the glandular
tissue; and (d) the outer peripheral zone (PZ), contains 70%–80% of the glandular tissue.
When benign prostatic hyperplasia (BPH) develops, the TZ will account for an increasing
percentage of the gland volume.
Approximately 70‐75% of prostate cancers originate in the PZ and 20‐30% in the TZ.
Cancers originating in the CZ are uncommon, and the cancers that occur in the CZ are
usually secondary to invasion by PZ tumors.
Based on location and differences in signal intensity on T2W images, the TZ can often be
distinguished from the CZ on MR images. However, in some patients, age‐related expansion
of the TZ by BPH may result in compression and displacement of the CZ. Use of the term
“central gland” to refer to the combination of TZ and CZ is discouraged as it is not reflective
of the zonal anatomy as visualized or reported on pathologic specimens.
A thin, dark rim partially surrounding the prostate on T2W is often referred to as the
“prostate capsule”. It serves as an important landmark for assessment of extraprostatic
extension of cancer. In fact, the prostate lacks a true capsule; rather it contains an outer
band of concentric fibromuscular tissue that is inseparable from prostatic stroma. It is
incomplete anteriorly and apically.

9
The prostatic pseudocapsule (sometimes referred to as the “surgical capsule”) on T2W MRI
is a thin, dark rim at the interface of the TZ with the PZ. There is no true capsule in this
location at histological evaluation, and this appearance is due to compressed prostate
tissue.
Nerves that supply the corpora cavernosa are intimately associated with arterial branches
from the inferior vesicle artery and accompanying veins that course posterolateral at 5 and
7 o'clock to the prostate bilaterally, and together they constitute the neurovascular
bundles. At the apex and base, small nerve branches surround the prostate periphery and
penetrate through the capsule, a potential route for extraprostatic extension (EPE) of
cancer.
B. Sector Map (Appendix II)
The segmentation model used in PI‐RADS v2 was adapted from a European Consensus
Meeting and the ESUR Prostate MRI Guidelines 2012. It employs thirty‐nine
sectors/regions: thirty‐six for the prostate, two for the seminal vesicles and one for the
external urethral sphincter.(Appendix II).
Use of the Sector Map will enable radiologists, urologists, pathologists, and others to
localize findings described in MRI reports, and it will be a valuable visual aid for discussions
with patients about biopsy and treatment options.
Division of the prostate and associated structures into sectors standardizes reporting and
facilitates precise localization for MR‐targeted biopsy and therapy, pathological correlation,
and research. Since relationships between tumor contours, glandular surface of the
prostate, and adjacent structures, such as neurovascular bundles, external urethral
sphincter, and bladder neck, are valuable information for periprostatic tissue sparing
surgery, the Sector Map may also provide a useful roadmap for surgical dissection at the
time of radical prostatectomy.
Either hardcopy (i.e. on paper) or electronic (i.e. on computer) recording on the Sector Map
is acceptable.
For information about the use of the Sector Map, see Section III and Appendix II
C. Benign Findings
Many signal abnormalities within the prostate are benign. The most common include;

10
1. Benign prostatic hyperplasia (BPH)
Benign prostatic hyperplasia (BPH) develops in response to testosterone, after it is
converted to di‐hydrotesosterone. BPH arises in the TZ, although exophytic and
extruded BPH nodules can be found in the PZ. BPH consists of a mixture of stromal and
glandular hyperplasia and may appear as band‐like areas and/or encapsulated round
nodules with circumscribed margins. Predominantly glandular BPH nodules and cystic
atrophy exhibit moderate‐marked T2 hyperintensity and are distinguished from
malignant tumors by their signal and capsule. Predominantly stromal nodules exhibit T2
hypointensity. Many BPH nodules demonstrate a mixture of signal intensities. BPH
nodules may be highly vascular on DCE and can demonstrate a range of signal intensities
on DWI.
Although BPH is a benign entity, it may have important clinical implications for biopsy
approach and therapy since it can increase gland volume, stretch the urethra, and
impede the flow of urine. Since BPH tissue produces prostate‐specific antigen (PSA),
accurate measurement of gland volume by MRI is an important metric to allow
correlation with an individual’s PSA level and to calculate the PSA density (PSA/prostate
volume).
2. Hemorrhage
Hemorrhage in the PZ and/or seminal vesicles is common after biopsy. It appears as
focal or diffuse hyperintense signal on T1W and iso‐hypointense signal on T2W.
However, chronic blood products may appear hypointense on all MR sequences.
3. Cysts
A variety of cysts can occur in the prostate and adjacent structures. As elsewhere in the
body, cysts in the prostate may contain “simple” fluid and appear markedly hyperintense
on T2W and dark on T1W. However, they can also contain blood products or
proteinaceous fluid, which may demonstrate a variety of signal characteristics, including
hyperintense signal on T1W.
4. Calcifications
Calcifications, if visible, appear as markedly hypointense foci on all pulse sequences
5. Prostatitis
11
Prostatitis affects many men, although it is often sub‐clinical. Pathologically, it presents
as an immune infiltrate, the character of which depends on the agent causing the
inflammation. On MRI, prostatitis can result in decreased signal in the PZ on both T2W
and the ADC (apparent diffusion coefficient) map. Prostatitis may also increase
perfusion, resulting in a “false positive” DCE result. However, the morphology is
commonly band‐like, wedge‐shaped, or diffuse rather than focal, round, oval, or
irregular, and the decrease in signal on the ADC map is generally not as great nor as focal
as in cancer.
6. Atrophy
Prostatic atrophy can occur as a normal part of aging or from chronic inflammation. It is
typically associated with wedge‐shaped areas of low signal on T2W and mildly decreased
signal on the ADC map from loss of glandular tissue. The ADC is generally not as low as in
cancer, and there is often contour retraction of the involved prostate.
7. Fibrosis
Prostatic fibrosis can occur after inflammation. It may be associated with wedge‐ or
band‐shaped areas of low signal on T2W.
Section III: Assessment and Reporting
A major objective of a prostate MRI exam is to identify and localize abnormalities that
correspond to clinically significant prostate cancer, and mpMRI is able to detect intermediate
to high grade cancers with volumes <5mm, depending on the location and background tissue
within the prostate gland. However, there is no universal agreement of the definition of
clinically significant prostate cancer.
In PI‐RADS v2, the definition of clinically significant cancer is intended to standardize reporting
of mpMRI exams and correlation with pathology for clinical and research applications. Based
on the current uses and capabilities of mpMRI and MRI‐targeted procedures, for PI‐RADS v2
clinically significant cancer is defined on pathology/histology as Gleason score > 7 (including
3+4 with prominent but not predominant Gleason 4 component), and/or volume > 0.5cc,
and/or extraprostatic extension (EPE).
PI‐RADS v2 assessment uses a 5‐point scale based on the likelihood (probability) that a
combination of mpMRI findings on T2W, DWI, and DCE correlates with the presence of a
clinically significant cancer for each lesion in the prostate gland.
12
PI‐RADS v2 Assessment Categories
PIRADS 1 – Very low (clinically significant cancer is highly unlikely to be present)
PIRADS 2 – Low (clinically significant cancer is unlikely to be present)
PIRADS 3 – Intermediate (the presence of clinically significant cancer is equivocal)
PIRADS 4 – High (clinically significant cancer is likely to be present)
PIRADS 5 – Very high (clinically significant cancer is highly likely to be present)
Assignment of a PI‐RADS v2 Assessment Category should be based on mpMRI findings only and
should not incorporate other factors such as serum prostate specific antigen (PSA), digital
rectal exam, clinical history, or choice of treatment. Although biopsy should be considered for
PIRADS 4 or 5, but not for PIRADS 1 or 2, PI‐RADS v2 does not include recommendations for
management, as these must take into account other factors besides the MRI findings,
including laboratory/clinical history and local preferences, expertise and standards of care.
Thus, for findings with PIRADS Assessment Category 2 or 3, biopsy may or may not be
appropriate, depending on factors other than mpMRI alone.
It is anticipated that, as evidence continues to accrue in the field of mpMRI and MRI‐targeted
biopsies and interventions, specific recommendations and/or algorithms regarding biopsy and
management will be included in future versions of PI‐RADS.
When T2W and DWI are of diagnostic quality, DCE plays a minor role in determining PIRADS
Assessment Category. Absence of early enhancement within a lesion usually adds little
information, and diffuse enhancement not localized to a specific T2W or DWI abnormality can
be seen in the setting of prostatitis. Moreover, DCE does not contribute to the overall
assessment when the finding has a low (PIRADS 1 or 2) or high (PIRADS 4 or 5) likelihood of
clinically significant cancer. However, when DWI is PIRADS 3 in the PZ, a positive DCE may
increase the likelihood that the finding corresponds to a clinically significant cancer and may
upgrade the Assessment Category to PIRADS 4.
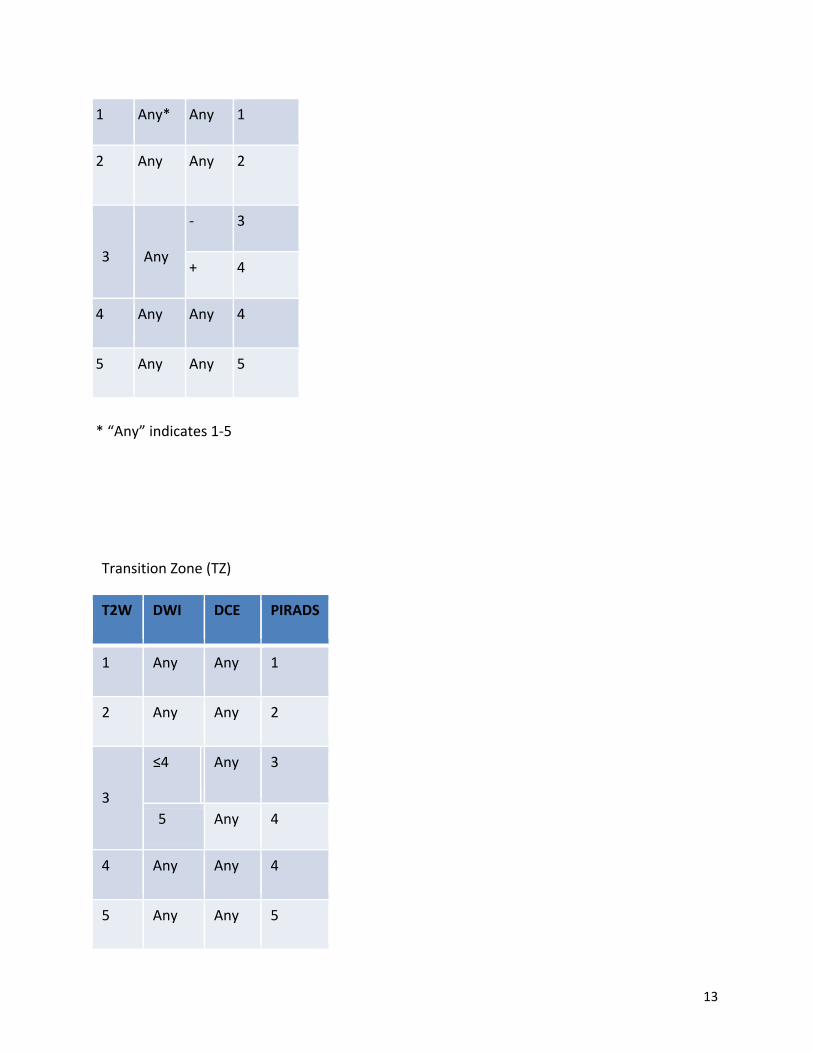
PI‐RADS Assessment
Peripheral Zone (PZ)
DWI T2W DCE PIRADS
13
1 Any* Any 1
2 Any Any 2
3
Any
‐ 3
+ 4
4 Any Any 4
5 Any Any 5
* “Any” indicates 1‐5
Transition Zone (TZ)
T2W DWI DCE PIRADS
1 Any Any 1
2 Any Any 2
3
≤4 Any 3
5 Any 4
4 Any Any 4
5 Any Any 5

14
A. Reporting (see Appendix I: Report Templates)
Measurement of the Prostate Gland
The volume of the prostate gland should always be reported. It may be determined using
manual or automated segmentation or calculated using the formula for a conventional prolate
ellipse;(maximum AP diameter) x (maximum transverse diameter) x (maximum longitudinal
diameter) x 0.52.
Prostate volume may also be useful to calculate PSA density (PSA/prostate volume).
Mapping Lesions
Prostate cancer is usually multifocal. The largest tumor focus usually yields the highest
Gleason score and is most likely to contribute to extraprostatic extension (EPE) and positive
surgical margins.
For PI‐RADS v2, up to four findings with a PIRADS Assessment Category of 3, 4, or 5 may each
be assigned on the Sector Map (Appendix II), and the index (dominant) intraprostatic lesion
should be identified. The index lesion is the one with the highest PIRADS Assessment
Category. If the highest PIRADS Assessment Category is assigned to two or more lesions, the
index lesion should be the one that shows EPE. Thus, a smaller lesion with EPE should be
defined as the index lesion despite the presence of a larger tumor with the identical PIRADS
Assessment Category. If none of the lesions demonstrate EPE, the largest of the tumors with
the highest PIRADS Assessment Category should be considered the index lesion.
If there are more than four suspicious findings, then only the four with the highest likelihood
of clinically significant cancer (i.e. highest PIRADS Assessment Category) should be reported.
There may be instances when it is appropriate to report more than four suspicious lesions.
Reporting of additional findings with PIRADS Assessment Category 2 or definitely benign
findings (e.g. cyst) is optional, but may be helpful to use as landmarks to guide subsequent
biopsy or for tracking lesions on subsequent mpMRI exams.
If a suspicious finding extends beyond the boundaries of one sector, all neighboring involved
sectors should be indicated on the Sector Map (as a single lesion).
Measurement of Lesions

15
With current techniques, mpMRI has been shown to underestimate both tumor volume and
tumor extent compared to histology, especially for Gleason grade 3. Furthermore, the most
appropriate imaging plane and pulse sequence for measuring lesion size on MRI has not been
definitely determined, and the significance of differences in lesion size on the various MRI
pulse sequences requires further investigation. In the face of these limitations, the PI‐RADS
Steering Committee nevertheless believes that standardization of measurements will facilitate
MR‐pathological correlation and research and recommends that the following rules be used
for measurements;
The minimum requirement is to report the largest dimension of a suspicious finding on an axial
image. If the largest dimension of a suspicious finding is on sagittal and/or coronal images, this
measurement and imaging plane should also be reported. If a lesion is not clearly delineated
on an axial image, report the measurement on the image which best depicts the finding.
Alternatively, if preferred, lesion volume may be determined using appropriate software, or
three dimensions of lesions may be measured so that lesion volume may be calculated (max a‐
p diameter x max l‐r diameter x max c‐c diameter x 0.52).
.
In the PZ, lesions should be measured on ADC.
In the TZ, lesions should be measured on T2W.
If lesion measurement is difficult or compromised on ADC (for PZ) or T2W (for TZ),
measurement should be made on the sequence that shows the lesion best.
In the mpMRI report, the image number(s)/series and sequence used for measurement should
be indicated.
Caveats for Overall Assessment
In order to facilitate correlation and synchronized scrolling when viewing, it is strongly
recommended that imaging plane angle, location, and slice thickness for all sequences
(T2W, DWI, and DCE) are identical.
Changes from prostatitis (including granulomatous prostatitis) can cause signal
abnormalities in the PZ with all pulse sequences. Morphology and signal intensity may
be helpful to stratify the likelihood of malignancy. In the PZ, mild signal changes on T2W
and/or DWI that are not rounded but rather indistinct, linear, lobar, or diffuse are less
likely to be malignant.
16
For the PZ, DWI is the primary determining sequence (dominant technique). Thus, if the
DWI score is 4 and T2W score is 2, PIRADS Assessment Category should be 4.
For the TZ, T2W is the primary determining sequence. Thus, if the T2W score is 4 and
DWI score is 2, PIRADS Assessment Category should be 4.
Since the dominant factors for PIRADS assessment are T2W for the TZ and DWI for the
PZ, identification of the zonal location of a lesion is vital. Areas where this may be
especially problematic include the interface of the CZ and PZ at the base of the gland
and the interface of the anterior horn of the PZ with TZ and anterior fibromuscular
stroma.
Currently, the capability of reliably detecting and characterizing clinically significant
prostate cancer with mpMRI in the TZ is less than that in the PZ
Homogeneous or heterogeneous nodules in the TZ that are round/oval, well‐
circumscribed, and encapsulated are common findings as men aged 40 and above.
Often, they demonstrate restricted diffusion and/or focal contrast enhancement, but
they are considered to be benign BPH. These do not have to be assigned a PIRADS
Assessment Category. Although such nodules may on occasion contain clinically
significant prostate cancer, the probability is very low.
Bilateral symmetric signal abnormalities on any sequence are often due to normal
anatomy or benign changes.
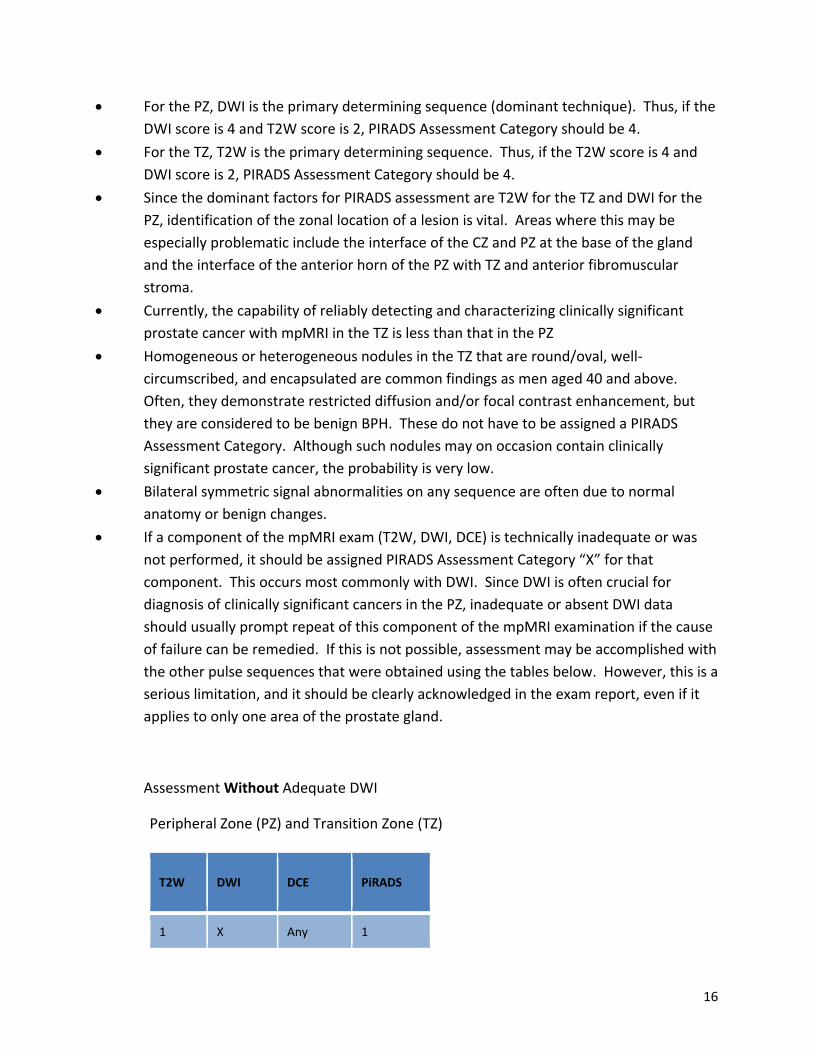
If a component of the mpMRI exam (T2W, DWI, DCE) is technically inadequate or was
not performed, it should be assigned PIRADS Assessment Category “X” for that
component. This occurs most commonly with DWI. Since DWI is often crucial for
diagnosis of clinically significant cancers in the PZ, inadequate or absent DWI data
should usually prompt repeat of this component of the mpMRI examination if the cause
of failure can be remedied. If this is not possible, assessment may be accomplished with
the other pulse sequences that were obtained using the tables below. However, this is a
serious limitation, and it should be clearly acknowledged in the exam report, even if it
applies to only one area of the prostate gland.
Assessment Without Adequate DWI
Peripheral Zone (PZ) and Transition Zone (TZ)
T2W DWI DCE PiRADS
1 X Any 1
17
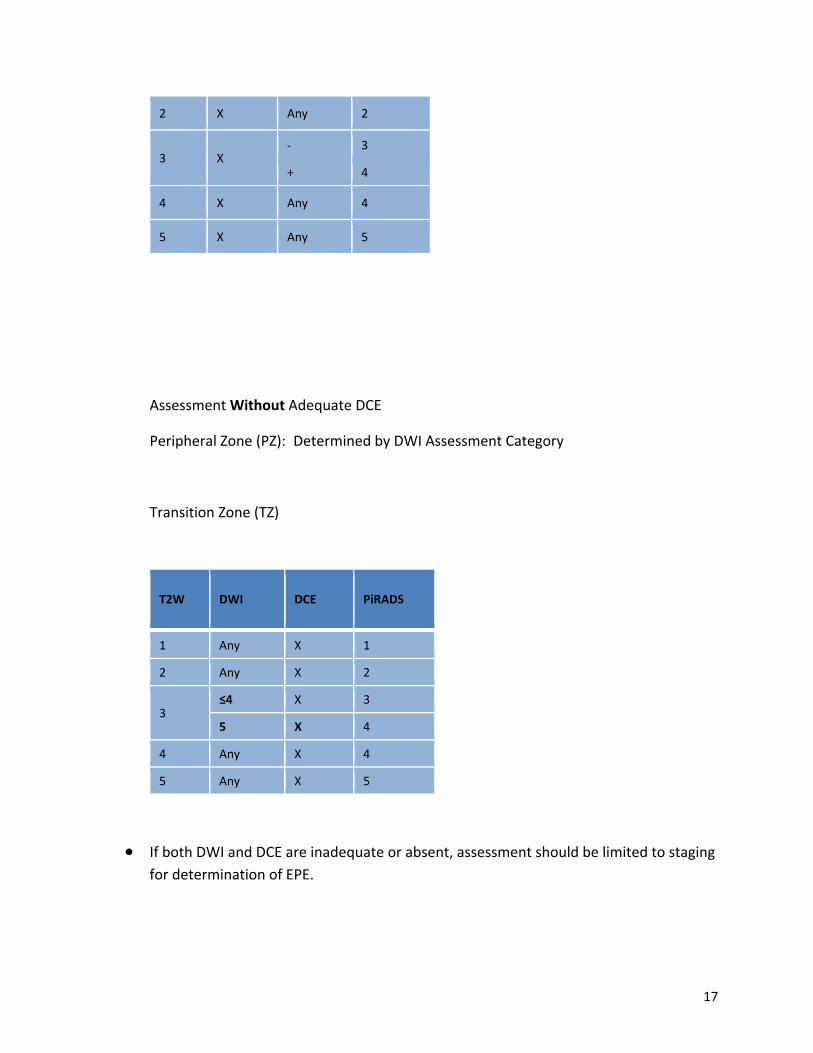
Assessment Without Adequate DCE
Peripheral Zone (PZ): Determined by DWI Assessment Category
Transition Zone (TZ)
If both DWI and DCE are inadequate or absent, assessment should be limited to staging
for determination of EPE.
2 X Any 2
3 X ‐ 3
+ 4
4 X Any 4
5 X Any 5
T2W DWI DCE PiRADS
1 Any X 1
2 Any X 2
3 ≤4 X 3
5 X 4
4 Any X 4
5 Any X 5
18
Section IV Multiparametric MRI (mpMRI)
A. T1‐Weighted (T1W) and T2‐Weighted (T2W)
Both T1W and T2W sequences should be obtained for all prostate MR exams. T1W
images are used primarily to determine the presence of hemorrhage within the prostate
and seminal vesicles and to delineate the outline of the gland. T1W images may also
useful for detection of nodal and skeletal metastases, especially following intravenous
administration of a gadolinium‐based contrast agent (GBCA).
T2W images are used to discern prostatic zonal anatomy, assess abnormalities within
the gland, and to evaluate for seminal vesicle invasion, EPE, and nodal involvement.
On T2W images, clinically significant cancers in the PZ usually appear as round or ill‐
defined hypointense focal lesions. However, this appearance is not specific and can be
seen in various conditions such as prostatitis, hemorrhage, glandular atrophy, benign
hyperplasia, biopsy related scars, and after therapy (hormone, ablation, etc.).
The T2W features of TZ tumors include non‐circumscribed homogeneous, moderately
hypointense lesions (“erased charcoal” or “smudgy fingerprint” appearance), spiculated
margins, lenticular shape, absence of a complete hypointense capsule, and invasion of
the urethral sphincter and anterior fibromuscular stroma. The more features present,
the higher the likelihood of a clinically significant TZ cancer.
TZ cancers may be difficult to identify on T2W images since the TZ is often composed of
variable amounts of glandular (T2‐hyperintense) and stromal (T2‐hypointense) tissue
intermixed with each other, thus demonstrating heterogeneous signal intensity. Areas
where benign stromal elements predominate may mimic or obscure clinically significant
cancer.
Both PZ and TZ cancers may extend across anatomical boundaries. Invasive behavior is
noted when there is extension within the gland (i.e. across regional parts of the
prostate), into the seminal vesicles, or outside the gland (EPE).
1. Technical Specifications
T2W
19
Multiplanar (axial, coronal, and sagittal) T2W images are usually obtained with 2D RARE
(rapid acquisition with relaxation enhancement) pulse sequences, more commonly
known as fast‐spin‐echo (FSE) or turbo‐spin‐echo (TSE). In order to avoid blurring,
excessive echo train lengths should be avoided.
o Slice thickness: 3mm, no gap. Locations should be the same as those used for
DWI and DCE
o FOV: generally 12‐20 cm to encompass the entire prostate gland and seminal
vesicles
o In plane dimension: ≤ 0.7mm (phase) x ≤0.4mm (frequency)
3D axial acquisitions may be used as an adjunct to 2D acquisitions. If acquired using
isotropic voxels, 3D acquisitions may be particularly useful for visualizing detailed
anatomy and distinguishing between genuine lesions and partial volume averaging
effects. However, the soft tissue contrast is not identical and in some cases may be
inferior to that seen on 2D T2W images, and the in‐plane resolution may be lower than
their 2D counterpart.
T1W
Axial T1W images of the prostate may be obtained with or without fat suppression using
spin echo or gradient echo sequences. Locations should be the same as those used for
DWI and DCE, although lower spatial resolution compared to T2W may be used to
decrease acquisition time or increase anatomic coverage.
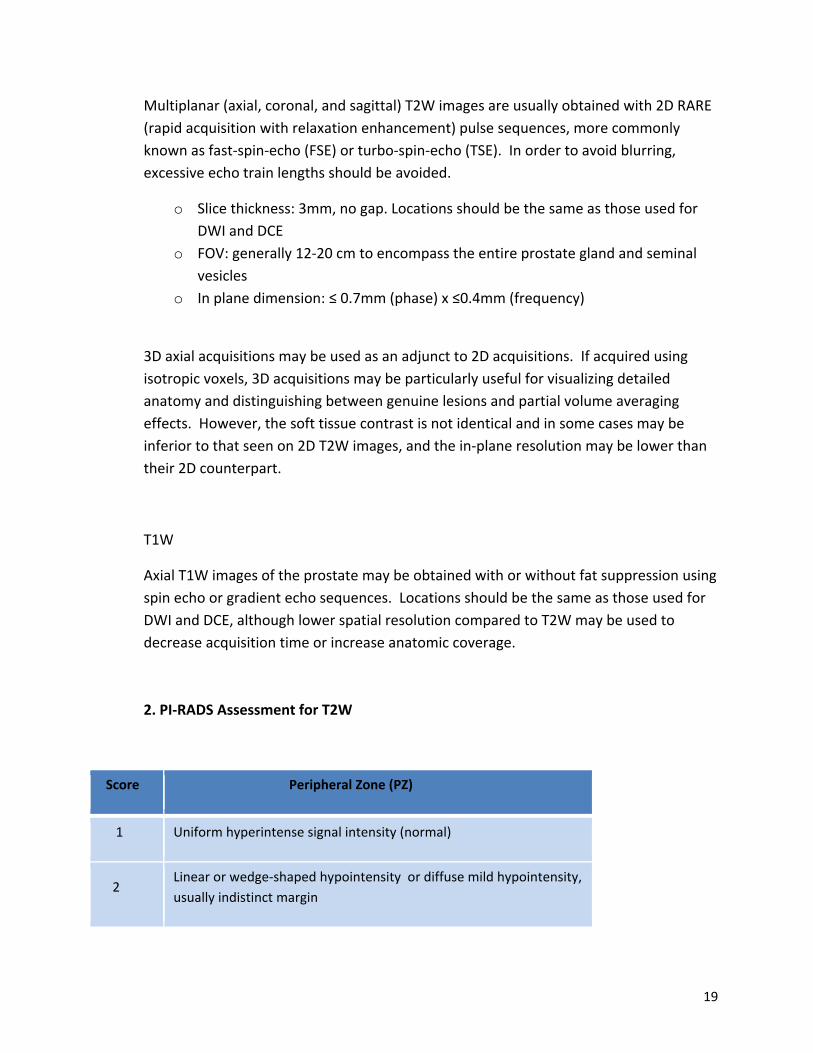
2. PI‐RADS Assessment for T2W
Score Peripheral Zone (PZ)
1 Uniform hyperintense signal intensity (normal)
2 Linear or wedge‐shaped hypointensity or diffuse mild hypointensity,
usually indistinct margin

20
3
Heterogeneous signal intensity or non‐circumscribed, rounded,
moderate hypointensity
Includes others that do not qualify as 2, 4, or 5
4 Circumscribed, homogenous moderate hypointense focus/mass
confined to prostate and <1.5 cm in greatest dimension
5 Same as 4 but ≥1.5cm in greatest dimension or definite
extraprostatic extension/invasive behavior
21
B. Diffusion‐Weighted Imaging (DWI)
Diffusion‐weighted imaging (DWI) reflects the random motion of water molecules and is
a key component of the prostate mpMRI exam. It should include an ADC map and high
b‐value images.
The ADC map is a display of ADC values for each voxel in an image. In most current
clinical implementations, it uses two or more b‐values and a monoexponential model of
signal decay with increasing b‐values to calculate ADC values. Most clinically significant
cancers have restricted/impeded diffusion compared to normal tissues and, thus,
appear hypointense on grey‐scale ADC maps. Although ADC values have been reported
to correlate inversely with histologic grades, there is considerable overlap between BPH,
low grade cancers, and high grade cancers. Furthermore, ADC calculations are
influenced by choice of b‐values and have been inconsistent across vendors. Thus,
qualitative visual assessment is often used as the primary method to assess ADC.
Nevertheless, ADC values, using a threshold of 750‐900 µm2/sec, may assist
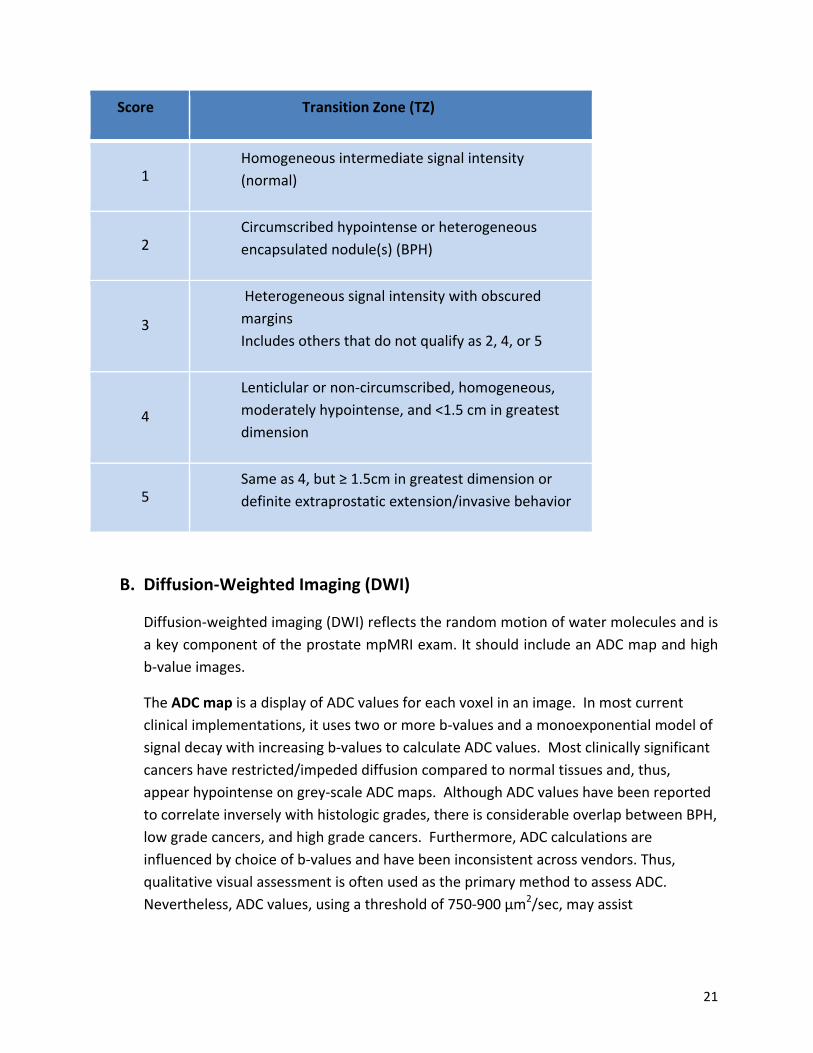
Score Transition Zone (TZ)
1 Homogeneous intermediate signal intensity
(normal)
2 Circumscribed hypointense or heterogeneous
encapsulated nodule(s) (BPH)
3
Heterogeneous signal intensity with obscured
margins
Includes others that do not qualify as 2, 4, or 5
4
Lenticlular or non‐circumscribed, homogeneous,
moderately hypointense, and <1.5 cm in greatest
dimension
5 Same as 4, but ≥ 1.5cm in greatest dimension or
definite extraprostatic extension/invasive behavior
22
differentiation between benign and malignant prostate tissues in the PZ, with ADC
values below the threshold correlating with clinically significant cancers. “High b‐value” images utilize a b‐value between >1400 sec/mm2. They display
preservation of signal in areas of restricted/impeded diffusion compared with normal
tissues, which demonstrate diminished signal due to greater diffusion between
application of gradients with different b‐values. Compared to ADC maps alone,
conspicuity of clinically significant cancers is sometimes improved on high b‐value
images, especially in those adjacent to or invading the anterior fibromuscular stroma, in
a subcapsular location, and at the apex and base of the gland. High b‐value images can
be obtained in one of two ways: either directly by acquiring a high b‐value DWI
sequence (requiring additional scan time), or by calculating (synthesizing) the high b‐
value image by extrapolation from the acquired lower b‐value data used to create the
ADC map (potentially less prone to artifacts because it avoids the longer TEs required to
accommodate the strong gradient pulses needed for high b‐value acquisitions). As the
b‐value increases, the signal‐to‐noise ratio (SNR) decreases, so that the optimum high b‐
value may be dependent on magnetic field strength, software, and manufacturer. Thus,
there is no currently widely accepted optimal “high b‐value”, but if adequate SNR
permits, b‐values of 1400‐ 2000 sec/mm2 or higher seem to be advantageous.
1. Technical Specifications
Free‐breathing spin echo EPI sequence combined with spectral fat saturation is recommended.
o TE: ≤ 90 msec; TR : > 3000 msec o Slice thickness: ≤4mm, no gap. Locations should match or be similar to those
used for T2W and DCE o FOV: 16‐22 cm o In plane dimension: ≤ 2.5mm phase and frequency
For ADC maps, if only two b‐values can be acquired due to time or scanner constraints,
it is preferred that the lowest b‐value should be set at 50‐100 sec/mm2 and the highest
should be 800‐1000 sec/mm2. Additional b‐values between 100 and 1000 may provide
more accurate ADC calculations and estimations of extrapolated high b‐value images
(>1400 sec/mm2).
Information regarding perfusion characteristics of tissues may be obtained with
additional b‐values ranging from 0 to 500 sec/mm2,
23
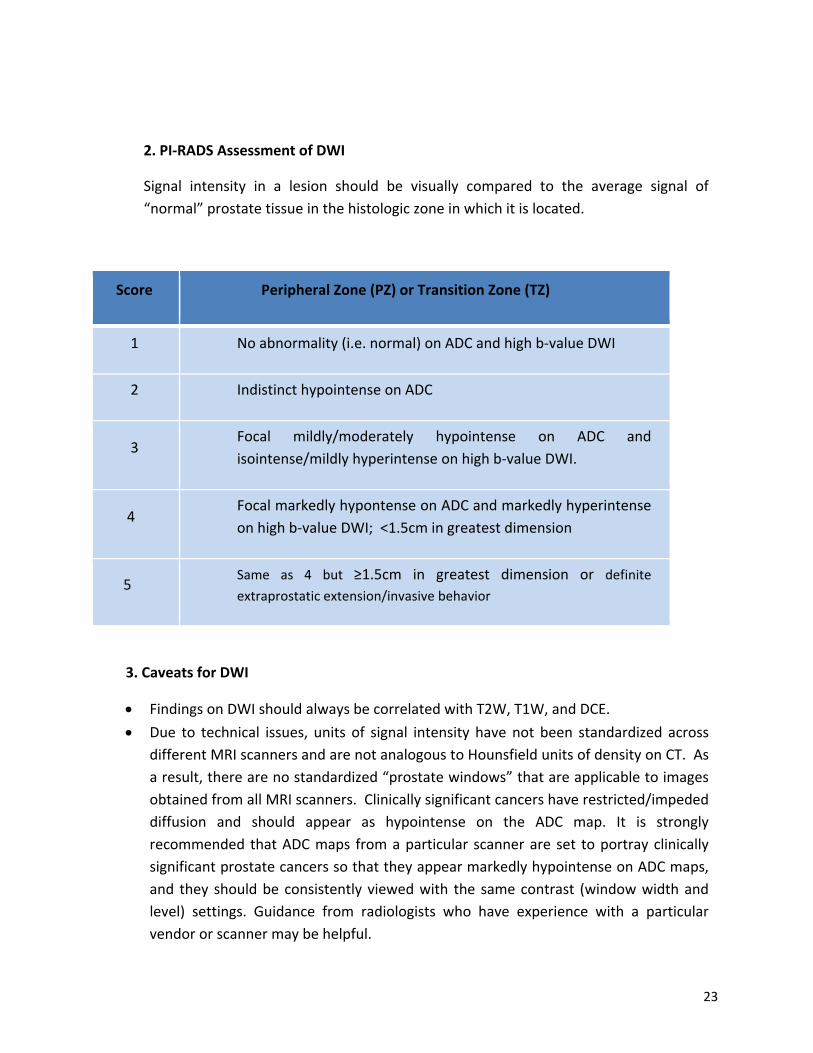
2. PI‐RADS Assessment of DWI
Signal intensity in a lesion should be visually compared to the average signal of
“normal” prostate tissue in the histologic zone in which it is located.
Score Peripheral Zone (PZ) or Transition Zone (TZ)
1 No abnormality (i.e. normal) on ADC and high b‐value DWI
2 Indistinct hypointense on ADC
3 Focal mildly/moderately hypointense on ADC and
isointense/mildly hyperintense on high b‐value DWI.
4 Focal markedly hypontense on ADC and markedly hyperintense
on high b‐value DWI; <1.5cm in greatest dimension
5 Same as 4 but ≥1.5cm in greatest dimension or definite
extraprostatic extension/invasive behavior
3. Caveats for DWI
Findings on DWI should always be correlated with T2W, T1W, and DCE.
Due to technical issues, units of signal intensity have not been standardized across
different MRI scanners and are not analogous to Hounsfield units of density on CT. As
a result, there are no standardized “prostate windows” that are applicable to images
obtained from all MRI scanners. Clinically significant cancers have restricted/impeded
diffusion and should appear as hypointense on the ADC map. It is strongly
recommended that ADC maps from a particular scanner are set to portray clinically
significant prostate cancers so that they appear markedly hypointense on ADC maps,
and they should be consistently viewed with the same contrast (window width and
level) settings. Guidance from radiologists who have experience with a particular
vendor or scanner may be helpful.
24
Color‐coded maps of ADC may assist in standardization of viewing and assessing
images from a particular scanner or vendor, but they will not obviate the concerns
with reproducibility of quantitative ADC values.
Benign findings and some normal anatomy (e,g. calculi and other calcifications, areas
of fibrosis or dense fibromuscular stroma, and some blood products, usually from
prior biopsies) may exhibit no or minimal signal on both T2W and ADC because there
is insufficient signal. However, in contrast to clinically significant prostate cancers,
these entities will also be markedly hypointense on all DWI images.
Some BPH nodules in the TZ are not clearly encapsulated, and they may exhibit
hypointensity on ADC maps and hyperintensity on high b‐value DWI. Although
morphologic features may assist assessment in some cases, this is currently a
recognized limitation of mpMRI diagnosis.
An encapsulated, circumscribed, round nodule in the PZ is likely an extruded BPH
nodule, even if it is hypointense on ADC. PIRADS Assessment Category for this finding
should be 2.
C. Dynamic Contrast‐Enhanced (DCE) MRI
DCE MRI, is defined as the acquisition of rapid T1W gradient echo scans before, during
and after the intravenous administration of a low molecular weight gadolinium‐based
contrast agent (GBCA). As with many other malignancies following bolus injection of a
GBCA, prostate cancers often demonstrate early enhancement compared to normal
tissue. However, the actual kinetics of prostate cancer enhancement are quite variable
and heterogeneous. Some malignant tumors demonstrate early washout, while others
retain contrast longer. Furthermore, enhancement alone is not definitive for clinically
significant prostate cancer, and absence of early enhancement does not exclude the
possibility.
DCE should be included in all prostate mpMRI exams so as not to miss some small
significant cancers. The DCE data should always be closely inspected for focal early
enhancement. If found, then the corresponding T2W and DWI images should be
carefully interrogated for a corresponding abnormality. At present, the added value
DCE is not firmly established, and most published data show that the added value of
DCE over and above the combination of T2W and DWI is modest. Thus, although DCE is
an essential component of the mpMRI prostate examination, its role in determination of
PI‐RADS v2 Assessment Category is secondary to T2W and DWI.

25
DCE is positive when there is enhancement that is focal, earlier or contemporaneous
with enhancement of adjacent normal prostatic tissues, and usually corresponds to a
suspicious finding on T2W and/or DWI. Positive enhancement in a lesion usually occurs
within 10 seconds of the appearance of the injected GBCA in the femoral arteries
(depending on temporal resolution used to acquire the images, injection rate, cardiac
output, and other factors).
The most widely available method of analyzing DCE is direct visual assessment of the
individual DCE time‐points at each slice location by either manually scrolling or using
cine mode. Visual assessment of enhancement may be improved with fat suppression
or subtraction techniques (especially in the presence of blood products that are
hyperintense on pre‐contrast enhanced T1W). Visual assessment of enhancement may
also be assisted with a parametric map which color‐codes enhancement features within
a voxel (e.g. slope and peak). However, any suspicious finding on subtracted images or a
parametric map should always be confirmed on the source images.
Considerable effort has gone into “curve typing” (i.e. plotting the kinetics of a lesion as a
function of signal vs. time). However, there is great heterogeneity in enhancement
characteristics of prostate cancers, and at present there is little evidence in the
literature to support the use of specific curve types. Another approach is the use of
compartmental pharmacokinetic modeling, which incorporates contrast media
concentration rather than raw signal intensity and an arterial input function to calculate
time constants for the rate of contrast agent wash‐in (Ktrans) and wash‐out (kep).
Commercial software programs are available that produce “maps” of Ktrans and kep and
may improve lesion conspicuity. Although pharmacodynamic (PD) analysis may provide
valuable insights into tumor behavior and biomarker measurements for drug
development, the PI‐RADS Steering Committee believes there is currently insufficient
peer reviewed published data or expert consensus to support routine adoption of this
method of analysis for clinical use.
Thus, for PI‐RADS v2, a “positive” DCE MRI lesion is one where the enhancement is focal,
earlier or contemporaneous with enhancement of adjacent normal prostatic tissues,
and corresponds to a finding on T2W and/or DWI. In the TZ, BPH nodules frequently
enhance early, but they usually exhibit a characteristic benign morphology (round
shape, well circumscribed). A “negative” DCE MRI lesion is one that either does not
enhance early compared to surrounding prostate or enhances diffusely so that the
margins of the enhancing area do not correspond to a finding on T2W and/or DWI.

26
1. Technical Specifications
DCE is generally carried out for several minutes to assess the enhancement
characteristics. In order to detect early enhancing lesions in comparison to background
prostatic tissue, temporal resolution should be <10 seconds and preferably <7 seconds
per acquisition in order to depict focal early enhancement. Fat suppression and/or
subtractions is recommended.
Although either a 2D or 3D T1 gradient echo (GRE) sequence may be used, 3D is
preferred.
o TR/TE: <100msec/ <5msec o Slice thickness: 3mm, no gap. Locations should be the same as those used for
DWI and DCE o FOV: encompass the entire prostate gland and seminal vesicles o In plane dimension: ≤2mm X ≤2mm o Temporal resolution: ≤15sec (<7sec is preferred) o Total observation rate: >2min o Dose: 0.1mmol/kg standard GBCA or equivalent high relaxivity GBCA o Injection rate: 2‐3cc/sec starting with continuous image data acquisition (should
be the same for all exams)
2. PI‐RADS Assessment for DCE
Score Peripheral Zone (PZ) or Transition Zone (TZ) for DCE
(‐)
no early enhancement, or
diffuse enhancement not corresponding to a focal finding on T2
and/or DWI or
focal enhancement corresponding to a lesion demonstrating
features of BPH on T2WI
(+) focal, and;
earlier than or contemporaneously with enhancement of adjacent

27
Caveats for DCE
DCE should always be interpreted with T2W and DWI; Focal enhancement in clinically
significant cancer usually corresponds to focal findings on T2W and/or DWI.
DCE may be helpful when evaluation of DWI in part or all of the prostate is technically
compromised (i.e. Assessment Category X) and when prioritizing multiple lesions in the
same patient (e.g. all other factors being equal, the largest DCE positive lesion may be
considered the index lesion).
Diffusely positive DCE is usually attributed to inflammation (e.g. prostatitis). Although
infiltrating cancers may also demonstrate diffuse enhancement, these are uncommon
and usually demonstrate an abnormality on the corresponding T2W and/or DWI.
There are instances where histologically sparse prostate cancers are intermixed with
benign prostatic tissues. They may be occult on T2W and DWI, and anecdotally may
occasionally be apparent only on DCE. However, these are usually lower grade tumors,
and the enhancement might, in some cases, be due to concurrent prostatitis.
Section V: Staging
MRI is useful for determination of the T stage, either confined to the gland (< T2 disease) or
extending beyond the gland (> T3 disease).
The apex of the prostate should be carefully inspected. When cancer involves the external
urethral sphincter, there is surgical risk of cutting the sphincter, resulting in compromise of
urinary competence. Tumor in this region may also have implications for radiation therapy.
High spatial resolution T2W imaging is required for accurate assessment of extraprostatic
extension (EPE), which includes assessment of neurovascular bundle involvement and seminal
vesicle invasion. These may be supplemented by high spatial resolution contrast‐enhanced fat
suppressed T1W.
The features of seminal vesicle invasion include focal or diffuse low T2W signal intensity
and/or abnormal contrast enhancement within and/or along the seminal vesicle, restricted
normal prostatic tissues, and;
corresponds to suspicious finding on T2W and/or DWI

28
diffusion, obliteration of the angle between the base of the prostate and the seminal vesicle,
and demonstration of direct tumor extension from the base of the prostate into and around
the seminal vesicle.
Imaging features used to assess for EPE include asymmetry or invasion of the neurovascular
bundles, a bulging prostatic contour, an irregular or spiculated margin, obliteration of the
rectoprostatic angle, a tumor‐capsule interface of greater than 1.0 cm, breach of the capsule
with evidence of direct tumor extension or bladder wall invasion.
The next level of analysis is that of the pelvic and retroperitoneal lymph nodes. The detection
of abnormal lymph nodes on MRI is currently limited to size, morphology and shape, and
enhancement pattern. In general, lymph nodes over 8mm in short axis dimension are
regarded as suspicious, although lymph nodes that harbor metastases are not always enlarged.
Nodal groups that should be evaluated include: common femoral, obturator, external iliac,
internal iliac, common iliac, pararectal, presacral, and paracaval, and para‐aortic to the level of
the aortic bifurcation.
Images should be assessed for the presence of skeletal metastases.
APPENDIX I Report Templates (this section is under construction)
Standard (FreeText) Report
Structured Report
APPENDIX II Sector Map
The segmentation model used in ACR‐ PI‐RADS v2 employs thirty‐nine sectors/regions:
thirty‐six for the prostate, two for the seminal vesicles and one for the external urethral
sphincter.
The prostate is divided into right/left on axial sections by a vertical line drawn through the
center (indicated by the prostatic urethra), and into anterior/posterior by a horizontal line
through the middle of the gland.
The right and left peripheral zones (PZ) at prostate base, midgland, and apex are each
subdivided into three sections: anterior (a), medial posterior (mp), and lateral posterior (lp).
29
The right and left transition zones (TZ) at prostate base, midgland, and apex are each
subdivided into two sections: anterior (a) and posterior (p)
The anterior fibromuscular stroma (AS) is divided into right/left at the prostate base,
midgland, and apex.
The seminal vesicles (SV) are divided into right/left.
The sector map illustrates an idealized “normal prostate”. In patients and their
corresponding MRI images, many prostates have components that are enlarged or
atrophied, and the PZ may obscured by an enlarged TZ. In such instances, in addition to the
written report, a sector map which clearly indicates the location of the findings will be
especially useful for localization.
30
31
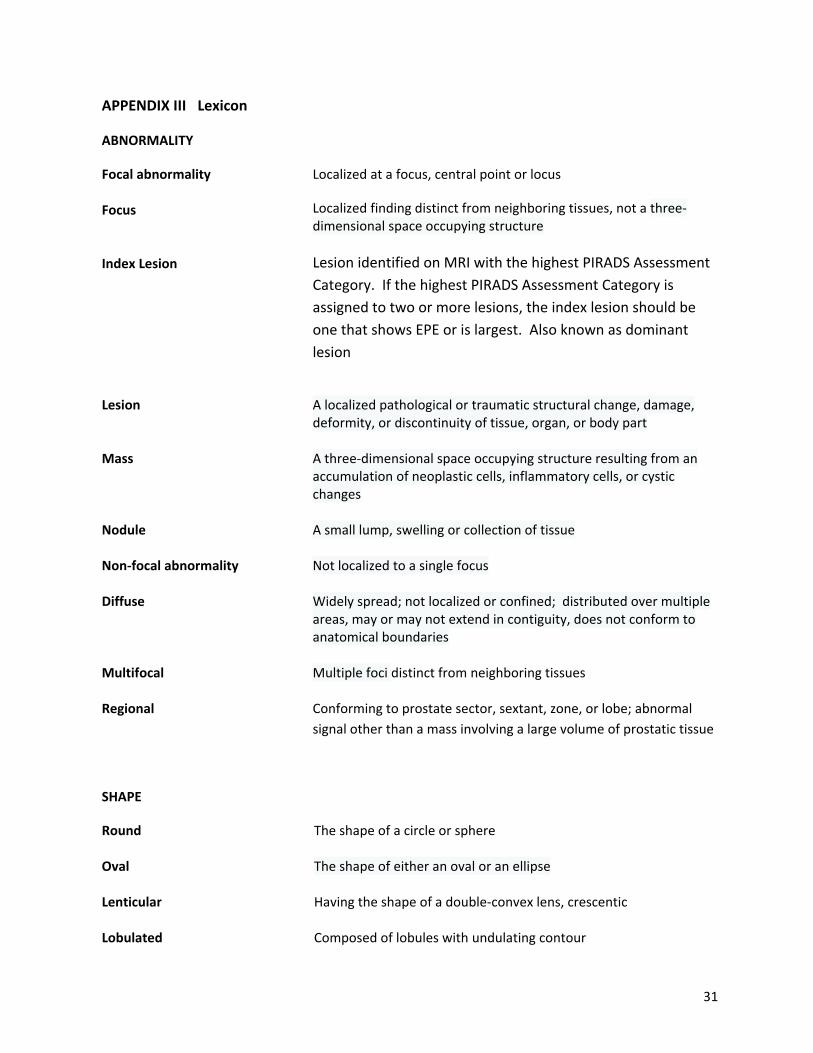
APPENDIX III Lexicon
ABNORMALITY
Focal abnormality Focus Index Lesion
Localized at a focus, central point or locus
Localized finding distinct from neighboring tissues, not a three‐dimensional space occupying structure
Lesion identified on MRI with the highest PIRADS Assessment
Category. If the highest PIRADS Assessment Category is
assigned to two or more lesions, the index lesion should be
one that shows EPE or is largest. Also known as dominant
lesion
Lesion
A localized pathological or traumatic structural change, damage, deformity, or discontinuity of tissue, organ, or body part
Mass
A three‐dimensional space occupying structure resulting from an accumulation of neoplastic cells, inflammatory cells, or cystic changes
Nodule A small lump, swelling or collection of tissue
Non‐focal abnormality
Not localized to a single focus
Diffuse
Widely spread; not localized or confined; distributed over multiple areas, may or may not extend in contiguity, does not conform to anatomical boundaries
Multifocal
Multiple foci distinct from neighboring tissues
Regional Conforming to prostate sector, sextant, zone, or lobe; abnormal
signal other than a mass involving a large volume of prostatic tissue
SHAPE
Round Oval
The shape of a circle or sphere The shape of either an oval or an ellipse
Lenticular
Having the shape of a double‐convex lens, crescentic
Lobulated Composed of lobules with undulating contour
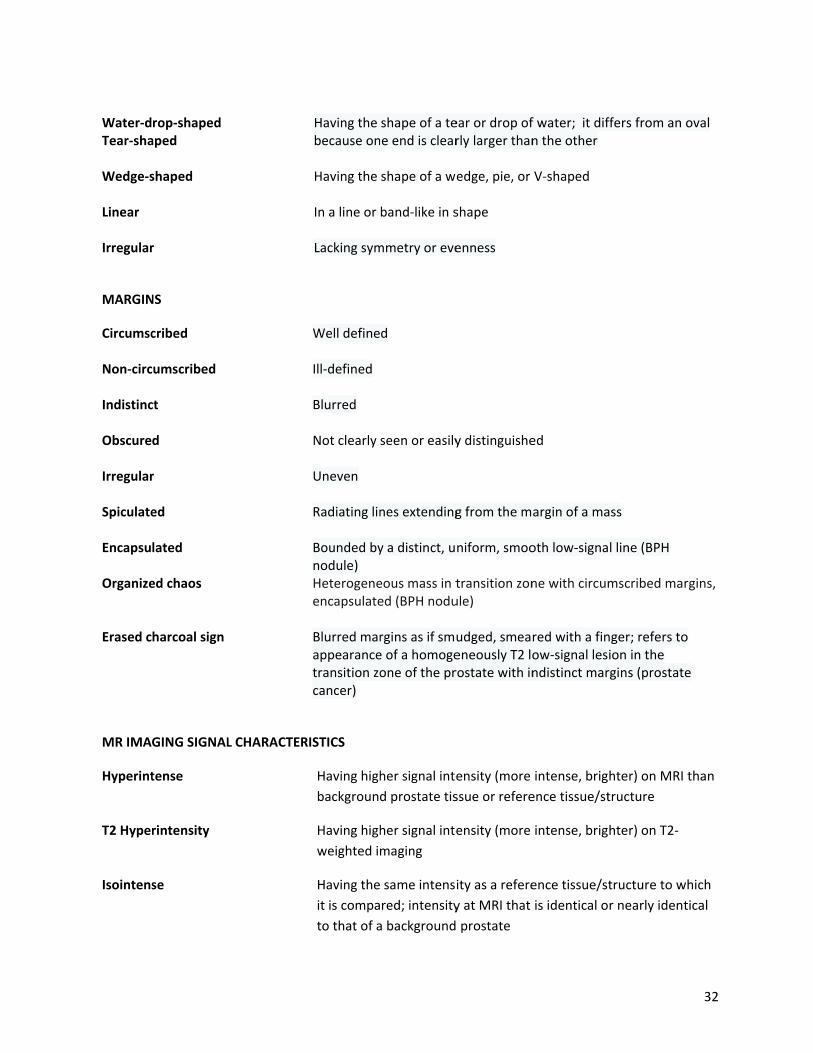
Water‐dTear‐sha Wedge‐s Linear Irregular
MARGIN
Circumsc Non‐circ Indistinc Obscure Irregular Spiculate Encapsu Organize Erased c
MR IMA
Hyperint
T2 Hyper
Isointens
rop‐shaped aped
shaped
r
NS
cribed
cumscribed
ct
d
r
ed
lated
ed chaos
harcoal sign
GING SIGNAL
tense
rintensity
se
L CHARACTER
Having the because on
Having the
In a line or
Lacking sym
Well define
Ill‐defined
Blurred
Not clearly
Uneven
Radiating lin
Bounded bynodule) Heterogeneencapsulate
Blurred marappearancetransition zocancer)
RISTICS
Having high
background
Having high
weighted im
Having the
it is compa
to that of a
shape of a tee end is clear
shape of a w
band‐like in s
mmetry or eve
d
seen or easily
nes extending
y a distinct, u
eous mass in ted (BPH nodu
rgins as if smue of a homogeone of the pr
her signal inte
d prostate tis
her signal inte
maging
same intens
red; intensity
a background
ear or drop ofrly larger than
edge, pie, or
shape
enness
y distinguishe
g from the m
niform, smoo
transition zonule)
udged, smeaeneously T2 lorostate with in
ensity (more
ssue or refere
ensity (more
ity as a refere
y at MRI that
prostate
f water; it difn the other
V‐shaped
ed
argin of a ma
oth low‐signa
ne with circum
red with a finow‐signal lesndistinct mar
intense, brig
ence tissue/st
intense, brig
ence tissue/st
is identical o
ffers from an
ass
l line (BPH
mscribed ma
nger; refers toion in the rgins (prostat
hter) on MRI
tructure
hter) on T2‐
tructure to w
r nearly ident
32
oval
rgins,
o
e
than
which
tical
33
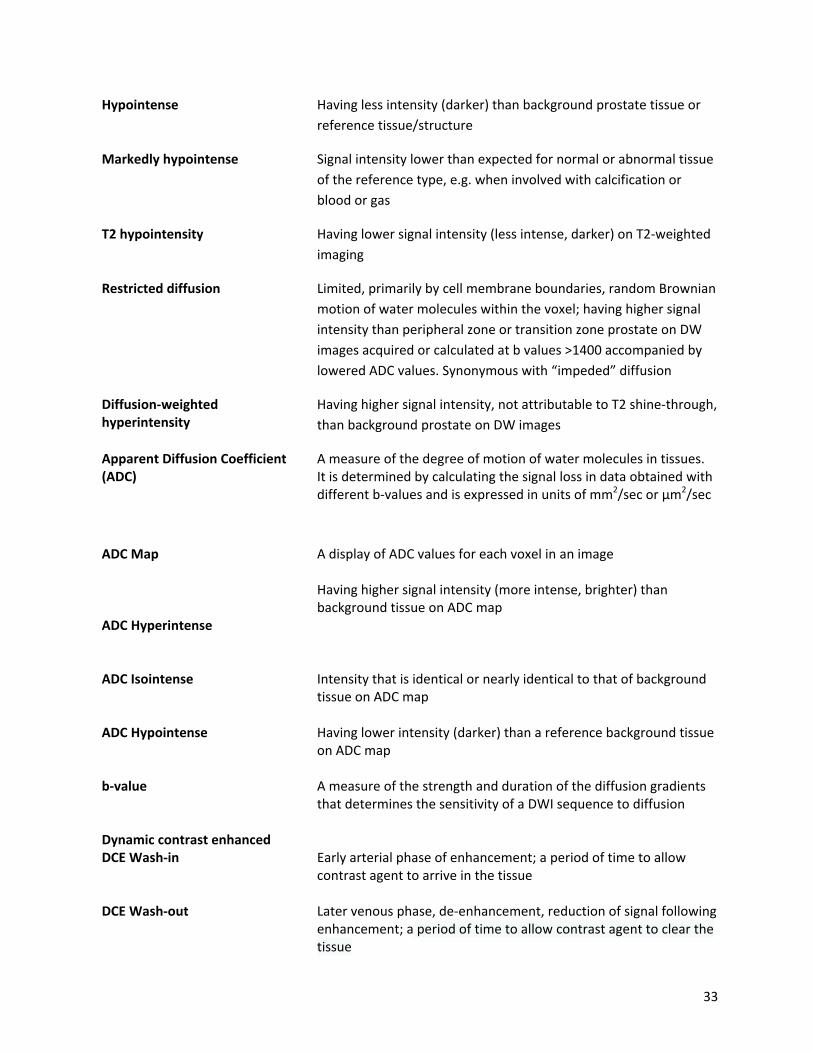
Hypointense Having less intensity (darker) than background prostate tissue or
reference tissue/structure
Markedly hypointense Signal intensity lower than expected for normal or abnormal tissue
of the reference type, e.g. when involved with calcification or
blood or gas
T2 hypointensity
Having lower signal intensity (less intense, darker) on T2‐weighted
imaging
Restricted diffusion Limited, primarily by cell membrane boundaries, random Brownian
motion of water molecules within the voxel; having higher signal
intensity than peripheral zone or transition zone prostate on DW
images acquired or calculated at b values >1400 accompanied by
lowered ADC values. Synonymous with “impeded” diffusion
Diffusion‐weighted hyperintensity
Having higher signal intensity, not attributable to T2 shine‐through,
than background prostate on DW images
Apparent Diffusion Coefficient (ADC)
A measure of the degree of motion of water molecules in tissues. It is determined by calculating the signal loss in data obtained with different b‐values and is expressed in units of mm2/sec or µm2/sec
ADC Map ADC Hyperintense
A display of ADC values for each voxel in an image Having higher signal intensity (more intense, brighter) than background tissue on ADC map
ADC Isointense
Intensity that is identical or nearly identical to that of background tissue on ADC map
ADC Hypointense b‐value
Having lower intensity (darker) than a reference background tissue on ADC map A measure of the strength and duration of the diffusion gradients that determines the sensitivity of a DWI sequence to diffusion
Dynamic contrast enhanced DCE Wash‐in
Early arterial phase of enhancement; a period of time to allow contrast agent to arrive in the tissue
DCE Wash‐out
Later venous phase, de‐enhancement, reduction of signal following enhancement; a period of time to allow contrast agent to clear the tissue

34
Pharmacodynamic analysis PD curves Time vs. signal intensity curve Enhancement kinetic curve
Method of quantifying tissue contrast media concentration changes to calculate time constants for the rate of wash‐in and wash‐out Graph plotting tissue intensity change (y axis) over time (x axis); enhancement kinetic curve is a graphical representation of tissue enhancement where signal intensity of tissue is plotted as a function of time
ENHANCEMENT PATTERNS
Early phase wash‐in
Signal intensity characteristic early after contrast agent administration; wash‐in phase corresponding to contrast arrival in the prostate
Delayed phase
Signal intensity characteristic following its initial (early) rise after contrast material administration
Persistent delayed phase Type 1 curve
Continued increase of signal intensity over time
Plateau delayed phase Type 2 curve
Signal intensity does not change over time after its initial rise, flat; plateau refers to signal that varies <10% from the peak signal over the duration of the DCE MRI
Washout delayed phase Type 3 curve
Signal intensity decreases after its highest point after its initial rise
Positive DCE
Focal, early enhancement corresponding to a focal peripheral zone or transition zone lesion on T2 and/or DWI MRI
Negative DCE Lack of early enhancement Diffuse enhancement not corresponding to a focal lesion on T2 and/or DWI MRI Focal enhancement corresponding to a BPH lesion
ANATOMICAL TERMS
Prostate: Regional Parts The prostate is divided from superior to inferior into three regional
parts: the base, the midgland, and the apex.
Base of prostate The upper 1/3 of the prostate just below the urinary bladder.
Mid prostate The middle 1/3 of the prostate that includes verumontanum in the
35
mid prostatic urethra; midgland
Apex of prostate The lower 1/3 of the prostate
Peripheral zone Covers the outer posterior, lateral, and apex regions of the
prostate; makes up most of the apex of the prostate
Transition zone Tissue around the urethra that is separated from the peripheral
zone by the “surgical capsule” delineated as a low signal line on T2
weighted MRI; it is the site of most BPH
Central zone Tissue surrounding the ejaculatory ducts posterior and superior,
from the base of the prostate to the verumontanum; it has the
shape of an inverted cone with its base oriented towards the base
of the gland; contains more stroma than glandular tissue
Anterior fibromuscular stroma Located anteriorly and contains smooth muscle, which mixes with
periurethral muscle fibers at the bladder neck; contains no
glandular tissue
Prostate: Sectors Anatomical regions defined for the purpose of prostate targeting
during interventions, may include multiple constitutional and
regional parts of the prostate. Thirty‐six sectors for standardized
MRI prostate localization reporting are identified, with addition of
seminal vesicles and membranous urethra. Each traditional
prostate sextant is sub‐divided into six sectors, to include: the
anterior fibromuscular stroma, the transition zone anterior and
posterior sectors, the peripheral zone anterior, lateral, and medial
sectors. The anterior and posterior sectors are defined by a line
bisecting the prostate into the anterior and posterior halves.
Diagram
Prostate “capsule” Histologically, there is no distinct capsule that surrounds the
prostate, however historically the “capsule” has been defined as an
outer band of the prostatic fibromuscular stroma blending with
endopelvic fascia that may be visible on imaging as a distinct thin
layer of tissue surrounding or partially surrounding the peripheral
zone.
Prostate pseudocapsule Imaging appearance of a thin “capsule” around transition zone
when no true capsule is present at histological evaluation. The
junction of the transition and peripheral zones marked by a visible
hypointense linear boundary, which is often referred to as the
prostate “pseudocapsule” or “surgical capsule”.
36
Seminal vesicle One of the two paired glands in the male genitourinary system,
posterior to the bladder and superior to the prostate gland, that
produces fructose‐rich seminal fluid which is a component of
semen. These glands join the ipsilateral ductus (vas) deferens to
form the ejaculatory duct at the base of the prostate.
Neurovascular bundle of
prostate NVB
Nerve fibers from the lumbar sympathetic chain extend inferiorly
to the pelvis along the iliac arteries and intermix with
parasympathetic nerve fibers branching off S2 to S4. The mixed
nerve bundles run posterior to the bladder, seminal vesicles, and
prostate as the “pelvic plexus”. The cavernous nerve arises from
the pelvic plexus and runs along the posterolateral aspect of the
prostate on each side. Arterial and venous vessels accompany the
cavernous nerve, and together these structures form the
neurovascular bundles which are best visualized on MR imaging at
5 and 7 o’clock position. At the apex and the base of the prostate,
the bundles send penetrating branches through the “capsule”,
providing a potential route for extraprostatic tumor spread.
Right neurovascular bundle Located at 7 o’clock postero‐lateral position.
Left neurovascular bundle Located at 5 o’clock postero‐lateral position.
Vas deferens The excretory duct of the testes that carries spermatozoa; it rises
from the scrotum and joins the seminal vesicles to form the
ejaculatory duct, which opens into the mid prostatic urethra at the
level of the verumontanum.
Verumontanum The verumontanum (urethral crest formed by an elevation of the
mucous membrane and its subjacent tissue) is an elongated ridge
on the posterior wall of the mid prostatic urethra at the site of
ejaculatory ducts opening into the prostatic urethra.
Neck of urinary bladder The inferior portion of the urinary bladder which is formed as the
walls of the bladder converge and become contiguous with the
proximal urethra.
Urethra: Prostatic The proximal prostatic urethra extends from the bladder neck at
the base of the prostate to verumontanum in the mid prostate.
The distal prostatic urethra extends from the verumontanum to
the membranous urethra and contains striated muscle of the
urethral sphincter.
Urethra: Membranous The membranous segment of the urethra is located between the
37
apex of the prostate and the bulb of the corpus spongiosum,
extending through the urogenital diaphragm.
External urethral sphincter Surrounds the whole length of the membranous portion of the
urethra and is enclosed in the fascia of the urogenital diaphragm.
Periprostatic compartment Space surrounding the prostate
Rectoprostatic compartment
Rectoprostatic angle
Space between the prostate and the rectum
Extraprostatic Pertaining to an area outside the prostate
Prostate –seminal vesicle angle The plane or space between the prostate base and the seminal
vesicle, normally filled with fatty tissue and neurovascular bundle
of prostate.
STAGING TERMS
Abuts “capsule” of prostate
Tumor touches the “capsule”
Bulges “capsule” of prostate Convex contour of the “capsule” Bulging prostatic contour over a suspicious lesion: Focal, spiculated (extraprostatic tumor) Broad‐base of contact (at least 25% of tumor contact with the capsule) Tumor‐capsule abutment of greater than 1 cm Lenticular tumor at prostate apex extending along the urethra below the apex.
Mass effect on surrounding tissue
Compression of the tissue around the mass, or displacement of adjacent tissues or structures, or obliteration of the tissue planes by an infiltrating mass
Invasion Tumor extension across anatomical boundary; may relate to tumor extension within the gland, i.e. across regional parts of the prostate, or outside the gland, across the “capsule” (extracapsular extension of tumor, extraprostatic extension of tumor, extraglandular extension of tumor).
Invasion: “Capsule” Extra‐capsular extension ECE Extraprostatic extension EPE Extraglandular extension
Tumor involvement of the “capsule” or extension across the “capsule” with indistinct, blurred or irregular margin Retraction of the capsule Breach of the capsule Direct tumor extension through the “capsule” Obliteration of the rectoprostatic angle

38
Invasion: Pseudocapsule Tumor involvement of pseudocapsule with indistinct margin
Invasion: Anterior fibromuscular stroma
Tumor involvement of anterior fibromuscular stroma with indistinct margin
Invasion: Prostate –seminal vesicle angle
Tumor extends into the space between the prostate base and the seminal vesicle
Invasion: Seminal vesicle Seminal vesicle invasion SVI
Tumor extension into seminal vesicle There are 3 types: 1.Tumor extension along the ejaculatory ducts into the seminal vesicle above the base of the prostate; focal T2 hypointense signal within and/or along the seminal vesicle; enlargement and T2 hypointensity within the lumen of seminal vesicle Restricted diffusion within the lumen of seminal vesicle Enhancement along or within the lumen of seminal vesicle Obliteration of the prostate‐seminal vesicle angle 2. Direct extra‐glandular tumor extension from the base of the prostate into and around the seminal vesicle 3.Metachronous tumor deposit –separate focal T2 hypointense signal, enhancing mass in distal seminal vesicle
Invasion: Neck of urinary bladder
Tumor extension along the prostatic urethra to involve the bladder neck
Invasion: Membranous urethra Tumor extension along the prostatic urethra to involve the membranous urethra
Invasion: Periprostatic, extraprostatic
Tumor extension outside the prostate
Invasion: Neurovascular bundle of prostate
Tumor extension into the neurovascular bundle of the prostate Asymmetry, enlargement or direct tumor involvement of the neurovascular bundles Assess the recto‐prostatic angles (right and left): 1. Asymmetry ‐ abnormal one is either obliterated or flattened. 2. Fat in the angle – infiltrated (individual elements cannot be identified or separated) clean (individual elements are visible ) 3.Direct tumor extension
Invasion: External urethral sphincter
Tumor extension into the external urethral sphincter Loss of the normal low signal of the sphincter, discontinuity of the circular contour of the sphincter
MRI CHARACTERISTICS OF ADDITIONAL PATHOLOGIC STATES

39
BPH nodule A round/oval mass with a well‐defined T2 hypointense margin; encapsulated mass or “organized chaos” found in the transition zone or extruded from the transition zone into the peripheral zone
Hypertrophy of median lobe of prostate
Increase in the volume of the median lobe of the prostate with mass‐effect or protrusion into the bladder and stretching the urethra
Cyst A circumscribed T2 hyperintense fluid containing sac‐like structure
Hematoma ‐ Hemorrhage T1 hyperintense collection or focus
Calcification Focus of markedly hypointense signal on all MRI sequences
APPENDIX IV SAMPLE PROTOCOLS (this section is under construction)
APPENDIX V Atlas (this section is under construction)
Three (3) examples of each category (1‐5) for T2, DWI, and DCE)
References
Introduction
Thornbury JR, Ornstein DK, Choyke PL, Langlotz CP, Weinreb JC. Prostate Cancer: What is the future for imaging? Am J Roentgenology 2001; 176:17‐22. Dickinson L, Ahmed HU, Allen C, Barentsz JO, Carey B, Futterer JJ, et al. Magnetic resonance imaging for the detection, localisation, and characterisation of prostate cancer: recommendations from a European consensus meeting. European Urology.2011; 4 :477‐94.
Eberhardt SC, Carter S, Casalino DD, Merrick G, Frank SJ, et al. ACR Appropriateness Criteria® for
Prostate Cancer — pretreatment detection, staging and surveillance. J Am Coll Radiol 2013;10(2);83‐92
Barentsz JO, Richenberg J, Clements R, Choyke P, Verma S, Villeirs G, et al. ESUR prostate MR guidelines 2012. European Radiol 2012;4:746‐57. Moore CM, Kasivisvanathan V, Eggener S, Emberton M, Futterer JJ, et al. Standards of reporting for MRI‐targeted biopsy studies (START) of the prostate: recommendations from an international working group. European Urology 2013;64:544‐552
40
Rosenkrantz AB, Kim S, Lim RP, Hindman N, Deng F‐M, et al. Prostate cancer localization using multiparametric MR imaging: comparison of Prostate Imaging Reproting and Data System (PI‐RADS) and Likert Scales. Radiology 2013:269:482‐492 de Rooij M, Hamoen EHJ, Futterer JJ, Barentsz JO, Rovers MM. Accuracy of muliparametric MRI for prostate cancer detection: a meta‐analysis. Am J Roentgenology 2014;202:343‐351 Arumainayagam N, Ahmed HU, Moore CM, Freeman A, Allen C, et al. Multiparametric MR imaging for detection of clinically significant prostate cancer: a validation cohort study with transperineal template prostate mapping as the reference standard. Radiology 2013:268:761‐769 Dickinson L, Ahmed HU, allen C, Barentsz JO, Carey B, et al. Scoring systems used for the interpretation and reporting of mulitparametric MRI for prostate cancer detection, localization and chanarcterization: could standardization lead to improved utilization of imaging within the diagnostic pathway? J Magn Reson imaging 2013:37;48‐58 Cornelis F, Rigou G, Le Bras Y, Coutouly X, Hubrecht R, et al. Real‐time contast‐enhanced transprectal US‐guided proastate biopsy: diagnostic accuracy in men with previously negative biopsy results and postivie MR imaging findings. Radiology 2013;269:159‐166 Puech P, Rouviere O, renard‐Penna R, Villers A,Devos P, et al. Prostate cacner diagnosis: multiparametric MR‐targeted biopsy with cognitive and transrectal U‐MR fusion guidance versus systemeic biopsy‐prospective mulitcenter study. Radiology 2013:268;461‐469 Pokorny MR, de Rooij M, Duncan E, Schroder FH, Parkinson R, et al. Prospective study of diagnostic accuracy comparing proastate cacner detection by transrectal ultrasound‐guided biopsy versus magnetic resonance (MR) imaigng with subsequent MR‐guided biopsy in men without previous prostate biopsies. European Urology 2014 (In press) Hamoen EHJ, de Rooij M, Witjes JA, Barentsz J. Use of the Prostate Imaging Reporting and Data System (PI‐RADS) for prostate cancer detection with mulitparametric magnetic resonance imaigng: a diagnostic meta‐analysis. European Urology 2014 (In press)
Section I: Clinical Considerations and Technical Specificiations Wagner M, Rief M, Busch, Scheuring C, Taupitz M, et al. Effect of butylscopolamine on image quality in MRI of the prostate. Clin radiol 2012;65:460‐465 Rosenkrantz AB, Kopec M, Kong X, Melamed J, Dakwar G, Babb JS, et al. Prostate cancer vs. post‐biopsy hemorrhage: diagnosis with T2‐ and diffusion‐weighted imaging. J Magn Reson Imaging 2010 Jun;31(6):1387‐94. Rosenkrantz AB, Mussi TC, Hindman N, Lim RP, Knong MX, et al. Impact of dealy after biopsy and post‐biopsy haemorrhage on prostate cancer tumour detection using mulit‐parametric MRI: a multi‐reader study. Clin Radiol 2012;67:83‐90

41
Tamada T, Sone T, Jo Y, Yamamoto A, Yamashita T, Egashira N, et al. Prostate cancer: relationships between postbiopsy hemorrhage and tumor detectability at MR diagnosis. Radiology. 2008 ;248:531‐539 Barrett T, Vargas HA, Akin O, Goldman DA, Hricak H. Value of the hemorrhage exclusion sign on T1‐weighted prostate MR images for the detection of prostate cancer. Raiology 2012;263:751‐757 Park KK, Lee SH, LIm BJ, Kim JH, Chung BH. The effects of the period between biopsy and diffusion‐weighted magnteic resoance imaging on cancer staging in localized prostate cancer. BJU Int 2010;106:1148‐1151 Medved M, Sammet S, Yousuf A, Oto A. MR imaging of the prostate and adjacent anatomic structures before, during, and after ejaculation: qualitative and quantitative evaluation. Radiology. 2014 271(2):452‐60. Rouviere O, Hartman RP, Lyonnet D. Prostate MR imaging at high‐field strength: evolution or revolution? European Radiol 2006;16(2):276‐84. Johnston R, Wong L‐M, Warren A, Shah N, Neal D. The role of 1.5T Tesla magnetic resonance imaging in staging prostate cancer. ANZ J Surg 2013 (83);234‐238 Kim BS, Kim TH, Kwon TG, Yoo ES. Comparison of pelvic phased‐array versus endorectal coil magnetic resonance imaging at 3 Tesla for local staging of prostate cancer. Yonsei Med J 2012;53(3):550‐6. Turkbey B, Merinio MJ, Gallardo EC, Shah V, Aras O, et al. Comparison of endorectal and nonendorectal coil T2W and diffusion‐weighted MRI at 3 Tesla for localizing prostate cancer: comparison with whole‐mount histopathollogy. J Magn Reson Imaging 2014:39;1443‐1448
Haider MA, krieger A, Elliot C, Da Rosa MR, Milot L. Prostate imaging: evaluation of reusable two‐channel endorectal receiver coil for MR imaigng at 1.5T. Radiology 2014:270:556‐565 Leake JL, Hardman R, Vijayanadh O, Thompson I, Shanbhogue A, et al. prostate MRI: access to the current practiceof prostate MRI in the Untied States. J Am Coll Radiol 2014:11;156‐160 Rosen Y, Bloch N, Lenkinski RE, Greenman RL, Marquis RP, Rofsky NM. 3T MR of the prostate: reducing susceptibility gradients by infalting the endorectal coil with barium sulfagte suspension. Magn Reson Med 2007;57:898‐904 Roethke MC, Kuru TH, Schultze S, Tichy D, Kopp‐Schneider A, Fenchel M, et al. Evaluation of the ESUR PI‐RADS scoring system for multiparametric MRI of the prostate with targeted MR/TRUS fusion‐guided biopsy at 3.0 Tesla. European Radiol 2014 Feb;24(2):344‐52. Niaf E, Lartizien C, Bratan F, Roche L, Babilloud M, et al. Prostate focal peripheral zone lesions; characterization at multiparametric MR imaging‐influence of computer‐aided diagnosis system. Radiology 2014;271:761‐769
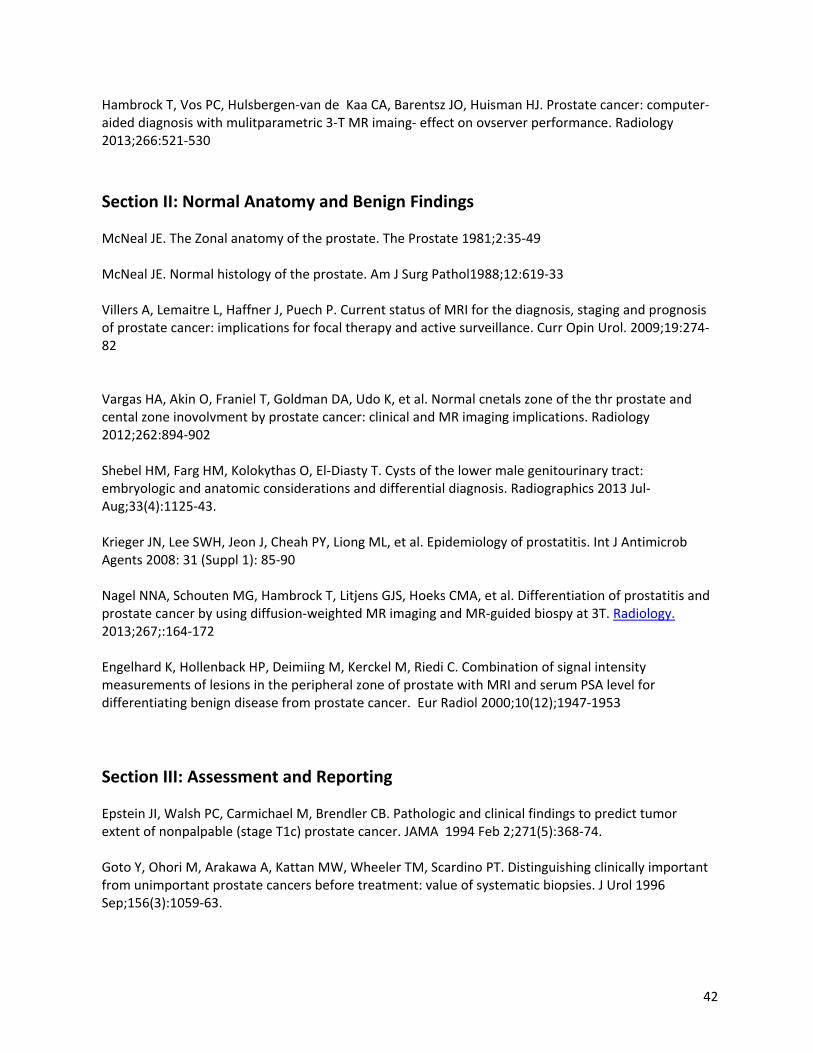
42
Hambrock T, Vos PC, Hulsbergen‐van de Kaa CA, Barentsz JO, Huisman HJ. Prostate cancer: computer‐aided diagnosis with mulitparametric 3‐T MR imaing‐ effect on ovserver performance. Radiology 2013;266:521‐530
Section II: Normal Anatomy and Benign Findings
McNeal JE. The Zonal anatomy of the prostate. The Prostate 1981;2:35‐49 McNeal JE. Normal histology of the prostate. Am J Surg Pathol1988;12:619‐33 Villers A, Lemaitre L, Haffner J, Puech P. Current status of MRI for the diagnosis, staging and prognosis of prostate cancer: implications for focal therapy and active surveillance. Curr Opin Urol. 2009;19:274‐82 Vargas HA, Akin O, Franiel T, Goldman DA, Udo K, et al. Normal cnetals zone of the thr prostate and cental zone inovolvment by prostate cancer: clinical and MR imaging implications. Radiology 2012;262:894‐902 Shebel HM, Farg HM, Kolokythas O, El‐Diasty T. Cysts of the lower male genitourinary tract: embryologic and anatomic considerations and differential diagnosis. Radiographics 2013 Jul‐Aug;33(4):1125‐43. Krieger JN, Lee SWH, Jeon J, Cheah PY, Liong ML, et al. Epidemiology of prostatitis. Int J Antimicrob Agents 2008: 31 (Suppl 1): 85‐90 Nagel NNA, Schouten MG, Hambrock T, Litjens GJS, Hoeks CMA, et al. Differentiation of prostatitis and prostate cancer by using diffusion‐weighted MR imaging and MR‐guided biospy at 3T. Radiology. 2013;267;:164‐172 Engelhard K, Hollenback HP, Deimiing M, Kerckel M, Riedi C. Combination of signal intensity measurements of lesions in the peripheral zone of prostate with MRI and serum PSA level for differentiating benign disease from prostate cancer. Eur Radiol 2000;10(12);1947‐1953
Section III: Assessment and Reporting
Epstein JI, Walsh PC, Carmichael M, Brendler CB. Pathologic and clinical findings to predict tumor extent of nonpalpable (stage T1c) prostate cancer. JAMA 1994 Feb 2;271(5):368‐74. Goto Y, Ohori M, Arakawa A, Kattan MW, Wheeler TM, Scardino PT. Distinguishing clinically important from unimportant prostate cancers before treatment: value of systematic biopsies. J Urol 1996 Sep;156(3):1059‐63.
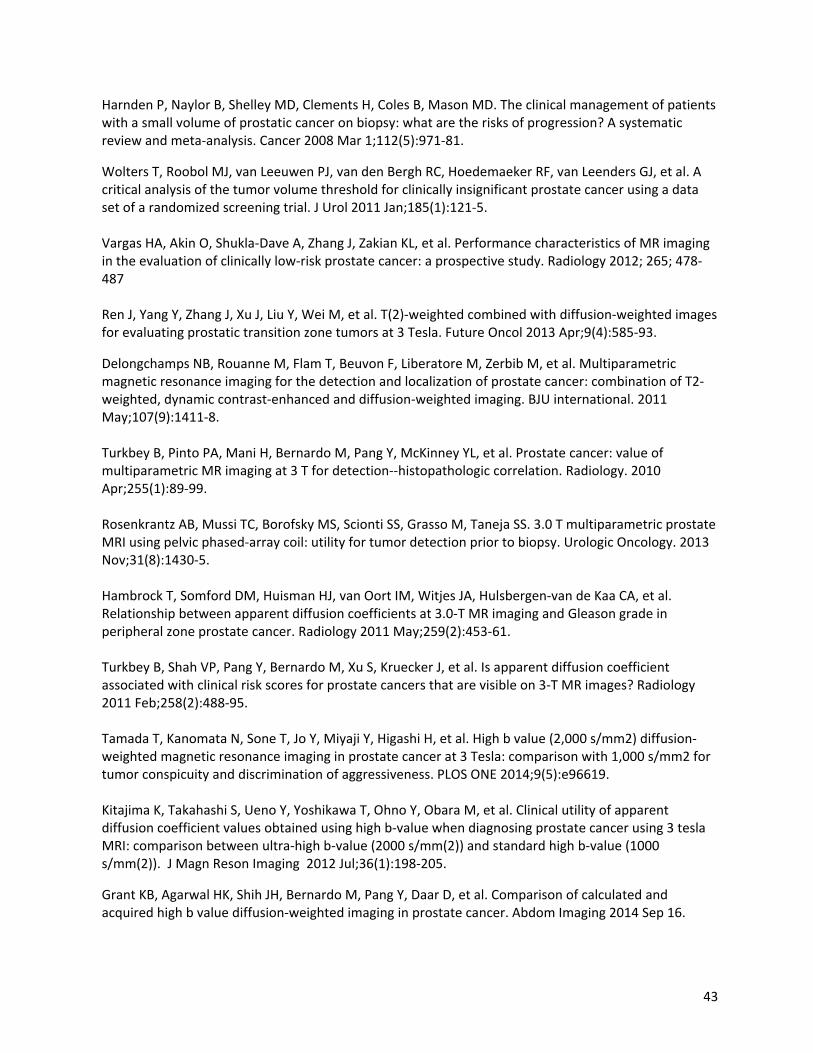
43
Harnden P, Naylor B, Shelley MD, Clements H, Coles B, Mason MD. The clinical management of patients with a small volume of prostatic cancer on biopsy: what are the risks of progression? A systematic review and meta‐analysis. Cancer 2008 Mar 1;112(5):971‐81.
Wolters T, Roobol MJ, van Leeuwen PJ, van den Bergh RC, Hoedemaeker RF, van Leenders GJ, et al. A critical analysis of the tumor volume threshold for clinically insignificant prostate cancer using a data set of a randomized screening trial. J Urol 2011 Jan;185(1):121‐5. Vargas HA, Akin O, Shukla‐Dave A, Zhang J, Zakian KL, et al. Performance characteristics of MR imaging in the evaluation of clinically low‐risk prostate cancer: a prospective study. Radiology 2012; 265; 478‐487 Ren J, Yang Y, Zhang J, Xu J, Liu Y, Wei M, et al. T(2)‐weighted combined with diffusion‐weighted images for evaluating prostatic transition zone tumors at 3 Tesla. Future Oncol 2013 Apr;9(4):585‐93.
Delongchamps NB, Rouanne M, Flam T, Beuvon F, Liberatore M, Zerbib M, et al. Multiparametric magnetic resonance imaging for the detection and localization of prostate cancer: combination of T2‐weighted, dynamic contrast‐enhanced and diffusion‐weighted imaging. BJU international. 2011 May;107(9):1411‐8. Turkbey B, Pinto PA, Mani H, Bernardo M, Pang Y, McKinney YL, et al. Prostate cancer: value of multiparametric MR imaging at 3 T for detection‐‐histopathologic correlation. Radiology. 2010 Apr;255(1):89‐99. Rosenkrantz AB, Mussi TC, Borofsky MS, Scionti SS, Grasso M, Taneja SS. 3.0 T multiparametric prostate MRI using pelvic phased‐array coil: utility for tumor detection prior to biopsy. Urologic Oncology. 2013 Nov;31(8):1430‐5. Hambrock T, Somford DM, Huisman HJ, van Oort IM, Witjes JA, Hulsbergen‐van de Kaa CA, et al. Relationship between apparent diffusion coefficients at 3.0‐T MR imaging and Gleason grade in peripheral zone prostate cancer. Radiology 2011 May;259(2):453‐61. Turkbey B, Shah VP, Pang Y, Bernardo M, Xu S, Kruecker J, et al. Is apparent diffusion coefficient associated with clinical risk scores for prostate cancers that are visible on 3‐T MR images? Radiology 2011 Feb;258(2):488‐95. Tamada T, Kanomata N, Sone T, Jo Y, Miyaji Y, Higashi H, et al. High b value (2,000 s/mm2) diffusion‐weighted magnetic resonance imaging in prostate cancer at 3 Tesla: comparison with 1,000 s/mm2 for tumor conspicuity and discrimination of aggressiveness. PLOS ONE 2014;9(5):e96619. Kitajima K, Takahashi S, Ueno Y, Yoshikawa T, Ohno Y, Obara M, et al. Clinical utility of apparent diffusion coefficient values obtained using high b‐value when diagnosing prostate cancer using 3 tesla MRI: comparison between ultra‐high b‐value (2000 s/mm(2)) and standard high b‐value (1000 s/mm(2)). J Magn Reson Imaging 2012 Jul;36(1):198‐205.
Grant KB, Agarwal HK, Shih JH, Bernardo M, Pang Y, Daar D, et al. Comparison of calculated and acquired high b value diffusion‐weighted imaging in prostate cancer. Abdom Imaging 2014 Sep 16.

44
Bittencourt LK, Attenberger UI, Lima D, Strecker R, de Oliveira A, Schoenberg SO, et al. Feasibility study of computed vs measured high b‐value (1400 s/mm(2)) diffusion‐weighted MR images of the prostate. World J Radiol 2014 Jun 28;6(6):374‐80. Rosenkrantz AB, Mannelli L, Kong X, Niver BE, Berkman DS, Babb JS, et al. Prostate cancer: utility of fusion of T2‐weighted and high b‐value diffusion‐weighted images for peripheral zone tumor detection and localization. J Magn Reson Imaging 2011 Jul;34(1):95‐100. Padhani AR, Liu G, Koh DM, Chenevert TL, Thoeny HC, Takahara T, et al. Diffusion‐weighted magnetic resonance imaging as a cancer biomarker: consensus and recommendations. Neoplasia. 2009 Feb;11(2):102‐25. Maas MC, Futterer JJ, Scheenen TW. Quantitative evaluation of computed high B value diffusion‐weighted magnetic resonance imaging of the prostate. Invest Radiol 2013 Nov;48(11):779‐86. Metens T, Miranda D, Absil J, Matos C. What is the optimal b value in diffusion‐weighted MR imaging to depict prostate cancer at 3T? European Radiol 2012 Mar;22(3):703‐9. Rosenkrantz AB, Hindman N, Lim RP, Das K, Babb JS, et al. Diffusion‐weighted imaign of the prostate: comparison of b1000 and b2000 image sets for index lesion detection. J Magn Reson Imaging 2013;38:694‐700 Bieencourt LK, Attenberger UI, Lima D, Strecker R, de Oliveira A, et al. World J Radiol 2014 (6);374‐380 Medved M, Soylu‐Boy FN, Karademir I, Sthei I, Yousef A, et al. High‐resolution diffusion‐weighted imaging of the prostate. AJR 2014:203:85‐90 Iwazawa J, Mitani T, Sassa S, Ohue S. Prostate cancer detection with MRI: is dynamic contrast‐enhanced imaging necessary in addition to diffusion‐weighted imaging? Diagn Interv Radiol. 2011 Sep;17(3):243‐8. Hoeks CM, Somford DM, van Oort IM, Vergunst H, Oddens JR, Smits GA, et al. Value of 3‐T multiparametric magnetic resonance imaging and magnetic resonance‐guided biopsy for early risk restratification in active surveillance of low‐risk prostate cancer: a prospective multicenter cohort study. Invest Radiol 2014 Mar;49(3):165‐72. Vourganti S, Rastinehad A, Yerram NK, Nix J, Volkin D, Hoang A, et al. Multiparametric magnetic resonance imaging and ultrasound fusion biopsy detect prostate cancer in patients with prior negative transrectal ultrasound biopsies. J Urol 2012 Dec;188(6):2152‐7. Hegde JV, Chen MH, Mulkern RV, Fennessy FM, D'Amico AV, Tempany CM. Preoperative 3‐Tesla multiparametric endorectal magnetic resonance imaging findings and the odds of upgrading and upstaging at radical prostatectomy in men with clinically localized prostate cancer. Int J Radiat Oncol Biol Phys 2013 Feb 1;85(2):e101‐7.

45
Cornud F, Khoury G, Bouazza N, Beuvon F, Peyromaure M, Flam T, et al. Tumor target volume for focal therapy of prostate cancer‐does multiparametric magnetic resonance imaging allow for a reliable estimation? J Urol 2014 May;191(5):1272‐9. Kuru TH, Roethke MC, Rieker P, Roth W, Fenchel M, Hohenfellner M, et al. Histology core‐specific evaluation of the European Society of Urogenital Radiology (ESUR) standardised scoring system of multiparametric magnetic resonance imaging (mpMRI) of the prostate. BJU international. 2013 Dec;112(8):1080‐7. Somford DM, Hamoen EH, Futterer JJ, van Basten JP, Hulsbergen‐van de Kaa CA, Vreuls W, et al. The predictive value of endorectal 3 Tesla multiparametric magnetic resonance imaging for extraprostatic extension in patients with low, intermediate and high risk prostate cancer. J Urol 2013 Nov;190(5):1728‐34. Tamada T, Sone T, Higashi H, Jo Y, Yamamoto A, Kanki A, et al. Prostate cancer detection in patients with total serum prostate‐specific antigen levels of 4‐10 ng/mL: diagnostic efficacy of diffusion‐weighted imaging, dynamic contrast‐enhanced MRI, and T2‐weighted imaging. Am J Roentgenology 2011 Sep;197(3):664‐70. Miller GJ, Cygan JM. Morphology of prostate cancer: the effects of multifocality on histological grade, tumor volume and capsule penetration. JURO. 1994 Nov;152(5 Pt 2):1709–13. Arora R, Koch MO, Eble JN, Ulbright TM, Li L, Cheng L. Heterogeneity of Gleason grade in multifocal adenocarcinoma of the prostate. Cancer. 2004;100(11):2362–6. Karavitakis M, Ahmed HU, Abel PD, Hazell S, Winkler MH. Margin status after laparoscopic radical prostatectomy and the index lesion: implications for preoperative evaluation of tumor focality in prostate cancer. Journal of Endourology. 2012 May;26(5):503–8. Algaba F, Montironi R. Impact of prostate cancer multifocality on its biology and treatment. Journal of Endourology. 2010 May;24(5):799–804. Wise AM, Stamey TA, McNeal JE, Clayton JL. Morphologic and clinical significance of multifocal prostate cancers in radical prostatectomy specimens. Urology. 2002 Aug;60(2):264–9. Epstein JI. Prognostic significance of tumor volume in radical prostatectomy and needle biopsy specimens. The Journal of Urology. 2011 Sep;186(3):790–7. van der Kwast TH, Amin MB, Billis A, Epstein JI, Griffiths D, Humphrey PA, et al. International Society of Urological Pathology (ISUP) Consensus Conference on Handling and Staging of Radical Prostatectomy Specimens. Working group 2: T2 substaging and prostate cancer volume. Modern Pathology. Nature Publishing Group; 2010 Sep 3;24(1):16–25. Rud E, Klotz D, Rennesund K, Baco E, Berge V, Lien D, Svindland A, Lundeby E, Berg RE, Eri LM, Eggesbø HB. Detection of the Index Tumor and Tumor Volume in Prostate Cancer using T2w and DW MRI alone. BJU Int. 2014 Jan 21. doi: 10.1111/bju.12637. [Epub ahead of print] PubMed PMID: 24447606.

46
Section V: Staging Engelbrecht MR, Jager GJ, Laheij RJ, Verbeek AL, van Lier HJ, Barentsz JO. Local staging of prostate cancer using magnetic resonance imaging: a meta‐analysis. European Radiol 2002 Sep;12(9):2294‐302.
Johnston R, Wong LM, Warren A, Shah N, Neal D. The role of 1.5 Tesla magnetic resonance imaging in staging prostate cancer. ANZ J Surg2013 Apr;83(4):234‐8. Wang L, Mullerad M, Chen HN, Eberhardt SC, Kattan MW, Scardino PT, Hricak H. Prostate cancer: incremental value of endorectal MR imaging findings for prediction of extracapsular extension. Radiology. 2004;232:133‐9. Renard‐Penna R, Roupret M, Comperat E, Ayed A, Coudert M, Mozer P, et al. Accuracy of high resolution (1.5 tesla) pelvic phased array magnetic resonance imaging (MRI) in staging prostate cancer in candidates for radical prostatectomy: results from a prospective study. Urologic Oncology. 2013 May;31(4):448‐54.
Thoeny HC, Froeliich JM, Triantafyllou M, Huesler J, Bains LJ, et al. Metastases in norma‐sized pelvic lymph nodes: detection with diffusion‐weighted MR imaging. Radiology 2014;273:125‐135
Baco E, Rud E, Vlatkovic L, Svindland A, Eggesbø HB, Hung AJ, et al. Predictive value of Magnetic Resonance Imaging Determined Tumor Contact Length for Extra‐capsular Extension of Prostate cancer. J Urol. 2014 Aug 20. pii: S0022‐5347(14)04257‐8. doi: 10.1016/j.juro.2014.08.084. [Epub ahead of print] PubMed PMID: 25150643.
Akin O, Sala E, Moskowitz CS, Kuroiwa K, Ishill NM, Pucar D, et al. Transition zone prostate cancers: features, detection, localization, and staging at endorectal MR imaging. Radiology. 2006 Jun;239(3):784‐792.
Sector Map Credit:
The prostate sector map was modified by David A. Rini, Department of Art as Applied to Medicine, Johns Hopkins University. It is based on previously published figures by Villers et al (Curr Opin Urol. 2009;19:274‐82) and Dickinson et al (Eur Urol. 2011;59:477‐94) with anatomical correlation to the normal histology of the prostate by McNeal JE (Am J Surg Pathol. 1988 Aug;12:619‐33).

47
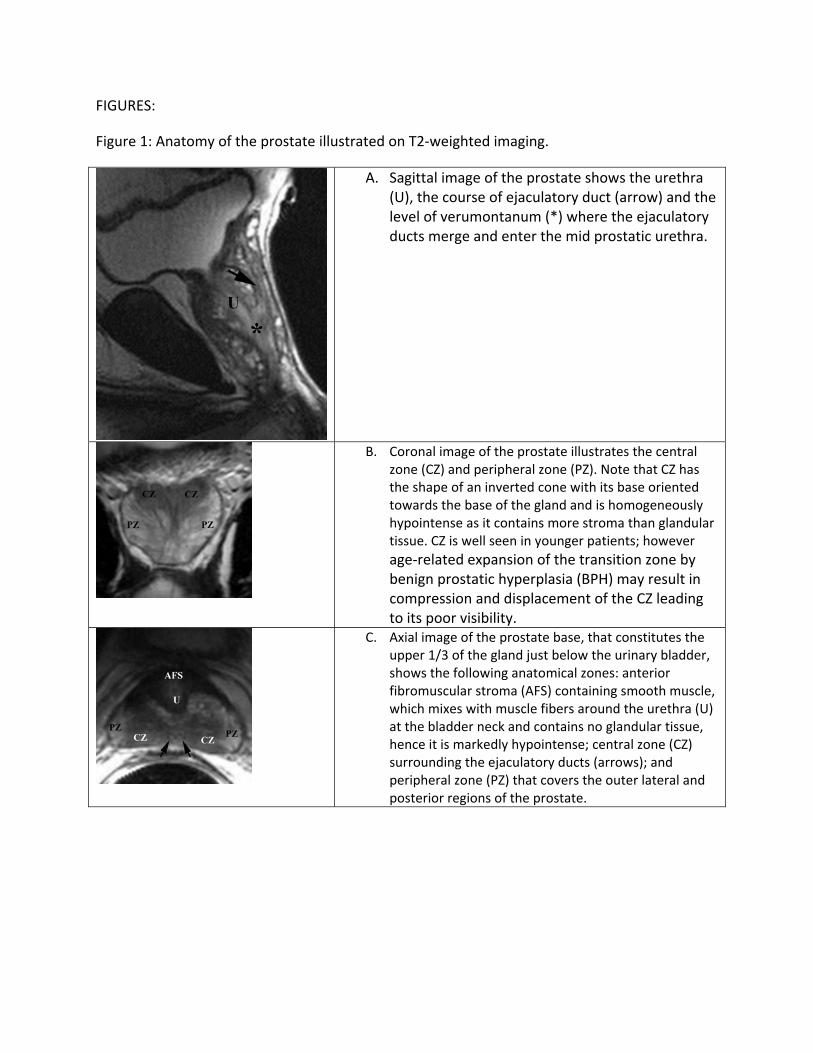
FIGURES:
Figure 1: Anatomy of the prostate illustrated on T2‐weighted imaging.
A. Sagittal image of the prostate shows the urethra (U), the course of ejaculatory duct (arrow) and the level of verumontanum (*) where the ejaculatory ducts merge and enter the mid prostatic urethra.
B. Coronal image of the prostate illustrates the central zone (CZ) and peripheral zone (PZ). Note that CZ has the shape of an inverted cone with its base oriented towards the base of the gland and is homogeneously hypointense as it contains more stroma than glandular tissue. CZ is well seen in younger patients; however
age‐related expansion of the transition zone by benign prostatic hyperplasia (BPH) may result in compression and displacement of the CZ leading to its poor visibility.
C. Axial image of the prostate base, that constitutes the upper 1/3 of the gland just below the urinary bladder, shows the following anatomical zones: anterior fibromuscular stroma (AFS) containing smooth muscle, which mixes with muscle fibers around the urethra (U) at the bladder neck and contains no glandular tissue, hence it is markedly hypointense; central zone (CZ) surrounding the ejaculatory ducts (arrows); and peripheral zone (PZ) that covers the outer lateral and posterior regions of the prostate.
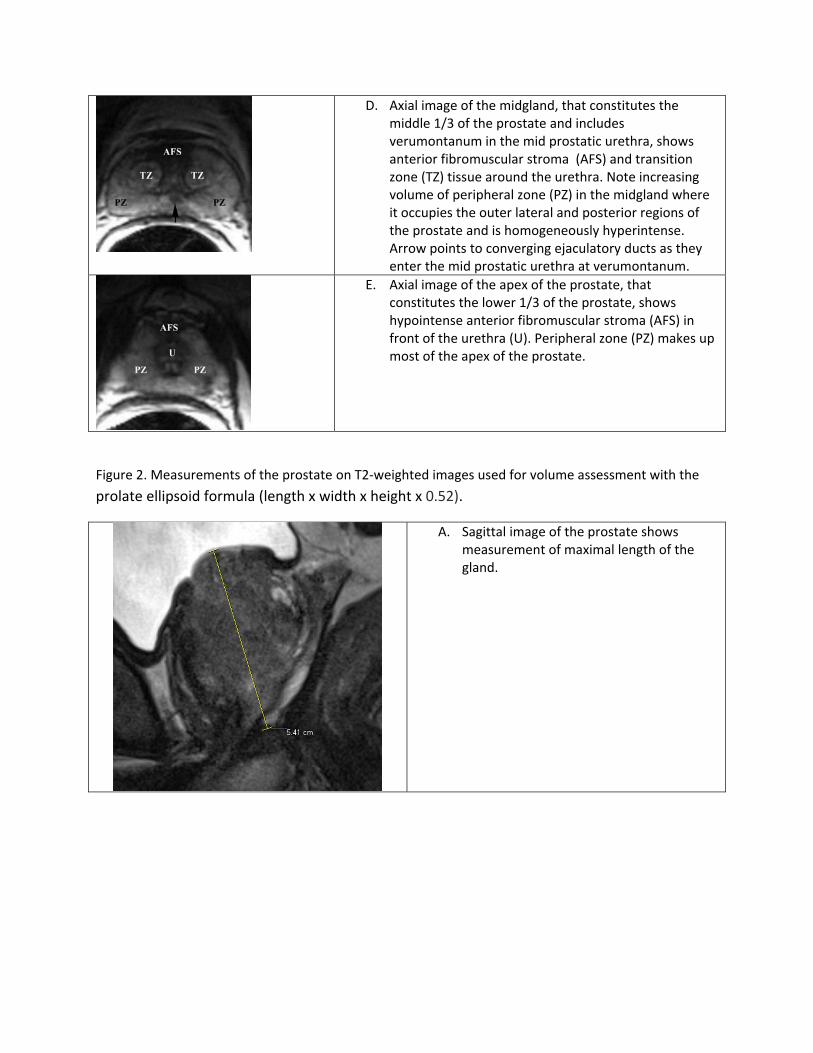
D. Axial image of the midgland, that constitutes the middle 1/3 of the prostate and includes verumontanum in the mid prostatic urethra, shows anterior fibromuscular stroma (AFS) and transition zone (TZ) tissue around the urethra. Note increasing volume of peripheral zone (PZ) in the midgland where it occupies the outer lateral and posterior regions of the prostate and is homogeneously hyperintense. Arrow points to converging ejaculatory ducts as they enter the mid prostatic urethra at verumontanum.
E. Axial image of the apex of the prostate, that constitutes the lower 1/3 of the prostate, shows hypointense anterior fibromuscular stroma (AFS) in front of the urethra (U). Peripheral zone (PZ) makes up most of the apex of the prostate.
Figure 2. Measurements of the prostate on T2‐weighted images used for volume assessment with the
prolate ellipsoid formula (length x width x height x 0.52).
A. Sagittal image of the prostate shows measurement of maximal length of the gland.
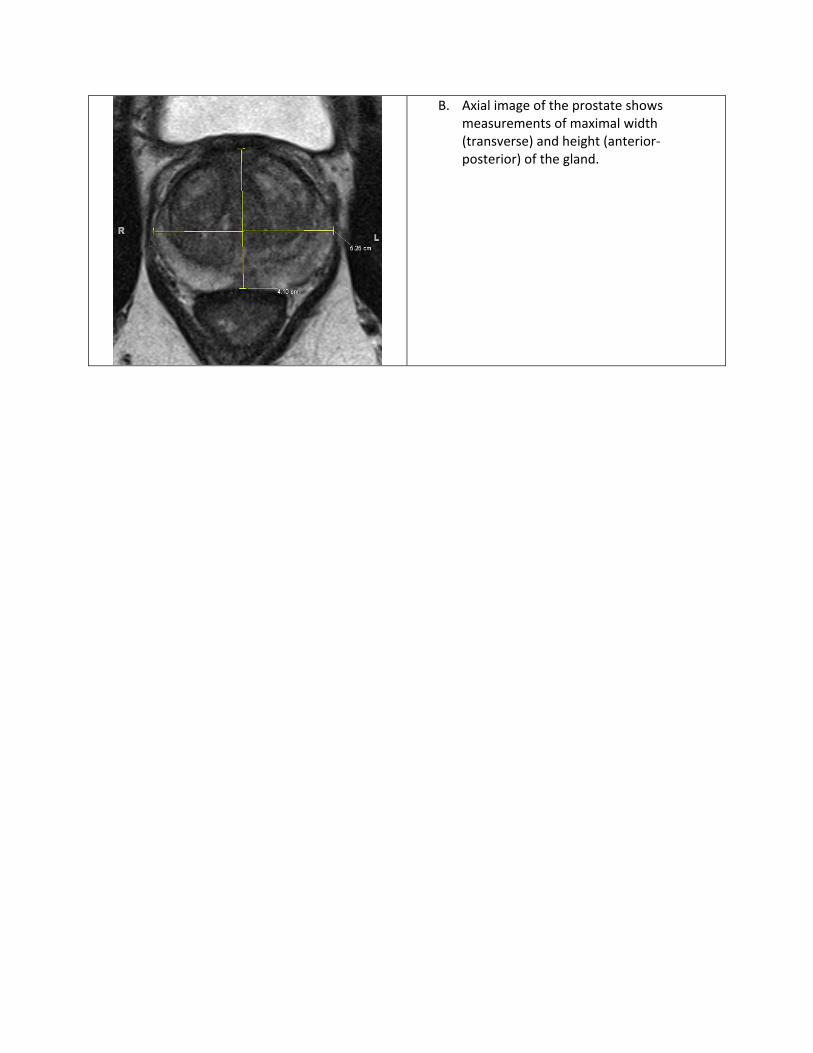
B. Axial image of the prostate shows measurements of maximal width (transverse) and height (anterior‐posterior) of the gland.
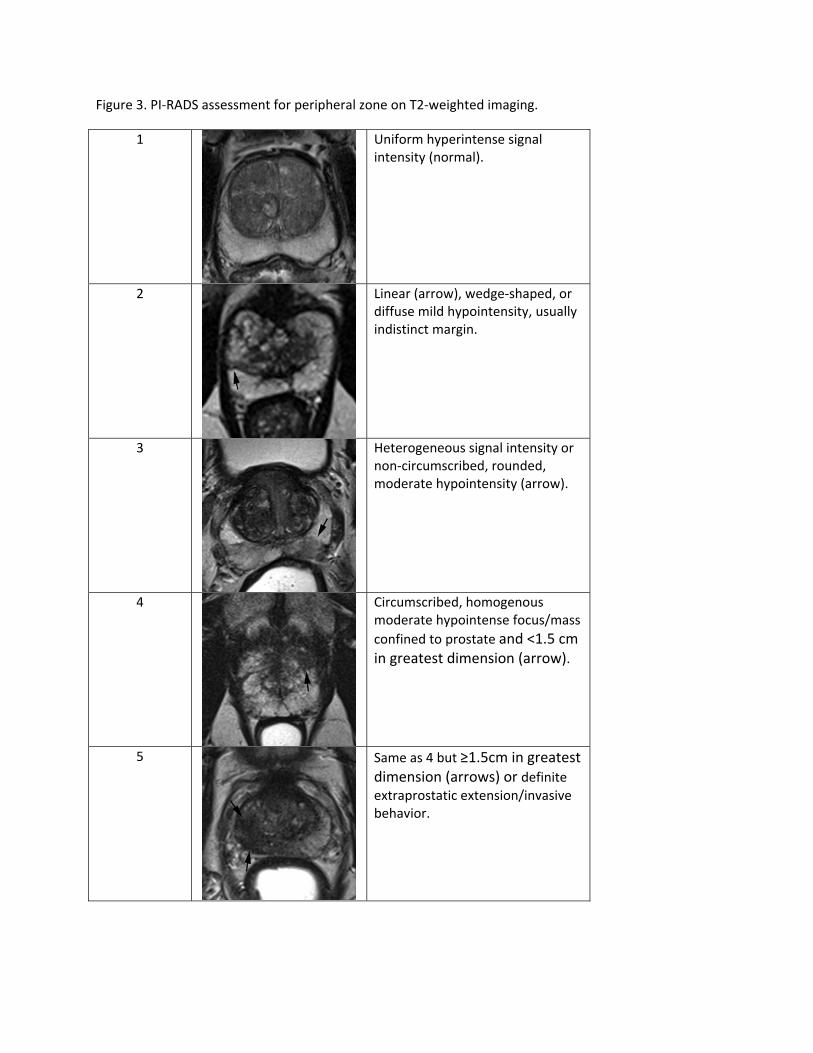
Figure 3. PI‐RADS assessment for peripheral zone on T2‐weighted imaging.
1 Uniform hyperintense signal intensity (normal).
2 Linear (arrow), wedge‐shaped, or diffuse mild hypointensity, usually indistinct margin.
3 Heterogeneous signal intensity or non‐circumscribed, rounded, moderate hypointensity (arrow).
4 Circumscribed, homogenous moderate hypointense focus/mass
confined to prostate and <1.5 cm in greatest dimension (arrow).
5 Same as 4 but ≥1.5cm in greatest dimension (arrows) or definite extraprostatic extension/invasive behavior.
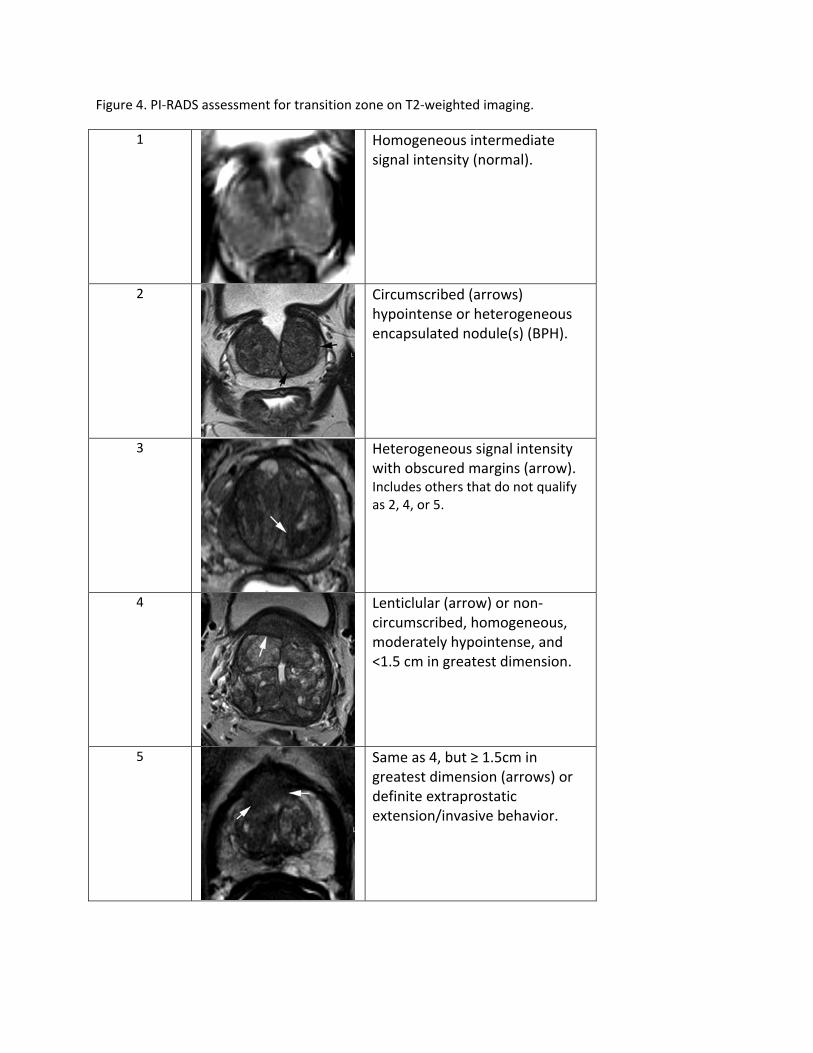
Figure 4. PI‐RADS assessment for transition zone on T2‐weighted imaging.
1 Homogeneous intermediate signal intensity (normal).
2 Circumscribed (arrows) hypointense or heterogeneous encapsulated nodule(s) (BPH).
3 Heterogeneous signal intensity with obscured margins (arrow). Includes others that do not qualify as 2, 4, or 5.
4 Lenticlular (arrow) or non‐circumscribed, homogeneous, moderately hypointense, and <1.5 cm in greatest dimension.
5 Same as 4, but ≥ 1.5cm in greatest dimension (arrows) or definite extraprostatic extension/invasive behavior.
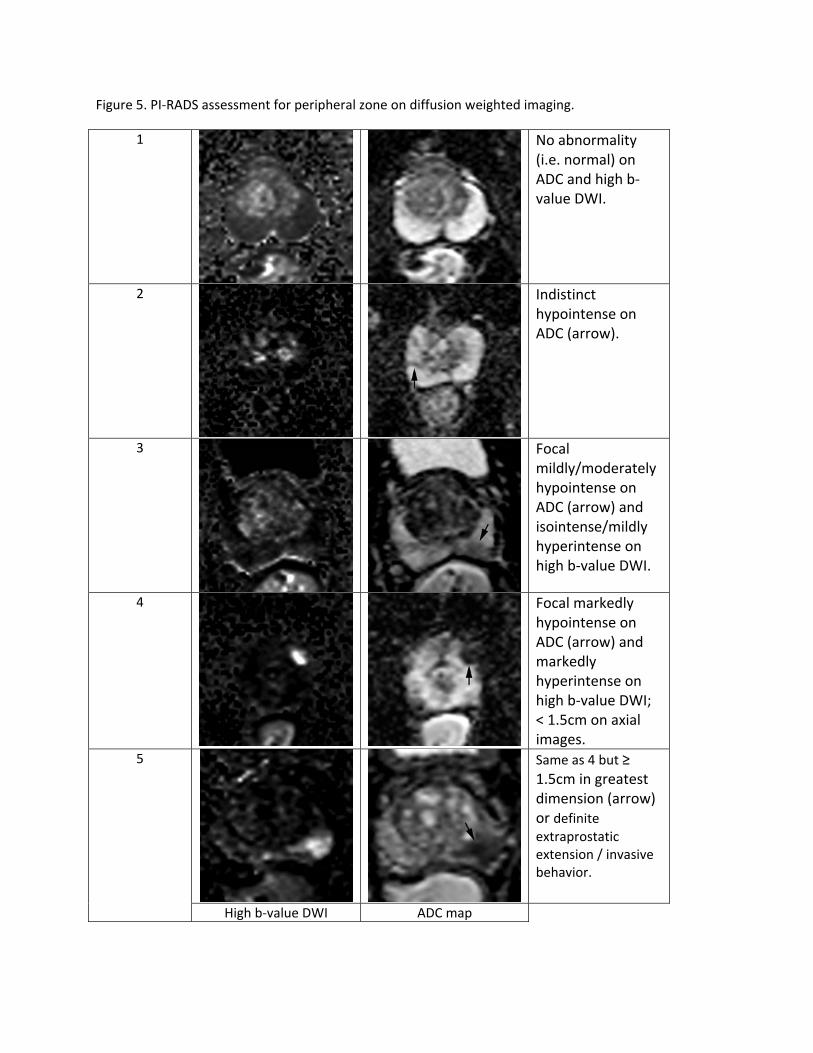
Figure 5. PI‐RADS assessment for peripheral zone on diffusion weighted imaging.
1 No abnormality (i.e. normal) on ADC and high b‐value DWI.
2 Indistinct hypointense on ADC (arrow).
3 Focal mildly/moderately hypointense on ADC (arrow) and isointense/mildly hyperintense on high b‐value DWI.
4 Focal markedly hypointense on ADC (arrow) and markedly hyperintense on high b‐value DWI; < 1.5cm on axial images.
5 Same as 4 but ≥ 1.5cm in greatest dimension (arrow) or definite extraprostatic extension / invasive behavior.
High b‐value DWI ADC map
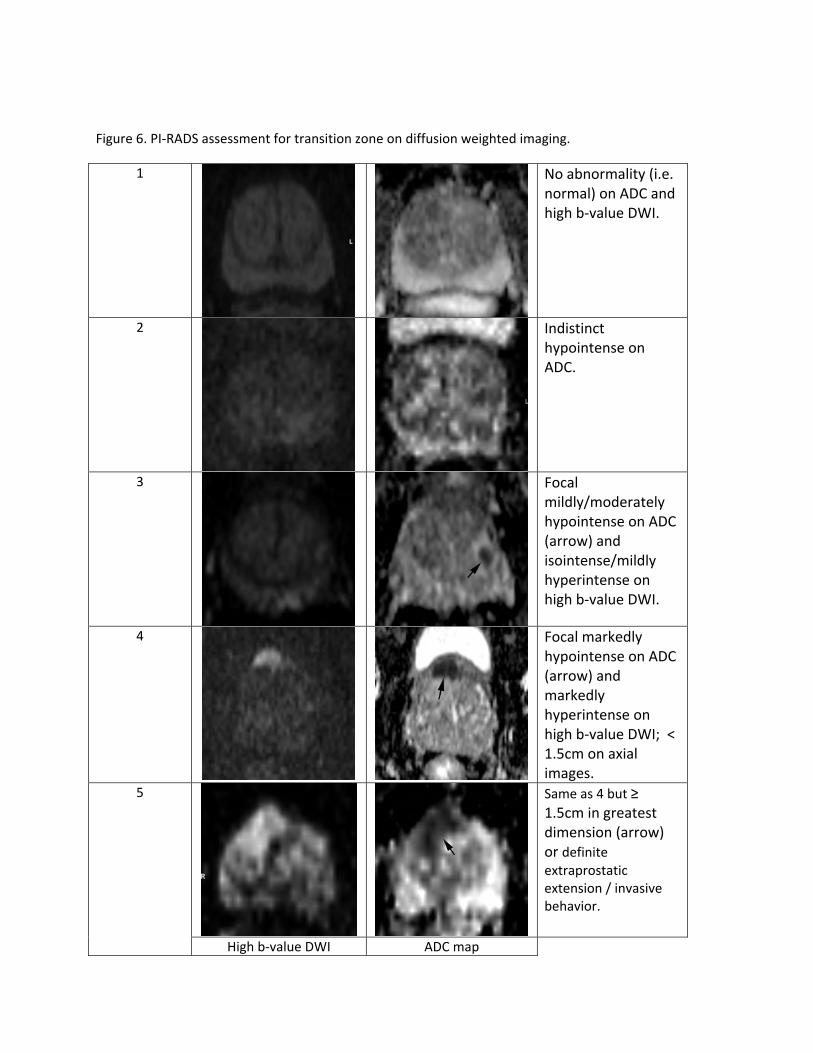
Figure 6. PI‐RADS assessment for transition zone on diffusion weighted imaging.
1 No abnormality (i.e. normal) on ADC and high b‐value DWI.
2 Indistinct hypointense on ADC.
3 Focal mildly/moderately hypointense on ADC (arrow) and isointense/mildly hyperintense on high b‐value DWI.
4 Focal markedly hypointense on ADC (arrow) and markedly hyperintense on high b‐value DWI; < 1.5cm on axial images.
5 Same as 4 but ≥ 1.5cm in greatest dimension (arrow) or definite extraprostatic extension / invasive behavior.
High b‐value DWI ADC map

Figure 7. PI‐RADS assessment for dynamic contrast enhanced MRI.
Negative
No early enhancement, or; diffuse enhancement not corresponding to a focal finding on T2WI and/or DWI, or; focal enhancement corresponding to a lesion demonstrating features of BPH on T2WI
Positive Peripheral Zone Transition Zone
Focal (arrow), and; earlier than or contemporaneously with enhancement of adjacent normal prostatic tissues, and; corresponds to suspicious finding on T2WI and/or DWI