phytosociological analysis in disturbed zone of the gatumba
TRANSCRIPT

142 Gakwerere et al.
Int. J. Biosci. 2013
RESEARCH PAPER OPEN ACCESS
Phytosociological analysis in disturbed zone of the Gatumba
mining area, Ngororero district, Rwanda
François Gakwerere1, Ildephonse Habarugira1*, Pontien Ndabaneze2
1Kigali Institute of Education. POBox 5039, Kigali, Rwanda
2The Inter University Council for East Africa, Kampala, Uganda
Key words: Diversity, performance index, phytosociological analysis, plant community, rehabilitation.
doi: http://dx.doi.org/10.12692/ijb/3.9.142-155
Article published on September 15, 2013
Abstract
The Gatumba mining area is one among the zones disturbed by the mining activities in Ngororero district, west
of Rwanda. The aim of the study was to investigate the plant community, to indentify plant species and describe
the vegetation of the Gatumba mining area and to suggest species that can be used for rehabilitation of the
disturbed area. The floristic data were analysed in accordance with the Braun-Blanquet procedures, Jaccard
similarity index and Shannon index for the plant diversity analysis. A total of 35 families were recorded with 83
genera, and 103 species (31 monocotyledones, 68 dicotyledones, 1 gymnosperm and 3 pteridophytes). The most
represented family was Poaceae with 19,6% species, followed by Asteraceae with 15% species. These two families
are known to colonize disturbed areas and usually demonstrate adaptation to unfavorable conditions. The
results showed that the vegetation was diversified and heterogeneous and four plant communities collectively
made by a mixture of shrubby and grassy vegetation. The dominant species are annual, related to human
activity. Indigenous species have disappeared in the area which demonstrates the negative impact of the mining
and agricultural activity on the plant community of the area. The species Tithonia diversifolia, Sesbania sesban
and Crotalaria dewildemaniana were found to be the most indicated for rehabilitation of the disturbed area.
* Corresponding Author: Ildephonse Habarugira [email protected]
International Journal of Biosciences | IJB |
ISSN: 2220-6655 (Print) 2222-5234 (Online)
http://www.innspub.net
Vol. 3, No. 9, p. 142-155, 2013

143 Gakwerere et al.
Int. J. Biosci. 2013
Introduction
Rwanda is a small country (26,338 km2), located
within the centre of the Albertine Rift, in the western
arm of the Africa’ s Rift Valley, which is considered to
be the highest in species richness in Africa and makes
the country ideal for focus on issues of conservation
(REMA, 2009). Rwanda shelters 2,150 plant species
known today; the number of plant species found in
this country is far from being totally fully identified
and new species are still being discovered. Rwanda’s
natural vegetation is regional mosaic comprising
Guineo-Congolese and Sudanese vegetation types
which includes savannah with grasses, bushes and
trees; mountain rain forests and mountain meadows;
forest galleries, swamps and aquatic vegetation
(MINITERE and ISAR, 2007).
Rwanda constitutes the Eastern limit for plants from
the Guineo-Congolian region. An example is the
Thonningia sanguinea VAHL. (Balanophoraceae),
which is widespread in Western and central Africa,
and is found in Cyamudongo forest, in the Western
part of Rwanda (REMA, 2009). Plants from the
Afromontane region are confined to higher altitudes,
such as the orchid Disa robusta found in Nyungwe
forest (REMA, 2009). The East African Savannah
elements comprise the Zambezian floral region, and
most of these plants are found in Akagera National
Park and its surroundings (Fischer and Killmann,
2007). Some species found all over the country in
Rwanda include Ficus thonningii BLUME, Euphorbia
tirucalli L., Erythrina abyssinica LAM. ex A. RICH.,
Vernonia amygdalina DELILE, Dracaena
afromontana MILDBR.. These plant species have
been traditionally planted around the households
since long time ago in Rwanda. The country is
currently covered by 21% of forests in total
(MINAGRI, 2012). Total vegetation area continues to
decline in Rwanda because of human activities
including agriculture, mining and urbanization.
Mining has caused significant land erosion and severe
pollution of rivers and streams surrounding the area
and destroyed the local vegetation. Moreover, the
increase in price of Coltan Tantalum in the
international market has resulted in an
overexploitation of Gatumba mining zone. As a
consequence, natural vegetation cover was removed
and top soil washed away, exposing bare soil or rock
which reduced available land for cultivation in a
highly populated region (Byiringiro and Biryabarema,
2008).
This current study regards to the effect of coltan
excavation on vegetation in Gatumba mining area and
possible ways to mitigate by using local plant species.
Previous study of the vegetation in the vicinity of the
Gatumba mining area (Ndabaneze et al., 2008)
showed that native vegetation had almost
disappeared in that area and has been replaced by
other local and exotic plant species such as Lantana
camara L. The mine spoils are colonized by natural
vegetation or used for cultivation of annual crops and
small-scaled farming systems have been developed.
In the framework of the national policy on
environment conservation there is a need to
systematically rehabilitate all the areas disturbed by
the mining and quarries exploitation by using local
plant species among others. To undertake such
important activity in the Gatumba mining zone a
survey of the vegetation was necessary in order to
help in selecting plant species that can be
recommended to be used in the rehabilitation
process.
The study aims to evaluate the impact of the mining
activity on the plant communities in the study area
and identify plant species that easily grow in that
particular area. Hence, according to the plant species
found the study will guide the management decisions
in selecting plant species that are the most suitable
for the rehabilitation process of the disturbed area.
Materials and methods
The study area
The study area covered the Gatumba mining zone.
Administratively, it is located in Ngororero district,
Western province, Rwanda. With regards to the

144 Gakwerere et al.
Int. J. Biosci. 2013
coordinates of Gatumba mining area, it is bounded by
the following coordinates: latitude 1°53’ and 1°56’ S;
29°37’ and 29°40’ E. The study area covers an area of
about 12 km2. It is found in two cells of Gatumba
sector, namely Cyome and Ruhanga cells, which are
administrative subunits of sectors and subunits of a
district.
Topography and soils at Gatumba mining area
The typical Soil Reference Groups (WRB, 2006)
identified the types of soils found in the investigated
area of Gatumba mining as technosol, greysol,
cambic-fluvisol, fluvisol, luvisol, umbrisol, lixisol and
leptosol. The soils of the Gatumba mining area are
typical soils of the tropical highlands of Rwanda. They
are relatively young, flat grounded, influenced by
landslides and soil flushing, containing non-
weathered material and often characterised by higher
soil fertility than lowland soils (FAOSTAT, 2007).
Climate of the study area
Ngororero District is characterized by a tropical
climate with an average annual temperature of 18ºC
but this varies with altitude (Table 1).
Ngororero district has a bimodal rainfall pattern with
short rains from October to December and long rains
from March to June. At an average altitude of 1700 m
asl, the annual mean precipitation in the Gatumba
mining area amounts to 1200 mm. The Gatumba
area receives rain throughout the year, with the
maximum precipitation in March and minimum in
July. The year 2010 had slightly more rain than 2009
(Fig. 1).
Transect methods
The phytosociological study was conducted by using
the transect method (Troupin, 1966) due to the
apparent heterogeneity of the vegetation in the study
area. In total, four sites (Ruhanga, Birambo, Mpare
and Rwasare) were investigated comprising 20
transects. Each transect was 50m long and plots of
4m2 were placed at every 10m along the selected
transect. The sampling sites were selected according
to historical and present mining activities, plant
communities, and archived photographs of mining.
The selection of transect orientation was guided by
the floristic heterogeneity and the plant physiognomy
encountered on ground. For each of the 20 transects
selected the type of soil was identified according to
the Soil Reference Groups (Table 2).
Plant species were identified according to Troupin
(1978, 1982, 1985 and 1988). Local names were
provided by local population in the field and were also
helpful for plant identification.
Data processing
From the transect method used for plant sampling,
each plant was assigned a coefficient of Abundance-
Dominance (AD). This coefficient is the average
percentage of the surface covered by the individual
plant species present in a sampled site. Estimation of
average surface covered by plant species and
allocation of AD coefficient were done according to
Braun-Blanquet (1934) cited in Troupin (1966) (Table
3). The medium of coverage classes is considered to
be the most significant but it gives a very big
importance to the elevated surface coverage. This
method has the merit of being operational on the data
obtained on the ground over the other methods
developed by van der Maarel (1975) which has the
higher scale value.
In order to analyse plant communities, the following
phyto-sociological parameters were calculated
(Troupin, 1966):
1) Presence (P) represents the presence or absence of
a plant species along a transect;
2) Frequency (F) is the presence rate of plant species
along transects and is given by the following formula:
100 N
PF
where N is the number of sampling points (relevés).
3) Relative frequency (RF) is the percentage rate of
the frequency of one plant species compared to the
total frequencies of plant species of a transect, and it
is calculated using the formula in below:

145 Gakwerere et al.
Int. J. Biosci. 2013
100F
FRF
4) Dominance (D) is the sum of all medium coverage
for each plant species within the transect. The
relative dominance (RD) is the percentage rate of the
dominance of one plant species compared to the total
dominance of all species within transect and is
calculated as:
100D
DRD
5) Frequency- dominance (FD) is the sum of relative
dominance and relative frequency.
6) Performance index is the dominance of a
species along a transect which is calculated according
to the following formula:
100FD
FD
Different transects were compared to assess the
similarity and dissimilarity of plant sample sets based
on Jaccard similarity index (J) (Jaccard, 1908)
calculated by the formula:
cba
aJ ji
,
where i and j are a set of two transects, a is the
number of plant species present in the two transects,
b is the number of plant species present only in the
first transect, and c is the number of plant species
present only in the second transect.
The Jaccard coefficients were calculated using
Multivariate Statistical Package (MVSP) (Kovach,
1993) and displayed on horizontal axis of different
dendrograms. According to Gillet (2000), the value of
Jaccard similarity index varies from 0 (very dissimilar
vegetation) to 1 (very similar). If J is <0.5, the
vegetation investigated is heterogeneous and if it is
>0.5, the vegetation is homogeneous.
Shannon diversity index (H) (1948) was used to
measure the diversity in categorical order. It was
calculated using the following formula:
)10log(1
s
i
i PiPH
where Pi is the fraction of the entire population made
up of species i, and s is the number of species
encountered on site. After using MVSP for Shannon
diversity index calculation, the H values of the indices
were typically compared to ½ log10 N, where N
represents the total number of plant species found in
a given site. When the H value is higher than the ½
log10 N, the studied vegetation is considered as
diversified.
Results
From a total of 20 transects selected, 103 plant
species were collected and grouped into 83 genera
and 35 families, dominantly representing flowering
plants, including 31 monocotyledons and 68
dicotyledons (Fig. 2, Table 4). Among the
monocotyledons the dominant family was Poaceae,
with 19.6% of total species collected while for the
dicotyledons, the dominant family was Asteraceae,
with 15% of total species collected in the study area.
Rare non-flowering plants were also found, and they
include gymnosperms and pteridophytes representing
1% and 3%, respectively. From the overall number of
plant species found on the study site, Ruhanga site
has the largest number of plant species (77), followed
by Mpare site (44) and Birambo site (40), while the
lowest numbers of plant species was found at
Rwasare site (36).
Table 1. Monthly temperatures (in oC) of Ngororero District, adapted from data of Gisenyi meteorological center
(2010).
Months/ Year
Jan Feb Mar Apr May Jun Jul Aug Sep Oct Nov Dec Average
2009 19.8 19.5 20.2 19.9 20.1 20.2 19.9 21.1 20.9 20.4 19.9 20 20.16
2010 20.6 21.1 20.6 20.3 20.8 20.1 20 21.3 20.2 20.1 20 20.1 20.43

146 Gakwerere et al.
Int. J. Biosci. 2013
Floristic analysis per site
For each site investigated in study area, a number of
dominant plant species were found, based on the
above-mentioned list and using the performance
index as a criterium. Performance index was
calculated for each plant in each transect at every site
and this allowed to determine dominant plant species
for each site (Fig. 3).
Table 2. Transects location and respective soil types.
Site Transects Soil types
Ruhanga T1 Technosol
T12 Technosol
T2 Technosol
T13 Technosol
T3 Technosol
T14 Technosol
T4 Technosol
T15 Technosol
T5 Lixisol
T16 Cambic-Fluvisol
Birambo T10 Fluvisol
T20 Fluvisol
T9 Fluvisol
T19 Fluvisol
Rwasare T8 Fluvisol
T11 Fluvisol
Mpare T7 T17
Fluvisol Fluvisol
T11 Cambic-Fluvisol
Birambo T6 Fluvisol
In Ruhanga site (Fig 3a) Digitaria abyssinica
dominates herbaceous stratum with performance
index of 45.5% values. It is followed by Digitaria
velutina with 33.5% and Crotalaria dewildemaniana
with 26.7%. The vegetation of Ruhanga site can be
defined as a plant association of shrubby-grassland
dominated by Digitaria abyssinica, Digitaria
velutina, Lantana camara, Crotalaria
dewildemaniana, and Sesbania sesban
It was also observed that the Ruhanga soil is very
disturbed by mining and other human activities and
its Technosol soil type is covered by poor vegetation.
At this site during the study, the mining activities
were still going on for extraction of coltan and other
minerals. The extraction of mineral was done on steep
slope which facilitated the movement of soil as land
slide
In Mpare site (Fig 3b) the vegetation was dominated
by Digitaria abyssinica with the performance index
equivalent to 36.1%, followed by Digitaria velutina
with 15.2%, Erythrina abyssinica (14.7%) and
Ageratum conyzoides L with 11.4%. Thus, the
vegetation of Mpare site can be defined as a shrubby-
grassland made by an association dominated by
Digitaria abyssinica, Erythrina abyssinica and
Ageratum conyzoides. The type of soil found in
Mpare was fluvisol with influence of water flow from
Ruhanga mining site.
Table 3. Medium coverage of the Abundance-Dominance coefficients.
Abundance-Dominance (AD) coefficient Braun-
Blanquet (1934)
Range in coverage (%) Medium coverage (%)
5 100-75 87.5 4 75-50 62.5
3 50-25 37.5 2 25-5 15
1 <5 2.5 + Low coverage 0.2 r one individual 0.1
Rwasare site (Fig 3c) the vegetation was dominated
by Erythrina abyssinica with 14.7% followed by
Ageratum conyzoides with performance index of
12.2%. The herbaceous stratum was represented by
147 Gakwerere et al.
Int. J. Biosci. 2013
Digitaria abyssinica. Thus, the vegetation of Rwasare
site can be defined as a shrubby-grassland made of
association of Ageratum conyzoides, Erythrina
abyssinica, Bambusa vulgaris and Digitaria
abyssinica. The soil type found in this site was
fluvisol due to its richness in limon and other
sediments characterizing this type of soil.
In Birambo site (Fig 3d) Cyperus papyrus dominates
with a performance index of 44.5%. The next
dominant plant species were Leersia hexandra,
Polygonum pulchrum and Bridelia micrantha with
performance indices of 35.3%, 29.2% and 16.1%
respectively. The vegetation of Birambo site can be
defined as a shrubby-grassland made of Cyperus
papyrus, Leersia hexandra, and Polygonum
pulchrum association. The soil was a fluvisol, which
was very rich in humus brought by affluent streams of
Nyabarongo River.
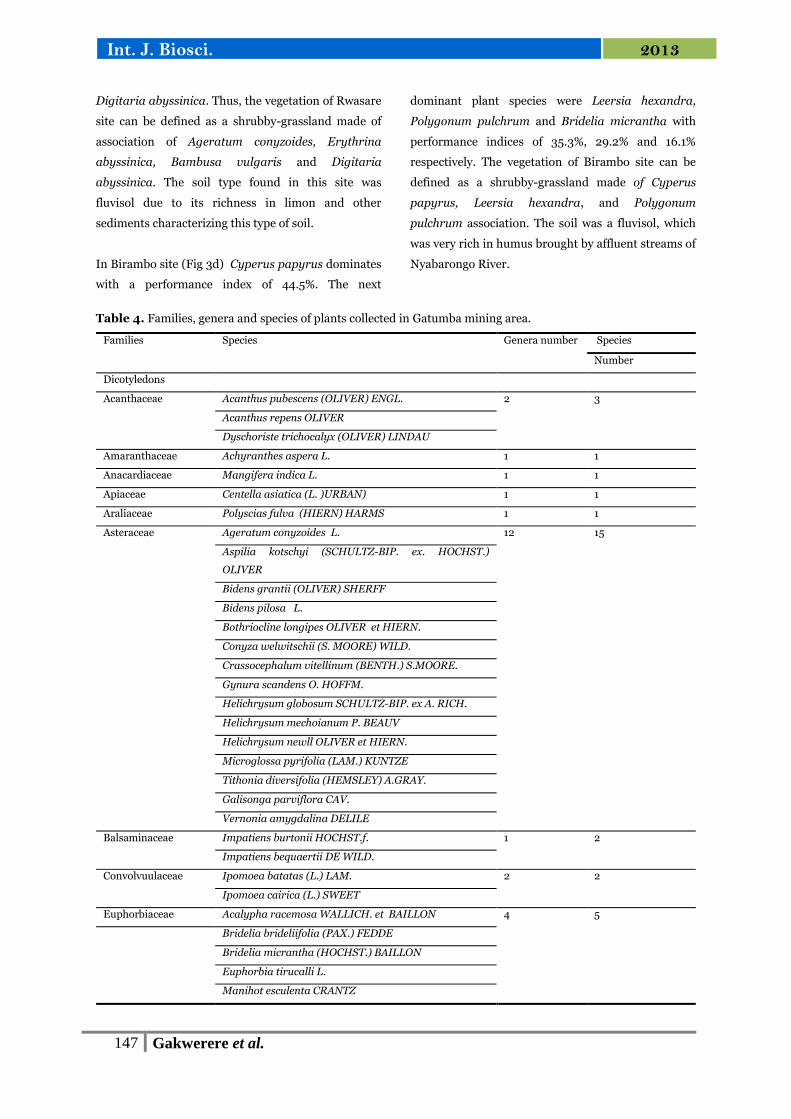
Table 4. Families, genera and species of plants collected in Gatumba mining area.
Families Species Genera number Species
Number
Dicotyledons
Acanthaceae Acanthus pubescens (OLIVER) ENGL. 2 3
Acanthus repens OLIVER
Dyschoriste trichocalyx (OLIVER) LINDAU
Amaranthaceae Achyranthes aspera L. 1 1
Anacardiaceae Mangifera indica L. 1 1
Apiaceae Centella asiatica (L. )URBAN) 1 1
Araliaceae Polyscias fulva (HIERN) HARMS 1 1
Asteraceae Ageratum conyzoides L. 12 15
Aspilia kotschyi (SCHULTZ-BIP. ex. HOCHST.)
OLIVER
Bidens grantii (OLIVER) SHERFF
Bidens pilosa L.
Bothriocline longipes OLIVER et HIERN.
Conyza welwitschii (S. MOORE) WILD.
Crassocephalum vitellinum (BENTH.) S.MOORE.
Gynura scandens O. HOFFM.
Helichrysum globosum SCHULTZ-BIP. ex A. RICH.
Helichrysum mechoianum P. BEAUV
Helichrysum newll OLIVER et HIERN.
Microglossa pyrifolia (LAM.) KUNTZE
Tithonia diversifolia (HEMSLEY) A.GRAY.
Galisonga parviflora CAV.
Vernonia amygdalina DELILE
Balsaminaceae Impatiens burtonii HOCHST.f. 1 2
Impatiens bequaertii DE WILD.
Convolvuulaceae Ipomoea batatas (L.) LAM. 2 2
Ipomoea cairica (L.) SWEET
Euphorbiaceae Acalypha racemosa WALLICH. et BAILLON 4 5
Bridelia brideliifolia (PAX.) FEDDE
Bridelia micrantha (HOCHST.) BAILLON
Euphorbia tirucalli L.
Manihot esculenta CRANTZ

148 Gakwerere et al.
Int. J. Biosci. 2013
Fabaceae Cassia singueanna DELILE 10 12
Rhynchosia minima (L.) DC.
Caesalpinia decapetala (ROTH) ALSTON
Crotalaria dewildemaniana WILCZEK
Crotalaria recta A. RICH.
Desmodium intortum (MILL.) URB.
Eriosema montanum BAKER f.
Erythrina abyssinica LAM. Ex A. RICH.
Indigofera arrecta HOCHST. ex A. RICH.
Rhynchosia luteola (HIERN.) SCHUMANN
Sesbania sesban (L.) MERRILL var nubica CHIOV.
Tephrosia pumila (LAM.) PERSON
Flacourtiaceae Dasylepsis racemosa OLIVER 1 1
Lamiaceae Hoslundia opposita VAHL. 2 2
Leonotis nepetaefolia ( R.BR.) ALTON f.
Malvaceae Triumfetta cordifolia A. RICH.
2
3
Hibiscus ludwigii ECKLON et ZEYHER.
Hibiscus noldeae BAK. f.
Melastomataceae Dissotis ruandensis ENGL. 1 1
Myrtaceae
Psidium guajava L. 2
2
Eucalyptus ficifolia F.J.MUELL
Myricaceae Myrica silicifolia HOCHST. ex A. RICH. 1 1
Myrsinaceae Maesa lanceolata FORSSKAL. 1 1
Onagraceae Ludwigia abyssinica A. RICH. 1 1
Oxalidaceae Biophytum petersianum KLOTZSCH 2 2
Oxalis latifolia KUNTH
Passifloraceae Passiflora edulis SIMS. 1 2
Passiflora ligularis JUSS.
Phytolaccaceae Phytolacca dodecandra L’HERIT. 1 1
Polygonaceae Polygonum pulchrum BLUME 1 1
Rosaceae Rubus rigidus SMITH. 1 1
Rubiaceae Spermacoce princeae (SCHUMANN) VERDC. 1 1
Verbanaceae Clerodendrum myricoides (HOCHST.) R.BR. ex VATKE 2 3
Clerodendrum rotundifolium OLIVER
Lantana camara L.
Monocotyledons
Agavaceae Dracaena afromontana MILDBR. 2 2
Sensevieria dawei STAPF.
Araceae Colocasia esculenta (L.) SCHOTT 1 1
Cyperaceae Cyperus distans L.f. 2 6
Cyperus latifolius POIRET
Cyperus papyrus L.
Cyperus pseudoleptocladus KUEK.
Cyperus rigidifolius STEUDEL
Lipocarpha chinensis (OSBECK)J. KERN
Commelinaceae Commelina benghalensis L. 1 1
Musaceae Musa sapientum L. 1 1
Poaceae Bambusa vulgaris SCHREDER 16 20

149 Gakwerere et al.
Int. J. Biosci. 2013
Brachiaria semiundulata (HOCHST. ex A. RICH)
STAPF
Cynodon nlemfuensis VANDERYST
Digitaria abyssinica (HOCHST. ex A. RCH.) STAPF
Digitaria velutina (FORSSAKAL) P. BEAUV.
Eragrostis exasperata PETER.
Euleusine indica (L.) GAERTN.
Hyparrhenia collina (PILG) STAPF
Hyparrhenia filipendula (HOCHST. ex STEUDEL)
STAPF
Hyparrhenia rufa (NEES)STAFF
Imperata cylindrica (L.)BEAUV.
Leersia hexandra SWARTZ
Melinis minutiflora P.BEAUV.
Panicum chionachne MEZ
Paspalum conjugatum FLUEGGE
Paspalum scrobiculatum L.
Pennisetum purpureum SCHUM.
Rhynchelytum repens (WILLD.) C.E. HUBB.
Sporobolus pyramidalis P. BEAUV.
Zea mays L.
Non-flowering plants
Pteridaceae Nephrolepis cordiofolia L. 2 2
Pteridium aquilinum (L.)KUHN
Selaginellaceae Selaginella sp. 1 1
Cupressacae Cupressus sp. 1 1
For the overall vegetation of Gatumba mining area
couple of transects have been correlated in order to
analyse their similarities or dissimilarities. This
relationship between transects was highlighted by
Jaccard similarity indices. The vegetation with lower
value of Jaccard index of 0.5 was classified as
heterogeneous, while the one which had a value equal
or higher than 0.5 was classified as homogeneous
Gillet (2000). In twenty transects combined from all
four sites, the dendrogram (Fig. 4) shows that Jaccard
coefficients for some couples of transects (T5-T9, T4-
T8 and T12-T14) are higher than 0.5 values. The
remaining couples of transects present Jaccard
coefficients which are less than 0.5, demonstrating
dissimilarity. Thus, the flora of Gatumba mining area
is heterogeneous.
An overall calculation of the Shannon diversity
indices for the four sites was done to evaluate the
diversity of Gatumba flora as a whole. The threshold
value for the 103 plant species identified in the whole
Gatumba area is ½ log10103= 1,004. All transects
except T2 and T20 possess the Shonnon index values
that are higher than 1,004 (Fig. 5), which indicates
that the flora of Gatumba mining area is diversified in
general.
Discussion
Phytosociological analysis showed that the study area
is mainly cultivated and four plant communities
characterize the area which is dominated by grasses
and to a lesser spatial extent, by shrubs. Those
categories of plant communities include dicotyledons
(66%) with 68 plant species, monocotyledons (30%)
with 31 plant species, pteridophytes (3%) and
gymnosperms (1%). Ndabaneze et al. (2008) found
the same categories of plants although their
respective frequencies are relatively different from

150 Gakwerere et al.
Int. J. Biosci. 2013
those found in the current study. In this study, the
ratio of monocotyledons to dicotyledons is 1/2.2.
Fig. 1. Monthly rainfall of Ngororero District
(adapted from data of Gisenyi meteorological center
(2010).
Fig. 2. Distribution of plant categories found in
Gatumba mining area.
The natural vegetation in the area which was a forest
as reported by Ndabaneze et al. (2008), has
disappeared and is today represented by very few
indigenous species like Polyscias fulva. According to
the performance index of the species in different sites,
dominant species which characterize the plant
communities in the study area differ from one site to
another. This is probably due to the types of soil but
also to the degree of disturbance by the human
activities. Most of the species identified are annual
and their establishment is in close relation with
human activities including mining and agriculture.
The study revealed that the investigated site is a
highly disturbed area. This is manifested by the
mixture of dominant plant families which are
characteristic of disturbed environments. In fact,
Asteraceae family was found to be dominant (15%)
among dicotyledons while Poaceae was found to be
dominant among monocotyledons (19.6%). According
to Ye et al. (2008) Gramineae and Compositae
manifest universal high tolerances and adaptations to
unfavorable conditions. The Poaceae family was also
reported by Shu et al. (2005) to be one of the
colonizing vegetation in mine tailings with high metal
concentration and low fertility.
Among the identified plant species, we found
Lantana camara L., and Tithonia diversifolia which
are invasive plant species. As Gatumba mining site
undergoes an increasing concentration in metal
elements, this may modify the natural soil
composition and helps in the colonization by new
plant species. This has been confirmed by Knops et al.
(1999) when they observed that contaminated soils
were more exposed to colonization by invasive plant
species easily propagated by birds and with ability to
grow on different types of soil due to loss of local
biodiversity.
Jaccard similarity indices calculated for Gatumba
vegetation were less than 0.5, which characterise
heterogeneous vegetation. This coefficient of 0.5 has
been discussed by Gillet (2000) to distinguish
heterogeneous from homogeneous vegetation. Such
heterogeneous status demonstrates the dissimilarity
between the transects selected in the area, and may be
due to the variability of the types of soil and to the
degree of soil degradation caused by mining activities,
other human activities and other factors such as soil
erosion. Furthermore, the high values of the Shannon
diversity index for most transects indicate that the
flora in Gatumba mining area is diversified with a
large number of species that are relatively evenly
distributed.
Among the plant species growing in the area under
investigation Tithonia diversifolia, Sesbania sesban
and Crotalaria dewildemaniana can be
recommended to be cultivated for rehabilitation.
Though those plants species do not exhibit the
highest performance index in the area they can
produce biomass in a short period. Moreover,

151 Gakwerere et al.
Int. J. Biosci. 2013
Crotalaria dewildemaniana and Sesbania sesban are
able to fix nitrogen and are useful fodder. Thus the
above mentioned species are good candidate species
to be cultivated for mine reclamation where mining
activity has been completed
Fig. 3. Performance indices of dominant plant species in four sites according to their respective soil types (Fluv:
fluvisol, Camb-fluv: cambic-fluvisol, Lixi: lixisol). a: Ruhanga site, b: Mpare site, c: Rwasare site and d: Birambo
site.

152 Gakwerere et al.
Int. J. Biosci. 2013
Fig. 4. Dendrogram of 20 transects of Gatumba
mining area. (T: represents transects).
Fig. 5. Shannon diversity indices for all transects of
the study area.
References
Braun Blanquet J. 1934. Plant sociology. New
York. Reprinted in 1966.
Byiringiro V, Biryabarema M. 2008.
Geomorphologic Processes in Gatumba Mining Area,
Butare. Etudes Rwandaises 1, 45-47.
FAOSTAT, 2007. Statistics by Food and Agriculture
Organization of the United Nations.URL:
http://faostat.fao.org.
Fischer E, Killmann D. 2007: Illustrated field
guide to the plants of Nyungwe National Park, Kigali,
(ISBN 978.3.941326.00.2).
Fousseni F, Xiuhai Z, Chunyu Z, Kperkouma
W, and Koffi A. 2010. Ecological and Numerical
analyses of plant communities of the most conserved
protected area in North-Togo. International Journal
of Biodiversity and Conservation 2, 359-369.
Gillet F. 2000. La phytosociologie synusiale
intégrée: guide méthodologique. Document
du laboratoire d’écologie végétale et de
phytosociologie, Neuchâtel : Université de
Neuchâtel.
Gisenyi meteorological center. 2010. Annual
Report of meteorological data. Kigali. Rwanda.
Institute for Security Studies. 2008. Report of
Institute for Security Studies (ISS). Accessed date:
10/08/2010.
Jaccard P. 1908. Nouvelles recherches sur la
distribution florale. Bulletin de la Société Vaudoise
des sciences naturelles 44, 223-270.
Knops JMH, Tilman D, Haddad NM, Naeem S,
Mitchell CE, Haarstad J, Ritchie ME, Howe
KM, Reich PB, Siemann E, Groth J. 1999.
Effects of plant species richness on invasion
dynamics, disease outbreaks, insect abundances and
diversity. Ecology Letter 2, 286–293.
http://dx.doi.org/10.1046/j.1461-0248.1999.00083.x
Kovach WL. 1993. Multivariate techniques for
biostratigraphical correlation. Journal of the
Geological Society 150, 697-705.
http://dx.doi.org/10.1144/gsjgs.150.4.0697
Minagri. 2012. Ensure a sustainable use of
marshland, MINAGRI target, Kigali, Rwanda.
Minitere.2007. Third National Report of the Conven
tion on Biological Diversity,Kigali, Rwanda.
Ndabaneze P, Muhongere C, Habarugira I.
2008: Sustainable Restitution/Recultivation of
artisanal Tantalum Mining wastelands in Central
Africa: Gatumba flora and vegetation study. Mining
Wetland in central Africa. Etudes Rwandaises 1, 45-
47.
REMA. 2009: Rwanda State of Environment and
Outlook Report.Kigali, Rwanda
153 Gakwerere et al.
Int. J. Biosci. 2013
Shannon CE. 1948: A mathematical theory of
communication. Bell System Technical Journal 27,
379-423 and 623-656. Accessed date: 12/10/2011.
Shu WS, Ye ZH, Zhang ZQ, Lan CY and Wong
MH. 2005. Natural colonization of plants on five
lead/zinc mine tailing in Southern China. Restoration
Ecology 13, 49-60.
http://dx.doi.org/10.1111/j.1526-100X.2005.00007.x
Troupin G. 1966. Etude Phytocénologique du Parc
National de l’Akagera et Rwanda Oriental. Recherche
d’une méthode d’analyse appropriée ả la végétation
d’Afrique intertropicale. Tervuren: Belgique
Troupin G. 1978. Flore du Rwanda.
Spermatophytes. Volume I. Musée royal de l’Afrique
Centrale, Tervuren: Belgique
Troupin G. 1985. Flore du Rwanda,
Spermatophytes. Volume III. Musée Royal de
l’Afrique Centrale, Tervuren: Belgique.
Troupin G. 1988. Flore du Rwanda,
Spermatophytes, volume IV. Musée Royal de
l’Afrique Centrale, Tervuren: Belgique.
Van der Maarel E. 1975. The Braun-Blanquet
approach in perspective. Plant Ecology 30, 213-219.
WRB. 2006. World Reference Base for soil
resources. World Soil Resources Reports, 103, Food
and Agriculture Organization of the United Nations,
IUSS Working Group. Rome, Italy.
Ye M, Li JT, Tia SN, Hu M, Yi S, Liao B.
2008: Biogeochemical studies of metallophytes from
copper-enriched sites along the Yangtze River, China.
Environmental Geology 56, 1313-1322.

154 Gakwerere et al.
Int. J. Biosci. 2013
Appendix 2. Absence or presence of plant species in all transects of the study
area.
Plant species T1 T2 T3 T4 T5 T6 T7 T8 T9 T10 T11 T12 T13 T14 T15 T16 T17 T18 T19 T20
Acalypha racemosa 0 0 0 0 1 0 0 0 1 0 0 0 0 0 0 0 0 0 0 0
Acanthus pubescens 0 0 1 1 0 0 0 0 0 0 0 1 1 1 0 0 0 1 0 0
Acanthus repens 0 0 0 0 0 0 0 0 0 0 0 1 0 1 0 0 0 0 0 0
Achyranthes aspera 0 0 0 0 0 0 0 0 0 0 0 0 0 0 0 0 0 1 0 0
Ageratum conyzoides 1 0 0 1 1 1 1 0 1 0 1 1 1 1 1 1 1 1 1 1
Antherotomma naudinii 1 0 0 0 0 0 0 0 0 0 0 0 0 0 0 0 0 0 0 0
Aspilla kotschyi 0 0 0 0 0 0 0 0 0 0 0 0 0 1 0 0 0 0 0 0
Bambusa vulgaris 0 0 0 0 0 0 1 0 0 0 1 0 0 0 0 0 0 1 0 0
Bidens grantii 0 0 0 0 0 0 0 0 0 0 0 1 0 1 1 0 1 0 1 0
Bidens pilosa 0 1 0 0 0 1 0 0 0 0 0 1 1 0 0 0 1 0 0 0
Biophytum petersianum 1 0 0 0 0 0 0 0 0 0 0 1 1 1 0 0 0 0 0 0
Bothriocline longipes 0 0 0 0 0 0 0 0 0 0 0 0 0 0 0 1 0 0 0 0
Brachiaria semiundula 0 0 0 0 0 0 0 0 0 0 0 0 0 0 0 1 1 1 1 0
Bridelia micrantha 0 0 0 1 0 1 1 1 0 1 0 0 0 0 0 0 0 0 0 0
Bridelia brideliifolia 0 0 0 0 0 1 1 0 0 1 0 0 0 0 0 0 0 1 0 0
Caesalpina decapetala 0 0 0 1 0 0 0 1 0 0 0 0 0 0 0 0 0 0 0 0
Cassia singueans 0 0 0 0 0 0 0 0 0 0 0 0 0 1 1 1 0 0 1 0
Centella asiatica 1 1 1 0 1 0 0 0 1 0 0 1 1 1 0 0 1 0 0 0
Clerodendrum myricoides 0 0 0 0 0 0 1 0 0 0 0 0 0 0 0 0 0 0 0 0
Clerodendrum rotundifolium 0 0 0 1 0 0 1 0 0 0 0 0 1 0 0 1 0 0 0 0
Colocasia esculenta 0 0 0 0 0 0 0 0 0 0 1 0 0 0 0 0 0 1 0 0
Commelina benghalensis 0 0 0 0 1 1 0 0 1 1 1 1 1 1 0 0 0 1 1 1
Conyza wewitschii 1 1 0 0 0 1 0 0 0 0 0 0 0 0 0 0 0 0 0 0
Crassocephalum vitellinum 1 1 0 1 0 0 0 0 0 0 0 1 1 1 1 1 1 1 1 0
Crotalaria arrecta 0 0 1 0 0 0 0 0 0 0 0 0 0 1 1 0 0 0 0 0
Crotalaria dewildemaniana 0 0 1 0 0 0 0 0 0 0 0 1 0 1 1 0 0 0 1 0
Cupressus sp 0 0 0 1 0 0 0 1 1 0 0 1 0 1 0 0 0 0 0 0
Cynodon nlemfuensis 0 0 0 0 0 0 0 0 0 0 1 1 0 1 0 0 0 0 0 0
Cyperus distans 0 0 0 0 0 0 0 0 0 0 0 0 1 1 0 0 0 1 0 0
Cyperus latifolia 0 0 0 0 1 0 0 1 0 0 0 0 0 0 0 0 0 0 1 1
Cyperus papyrus 0 0 0 0 1 1 0 0 1 1 0 0 0 0 0 0 0 0 0 1
Cyperus pseudoleptocladus 0 0 0 0 0 0 0 0 0 0 0 0 0 0 0 1 0 0 0 0
Cyperus rigidifolius 0 0 0 0 0 0 0 0 0 1 0 0 0 0 0 0 0 0 1 1
Dasylepsis racemosa 0 0 0 0 0 0 1 0 0 0 1 0 0 0 0 0 0 0 0 0
Desmodium intortum 0 0 0 1 0 0 0 1 0 0 0 0 0 0 0 0 0 0 0 0
Digitaria abyssinica 1 1 1 1 1 1 0 1 1 0 1 1 1 1 1 1 0 1 0 0
Digitaria velutina 0 0 0 0 0 0 1 0 0 0 0 0 0 0 0 0 1 0 0 0
Dissotis ruandensis 0 0 0 0 0 0 0 0 0 0 0 0 0 0 0 0 0 1 1 0
Dracoena afromontana 0 0 0 0 0 1 0 0 0 1 0 0 0 0 0 0 0 0 0 0
Dyschoriste trichocalyx 0 0 0 0 1 1 0 0 1 1 1 0 0 0 0 0 0 0 0 0
Eleusine indica 0 0 0 0 0 0 0 0 0 0 1 0 0 0 0 0 0 0 0 0
Eragrostis exasperata 0 0 0 0 0 0 1 0 0 0 0 0 0 0 0 0 0 0 0 0
Eriosema montanum 0 0 1 0 0 0 0 0 0 0 0 0 0 0 0 0 0 0 0 0
Erythrina abyssinica 0 0 0 1 0 0 1 1 0 0 1 0 1 0 0 0 1 1 0 0
Eucalyptus filifolia 0 0 0 0 0 0 0 0 1 0 0 1 0 0 0 0 1 0 0 0
Euphorbia tirucalli 0 0 0 0 0 1 0 0 0 0 0 0 0 0 0 0 0 0 0 0
Galinsoga parviflora 0 0 0 0 0 0 0 0 0 0 0 0 0 0 0 0 1 1 1 1
Gynura scandens 0 0 0 0 0 0 0 0 0 0 1 1 1 1 1 1 1 1 1 0
Helichrysum globosum 0 0 0 0 0 0 1 0 0 0 0 0 0 0 0 0 0 0 1 0
Helichrysum mechoianum 1 0 0 1 0 0 0 1 0 0 0 0 0 0 0 0 0 0 0 0
Helichrysum newll 0 0 0 0 0 0 0 0 0 0 0 1 0 0 0 0 0 0 0 0
Hibiscus ludwigii 0 0 0 0 0 0 1 0 0 0 1 0 0 1 0 0 0 0 0 0

155 Gakwerere et al.
Int. J. Biosci. 2013
Hibiscus noldeae 0 0 1 0 0 0 0 0 0 0 0 0 0 0 0 0 0 0 0 0
Hoslundia opposita 1 0 0 1 0 0 0 0 0 0 1 1 1 1 1 0 0 0 0 0
Hyparrhenia collina 0 1 0 0 0 0 0 0 0 0 0 0 1 1 1 0 0 0 0 0
Hyparrhenia filipendula 0 0 0 0 0 1 0 0 0 1 0 0 0 0 0 0 1 0 0 0
Hyparrhenia rufa 0 1 0 0 0 0 0 0 0 0 0 0 0 0 0 0 0 0 0 1
Impatiens bequartii 0 0 0 0 0 0 0 0 0 0 0 0 1 0 0 0 0 0 0 0
Impatiens burtonii 0 0 0 0 0 0 0 0 0 0 0 0 0 0 0 0 0 1 0 0
Imperata cylindrica 0 0 0 0 0 0 0 1 0 0 0 0 0 0 0 0 0 0 0 0
Indigofera arrecta 0 0 1 0 0 0 0 0 0 0 0 1 0 0 0 0 0 0 1 0
Ipomoea batatas 1 0 0 0 0 1 0 0 0 0 1 1 1 1 0 0 1 1 0 0
Ipomoea cairica 0 0 0 0 0 0 1 0 0 0 1 0 1 1 0 1 1 1 0 0
Lantana camara 0 0 0 1 0 0 1 1 0 0 0 0 0 0 0 0 0 0 0 0
Leersia hexandra 0 0 0 0 1 1 0 0 1 1 0 0 1 0 0 0 0 0 1 1
Leonotis nepetaefolia 0 0 0 0 0 0 1 0 0 1 1 0 0 0 0 0 0 1 1 0
Lipocarpha chinensis 0 0 0 0 0 0 0 0 1 0 0 0 0 0 0 0 0 0 1 1
Ludwigia abyssinica 0 0 0 0 1 0 1 0 1 1 0 0 0 0 0 0 0 0 0 1
Maesa lanceolata 0 0 0 0 0 0 1 0 0 0 0 0 0 0 0 0 0 0 0 0
Mangifera indica 0 0 0 0 0 1 0 0 0 1 0 0 0 0 0 0 0 0 0 0
Manihot esculenta 0 0 0 0 0 1 1 0 0 0 0 0 1 0 0 0 1 0 0 0
Melinis minutiflora 1 1 0 0 0 0 1 1 0 0 0 1 1 1 1 1 1 1 0 0
Microglossa pyrifolia 0 0 0 0 0 0 0 0 0 0 0 1 0 0 0 0 0 0 0 0
Musa sapientum 0 0 0 0 0 1 0 0 0 1 0 0 0 0 0 0 0 0 0 0
Myrica salicifolia 1 0 0 0 0 0 1 0 0 0 0 0 1 0 0 0 0 0 0 0
Nephrolepis cordifolia 0 0 0 0 0 0 0 1 0 0 0 0 0 0 0 0 0 1 1 0
Oxalis latifolia 0 0 0 0 0 1 0 0 0 1 0 0 1 0 0 1 0 0 0 0
Panicum chionachne 0 1 0 0 0 0 1 0 0 0 0 0 0 0 0 0 0 0 1 0
Paspalum conjugatum 0 0 1 0 0 0 0 0 0 0 0 0 0 0 0 0 0 0 0 0
Paspalum scrobiculatum 0 0 0 1 0 0 0 1 0 0 0 0 0 0 0 0 0 0 0 0
Passiflora edulis 0 0 0 0 0 0 1 0 0 0 1 0 0 0 0 0 0 1 0 0
Passiflora ligularis 0 0 0 1 0 0 0 1 1 0 0 0 0 0 0 0 0 0 0 0
Pennisetum purpureum 0 0 0 1 1 0 0 1 1 0 1 0 0 0 0 1 0 1 1 0
Phytolacca dodecandra 0 0 0 1 0 0 1 0 0 0 0 0 0 0 0 0 0 1 0 0
Polygonum pulchrum 0 0 0 0 1 1 1 0 1 0 1 0 0 0 1 0 0 0 1 1
Polyscias fulva 0 0 0 0 0 0 0 1 0 1 0 0 0 0 0 0 0 0 0 0
Psidium guajava 0 0 0 0 0 1 1 0 0 0 0 0 0 0 0 0 0 0 0 0
Pteridium aquilinum 0 0 0 0 0 0 1 0 1 1 1 1 1 1 0 0 0 0 0 0
Rhynchelytrum repens 0 0 0 1 0 0 0 1 0 0 0 0 0 0 0 0 0 0 0 0
Rhynchosia luteola 0 0 0 0 0 0 0 0 0 0 0 1 0 0 0 0 0 0 0 0
Rhynchosia minima 0 0 0 0 0 0 0 0 0 0 0 0 0 1 0 0 0 0 0 0
Rubus rigidus 0 0 0 1 0 1 0 1 1 1 0 1 0 1 0 0 0 0 0 0
Selaginella sp. 0 0 0 0 0 0 0 0 0 0 0 1 0 1 0 0 0 0 0 0
Senseviera dawei 0 0 0 1 0 0 0 1 0 0 0 0 0 0 0 0 0 0 0 0
Sesbania sesban 0 0 1 0 0 0 0 0 0 0 0 0 0 1 1 0 1 0 0 0
Spermacoce princae 0 0 0 0 0 0 0 0 1 0 0 1 1 1 0 0 1 0 0 0
Sporobolus pyramidalis 0 1 0 0 0 0 0 0 0 0 0 0 0 0 0 0 0 0 0 0
Tephrosia pumila 0 0 0 0 0 0 0 0 0 0 0 0 0 1 0 0 0 0 0 0
Tithonia diversifolia 0 0 0 0 0 0 0 0 0 0 0 0 1 0 0 0 0 0 0 0
Triumfetta codifolia 0 0 0 1 1 1 0 1 1 1 1 0 1 1 1 0 1 1 1 0
Vernonia amygdalina 0 0 1 1 0 1 0 0 0 0 0 0 0 0 0 0 1 0 0 0
Zea mays 0 0 0 0 0 0 0 0 0 0 0 0 0 0 0 0 0 1 0 0