physiological sensing for affective...
TRANSCRIPT

Physiological Sensing for
Affective Computing
Dissertation by
Christian Peter
Submitted to the Faculty of Computer Science and Electrical Engineering, Rostock University
for receiving the academic title of
Doktor-Ingenieur (Dr.-Ing.)
Submitted October 31, 2011
by Christian Peter, Rostock, Germany
born September 11, 1968 in Rostock, Germany
urn:nbn:de:gbv:28-diss2012-0075-3

Thesis supervisor
Prof. Dr. Bodo Urban, Universität Rostock, 18059 Rostock, Albert Einstein Str. 21
Reviewers
Prof. Dr. Lars Schwabe, Universität Rostock, 18059 Rostock, Albert Einstein Str. 21
Prof. John A. Waterworth, Umeå University, SE-90187 Umeå, Sweden
This thesis has been defended on May 09, 2012.

Abstract The study of emotion is a well-established field of research with a history ranging back more than a hundred years. Applying this knowledge to the development of more user-centred technical systems started over a decade ago, within the domain of human-computer interaction (HCI) and is commonly called affective computing. The affective computing community still has to deal with several challenges in order to apply psychological knowledge to their technical field and to actually design affective systems.
This thesis addresses two aspects related to enabling systems to recognize the affective state of people and respond sensibly to it. First, the issue of representing affective states and unambiguously assigning physiological measurements to those is addressed by suggesting a new approach based on the dimensional emotion model of valence and arousal, avoiding many disadvantages of common approaches. Second, the issue of sensing affect-related physiological data is addressed by suggesting a concept for physiological sensor systems that live up to the requirements of adaptive, user-centred systems. The solutions developed in this thesis have been implemented and tested in several projects and proved their applicability.
Deutsche Zusammenfassung Affective Computing ist eine Teildisziplin der Informatik, die bei der Gestaltung von Mensch-Maschine Schnittstellen die Emotionen des Nutzers berücksichtigt. Hierzu bedient sie sich der Erkenntnisse der Emotionsforschung, einer Forschungsrichtung der Psychologie mit über hundertjähriger Tradition. Trotz des verfügbaren großen Wissensschatzes über menschliche Emotionen fällt es der Affective Computing Gemeinde schwer, robuste, zuverlässige und gleichzeitig benutzerfreundliche „affektive“ Systeme zu schaffen, die unter realen Bedingungen sinnvoll auf erkannte Emotionen einer Person reagieren.
Die vorliegende Arbeit adressiert zwei große Hemmnisse auf dem Weg zu einfach zu bedienenden, zuverlässigen affektiven Systemen. Sie befasst sich zunächst mit der Frage, wie Emotionen digital verarbeitbar dargestellt werden können, so dass Sensordaten, die zur Bestimmung der Emotion einer Person erfasst werden, eindeutig einer emotionalen Zustandsrepräsentation zugeordnet werden können. Basierend auf den Erkenntnissen einer gründlichen Analyse des Standes der Forschung wird ein Konzept erarbeitet welches erlaubt, physiologische Messdaten eindeutig Emotionszuständen zuzuordnen, wobei Probleme klassischer Ansätze hierzu

vermieden werden. Des Weiteren widmet sich die Arbeit der Erfassung emotionsbezogener physiologischer Parameter. Zuverlässige und gleichzeitig einfach benutzbare Verfahren hierfür sind bislang nicht verfügbar, was die Forschergemeinde zwingt, auf weniger geeignete Sensorik zurückzugreifen, was jedoch die Forschungsergebnisse negativ beeinflusst und die Entwicklung affektiver Anwendungen stark behindert. In dieser Arbeit wird ein Konzept für Sensorsysteme vorgestellt, welches die zuverlässige Erfassung relevanter physiologischer Parameter erlaubt, ohne jedoch den Nutzer stark zu beeinträchtigen. Der Schwerpunkt liegt hierbei auf der alltagstauglichen Gestaltung des Systems mit Blick auf Robustheit, Zuverlässigkeit, Integrationsfähigkeit und einfache Bedienbarkeit.
Beide entwickelten Konzepte werden ausführlich beschrieben und beispielhafte Implementationen erläutert. Auf den Konzepten basierende Systeme wurden in verschiedenen Projekten erfolgreich eingesetzt und bewiesen ihre praktische Anwendbarkeit.

Acknowledgements A PhD project is an undertaking that requires a lot of patience, effort and time. Realizing most of it as a spare time activity besides a full-time job and family life requires even more of those. But most important to finally accomplish the task is the encouragement and help of many people. I am very grateful to have had the support of friends and colleagues who motivated me on and again, and who actually helped pushing this project forward by debating and reviewing ideas, implementing and testing hard- and software, and evaluating many little parts that came into being in the course of this project. All those people deserve my humble thanks, for without them this thesis wouldn't exist.
First of all my family be mentioned, my wife and my kids. They endured so many evenings and nights without me being mentally present, and days with me being too tired to be a good partner at home, the chess board, or the football ground. I am very grateful for their enduring understanding and love which encouraged me to finally bring this long project to an end. Also my parents deserve my deep thanks. They supported me from my first days on and equipped me with the right mix of curiosity, inquiring mind and perseverance that was needed to pursue this project for such a long time.
Very special thanks go to Antje Lichtenstein, without who the psychology-based parts of this work would not be as well-founded and well thought-out. Her excellent psychological knowledge combined with her ability to communicate patiently with a more technical person led to many inspiring discussions, often resulting in new ideas and further investigations to be performed. She permanently drove me forward with her ever new questions and ideas and convinced me to jointly summarize our ideas in a paper that finally became our first journal paper (in Interacting with Computers, then as Antje Herbon). I am very happy that we carried on working together at many occasions and are befriended until now.
I would also like to express my thanks to Prof. Beikirch from Rostock University who gave significant support in developing the different hardware implementations of the EREC system and encouraged me to keep on trying and testing new variants of the system.
I'd also like to thank all the researchers and project partners who used the EREC system in various scenarios and provided valuable feedback for improving the system: Nadine Nowack, Hubert Janik and Karin Kraft from Rostock University, Elke van der Meer from Humboldt University to Berlin, Roland Göcke from National ICT Australia and now Australian National University, Martin Tischler from Daimler AG, Johannes

Böing and Juliane Hellhammer from daacro GmbH Trier, Syed Shahbaz Hussain from KTH Stockholm, Pieter Blignaut and Tanya Beelders from the University of the Free State in Bloemfontein, South Africa, Sabine Wollstädter and Hans-Rüdiger Pfister from University of Lüneburg, and Siti Ibrahim and Nadia Berthouze from University College London - they all have their share in EREC growing from an idea to a usable system.
Many students contributed to this project, be it in the frame of their Bachelor-, Master-, or Diploma project, or as interns. They worked incredibly diligent and highly motivated to give the EREC system its physical existence, implemented various versions of the sensor software, and developed neat visualization tools to view and analyse the physiological data collected with the EREC system – thanks for all of your work!
As this thesis is written in English, I am very grateful for having found friendly people who took the time checking this work to make reading it as pleasant as possible even for native speakers. Beth Crane, Lesley Axelrod and Antje Lichtenstein have sacrificed their spare time for this. As they also are experts in their field of emotion-related research, they voluntarily took the role of peer reviewers, improving the quality of this thesis with highly relevant comments and suggestions – thanks to all of you!
Last but not least I would like to thank my colleagues at Fraunhofer IGD. Steffen Mader, Randolf Schultz, Karina Oertel, and Stephan Ohl contributed to implementing and improving software, testing various versions, and performing studies using the EREC system. Gery Bieber was never too shy to promote my project at conferences, fairs and other occasions, leading to increasing interest in the community and keeping up my spirits. My supervisors Bodo Urban and Jörg Voskamp provided excellent working conditions and gave continuous support and encouragement. Creating the different iterations of the EREC system and evaluating the ideas and concepts developed in this project would not have been possible without their advocacy. Bodo Urban, as my thesis supervisor, deserves special acknowledgements for his persistent support and valuable feedback.
Thank you all.

Contents
1 Introduction ................................................................................................. 1 1.1 Motivation ............................................................................................................ 1 1.2 General approach to physiological sensing for affective computing ................... 2 1.3 Structure of the thesis .......................................................................................... 4 2 Theoretical background ................................................................................ 7 2.1 Introduction ......................................................................................................... 8 2.2 Main approaches to structure emotion ............................................................... 9 2.2.1 Discrete emotion theories and the concept of basic emotions ..................................... 10 2.2.2 Dimensional emotion theories and the Circumplex model of affect ............................. 12 2.2.3 Discussion ....................................................................................................................... 16 2.3 Emotion and HCI ................................................................................................ 20 2.3.1 Affective HCI research .................................................................................................... 20 2.3.2 Designing affective systems ........................................................................................... 23 2.4 Challenges .......................................................................................................... 25 3 Physiological background ........................................................................... 28 3.1 Introduction ....................................................................................................... 28 3.2 Physiological processes relevant to affective computing and ways to measure them ................................................................................ 29 3.2.1 Muscle tension ............................................................................................................... 29 3.2.2 Peripheral vasoconstriction (Blood flow) ....................................................................... 31 3.2.3 Sweat gland activity, electro-dermal activity (EDA) ....................................................... 33 3.3 Measuring emotional signals ............................................................................. 35 3.4 Implications for sensing affective states ............................................................ 36 3.5 Challenges .......................................................................................................... 37 3.6 State of the art in physiological sensing............................................................. 38 3.6.1 Physiological sensor systems .......................................................................................... 38 3.6.2 Implications for HCI ........................................................................................................ 40 3.6.3 Summary ........................................................................................................................ 42 4 Interpretation of physiological data ............................................................ 43 4.1 Introduction ....................................................................................................... 43 4.1.1 Data Pre-processing ....................................................................................................... 45 4.1.2 Feature Extraction .......................................................................................................... 47 4.1.3 Classification ................................................................................................................... 53 4.2 Summary ............................................................................................................ 59

5 A new approach to associate and represent emotional states ..................... 60 5.1 Introduction ........................................................................................................ 60 5.1.1 Challenges addressed ..................................................................................................... 61 5.2 Concept .............................................................................................................. 62 5.2.1 Pure vs. mixed emotions ................................................................................................ 63 5.2.2 Labelling Emotions ......................................................................................................... 65 5.3 Implementation .................................................................................................. 67 5.3.1 Step 1 - acquisition of physiological data and emotion rating ....................................... 68 5.3.2 Step 2 - assigning physiological data to emotion ratings ............................................... 69 5.3.3 Step 3 - clustering ........................................................................................................... 69 5.3.4 Step 4 - finding physiological patterns ........................................................................... 70 5.4 Experimental Validation ..................................................................................... 70 5.4.1 Experiment ..................................................................................................................... 71 5.4.2 Results ............................................................................................................................ 72 6 A new approach to sensing emotion-related physiological parameters........ 78 6.1 Introduction ........................................................................................................ 78 6.1.1 Challenges addressed ..................................................................................................... 78 6.2 Concept .............................................................................................................. 80 6.2.1 Components ................................................................................................................... 81 6.2.2 Data validation ............................................................................................................... 82 6.3 Exemplary implementation ................................................................................ 85 6.3.1 First prototype: EREC-I ................................................................................................... 85 6.3.2 Second prototype: EREC-II .............................................................................................. 88 6.3.3 Data validation ............................................................................................................... 90 6.4 Experimental evaluation .................................................................................... 94 6.4.1 Evaluation scenarios ....................................................................................................... 95 6.4.2 Evaluation results ........................................................................................................... 97 6.4.3 Discussion ..................................................................................................................... 100 7 Affective Application ............................................................................... 102 7.1 Introduction ...................................................................................................... 103 7.2 Applying the affective sensing pipeline ............................................................ 106 7.2.1 Physiological sensing .................................................................................................... 106 7.2.2 Feature extraction and classification ........................................................................... 107 7.2.3 Emotion representation ............................................................................................... 108 7.2.4 Affective application ..................................................................................................... 109 7.2.5 Evaluation ..................................................................................................................... 111 8 Summary ................................................................................................. 114 References Appendix A – Referenced main publications Appendix B – Emotion descriptions Relevant own scientific publications

List of figures
Fig. 1. Pipeline of physiological sensing for affective computing .................................. 3 Fig. 2. Structure of the thesis ......................................................................................... 4 Fig. 3. Chapter 2 in the context of this thesis................................................................. 7 Fig. 4. A Circumplex model of affect ............................................................................ 14 Fig. 5. Physiol. correlates of valence/arousal, derived from categorical assignments ...... 19 Fig. 6. Chapter 3 in the context of this thesis............................................................... 28 Fig. 7. Chapter 4 in the context of this thesis............................................................... 43 Fig. 8. From physiological signals to emotion .............................................................. 44 Fig. 9. Chapter 5 in the context of this thesis............................................................... 60 Fig. 10. Mixed emotions in a two-dimensional space .................................................... 64 Fig. 11. SAM - Self Assessment Manikin ......................................................................... 66 Fig. 12. Emotion ratings in the coordinate system ........................................................ 68 Fig. 13. Clustered emotion ............................................................................................. 69 Fig. 14. SAM-ratings for scenarios 1 through 4 .............................................................. 75 Fig. 15. SAM-ratings for scenarios 2 through 4 .............................................................. 76 Fig. 16. Chapter 6 in the context of this thesis............................................................... 78 Fig. 17. Concept of a physiological sensor system ......................................................... 81 Fig. 18. Schematic view of a SEVA sensor ...................................................................... 84 Fig. 19. EREC first prototype .......................................................................................... 85 Fig. 20. Position of basic sensors in the EREC glove ....................................................... 86 Fig. 21. EREC-II components ........................................................................................... 88 Fig. 22. Basic sensors in EREC-II glove ............................................................................ 89 Fig. 23. Plot of physiological data acquired with the EREC system ................................ 93 Fig. 24. SEVA example for EDA measurement ............................................................... 93 Fig. 25. SEVA example for skin temperature measurement .......................................... 94 Fig. 26. EREC-II evaluation in a car-driving scenario ...................................................... 97 Fig. 27. Chapter 6 in the context of this thesis............................................................. 102 Fig. 28. Yerkes & Dodson’s correlation of arousal and performance .......................... 103 Fig. 29. Regions of interest in the affective space for e-Learning applications ........... 104 Fig. 30. AFFectIX e-Learning system architecture ........................................................ 105 Fig. 31. Affective physiological sensing pipeline as realised in the AFFectIX project ....... 106 Fig. 32. Stage 1 of the AFFectIX affective application architecture ............................. 106 Fig. 33. Stage 2 of the AFFectIX affective application architecture ............................. 107 Fig. 34. Stage 3 of the AFFectIX affective application architecture ............................. 108 Fig. 35. Stage 4 of the AFFectIX affective application architecture ............................. 109 Fig. 36. Application dependent action: adaptation of the learning path ..................... 110


List of tables
Table 1. Summary of physiological correlates with basic emotions ............................. 11 Table 2. Summary of physiological correlates with dimensions valence and arousal ..... 16 Table 3. Physiological correlates of valence, as derived from categorical assignments ..... 18 Table 4. Physiological correlates of arousal, as derived from categorical assignments ..... 18 Table 5. Common values for smoothing windows for physiological parameters ......... 45 Table 6. Inter-beat interval - frequency bands for cardiac activity ................................. 50 Table 7. Elemental features commonly used on physiological data ............................. 51 Table 8. Further supporting features used on physiological data ................................ 52 Table 9. Correlations of physiological measurements with emotion ratings ............... 74 Table 10. Comparison of valence/arousal ratings between groups ............................. 112 Table 11. Comparison of user experience between groups ......................................... 112 Table 12. Comparison of learning success between groups ......................................... 113

Abbreviations
ANS Autonomous Nervous System
bpm Beats Per Minute, common unit of heart rate
cEMG Corrugators electromyogram: EMG readings of movements of the eye brows
CPD Conditional Probability Distribution
DAG Directed Acyclic Graph
DD Detailed Diagnostics (SEVA measure)
DS Device Status (SEVA measure)
EDA Electro-Dermal Activity
EDR Electro-Dermal Response
EMG Electromyogram
EmotionML Emotion Markup Language
EEG Electroencephalogram
EREC Emotion RECognition
FAT File Allocation Table: a common computer file system architecture
GSR Galvanic Skin Response
HCI Human-Computer Interaction
IBI Inter-Beat Interval, time between two consecutive beats
ICT Information and Communication Technology
ISM Industry, Scientific, and Medical: a radio band reserved for industrial, scientific and medical applications
kΩ Kilo Ohm, unit for electrical resistance
LED Light Emitting Diodes: electronic elements the emit light
MMI Multi-Modal Interaction
μS Micro Siemens, unit for electrical conductivity
MVS Measurement Value Status (SEVA measure)

NICTA National ICT Australia, an Australian research institute dedicated to research in the field of information and communication technology
SAM Self-Assessment Manikins: a graphics-based tool for expressing one's feelings
SEVA Short for SElf VAlidating sensors
SCL Skin Conductance Level
SCR Skin Conductance Response
SI the international system of units (abbreviated SI from French: Système International d'unités); often called engineering units
SRL Skin Resistance Level
SRR Skin Resistance Response
SVM Support Vector Machine
USB Universal Serial Bus: a standard for serial communication between devices and a host controller
VISTA Vision Science, Technology and Applications, a research group at NICTA
VMV Validated Measurement Value (SEVA measure)
VU Validated Uncertainty (SEVA measure)
W3C World Wide Web Consortium
zEMG Zygomatic electromyogram: EMG readings of movements of the corners of the mouth

1 Introduction
1.1 Motivation
The next generation of smart technologies will be characterised by their ability to autonomously adapt to the steadily changing needs of their users. The user‘s psychological state, comprising cognition, motivation, and emotion, is an important – if not the most important – contextual information for a system interacting with humans. Only when a system knows how its actions are perceived by the user can it adjust to the user’s needs and fine-tune its actions.
Since emotions are such an important factor of our everyday live, it is only logical that the community of human-computer interaction started to engage in emotion recognition to find out how to best integrate affective knowledge into systems design. The term Affective Computing was created over ten years ago, describing "computing that relates to, arises from, or deliberately influences emotion or other affective phenomena" [Picar 97]. Since then, the community developed various concepts, models, frameworks and demo applications for affective systems and devices. But all activities so far have been just possibility studies, proof-of-concept prototypes or demonstrators. But why is the community not going the next step? Why don't we see fully functional affective applications? Why are there so few demos which actually observe a human user under real life circumstances and then adapt sensibly to the observed emotions? There are different reasons for this:
First, since emotion research usually is done in laboratories, the scientific body of knowledge on emotional reactions in real life situations is still very fragmentary, and there is very little data available on this. Second, underlying models to describe emotional phenomena have been developed by psychologists for their aim to understand emotional processes. These models are built on varying theoretical assumptions which include anatomical and biological aspects as well as different theories about cause and purpose of emotions. It is difficult for HCI researchers to evaluate those models and decide for one or the other, since aspects central to the underlying theories might be irrelevant for human-computer interaction (HCI), but neglecting them falsifies the model and hence questions the scientific quality and seriousness of the performed work. The third reason effectively feeds into obstacles one and two. The community still has no

2
appropriate devices available for observing people in the real life to collect affective information in an unobtrusive way. This makes it difficult to collect real-life data and to do research under real-life situations, leading to researchers sticking to lab studies and lab demos. Fourth and finally there is the sheer complexity of real life that can't be dealt with yet by technological systems. There are so many contextual aspects to be considered, so many possible influences on a human’s behaviour, motivation and feelings, and so many interaction options to be considered, that to date it is simply not possible to make sensible assumptions about a person’s behaviour and mental state without limiting the setting to certain situations with well-known patterns of behaviour, affective triggers, and interaction affordances.
These obstructions let the community stick in a state of having developed numerous great ideas, interaction models, architectures and research frameworks without being able to make the final step into the real life.
This thesis aims to help overcoming obstacles two (emotion models) and three (sensing devices) by developing and evaluating a concept for representing emotions in digital systems, including assignments of physiological readings, and a concept for physiological sensor systems that live up to the requirements of real-time data acquisition in real-world scenarios.
1.2 General approach to physiological sensing for affective computing
Affective computing, as described by Picard [Picar 97], considers three types of affective computing applications. First, systems that detect the affective state of a person; second, systems that themselves express emotions; and third, systems that actually can “feel” emotions. The ability to sense the affective state of a person is crucial for all three types of applications, as “feeling” as well as displaying emotions requires to understand the affective state of the interaction partner.
One of the oldest and best researched ways to infer on the affective state of a person is by observing certain physiological parameters. Many disciplines have contributed to this field of research, contributing insights into affect-related aspects of human physiology and different perspectives on the nature of emotion.

Fig. 1. Pipeline of physiological sensing for affective computing and related research areas
The general approach to sensing affective states is shown in Fig. 1. In a first step, physiological signals are measured by sensing devices which have to be designed appropriately to detect affect-specific changes of the observed physiological processes. The signals are pre-processed and conditioned before being analysed in the next step.
In a second step, the physiological data are analysed for characteristic patterns, called features, which can be correlated to affective phenomena. These features then serve as input for dedicated classification algorithms that calculate the likely emotion experienced by the observed person at the time the physiological data have been acquired.
Knowledge on related aspects of human physiology is required for designing physiological sensors as well as developing suitable algorithms for feature extraction and classification.
Third, the estimated affective state has to be represented in a suitable way to allow for viewing, analysing, and finally using the generated emotion information in an affective application.
Aspects of emotion theory are to be considered when developing feature extraction and emotion classification algorithms. Also, a good theoretical background on emotion is needed to properly represent emotion information in a digital system.
This pipeline contains all steps necessary for providing an affectively adaptive system with the needed information on the ever changing affective state of a person.
Feature Extraction
&Classification
...
Emotion Representation
Phys
iolo
gica
l D
ata
Affe
ctiv
e Ap
plic
atio
n
Aspects of Emotion TheoryAspects of Human Physiology
Emot
ion
Estim
ate
Emot
ion
Repr
es.
PhysiologicalSensing
Phys
iolo
gica
lSi
gnal
s
4
As can be seen in the next chapter, this theses covers all three steps of the affective sensing pipeline and shows its applicability in an affective application. Several challenges that so far hindered the implementation of a fully functional affective application are answered in two dedicated chapters (chapter 5 and chapter 6) and can be considered the main achievement of this thesis.
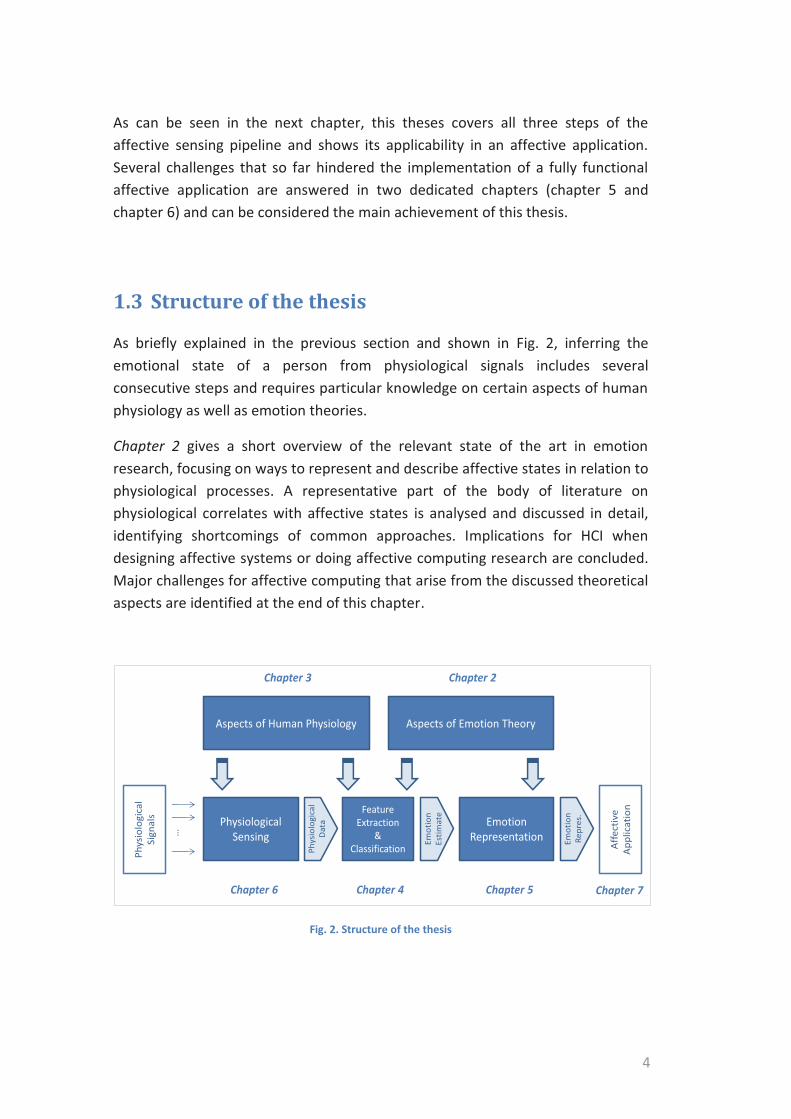
1.3 Structure of the thesis
As briefly explained in the previous section and shown in Fig. 2, inferring the emotional state of a person from physiological signals includes several consecutive steps and requires particular knowledge on certain aspects of human physiology as well as emotion theories.
Chapter 2 gives a short overview of the relevant state of the art in emotion research, focusing on ways to represent and describe affective states in relation to physiological processes. A representative part of the body of literature on physiological correlates with affective states is analysed and discussed in detail, identifying shortcomings of common approaches. Implications for HCI when designing affective systems or doing affective computing research are concluded. Major challenges for affective computing that arise from the discussed theoretical aspects are identified at the end of this chapter.
Fig. 2. Structure of the thesis
Feature Extraction
&Classification
...
Emotion Representation
Phys
iolo
gica
l D
ata
Affe
ctiv
e Ap
plic
atio
n
Aspects of Emotion TheoryAspects of Human Physiology
Chapter 3 Chapter 2
Chapter 5Chapter 6 Chapter 4 Chapter 7
Emot
ion
Estim
ate
Emot
ion
Repr
es.
PhysiologicalSensing
Phys
iolo
gica
lSi
gnal
s

Chapter 3 follows with a selective introduction to human physiology, describing the main physiological processes relevant for sensing affective states. The focus is on the measurable aspects of those processes and most common ways to measure them. After this follows a short discussion concluding implications for HCI, again identifying major challenges that have to be addressed when designing affective systems for real world applications. The chapter ends with a short review of the state of the art in physiological sensing. The focus here is on identifying typical characteristics of sensor systems commonly used in emotion research as well as in affective computing projects and evaluating those on their suitability for real-world applications. Implications for designing affective systems are drawn and requirements for affective sensor systems are described, ready to be addressed when designing affective systems.
Chapter 4 gives an overview of common methods to pre-process and analyse physiological data to identify patterns, or features, related to affective states. Besides basic pre-processing measures, widespread methods for feature extraction are explained, before standard methods for classifying affective states are briefly described.
With this background knowledge provided, the challenges identified in chapter 2 are addressed in chapter 5, dealing with aspects of structuring and representing emotions and assigning physiological measurements to affective states. A new approach is developed, avoiding some of the drawbacks of standard models as identified in chapter 2 and allowing to process affective sensor data in a more straightforward manner. The developed approach has been evaluated in experiments by external partners and has proved to be applicable in HCI settings and suitable for designing affective systems as described at the end of this chapter.
Chapter 6 then continues with addressing challenges identified in chapter 3. Based on the requirements worked out in chapter 3, a sensor system is conceptualized that is well suited for use in real-world scenarios, avoiding many of the drawbacks of current commercial physiological sensor systems. Two iterative implementations of this concept are described briefly, together with their experimental evaluations. The evaluations of the developed systems have been performed by external partners and lead to the improved versions of the system as described in chapter 6.
Chapter 7 provides proof of the applicability of the developed approaches to sensing emotion-related physiological parameters and representing affective states. An affective e-Learning application is described that has been implemented

6
using the developed prototype for sensing relevant physiological data and applies concepts as developed in chapter 5 for representing affective states.
Chapter 8 finally concludes the thesis, summarizing the work and highlighting major findings and contributions to the HCI community.
Two appendices complement the thesis.
Appendix A gives full account on the study developed in Chapter 5. Two papers have been published explaining in detail the theoretical background, the study, and the data analysis. These papers are listed in this Appendix to give full account on the respective details.
Appendix B provides a collection of methods to describe emotions which are used in different emotion research and affective computing projects. This list comprises categories, dimensions, appraisals, and action tendencies as it is provided by the World Wide Web Consortium’s Multimodal Interaction Group’s Emotion Markup standardisation activity. While not being a complete list, it can be considered a compilation of major methods used in actual HCI projects.
2 Theoretical background
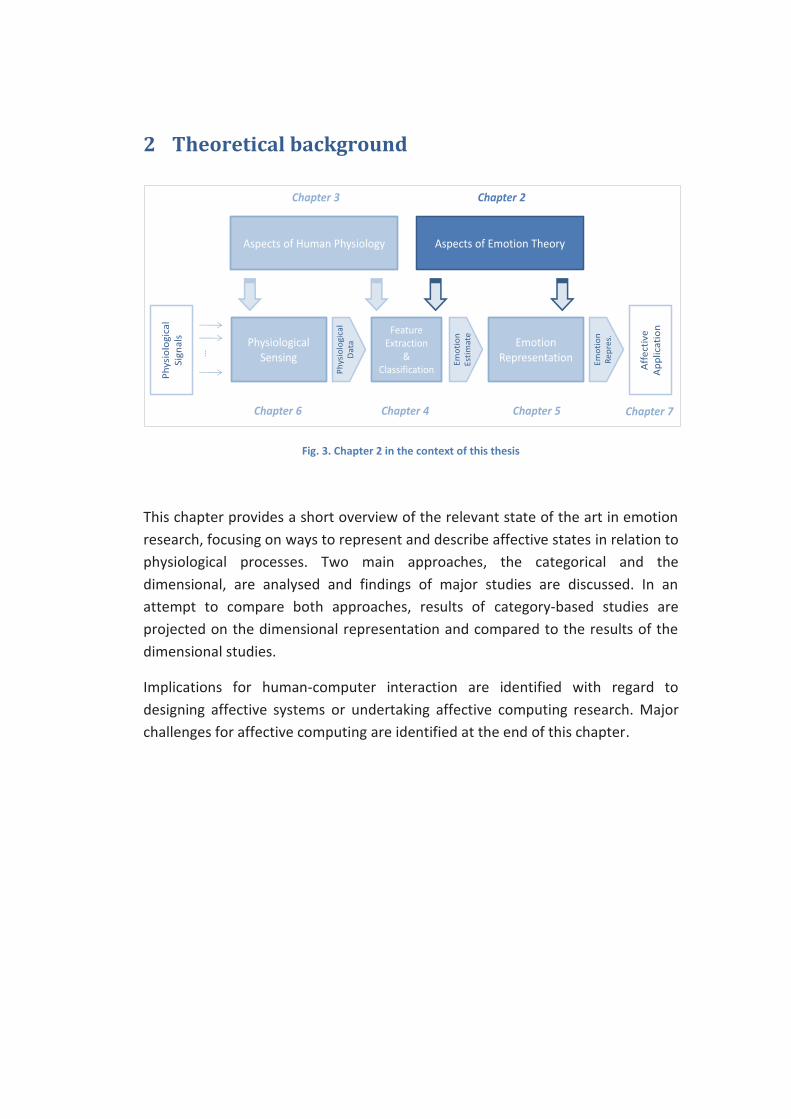
Fig. 3. Chapter 2 in the context of this thesis
This chapter provides a short overview of the relevant state of the art in emotion research, focusing on ways to represent and describe affective states in relation to physiological processes. Two main approaches, the categorical and the dimensional, are analysed and findings of major studies are discussed. In an attempt to compare both approaches, results of category-based studies are projected on the dimensional representation and compared to the results of the dimensional studies.
Implications for human-computer interaction are identified with regard to designing affective systems or undertaking affective computing research. Major challenges for affective computing are identified at the end of this chapter.
Feature Extraction
&Classification
...
Emotion Representation
Phys
iolo
gica
l D
ata
Affe
ctiv
e Ap
plic
atio
n
Aspects of Emotion TheoryAspects of Human Physiology
Chapter 3 Chapter 2
Emot
ion
Estim
ate
Emot
ion
Repr
es.
PhysiologicalSensing
Phys
iolo
gica
lSi
gnal
s
Chapter 5Chapter 6 Chapter 4 Chapter 7

8
2.1 Introduction
Emotions1 have been studied for a long time. Over recent decades, psychologists have developed a number of models describing emotion, from different and partially opposing viewpoints.
While there is a huge variety of emotion models in psychology, emotion related HCI research has for a long time neglected the need of a profound underlying theoretical model of emotions (cf. [Cock 04b], [Mull 04]). Particularly when it comes to using emotional information within digital systems the lack of suitable models becomes obvious. Several models of emotions developed by psychologists have been tried, like OCC [OCC 88], or those from Scherer [Scher 84], Frijda, [Frij 86], and Roseman et al. [RAJ 96]. However, it is difficult to take a theory of one research field, like psychology or cognitive neuroscience, and apply it to another, like HCI. The emotion models developed by psychologists have been designed to study emotions in general. They do not just contain correlations between physiological and emotional states, but also different ideas on the cause of the arising emotion, underlying biological processes, anatomical structures, and other psychological considerations (cf. [David 03]). Furthermore, discussions regarding which model is eventually best suitable for measuring emotions are very controversial, not least because some authors even question the fundamentals of these models (cf. [FrLe 98], [SaSi 05]). The affective computing community has so far concentrated on not to try to model emotions anew, but rather to develop mechanisms that allow to make use of the scientific work of emotion research by describing emotional states using a markup language [SPL 06], [SDK+ 07], [SZP+ 07], [SPL+ 11]. However, the current specification of this very neat approach to communication of emotion does not cater for assigning sensor data to emotional states. So for the very first step of detecting emotional signs it is still necessary to create or adopt a model.
Implementing those models in software with the goal to assign e.g. physiological readings to emotional states, proved to be very difficult, and since the system developers were not psychologists, the resulting designs finally became simplified implementations of the original models and were adapted to the very specific tasks in mind.

Obviously, there isn’t a straightforward way from psychology to HCI systems design. Rather, designers and researchers in HCI should selectively use relevant and applicable knowledge gained by psychologists to design affective systems. HCI researchers are focussing on different aspects of emotion to psychologists, mainly in observable physiological manifestations of emotions occurring in real-life scenarios. Psychological emotion models do not live up to their requirements of applicability, comparability, and ease of use, as pointed out later. What is needed for HCI researchers and practitioners are adequate measures to associate measurements of emotional signs to unambiguous emotional states in order to finally assign them to conditions meaningful to a system, cf. [Cock 04b] [BPKV 04] [WiSa 04] [WaMa 04] [Fairc 09].
In the following section, an introductory overview of the two main models used to structure emotions is given and the supporting physiological findings are presented for each, from different studies. The concluding discussion highlights the disadvantages, shortcomings, and pitfalls of the discussed emotion models, from an HCI perspective.
2.2 Main approaches to structure emotion
Current theories from psychology on emotions can be grouped into theories that focus on how emotions arise, how they are perceived and what they induce in the human, e.g. [Ekman 72] [Ekman 92] [Scher 84] [Frij 86] [OCC 88] [RAJ 96], and theories focussing on how observed emotions could be categorised or structured, e.g. [Plut 80] [Ekman 92] [RuFe 99]. Since theoretical details on how emotions arise, when and how they are perceived, and which biological mechanisms induce them are less important for systems to recognise emotions, these approaches won’t be reviewed in this thesis. Appendix B gives an overview of most common emotion descriptions. Please refer to the respective literature cited there.
Among the theories for categorising or structuring emotions, two main theories are currently established in emotion research: a discrete approach, with its most prominent representative claiming the existence of universal “basic emotions” (e.g. [Plut 80] [Ekman 92]), and a dimensional approach, assuming the existence of two or more major dimensions which are able to describe different emotions and to distinguish between them [Russ 80]. There is still controversy on the matter of which approach is the one that best captures the structure of emotion. Russell and Feldman Barrett [RuFe 99] have made an attempt to combine the

10
dimensional and categorical approaches, using dimensions as well as discrete emotion categories. They suggest that the reason for the existence of two seemingly opposing theories is that both approaches relate to different concepts of what exactly is being defined as emotion and that, keeping this in mind, they can indeed be combined.
In the following, an overview of discrete emotion models and the dimensional approach will be given. In the conclusion of this section implications for the Affective Computing domain will be discussed.
2.2.1 Discrete emotion theories and the concept of basic emotions
Discrete emotion theories claim the existence of historically evolved “basic emotions” which are universal and can therefore be found in all cultures. Several psychologists have suggested a different number of these, ranging from 2 to 18 categories and sub-categories, but there has been considerable agreement on the following six: anger, disgust, fear, happiness, sadness and surprise. Several arguments for the existence of these categories have been provided, like distinct universal facial expressions, distinct universals in antecedent events, presence in other primates etc. Ekman based his assumptions mainly on the facial expression of emotions. In his studies, facial expressions of emotions shown in static images were recognised by people from very different cultures.
In [Russ 94], however, Russell found that there are differences in the recognition ability for subjects of different origins. While western literate groups widely agree about emotions presented by photographs, people from isolated groups often do not agree with them. These differences challenge the universality view. Carroll and Russell [CaRu 96] conducted an experiment focussing on emotion recognition from pictures in a semantic context and found first, that they could not replicate the high recognition rates for the POFA (Pictures of Facial Affect [EkFr 76]) that had been reported and second, that there exists situational dominance when pictures are presented in an emotionally different context.
2.2.1.1 Empirical evidence
Over the last decades many experiments have been performed in search of universal physiological patterns specific to basic emotions. Those studies concentrated mainly on activities of the autonomous nervous system (ANS) and characteristic speech signal changes. ANS related studies (e.g. [Ax 53]; [ELF 83];

[PaSt 93];, [PSAS 99]; [PWZM 99]; and many others) showed very interesting results each on its own, but until now no distinct patterns for the six basic emotions mentioned above could be found that all agree on. The results of the studies are controversial and the variables measured do not seem to allow distinguishing clearly between the different emotions. Some stable results could be found for variables that seem to characterise certain basic emotions, especially fear and anger which are the two that previous studies have focussed on mostly.
Table 1 summarizes the findings of 15 studies [Ax 53], [SWS 81], [ELF 83], [LEF 90], [SLP 92], [PaSt 93], [PSAS 99], [PWZM 99], [FMBT 00], [Scher 00], [WKSH 00], [LMCF 01], [NeuWa 01], [Chri 02], [NALF 04] concerning correlations of physiological changes with the 6 basic emotions as defined by Ekman. The table shows those physiological parameters which are used in most of the studies. Note that not all studies use all of these parameters.
Fear Anger Sadness Happiness Disgust Surprise Skin conductance
Increase (5-1-0)
Increase (1-1-0)
Decrease (1-0-0)
Decrease (1-0-0)
Increase (1-0-0)
n/a
Heart rate Increase (11-0-0)
Increase (8-0-2)
Increase (5-1-2)
Increase (3-1-1)
Increase (2-2-0)
Increase (1-0-0)
Skin temperature
Decrease (2-2-0)
Increase (2-1-0)
Not significant (2-0-0)
Increase (1-1-0)
Decrease (1-1-0)
Not significant (1-0-0)
Blood pressure diast.
Increase (2-1-1)
Increase (9-0-1)
Increase (2-1-1)
Increase (4-1-1)
Increase (1-0-0)
n/a
Blood pressure syst.
Increase (4-0-0)
Increase (5-0-1)
Increase (3-0-1)
Increase (4-0-2)
Increase (1-0-0)
n/a
Respiration Increase (3-0-0)
n/a Not significant (1-0-0)
n/a n/a n/a
� Dark green: strong evidence �� Light green: some evidence � Amber: no clear assumption can be made due to contradictory results or too few studies � Red: not sufficient evidence for either hypothesis (n/a - no studies available that provide
sufficient evidence) Numbers in parenthesis indicate how many studies support or oppose the named hypothesis (5-1-2 means 5 studies support the hypothesis, 1 does neither support nor oppose it, 2 oppose it).
Table 1. Summary of physiological correlates with basic emotions
12
As can be seen in Table 1, the amount of evidence for unique correlation with physiological changes varies between emotions. In the table, green colour symbolizes that there is evidence for the named correlation, either strong (dark green) or some evidence (light green). The criterion here was that many studies support the thesis and none contradicts it (dark green), or at least some do support it with no or very little contradiction which could be attributed to methodological differences between the studies (light green). Amber colour stands for correlations that have no strong support and/or few contradictory results are known. Red colour symbolizes that there is no study with clear statements on respective correlations. For a more detailed analysis of the studies, please refer to [PeHe 06] and Appendix A.
2.2.2 Dimensional emotion theories and the circumplex model of affect
Dimensional emotion theories use dimensions rather than discrete categories to describe the structure of emotions. According to [RuFe 99], dimensions generally agreed on are the degree of pleasure (a.k.a. valence), the degree of physical activation (a.k.a. arousal, activity, energy), and intensity of an emotion. A further dimension that is used in some studies is control (a.k.a. power or dominance).
Valence, or pleasure, denotes how pleasant a situation is assessed by a person. It seems to be the one dimension with the highest degree of agreement among researchers, highlighting the importance of pleasure for human beings (for example, all known human languages have words to communicate states of pleasure [Wierz 92]).
Arousal, or activation, describes the amount of energy being mobilized by the organism as reaction to the current situation. It is not an illusion or interpretation of a state, but the summary of a physiological state [RuFe 99]. Hence it is no surprise that arousal is the dimension which can best be measured.
Intensity describes how strong the current emotion is experienced. Some researchers argue that the dimension of intensity is not needed since stronger emotions are also connected with a higher degree of energy mobilisation (activation/arousal). But still, and particularly in the more technical domain of HCI, intensity is considered a very useful dimension. It allows quite easily describing the general emotional state with valence and arousal and expressing its intensity separately.
Control, sometimes referred to as power or dominance, is another dimension suggested by some researchers. It is mentioned here because it appears to have potential in the HCI domain. It describes how much the person is assumed to be in control of the situation or, conversely, feels subjected to it. Helplessness is a typical example for the lower end of this scale.
In the following, a short review of the current state of research is given which has also been published in [PeHe 06].
Most of the studies reviewed consider valence and arousal as the most important dimensions (see [PeHe 06]). However, arousal and valence are not claimed as sufficient to differentiate equally between all emotions, but they have proved to be the two main dimensions most researchers agree on (c.f. [Russ 83]).
Cowie et al. [CDATR 99] suggested additional features that are not part of every emotion, but of certain ones. They found that some emotions that share the same degrees of arousal and valence but are perfectly distinguishable in everyday life (e.g. fear and anger) could be better discriminated by comparing these additional features such as control (fear = little control vs. anger = higher control).
There are also other issues discussed by the community such as whether the axes should be unipolar or bipolar. While valence is a nice example for a bipolar axis (negative valence and positive valence), it seems more intuitive for arousal and control to have unipolar axes, with zero being the lower end (no activation, no control). There are even opinions that positive and negative affect might have separate scales as both can happen at the same time such as in the case of mixed emotions2.
When Russell started conducting self-report studies on the structure of emotion with the two-dimensional approach (valence / arousal), he discovered a specific ordering of the words describing the felt emotions. The ratings did not fall in every area of the coordinate system, but instead clustered around the periphery of a circle. He called the resulting configuration the Circumplex of Affect (see figure 1). This structure has been replicated many times in English and many other languages (e.g. [Russ 83]; [RLN 89]; [VFGK 00]) and it has also been challenged, e.g. by Bradley and colleagues [BGH 93], and is used very often to display emotion with the dimensional approach.
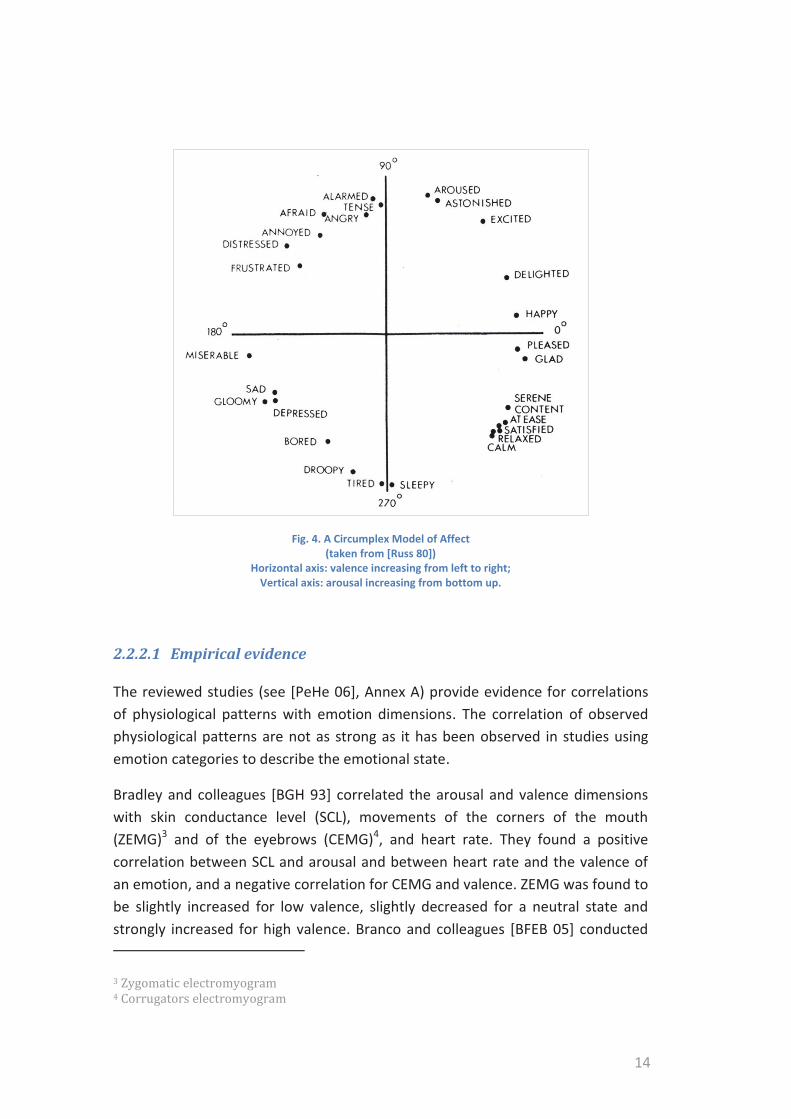
14
Fig. 4. A Circumplex Model of Affect (taken from [Russ 80])
Horizontal axis: valence increasing from left to right; Vertical axis: arousal increasing from bottom up.
2.2.2.1 Empirical evidence
The reviewed studies (see [PeHe 06], Annex A) provide evidence for correlations of physiological patterns with emotion dimensions. The correlation of observed physiological patterns are not as strong as it has been observed in studies using emotion categories to describe the emotional state.
Bradley and colleagues [BGH 93] correlated the arousal and valence dimensions with skin conductance level (SCL), movements of the corners of the mouth (ZEMG)3 and of the eyebrows (CEMG)4, and heart rate. They found a positive correlation between SCL and arousal and between heart rate and the valence of an emotion, and a negative correlation for CEMG and valence. ZEMG was found to be slightly increased for low valence, slightly decreased for a neutral state and strongly increased for high valence. Branco and colleagues [BFEB 05] conducted

an HCI experiment with tasks of varying difficulty. Using unsolvable tasks, they induced irritation in users and could observe increases in EMG signals for this negative affective state. On heart rate, Bradley et al.’s results were not as clear as the correlations they found with EMG patterns, with heart rate correlations being much smaller. Neumann & Waldstein [NeuWa 01] and Ritz & Thöns [RitTh 02] could not find any heart rate differences at all between positive and negative emotions. [DSB 98] found a positive correlation between arousal and SCL too, but could not quite replicate Bradley’s findings on correlations between heart rate and valence. They did find a deceleration for negative valence stimuli, but they found the same for positive stimuli, although not as strong. In addition, heart rate deceleration correlated with high and low arousal in as far as it was stronger than for medium arousal. Anttonen & Surakka [AnSu 05] found similar results while measuring heart rate with the EMFi chair (an office chair that allows unobtrusive heart rate measurement). They presented positive, negative and neutral stimuli to 26 subjects and found a stronger deceleration of heart rate for negative than for positive or neutral stimulation. Interestingly, when comparing individual response patterns to the mean response pattern over all subjects for each of the stimulus groups (positive, negative, neutral), they found that only 62.5% of the individual curves were adequately in line with the mean curve, indicating strong inter-individual differences. In 16.7% of the cases, the authors could not show different responses for positive and negative stimuli at all. These findings suggest that physiological responses cannot be generalised for all people but differ considerably from individual to individual. However, care has to be taken with some of Anttonnen & Surakka’s results due to methodological issues. The ratings of all subjects have been grouped by their mean ratings and have not been analysed for their individual differences. In addition, the results have not been controlled for their level of arousal, i.e. stimuli for negative valence also had an arousing effect which has not been considered in the evaluation of the physiological data.
Fewer studies can be found reporting on unambiguous correlations of physiological processes and emotional dimensions, and just two of those processes seem to be reliable: changes to heart rate and electro-dermal activity.
Table 2 summarizes the body of evidence for correlations of the physiological parameters heart rate and skin conductance with valence and arousal respectively, taking into account the findings of [BGH 93], [DSB 98], [NeuWa 01], [RitTh 02], [HPMMV 05] and [OHKZ 07]. Heart rate and skin conductance are those parameters that are exploited in most studies using a dimensional emotion representation.
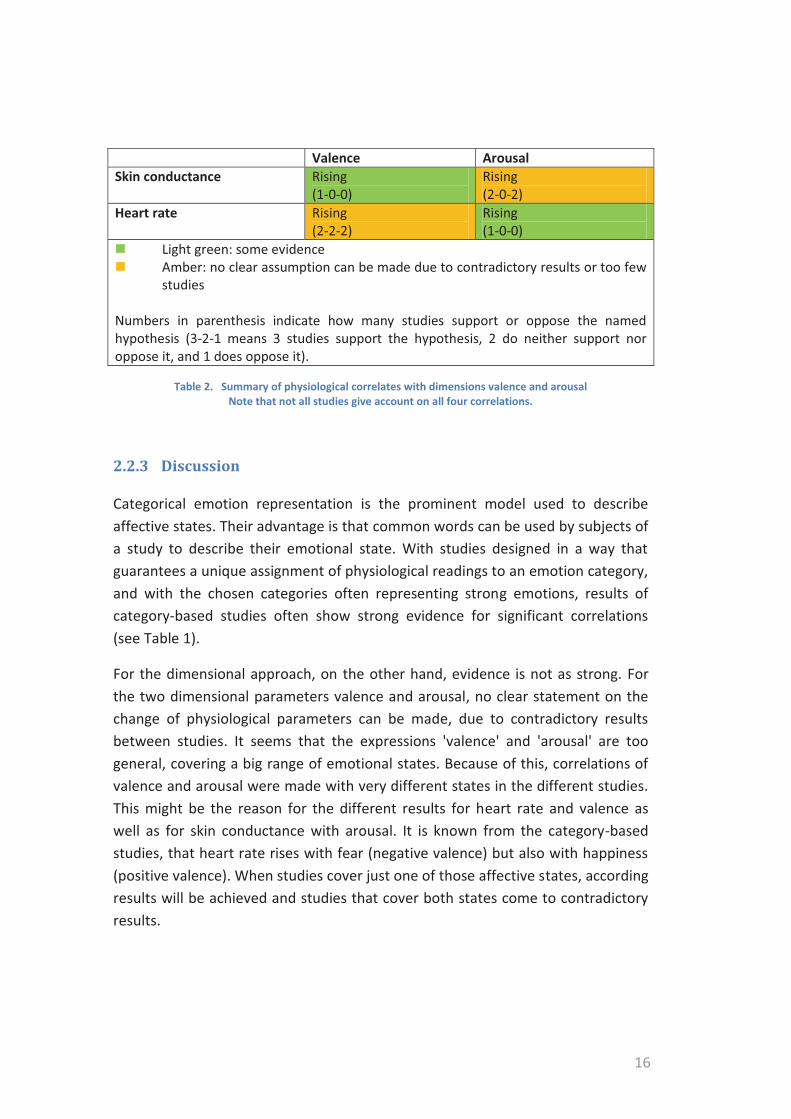
16
Valence Arousal Skin conductance Rising
(1-0-0) Rising (2-0-2)
Heart rate Rising (2-2-2)
Rising (1-0-0)
�� Light green: some evidence �� Amber: no clear assumption can be made due to contradictory results or too few
studies Numbers in parenthesis indicate how many studies support or oppose the named hypothesis (3-2-1 means 3 studies support the hypothesis, 2 do neither support nor oppose it, and 1 does oppose it).
Table 2. Summary of physiological correlates with dimensions valence and arousal Note that not all studies give account on all four correlations.
2.2.3 Discussion
Categorical emotion representation is the prominent model used to describe affective states. Their advantage is that common words can be used by subjects of a study to describe their emotional state. With studies designed in a way that guarantees a unique assignment of physiological readings to an emotion category, and with the chosen categories often representing strong emotions, results of category-based studies often show strong evidence for significant correlations (see Table 1).
For the dimensional approach, on the other hand, evidence is not as strong. For the two dimensional parameters valence and arousal, no clear statement on the change of physiological parameters can be made, due to contradictory results between studies. It seems that the expressions 'valence' and 'arousal' are too general, covering a big range of emotional states. Because of this, correlations of valence and arousal were made with very different states in the different studies. This might be the reason for the different results for heart rate and valence as well as for skin conductance with arousal. It is known from the category-based studies, that heart rate rises with fear (negative valence) but also with happiness (positive valence). When studies cover just one of those affective states, according results will be achieved and studies that cover both states come to contradictory results.

2.2.3.1 Dimensional interpretation of category-based studies
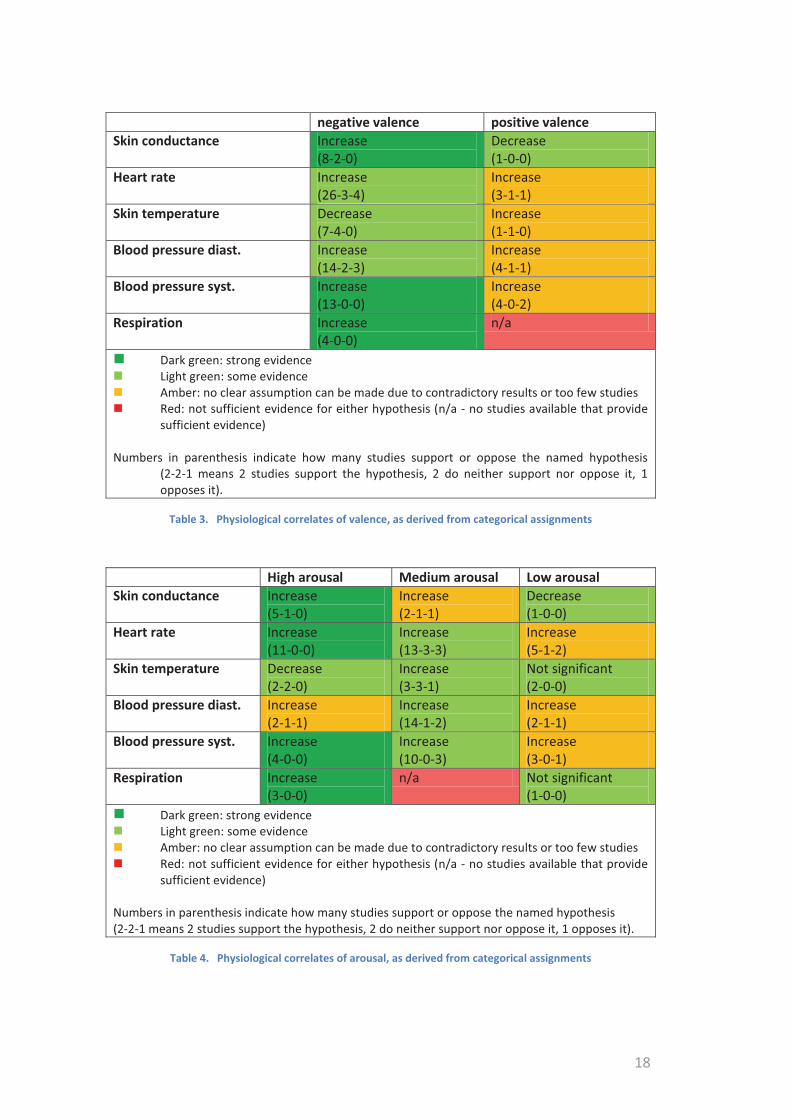
Given the big number of studies correlating physiological measurement data with emotion categories, it is intriguing to use these data to look for their dimensional representatives. As e.g. shown by Russel [Russ 80], emotion categories can be mapped onto the dimensional model of valence and arousal (and control), see Fig. 4. In the same way, the physiological correlates of the categories can be assigned to valence and arousal values.
For the purpose of comparing results of category-based studies in the valence/arousal domain, it be suggested to define “Fear”, “Anger”, “Sadness”, and “Disgust” combined as negatively valenced emotions, while “Happiness” can be taken as representative for positive valence. Note that “Surprise” cannot be assigned to valence values, as it is mainly an arousing state that can be either positive or negative. Note also that no medium valenced category is present in the studies analysed. For arousal, “Fear” can be taken for high arousal, “Anger”, “Happiness”, and “Disgust” for medium arousal and “Sadness” for low arousal. Surprise has been left out as it is not used for the valence dimension.
Looking at Table 3 and Table 4, much stronger evidence can be seen for correlations between physiological processes and valence/arousal of the ongoing emotion. It can be seen that the vague statements on correlations of physiological parameters with valence and arousal (Table 2) are supported by the results of Table 3 and Table 4, even in their partially contradictory accounts.
Table 2 shows week evidence for valence correlating positively with skin conductance (1 study) as well as with heart rate. Table 3 contradicts this in part by showing 9 studies having found a negative correlation between skin conductance and valence and 26 studies reporting a negative correlation of valence with heart rate. Although studies can be found that show a positive correlation between heart rate and valence, the overwhelming majority of studies suggest a negative correlation. As a third parameter, skin temperature shows a clear behaviour. The majority of studies suggest a positive correlation with valence.
For arousal, dimension-based studies show contradictory results for skin conductance and weak evidence for a positive correlation of arousal with heart rate (Table 2). Table 3 shows quite strong evidence for a positive correlation of arousal with skin conductance and a trend towards a positive correlation of arousal with heart rate as well, although heart rate increase has also been found for low arousal. Skin temperature correlates negatively with arousal, although no significant changes could be observed with low arousal.
18
negative valence positive valence Skin conductance Increase
(8-2-0) Decrease (1-0-0)
Heart rate Increase (26-3-4)
Increase (3-1-1)
Skin temperature Decrease (7-4-0)
Increase (1-1-0)
Blood pressure diast. Increase (14-2-3)
Increase (4-1-1)
Blood pressure syst. Increase (13-0-0)
Increase (4-0-2)
Respiration Increase (4-0-0)
n/a
� Dark green: strong evidence �� Light green: some evidence � Amber: no clear assumption can be made due to contradictory results or too few studies � Red: not sufficient evidence for either hypothesis (n/a - no studies available that provide
sufficient evidence) Numbers in parenthesis indicate how many studies support or oppose the named hypothesis
(2-2-1 means 2 studies support the hypothesis, 2 do neither support nor oppose it, 1 opposes it).
Table 3. Physiological correlates of valence, as derived from categorical assignments
High arousal Medium arousal Low arousal Skin conductance Increase
(5-1-0) Increase (2-1-1)
Decrease (1-0-0)
Heart rate Increase (11-0-0)
Increase (13-3-3)
Increase (5-1-2)
Skin temperature Decrease (2-2-0)
Increase (3-3-1)
Not significant (2-0-0)
Blood pressure diast. Increase (2-1-1)
Increase (14-1-2)
Increase (2-1-1)
Blood pressure syst. Increase (4-0-0)
Increase (10-0-3)
Increase (3-0-1)
Respiration Increase (3-0-0)
n/a Not significant (1-0-0)
� Dark green: strong evidence � Light green: some evidence � Amber: no clear assumption can be made due to contradictory results or too few studies � Red: not sufficient evidence for either hypothesis (n/a - no studies available that provide
sufficient evidence) Numbers in parenthesis indicate how many studies support or oppose the named hypothesis (2-2-1 means 2 studies support the hypothesis, 2 do neither support nor oppose it, 1 opposes it).
Table 4. Physiological correlates of arousal, as derived from categorical assignments
The remaining physiological parameters used in categorical studies as shown in Table 1 leads to contradictory conclusions. Blood pressure has a tendency to increase with negative valence. With arousal, blood pressure appears to rise with medium arousal and to decrease with high arousal (as heart rate increases), as well as with low arousal.
For respiration, there is some evidence of a positive correlation with both, valence and arousal.
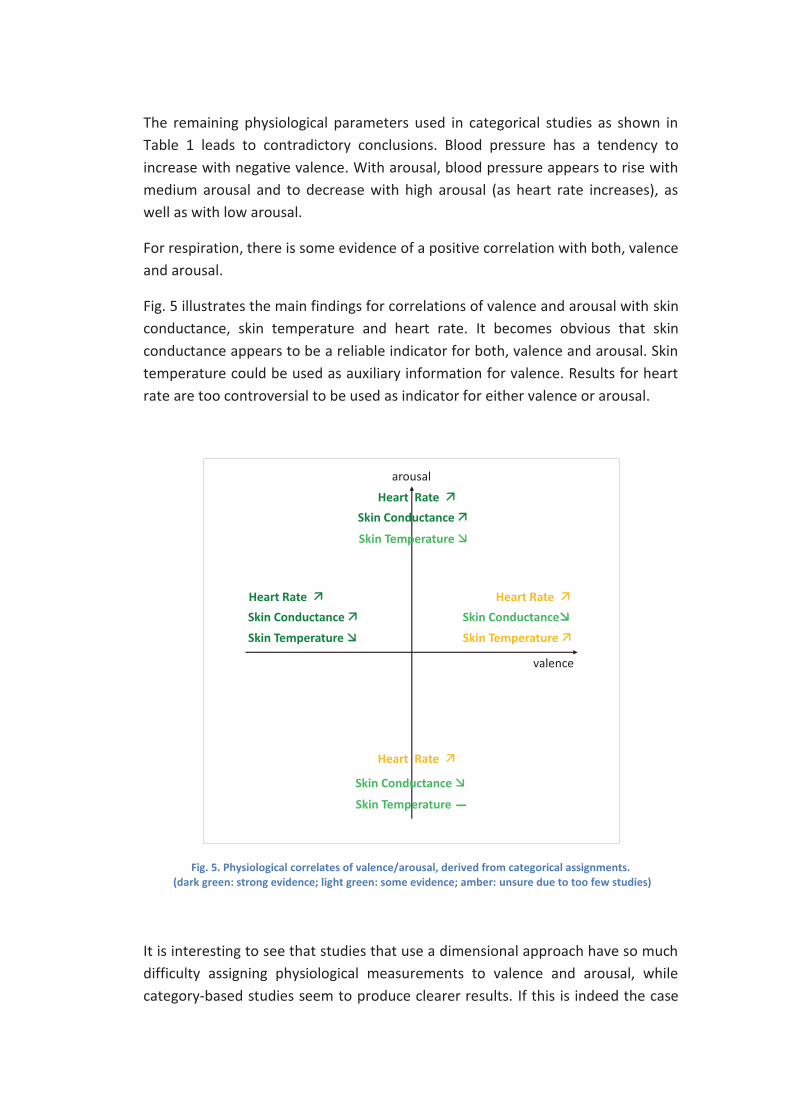
Fig. 5 illustrates the main findings for correlations of valence and arousal with skin conductance, skin temperature and heart rate. It becomes obvious that skin conductance appears to be a reliable indicator for both, valence and arousal. Skin temperature could be used as auxiliary information for valence. Results for heart rate are too controversial to be used as indicator for either valence or arousal.
Fig. 5. Physiological correlates of valence/arousal, derived from categorical assignments. (dark green: strong evidence; light green: some evidence; amber: unsure due to too few studies)
It is interesting to see that studies that use a dimensional approach have so much difficulty assigning physiological measurements to valence and arousal, while category-based studies seem to produce clearer results. If this is indeed the case
valence
arousal
Skin Conductance��Heart Rate �
Skin Conductance �
Heart Rate �
Skin Temperature �Skin Temperature �
Skin Conductance �
Heart Rate �
Skin Temperature �
Skin Conductance �
Heart Rate �
Skin Temperature ̶

20
and which advantages and disadvantages the different approaches have in the context of human-computer interaction will be discussed in the next section. In chapter 5 the problem of weak and contradictory results with studies using the dimensional approach is discussed and a possible solution is presented.
2.3 Emotion and HCI
The categorical and dimensional approaches to structure emotion are those used mainly in emotion research and affective computing research. Both have obvious advantages over the other, but also drawbacks, which result in fundamental practical implications. They not only represent different ideas about how emotions should be described and structured, but also, as a consequence, about how emotions can be observed and assessed and about how emotion could be dealt with by an adaptive system. Consequently, one has to commit to one emotion model or the other prior to any other step.
The following section will discuss the importance of deciding for an emotion model in light of the two major applications fields in HCI: affective HCI research, and designing affective systems, taking into account their different requirements.
2.3.1 Affective HCI research
Affective HCI research investigates in affective aspects of interactions with technology. Well-designed studies require a hypothesis to be verified or disproved, a well-planned study design which includes aspects of the user interface and the interactions with it, a suitable hardware set up, and a suitable procedure to acquire relevant information of the subjects about their affective state during the study. For all steps, the question of which emotion representation to choose is of significant importance, as will be explained below.
Finding the hypotheses
A common outline of an experiment starts with thinking of one or many hypotheses. For example, if one is interested in a user’s affective response to system messages, a first attempt to hypotheses could be “All system messages are experienced positively by the user (hypothesis H1)” and “Visual system messages

are liked more than acoustical ones (hypothesis H2)”. As one can see, “experienced positively” lets room for interpretation as to what exactly is meant with a positive emotion. When going for a categorical approach, H1 needs to be concretized by e.g. saying “All system messages result in the user being happy, glad, or thankful (H1)”. H2 would need to be adjusted similarly to e.g. “Visual system messages result more often in users being happy than is the case with acoustical system messages (H2)”, provided one defines happiness being a more positive emotion than gladness or thankfulness. For a dimensional approach, the original hypotheses could stay as they are since “positive” is an actual scale value of the dimensional model. For the same reason it is quite straightforward to compare the degree of liking on that scale.
Choosing experimental tasks
Another problem observed is closely connected with the methods used to induce emotions in an experiment. Banse and Scherer [BaSch 96] discussed the problem of controversial and unclear results in most of the basic emotion studies, which applies also to studies based on the dimensional approach. They pointed out that there exists a serious emotion induction problem and that this methodological issue may be the reason for some poor results. Regularly used induction methods were photograph or video watching, recalling affective situations or sometimes actually bringing the subject into an affective situation, which was done very carefully for ethical reasons and hence induced fairly weak emotions. But, anger induced through a picture is much different from anger induced by bad news or by a word-processor formatting the text without explicit permission. Hence, one has to be very careful when choosing an experimental task to induce certain emotional states. When using categories, just calling the induced emotion e.g. anger is not sufficient due to the different natures of anger that exist. The same obviously applies for a dimensional approach but in a much broader scope. When only going for valence and arousal, an e.g. negative emotion can be induced in many different ways, probably causing many different physiological reactions5. The experimenter has to take this into account when designing the study and should choose the stimuli according to goal and context of the study.

22
Describing the user experience
When it comes to describing the experienced emotion during the experiment (by either the subject or the experimenter), linguistic aspects need to be considered. All categories of the discrete emotion theories have in common that their definitions are based on verbal descriptions and hence on semantic categories of the language used. In most languages there are similar, but not identical categories, i.e. there is no one-to-one translation of emotion words, see [Russ 91], [Wierz 92]. Further, there are social and cultural differences in the interpretation of emotion words, depending on the cultural and social background and the live experiences of the individual. Because of this, assignments of emotion words to certain discrete categories depend on the individual researcher’s cultural and social background as well as on his scientifically driven preferences. Furthermore, the borders of the categories are blurry, and an emotion usually belongs to a category only to a certain degree and to another category to another degree, even when a large number of categories are chosen. For instance with anger, anger experienced playing a computer game differs from anger about loss of data, and this even differs depending on who is responsible for it. Accordingly, those angers are states of different emotional experience with different physiological patterns, although they might all be labelled as “anger” by different individuals.
Emotion words were also used with studies using the dimensional approach to label emotions. A typical labelling task is, for example, to answer the questions “How aroused were you physically during the task?” and “How much did you like the previous task?”, using a scale ranging from “not at all” to “very much”. Since people might have a different interpretation of being “aroused” and “liking” something, similar states might be labelled differently or, conversely, states labelled the same might in fact be linked to different physiological states. While this has no effect on the applicability of the theory itself, it poses similar problems concerning assignments of physiological measures to expressed emotional states.
Lichtenstein et al. [LOKJ 08] conducted a study comparing the basic emotion model and the dimensional approach of valence and arousal. The aim of their study was to investigate the models’ suitability for self-assessment of emotions as well as for deriving affective states from physiological readings. According to their results, the basic emotion model is better suited for assigning pre-selected states to physiological patterns while the dimensional approach has been found to be more accurate for self-assessments. On the other hand, the participants in their study found it more difficult to assess their affective state using the dimension-based self-assessment manikins (SAM) [Lang 80] for valence and arousal measures, while they had no difficulties doing so using pictures and descriptive

words describing discrete emotion categories. How these findings affect each other (i.e. how accurate are results which are based on a model assessed as difficult to use, and how useful are results based on pre-selected states) is also briefly discussed by Lichtenstein et al., but the verdict remains open as for now.
Mapping physiological patterns onto emotion descriptions
Another problem is that of mapping physiological readings onto an emotion description. At the current state of research, such mappings are done very specifically for a particular study and are valid only for the given set of collected data. When applying the same classifiers to another set of data acquired under different circumstances, classification results often are less satisfying.
For HCI research this means so far, that one has to find the best suitable classifier for mapping physiological patterns onto the chosen emotion model for a particular study. In section 5, a new approach to map physiological patterns onto emotion descriptions is developed that avoids many of the mentioned drawbacks of common categorical or dimensional approaches.
2.3.2 Designing affective systems
For the designer of an emotion-aware system, committing to a model means that at the very first step of drawing up the system one has to choose the approach that best meets the requirements of the envisioned use cases. In other words, a definition has to be found for the structure of emotion that will be used throughout the system. This decision is a key element of the design process which has significant effects on system characteristics like the number and sort of user states that can be distinguished, the level of detail of the emotion information, how emotion information will be stored and communicated within the system, which analyses can be performed with which degree of accuracy and finally, the way in which the system can sensibly respond to detected states.
Number and nature of user states, level of detail
Obviously, the choice of emotion model is critical for the ability of a system to distinguish observed user states. A model comprising e.g. 18 emotion categories allows for a finer granularity in differentiating between states than a model with 6 emotions does. Also, different models provide different sets of emotion

24
categories, some of which are better suited than others for HCI purposes. For instances, Ekman's six basic emotions [Ekman 72] are well established in the emotion research domain, but for HCI this model is fairly limiting with just one positive emotion (happiness), but two emotions that hopefully will be triggered very seldom by a technical system (disgust and fear). Dimensions, on the other hand allow for very specific definition of desired and undesired user states, simply by defining thresholds without the need of defining or referring to artificial categories. Appendix B lists a number of emotion descriptions that can be used including categories, dimensions, appraisals, and action tendencies.
Mapping physiological patterns onto emotion descriptions
As with user studies, mapping physiological readings onto an emotion description is a major problem for designing affective systems. So far, for each application a specific data base is used to model characteristic physiological patterns, and dedicated classifiers for this particular use case are used. At the current state of research, no general way to conclude on emotional states from physiological patterns has been found.
For developing affective systems this means that one has to find the best suitable classifier for mapping physiological patterns onto the chosen emotion model for the particular application. In section 5, a new approach to map physiological patterns onto emotion descriptions is developed that avoids many of the mentioned drawbacks of common categorical or dimensional approaches.
Storing and communicating emotion information
The question of the format in which emotion information should be stored in a digital system depends on a number of factors. If the information is to be used within the system only, system or program specific solutions can be appropriate. If, however, the information is to be shared with other applications such as analysis or visualisation software, the question of the underlying emotion model and its principal structure is imperative. To give an example, with categories it has to be decided where the borders are between the different categories and how it is assumed to be dealt with multiple, or mixed emotions. With dimensions, it has to be decided which values will be valid for the scales, i.e. if all dimensions will have a range from e.g. 0 to 1, or from -1 to 1, or from -9 to +9, and what meaning the different values have. For example, is an arousal value of 0 the middle of the

scale i.e. a moderate arousal level (as can be assumed being the case with Russel's Circumplex, Fig. 4), or is it the lower end of the scale i.e. no arousal? Those decisions have to be made very carefully with the user (the human) and the processing application in mind. The World Wide Web Consortium is currently developing a standard for communicating emotion information, which highlights the importance and non-triviality of this issue [SBB+ 11].
Analysis and system response
Obviously, emotional states can only be analysed for the states provided by the model chosen. Categories are very restrictive here but also very clear in their meaning. Dimensions, in the contrary, allow for a theoretically arbitrary number of states that could be looked for. This gives the system developer the chance to tailor the system to the actual user, but also brings with it the need of doing so. For adaptive systems, dimensions seem to be best suited for exactly this reason. They allow adapting the response to a shifting emotion profile of a user, which is difficult to accomplish with a fixed set of emotion categories. However, for applications with well-defined user profiles and well defined system responses, tailored categories might be the best choice because it allows direct mapping of targeted user states to well defined system responses.
2.4 Challenges
In section 2.2 an overview on most regularly used approaches to represent emotion was given, together with a discussion of studies supporting each respective theory. It has been shown that both, the categorical as well as the dimensional approach have been successfully used to represent emotional states and correlate those with physiological data. It was found that neither the categorical nor the dimensional approach allow unique mapping of physiological readings to emotional states, as for nearly all emotional states there are controversial results. It has also been shown that studies using the dimensional approach had obvious difficulties in clearly assigning physiological states to distinct valence/arousal measures, while with the categorical approach it cannot clearly be said what emotional state is actually described under the chosen emotional term (for example, which sort of anger is experienced).

26
For HCI purposes, practical implications of the different approaches as discussed in section 2.3 are significant and have to be kept in mind when planning an experiment or sketching an affective system.
Challenge 1: The challenge is to decide on an emotion description that best fits the purpose of the project.
While it is widely accepted that there are unique physiological correlates to distinct emotional states, it is still controversial as to which physiological reactions correlate with which emotional states, for most emotions. One crucial part of the problem in research is that the interpretation of an emotional term and hence the labelling of a physiological pattern is often influenced by language specific as well as social and cultural factors. This applies to both the categorical as well as the dimensional approach. With the categorical approach the problem also arises that many suggestions for categories exist with no clear distinction between categories so that they cannot be differentiated unambiguously by means of physiological measures.
Challenge 2: The challenge for HCI is to find a suitable description of emotional states for labelling physiological data that is ideally not affected by cultural and social conditions and allows for a clear distinction between emotional states.
A different challenge (but related to that above) arises when designing affective systems. Regardless of how the observed state would be named, there have to be robust means to reliably infer the current state from the physiological data that have been measured.
Challenge 3: The challenge is to find appropriate means that allow inferring the emotional state of a person from the physiological readings available.
Challenge 1 and challenge 2 are discussed in more detail in chapter 5, which also offers an approach to meet those challenges.
For challenge 3, common methods for inferring affective states from physiological readings will be introduced in chapter 4. As discussed earlier, data analysis and classification depend a lot on nature and structure of the data to be classified which vary significantly from project to project. The contribution of this thesis is

on simplifying the data acquisition process while at the same time improving the quality and reliability of the acquired data as well as the correlation of those with observed affective phenomena. When applied in future projects, this will hopefully lead to more homogeneous data sets, mitigating the effects leading to challenge 3.
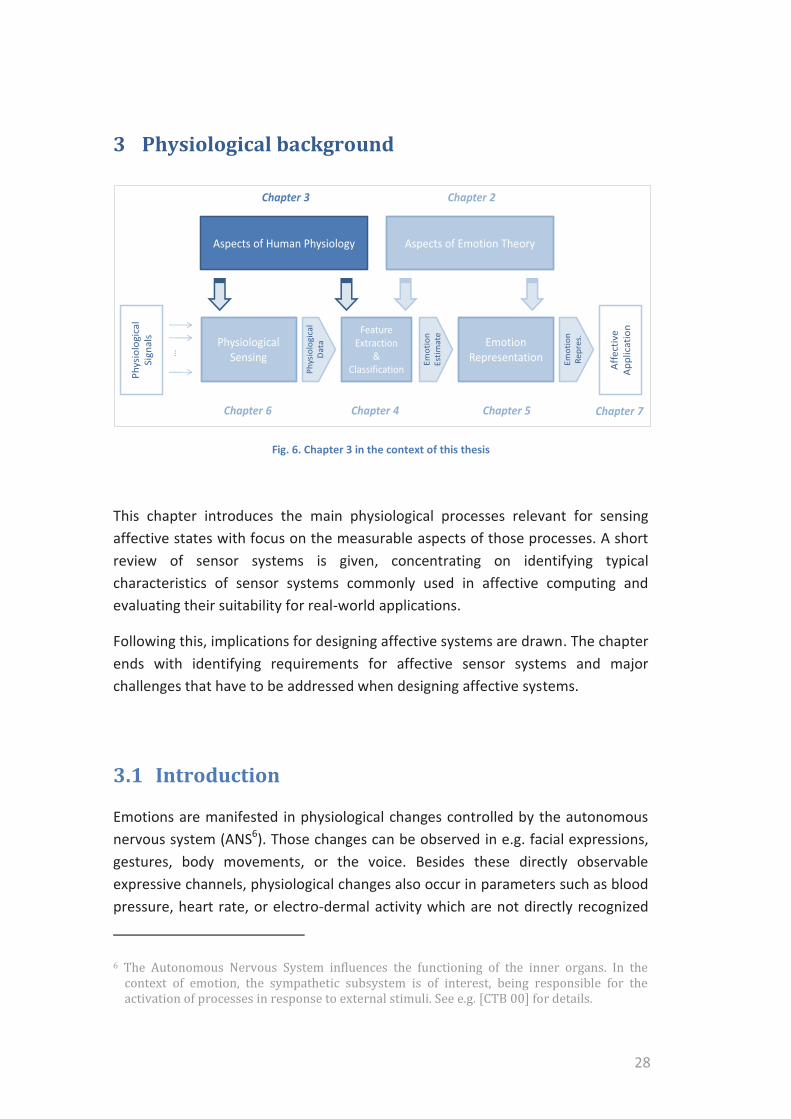
28
3 Physiological background
Fig. 6. Chapter 3 in the context of this thesis
This chapter introduces the main physiological processes relevant for sensing affective states with focus on the measurable aspects of those processes. A short review of sensor systems is given, concentrating on identifying typical characteristics of sensor systems commonly used in affective computing and evaluating their suitability for real-world applications.
Following this, implications for designing affective systems are drawn. The chapter ends with identifying requirements for affective sensor systems and major challenges that have to be addressed when designing affective systems.
3.1 Introduction
Emotions are manifested in physiological changes controlled by the autonomous nervous system (ANS6). Those changes can be observed in e.g. facial expressions, gestures, body movements, or the voice. Besides these directly observable expressive channels, physiological changes also occur in parameters such as blood pressure, heart rate, or electro-dermal activity which are not directly recognized
Feature Extraction
&Classification
...
Emotion Representation
Phys
iolo
gica
l D
ata
Affe
ctiv
e Ap
plic
atio
n
Aspects of Emotion TheoryAspects of Human Physiology
Chapter 3 Chapter 2
Emot
ion
Estim
ate
Emot
ion
Repr
es.
PhysiologicalSensing
Phys
iolo
gica
lSi
gnal
s
Chapter 5Chapter 6 Chapter 4 Chapter 7

by human observers. These physiological changes can be attributed to the following three physiological processes ([CTB 00]; [ScAn 03]):
1. Muscle tension;
2. Peripheral vasoconstriction i.e. changes in blood flow; and
3. Sweat gland activity.
As has been shown in chapter 2, these three processes are well recognized as being deeply involved in emotional arousal and there is increased agreement of them being associated with valence, i.e. the degree of perceived pleasantness of an event.
This chapter will describe each of these three processes, introduce measurement methods, discuss specific issues related to HCI, review commonly used sensing devices and conclude implications for HCI. A comprehensive introduction to physiological processes can be found in [CTB 00] and [ScAn 03].
3.2 Physiological processes relevant to affective computing and ways to measure them
3.2.1 Muscle tension
Muscle tension can most easily be observed in postural changes, body movements and gestures7. More subtle affect related muscle activity can be observed in the face. Ekman and various colleagues have distinguished so called ”action units”, specific patterns of facial muscle activity related to emotions [EkFr 76], [ELF 83], [EkDa 94]. They define 46 such specific regions in the face plus 25 head- and eye movement codes, which, according to them, can be used to decode certain affective states [EkFr 78]. An ”action unit”, or AU, can be seen as a single region in the face that is moved by muscles, encoding a certain affect-related expression, or parts thereof (e.g. AU 7 decodes the lid tightener, AU 9 the nose wrinkler, or AU 43 that the eyes are closed).
30
However, muscle contraction itself is not measurable in sufficient resolution and accuracy for inferring ANS triggered activities. Therefore, correlates of it have to be used. Most commonly used methods to infer muscle tension are electromyography and visual observation.
3.2.1.1 Electromyography
The most common way to infer muscle tension is measuring changes in the electrical potentials actuating the muscle fibres, which are accessible through surface electrodes attached to the skin above the muscle. This principle is called surface electromyography (sEMG), or just EMG. The measurand is usually provided in micro Volts (mV).
EMG measurements are affected by voluntary movements of the body part. Also, due to the small dimensions of some muscles to be observed, correct placement of electrodes is difficult at times. When multiple electrodes are used, the issue of cross-talking arises, i.e. different electrodes affect each other readings. Generally, high and low frequencies originated by the sensing circuitry itself might affect the sensor readings. Hence, a bandwidth filter should be applied to the measurements. EMG signals usually are in the range of 10 to 1000 Hz. Note that different EMG devices use different bandwidths. Hence, measurements acquired with different devices are not comparable.
While EMG is a reliable method to observe e.g. facial expression in lab studies, it is a very obtrusive measure. For affective computing studies, EMG can be considered too obtrusive as electrodes especially in the face will remind the subjects permanently on being observed, likely affecting their behaviour and affective state.
For real-world affective applications, EMG is not suitable not only for its obtrusiveness but also because it is not practicable and socially accepted (see 3.6.2)
3.2.1.2 Visual observation
Another way to infer muscle tension is to monitor the human with a video-based camera system to capture specific movement parameters. Using the captured data, sophisticated algorithms are applied to distinguish specific body movements (gestures) or even subtle changes in the person’s face.

Usually, visual approaches to identify affective signs in the face are based on action units, just as EMG-based approaches. The advantage of visual observation over EMG is that it is not as obtrusive. Particularly in lab studies, a camera observing the face is well accepted by subjects. The disadvantage of visual observation compared to EMG is that muscle movements must be relatively strong to result in visually observable signs while EMG detects also subtle movements that cannot be visually observed.
For affective computing visual observation is a possible way to observe a person for affective signs. As it relies on the person being in view of the camera and several conditions have to be met (lighting, proximity of the person to the camera), visual observation is so far mainly used in lab studies which allow controlling those parameters. I real-world affective applications, visual observation can be suitable in some scenarios, for instance those that include a desktop setup.
For more detailed information on visual affective sensing [Wimm 07] and [TaTa 09] be suggested for further reading.
3.2.2 Peripheral vasoconstriction (Blood Flow)
Peripheral vasoconstriction refers to a decrease in the diameter of blood vessels. Since it is not yet possible to non-invasively measure the diameter of blood vessels (or the muscle activity that cause this) directly, correlates of it have to be used. Most commonly used methods for this are measurements of the peripheral (i.e. skin) temperature, and photo transmission.
3.2.2.1 Peripheral temperature
Changes in the diameter of blood vessels bring with it a varying volume of blood in that body part per time. This, in turn, results in the surrounding tissue getting warmer or cooler, depending on the actual diameter of the contained blood vessels. These effects can be particularly well observed in the extremities, where relatively little tissue contains relatively many blood vessels.
Measuring changes in skin temperature for inferring peripheral vasoconstriction can be done with relatively simple and off-the-shelf temperature sensors. It is a well-established method that is considered robust and is frequently used in biofeedback applications and psychological studies.

32
Measurements are affected by room temperature and airflow around the probe or body part e.g. through movement of the person or environmental influences. Cool or moving air absorbs more warmth than warm or still air. Also, a high room temperature may affect the skin temperature since skin temperature cannot cool much below room temperature. Further, changes of the size of the contact area of sensor and skin influence the measurements. Such changes are often caused by movements or pressure on the sensing elements. Measurements of temperature readings are usually provided in degree Celsius (°C), some early studies also use Fahrenheit (F).
The following terms can often be found characterizing skin temperature devices. Accuracy describes how close the sensor reading is to the actual temperature. For the purpose of affect sensing, this is less important than the actual changes of it. Resolution refers to the smallest temperature change the device is able to detect. In an affect sensing context, a resolution better than 1° is necessary, e.g. 0.1°. However, a higher resolution also increases the risk of artefacts being taken as changes in vasoconstriction. Response time refers to the time it takes for a change in the measurement resulting in a respond in the device. It depends on the material used for the sensing elements, and the volume of material which needs to be heated (or cooled) to the new temperature.
The advantage of measuring peripheral vasoconstriction via skin temperature is its relatively easy accessibility. Temperature sensors are small and can be included in seemingly any device or garment. The disadvantage of temperature sensors is their slow response time when compared to other measures such as photo transmission. Due to laws of physics, the temperature of the sensing element needs to be at the same temperature as the surface it observes which can take milliseconds or even seconds, depending on the sensor used. Very small temperature sensors have a response time of several milliseconds, which is okay for affect-related measurements. Note, however, that a faster response time makes the device also vulnerable to environmental influences such as the cooling effect of moving air.
3.2.2.2 Photo transmission
Another way to indirectly infer the amount of peripheral blood flow is by light. Most common techniques use special light sources and receptors for this, usually in the red/infra-red spectrum, benefiting from the fact that light absorption in these frequency bands change significantly with the oxy/deoxyhemoglobin levels of the blood. The light source (usually a light emitting diode, LED) is transmitting

light into a finger, for example, and a nearby light receptor is measuring the amount of light reaching the other side of the finger or being reflected off the bone. The amount of light that reaches the receptor changes with the volume of blood to be passed by the light.
The advantage of this method is that it can be used to infer several different physiological changes that are associated with changes in affect. For example, by choosing the right frequencies of light, heart rate can be assessed, or the amount of haemoglobin within the blood can be detected and used as a measure of blood oxygenation.
The disadvantage of this method is that the measurements are quite sensitive to movements that occur thereby affecting the quality of the captured data. Artefacts are mostly caused by movements of either the body part, or the sensing element against the body part. For example, movements of a body part, such as a hand, cause more or less blood flowing into the extremities due to centrifugal forces. While these changes are too fast to be detected by temperature sensors due to their relatively long response time, photo transmission devices are well able to observe them. These changes can be of similar amplitude and frequency as those caused by ANS activity and hence pose significant problems in non-lab settings. Movement of the sensing elements against the body part causes a change in the path of light resulting in measurement changes. It also may cause day light entering the path of light, resulting in more photons reaching the receiving part.
In the context of affective computing it can be said that photo transmission based sensors might be an acceptable way to measure peripheral vasoconstriction in lab studies that do not require the subject to move the hand on which the sensor will be placed. For real-world applications, photo transmission-based sensing devices are not suitable due to the drawbacks identified above.
3.2.3 Sweat gland activity, electro-dermal activity (EDA)
Just as the other two physiological processes associated with sympathetic ANS activity, sweat gland activity is not directly measurable. Therefore, glandular activity is commonly inferred by measuring changes in electrical conductivity of the skin. Since sweat contains a number of electrically conductive minerals, increased conductivity is associated with a higher activity of the glands.
34
To measure electro-dermal activity, a small voltage is applied on an area with a high concentration of sweat glands (e.g. palms of the hand, or the foot). The measured electrical current between the two electrodes correlates with the sweat glands’ activity. Usually, measurements are given as conductance level, since conductance increases linearly with sweat glands activity.
Skin conductance is measured in μS (micro Siemens), skin resistance in kΩ (kilo Ohms).
Terms often used to describe electro-dermal activity are: GSR (Galvanic Skin Response), SCL (Skin Conductance Level), SCR (Skin Conductance Response), SRL (Skin Resistance Level), and SRR (Skin Resistance Response). The respective L and R versions refer to the (tonic) background level (L), and the time-varying (phasic) response (R).
The tonic level (SCL, SRL) effectively represents a baseline, or resting level. It usually changes very slowly and represents the relative level of sympathetic arousal of a person. The phasic changes (SCR, SRR) are short episodes of increased glands activity caused by increased sympathetic arousal, generated by a stimulus. SCR reactions on a stimulus appear about 1-2 seconds after the stimulus, stay on a certain level depending on the intensity of the stimulating event and how long it lasts and then falls back to the tonic level.
It is important to bear in mind that a phasic change might lead to an elevated baseline if the person’s sympathetic system does not completely recover from the triggering event. Conversely, when the person’s sympathetic system “relaxes” over time, the tonic level might decrease over time. The important point is, for affective computing applications, phasic changes as well as changes to the tonic level are of interest. However, this can only be taken into account when measurements are taken permanently at the same location. Temporarily detached electrodes or changing electrode positions may result in different absolute values, wrongly suggesting a change in the tonic skin conductance level.
As a technical challenge, baseline changes caused by sympathetic reactions are difficult to distinguish from measurement drifts caused by internal processes in the sensing electronics. If the device requires electrode gel to be used, chemical reactions within the gel over time can lead to measurement drifts which have to be considered as well.
In the context of affective computing, determining sweat gland activity by measuring electro-dermal activity is a very common and reliable means for measuring affect-related physiological phenomena. Due to its fairly simple sensing

principle it is very suitable for affective computing applications as the sensors can be designed in a way that they not obtrude too much on the user.
3.3 Measuring emotional signals
As illustrated in the previous section, although accessing emotion-related physiological parameters is a non-trivial task, it is not impossible. There are two main approaches to observe emotional signs: visual observation of the face, gestures or body posture, as well as measuring physiological parameters directly through sensors with direct body contact. Both approaches observe changes to physiological processes and each of them has its advantages and drawbacks.
Visual observation has the advantage of being only moderately intrusive. While a camera is being considered an intrusion into privacy, people are inclined to accept and forget about it once they get used to it and see a value in it.
The disadvantage of the visual approach is that it requires the person being in the view field (and possibly the focus area) of the camera, that certain lighting conditions are adequately met, and that the features to be observed are in view of the camera i.e. not hidden by clothing or accessories like glasses or baseball hats. Apart from those technical draw backs which might be overcome in the near future, there is the problem that some of the features usually observed with cameras are barely present in HCI settings. For instance, people tend not to show much facial expressions when interacting with technical systems. Display of emotional states through the face is a deeply social means of human-to-human interaction, acquired through evolution to facilitate better communication and influential actions through this additional, subtle channel. Since machines do not (yet) respond to emotional expressions, humans have not yet learned to use this channel when communicating with technology. Hence, observation of affective facial expressions and other visually observable signs of emotions are restricted to either staged (exaggerated) expressions or strong emotions in real life.
Physiological readings have the advantage of being present all the time. Further, people don't mask their physiological readings to influence their communication partner as they do with e.g. facial features. Hence, physiological readings may provide much more realistic data on the "internal" emotional processes than visually expressive channels, such as facial expressions, can provide. Another advantage of this channel is the relative simplicity of the data. Parameters like

36
heart rate, skin temperature, and electro-dermal activity are very simple one-dimensional data that are easily processed and analysed.
The drawback of working with physiological readings is the personal access required to measure them. Direct contact to the person's body is needed to access most parameters8. This requires first the acceptance and willingness of the person to wear the device and second the person actually wearing it the right way, i.e. the person being able and willing to use the device. As with visual observation, the cooperation of the user is required. Wearable sensors have to meet various usability and technological requirements (reliability, robustness, availability and quality of data) which are often very difficult to match.
The following sections summarize and review the implications for HCI as well as discuss challenges for current and future work.
3.4 Implications for sensing affective states
As outlined above, various restrictions and side aspects have to be taken into account when looking for emotional signs in real-world HCI settings. This leads to the following major implications.
Intensity of emotions
Expressing emotions in general has evolved to facilitate human-to-human social communication. It can hence be expected (and has been observed) that humans will use much less emotional expressions when interacting with technology than they do when interacting with other persons. Means have to be found to "tap" the emotion channel even when subtle, non-visible emotions are going on. Physiological readings could be one measure to achieve this goal.
Reliability
It cannot be assumed that in real-world settings any single sensor will provide emotion information permanently in a quality sufficiently high. It is hence recommended to not rely on just one information source but rather use multiple
sensors. Since emotion-related parameters are interrelated with each other, integrating multiple sensors is likely to improve reliability of the sensing system.
Data validation
All physiological parameters are influenced by physical activity either directly or indirectly. Physical activity, for example, is directly linked with the heart rate, with direct influence also on skin temperature. Further, body movements might interfere with sensor readings. For example, arm movements make more blood flowing into the hands due to centrifugal forces which interferes with optical blood flow measurements.
It is hence recommended to use auxiliary sensors and to consider all sensor readings with regard to other sensors’ information.
3.5 Challenges
Sections 3.3 and 3.4 outlined several issues related to observing emotional signs in real world settings. Usability, acceptability, robustness and data quality play a crucial role here. Several challenges can be drawn from this relating to sensing affective states in human-computer interaction scenarios.
For affective sensors to be used in real-world settings it is indispensable that they are accepted (and also used) by the users. This implies that aspects of intrusiveness, usefulness, usability, and user experience must be considered. Since affective sensors need either physical contact or good camera view of the person, it is essential that this person allows this to happen.
Challenge 4: The challenge is to design affective sensors in such a way that people will use and engage with them and so that they are fully operational and can provide affective information in sufficiently good quality.
Technology in real-world HCI scenarios often has to operate in adverse conditions. It cannot be assumed that it will be treated with care by the user nor can users be expected to follow certain restrictive directives to allow the device to operate properly. Further, there is the problem that no single sensor is able to permanently provide affective information of users in everyday life. Visual sensors will lose view of the person; physiological sensors might not be worn or might

38
suffer from movement artefacts or other interferences. It therefore seems advisable to tap more than one modality and find suitable ways to merge results.
Particularly for applications that aim to react sensibly to the detected affective state it is important to know how reliable the provided information is. Given that no single sensor is able to provide reliable information permanently (see above), provision of reliability information is essential.
Challenge 5: The challenge is to design device sufficiently robustly and to provide information on the reliability of the sensor data in real-time along with the data.
Challenge 6: Another challenge is to find suitable ways to fuse sensor data that come from different modalities and are of a totally different nature in terms of complexity, time behaviour and accuracy.
The identified challenges will be discussed and solutions are proposed in chapter 6.
3.6 State of the art in physiological sensing
Projects that involve physiological sensing for inferring affective states are manifold (see [AnSu 05], [BZA 07], [CKC 08], [ChVe 04], [Fairc 09], [HGSW 04], [HPMMV 05], [JBW 09], [LOKJ 08], [MIC 06], [MoAg 08], [NALF 04], [PSVUN 07], [PiSch 01], [SFKP 02], [SuPe 05], [VLBOZ 09], [YaHa 07], [MGBA 09]). Previous projects have used commercial systems for measuring selected physiological parameters and apply various means to enhance and analyse the collected data.
This section reviews commonly used sensor systems in the affective computing community and introduces commonly used methods for interpreting physiological data associated with felt emotions.
3.6.1 Physiological sensor systems
Systems used most in the Affective Computing domain are those from Thought Technology Ltd.9 (e.g. the Procomp Infinity system) and Mind Media BV10 (e.g. the

Nexus device), which have been developed for biofeedback applications. A number of system from other developers exist, some also targeting the biofeedback community, others focussing more on the sports11-, or the medical12 sector. Apart from the sports oriented sensors, all systems have in common that they come with sample rates as used in medical applications (at least 250 Hz up to 2048 Hz) which they provide for acquisition of at least four different parameters. Another aspect they have in common is that they rely on their own proprietary software for viewing, storing, and analysing the data and that they do not provide the data in real time for other applications in an open format. While this is usually no problem for researchers who want to analyse their data offline after data acquisition, it poses a big problem for application designers since it effectively means that the data are only available offline and cannot be used in real time for adapting the user interface to the current needs of the user. Apart from systems developed for the sports sector, current version of the systems also rely on wires or optical cables for communicating their data to a PC due to the high data rates, which is problematic in terms of mobility and acceptability due to restricted comfort and interference with the person’s experience of the situation.
For studies on affect and emotion in everyday HCI scenarios, as well as for designing affective systems, devices available prove to be unsuitable. Their most prominent disadvantages are their restrictions on the subject’s movements, their difficult usage, or the fact that they do not provide their data in real time in an open format. A few authors already addressed related problems [HGSW 04], [JMOG 05], [BLJW 10] and identified the following issues:
- With physiological signals being measured non-invasively (i.e. usually indirectly), there is a delay between the originating physiological process and the observation;
- Physiological sensors used are prone to movement artefacts;
40
- Since human physiology is very complex and many different physiological processes persist, physiological signals are usually very noisy and changes can hardly be attributed to unique single processes;
- Physiological reactions related to certain events show individual differences, which make it hard to identify generally applicable rules.
The following limitations of current systems have been identified that avoid wider acceptance of the existing physiological sensors and health monitoring systems for continuous monitoring.
- Unwieldy wires between sensors and a processing unit makes using the device awkward and remind the subject of being supervised, influencing the behaviour;
- The lack of system integration of individual sensors makes it complicated to analyse or process data that belong together;
- Non-existent support for massive data collection and knowledge discovery limits and / or prevents data processing and analysis in real-time;
- Data are only available offline and often bound to lab settings.
Jovanov et al. [JMOG 05] emphasize the negative effects of unwieldy wires between electrodes and the monitoring system, as these limit the person's range of activity and level of comfort and thus influence negatively the measured results. Sung & Pentland [SuPe 05] have attributed this to the fact that devices developed for clinical purposes focus on accuracy and reliability, at the expense of the patient's comfort and usability.
Dealing with those issues is important for designing affective systems as they use physiological measurements. Implications that arise from this will be addressed in the following section.
3.6.2 Implications for HCI
Real life HCI applications have special requirements on physiological sensors. They differ from medical applications in that they need to be easy to use, non-obtrusive, and flexible in providing their data besides being accurate and precise while being operated outside controlled lab conditions.
The following requirements on affective systems can be identified:
Robustness
The device should be tolerant against movements of any kind. A user cannot be assumed to behave in a particular way just to allow the system to operate properly. Hence, the system should be able to recognise movements and detect movement artefacts or blurred sections in the sensor data. Information on the reliability of the data should permanently be available along with the actual data to allow the system to treat the information accordingly.
Non-obtrusiveness
A system should not irritate the users in any way. It should operate without the need of the users' attention and not be in the users' way at any of their activities. For wearable sensors this also implies a comfortable fit, no visible wires, and wireless data transmission. A small form factor and light weight are also beneficial. Integrating the system in clothing, jewellery or other usually worn gadgets like watches will help minimising the system’s obtrusiveness.
Another aspect of obtrusiveness is social acceptance. A sensing device should be designed so that it is accepted to be worn. Integration in clothes, jewellery and everyday gadgets could help here.
Easy usage
It seems obvious that, in order to be accepted by users, a system must be easy to use. It must not require them to run through lengthy installation and calibration routines or learn and adhere to complicated operation instructions. There should be no need for the user to connect different hardware parts in a pre-described fashion to get the system running, or to place electrodes at specific body parts using tape or Velcro fastener, or to configure and adjust software prior to collecting data. Also, energy consumption should be low, to allow for a long operation time without the need of changing or recharging batteries.
Immediate access
Data should be immediately available. For studies, the experimenter should get permanent and in-real-time feedback on the subject’s performance. For affective applications, permanent provision of actual data is a prerequisite to allow for continuous adaptation of the system to an ever-changing user state.

42
Ease of integration
There should always be sensible data available to speed up data processing and ease analysis. Also important for integration are aspects of robustness of the device as described earlier. Particularly, information on the system’s state and the reliability of the data provided is important for using the system as integrated component of an affective system. Error-handling routines should be run within the device, freeing the integrating developer from caring about lost connections, transmission errors, badly fitted electrodes, and other technical side aspects. Ideally, data should be provided in an open format.
Standard conformance
Being also an aspect of ease of integration, data should be made available in engineering (SI) units. This avoids inclusion of sensor-specific conversion formulae into applications, increases flexibility, and eliminates the risk of conversion errors.
3.6.3 Summary
Looking at commercial sensor systems used so far for collecting affective data, major drawbacks of such systems could be identified based on an extensive literature review as well as personal observations. The gained insights were summarized for their implications for HCI in the context of affective applications. Major requirements of affective physiological sensor systems were derived from this for use in real-world scenarios, addressing issues of robustness, obtrusiveness, ease of use, ease of integration, and standard conformance.
Requirements of physiological sensor systems to be used in affective computing settings were worked out, representing core features an affective sensor system should meet. Obviously, these requirements are of varying importance in different scenarios, and each scenario might add further specific requirements to the list.
In chapter 6 these aspects are taken into account for developing an affective physiological sensor system for use in real-world settings.

4 Interpretation of physiological data
Fig. 7. Chapter 4 in the context of this thesis
This chapter gives an overview of common methods to pre-process and analyse physiological data to identify patterns related to affective states. The focus of this chapter is on introducing widespread methods for feature extraction and classification and appraising their suitability for affective computing applications.
4.1 Introduction
In many projects such as those mentioned at the beginning of this chapter, various methods are applied to pre-process, analyse and classify physiological data with the final goal to identify the emotional state of a person. Throughout the projects, recognition rates vary, but most rates reported in projects are similar to those achieved with other modalities like speech and facial feature analysis (between 60 and 80%), which is close to the recognition rate achieved by humans13.
The general approach to infer an emotional state from physiological signals is shown in Fig. 8. Physiological signals are first pre-processed, and, if more than one
Feature Extraction
&Classification
...
Emotion Representation
Phys
iolo
gica
l D
ata
Affe
ctiv
e Ap
plic
atio
n
Aspects of Emotion TheoryAspects of Human Physiology
Chapter 3 Chapter 2
Emot
ion
Estim
ate
Emot
ion
Repr
es.
PhysiologicalSensing
Phys
iolo
gica
lSi
gnal
s
Chapter 5Chapter 6 Chapter 4 Chapter 7

44
sensor is involved, synchronized before passed on to the next stage. This pre-processing is often done in the sensing devices but can also be performed as first step in the interpretation queue. The “cleaned” and possibly normalized data are then analysed
Fig. 8. From physiological signals to emotion
for characteristic attributes, or features (feature extraction), which involves statistical analyses. The calculated features then are classified according to a pre-defined model using neural nets, fuzzy logic or other classifiers, and the likely emotion is calculated and finally provided for further processing.
When comparing the approaches for feature extraction and emotion classification used in different projects, it becomes obvious that no single, or best, algorithm exists (cf. e.g. [KFS 95], [NALF 04], [KiAn 08]). Various algorithms have been tried for the different stages, and many have been found to be suitable in their specific use case. Obviously, environmental factors, behaviour patterns, cognitive processes as well as social aspects have a considerable impact on physiological parameters related to emotion, cf. chapter 2, and [BJWH 09], [KKA 11].
As a consequence it can be concluded that analysis algorithms and classifiers have to be chosen according to the actual use case, the scenario, and the affective states to be detected. In this thesis, no recommendation will be given but rather a short overview of commonly used methods for data pre-processing, feature extraction and classification provided. For further reference, a good and concise introductory review is given in [Picar 97], advance discussions can be found in [NALF 04] and [PPC 11].
... ClassificationPh
ysio
l. D
ata
Emot
ion
Estim
ate
Data Pre-Processing
Phys
iolo
gica
lSi
gnal
s Feature Extraction
Feat
ures
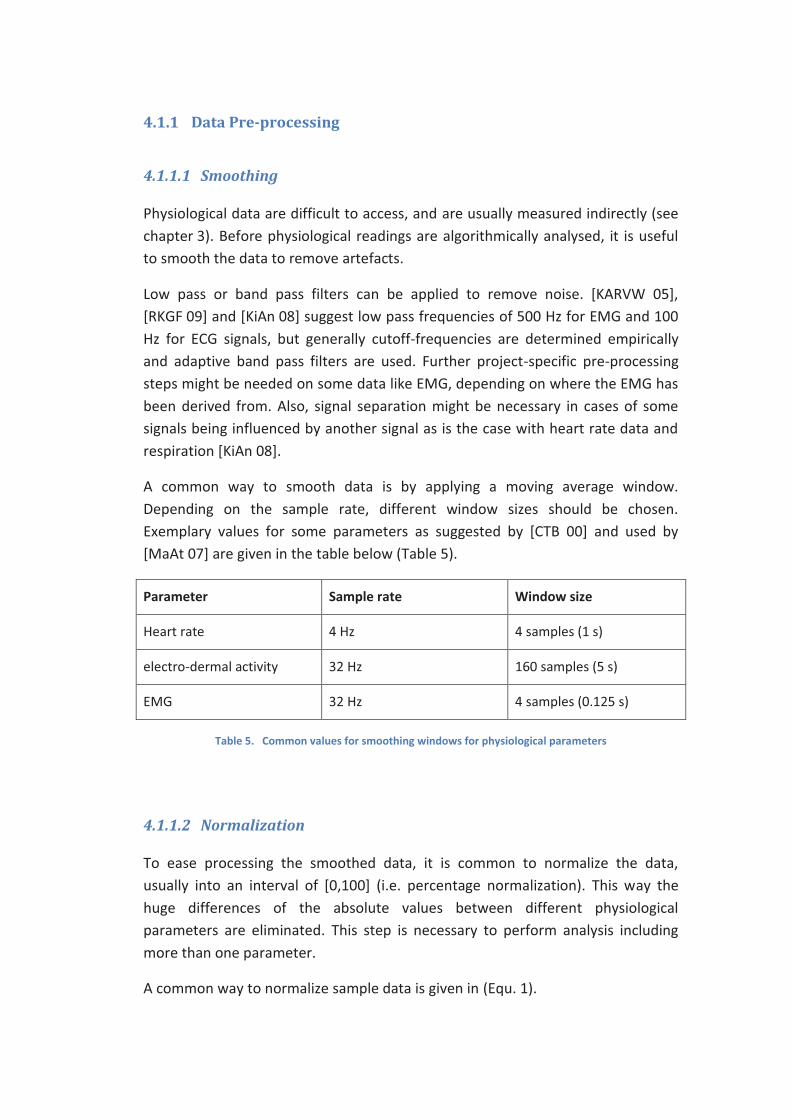
4.1.1 Data Pre-processing
4.1.1.1 Smoothing
Physiological data are difficult to access, and are usually measured indirectly (see chapter 3). Before physiological readings are algorithmically analysed, it is useful to smooth the data to remove artefacts.
Low pass or band pass filters can be applied to remove noise. [KARVW 05], [RKGF 09] and [KiAn 08] suggest low pass frequencies of 500 Hz for EMG and 100 Hz for ECG signals, but generally cutoff-frequencies are determined empirically and adaptive band pass filters are used. Further project-specific pre-processing steps might be needed on some data like EMG, depending on where the EMG has been derived from. Also, signal separation might be necessary in cases of some signals being influenced by another signal as is the case with heart rate data and respiration [KiAn 08].
A common way to smooth data is by applying a moving average window. Depending on the sample rate, different window sizes should be chosen. Exemplary values for some parameters as suggested by [CTB 00] and used by [MaAt 07] are given in the table below (Table 5).
Parameter Sample rate Window size
Heart rate 4 Hz 4 samples (1 s)
electro-dermal activity 32 Hz 160 samples (5 s)
EMG 32 Hz 4 samples (0.125 s)
Table 5. Common values for smoothing windows for physiological parameters
4.1.1.2 Normalization
To ease processing the smoothed data, it is common to normalize the data, usually into an interval of [0,100] (i.e. percentage normalization). This way the huge differences of the absolute values between different physiological parameters are eliminated. This step is necessary to perform analysis including more than one parameter.
A common way to normalize sample data is given in (Equ. 1).
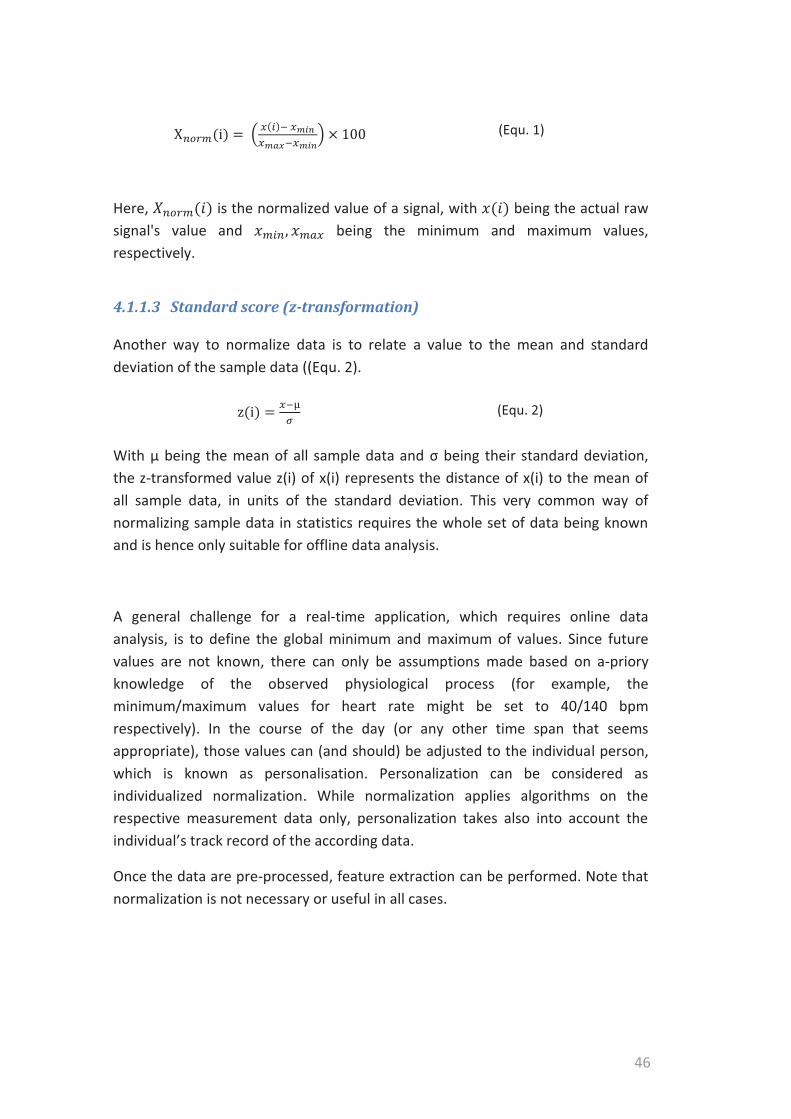
46
(Equ. 1)
Here, is the normalized value of a signal, with being the actual raw signal's value and being the minimum and maximum values, respectively.
4.1.1.3 Standard score (z-transformation)
Another way to normalize data is to relate a value to the mean and standard deviation of the sample data ((Equ. 2).
(Equ. 2)
With μ being the mean of all sample data and σ being their standard deviation, the z-transformed value z(i) of x(i) represents the distance of x(i) to the mean of all sample data, in units of the standard deviation. This very common way of normalizing sample data in statistics requires the whole set of data being known and is hence only suitable for offline data analysis.
A general challenge for a real-time application, which requires online data analysis, is to define the global minimum and maximum of values. Since future values are not known, there can only be assumptions made based on a-priory knowledge of the observed physiological process (for example, the minimum/maximum values for heart rate might be set to 40/140 bpm respectively). In the course of the day (or any other time span that seems appropriate), those values can (and should) be adjusted to the individual person, which is known as personalisation. Personalization can be considered as individualized normalization. While normalization applies algorithms on the respective measurement data only, personalization takes also into account the individual’s track record of the according data.
Once the data are pre-processed, feature extraction can be performed. Note that normalization is not necessary or useful in all cases.

4.1.2 Feature Extraction
Feature extraction usually refers to the process of generating specific features of signals used to distinguish different characteristics within the signal. These features either describe the nature of the signal, like (quasi-) periodicity of a heart rate or respiration signal, or statistical values like mean values or standard deviations. Obviously, features themselves can be combined again, so as to describe another characteristic, resulting in another feature.
Note that some approaches skip the step of feature extraction, applying the classifying algorithm directly on the pre-processed data. Fuzzy logic approaches [MaAt 07] and neural nets [HGSW 04], [YLPKL 05] are examples for this.
The time series data obtained when capturing physiological data is often discretized and reduced to simple descriptive statistical variables. In the following section, the main features commonly derived from physiological parameters are introduced. They have been used and evaluated in many projects and proved to yield satisfying results in many use cases. Note that some features differ only in that they are applied to either the raw signal or the normalized signal.
Table 7 and Table 8 provide a list of the most common features derived from physiological signals in affective computing projects and names publications that can be used as good references. Most projects experiment with further features and variants of those given in the tables. Use case specific features might be a useful addition to the features explained in the following.
4.1.2.1 Mean, max and min of absolute values
Depending on the physiological parameter chosen, absolute values (not normalized "raw" data) can be very informative (e.g. absolute values of heart rate). The mean (Equ.3), maximum and minimum values can be computed on a defined amount of sample data, which is usually done by means of a moving window. A smaller window results in faster response times at the cost of lower accuracy, while a wider window allows for more accurate results (due to more sample data being available) but with the risk that short emotional episodes will be missed.
Heart rate, skin temperature, and EMG signals are typical examples for using mean, maximum and minimum values of non-normalized data.

48
4.1.2.2 Standard deviation
The standard deviation (Equ.4) of either the raw signal or the normalized values is another standard feature. It is a measure for how much the current value differs from the average of the values in the given window. Again, the sensibility of this feature depends on the size of the chosen window.
4.1.2.3 Mean of the absolute values of the first and second differences
The mean of the absolute values of the first differences (Equ.5) approximates a gradient for the current data stream, representing the degree of changes within the data.
The mean of the absolute values of the second differences (Equ.6) leads to a slightly different value, depending on the nature of the signal. Signals with highly fluctuating values will be smoothed a little, whereas signals with little changes between values will result in stronger results.
4.1.2.4 Median of amplitude/frequency
The median represents the middle value of a number of sorted samples (Equ.7). It differs from the algorithmic mean in so far as that it takes the number of samples into account. This method avoids large numbers having a stronger influence on the result than small ones. For instance, from the samples {1, 2, 2, 3, 4, 8, 8} the median is 3, while the arithmetic middle is 4.
4.1.2.5 Mean rise duration
The mean rise duration (Equ.8) indicates how long a change of the signal lasts, i.e. the time from the onset of the event to the time of the peak of the signal. It differs from the 1st and 2nd derivative (4.1.2.6) in that the amplitude of the signal is not considered.
What is important for this parameter is the definition of the threshold, i.e. when a change of the signal is considered to be the beginning or end of a slope.
4.1.2.6 Mean of 1st and 2nd derivative
The mean of the 1st derivative indicates the degree of changes of a signal, i.e. the steepness of the slope.

The mean of the 2nd derivative indicates he degree to which the 1st derivative changes.
Both present time-characteristics of the signal. Other than the mean rise duration (4.1.2.5), the amplitude of the signal is considered.
4.1.2.7 Number of peaks
A very simple yet efficient feature is the count of peaks within a certain time interval. There is no consensus on the size of the interval, ranging from 5 seconds with phasic EDA to 60 seconds with heart rate, depending on the physiological parameter observed [LOKJ 08].
This feature is usually applied to heart rate, breathing rate, but also phasic EDA (EDR) and EMG.
4.1.2.8 Inter beat intervals
Inter beat intervals (IBI) are mostly calculated for heart data but can also be calculated on other quasi periodic signals (such as respiration [KiAn 06]). The IBI is the time in milliseconds between two consecutive peaks in a signal (Equ. 9).
Concerning cardiac activity, three frequency bands are established for distinguishing changes caused by the sympathetic14 and parasympathetic15 nervous system, respectively (Table 6). It has been found, that changes in the lower frequency band can be linked to activities of the sympathetic nervous system, while changes in the high frequency band can be linked to activities of the parasympathetic nervous system [RLSV 06], [CTB 00].
The ratio of low frequency to high frequency is considered an indicator of mental stress, since mental stress is correlated with an increase of sympathetic activity and a decrease of parasympathetic activity [BZA 07].
14
15

50
Name Frequency band Remark
HF - high frequency 0.15 ... 0.4 Hz related to parasympathetic nervous system
LF - low frequency 0.05 ... 0.15 Hz related to sympathetic nervous system
VLF - very low frequency
0.003 ... 0.04 Hz rarely used, linked to sympathetic nervous system
Table 6. Inter beat interval - frequency bands for cardiac activity
Table 7 shows a list of features used in most projects (F.1 - F.4) while Table 8 lists further features that have been used in some projects leading to good results (F.5 - F.8). It is to mention that features F.1 - F.4 are usually applied to the non-normalized "raw" data as well as to their normalized equivalents, representing eight features in effect. All features can sensibly be applied to most physiological parameters.
In the following, for all equations, we assume being the according measurement values within a given window of N elements.

# Short description Used by (e.g.) Formula
Generally used features
F. 1 Mean
[PVH 01] [KBK 04] [NALF04]
[YLPKL 05] [RLSV 06] [BZA 07] [LOKJ 08] [KiAn 06] [KiAn 08]
[MGBA 09] [RKGF 09]
[VLBOZ 09]
(Equ.3)
F. 2 Standard deviation
[PVH 01] [KBK 04] [RLSV 06] [BZA 07] [LOKJ 08]
[MGBA 09] [RKGF 09]
[VLBOZ 09] [KiAn 06]
(Equ.4)
F. 3
Mean of the absolute values of the first differences (approximating gradient)
[PVH 01] [LOKJ 08] [RKGF 09]
(Equ.5)
F. 4
Mean of the absolute values of the second differences
[PVH 01] (Equ.6)
Table 7. Elemental features commonly used on physiological data

52
# Short description Used by (e.g.) Formula
Further features considered useful
F.5 Median [LOKJ 08] [RKGF 09]
.
(Equ.7)
F.6 mean rise duration16
[RLSV 06] [BZA 07] [LOKJ 08] [RKGF 09]
(Equ.8)
F.7 number of peaks within the window
[KBK 04] [RLSV 06] [BZA 07] [LOKJ 08] [RKGF 09]
[VLBOZ 09] [KiAn 08]
F.8 inter beat interval, incl. LF/HF ratio
[RLSV 06] [BZA 07] [LOKJ 08]
[MGBA 09]
(Equ. 9)
Table 8. Further supporting features used on physiological data

4.1.3 Classification
In this section, common classification methods, as used in most projects are introduced. Pattern recognition methods used to classify physiological data usually apply either statistical classification techniques or template matching schemes. As there is no "best" classification method for all scenarios [KFS 95], [NALF 04], [KiAn 08], the most popular methods are described below. For more detailed explanations of the described methods, and many more, [Bish 06] and [HTF 09] are suggested as very good references.
4.1.3.1 k-Nearest Neighbour
The k-Nearest Neighbour algorithm (k-NN for short) is one of the most often used machine learning algorithms to classify emotional states particularly from physiological parameters. It uses an exemplary data set (often called training data set although there is no training as such), and a predefined set of classes.
First, classes are defined to which the sensor data should be classified to. Then, the instances of the training data set are assigned to the classes and labelled with the name of the class they belong to. In the classification process, new instances are assigned to that class whose members (i.e. the instances of the training data set) are closest to the new data. In other words, the "nearest neighbours" of the new data are determined.
The integer k defines the number of neighbours to be considered in that comparison. In other words, the algorithm looks at the k nearest neighbours of the new data and assigns the new data to the class most of the k neighbours belong to. For calculating the distance, different methods can be used, such as Euclidean distance, Mahalanobis distance, or Hamming distance.
k-Nearest Neighbour delivers best results when the number of instances is distributed evenly over all classes. In cases of unevenly distributed sample data in the training set appropriate compensation mechanisms should be applied, such as weighing the classes.
k-NN is also very sensitive against noisy data which can be mitigated by weighing the influence of the neighbours with their distance (distant instances getting less influence than close ones). Also, bigger values for k reduce the local sensitivity of the algorithm.

54
For affective sensing, k-NN is a good means for fast processing of affective data, given a good training data set can be provided, the input data are pre-processed properly and noisy data are treated appropriately.
k-NN is used in several projects, such as [PVH 01], [NALF04], [WKA 05], [RLSV 06] and [RKGF 09].
4.1.3.2 Regression Tree
Regression trees represent a way of nonlinear prediction, in which the data space is partitioned recursively until the sub-units of the data space can be managed easily, i.e. until the data of each sub-unit can be predicted by an acceptably simple model. Splitting the data space is done with a greedy approach, looking for that binary question that yields the most information on the data. The binary question divides the data into two "branches", and for each branch (i.e. sub-unit of the data) a new search is done following the same scheme. The recursive search ends, when the information gain has reached a certain threshold, or when the branch would represent a too small sub-set of the data. The end-point of each branch (called a "leaf") now represents a local model for the data.
Optimizing a tree can be done by cross-validation. The data are split into a set of training data and a set of test data. The tree then is built on the training data. For optimizing the tree ("pruning"), the test data are applied to the tree and each pair of leaves which originate in the same question (the "parent node") is analysed for errors. If the sum of squares of the errors can be reduced by removing the leaves, the leaves are removed and the parent node now becomes the leaf of that branch. This procedure is continued until no improvement can be reached. As additional measure, a new cycle of growing the tree and pruning it again can be run, with a changed set of data, to gradually improve the tree.
The biggest advantage of regression trees is their fast processing, since their predictions are done by looking at a results table, without complex calculations to be done. They also help to understand which variables (features) are important. Regression trees also work when some data are missing, simply by averaging the results of the tree below the last question that could be answered.
For affective sensing, regression trees are appreciated for their fast processing and robustness. Also they are a good means to gain knowledge about the data and their interrelationships. Regression trees are used e.g. by [RLSV 06], [BZA 07].
4.1.3.3 Bayesian Networks
Bayesian networks are probabilistic graphical models, particularly applying the structure of directed acyclic graphs (DAG). As such, the graphical model represents knowledge about the data and their interdependencies.
In the graphical model, each node represents a variable and the edges between the nodes represent probabilistic dependencies among corresponding variables, i.e. how much a variable is being influenced by another variable. In the DAG notation, a variable, or node, that depends on another variable's value is called that variable's "child", while the influencing variable is called the "parent" of the child node. The structure of the acyclic graph makes sure that no node can be its own descendant or ancestor. Thanks to this directed structure, statements on a variable's independence can be made, namely that a variable is independent from its non-relatives. This allows reducing the number of parameters when calculating probability distributions over the set of variables.
With the graph structure giving the qualitative part of the model, the quantitative part is describing the conditional probability distribution (CPD) among the variables, defining for each variable the probability of taking on each of the possible values, for each combination of values of its ancestors.
The big advantage of Bayesian networks is that they can deal with missing data points since the dependencies among the nodes are encoded in the network's structure. Another advantage is that detailed and complete knowledge on the data and their relationships is not needed since it is possible to include mere hypotheses into the structure of the network. By this, it is possible to examine relationships between variables.
Another great benefit of Bayesian networks is that they reduce the number of factors to be considered for each variable. Instead of considering each variable's influence on other variables, only the ancestor's influence needs to be considered. Generally, Bayesian networks are a very good means to represent causal and probabilistic semantics.
For affective sensing, Bayesian networks are recommended for their robustness and the possibility to include existing knowledge on the process into the model. They are also a nice means to examine the nature of processes.
Bayesian networks are e.g. used by [QiPi 02], [RLSV 06] and [VLBOZ 09]. A good introduction to Bayesian networks is given in [Ben 07] and [Bish 06].

56
4.1.3.4 Support Vector Machines
Support Vector Machines (SVM) are non-probabilistic binary linear classifiers, sparse decision machines allowing to separate data points and assigning them to one of two given classes. If more than two classes are to be separated, new classifiers can be built for the resulting classes of the first iteration, with a voting mechanism assigning new data points to one of the classes.
The charm of SVM lies in their approach to map data that are not linearly separable into a higher-dimensional data space until linear algebra and geometry can be used to separate the data points. The basic idea behind SVM is now to find a hyperplane that separates the data points according to their class membership, with the goal to maximize the "width" of that plane i.e. to maximize the distance between the two classes (called the "margin"). The task is then to find those data points that are closest to that hyperplane (that "support" it).
To facilitate scaling up and down the data space kernel functions are used, which are special integral transform algorithms with parameters that allow fine-tuning their behaviour. Several kernel functions have been developed and the one best fitting the data space has to be found applying e.g. the method of cross validation on a suitable training data set. With the SVM being built, the classes are well separated and it is now possible to assign each new data point to one of the classes.
SVM are fairly robust against noisy data, which makes them a good choice for classifying physiological data which usually are quite noise. Another advantage is that the training data set for building the SVM can be relatively small, which reduces the effort needed for building the classifier.
SVM are used by e.g. [KBK 04], [RLSV 06] and [BZA 07].
4.1.3.5 Fuzzy Logic
Fuzzy logic is an approach not that often used for classifying affective data. It has its roots in control engineering, where it is used as a simple means to control complex systems. This rule-based approach, however, can also be used to classify complex data or data that are only partially known.

According to [Cox 92], the fuzzy logic approach is well suited for continuous data, when a mathematical model of the process does not exist or is too complex, or when the data are very noisy.
Fuzzy logic uses descriptive rules to map the input data to output. The advantage of this approach is that the input data need not be known completely, or in other words, fuzzy logic is robust against unknown data. The input data space is partitioned in so called "fuzzy sets", regions to which an input can belong. Fuzzy sets may overlap, making it necessary to define the degree to which an input data belongs to either of the sets. Rules then are defined to map the input to the output variable(s).
Fuzzy logic systems comprise four components: input, output, membership functions, and rules. The membership function describes the degree to which a data point belongs to each of the given fuzzy sets. It weights the input values and defines the overlap between the sets. Membership functions usually are defined as triangular or trapezoidal functions, although other shapes are possible. The rules then are used to determine the value of the output signal. They usually are simple if/then conditional rules which give fuzzy systems a high performance.
For affective sensing fuzzy logic seems to be well suited. They allow dealing with noisy input data whose nature is not completely understood, as is the case with physiological data. They do not need to be trained as the whole system behaviour can be defined through the membership functions and rules. The rules they require can well be formulated since in most of the cases the desired behaviour of the system is well known (and usually quite simple).
Mandryk and Atkins [MaAt 07] use fuzzy logic to infer emotion information from physiological data, with remarkable success, [EYI 00] developed an interesting model for representing emotions using the fuzzy logic approach.
4.1.3.6 Artificial Neural Networks
Artificial Neural Networks (ANN) comprise of nodes (called "neurons") that are highly interconnected with each other. ANN are trained to build a model on the relation of input data to desired output values with the learning process usually being adaptive, meaning that the model can adapt to changing input data according to the provided feedback on its performance. Learning can be done
58
supervised or unsupervised with the latter leading to a so called self-organized network.
The logic of neural nets is contained in the neurons and their interconnections. A neuron usually has many inputs and one output. In the training phase, the neuron learns which output it has to provide for each possible input (in ANN terms it learns when to "fire"). Those "firing rules" provide an model for generating an output for all possible input combinations, even when the training data set does not cover all possible combinations. To infer the output for an input pattern that was not in the training set, a common way is to calculate the Hamming distance to all trained input patterns and take the output of the pattern with the smallest Hamming distance.
To make the ANN more flexible, the interconnections between the neurons are equipped with weights, which allow to manipulate the output of one neuron, increasing or decreasing its value according to that weight before it is processed by the next neuron. In other words, the weight describes the degree of influence one neuron has on the other. Through the weights, the network can adapt to changing situations, making it more powerful and flexible. Depending on the structure of the network, the weights are changed based on input data (so called feed-forward networks) or on the generated output (feedback networks).
The advantage of ANN is that they allow solving a problem (such as classification) without the need of an algorithm describing the behaviour of the system. That is, no knowledge of the actual process is necessary. However, neural nets require a high knowledge of the input data and the desired output of the system (for supervised learning). For high reliability, ANN need a relatively large data set as training data to cover a good range of combinations of input values. Once learned, a neural net is then very robust and tolerant against noise in the input data, and reliable in its behaviour. Thanks to their parallel structure and relatively simple calculations to be performed, ANNs have fast computation times.
For affective systems, neural nets might be appropriate when a training set of sufficient size is available and little is known about the underlying process to be modelled.
Artificial Neural Networks are used by [YLPKL 05] and [BLJW 10].

4.2 Summary
This chapter gave a short overview of established methods for data processing, analysis, and classification, necessary steps for making assumptions on a person's affective state. It started with basic means to pre-process noisy data before introducing major features commonly extracted from physiological data for deducing affective information. While it is possible to derive many features from physiological data, those discussed here can be considered a representative subset of features used in most affective computing projects involving physiological data. Similarly, many classification approaches exist and have been applied to physiological data with those described here being most popular ones for classifying physiological data.
Throughout the projects studied for this short review it could be observed that the data collected and analysed varied significantly between projects, leading to each project developing its own best classifier specialized for a project-specific feature set. A possible explanation for the variety in the data is the different methods used to collect physiological data and to map those to known affective states (ref chapter 2). The following chapter 5 provides a possible solution to this.

60
5 A new approach to associate and represent emotional states
Fig. 9. Chapter 5 in the context of this thesis
In this chapter, a new approach to structuring and representing emotions is developed with particular consideration of assigning physiological measurements to affective states. The approach avoids some of the drawbacks of standard models as identified in chapter 2 and allows to process affective sensor data in a more straightforward manner. After motivating and explaining the developed approach, an evaluative experiment is described which shows the general applicability of the approach.
5.1 Introduction
The previous chapters 2 and 3 have given an overview of the theoretical and physiological background as well as the state of the art in physiological sensing. At the end of each of the chapters, problems and issues have been discussed which have to be addressed by the affective computing community to advance further towards functional affective systems.
Feature Extraction
&Classification
...
Emotion Representation
Phys
iolo
gica
l D
ata
Affe
ctiv
e Ap
plic
atio
n
Aspects of Emotion TheoryAspects of Human Physiology
Chapter 3 Chapter 2
Emot
ion
Estim
ate
Emot
ion
Repr
es.
PhysiologicalSensing
Phys
iolo
gica
lSi
gnal
s
Chapter 5Chapter 6 Chapter 4 Chapter 7
5.1.1 Challenges addressed
In section 2.4, three challenges were identified of which two will be addressed in this chapter. Challenge 1 was related to emotion description models. It was said that there are many ways to describe emotional states and that there are different views among the experts which theory or model is best used. For HCI purposes, the implications of the different approaches are significant. The identified challenge was to decide on an emotion description that best fits the purpose of the project. Since decisions on this are very project specific, this thesis will not deal with this challenge in detail. [LOKJ 08] provides a feasibility study comparing the categorical and the dimensional approach, which is recommended as a good guide.
Challenge 2 addressed the problem of interpreting an emotional term and labelling a physiological pattern, as this is influenced by language specific, social and cultural factors. This applies both to the categorical as well as the dimensional approach. With the categorical approach the problem arises that many suggestions for categories exist with no clear distinction between categories so that they cannot be differentiated unambiguously by means of physiological measures. The problem with valence and arousal (and also control) measures is that the interpretation of how positively or negatively the current state is experienced is very difficult to determine and again depends on the social and cultural background as well as personal experiences and overall context, so that correlating physiological readings to single dimensions is problematic. The challenge for HCI here is to find a suitable description of emotional states for labelling physiological data that is ideally not affected by cultural and social conditions and allows for a clear distinction between emotional states.
Challenge 3 was on correlations of observable signs of emotions and emotional states. It is widely accepted that there are distinctive physiological correlates to individual emotional states. However, for most emotional states, identifying which physiological reactions correlate with which emotional state is still controversial. This problem can also be attributed to the lack of suitable means to assign emotional meaning to physiological data, i.e. to label sensor readings unambiguously and independent from social and cultural influences. The challenge is to find appropriate means that allow inferring the emotional state of a person from the physiological readings available.
62
Challenges 2 and 3 are addressed in this thesis by proposing a new approach with which to structure emotion. This approach does not rely on verbal descriptions of emotional states and is hence less prone to social and cultural influences. It avoids artificial categorisation of emotions, requires no naming of emotional states, is language independent and handles the problem of blended, or mixed emotions.
In this chapter, the concept of the new approach is laid out, followed by a description of an experiment that has been designed to evaluate the applicability of the approach. The study has been performed in co-operation with Humboldt University to Berlin and shows that the approach is indeed applicable. This work has been proposed to the HCI community in [PeHe 06] and has already been applied successfully by other researchers such as [VLBOZ 09].
5.2 Concept
As has been made clear in previous chapters, it is necessary to commit to one emotion model or another in order to define the basic principles of a study to be conducted or for a system to be designed.
Due to the many problems associated with category-based models (see chapter 2), a dimension-based approach is suggested to be more appropriate for HCI purposes as long as more than one dimension is used. As has been illustrated in section 2.2, linking physiological readings with just one dimension nearly always leads to contradictory results (Table 2). Obviously, emotional states cannot be distinguished clearly by using just one dimension. It is therefore considered necessary to use more than one dimension to describe a person's affective state unambiguously. The decision whether to use two or three or even more dimensions depends strongly on the research goal or application in mind. It can be assumed that two dimensions might suffice to characterise and discriminate between most of the emotional states that might occur during human-computer interaction. However, there are applications where the third dimension of power, or control, might be of interest, for instance to detect helplessness, irritation, or confidence of the user.
It is assumed that the model of emotional dimensions is universal so that it should be possible to identify a person’s emotional state by using two or more dimensions.

There are two issues to be addressed when using dimensions (ref. chapter 2). First, the problem of unambiguously distinguishing between emotions, i.e. the issue of pure vs. mixed emotions; and second, the problem of uniquely labelling emotions. Those will be discussed in the following sections.
5.2.1 Pure vs. mixed emotions
In their studies on the structure of emotion the pioneers of the dimensional approach derived their data from subjects’ ratings about the similarity of emotion words, e.g. [Russ 80], and replicated those later with self-reports on subjects’ current emotional states [FeRu 98]. In all of these studies, subjects were given a list of emotion words, which they rated in different ways. Usually, subjects were asked to indicate their current feelings on Likert-type scales ranging from “not at all” to “extremely”, “strong disagreement” to “strong agreement” or “describes me not at all” to “describes me very well”. Subjects rated several emotions as appropriate to describe their current states instead of just one, which showed that the subjects did experience several of the given emotions all at one time. Studies performed by Davis and colleagues [DRSBS 95] showed the same effect for subjects that were presented with emotional photographs. Examples of emotion combinations observed are happy/surprise, sad/disgust, anger/sad and love/happy/sad. However, researchers who studied correlates of emotion and physiology never seem to have paid much attention to that fact. The stimuli used were usually rated before the actual study was conducted to assure source clarity, and resulting correlates with physiological data were ascribed to the emotion that the stimulus was expected to induce, e.g. [FrLe 98]. Although such immense effort has been made to increase source clarity, hardly any of the stimuli achieved source clarity of nearly 100% (see also [Schim 05]).
Given the above mentioned results from Feldman Barrett & Russell [FeRu 98] and Davis et al. [DRSBS 95], it seems problematic to assign physiological measurements to emotion words like fear, anger, happiness and so on, since they are in fact just like categories and not unique emotions with a characteristic physiological pattern.
In proposing the use of a mixed instead of a pure emotion concept, it is suggested that the different emotions that are felt at one time blend together, resulting in one emotional state.
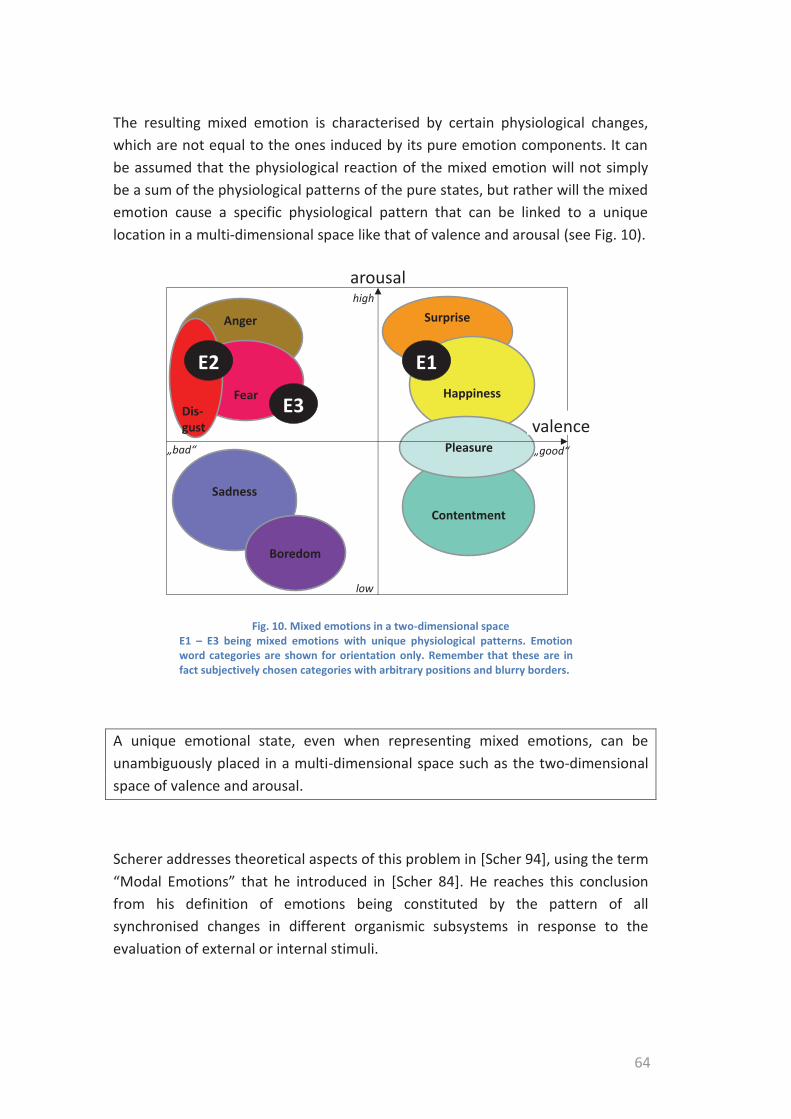
64
The resulting mixed emotion is characterised by certain physiological changes, which are not equal to the ones induced by its pure emotion components. It can be assumed that the physiological reaction of the mixed emotion will not simply be a sum of the physiological patterns of the pure states, but rather will the mixed emotion cause a specific physiological pattern that can be linked to a unique location in a multi-dimensional space like that of valence and arousal (see Fig. 10).
Fig. 10. Mixed emotions in a two-dimensional space E1 – E3 being mixed emotions with unique physiological patterns. Emotion word categories are shown for orientation only. Remember that these are in fact subjectively chosen categories with arbitrary positions and blurry borders.
A unique emotional state, even when representing mixed emotions, can be unambiguously placed in a multi-dimensional space such as the two-dimensional space of valence and arousal.
Scherer addresses theoretical aspects of this problem in [Scher 94], using the term “Modal Emotions” that he introduced in [Scher 84]. He reaches this conclusion from his definition of emotions being constituted by the pattern of all synchronised changes in different organismic subsystems in response to the evaluation of external or internal stimuli.
Anger Surprise
Sadness
Boredom
arousal
Happiness
E1
Contentment
Pleasure „good“
valence„bad“
low
high
Fear E3Dis-gust
E2
The approach proposed here can be considered similar to his, but with a more pragmatic and implementation-oriented attitude:
It is assumed that any affective state has a specific physiological pattern that can be used to distinguish it from other emotional states in a multi-dimensional space.
5.2.2 Labelling Emotions
Whenever studies resulted in a structure that showed emotion words placed in a coordinate system (e.g. [Russ 83], [MoHei 88], [VFGK 00], and many others), they all assumed that the list of words given to the subjects to rate their emotion contains words that are universal in so far that everyone will associate the same feelings with them. But what all categories of the discrete emotion theories have in common is that their definitions are based on verbal descriptions and hence on semantic categories of the language used. In most languages there are similar, but not identical categories, i.e. there is no one-to-one translation of emotion words, see [Russ 91]. Examinations of the semantics of basic emotion terms by Wierzbicka [Wierz 92] also showed similar results. She explained that for some languages certain words describing basic emotions do not exist (such as the word anger for the Ilongot language of the Philippines or the Ifaluk language of Micronesia) and concluded that the basic emotions are just cultural artefacts of the English language. These findings from Russell and Wierzbicka contradict the assumption of universality of emotion by claiming that there exist intercultural differences in the interpretation of emotion words.
In the context of HCI, it can be assumed that even within the same culture individual differences will exist. People of the same social and cultural background but with different experiences with technology might describe similar interactive episodes in different emotional terms. So if, for example, a study is designed to induce “anger” by e.g. advertisements popping up every 20 seconds, one subject will indeed experience anger, while another subject who is used to aggressive Internet ads would just be annoyed, with respective physiological reactions. As a result, the observed physiological reactions of the subjects will be very different although they all responded to a situation labelled “anger” by the person who set up the study.

66
For the approach suggested here, it is proposed that there are not only inter- but even intra-cultural differences in the interpretation of emotion words.
This approach suggests abandoning labelling emotions with words. Instead it suggests that it is possible to describe a person’s emotional state only by using dimensions, rather than emotion words. The emotion could simply be labelled by its position in the coordinate system.
Fig. 11. SAM - Self Assessment Manikin Valence (top row), arousal (bottom row), as suggested by [Lang 80]
When looking at studies that use a dimensional approach to describe emotions and correlate the reported state with physiological patterns [BGH 93], [DSB 98], [NeuWa 01], [RitTh 02], [BLJW 10] and [ZKZ+ 10], it is obvious that nearly all those studies report difficulties in correlating the physiological readings to valence and arousal.
Their common approach is to ask subjects for their perceived valence and arousal, using either scales with labels17, or the Self-Assessment Manikin SAM [Lang 80], [BrLa 94], Fig. 11.
SAM allows the subjects to describe their current feeling in terms of arousal and valence by picking a figure that symbolizes the corresponding state. The manikins represent 5 states with the subjects rating their current feeling either on a
manikin or in the space between two manikins, which results in 9 gradations. SAM avoids using words, but nevertheless proved to be difficult to use for some users [LOKJ 08]. Both methods treat valence and arousal separately because it is easier for persons to describe their perceived emotional state considering the axes separately.
An obvious problem is that all researchers tried to separately correlate self-assessments of valence and arousal to the physiological readings. But valence and arousal belong together, as they describe an emotional state with a unique combination of valance and arousal values. Considering only valence or only arousal must lead to contradictory results, as e.g. high arousal values with the same rating for arousal can relate to both strong anger or high excitement (different valance values), with obviously very different physiological correlates (see Fig. 4). It is therefore essential to always consider both the used dimensions as a pair, describing a single emotional state.
Evidence suggests abandoning correlating separate emotional dimensions with physiological parameters. Rather, an emotional state should always be described by using a combination of valence and arousal and possibly further dimensions. In other words:
Correlations of physiological processes should always be attributed to all dimensions used as only their combination can correctly represent the correlated emotional state.
5.3 Implementation
This section describes the steps necessary to implement the new approach. It is explained how it could be used to explore correlates between physiological patterns and emotions experienced by the subjects. In this description, a two-dimensional model is used for clarity, adding further dimensions does not affect the method’s applicability.

68
5.3.1 Step 1 - acquisition of physiological data and emotion rating
In a first step, emotions that typically occur during specific interactions will have to be identified. This could be done with subjects performing computer tasks and rating their different emotional experiences using a non-verbal method, for instance SAM [Lang 80] [BrLa 94], Fig. 11. Examples of those tasks for use in a laboratory experiment are writing a letter, playing a game, completing a form, or others as appropriate. A task for acquiring base line data should also be included.
After subjects have rated their emotions as experienced during the task e.g. on SAM, the ratings can be placed in the coordinate system according to their degree of arousal and valence and should from that point on be labelled with their x- and y-coordinates, e.g. “emotion (2, 1.5)”, see Fig. 12.
Physiology is the second characteristic of interest. For this, certain physiological measures, like heart rate, electro-dermal activity (usually skin conductance level, SCL), or skin temperature of the subjects have to be taken while performing the above-mentioned tasks and self-assessments.
Fig. 12. Emotion ratings in the coordinate system
valence-1 1
1
-1
X(-4, 1)
X(1, -3)
X(2, 1.5)
arousal
X(2, 2)
valence-1 1
1
-1
X(-4, 1)
X(1, -3)
X(2, 1.5)
arousal
X(2, 2)
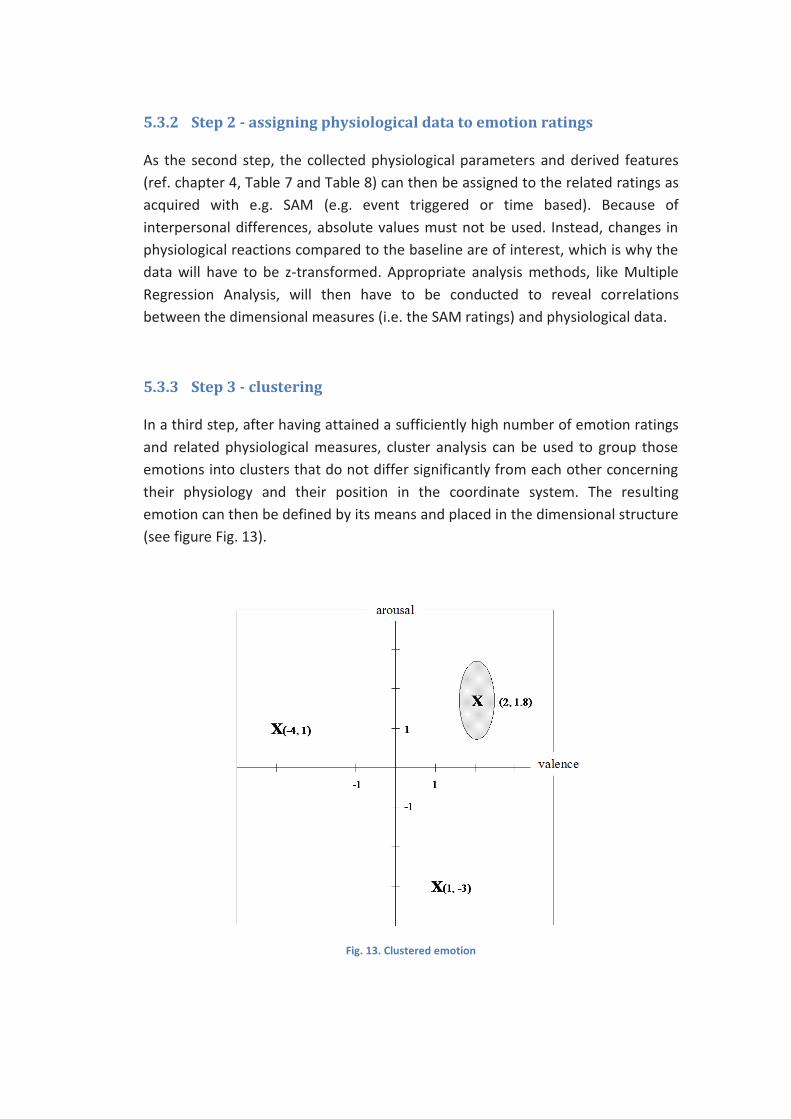
5.3.2 Step 2 - assigning physiological data to emotion ratings
As the second step, the collected physiological parameters and derived features (ref. chapter 4, Table 7 and Table 8) can then be assigned to the related ratings as acquired with e.g. SAM (e.g. event triggered or time based). Because of interpersonal differences, absolute values must not be used. Instead, changes in physiological reactions compared to the baseline are of interest, which is why the data will have to be z-transformed. Appropriate analysis methods, like Multiple Regression Analysis, will then have to be conducted to reveal correlations between the dimensional measures (i.e. the SAM ratings) and physiological data.
5.3.3 Step 3 - clustering
In a third step, after having attained a sufficiently high number of emotion ratings and related physiological measures, cluster analysis can be used to group those emotions into clusters that do not differ significantly from each other concerning their physiology and their position in the coordinate system. The resulting emotion can then be defined by its means and placed in the dimensional structure (see figure Fig. 13).
Fig. 13. Clustered emotion

70
5.3.4 Step 4 - finding physiological patterns
In the fourth and last step, it should be possible to identify a characteristic pattern in the physiological signals for each of the clusters. Those can be used in further processing steps to automatically detect and discriminate distinctive affective states of the user in the given context.
These proposed four steps allow assigning physiological data (usually features derived from physiological signals) to distinct affective states. This has been validated in a study described in the following section.
5.4 Experimental Validation
The proposed method has been validated by a study performed in co-operation with Humboldt University to Berlin [HPMMV 05], focussing on Step 1 - acquisition of physiological data and emotion rating, and

Step 2 - assigning physiological data to emotion ratings.
A full implementation has been performed independently by [VLBOZ 09]. They implemented all steps as suggested above, based on [PeHe 06], confirming the applicability of the suggested method.
In the following sections, the study carried out in co-operation with Humboldt University to Berlin [HPMMV 05] is presented. The experiment has been performed with subjects completing computing tasks while emotion-related physiology changes were recorded. Data were obtained for skin conductivity (SCL), skin temperature, heart rate, and pupil dilation.
5.4.1 Experiment
Subjects were 31 students (14 males, 17 females) from 19 to 27 years (mean 22.7) from Humboldt University to Berlin. Some of the students received credit for their participation, while others just had personal interest in the topic. Four representative tasks were chosen to be performed on a computer in order to elicit a wide spectrum of emotions that might occur during everyday computing tasks.
Scenario 1: The first task was to count pictures of babies which were presented on the screen. The task was divided into three parts with different difficulty levels. In the first part only babies were presented. In the second part babies and neutral objects were presented. In the third part human babies, animal babies and baby-connected objects were presented. The goal of the first task was to induce an emotional state of high valence and low arousal.
Scenario 2: In the second task, subjects had to search different lists for certain requested files. In sum, 3*3 lists had to be searched. Difficulty level was varied by raising the difficulty of the words for each list-group as listed in the Celex Database [BPR 95]. The goal of this task was to induce an emotional state of low valence and low arousal.
Scenario 3: The third task was a task of repetitively colouring figures with a very small pencil tool. Figures of different shape were being presented which had to be coloured in three minutes each. The task was divided into three parts, varying by the difficulty and size of the figure. The goal of this task was to induce an emotional state of low valence and high arousal.
Scenario 4: The fourth task was to play a game of “Ultraflex”, in which the user had to destroy bricks in a game field using a spaceship and a ball. This game was

72
to be played three times, with difficulty levels low, middle and high, respectively. A level was over when the subject had lost the game or when three minutes had passed. The experimental goal of this task was to induce an emotional state of high valence and high arousal.
For self-assessment of experienced emotions, the Self-Assessment Manikin (SAM) as shown in Fig. 11 was used, using 9 gradations.
Subjects were placed in front of the monitor and asked to sit comfortably. Sensors for EDA, skin temperature and heart rate were attached on the subject and a helmet with mounted pupil-camera was put on the subject’s head. The experimenter then recorded the subject’s sex, age, health, and computer and internet experience. Afterwards instructions were presented on the monitor, which introduced the subject to SAM and explained how to use the rating scales. The subjects were instructed to rate their emotions after each level but according to the emotion they felt during the task. Before the experiment was started, time for questions was given and the subject was orally instructed to be honest when rating and told that there were no “wrong” emotions. One session lasted about 30 minutes, depending on how fast the subjects completed the tasks. Afterwards a short debriefing was conducted and time was given to report any possible problems the subjects had found.
5.4.2 Results
Analyses were conducted with SPSS [SPSS 10].
5.4.2.1 Data Reduction
The permanent recording of physiological parameters led to a huge amount of physiological data compared to only one SAM-rating per Level. Since the goal was to correlate the SAM-ratings (dimensions) with physiology, physiological data had to be reduced to one value for each physiological parameter per level/SAM-rating. Unfortunately, Scenario 1 had to be excluded from analyses for all subjects because of technical problems, resulting in a maximum of 9*2 SAM-ratings and 9*4 physiological values per subject. Pupil diameter could not be measured for 4 subjects, EDA was missing for one subject and heart rate could not be recorded for two subjects. Physiological data was z-transformed in order to reduce inter-individual differences and allow comparisons between subjects.
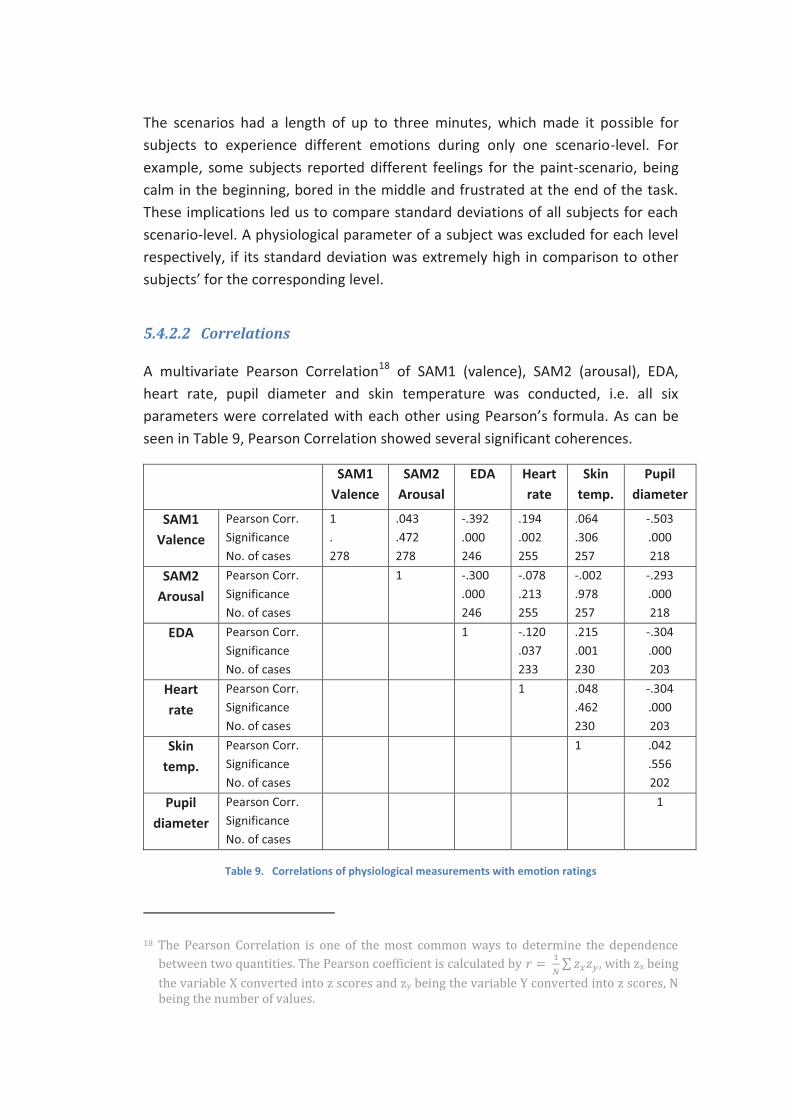
The scenarios had a length of up to three minutes, which made it possible for subjects to experience different emotions during only one scenario-level. For example, some subjects reported different feelings for the paint-scenario, being calm in the beginning, bored in the middle and frustrated at the end of the task. These implications led us to compare standard deviations of all subjects for each scenario-level. A physiological parameter of a subject was excluded for each level respectively, if its standard deviation was extremely high in comparison to other subjects’ for the corresponding level.
5.4.2.2 Correlations
A multivariate Pearson Correlation18 of SAM1 (valence), SAM2 (arousal), EDA, heart rate, pupil diameter and skin temperature was conducted, i.e. all six parameters were correlated with each other using Pearson’s formula. As can be seen in Table 9, Pearson Correlation showed several significant coherences.
SAM1 Valence
SAM2 Arousal
EDA Heart rate
Skin temp.
Pupil diameter
SAM1 Valence
Pearson Corr. Significance No. of cases
1 . 278
.043
.472 278
-.392 .000 246
.194
.002 255
.064
.306 257
-.503 .000 218
SAM2 Arousal
Pearson Corr. Significance No. of cases
1 -.300 .000 246
-.078 .213 255
-.002 .978 257
-.293 .000 218
EDA Pearson Corr. Significance No. of cases
1 -.120 .037 233
.215
.001 230
-.304 .000 203
Heart rate
Pearson Corr. Significance No. of cases
1 .048 .462 230
-.304 .000 203
Skin temp.
Pearson Corr. Significance No. of cases
1 .042 .556 202
Pupil diameter
Pearson Corr. Significance No. of cases
1
Table 9. Correlations of physiological measurements with emotion ratings
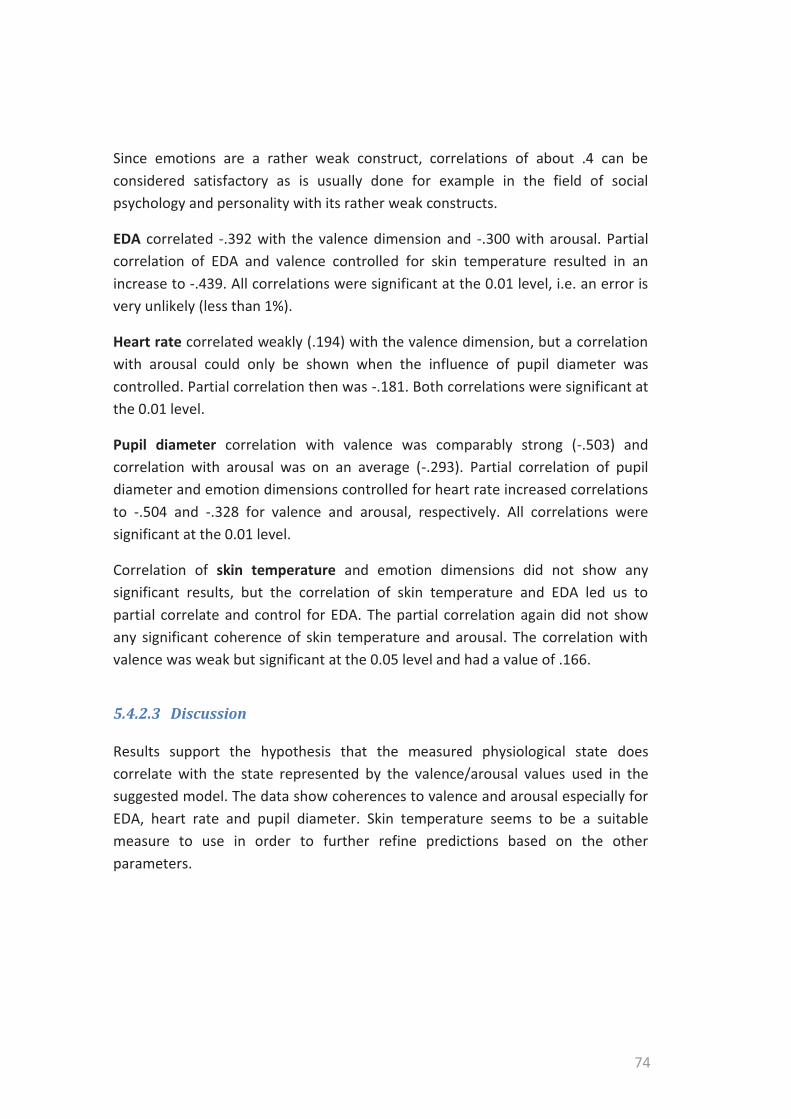
74
Since emotions are a rather weak construct, correlations of about .4 can be considered satisfactory as is usually done for example in the field of social psychology and personality with its rather weak constructs.
EDA correlated -.392 with the valence dimension and -.300 with arousal. Partial correlation of EDA and valence controlled for skin temperature resulted in an increase to -.439. All correlations were significant at the 0.01 level, i.e. an error is very unlikely (less than 1%).
Heart rate correlated weakly (.194) with the valence dimension, but a correlation with arousal could only be shown when the influence of pupil diameter was controlled. Partial correlation then was -.181. Both correlations were significant at the 0.01 level.
Pupil diameter correlation with valence was comparably strong (-.503) and correlation with arousal was on an average (-.293). Partial correlation of pupil diameter and emotion dimensions controlled for heart rate increased correlations to -.504 and -.328 for valence and arousal, respectively. All correlations were significant at the 0.01 level.
Correlation of skin temperature and emotion dimensions did not show any significant results, but the correlation of skin temperature and EDA led us to partial correlate and control for EDA. The partial correlation again did not show any significant coherence of skin temperature and arousal. The correlation with valence was weak but significant at the 0.05 level and had a value of .166.
5.4.2.3 Discussion
Results support the hypothesis that the measured physiological state does correlate with the state represented by the valence/arousal values used in the suggested model. The data show coherences to valence and arousal especially for EDA, heart rate and pupil diameter. Skin temperature seems to be a suitable measure to use in order to further refine predictions based on the other parameters.
With regard to the proposed steps, the following observations are worth mentioning:
Inducing Emotions
The goal of the experiment was to induce emotions in all four quadrants of the dimension model, but it proved to be difficult to fill out the third quadrant, i.e. to induce negative and low arousing emotions (Fig. 14). This problem was probably one of population; by using highly motivated and interested college students, they were not very likely to be bored by the experiment. The pre-tests also indicated socially desirable emotion ratings, which is why in the main study the introductory briefing put great emphasis on honesty and pointed out that ratings are not assessed to judge the scenarios themselves or even the experimenter’s competence. All of the other three quadrants could be filled with ratings satisfactorily.
Fig. 14. SAM-ratings for scenarios 1 through 4 Big blobs indicate many ratings; little points indicate few to one.
During the experiment we encountered occasional technical problems with scenario 1, which required us to exclude the related data from further analysis. This resulted in further reduction of data points in the valence/arousal space, especially in quadrant 4 (Fig. 15).

76
Fig. 15. SAM-ratings for scenarios 2 through 4 Big blobs indicate many ratings; little points indicate few to one.
Measuring Emotions
Using real life scenarios instead of pictures or films (as is often done in psychological studies) caused different methodological problems, since real-life scenarios are harder to control, i.e. the subjects’ behaviour and resulting emotions are harder to predict.
Self-assessment of their emotions proved difficult for some subjects. Having real-life scenarios lasting several minutes, subjects had to recall their emotions and maybe also to name the prevailing ones, since they might have gone through different emotional states during a task.
Inter-individual differences could be observed, such as subjects preferring extreme ratings or subjects with a tendency to the middle. This problem could be answered by further refined analysis and a more thorough introductory briefing and debriefing.
Intercultural differences were also observed. Two non-German subjects (origin: Baltic States) rated very much differently to their German colleagues concerning the variance of their ratings. In the debriefing, they reported that they had felt calm and positive throughout the experiment. Unfortunately it could not be proved if this was the case or if they rated the same feelings differently to German subjects.

In addition, being connected to different technical devices in an artificial laboratory situation is also likely to have prevented subjects from calming down, which is a general problem when using physiological sensors.
Finally it can be said that the experiment proved the applicability of the proposed approach. The goal of the experiment was to find out if emotion-related physiological parameters could be unambiguously mapped onto a dimensional data representation. We could show that the suggested model to structure and represent emotions is well suited for that aim.

78
6 A new approach to sensing emotion-related physiological parameters
Fig. 16. Chapter 6 in the context of this thesis
This chapter addresses the challenges that relate to sensing emotion-related physiological parameters as worked out in chapter 3. A solution is provided, conceptualizing a sensor system that is well suited for use in real-world scenarios, avoiding many of the drawbacks of current commercial physiological sensor systems as they were identified in chapter 3. Two iterative implementations of this concept have been developed and evaluated, verifying their applicability.
6.1 Introduction
6.1.1 Challenges addressed
In chapter 3, section 3.5 several issues were identified that have to be addressed when developing affective systems for use in real-world settings. They have been summarized in three challenges, adding to the three challenges identified in chapter 2, section 2.4. Challenge 4 is about the users. Only when the users are willing to accept and use adequate sensing technologies, affectively adaptive systems will become reality. The challenge is to design affective sensors in such a
Feature Extraction
&Classification
...
Emotion Representation
Phys
iolo
gica
l D
ata
Affe
ctiv
e Ap
plic
atio
n
Aspects of Emotion TheoryAspects of Human Physiology
Chapter 3 Chapter 2
Emot
ion
Estim
ate
Emot
ion
Repr
es.
Phys
iolo
gica
lSi
gnal
s PhysiologicalSensing
Chapter 5Chapter 6 Chapter 4 Chapter 7

way that people will use and engage with them so that they are fully operational and can provide affective information in sufficiently good quality.
Challenge 5 is technological. Given that the sensors have to be as unobtrusive as possible, they likely not always are able to acquire data in consistently high quality. For instance, visual sensors will occasionally have limited view on the person, and physiological sensors will be not worn at times or subjected to movements inferring their data. The challenge is to design the device sufficiently robustly and to provide information on the reliability of the sensor data in real-time along with the data, in order to allow a processing system to make assumptions on the usefulness of the provided information.
Given that a single sensor will usually not be sufficient to provide an adequate amount of affective information on the person, multiple modalities are needed to collect as much information as possible without harassing the user. Challenge 6 is to find suitable ways to fuse sensor data that come from different modalities and are of a totally different nature in terms of complexity, time behaviour and accuracy.
In this thesis, challenges 4 and 5 are addressed. For aspects of sensor fusion (challenge 6) please refer to e.g. [CKC 08] and [McGö 08].

80
6.2 Concept
When developing physiological sensor systems for affective applications, HCI-related aspects as discussed in chapter 3.6 play an important role. Aspects identified as being most important are:
- Robustness;
- Non-obtrusiveness;
- Easy usage/usability;
- User experience;
- Immediate access to data;
- Ease of integration;
- Standard conformance.
For a system to meet the criteria above, a distributed architecture with wirelessly connected components seems to be most appropriate. It allows design of small and robust distributed components while avoiding wires to communicate the data. Components can be split in one component for collecting the data, i.e. a sensor component, and another component taking care of processing the data and providing them for further use, Fig. 17.
The sensor component is responsible for acquiring the data from the basic sensors connected to the user’s body. Examples for basic sensors that could be connected to a sensor unit are sensors for skin conductivity or skin temperature. In the sensor component, data should be pre-evaluated at the signal level to avoid sending useless data to the processing component. The sensor unit has to be placed close to the body of the user. It should be small and of little weight and comfortable to wear. The wires from the basic sensors to the electronics should ideally be hidden.
The processing component should take care of validating, pre-processing and storing the data, as well as making them available immediately to the affective application. The processing component should be freely positionable within a sensible range of the sensor component and permanently keep contact with the affective application for which it serves as input device. Of course, the affective sensor system should be able to cope with the processing component losing contact with the sensor component and make sure that sensible data are permanently provided to the affective application.
In the following, both components will be discussed in more detail.

Fig. 17. Concept of a physiological sensor system
6.2.1 Components
6.2.1.1 Sensor component
For acquisition of peripheral physiological data, the basic sensors such as skin temperature, EDA or heart rate sensors need direct contact with the subject’s skin. To avoid long wires between basic sensors and the senor component’s electronics, the sensor component should be close to the actual measurement location.
To allow for easy usage and hence increased acceptance of the system, basic sensors, electronics and wires should be invisibly integrated in a device or in the types of clothing or gears usually worn by people, for instance a glove, wristband, watch, brassiere, jewellery, headband, base cap or similar. As has been shown in different studies [PiSch 01], [PSVUN 07], such integrated devices are quickly accepted and people soon forget about being monitored when using everyday objects.
The main task of the sensor component is to capture the data and to perform pre-evaluations at the signal level, like detecting measurement errors or sensor failures (ref. section 6.2.2 - Data validation). If errors occur, the data need to be treated and appropriate action should be taken, like re-adjustment of the basic sensors, calibration of electronic parts, or notification to the processing component. Before the data can be transmitted, they have to be wrapped in an appropriate transmission protocol, and a checksum has to be generated.
...
Raw
Dat
a
Sensing
• Capture data• Pre-evaluate data
(signal level)• Provide data for
processing
Phys
iolo
gica
lSi
gnal
s
Phys
iolo
gica
l D
ata
Data Pre-Processing
• Receive data• Timestamp data• Validate data• Adjust flawed data• Generate reliability
information• Convert to engineering
units (SI)• Provide data to next step

82
6.2.1.2 Processing component
The processing component must receive the data from the sensor component. After validating the checksum, valid data should get a time stamp as soon as they are received to allow for synchronizing data from different basic sensors (e.g. skin temperature and environmental temperature), as well as for correlating collected physiological data with external events.
Following this, data can be evaluated for sensibility, based on stored information on typical values, measurement history, physical laws, and possibly under consideration of data from other basic sensors. For instance, when no basic sensor sends sensible data, it is likely that the sensor component is not attached properly to the user. When just one basic sensor reports unusual data, there might be a problem with that sensor (e.g. not properly attached). In case of a general sensor error, the sensor component could, for instance, be reset. In case a bad attachment of the sensor component is assumed, the user could be notified and asked for assistance.
In the next step, output data can be prepared taking into account information of the validation of the input data. Raw data should be converted to engineering (SI) units. Since it is desirable to provide sensible data continuously, missing or bad data have to be treated, for instance by filling gaps with likely, estimated data. Where alterations have been performed on the data, this has to be made known to the processing affective application along with further reliability information. Prepared like this, the data can be sent out continuously to the affective application. For cases with no permanent link to the application being available, the possibility of storing the data on the device should be provided.
6.2.2 Data validation
As suggested earlier (section 3.4), data should be validated at different levels on their way from entering the system as raw measurement values to finally being provided as reliable information to the affective application. First, at the measurement level it should be evaluated if the measurement values obtained represent sensible data. For instance, a skin conductance value dropping to zero can only mean the sensor not being attached to the skin and should be treated accordingly. Second, the data should be evaluated at a higher, process level, taking all sensor data including auxiliary information together and evaluating the different measurement values in relation to each other and in context of the process that is being observed. To give an example, if a wearable device hosts
both a skin conductance sensor and a skin temperature sensor at nearby locations (e.g. the same finger) and the skin conductance is very low, the skin temperature value should be treated with care as it is likely that both sensors have no proper contact to the person’s skin.
A very good way to validate sensor data at this level is proposed by the standard for self-validating sensors (SEVA) which has been developed at Oxford University and has been adopted as a British standard [BSI 04]. The SEVA concept as described in [HeCl 93], [Henry 01a] and [Henry 01b] is based on the idea that an intelligent sensor should provide more useful information than the measurand and a device-specific error code. SEVA devices monitor their own performance, validate the quality of the data, and provide standard-formatted reliability information for each measurement value they pass on. If an error occurs its impact on the measurement is assessed, the measurement value corrected if necessary, and the reliability information set accordingly.
Fig. 18 shows the principle concept of a SEVA sensor. Raw measurement data are read in by the SEVA sensor. As common sensors, the raw measurement data are provided, together with proprietary sensor diagnostics such as error codes. Additionally, SEVA values are provided. The validated measurement value (VMV) represents the most likely value (the best estimate) of the actual process value (usually the original measurement value as long as no error occurs). The validated uncertainty (VU) describes the sensor’s confidence in the correctness of the data provided, i.e. the accuracy of the validated measurement value. The measurement value status (MVS) is a discrete parameter indicating the reliability of the VMV depending on how it was calculated. According to the SEVA standard, possible values are: clear (valid measurement), blurred (estimated data after known errors have occurred), dazzled (estimated data with uncertain cause of problems), and blind (estimated data of increasing uncertainty). The device status (DS) indicates how operational a sensor is. The SEVA standard proposes 6 states: good (no problems), testing (sensor in self-test), suspect (malfunction possible but not yet verified), impaired (malfunction with low impact), bad (serious malfunction diagnosed), and critical (sensor not operational). The validated measurement value VMV along with the validated uncertainty VU and the measurement value status MVS are calculated and provided for each measurement, while the device status DS changes with the device’s operational status.

84
Fig. 18. Schematic view of a SEVA sensor [HeCl 93]
By moving the validation task from the application level to the sensor itself it is possible to perform process- and sensor specific validations in-situ and to apply possible corrective measures directly to the sensor. No process- or sensor specific knowledge is needed at application level and the communication from sensor to application is reduced to a minimum, i.e. only sensible data are sent to the processing domain. SEVA also suggests pre-processing the data in the sensor system so far so that measurement values are already provided in engineering units. This step keeps all low-level sensor specific parameters and conversion algorithms within the device, making integration of such devices simple and straightforward.
Providing reliability information along with the measurement data keeps analysing the data simpler, and thanks to the device-independent standard format of the reliability information, the software at the system level becomes independent from the chosen hardware, which allows a more flexible planning and changing of hardware modules. As a side effect, the data processing algorithms of the application can be made simpler, since a permanent flow of guaranteed useful data is provided and the assessment of the liability of the data is already done by the sensor in a standardised way.
With those advantages offered by SEVA, this method for sensor validation is suggested for physiological sensors that have to provide reliable data in real-time.
For more information on SEVA and several implementation examples please refer to [BSI 04] and to [HeCl 93], [ZAB+ 99] [Henry 01a], [Henry 01b], and [THP 04].
SEVA Sensor
Validated MVValidated UncertaintyMV Status
Device Status
Raw Measurement
Detailed Diagnostics
Raw DataOne pervalue

6.3 Exemplary implementation
6.3.1 First prototype: EREC-I
A sensor system has been developed19 which follows the concept described in section 6.2 [PEB 05]. It measures skin conductivity, heart rate, skin temperature and, as auxiliary information, ambient air temperature. The processing component features a display to visualize the current state of the system and current measurement data. Basic user input is possible by hardware buttons e.g. to indicate interesting events. As a special feature for applications and mobile devices, the processing component can generate events, such as detection of certain physiological states, which can be made available to the outside world.
Communication between sensor component and processing component is done wirelessly using an ISM20 band transmitter (433 MHz). With the used transmitter, the maximum range is 10-30 meters indoors and up to 300 meters outdoors. The first prototype of the system uses a glove as garment hosting the sensor unit (Fig. 19).
Fig. 19. EREC first prototype

86
6.3.1.1 EREC-I sensor component
All sensing electronics and basic sensors, except for the heart rate, are integrated in a glove. This allows for short and hidden wires from the basic sensors for skin temperature and skin conductivity to the electronics. As heart rate sensor, a conventional chest belt is used. The heart rate receiver from Polar is designed for placing near the hand and therefore could well be integrated into the glove.
The placement of electrodes and temperature sensor is shown in Fig. 20. For sensing skin conductance, two electrode pairs have been included at two different locations, the index finger, and the thenar. This helps to increase the robustness of the system significantly. Data evaluation checks can be performed more reliably based on those duplicate data. The skin temperature is taken at two different positions as well but integrated in one sensor, leading to higher accuracy and higher resolution. Also in the sensor component, the ambient air temperature near is measured. This is another important factor for calculating sensor status and data reliability, since skin temperature and skin conductivity vary with changing environmental temperature.
Skin temperature as well as skin conductivity are sampled 20 times per second each. Heart rate data are sent out by the heart rate sensor immediately after a beat has been detected. The collected data are digitized instantly and assessed for sensor failure as described in the data validation section below (section 6.3.3).
Fig. 20. Position of basic sensors in the EREC glove

Based on the evaluation results, output data are prepared in the next step. In case of bad or temporarily no data from a sensor, previous data are used to estimate the likely current value. In this case, a flag in the transmission protocol is set accordingly. Wrapped into the protocol and fitted with a CRC check sum, the data are sent out by the integrated ISM-band transmitter.
6.3.1.2 EREC-I processing component
The processing component receives the data transmitted from the sensor component. Thanks to the wireless connection multiple sensor components, each with a unique identifier, can easily be used if wanted. Immediately after the data have been received by the processing component they get a time stamp. After a positive check sum evaluation, data are validated and enhanced as described in the data validation section below (section 6.3.3). The validation results are stored along with the data and their time stamp on a local exchangeable memory card. If desired, they can also be sent out permanently to a host computer using a serial connection, in this version RS232.
The environmental temperature is taken again in the processing component. This is to provide an additional indicator on environmental changes the person might be exposed to and complements the corresponding measurement of the sensor component (the sun might shine on the person’s hands, resulting in a higher local temperature near the hand, while the room might still be chilly).
All data are made available in SI engineering units. The temperature is represented in degree Celsius with a resolution of 0.1°C. The skin conductance is provided in its reciprocal unit21 and comes in kilo ohms with a resolution of 300 kilo ohms. The heart rate comes in beats per minute (bpm) with a resolution of 1 bpm. Transmission speed of the validated and enhanced data to a processing host is for each of the sensors 5 validated values per second.

88
6.3.2 Second prototype: EREC-II
After first tests and evaluations (see section 6.4), a number of changes to the system have been recommended by users, leading to the development of EREC-II.
Fig. 21. EREC-II components
EREC-II consists of two parts as well. The sensor component still uses a glove to host the basic sensors for skin resistance and skin temperature, while the electronics are now in a separate wrist pocket. It also collects heart rate data from a Polar heart rate chest belt and measures the environmental air temperature. The processing component is wirelessly connected to the sensor component, receives the pre-validated sensor data, evaluates them, stores them on a memory card and/or sends the evaluated data to a computer running the affective application. In the following, more details are given in comparison to the EREC-I system. A description of the development steps and individual evaluations is given in [PSVUN 07].
6.3.2.1 EREC-II sensor component
The sensor component is functionally identical to that of EREC-I, with small changes to the circuit layout. The basic sensors are fixed now on a cycling glove (Fig. 22).

Fig. 21 illustrates the processing electronics being hidden in a wrist pocket, with the sensing elements connected to it by a short, covered lead. While this actually is against the requirement of no wires being visible, it was proved in our studies that users where not irritated by it. As we designed this connection to look more like a strap than an electric cable, people accepted this as part of the design.
Fig. 22. Basic sensors in EREC-II glove
This new design offers various benefits. Most importantly it increases the flexibility in using the system by allowing connecting various designs of sensor gloves to the electronics part (e.g. different sizes, colour, or fabric). Also, it allows using gloves of lighter and more airy material which increases comfort and fit of the glove. Further, due to the electronics being placed above the wrist, the user’s movements are less affected by weight and size of the electronics module. Finally, the glove can be washed in a usual manner since no delicate electronics are integrated in it. Feedback from users confirmed the appropriateness of this decision.
6.3.2.2 EREC-II processing component
The processing component has undergone a major re-design. It has now a pocket-size case, no display, and uses a smaller memory card for storing data permanently. The data are stored on the card in the common FAT22 format
90
allowing reading out the data with any standard computer. The serial connection to a computer is now using USB23.
The display has been replaced by light emitting diodes (LEDs24) for communicating different sensor and system states. Three push buttons are available for the user to mark special events. As with EREC-I, sensor data are received from the sensor component, transport errors are assessed, and reliability checks are performed each time new data are received. Validated data are sent out immediately to a connected PC and stored on the memory card. Also, raw measurement data are now provided for detailed low-level analyses, if desired.
6.3.3 Data validation
Data are validated throughout the system at two levels: a signal level evaluation is performed on the data in the sensor component, and a process level validation is carried out in the processing component with respect to usefulness of the data. Validation is based on the SEVA standard as suggested in section 6.2.2.
The sensor component collects data from several sensors. In the configuration described in this chapter there are two skin conductance sensors, one skin temperature sensor, one ambient air temperature sensor, and one heart rate sensor. Except for the air temperature sensor, all sensors need direct connection to the user’s body. As the user moves about sensing elements might become temporarily detached. Those cases are handled at the signal level by the sensor component. If no data are received from a sensing element, a “best estimate” is sent instead. A flag in the transmission protocol is set in this case, indicating that the data are estimates. If no data have been received from a sensor for a longer period of time (e.g. for 10 samples), a sensor status flag is set accordingly in the transmission protocol.
In the processing component, the status of each sensor is analysed continuously based on the data and sensor status received from the processing component. Validated SEVA data are generated based on these results and additional knowledge on physiology and sensor characteristics. The following data are produced (in accordance with suggestions from [Henry 01b]):

Validated measurement value (VMV)
This corresponds to the actually measured value as long as no problem occurred and the data are in a sensible range. In case of problems, i.e. estimated data have been received or the sensor status being blind, further considerations on the most likely value are made. In case data move out of a predefined range or develop unusual (i.e. heart rate over 200 bpm, jump of skin temperature by 2°C within 0.2 seconds), a VMV value will be estimated based on previously received data and stored measurand characteristics.
Validated uncertainty (VU)
The VU denotes the likely error of the VMV. It can be seen as an “uncertainty band” enclosing the VMV.
Measurement value status (MVS)
According to the SEVA standard, the following values are generated: clear (valid measurement), blurred (estimated data after known errors have occurred), dazzled (estimated data with uncertain cause of problems), and blind (estimated data of increasing uncertainty).
Device status (DS)
The device status is generated according to the SEVA standard’s six statuses: good (no problems), testing (sensor in self-test), suspect (malfunction possible but not yet verified), impaired (malfunction with low impact), bad (serious malfunction diagnosed), and critical (sensor not operational).
Detailed diagnostics (DD)
In case of an error, precise information on the error are provided, e.g. no data, wrong CRC, or data out of range.
Those SEVA data are stored in the processing component and communicated to processing applications, along with the data.
Providing reliability information on the measurement values allows to assess the quality of the data in real-time. With suitable visualisation tools, this information can be used to e.g. verify that the system is operating properly.

92
Fig. 23 shows an example of data collected with the EREC system, as visualized with the EmoChart software25. In the bottom-left corner an easy to understand overview of the functioning of different sensing elements is given, using a traffic light metaphor. Green light is used for the MVS being "clear", amber for the MVS being "blurred" or "dazzled", and red for the MVS being "blind".
Above the SEVA status overview window, a combined, normalized, representation of all incoming validated measurement values of all EREC sensors is given to provide an overview of the behaviour of the incoming data.
In the separate sensor plots arranged to the right, an "uncertainty band" as introduced by Henry in e.g. [Henry 01a] visualizes intuitively how certain the sensor was about its measurement. The broader the uncertainty band, the less reliable are the data provided. Note that there are always data available for being processed, so an affective application need not deal with any aspects of sensor failure or loss of data.
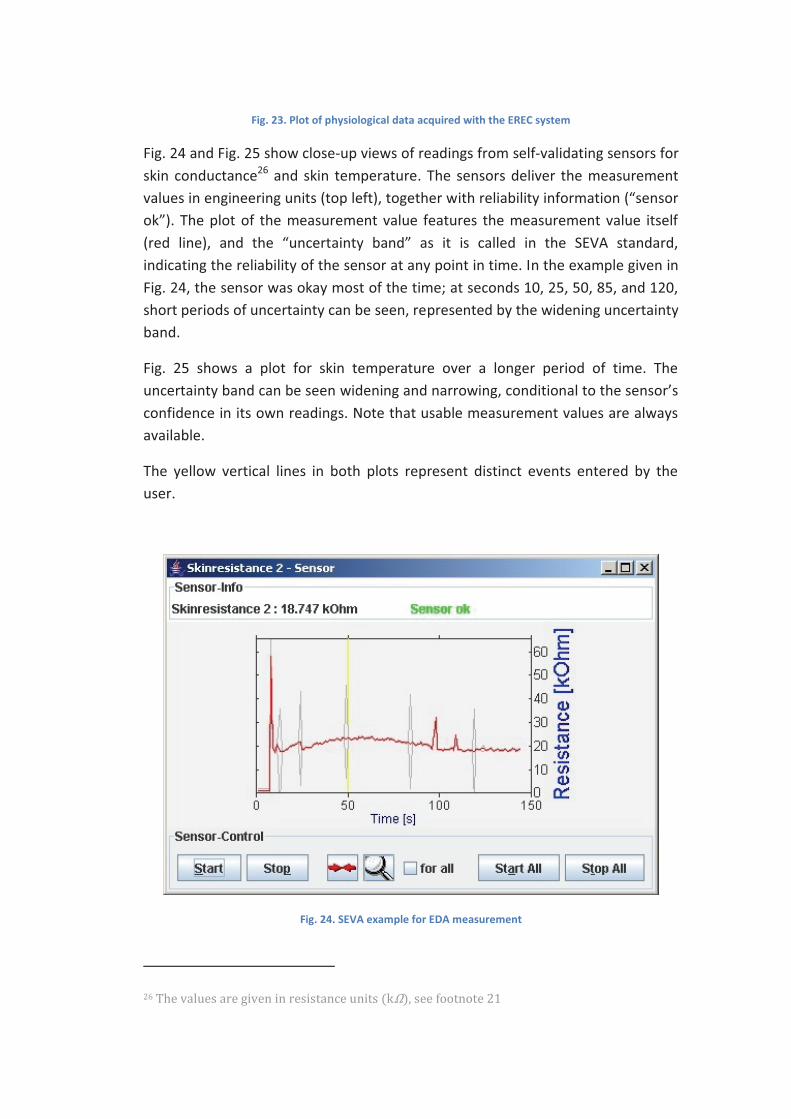
Fig. 23. Plot of physiological data acquired with the EREC system
Fig. 24 and Fig. 25 show close-up views of readings from self-validating sensors for skin conductance26 and skin temperature. The sensors deliver the measurement values in engineering units (top left), together with reliability information (“sensor ok”). The plot of the measurement value features the measurement value itself (red line), and the “uncertainty band” as it is called in the SEVA standard, indicating the reliability of the sensor at any point in time. In the example given in Fig. 24, the sensor was okay most of the time; at seconds 10, 25, 50, 85, and 120, short periods of uncertainty can be seen, represented by the widening uncertainty band.
Fig. 25 shows a plot for skin temperature over a longer period of time. The uncertainty band can be seen widening and narrowing, conditional to the sensor’s confidence in its own readings. Note that usable measurement values are always available.
The yellow vertical lines in both plots represent distinct events entered by the user.
Fig. 24. SEVA example for EDA measurement

94
Fig. 25. SEVA example for skin temperature measurement
6.4 Experimental evaluation
The EREC system, version EREC-II, has been evaluated at the National ICT Australia (NICTA) Research Laboratory in Canberra, Australia27. As an ICT research centre paying much attention to user experience aspects of information and communication technology, NICTA investigates different ways of objectively measuring factors of user experience and human performance.
The NICTA Vision Science, Technology and Applications (VISTA) group is interested in measuring and analysing physiological sensor data from a perspective of monitoring human performance as well as improved human-computer interaction (HCI). The EREC system, providing information on emotion-related physiological parameters, is considered an interesting device delivering valuable real-time information on the user’s current state. To assess the possible usefulness of the EREC system, NICTA’s VISTA group evaluated the EREC-II system in two different scenarios of multimodal affective sensing: human performance monitoring, and affective sensing for improved HCI. The evaluation took place in the premises of NICTA, over a period of 5 weeks. In the following, a brief overview of these activities is given, followed by a summary of NICTA’s evaluation result.
6.4.1 Evaluation Scenarios
For collecting information on the user’s affective state, NICTA follows a multimodal, multi-sensor approach. It considers multimodality as a key to delivering affective information with the robustness required in real-world applications. Supplying computer systems with the capability to sense affective states is considered important for developing intelligent, user-centred systems.
In terms of modalities, NICTA’s research is focussed on using audio, video, and physiological sensors. In the audio modality, features such as fundamental frequency F0, energy, and speed of delivery are used to gain insights into evidence of affective states in spoken language. They proposed a new, more comprehensive model of affective communication and a set of ontologies which provide a rigorous way of researching affective communication [McGö 06]. In the video modality, active appearance models are used to track the face of users and its facial features [CETB 98]. Active appearance models are a popular method for modelling the shape and texture of non-rigid objects (e.g. faces) using a low dimensional representation obtained from applying principle component analysis to a set of labelled video data. Active appearance models are then combined with artificial neural networks to automatically recognise facial expressions.
Finally, physiological data are used for measuring physiological responses related to affective states. Electro-dermal activity, heart rate and skin temperature are of particular interest in NICTA's projects as these parameters are considered key indicators for affective responses that are accessible in real-time with fairly unobtrusive means. With these measures all being provided by the EREC system, testing the system was of high interest to NICTA.
For evaluating the EREC system in a multimodal affective sensing scenario, the system has been used as third modality together with audio (speech analysis) and video (facial feature analysis) sensors.
6.4.1.1 Scenario 1: Human Performance Monitoring
In a joint project with the Australian Institute of Sports in Canberra, Australia, NICTA investigated how state-of-the-art camera technology in the infrared range of the electro-magnetic spectrum could be used to measure performance indicators that were so far only accessible by physiological sensors. Near-infrared cameras can be tuned to wavelengths specifically relevant to human haemoglobin, which is the carrier of oxygen in blood, so that haemoglobin levels can be measured in a non-invasive way. Similarly, far-infrared cameras can

96
visualise thermal energy emitted from an object, e.g. a human body. NICTA use far-infrared cameras to measure the surface temperature of a person, map these onto a 3D model of the person’s body and determine the heat source using finite-element methods.
In this project, the EREC-II sensor glove system was used as a ground-truthing device because it allows to measure physiological parameters directly. In the experiments, a test-person sits on a cycling ergometer during a training session. Data are recorded from the EREC-II system, and the near-infrared and far-infrared cameras. During an analysis of the training interval, the performance indicators derived from the video data is compared with the data from the physiological sensors as well as data from blood samples.
6.4.1.2 Scenario 2: Affective Sensing for Improved HCI
NICTA also investigate multimodal HCI systems that are capable of sensing the affective state of a user and that monitor this state or take it into account for evaluating the user’s perception of the system’s behaviour and for deciding on next actions of the HCI system.
In this scenario, affective sensing is used for advancing a driver assistance systems that aid drivers in their driving task. Vehicle drivers have to perform many cognitive tasks at the same time and one of the major sources for accidents is cognitive overload. Another danger is driver drowsiness which is particularly relevant for long-distance and night-time driving. In an experimental vehicle, NICTA have placed cameras that look at both the road and surroundings outside the car as well as monitor the driver. While facial feature tracking and eye blink detection are one way of detecting drowsiness, there was no way of measuring physiological parameters before the EREC-II system was incorporated.
Ultimately, one would like the sensors in the EREC-II system to be integrated into the steering wheel, rather than having to wear a sensor glove, but for an experimental vehicle the setup using a glove is acceptable. Measuring the heart rate, electro-dermal activity and skin temperature give direct cues about the affective state of the driver and can be used to improve the reliability of drowsiness detection systems.

Fig. 26. EREC-II evaluation in a car-driving scenario
6.4.2 Evaluation results
6.4.2.1 Robustness, data quality and access
EREC’s approach to provide the data in an open format makes it very easy to access the affect-related physiological information. It was a nice experience to be able to directly access the sensor data, even in real-time, without the need of proprietary software. With the data already coming in engineering units it was easy to analyse the data and to include them in processing algorithms. A huge advantage that can be attributed to the fact of data coming in engineering units was that one had not to pay attention to any sensor specific configurations and related conversion tasks to be included in routines analysing the data. This very convenient fact eases integration and avoids the risk of inaccuracies in converting values.
A very interesting and valuable feature of EREC is the implemented self-validation of the data. This is a very new and very nice idea, adding a high level of trustworthiness to the device. The sensor data always come with reliability information, informing on the trustworthiness of the provided data. It was found that this will simplify the implementation process of analysis algorithms, as there are always data available that are in the range of expected values. Treatment of sensor failure, data being out of range, or broken connections to the sensor

98
component are all treated in the device and need not be taken care of by the analysing routines. The reliability information in form of simple states in four gradations is considered sufficiently detailed to handle the data in an according manner.
Overall, it was found that the device works very reliable, with data being valid most of the time.
While working with the EREC system it proved to be very convenient that the sensor data along with the related SEVA quality index could be checked in real-time. This made it very easy to put on the glove properly and to make sure the system sends sensible data throughout the study.
Another data-related aspect was that of resolution and sample rate. Compared to other devices that are usually used in the medical sector, EREC’s sample rates of 20 Hz per channel appeared fairly low (medical devices use several 100 Hz, up to 2048 Hz). However, it was found that for the purpose of affective sensing, EREC’s sample rates are fully sufficient for enabling applications to react on HCI-related affective changes in the user. NICTA believes that affectively intelligent ICT is not expected to deal with every little change of a person’s affective state and hence needs not to detect every so little change. Rather, an affectively intelligent system should be able to detect relevant affective reactions of the user to the system’s behaviour, which are assumed to last long enough to be detected with a 20 Hz sample rate.
The resolution of the data is very good. Electro-dermal activity could be monitored very well. Skin temperature data come with sufficient resolution, but it was found that the temperature sensor is fairly slow which makes it difficult to assign observed changes to a certain event. A faster response time is considered necessary to make sense of this parameter. Changes of the heart rate could be detected well enough to conclude on relevant changes of the mental state (scenario 2). For improved analysis such as inter-beat intervals, the heart rate information needs to be more reliable. NICTA would like to suggest to provide the inter-beat interval as an additional sensor output of the device, with EREC taking care of the IBI calculations and providing the value readily available.
The system as a whole proved to be very robust. Data were always available and allowed for permanent monitoring of the physiological parameters of the test persons. Some problems occurred with the heart rate data in the driver assistance scenario. EREC-II uses a commercial chest belt which sends the data wirelessly to the sensor component. At some occasions, no heart rate data were received from the chest belt while driving. First investigations suggest that this was caused by

electromagnetic interferences with some electrical devices of the car, such as the wiper’s drive. It also appeared that the positioning of the hand (with the heart rate receiver being integrated in the glove) in relation to the chest belt has some influence on receiving valid data from the chest belt. NICTA see potential for further improvements of the system in terms of the reliability of the heart rate data transmission. NICTA also suggests providing for an optional pulse oxymeter (SpO2 sensor).
Apart from the named issues with the heart rate sensor, NICTA found the sensors to work reliably and the entire system to be robust and very useful in their applications.
6.4.2.2 Usability and obtrusiveness
Both, experimenters and test subjects found the EREC system easy to use and comfortable to wear. Putting on and off the glove was very easy and no special care had to be taken to place the sensors at certain positions, as is the case with common commercial systems. This ease of use was experienced very positively by both, the experimenter and the test subjects. The test subjects in the experiments have found the EREC-II sensor glove comfortable to wear and reported no particular problem with it. The glove did not prevent a ‘normal’ use of the hand in both scenarios. The system being integrated into a glove has the advantage that it is very lightweight and that it is comfortable to wear even for longer periods of time. NICTA found that having the sensor circuitry in a separate component which is attached to the wrist is acceptable in many application areas, in particular when the wearer is sitting, for example, while working on a computer. However, for more mobile application scenarios, it would be advantageous to have a more compact component that is integrated with the sensor glove.
Concerning the chest belt, test persons of the sports scenario (scenario 1) had no problem with this as this is common equipment for these persons. In the driver assistance scenario (scenario 2) the chest belt was considered an inappropriate measure for real-world use, but okay for research purposes. It seems an interesting alternative to include a heart rate sensor either in the steering wheel or the seat.

100
6.4.3 Discussion
In chapter 3, section 3.5 several issues were identified that have to be addressed when developing affective systems for use in real-world settings. This project addresses two of those, namely first to design affective sensors in a way that the users allow it to be present and operational (i.e. they use it) so the system can provide the affective information in sufficiently good quality and timely resolution, and second to design the device sufficiently robust and to provide information on the reliability of the sensor data in real-time along with the data, to allow a processing system making assumptions on the usefulness of the provided information.
Concerning the first challenge, the evaluations show that systems based on the concept developed in section 6.2 are usable and accepted by users. While all evaluations were research studies, an observation could be made supporting more general assumptions on acceptability, usability and usefulness of HCI systems as e.g. discussed in [Cock 04a]. Cockton states that the acceptance of a product depends on the product's fit to its purpose, its quality in use, and its value to the user. Fit to purpose means that the better a device performs doing what the user expects it to do, the more it is accepted and even valued by the user. Cockton even proclaims that fit matters more than quality in use, because a product that does not live up to the user's expectations concerning its function will not be used, regardless how easy it might be to use. Cockton goes on explaining that value matters even more than fit, meaning that a device that is of value to the user will be used, even if it is not that fit to purpose and not that usable. Applying this view on the evaluations of the EREC system (and further to any physiological sensor system), it can be assumed that a slightly intrusive system might still be liked and hence used if the benefit for the user is obvious and of value for that person. For instance, persons might well be willing to wear a sensor glove when driving a car when this increases their safety and gives them a more pleasant driving experience28.
Concerning the second challenge it can be said that the reliability information provided along with the data were very useful in assessing the quality of the recorded data. With the EmoChart visualisation tool it was possible to observe the physiological data in real-time during the studies to ensure data being collected properly. In fact, during studies it has been reported that having the reliability data available immediately and wirelessly was one of the main values of the

system because the experimenter could always see if the glove was worn properly and if heart rate data were received from the chest belt. Comparing this to commercial systems which either require the sensor system being wired to a PC running the visualisation software or a wireless system just storing the data in a box without any information on sensor data being available (let alone sensible), this was considered a big step towards user-friendly system design.
The evaluation show that the developed concept for physiological sensor systems meets important criteria of affective computing research. Robustness, non-obtrusiveness, easy usage and ease of integration were assessed very positively in the evaluation. The immediate access to data, the concept of pre-evaluating the data on the device and providing the data in SI engineering units were highly valued. Overall, the implementation of the developed concept can be considered a successful proof of applicability of the proposed approach to sensing emotion-related physiological data.
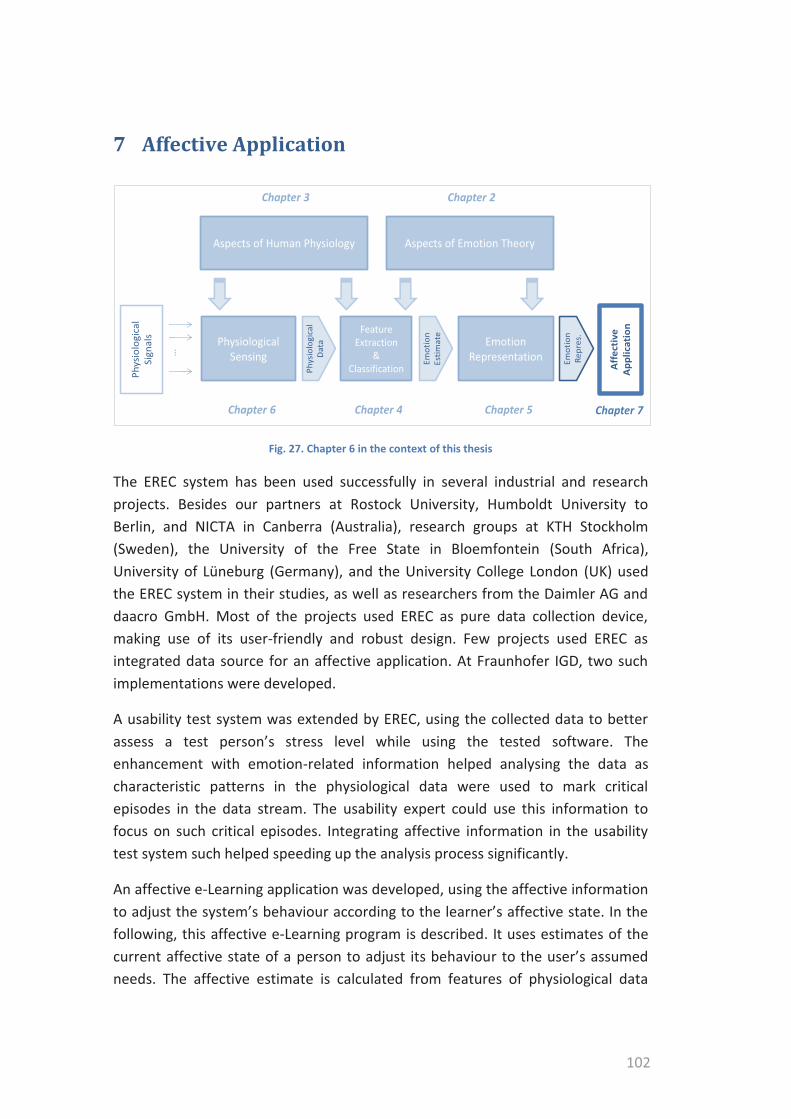
102
7 Affective Application
Fig. 27. Chapter 6 in the context of this thesis
The EREC system has been used successfully in several industrial and research projects. Besides our partners at Rostock University, Humboldt University to Berlin, and NICTA in Canberra (Australia), research groups at KTH Stockholm (Sweden), the University of the Free State in Bloemfontein (South Africa), University of Lüneburg (Germany), and the University College London (UK) used the EREC system in their studies, as well as researchers from the Daimler AG and daacro GmbH. Most of the projects used EREC as pure data collection device, making use of its user-friendly and robust design. Few projects used EREC as integrated data source for an affective application. At Fraunhofer IGD, two such implementations were developed.
A usability test system was extended by EREC, using the collected data to better assess a test person’s stress level while using the tested software. The enhancement with emotion-related information helped analysing the data as characteristic patterns in the physiological data were used to mark critical episodes in the data stream. The usability expert could use this information to focus on such critical episodes. Integrating affective information in the usability test system such helped speeding up the analysis process significantly.
An affective e-Learning application was developed, using the affective information to adjust the system’s behaviour according to the learner’s affective state. In the following, this affective e-Learning program is described. It uses estimates of the current affective state of a person to adjust its behaviour to the user’s assumed needs. The affective estimate is calculated from features of physiological data
Feature Extraction
&Classification
...
Emotion Representation
Phys
iolo
gica
l D
ata
Aff
ectiv
e A
pplic
atio
n
Aspects of Emotion TheoryAspects of Human Physiology
Chapter 3 Chapter 2
Chapter 5Chapter 6 Chapter 4 Chapter 7Em
otio
nEs
timat
e
Emot
ion
Repr
es.
PhysiologicalSensing
Phys
iolo
gica
lSi
gnal
s

which are collected with the EREC system (chapter 6). For representing and communicating the affective state to the affective application, a dimensional model as suggested in chapter 5 is used with the affective state being represented by its valence and arousal coordinates in the two-dimensional valence/arousal space (cf. chapter 5). With this, the chapter represents the last stage of the pipeline of affective physiological sensing.
7.1 Introduction
E-Learning has become a well-recognized method for acquiring knowledge, be it for studies, further education, or work-related on-the-job training. Although e-Learning environments support tutoring and cooperation, an essential part of learning is assumed to be self-contained with the learner communicating mainly with an electronic system. This requires more discipline and self-motivation due to lack of human communication which usually functions as motivator in traditional learning scenarios.
For an affective e-Learning application it is assumed that reacting to unfavourable affective states of the learner will improve not only the learning experience of the person, but also the overall learning performance of the person.
Fig. 28. Yerkes & Dodson’s correlation of arousal and performance (from [DCP+ 07])

104
The Yerkes-Dodson law [YeDo 08] reveals an empirical relationship between physiological arousal and performance of a person, with a bell-shaped curve for cognitively demanding tasks (Fig. 28).
From this, it can be concluded for learning tasks that a person’s performance increases particularly with cognitive arousal, but only up to a certain point: when levels of arousal become too high, the performance of the person will decrease. For valence, a similar behaviour can be found, with people in a negative emotional state performing not as good as people with positive affect, leading to the conclusion that a positive valence seems to be beneficial for learning performance [Isen 00], [PPB+ 04].
Based on this, areas of unfavourable emotional states can be concluded and a target region for optimal learning can be identified in the arousal-valence diagram. In Fig. 29, region 1 represents affective states with negative valence and positive arousal, referring to emotions like frustration, annoyance and angriness.
Emotions like boredom and sleepiness are represented by region 2, characterized by negative valence and low arousal.
Fig. 29. Regions of interest in the affective space for e-Learning applications from [OKVU 07]

The target region of emotions, specified by a slight positive valence and medium arousal, should support the learner for a maximum of efficiency and factual knowledge gain respectively.
An affective e-Learning system will instantiate dedicated actions depending on the learner’s affective state with the goal to move the learner’s emotion from the unfavourable negative regions towards the target region.
In the AFFectIX project, an extension to an e-Learning environment was implemented that uses affective information on the user as additional input to the e-Learning application and provided affective feedback to the learner with the goal to improve the performance and the overall learning experience of the user. Fig. 30 illustrates the architecture of the developed AFFectIX system.
Fig. 30. AFFectIX e-Learning system architecture
The AFFectIX system consist of 6 components: An emotion recognition module, integrating the affective sensing pipeline; an affective user model; a catalogue of
Feature Extraction
&Classification
Emotion Representation
Phys
iolo
gica
l Da
ta
Emot
ion
Estim
ate
EmotionRepres.
PhysiologicalSensing
Reasoning(Action
Selection)Affective
User Model*
Catalogueof
Measures
Execution
E-Learning SystemInteraction
* not implemented
PhysiologicalSignals
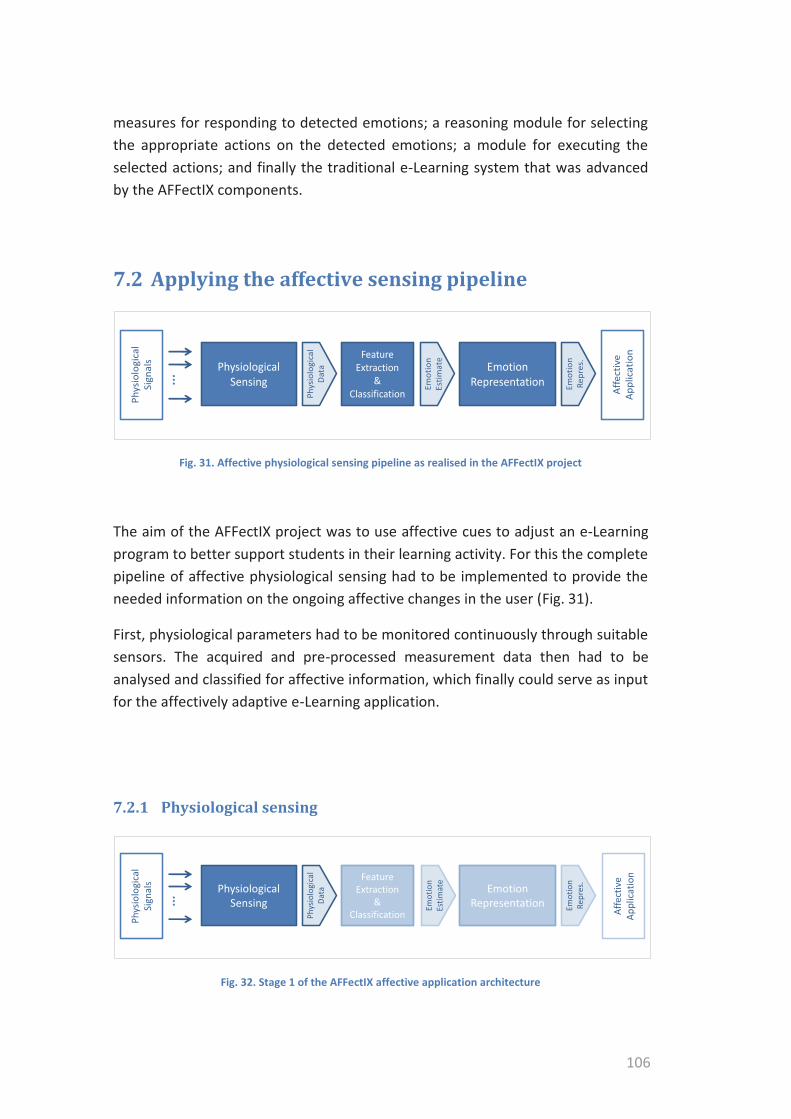
106
measures for responding to detected emotions; a reasoning module for selecting the appropriate actions on the detected emotions; a module for executing the selected actions; and finally the traditional e-Learning system that was advanced by the AFFectIX components.
7.2 Applying the affective sensing pipeline
Fig. 31. Affective physiological sensing pipeline as realised in the AFFectIX project
The aim of the AFFectIX project was to use affective cues to adjust an e-Learning program to better support students in their learning activity. For this the complete pipeline of affective physiological sensing had to be implemented to provide the needed information on the ongoing affective changes in the user (Fig. 31).
First, physiological parameters had to be monitored continuously through suitable sensors. The acquired and pre-processed measurement data then had to be analysed and classified for affective information, which finally could serve as input for the affectively adaptive e-Learning application.
7.2.1 Physiological sensing
Fig. 32. Stage 1 of the AFFectIX affective application architecture
Feature Extraction
&Classification
...
Emotion Representation
Phys
iolo
gica
l D
ata
Affe
ctiv
e Ap
plic
atio
n
Emot
ion
Estim
ate
Emot
ion
Repr
es.
PhysiologicalSensing
Phys
iolo
gica
lSi
gnal
s
Feature Extraction
&Classification
...
Emotion Representation Em
otio
nRe
pres
.
PhysiologicalSensing
Phys
iolo
gica
lSi
gnal
s
Phys
iolo
gica
l Da
ta
Emot
ion
Estim
ate
Affe
ctiv
e Ap
plic
atio
n

Sensing affective states in an e-Learning context needs to be done unobtrusively to avoid distraction of the learner from the learning task. The person should be able to move about freely, use keyboard and mouse, make notes, and even go out of the room to take a break without having to put off and on any sensor equipment.
The EREC system was considered a suitable tool for this purpose as it is easy to wear, does not need any electrodes to be placed on certain areas of the body and features a wireless connection between sensor hardware and PC. Further, it allows the user to behave as usual when operating a computer, not constraining the person in movements, posture or activities. Other sensors, like a camera monitoring the face or a microphone providing auditory cues on likely emotions were considered less suitable, as emotion-related changes in facial features are rare in computer supported learning and the learning task did not require the learner to speak.
As EREC also delivers the relevant physiological parameters heart rate and electro-dermal activity, which are well established in the affective computing domain (ref. chapter 2), EREC had been chosen as affective input device for the AFFectIX affective e-Learning system.
7.2.2 Feature extraction and classification
Fig. 33. Stage 2 of the AFFectIX affective application architecture
The physiological data provided by the EREC system come in SI engineering units, which is very convenient for further processing of the data. EREC also provides reliability information on each measurement value, which allowed simplifying handling the data, as useful data were always available. Error handling is taking care of on the device, making integrating EREC into the e-Learning system easy and straightforward. According routines had only to deal with the four SEVA states
Feature Extraction
&Classification
Emotion Representation
Phys
iolo
gica
l Da
ta
Emot
ion
Estim
ate
Emot
ion
Repr
es.
PhysiologicalSensing
Affe
ctiv
e Ap
plic
atio
n
...
Phys
iolo
gica
lSi
gnal
s

108
clear, blurred, dazzled and blind (ref. section 6.2.2) which enormously simplified the integration while adding robustness to the system.
For feature extraction and classification, the OmniRoute framework, developed at Fraunhofer IGD, has been used [MPG+ 04]. OmniRoute allows to freely configure systems that have to deal with different sorts of data. The particular advantage of OmniRoute in the context of this application is that it allows connecting different sensor sources (i.e. the different physiological data channels) with processing components that perform the dedicated processing steps such as smoothing, feature extraction, and finally classification.
In this project, the feature set suggested by Picard et al. was used [PVH 01], i.e. the mean, standard deviation, mean of the absolute values of the first differences, and mean of the absolute values of the second differences, each applied to the raw data as well as the normalized values.
For classification, the Naive Bayes classifier of the Weka toolkit29 has been used (see chapter4).
7.2.3 Emotion representation
Fig. 34. Stage 3 of the AFFectIX affective application architecture
For representing the classified emotion, a dimensional model has been used, with the classified emotion being positioned in the valence/arousal space by its x and y coordinates. As described in chapter 5, this allows representing the state of the user on continuous axes, in this project in an interval from 0 to 1 for both valence and arousal. This helped to assess the results of the emotion classifier in relation to specific learning tasks.
Feature Extraction
&Classification
Emotion Representation
Phys
iolo
gica
l Da
ta
Affe
ctiv
e Ap
plic
atio
n
Emot
ion
Estim
ate
Emot
ion
Repr
es.
PhysiologicalSensing
...
Phys
iolo
gica
lSi
gnal
s

For the affective application, representing valence and arousal on continuous scales allows to tailor the system behaviour much better than it is possible with fixed categories values.
7.2.4 Affective application
Fig. 35. Stage 4 of the AFFectIX affective application architecture
Four components of the e-Learning application deal with the affective adaptation: a user model; a catalogue of measures for responding to detected emotions; a reasoning module for selecting the appropriate actions on the detected emotions; and a module for finally executing the selected actions (ref. Fig. 30).
The user model30 is thought to keep a track record of the learner’s behaviour, preferences, and affective reactions to the different adaptations of the system.
The catalogue of measures describes the possible actions to support the learner in managing negative emotions. Of particular interest are emotions that lie in the two critical regions as shown in Fig. 29. The measures contain application-independent and application-dependent actions.
As application-independent actions were provided motivational statements, the possibility to express displeasure, the suggestion of a short break and the possibility to play a mini-game to reduce stress and frustration.
Application-dependent actions, bound to the given e-learning system or at least to the application domain, were mainly changes of lessons, of the way the subject is presented (e.g. an animation instead of pure text), or the start of a questionnaire to check the learners learn progress.
Emotion RepresentationEm
otio
nEs
timat
e
Emot
ion
Repr
es.Feature
Extraction&
ClassificationPhys
iolo
gica
l Da
taPhysiologicalSensing
...
Phys
iolo
gica
lSi
gnal
s
Affe
ctiv
e Ap
plic
atio
n

110
Fig. 36. Application dependent action: adaptation of the learning path
The reasoning module selects actions provided by the catalogue of measures. The selection itself depends on the availability of actions: while application-independent actions can be continuously offered, application-dependent actions have to consider constraints of application and relations between actions as well, taking into account insights stored in the user model.
The execution module finally performs the selected action.
A field study proved that the fun factor of the course was rated higher, that a greater learning success was achieved, and that actions of the affective extension did not hinder the learning or exploration process.

7.2.5 Evaluation
7.2.5.1 Procedure
The AFFectIX system has been tested in an experimental study. Ten participants had to perform an e-Learning session on financial accounting comprising a set of lessons, a test module, and multimedia learning elements. All participants had to wear the EREC system, while only 5 were supported by the affective system. The remaining 5 participants served as control group. The session lasted about 30 minutes. Measures for valence and arousal were taken from the emotion recognition system. User satisfaction was assessed using a questionnaire, the learning success was evaluated via the test module integrated in the e-Learning system.
7.2.5.2 Results
Despite the small size of the study it became evident that affect-related adaptations have indeed an effect on a learner’s perceived emotion, the learning success, and the overall user experience.
As Table 10 illustrates, participants supported by AFFectIX (group 1) show significant higher valence values than the control group, indicating a more pleasurable experience for the participants that got affect-related support and tailored courses. Arousal measures are lower for the affective group than for the control group. With the control group, all but one participant were more than moderately aroused with two even having been very aroused. This can be interpreted as the standard lessons being too demanding or frustrating. In group 1 (with affective support), in the contrary, just one participant showed arousal values as expected while the others remained very calm. This allows the conclusion that the affective reactions of the system helped to avoid stress and frustration. However, since most participants are well below the desired arousal values (target arousal range between 0.4 and 0.6, see Fig. 29), the adaptions were not optimal.
112
Table 10. Comparison of valence/arousal ratings between groups (from [OKVU 07])
A questionnaire was used for getting self-reports of the participants on their perceived user experience. As can be seen in Table 11, some affect-related interventions of the system like the mini-game helped to increase the positive experience (fun). However, this led to an overall less positive rating of the system, as the satisfaction after the course as well as the valuation of the course was rated less positive by the affectively supported participants. It can be assumed that the users didn’t take the e-Learning system as serious after having had fun with the mini-game.
Table 11. Comparison of user experience between groups (from [OKVU 07])
Concerning learning success, the affectively supported group performed better than the control group. This is interesting in so far as it contradicts the negative self-reports of group 1 participants. Although participants of group 1 performed better, they felt less satisfied than the control group. A possible explanation is that group 1 participants felt less challenged than usual in the course, what might lead to dissatisfaction in some users.
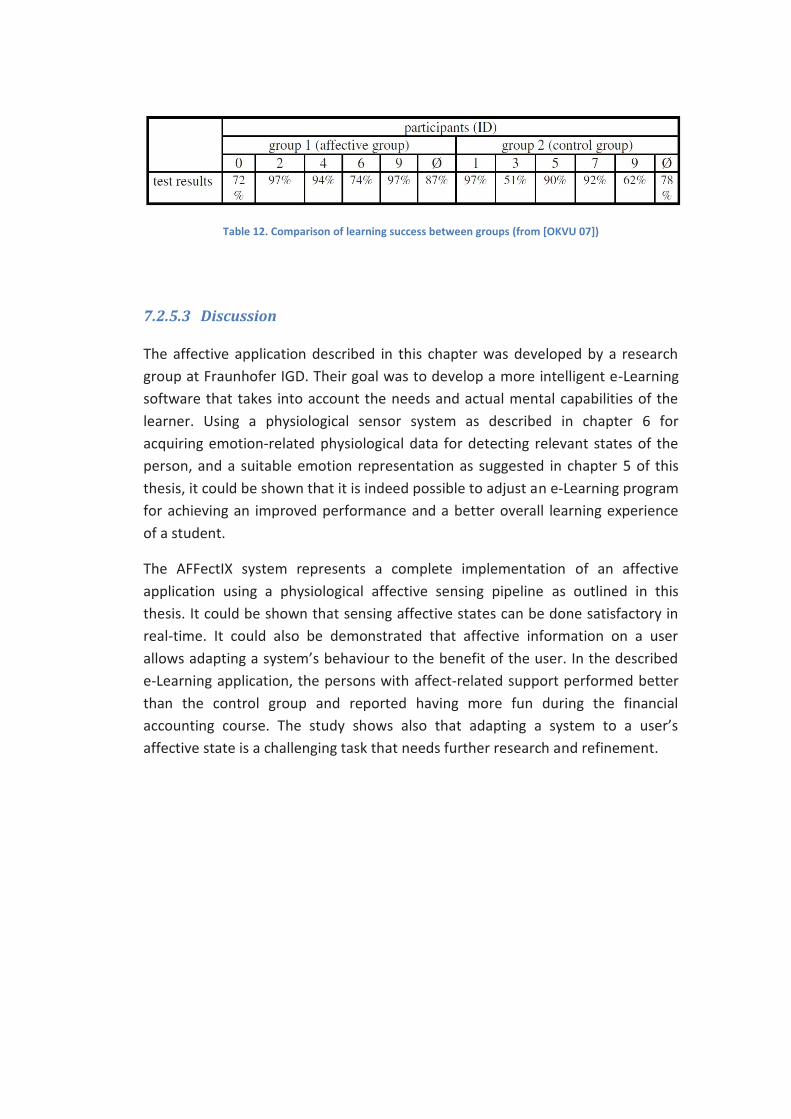
Table 12. Comparison of learning success between groups (from [OKVU 07])
7.2.5.3 Discussion
The affective application described in this chapter was developed by a research group at Fraunhofer IGD. Their goal was to develop a more intelligent e-Learning software that takes into account the needs and actual mental capabilities of the learner. Using a physiological sensor system as described in chapter 6 for acquiring emotion-related physiological data for detecting relevant states of the person, and a suitable emotion representation as suggested in chapter 5 of this thesis, it could be shown that it is indeed possible to adjust an e-Learning program for achieving an improved performance and a better overall learning experience of a student.
The AFFectIX system represents a complete implementation of an affective application using a physiological affective sensing pipeline as outlined in this thesis. It could be shown that sensing affective states can be done satisfactory in real-time. It could also be demonstrated that affective information on a user allows adapting a system’s behaviour to the benefit of the user. In the described e-Learning application, the persons with affect-related support performed better than the control group and reported having more fun during the financial accounting course. The study shows also that adapting a system to a user’s affective state is a challenging task that needs further research and refinement.

114
8 Summary
This work deals with two aspects of physiological sensing as they are relevant for affective computing: the issue of representing affective states in digital systems and consequently of assigning physiological measurement data to affective states; and the problem of acquiring reliable data of affect-related physiological processes in real- world settings.
The work starts with an overview of the relevant theoretical background in the field of emotion representation related to physiological processes (chapter 2). The two approaches used most often in the literature (emotion categories, dimensions) are discussed and analysed as to their suitability for use in affective computing scenarios. It worked out that both approaches, the category-based as well as the dimensional, have well been used in affective computing scenarios. Interestingly it has been found that neither of the two approaches seems to be able to provide for uniquely correlating emotional ratings to physiological readings which is necessary for physiology-based affective computing applications.
With categorical descriptions, the main problem is identified being the language-based definitions of the emotional categories. This makes the description of an affective state subject to subjective interpretations, which depend not only on the language itself but also on the cultural and social background of the people describing the affective state. The many differences between studies in correlating physiological patterns to affective states can be attributed to such interpretative, language-specific aspects. Further problems with categorical descriptions are the many different categories that have been suggested by different researchers, without providing clear characteristics to distinguish the different categories from each other. As a consequence, in this work it is suggested to not use categories to describe affective states and to abandon at all labelling emotions with words (section 5.2).
In chapter 2 it is also found that obviously studies using the dimensional approach had difficulties in clearly assigning physiological states to distinct valence/arousal measures. This could be attributed to two related issues. First, the dimensional approach giving more freedom to the researcher in deciding how to elicit a certain state, and to the subjects of a study deciding to which degree the experienced situation was positive or negative, and how arousing it was, respectively. Second it has been worked out that the usual method of examining valence and arousal and their relation to physiological changes is problematic. By considering valence and

arousal as separate, seemingly independent components of an emotion, the basic principle of the dimensional approach is neglected, namely that valence and arousal only together describe the unique emotional state (possibly expanded by further dimensions). Therefore, assigning physiological readings to either valence or arousal respectively ignores their inherently interlaced nature. This leads to the observed physiological changes being attributed to just one of the dimensions, while in fact they relate to both components, as only the combination of both wholly describe the affective state and changes thereof. In this thesis it is therefore concluded to suggest for further research that valence and arousal should not be treated separately but rather their combined coordinates should be taken for representations of unique affective states.
Based on the theoretical considerations of chapter 2, a new approach to structure and represent affective states and to assign physiological readings to those states is conceptualized in chapter 5. The challenges identified in chapter 2 are addressed and a possible implementation of that concept is suggested. It avoids some of the drawbacks of standard models as identified in chapter 2 and allows processing affective data in a fairly straightforward manner. It uses a dimensional model for representing affective states, avoids using language-based constructs to label the emotional state, and considers the valence and arousal values as unique pairs describing the emotional state of a person.
The developed approach has been evaluated in an experiment by external partners and proved to be applicable and very suitable. Other researchers have already adopted the approach, again with positive results [VLBOZ 09].
The second part of this work addresses several challenges concerning measuring physiological data in real-world scenarios. As identified in chapter 3, these refer mainly to aspects of acceptability, usability, and reliability, pointing out that particularly sensor systems that observe a persons' physiology rely on being accepted by that person. Usability issues apply mainly to sensors that need the user's cooperation as is the case with wearable devices. As another important aspect, robustness has been identified, giving tribute to the fact that in real-world settings sensing conditions vary a lot and the system has to cope with that. Reliability is closely related to this. Given that continuously measuring physiological processes seems to be impossible without harassing the person and harassing the user being not an option, the sensor system has to deal with intermittent or blurry data while still being expected to deliver reliable data.

116
Requirements on physiological sensor systems are worked out, applying particularly to physiological sensor systems that are to be used in real-world settings. They are drawn not only from the analysis performed in chapter 3, but also from analysing existing sensor systems, their strengths and weaknesses as reported in the literature, and own experiences and evaluations.
Based on the developed requirements, a physiological sensor system is conceptualized in chapter 6 that meets the identified challenges of robustness, reliability, and usability. It does so by choosing an architecture that allows to construct the components light-weight and small, so that the intrusion on the user is reduced to a minimum. Further, the concept includes a robust error handling and data validation scheme that allows for continuously providing sensible sensor data, even in case of occasional disruptions of the sensing process. The concept includes permanent self-validation of the system, verifying the quality of the data and providing reliability information on each measurement value along with the data. This simple yet efficient means to assess the quality of the data improves significantly the usability of systems that follow this concept and eases its integration into affective systems.
To verify the applicability of the concept two iterative implementations have been developed. Each version was evaluated in studies performed by external partners. The evaluation results have shown that the concept is very suitable and applicable to different scenarios. Suggestions for improvements were made mainly on hardware design aspects, some of which have been realized and evaluated in the following implementations. Functional aspects of the system have been evaluated positively, confirming the concept behind the developed systems.
Chapter 7 finally reports on an implementation of an affective application that makes use of the developed solutions for sensing emotion-related physiological parameters as described in chapter 6, and applies a method for associating and representing affective states as developed in chapter 5. The successful implementation of an affective e-Learning application proves the general applicability of the solutions developed in this thesis. Furthermore it shows that with the solutions provided in this work, the complete pipeline for physiology-based affective applications can be implemented, from sensing via feature extraction, classification and emotion representation to finally using the emotion information to adjust an affective application.
Concluding, it can be said that the work described here offers solutions to a number of issues that have so far hindered the affective computing community in reaching out to the real life. With the approaches suggested in this thesis it should

be possible for HCI researchers and system developers alike to describe a person's affective state and to unambiguously assign emotion-related sensor data to those states. With sensing devices implementing the developed sensor concept for acquiring physiological data it should be possible to gather emotion-related data outside the lab, opening new possibilities to study human emotions in more realistic settings.
References
[AnSu 05] Anttonen, J. & Surakka, V. (2005). Emotions and Heart Rate while Sitting on a Chair. In CHI ’05 conference proceedings, pp. 491-499. New York: ACM Press.
[Ax 53] Ax, A. (1953). The physiological differentiation between fear and anger in humans. In Psychosomatic Medicine 55 (5), pp. 433-442. The American Psychosomatic Society.
[BPR 95] Baayen, R. H., Piepenbrock, R. & Rijn, H. van (1995). The CELEX lexical database (Corpus Nijmegen Update) [CD-ROM]. Philadelphia: Linguistic Data Consortium, University of Pennsylvania.
[BPKV 04] Bamidis, P.D., Papadelis, C., Kourtidou-Papadeli, C., Vivas, A. (2004). Affective computing in the era of contemporary neurophysiology and health informatics. Interacting with Computers 2004; 715–721.
[BaSch 96] Banse, R. & Scherer, K. R. (1996). Acoustic Profiles in Vocal Emotion Expression. In Journal of Personality and Social Psychology 70 (3), pp. 614-636. American Psychological Association, Inc.
[BZA 07] Barreto, A., Zhai, J., Adjouadi, M. (2007). Non-intrusive physiological Monitoring for Automated Stress Detection in Human-Computer Interaction. In: Lew, M., Sebe, N., Huang, T.S., Bakker, E.M. (eds.) HCI 2007. LNCS, vol. 4796, pp. 29–38. Springer, Heidelberg (2007).
[Ben 07] Ben-Gal I. (2007). Bayesian Networks. In: Ruggeri F., Faltin F. & Kenett R., Encyclopedia of Statistics in Quality & Reliability, Wiley & Sons (2007).
[Bish 06] Bishop, C. M. (2006). Pattern Recognition and Machine Learning. Springer Verlag, London. ISBN: 978-0-387-31073-2.
[BGH 93] Bradley, M. M., Greenwald, M. K. & Hamm, A. O. (1993). Affective Picture Processing. In Birbaumer, N. & Öhman, A. (Eds.): The Structure of Emotion, pp. 48-65. Toronto: Hogrefe & Huber Publishers.
[BrLa 94] Bradley, M., & Lang, P. (1994). Measuring emotion: The Self-Assessment Manikin and the semantic differential. Journal of Behavior Therapy and Experimental Psychiatry 25, pp. 49–59.
[BFEB 05] Branco P., Firth P., Encarnacao L.M., Bonato P. (2005). Faces of Emotion in Human-Computer Interaction. Proceedings of the CHI 2005 conference, Extended Abstracts, ACM Press. 1236 – 1239.

References
[BSI 04] British Standards Institution (2004). BS 7986: Industrial process measurement and control – Data quality metrics. Available from BSI Customer Services email: [email protected].
[BJWH 09] Broek van den, Egon L., Janssen, J. H. Westerink, J. H.D.M. and Healey, J. A. (2009). Prerequisites for Affective Signal Processing (ASP). In: International Conference on Bio-Inspired Systems and Signal Processing, Biosignals 2009, 14-17 Jan 2009, Porto, Portugal.
[BLJW 10] Broek van den E. L., Lisý V., Janssen J.H., Westerink J.H.D.M.,Schut M.H., and Tuinenbreijer K. (2010). Affective Man-Machine Interface: Unveiling Human Emotions through Biosignals. In: A. Fred, J. Filipe, and H. Gamboa (Eds.): BIOSTEC 2009, CCIS 52, pp. 21–47, 2010. (c) Springer-Verlag Berlin Heidelberg 2010.
[CTB 00] Cacioppo, J.T., Tassinary, L.G., Berntson, G.G. (Eds.) (2000). Handbook of Psychophysiology, 2nd Edition. Cambridge University Press, ISBN 0-521-62634-X.
[CaRu 96] Carroll, J. M. & Russell, J. A. (1996). Do Facial Expressions Signal Specific Emotions? Judging Emotion From the Face in Context. In Journal of Personality and Social Psychology 70 (2), pp. 205-218.
[CKC 08] Castellano G., Kessous L. and Caridakis G. (2008). Emotion recognition through multiple modalities: face, body gesture, speech. In: Peter C., Beale R. (eds.): Affect and Emotion in Human-Computer Interaction. LNCS, vol. 4868. Springer, Heidelberg (2008).
[ChVe 04] Chen D., Vertegall R. (2004). Using mental load for managing interruptions in physiologically attentive user interfaces. CHI '04 extended abstracts on Human factors in computing systems, pp. 1513 – 1516, ISBN:1-58113-703-6, ACM New York, NY, USA.
[Chri 02] Christie, I.C. (2002). Multivariate Discrimination of Emotion-Specific Autonomic Nervous System Activity. MSc Thesis, Virginia Polytechnic Institute and State University.
[cock 04a] Cockton, G. (2004). From quality in use to value in the world In: CHI 2004 Extended Abstracts. ACM Press, New York pp. 1287–1290; ISBN: 1-5811 3-703-6.
[Cock 04b] Cockton, G. (2004). Doing to Be: Multiple Routes to Affective Interaction. Interacting with Computers 16.
[CETB 98] Cootes, T. F., Edwards, G., Taylor, C. J., Burkhardt, H., and Neuman, B. (1998). Active appearance models. In Proceedings of the European Conference Computer Vision, volume 2, pp. 484-489, 1998.

[CDATR 99] Cowie, R., Douglas-Cowie, E., Appolloni, B., Taylor, J., Romano, A., & Fellenz, W. (1999). What a neural net needs to know about emotion words. In N. Mastorakis (Ed.), Computational Intelligence and Applications (pp. 109-114). World Scientific & Engineering Society Press.
[Cox 92] Cox, E. (1992). Fuzzy Fundamentals. IEEE Spectrum 29 (10), 58-61.
[David 03] Davidson R.J. (2003). Seven sins in the study of emotion: Correctives from affective neuroscience. Brain and Cognition 52 (2003), 129-132.
[DRSBS 95] Davis W. J., Rahman M. A., Smith L. J., Burns A., Senecal L., McArthur D., Halpern J. A., Perlmutter A., Sickels W., Wagner W. (1995). Properties of human affect induced by static color slides (IAPS): dimensional, categorical and electromyographic analysis. In Biological Psychology 41, pp. 229-253. Elsevier Science.
[DSB 98] Detenber, B. H., Simons, R. F. & Bennett, G. G. (1998). Roll 'em!: The Effects of Picture Motion on Emotional Responses. In Journal of Broadcasting and Electronic Media 21, pp. 112-126.
[DCP+ 07] Diamond D.M., Campbell A.M., Park C.R., Halonen J., Zoladz P.R. (2007). The Temporal Dynamics Model of Emotional Memory Processing: A Synthesis on the Neurobiological Basis of Stress-Induced Amnesia, Flashbulb and Traumatic Memories, and the Yerkes-Dodson Law. Neural Plasticity: 33. Hindawi Publishing Corp.
[Ekman 72] Ekman, P. (1972). Universals and Cultural Differences in Facial Expressions of Emotion. In J. Cole (Ed.), Nebraska Symposium on Motivation (Vol. 19, pp.207-282). University of Nebraska Press.
[Ekman 92] Ekman, P. (1992). An argument for basic emotions. In Cognition and Emotion 6 (3/4), Lawrence Erlbaum limited.
[EkFr 76] Ekman, P. and Friesen, W. (1976). Pictures of facial affect. Palo Alto, California: Consulting Psychologists Press.
[EkFr 78] Ekman, P. and Friesen, W. (1978). Facial Action Coding System: A Technique for the Mea-surement of Facial Movement. Consulting Psychologists Press, Palo Alto.
[ELF 83] Ekman, P., Levenson, R. W. and Friesen, W. (1983). Autonomic Nervous System Activity Distinguishes among Emotions. In Science 221. The American Association for Advancement of Science.
[EkDa 94] Ekman P., Davidson R. J. (Eds.) (1994). The Nature of Emotion: Fundamental Questions. Oxford University Press, New York.
References
[EYI 00] El-Nasr M.S., Yen J., Ioerger T.R. (2000). FLAME - Fuzzy Logic Adaptive Model of Emotions. Autonomous Agents and Multi-Agent Systems Volume 3 Issue 3, September 2000, pp. 219-257. Kluwer Academic Publishers Hingham, MA, USA.
[Fairc 09] Fairclough, S.H. (2009). Fundamentals of Physiological Computing. Interacting with Computers 21, pp133-145.
[FeRu 98] Feldman Barrett, L. & Russel, J. A. (1998). Independence and Bipolarity in the Structure of Current Affect. In Journal of Personality and Social Psychology 74 (4), pp. 967-984. Educational Publishing Foundation.
[FSRE 07] Fontaine, J. R., Scherer, K. R., Roesch, E. B., & Ellsworth, P. C.(2007). The World of Emotions Is Not Two-Dimensional. Psychological Science, 18(12), 1050-1057.
[FrLe 98] Fredrickson, B. L. & Levenson, R. W. (1998). Positive Emotions Speed Recovery from the Cardiovascular Sequelae of Negative Emotions. In Cognition and Emotion 12 (2), pp. 191-220. Psychology Press Ltd.
[FMBT 00] Fredrickson, B. L., Mancuso, R. A., Branigan, C. & Tugade, M. M. (2000). The Undoing Effect of Positive Emotions. In Motivation and Emotion 24 (4), pp. 237-257. Plenum Publishing Corporation.
[Frij 86] Frijda, N. (1986). The Emotions. Studies in Emotion and Social Interaction. New York: Cambridge University Press.
[GrMa 04] Gratch, J., & Marsella, S. (2004). A domain-independent framework for modeling emotion. Cognitive Systems Research, 5(4), 269-306.
[HGSW 04] Haag A., Goronzy S., Schaich P., Williams J. (2004). Emotion Recognition Using Bio-sensors: First Steps towards an Automatic System. In André et al (Eds.): Affective Dialogue Systems, Proceedings of the Kloster Irsee Tutorial and Research Workshop on Affective Dialogue Systems, Lecture Notes in Computer Science 3068, Springer-Verlag Berlin, Heidelberg, New York pp. 36-48.
[HTF 09] Hastie T., Tibshirani R., Friedman J. (2009). The Elements of Statistical Learning: Data Mining, Inference, and Prediction. Springer Series in Statistics, 2nd ed. 2009. Corr. 3rd printing 5th Printing., 2009. ISBN: 978-0-387-84857-0
[Henry 01a] Henry M.P. (2001). Self-Validating Sensors – Towards Standards and Products. Automatione e Strumentazione, Feb2001.

[Henry 01b] Henry M. (2001). Recent developments in self-validating (SEVA) sensors. Sensor Review, Vol 21 No 1 2001, pp 16-22, MCB University Press. ISSN 0260-2288.
[HeCl 93] Henry, M. P. , Clarke, D. W. (1993). The self-validating sensor: rationale, definitions and examples ; Control Engineering Practice, 1, pp. 585.
[HPMMV 05] Herbon A., Peter C., Markert L., van der Meer E., Voskamp J. (2005). Emotion Studies in HCI – a New Approach. Proceedings of the 2005 HCI International Conference, Las Vegas, 2005.
[HZCS 08] Hu S., Zheng J., Chouliaras V., and Summers R. (2008). Feasibility of imaging photoplethysmography, Proceedings of IEEE Conference on BioMedical Engineering and Informatics (IEEE, 2008), pp. 72–75.
[Isen 00] Isen A. M. (2000). Positive affect and decision making. In: Lewis M. and Haviland J. (Eds): Handbook of Emotions. Guilford, New York (2000).
[JBW 09] Janssen, J. H., van den Broek, E. L., and Westerink, J. H. D. M. (2009). Personalized affective music player. In Proceedings of the IEEE 3rd International Conference on Affective Computing and Intelligent Interaction, ACII, volume 1, pages 472–477, Amsterdam, The Netherlands. IEEE Press.
[JMOG 05] Jovanov E., Milenkovic A., Otto C., deGroen P.C. (2005). A wireless body area network of intelligent motion sensor for computer assisted physical rehabilitation. Journal of NeuroEngineering and Rehabilitation 2005, 2:6. BioMed Central Ltd. (doi:10.1186/1743-0003-2-6).
[KBK 04] Kim K. H., Bang S. W., and Kim S. R. (2004). Emotion recognition system using shortterm monitoring of physiological signals, Medical and Biological Engineering and Computing 42 (2004), 419–427.
[KARVW 05] Kim J, André E, Rehm M, Vogt T and Wagner J (2005). Integrating Information from Speech and Physiological Signals to Achieve Emotional Sensitivity. In Interspeech 2005- Eurospeech, Lisbon, Portugal, 4-8 September: 2005, pp. 809-812.
[KiAn 06] Kim J., André E. (2006). Emotion Recognition Using Physiological and Speech Signal in Short-Term Observation. In: Elisabeth André, Laila Dybkjær, Wolfgang Minker, Heiko Neumann, Michael Weber (Eds.): Perception and Interactive Technologies, LNCS 4021, Springer 2006, ISBN 3-540-34743-7, pp 53-64.
[KiAn 08] Kim, J., André, E. (2008). Emotion recognition based on physiological changes in music listening. IEEE Transactions on Pattern Analysis and Machine Intelligence, 30(12): 2067-2083.

References
[KFS 95] King, R. D., Feng, C., & Sutherland, A. (1995). Statlog: Comparison of Classification Algorithms on Large Real-World Problems. Applied Artificial Intelligence, 9(3), 289-333. (c) Taylor & Francis Groups, London.
[KKA 11] Knapp R.B., Kim J., André E. (2011). Physiological Signals and Their Use in Augmenting Emotion Recognition for Human-Machine Interaction. In: Petta, Paolo (Hrsg.) ; Pelachaud, Catherine (Hrsg.) ; Cowie, Roddy (Hrsg.): Emotion-Oriented Systems: The Humaine Handbook. Springer, 2011 (in press).
[Lang 80] Lang, P. J. (1980). Behavioral treatment and bio-behavioral assessment: computer applications. In Sidowski, J.B., Johnson, J.H. & Williams, T.A. (Eds.): Technology in Mental Health Care Delivery Systems, pp. 119–137. Ablex, Norwood, NJ.
[LMCF 01] Lavoie, K. L, Miller, S. B., Conway, M. & Fleet, R. P. (2001). Anger, negative emotions and cardiovascular reactivity during interpersonal conflict in women. In Journal of Psychosomatic Research 51, pp. 503-512. Elsevier Science Inc.
[LEF 90] Levenson R.W., Ekman P., Friesen W.V. (1990). Voluntary facial action generates emotion-specific autonomic nervous system activity. Psychophysiology. 1990 Jul;27(4):363-84.
[LOKJ 08] Lichtenstein A., Oehme A., Kupschick S., Jürgensohn T. (2008). Comparing Two Emotion Models for Deriving Affective States from Physiological Data. In: Peter C., Beale R. (eds.): Affect and Emotion in Human-Computer Interaction. LNCS, vol. 4868. Springer, Heidelberg (2008). ISBN: 978-3-540-85098-4.
[MPG+ 04] Mader, S., Peter, C., Göcke, R., Schultz, R., Voskamp, J., Urban, B. (2004). A Freely Configurable, Multi-modal Sensor System for Affective Computing. In: André et al. (Eds.): Affective Dialogue Systems: Tutorial and Research Workshop. Springer-Verlag Berlin, Heidelberg, New York, 313-318.
[MGBA 09] Magjarevic M., Gao Y., Barreto A., and Adjouadi M. (2009). Comparative Analysis of Noninvasively Monitored Biosignals for Affective Assessment of a Computer User, 25th Southern Biomedical Engineering Conference 2009, 15 – 17 May 2009, Miami, Florida, USA (Anthony J. McGoron, Chen-Zhong Li, and Wei-Chiang Lin, eds.), IFMBE Proceedings, vol. 24, Springer Berlin Heidelberg, 2009, 10.1007/978-3-642-01697-4_90, pp. 255–260.
[MIC 06] Mandryk, R.L., Inkpen, K.M., Calvert, T.W. (2006). Using Psychophysiological Techniques to Measure User Experience with Entertainment Technologies. Behaviour and Information Technology (Special Issue on User Experience) 25, 141–158 (2006).

[MaAt 07] Mandryk R.L., Atkins M.S. (2007). A fuzzy physiological approach for continuously modeling emotion during interaction with play technologies. Int. J. Human-Computer Studies 65, pp 329-347. Elsevier Ltd. 2007.
[McGö 06] McIntyre, G., and Goecke, R. (2006). Researching Emotions in Speech, In Proceedings of the Eleventh Australasian International Conference on Speech Science and Technology SST2006, Auckland, New Zealand, pp. 264-269, Dec. 2006.
[McGö 08] McIntyre G. and Göcke R. (2008). The Composite Sensing of Affect. In: Peter C., Beale R. (eds.): Affect and Emotion in Human-Computer Interaction. LNCS, vol. 4868. Springer, Heidelberg (2008).
[Mehr 96] Mehrabian, A. (1996). Pleasure-arousal-dominance: A general framework for describing and measuring individual differences in Temperament. Current Psychology, 14(4), 261-292.
[MoAg 08] Money A., Agius H (2008). Feasibility of Personalized Affective Video Summaries. In: Peter C., Beale R. (eds.): Affect and Emotion in Human-Computer Interaction. LNCS, vol. 4868. Springer, Heidelberg (2008). ISBN: 978-3-540-85098-4.
[MoHe 88] Morgan, R. L. & Heise, D. (1988). Structure of Emotion. In Social Psychology Quarterly 51 (1), pp. 19-31. Washington: American Sociological Association.
[Mull 04] Muller, M. (2004). Multiple paradigms in affective computing. Interacting with Computers 2004; 759–768.
[NALF04] Nasoz F., Alvarez K., Lisetti C.L., and Finkelstein N. (2004). Emotion recognition from physiological signals using wireless sensors for presence technologies. International Journal of Cognition, Technology, and Work - Special Issue on Presence, Vol. 6(1), 2004. Springer Verlag.
[NeuWa 01] Neumann, S. A. & Waldstein, S. R. (2001). Similar patterns of cardiovascular response during emotional activation as a function of affective valence and arousal and gender. In Journal of Psychosomatic Research 50, pp. 245-253.
[OHKZ 07] Oehme, A., Herbon, A., Kupschick, S. & Zentsch, E. (2007). Physiological Correlates of Emotions. Proceedings of the AISB Annual Convention, April 2-4, 2007, Newcastle upon Tyne, UK.
[OKVU 07] Oertel K., Kaiser R., Voskamp J., Urban B. (2007). AFFectIX - An Affective Component as Part of an E-Learning-System. In Proceedings of HCI (16)'2007. pp.385-393.
[OCC 88] Ortony, A., Clore, G. L., Collins, A. (1988). The Cognitive Structure of Emotions. Cambridge, England: Cambridge University Press.

References
[PaSt 93] Palomba, D. & Stegagno, L. (1993). Physiology, Perceived Emotion and Memory: Responding to Film Sequences. In Birbaumer, N. & Öhman, A. (Eds.): The Structure of Emotion, pp. 158-168. Toronto: Hogrefe & Huber Publishers.
[PSAS 99] Palomba, D., Sarlo, M., Agrilli, A., Mini, A. & Stegagno, L. (1999). Cardiac response associated with affective processing of unpleasant film stimuli. International Journal of Psychophysiology 36, pp. 45-57.
[PEB 05] Peter, C., Ebert E., Beikirch, H. (2005). A Wearable Multi-Sensor System for Mobile Acquisition of Emotion-Related Physiological Data. Proceedings of the 1st International Conference on Affective Computing and Intelligent Interaction, Beijing 2005. Springer Verlag Berlin, Heidelberg, New York.
[PeHe 06] Peter, C. & Herbon, A. (2006). Emotion Representation and Physiology Assignments in Digital Systems. In Interacting With Computers. 18/2 pp. 139-170, Elsevier Science, Inc.
[PSVUN 07] Peter C., Schultz R., Voskamp J., Urban B., Nowack N., Janik H., Kraft K., Göcke R. (2007). EREC-II in Use – Studies on Usability and Suitability of a Sensor System for Affect Detection and Human Performance Monitoring. J. Jacko (Ed.): Human-Computer Interaction, Part III, HCII 2007, LNCS 4552, pp. 465–474, 2007. © Springer-Verlag Berlin Heidelberg 2007.
[PPC 11] Petta P., Pelachaud C., Cowie R. (eds.) (2011). Emotion-Oriented Systems: The Humaine Handbook. Springer, 2011.
[Picar 97] Picard, R.W. (1997). Affective Computing. M.I.T. Press, Cambridge, MA.
[PPB+ 04] R. W. Picard, S. Papert, W. Bender, B. Blumberg, C. Breazeal, D. Cavallo, T. Machover, M. Resnick, D. Roy, C. Strohecker (2004). Affective learning—a manifesto. BT Technology Journal, Vol. 22, No. 4. (2004), pp. 253-269.
[PiSch 01] Picard RW and Scheirer J (2001). The Galvactivator: A Glove that Senses and Communicates Skin Conductivity. Proceedings from the 9th International Conference on Human-Computer Interaction, August 2001, New Orleans, LA, pp. 1538-1542.
[PVH 01] Picard R.W., Vyzas E., Healey J. (2001). Toward Machine Emotional Intelligence - Analysis of Affective Physiological State. IEEE Transactions on Pattern Analysis and Machine Intelligence, Vol 23 No. 10, pp. 1175-1191, October 2001.
[Plut 80] Plutchik, R., (1980). A general psychoevolutionary theory of emotion. In R. Plutchik & H. Kellerman (Eds.), Emotion: Theory, research, and experience: Vol. 1. Theories of emotion, pp. 3-33. New York: Academic.

[PMP 10] Poh M-Z, McDuff D J, Picard R W. (2010). Non-contact, automated cardiac pulse measurements using video imaging and blind source separation.Optics Express Vol.18 No 10 (c) 2010 OSA. Pp. 10763-10774.
[PWZM 99] Prkachin, K. M., Williams-Avery, R. M., Zwaal, C. & Mills, D. E. (1999). Cardiovascular changes during induced emotion: An application of Lang's theory of emotional imagery. In Journal of Psychosomatic Research 47 (3), pp. 255-267. Elsevier Science Inc.
[QiPi 02] Qi Y., Picard R. W. (2002). Context-sensitive Bayesian Classifiers and Application to Mouse Pressure Pattern Classification. In: Proceedings of the 16th International Conference on Pattern Recognition (ICPR'02), vol. 3, pp.30448. ISBN: 0-7695-1695-X.
[RLSV 06] Rani P., Liu C., Sarkar N., and Vanman E. (2006). An empirical study of machine learning techniques for affect recognition in human–robot interaction, Pattern Analysis & Applications Vol 9 No 1, Springer Verlag 2006.
[RKGF09] G. Rigas, C. Katsis, G. Ganiatsas, and D. Fotiadis (2009). A User Independent, Biosignal Based, Emotion Recognition Method, User Modeling 2007 (Cristina Conati, Kathleen McCoy, and Georgios Paliouras, eds.), Lecture Notes in Computer Science, vol. 4511, Springer Berlin / Heidelberg, 2009, 10.1007/978-3-540- 73078-1_36, pp. 314–318.
[RitTh 02] Ritz, T. & Thöns, M. (2002). Airway response of healthy individuals to affective picture series. In International Journal of Psychophysiology 46, pp. 67-75, Elsevier Science B.V.
[Roger 04] Rogers, Y. (2004). New Theoretical approaches for Human-Computer Interaction. Annual Review of Information, Science and Technology, 38, 87-143.
[RAJ 96] Roseman, I.J., Antoniou, A.A., Jose, P.E. (1996). Appraisal determinants of emotions: Constructing a more accurate and comprehensive theory. Cognition and Emotion, 10(3), pp 241-277.
[Russ 80] Russell, J. A. (1980). A Circumplex Model of Affect. In Journal of Personality and Social Psychology 39, pp. 1161-1178. Elsevier Science Inc.
[Russ 83] Russell, J. A. (1983). Pancultural Aspects of the Human Conceptual Organization of Emotions. In Journal of Personality and Social Psychology 45 (6), pp. 1281-1288. American Psychological Association, Inc.
[Russ 91] Russell J. A. (1991). Culture and the categorization of emotions. Psychological Bulletin, 110, 426-450.

References
[Russ 94] Russell, J. A. (1994). Is there universal recognition of emotion from facial expression? A review of the cross-cultural studies. In Psychological Bulletin 115, pp. 102-141. Elsevier Science Inc.
[RLN 89] Russell, J. A., Lewicka, M. & Niit, T. (1989). A Cross-Cultural Study of a Circumplex Model of Affect. In Journal of Personality and Social Psychology 57 (5), pp. 848-856. American Psychological Association, Inc.
[RuFe 99] Russell, J. A. & Feldman Barrett, L. (1999). Core Affect, Prototypical Emotional Episodes, and Other Things Called Emotion: Dissecting the Elephant. In Journal of Personality and Social Psychology 76 (5), pp. 805-819. American Psychological Association.
[SaSi 05] Sabini J., Silver M. (2005). Ekman’s basic emotions: Why not love and jealousy? Cognition and Emotion 2005, 19 (5) Psychology Press, 693-712.
[SFKP 02] Scheirer, J., Fernandez, R., Klein, J., Picard, R.W. (2002). Frustrating the user on purpose: a step toward building an affective computer. Interacting with Computers 14 (2), 93–118.
[Scher 84] Scherer, K. R. (1984). On the nature and function of emotion: A component process approach. In K.R. Scherer & P. Ekman (Eds.), Approaches to emotion (pp. 293-318). Hillsdale, NJ: Lawrence Erlbaum.
[Scher 94] Scherer, K. R. (1994). Toward a concept of "modal emotions". In P. Ekman & R. J. Davidson (Eds.), The nature of emotion: Fundamental questions (pp. 25-31). New York/Oxford: Oxford University Press.
[Scher 99] Scherer, K. R. (1999). Appraisal theory. In T. Dalgleish & M. J. Power (Eds.), Handbook of Cognition & Emotion (p. 637-663). New York: John Wiley.
[Scher 00] Scherer, T. M. (2000). Stimme, Emotion und Psyche - Untersuchungen zur emotionalen Qualität der menschlichen Stimme, PhD Thesis. Marbug University.
[Schim 05] Schimmack U. (2005). Response latencies of pleasure and displeasure ratings: Further evidence for mixed feelings. Cognition and Emotion 2005, 19 (5), Psychology Press, 671-691.
[SBB+ 11] Schröder, M., Baggia, P., Burkhardt, F., Pelachaud, C., Peter, C., Zovato, E. (2011). Emotion markup language (EmotionML) 1.0. W3C last call working draft, World Wide Web Consortium (Apr 2011), http://www.w3.org/TR/emotionml/

[SDK+ 07] Schröder, M., Devillers, L., Karpouzis, K., Martin, J.-C., Pelachaud, C., Peter, C., Pirker, H., Schuller, B., Tao, J. & Wilson, I. (2007). What should a generic emotion markup language be able to represent? Proc. 2nd International Conference on Affective Computing and Intelligent Interaction (ACII'2007), Lisbon, Portugal.
[SPA+ 11] Schröder, M., Pelachaud, C., Ashimura, K., Baggia, P., Burkhardt, F., Oltramari, A., Peter, C., Zovato, E. (2011). Vocabularies for EmotionML. W3C working draft, World Wide Web Consortium (Apr 2011), http://www.w3.org/TR/2011/WD-emotion-voc-20110407/
[SPL 06] Schröder, M., Pirker, H., Lamolle, M. (2006). First suggestions for an emotion annotation and representation language. In: Proceedings of LREC’06 Workshop on Corpora for Research on Emotion and Affect. pp. 88–92. Genoa, Italy (2006).
[SPL+ 11] Schröder, M., Pirker, H., Lamolle, M., Burkhardt, F., Peter, C., Zovato, E. (2011). Representing emotions and related states in technological systems. In: Petta, P., Cowie, R., Pelachaud, C. (eds.) Emotion-Oriented Systems – The Humaine Handbook, pp. 367–386. Springer.
[SZP+ 07] Schröder, M., Zovato, E., Pirker, H., Peter, C. & Burkhardt, F. (2007). W3C Emotion Incubator Group Final Report. Published online: http://www.w3.org/2005/Incubator/emotion/XGR-emotion-20070710
[ScAn 03] Schwartz, M. S. and Andrasik, F. (2003). Biofeedback: A Practitioner's Guide (3rd edition). New York: Guilford Press, ISBN 1-57230-845-1.
[SWS 81] Schwartz, G. E., Weinberger, D.A. and Singer, J.A. (1981). Cardiovascular differentiation of happiness, sadness, anger and fear following imagery and exercise. Psychosomatic Medicine, 43, pp. 343 –364.
[SLP 92] Sinha, R., Lovallo, W.R., & Parsons, O.A. (1992). Cardiovascular differentiation of emotions. Psychosomatic Medicine, 54, 422 - 435.
[SPSS 10] SPSS homepage (2010). http://www.spss.com/. accessed 16 August 2010.
[SuPe 05] Sung M., Pentland A. (2005). Minimally-Invasive Physiological Sensing for Human-Aware Interfaces. Proceedings of the 2005 HCI International conference.
[TaTa 09] Tao, Jianhua; Tan, Tieniu (Eds.) (2009). Affective Information Processing, pp. 293-310. Springer London, ISBN: 978-1-84800-305-7.
[THP 04] Tombs M.S. , Henry M.P. , Peter C. (2004). From research to product using a common development platform. Control Engingeering Practice, vol. 12, pp. 503-510, April 2004.

References
[VFGK 00] Västfjäll, D., Friman, M., Gärling, T. & Kleiner, M. (2000). The measurement of core affects: A Swedish self-report measure derived from the affect circumplex. In Göteborg Psychological Reports 30. Göteborg: Göteborg University.
[VLBOZ 09] Verhoef T., Lisetti C., Barreto A., Ortega F., van der Zant T. and Cnossen F. (2009). Bio-sensing for emotional characterization without word labels. J.A. Jacko (Ed.): Human-Computer Interaction, Part III Ambient, Ubiquitous and Intelligent Interaction, LNCS 5612, pp. 693–702, 2009. © Springer-Verlag Berlin Heidelberg 2009.
[VSN 08] Verkruysse W, Svaasand L. O., and Nelson J. S. (2008). Remote plethysmographic imaging using ambient light, Opt. Express 16(26), 21434–21445 (2008).
[ViLi 09] Villon O. and Lisetti C. (2009). A User Model of Psycho-physiological Measure of Emotion. In: Cristina Conati, Kathleen McCoy, and Georgios Paliouras (eds.): User Modeling 2007. Lecture Notes in Computer Science, vol. 4511, Springer Berlin / Heidelberg, 2009, pp. 319–323.
[Schrö 10] Schröder, M. (ed). (2010). W3C Emotion Markup Language (EmotionML) 1.0: W3C Working Draft 29 July 2010. http://www.w3.org/TR/2010/WD-emotionml-20100729/
[WKA 05] Wagner J, Kim J and André E (2005), "From Physiological Signals to Emotions: Implementing and Comparing Selected Methods for Feature Extraction and Classification," in IEEE International Conference on Multimedia & Expo (ICME 2005), IEEE. 2005, pp. 940-943.
[WKSH 00] Waldstein, S. R., Kop W. J., Schmidt L.A., Haufler A.J., Krantz D.S., Fox N.A. (2000). Frontal Electrocortical and cardiovascular reactivity during happiness and anger. Biological Psychology 55, pp.3-23.
[WaMa 04] Ward, R., Marsden, P. (2004). Affective Computing: problems, reactions and intentions. Interacting with Computers 2004; 707–713.
[WiSa 04] Wilson, G., Sasse, A. (2004). From doing to being: getting closer to the user experience. Interacting with Computers 2004; 715–721.
[Wierz 92] Wierzbicka, A. (1992). Talking about Emotions: Semantics, Culture, and Cognition. In Cognition and Emotion 6 (3/4). Lawrence Erlbaum limited.
[Wimm 07] Matthias Wimmer (2007). Model-based Image Interpretation with Application to Facial Expression Recognition. Ph.D. Thesis, Technische Universitat München, Institute for Informatics, 2007.

[YaHa 07] Yannakakis G.N., Hallam J. (2007). Entertainment Modeling in Physical Play Through Physiology Beyond Heart-Rate. A. Paiva, R. Prada, and R.W. Picard (Eds.): ACII 2007, LNCS 4738, pp. 254–265, 2007. (c) Springer-Verlag Berlin, Heidelberg 2007.
[YeDo 08] Yerkes, R.M. & Dodson, J.D. (1908). The relation of strength of stimulus to rapidity of habit-formation. Journal of Comparative Neurology and Psychology, 18 (5), 1908, 459-482.
[YLPKL 05] Yoo S.K., Lee C.K., Park Y.J., Kim N.H, Lee B.C., and Jeong K.S. (2005). Neural Network Based Emotion Estimation Using Heart Rate Variability and Skin Resistance. In: LipoWang, Ke Chen, and Yew S. Ong (eds.): Advances in Natural Computation, Lecture Notes in Computer Science, vol. 3610, Springer Berlin / Heidelberg, 2005, pp. 818–824.
[ZAB+ 99] Zhou F.B., Archer N., Bowles J., Clark D., Henry M., Peter C. (1999). A General Hardware Platform for Sensor Validation, Intelligent and Self-validating Sensors, IEE Colloquium ref: 99/160, Oxford, UK.
[ZKZ+ 10] Zhang T., Kaber D.B., Zhu B., Swangnetr M., Mosaly P., Hodge L. (2010). Service robot feature design effects on user perceptions and emotional responses. Intelligent Service Robotics. Volume 3, Number 2, 73-88, DOI: 10.1007/s11370-010-0060-9.

References

Appendix A – Referenced main publications
The publications provided in this annex provide all detailed information related to the study mentioned in Chapter 5 of this thesis, which has been performed in co-operation with Humboldt University to Berlin. The study, as well as the papers is result of a close co-operation between the authors. Co-authors from the university took charge of planning and conducting the study, of analysing the data, while I took charge of the conceptual framework. Together we discussed the data and concluded the results. Obviously, there were strong interactions between us during all phases of the study (concept, planning, conducting, analysis and conclusion).
The first paper [HPMMV 05] was published and presented at the 2005 HCI International conference and describes the setup and procedure of the experiment. The second paper [PeHe 06] was published in the Journal Interacting with Computers in January 2006 and provides detailed information of the literature review and the derived conceptual framework.
A-2
Appendix A.1 Conference paper referenced as [HPMMV 05]
Herbon A., Peter C., Markert L., van der Meer E., Voskamp J. (2005). Emotion Studies in HCI – a New Approach.
Appeard in: Proceedings of the 2005 HCI International Conference, Las Vegas, 2005.
Emotion Studies in HCI – a New Approach
Antje Herbon1, Christian Peter2, Lydia Markert1, Elke van der Meer1, Jörg Voskamp2
1 Department of Psychology, Humboldt University to Berlin 2 Fraunhofer IGD, Rostock
Abstract
This paper presents results of an experiment studying user response to everyday computing tasks and related changes in peripheral physiology parameters. As underlying emotion model a new, HCI-oriented, dimensional approach to structure and represent emotions is introduced. Results show correlates between physiology changes and valence and arousal. The suitability of the new approach could be verified.
Introduction Emotions are of increasing interest to the HCI community, both academics and practitioners. Be it for designing emotion-aware applications, empathic agents, more realistic characters in Mixed Reality presence environments, or conventional software developed with the user in focus – emotions are finally recognized as a key “property” of users. The desire to move on from software that is functional and usable to software with a value for the user increased also awareness for the users’ attitude towards software products. Software which is functional but not
Appendix A.1
A-3
usable has little chance to become accepted. Software which is functional and usable, but has little or no value to the user will be difficult to sell as well. And among those applications which are also of value for the user, those products which appeal to the user’s emotions, which induce positive feelings and even excitement or passion, will be the user’s choice.
In this paper we present the results of an experiment studying physiological changes and emotional response of users to different everyday computing tasks. The experiment is based on a new model for structuring and representing emotions, which was developed by us particularly for use in an HCI context. A new approach to representing emotions is being considered necessary because traditional models for representing emotions were developed for psychological studies and have certain characteristics which might pose problems developing emotion-aware systems or which are simply not applicable for real-world software applications. Another problem answered by the new approach is the of naming emotions. As several scientists have found out (e.g. Russel (1991), Wierzbicka (1992)), labeling emotions using emotion words is problematic, especially in an international and pan-cultural context. Hence, overcoming these disadvantages of traditional emotion theories seems essential to us for designing future emotion-aware HCI systems, and the developed method for structuring and representing emotions provides a good means for it.
In the following section we will describe the new approach to structure and represent emotions in an HCI context. Section 3 describes the experiment based on it, sections 4 and 5 present the results and discuss problems encountered. In the subsequent section conclusions are drawn and an outlook given.
A new approach to structuring and representing emotions in an HCI system For categorizing or structuring emotion, several models exist which have been developed by psychologists for different purposes. Theories like OCC (Ortony et al, 1988) or those from Frijda (1986) or Roseman (1996) focus on how emotions arise and how they are perceived. Others, like the Basic Emotion theory (e.g. Plutchik, 1980; Ekman, 1992) or the dimensional approach (e.g. Russell, 1980), focus on how observed emotions could be categorized or structured. However, for finding correlates between physiology and emotion, underlying theories on how emotions are perceived and which organismic processes induce them are of no interest. Rather, it is desired to be able to easily “map” an emotional state onto an

A-4
appropriate data representation. The Basic Emotion theory as well as the dimensional approach are the two main theories followed in this field.
Basic Emotions theories claim the existence of historically evolved basic emotions which are universal and can therefore be found in all cultures. Several psychologists have suggested a different number of these, ranging from 2 to 18 categories. Most of those, however, agree on the following six basic emotions: anger, disgust, fear, happiness, sadness and surprise. The advantage of this approach for pursuing an experiment is that those basic emotions are well known to most users and they can well judge whether they feel those emotions or not. The disadvantage, however, is that obviously a user can have other feelings than those 6 (or 2, or 18), which than have to be mapped on the model’s categories, which leads to some distortion of the actual impression. Further, different researchers might use different basic emotion categories, which makes comparing studies difficult. Also, people have a different understanding of those, depending on their social and cultural background (see Russel, 1991).
Dimensional emotion theories use two or three orthogonal dimensions (e.g. arousal, valence, control) rather than discrete categories to describe the structure of emotions. According to a dimensional view, all emotions can be discriminated by their position in the resulting coordinate system. The advantage of this model is that the user has not to decide for one category or another, but can rather evaluate the felt emotion to the degree of being aroused and pleased, and the degree of control over the situation. This can lead to a very accurate assessment of the actual emotional state. The disadvantage, however, is that those dimensions are rather abstract expressions, which not all subjects might be comfortable with. Using the dimensional approach requires the experimenter to explain more detailed, what the user is expected to describe.
The model The theoretical basis of our study was a two-dimensional approach to structure emotions that characterizes emotions by their degree of valence and arousal. Underlying this approach are findings by Russell (1980), who conducted self-report studies and discovered a specific pattern emotion words were spread in the two-dimensional space. He called this configuration the Circumplex of Affect, since the pattern was circular (see figure 1). This structure has been replicated many times in English and many other languages (e.g. Russell, 1983; Russell et al., 1989; Västfjäll et al., 2000) and it has also been challenged, e.g. by Bradley et al.(1993). The existence of an exact pattern (circular or other) is not important for our purposes, but rather the fact of valence and arousal being emotion-underlying

Appendix A.1
A-5
dimensions and being therefore able to distinguish between different internal states. However, arousal and valence are not claimed to be the only dimensions, but they have shown to be the two main ones (Russell, 1983; for a study on possible additional dimensions/features see Cowie et al., 1999).
Figure 1: Russell's circumplex model of affect
There are two main differences of this new, HCI-oriented, approach to Russell’s Circumplex: the labeling of emotions and the applied concept of mixed emotions.
Labeling emotions For his self-report studies, Russell used words that described different emotions. As has been shown, verbally labeling the same emotion in different languages can be troublesome. Wierzbicka (1992) claimed that basic emotions are cultural artefacts of the English language. She explained that for some languages certain basic emotion words do not exist, such as the word anger in the Ilongot language of the Philippines or the Ifaluk language of Micronesia. This strongly contradicts discrete emotion theories, but it does also give strong implications in the direction of a dimensional model. Whenever studies resulted in a structure that showed emotion words placed in a coordinate system (e.g. Russell, 1983; Morgan & Heise,
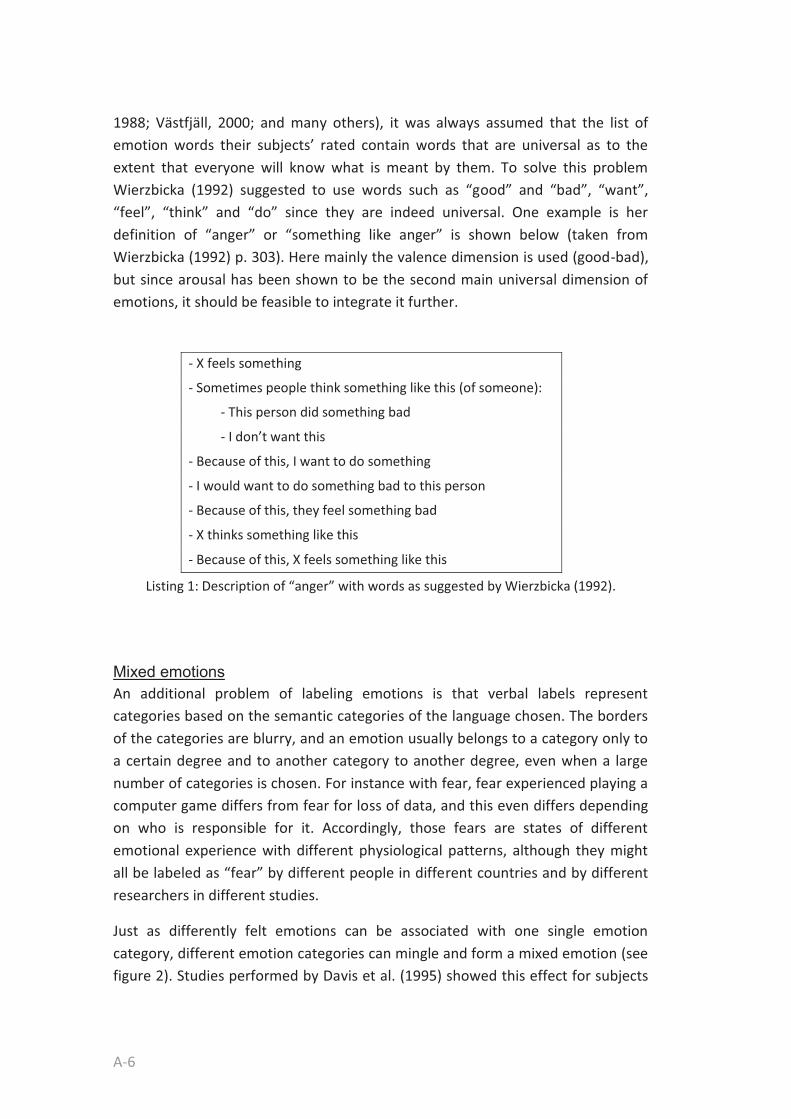
A-6
1988; Västfjäll, 2000; and many others), it was always assumed that the list of emotion words their subjects’ rated contain words that are universal as to the extent that everyone will know what is meant by them. To solve this problem Wierzbicka (1992) suggested to use words such as “good” and “bad”, “want”, “feel”, “think” and “do” since they are indeed universal. One example is her definition of “anger” or “something like anger” is shown below (taken from Wierzbicka (1992) p. 303). Here mainly the valence dimension is used (good-bad), but since arousal has been shown to be the second main universal dimension of emotions, it should be feasible to integrate it further.
- X feels something
- Sometimes people think something like this (of someone):
- This person did something bad
- I don’t want this
- Because of this, I want to do something
- I would want to do something bad to this person
- Because of this, they feel something bad
- X thinks something like this
- Because of this, X feels something like this
Listing 1: Description of “anger” with words as suggested by Wierzbicka (1992).
Mixed emotions An additional problem of labeling emotions is that verbal labels represent categories based on the semantic categories of the language chosen. The borders of the categories are blurry, and an emotion usually belongs to a category only to a certain degree and to another category to another degree, even when a large number of categories is chosen. For instance with fear, fear experienced playing a computer game differs from fear for loss of data, and this even differs depending on who is responsible for it. Accordingly, those fears are states of different emotional experience with different physiological patterns, although they might all be labeled as “fear” by different people in different countries and by different researchers in different studies.
Just as differently felt emotions can be associated with one single emotion category, different emotion categories can mingle and form a mixed emotion (see figure 2). Studies performed by Davis et al. (1995) showed this effect for subjects

Appendix A.1
A-7
that were presented with emotional photographs. Examples of emotion combinations observed were happy/surprise, sad/disgust, anger/sad and love/happy/sad (see also Feldman Barrett & Russell, 1998).
Figure 2: Mixed emotions (E1, E2, E3). Note that disgust, anger a.s.o. are just arbitrarily chosen categories.
For the reasons described above we decided not to label emotions with the use of verbal descriptions or categories. We assume the concept of emotional dimensions to be universal so that it should be possible to identify a person’s inner state just by using these dimensions. The emotion could simply be labeled by its position in the coordinate system (see figure 3). A further labeling does not seem necessary to us in order to design emotion-aware systems.

A-8
Figure 3: Emotions in a two-dimensional space
The experiment To proof the applicability of the new approach, we performed an experiment with subjects performing computing tasks while emotion-related physiology changes were recorded. Data were obtained for skin conductivity (electro-dermal activity, EDA), skin temperature, heart rate, and pupil dilation.
Subjects were 31 students (14 males, 17 females) from 19 to 27 years (mean 22.7) at Humboldt University to Berlin. Part of the students received credit for their participation, others were just personally interested in the topic. Four representative tasks were chosen to be performed on a computer in order to cover a wide spectrum of emotions occurring at everyday computing tasks.
The first task was to count pictures of babies which were presented on the screen. The task was divided into three parts with different difficulty level. In the first part only babies were presented. In the second part babies and neutral objects were presented. In the third part human babies, animal babies and baby-connected objects were presented. The goal of the first task was to induce an emotional state of high valence and low arousal.
In the second task, subjects had to search different lists for certain requested files. In sum, 3*3 lists had to be searched. Difficulty level was varied by raising the
Appendix A.1
A-9
difficulty of the words for each list-group as listed in the Celex Database (Baayen, Piepenbrock, & Gulikers, 1995). The goal of this task was to induce an emotional state of low valence and low arousal.
The third task was a task of repetitively coloring figures with a very small pencil tool. Figures of different shape were being presented which had to be colored in three minutes each. The task was divided into three parts, varying by the difficulty and size of the figure. The goal of this task was to induce an emotional state of low valence and high arousal.
The fourth task was to play a game of “Ultraflex”, in which the user had to destroy bricks in a game field using a spaceship and a ball. This game was to be played three times, with difficulty levels low, middle and high, respectively. One level was over when the subject had lost the game or when three minutes had past. The experimental goal of this task was to induce an emotional state of high valence and high arousal.
For self-assessment of experienced emotions SAM was used. SAM (Self-Assessment-Manikin), introduced by (Lang, 1980), consists of pictures of manikins for each of the dimensions valence, arousal and dominance. The manikins represent 5 states from happy to unhappy, excited to calm, and controlled to control, accordingly1. Subjects rate their current feeling either on a manikin or in the space between two manikins, which results in 9 gradations per dimension (see also Bradley & Lang, 1994).
Subjects were placed in front of the monitor and asked to sit comfortably. Sensors for EDA, skin temperature and heart rate were attached on the subject and a helmet with mounted pupil-camera was put on the subject’s head. The test-leader then recorded the subject’s sex, age, health and computer and internet experience. Afterwards instructions were presented at the monitor, which introduced the subject to SAM and explained how to use the rating scales. The subjects were instructed to rate their emotions after each level but according to the emotion they felt during the completion of the task. Before the experiment was started, time for questions was given and the subject was orally instructed to be honest when rating and told that there were no “wrong” emotions. One session lasted about 30 minutes, depending on how fast the subjects completed
1 In this study only the pictures for valence and arousal were used, see chapter 2
A-10
the tasks. Afterwards a short debriefing was conducted and time was given to report possible troubles the subjects had faced.
Results and analyses Analyses were conducted with SPSS (SPSS 2005).
Data reduction The permanent recording of physiological parameters led to a huge amount of physiological data compared to only one SAM-rating per Level. Since the goal was to correlate the SAM-ratings (dimensions) with physiology, physiological data had to be reduced to one value for each physiological parameter per level/SAM-rating. Unfortunately, Scenario 1 had to be excluded from analyses for all subjects because of technical problems, resulting in a maximum of 9*2 SAM-ratings and 9*4 physiological values per subject. Pupil diameter could not be measured for 4 subjects, EDA was missing for one subject and heart rate could not be recorded for two subjects. Physiological data was z-transformed in order to reduce inter-individual differences and allow comparisons between subjects.
The scenarios had a length of up to three minutes, which made it possible for subjects to experience different emotions during only one scenario-level. For example, some subjects reported different feelings for the paint-scenario, being calm in the beginning, bored in the middle and frustrated at the end of the task. These implications led us to compare standard deviations of all subjects for each scenario-level. A physiological parameter of a subject was excluded for each level respectively, if its standard deviation was extremely high in comparison to other subjects’ for the according level.
Correlations A multivariate Pearson Correlation of SAM1 (valence), SAM2 (arousal), EDA, heart rate, pupil diameter and skin temperature was conducted, i.e. all six parameters were correlated with each other using Pearson’s formula (Ref). It showed several significant coherences (see table 1).
Emotions are a rather weak construct, being difficult to measure and to define. Therefore we did not expect to find correlations of .8 or higher, which are considered satisfactory in harder constructs such as school grades, physical parameters and others, but instead we consider correlations of about .4

Appendix A.1
A-11
satisfactory as is usually done for example in the field of social psychology and personality with its rather weak constructs.
EDA correlated -.392 with the valence dimension and -.300 with arousal. Partial correlation of EDA and valence controlled for skin temperature resulted in an increase to -.439. All correlations were significant at the 0.01 level, i.e. an error is very unlikely (less than 1%). Heart rate correlated weakly (.194) with the valence dimension, but a correlation with arousal could only be shown when the influence of pupil diameter was controlled. Partial correlation then was -.181. Both correlations were significant at the 0.01 level. Pupil diameter correlation with valence was comparably strong (-.503) and correlation with arousal was on an average (-.293). Partial correlation of pupil diameter and emotion dimensions controlled for heart rate increased correlations to -.504 and -.328 for valence and arousal, respectively. All correlations were significant at the 0.01 level. Correlation of skin temperature and emotion dimensions did not show any significant results, but the correlation of skin temperature and EDA led us to partial correlate and control for EDA. The partial correlation again did not show any significant coherence of skin temperature and arousal. The correlation with valence was weak but significant at the 0.05 level and had a value of .166.

A-12
Table 1: Correlations
SAM1 Valence
SAM2
Arousal
EDA Heart rate
Skin temp.
Pupil diameter
SAM1
Valence
Pearson Correlation
Significance
Number of cases
1
.
278
.043
.472
278
-.392
.000
246
.194
.002
255
.064
.306
257
-.503
.000
218
SAM2
Arousal
Pearson Correlation
Significance
Number of cases
1 -.300
.000
246
-.078
.213
255
-.002
.978
257
-.293
.000
218
EDA Pearson Correlation
Significance
Number of cases
1 -.120
.037
233
.215
.001
230
-.304
.000
203
Heart rate
Pearson Correlation
Significance
Number of cases
1 .048
.462
230
-.304
.000
203
Skin temp.
Pearson Correlation
Significance
Number of cases
1 .042
.556
202
Pupil diameter
Pearson Correlation
Significance
Number of cases
1

Appendix A.1
A-13
Discussion Results do support the thesis that physiology does correlate with the emotion dimensions used by the suggested model. The data show coherences to valence and arousal especially for EDA, heart rate and pupil diameter. Skin temperature seems to be suitable to further refine predictions based on the other parameters.
Unfortunately, correlations are not strong enough to suggest a regression model. We did conduct a multiple linear regression for the valence dimension, which appeared to be better predicted by the measured physiological parameters than arousal. However, the resulting model could only explain about 28% of the total variance and is therefore too weak for prediction. We faced two different kinds of problems:
Inducing Emotions The goal of the experiment was to induce emotions in all four quadrants of the dimension model, but we did have trouble to fill out the third quadrant, that is to induce negative and low arousing emotions. (see figure 4). Unfortunately, our pre-tests did not indicate this. We do suppose the problem to be one of the population. About half of the students volunteered because they were interested in the study, which probably prevented them from getting bored very often. The other half took part in order to receive credit. But there are very many possible ways and studies to receive credit for. So again, the students especially picked this experiment because of interest. These students were also very familiar with psychological experiments because they had taken part in several other studies before, which most of the time were reaction time experiments which are fairly monotonous compared to our scenarios. Therefore we suppose that their being used to much more monotonous experiments prevented them from getting bored very often. We did get this information directly from several students in the debriefing following the experiment. Another problem that could account for few ratings in quadrant three was that some subjects reported to start thinking about different issues not connected to the experiment when they felt a task was monotonous. Some interesting EDA results for these students in the according scenario support their reports.
An influence of the artificial situation in the laboratory and the fact of being connected to different technical devices is also likely to have prevented subjects from calming down. Some students reported pain towards the end of the

A-14
experiment caused by the helmet the pupil camera was mounted on, all of them reported at least discomfort.
All of the other three quadrants could be filled with ratings satisfactorily, but the exclusion of scenario 1 because of technical problems caused additional problems, especially in quadrant 4 (see figure 5).
Figure 4: SAM-ratings for scenarios 1 through 4. Big blobs indicate many ratings, little points indicate few to one.
Figure 5: SAM-ratings for scenarios 2 through 4. Again, big blobs indicate many ratings, little points indicate few to one.
Appendix A.1
A-15
Measuring Emotions We suppose the main problem in measuring emotions is the self-assessment of felt emotions by subjects. We were faced with inter-individual differences, such as subjects preferring extreme ratings or subjects with a tendency to the middle. Ratings-preferences like these led to different ratings of the exact same feeling between subjects. This problem could be answered by further refined analysis methods.
We were also faced with intercultural differences. We observed that two non-German subjects (origin: Baltic States) rated very much different than their German colleagues concerning the variance of their ratings. We pointed out the differences in the debriefing to find out if they had understood the purpose of the measuring-instrument and how to use it and they reported that they had felt calm and positive during the whole experiment. Unfortunately we can not examine if this was the case or if they rate the same feelings differently than German subjects.
In our pre-tests we also found implications for subjects rating socially desirable. In the introduction of the main study we therefore put emphasis on honesty in ratings and pointed out that the ratings are not assessed to judge the scenarios or even the test leaders competence. However, this does not guarantee subjects being totally honest.
Conclusion and Outlook
We presented results of an experiment based on a new approach to structure and represent emotions. Goal of the experiment was to find out if emotion-related physiological parameters could be unambiguously mapped onto a data representation suitable for use in a digital system. We could show that the suggested model to structure and represent emotions is well suited for that aim.
Correlations of electro-dermal activity, heart rate and pupil dilation for valence and/or arousal could be found, skin temperature was identified as potential helper parameter for refinement of analysis. However, correlations were not strong enough to suggest a regression model. Further analysis, for instance using data mining techniques and comparisons with other results based on the same model, will be performed for extended investigations (see Blech et al., 2005). It will also be interesting to investigate whether introduction of a third dimension will improve results further.

A-16
Acknowledgements
We would like to thank Cindy Pethö for her support planning the experiment, Tom Lichtenstein for the rapid development of the experiment software, and Marco Spill for his support for synchronously collecting the data.

Appendix A.1
A-17
References as used in Appendix A.1
Baayen, R. H., Piepenbrock, R. & Rijn, H. van (1995). The CELEX lexical database (Corpus Nijmegen Update) [CD-ROM]. Philadelphia: Linguistic Data Consortium, University of Pennsylvania.
Blech, M., Peter, C., Stahl, R. (2005). Setting up a multimodal database for long-time emotion studies in HCI. Proceedings of the HCI International Conference, Las Vegas, 2005.
Bradley, M. M., Greenwald, M. K. & Hamm, A. O. (1993). Affective Picture Processing. In Birbaumer, N. & Öhman, A. (Eds.): The Structure of Emotion, pp. 48-65. Toronto: Hogrefe & Huber Publishers.
Bradley, M., & Lang, P. (1994). Measuring emotion: The Self-Assessment Manikin and the semantic differential. Journal of Behavior Therapy and Experimental Psychiatry 25, pp. 49–59.
Cowie, R. et al. (1999). What a neural net needs to know about emotion words. In CSCC'99 Proceedings, pp. 5311-5316.
Davis, W. J., Rahman, M. A., Smith, L. J., Burns, A. et al. (1995). Properties of human affect induced by static color slides (IAPS): dimensional, categorical and electromyographic analysis. In Biological Psychology 41, pp. 229-253. Elsevier Science.
Ekman, P. (1992). An argument for basic emotions. In Cognition and Emotion 6 (3/4), Lawrence Erlbaum limited.
Feldman Barrett, L. & Russel, J. A. (1998). Independence and Bipolarity in the Structure of Current Affect. In Journal of Personality and Social Psychology 74 (4), pp. 967-984. Educational Publishing Foundation.
Frijda, N., 1986. The Emotions. Studies in Emotion and Social Interaction. New York: Cambridge University Press.
Lang, P. J. (1980). Behavioral treatment and bio-behavioral assessment: computer applications. In Sidowski, J.B., Johnson, J.H. & Williams, T.A. (Eds.): Technology in Mental Health Care Delivery Systems, pp. 119–137. Ablex, Norwood, NJ.
Morgan, R. L. & Heise, D. (1988). Structure of Emotion. In Social Psychology Quarterly 51 (1), pp. 19-31. Washington: American Socialogical Association.
A-18
Ortony, A., Clore, G. L., Collins, A., 1988. The Cognitive Structure of Emotions. Cambridge, England: Cambridge University Press.
Plutchik, R., 1980. A general psychoevolutionary theory of emotion. In R. Plutchik & H. Kellerman (Eds.), Emotion: Theory, research, and experience: Vol. 1. Theories of emotion, pp. 3-33. New York: Academic.
Roseman, I.J., Antoniou, A.A., Jose, P.E., 1996. Appraisal determinants of emotions: Constructing a more accurate and comprehensive theory. Cognition and Emotion, 10(3), pp 241-277.
Russell, J. A. (1980). A Circumplex Model of Affect. In Journal of Personality and Social Psychology 39, pp. 1161-1178. Elsevier Science Inc.
Russell, J. A. (1983). Pancultural Aspects of the Human Conceptual Organization of Emotions. In Journal of Personality and Social Psychology 45 (6), pp. 1281-1288. American Psychological Association, Inc.
Russell, J. A., Lewicka, M. & Niit, T. (1989). A Cross-Cultural Stidy of a Circumplex Model of Affect. In Journal of Personality and Social Psychology 57 (5), pp. 848-856. American Psychological Association, Inc.
Russell, J. A. (1991). Culture and the categorization of emotions. Psychological Bulletin, 110, 426-450.
SPSS (2005). http://www.spss.com/. Last accessed 25 Feb. 2005.
Västfjäll, D., Friman, M., Gärling, T. & Kleiner, M. (2000). The measurement of core affects: A Swedish self-report measure derived from the affect circumplex. In Göteborg Psychological Reports 30. Göteborg: Göteborg University.
Wierzbicka, A. (1992). Talking about Emotions: Semantics, Culture, and Cognition. In Cognition and Emotion 6 (3/4). Lawrence Erlbaum limited.

Appendix A.2
A-19
Appendix A.2 Journal paper referenced as [PeHe 06]
Peter, C. & Herbon, A. (2006). Emotion Representation and Physiology Assignments in Digital Systems. Appeard in: Interacting with Computers. 18/2 pp. 139-170, Elsevier Science, Inc., January 2006.
Emotion Representation and Physiology Assignments in Digital Systems
Christian Peter, Fraunhofer IGD Antje Herbon, Humbold University to Berlin
Abstract
Emotions are of increasing interest to the HCI community. Within the last decade, emotion research in HCI grew from an eccentric hobby of some visionary scientists to a widely accepted field of research. A number of proof-of-concept prototypes and studies have been published, dedicated sensor systems and technology frameworks have been developed, and theoretical considerations have been made. While they all represent a very valuable contribution to this young field of research, they lack a common theoretical basis. Particularly, there exists no applicable model of emotions suitable for designing emotion-aware systems or performing HCI-related emotion studies. However, in order to become a mature discipline, emotion research in HCI needs such a rigorous footing that future work can be based on. In this paper, a suitable approach to structure and represent emotions for use in digital systems is introduced, after a detailed and critical review of widely used emotion models is given and representative study results are discussed. The proposed method meets several requirements of HCI researchers and software developers. It avoids artificial categorisation of emotions, requires no naming of emotional states, is language independent, and its implementation is straightforward. The results of an experiment based on this approach are discussed demonstrating its applicability.
Keywords: emotion, HCI, affective computing, emotion-aware systems, human-centred design

A-20
1 Introduction
The HCI community is becoming more and more aware of the importance of emotions in Human-Computer Interaction. Especially in the usability domain there is a growing need and interest in considering the emotional “property” of users (Reeves & Nass, 1996; Picard, 1997; Marcus, 2003; Cockton, 2004). Traditional analysis concepts like mental models (Carroll & Olson, 1988) or users’ models (Sasse, 1997) help to understand users’ approaches to problem solving and interaction with machines. Emotions, however, are barely covered by those theories. Also, product designers started to explore emotional aspects in their domain. Beginning with Pat Jordan’s and Don Norman’s considerations (Jordan, 2002; Norman, 2004), more and more contributions have been made to this field, like Pieter Desmet’s work (Desmet, 2002). In the field of Human-Computer Interaction, Rosalind Picard’s work on affective computing (Picard, 1997, 1999) has enormously increased the momentum of HCI-related emotion research. Today, there are several publications available on proof-of-possibility studies for emotion detection and affective response, for instance André et al (2000), Kort et al. (2001), Klein et al. (2002), Picard & Klein (2002), Scheirer et al. (2002), and Arafa et al. (2004). Dedicated sensor systems and technology frameworks have been developed (Haag, 2004; Mader et al., 2004; Anttonen & Surakka, 2005; Peter et al., 2005), theoretical aspects have been addressed (Cañamero, 1999; Picard, 1999; Cockton, 2002, 2004; Hudlicka, 2003), and there are the first signs of a developing community interested in emotions and their role in HCI (see Marcus, 2003; HUMAINE, 2005; Peter & Blyth, 2005; ACII, 2005).
However, all activities so far have been restricted to being just possibility studies and proof-of-concept prototypes without a clear theoretical foundation of emotions and how they should be dealt with by a digital system. Particularly, there exists no straightforward and applicable concept of structuring emotions, which is a prerequisite for reliably obtaining, storing, and finally processing emotion data. While there is a huge variety of emotion models in psychology, emotion related HCI research has so far widely neglected the need of an underlying theoretical model of emotions (cf. Cockton 2004, Muller 2004). Recently, some researchers have realised the need for an underlying theory for

Appendix A.2
A-21
properly correlating physiological data2 with emotional states. Several models of emotions developed by psychologists have been tried, like OCC (Ortony et al., 1988), or those from Scherer (1984), Frijda (1986), and Roseman et al. (1996). However, it is difficult to take a theory of one research field, like psychology or cognitive neuroscience, and apply it to another, like HCI. The same problem has been experienced by the HCI community in the late 1980s and 1990s, when cognitive processes were to be included in HCI research (cf. Rogers 2004). Why should it be different with emotions? The emotion models developed by psychologists have been designed to study emotions in general. They do not just contain correlations between physiological and emotional states, but also different ideas on the cause of the arising emotion, underlying biological processes, anatomical structures, and other psychological considerations (cf. Davidson 2003). Furthermore, discussions regarding which model is eventually best suitable for measuring emotions are very controversial, not least because some authors even question the fundamentals of these models (cf. Fredrickson 1998; Sabini & Silver, 2005).
Implementing these models in software hence proved to be very difficult, and since the system developers were not psychologists, the resulting designs finally became simplified implementations of the original models and were adapted to the very specific tasks in mind. Obviously, there isn’t a straightforward way from psychology to HCI. Rather, designers and researchers in HCI should selectively use relevant and applicable knowledge gained by psychologists, taking the freedom to ignore aspects not relevant to their domain. HCI researchers are interested in other aspects of emotion than psychologists are, mainly in observable physiological manifestations of emotions occurring in real-life scenarios. Psychological emotion models do not live up to their requirements of applicability, comparability, and ease of use, as pointed out later in this paper. What is needed for HCI researchers and practitioners are adequate measures to associate physiological measurements to unambiguous emotional states in order to finally assign them to conditions meaningful to a computer (cf. Cockton, 2004; Bamidis et al., 2004; Wilson & Sasse, 2004; Ward & Marsden, 2004).
The method described in this paper fulfils several requirements of HCI researchers and software developers on such a basis. It avoids artificial categorisation of
2 The term “physiological data” here refers to any observable physiological changes, such as heart rate, skin resistance, skin temperature, mimics, gestures, posture, voice characteristics, and others.

A-22
emotions, requires no naming of emotional states, is language independent, and straightforward to implement.
In the following section, an introductory overview of the two main models used to structure emotions is given and the supporting physiological findings are presented for each, from different studies. This is followed by a discussion of the disadvantages, shortcomings, and pitfalls of the discussed emotion models, from an HCI perspective. Based on this analysis, a new approach to structure emotion has been developed with a focus on its applicability in HCI research and application design. Results of an experiment based on this approach are described which show the applicability of the new approach.
2 Two main approaches to structure emotion Current theories from psychology on emotions can be grouped into theories that focus on how emotions arise and how they are perceived, and theories focussing on how observed emotions could be categorised or structured. Since theoretical aspects on how emotions arise, when and how they are perceived, and which biological mechanisms induce them are less important for systems to recognise emotions, these approaches won’t be reviewed in this paper. Please refer to the respective literature (e.g. Scherer (1984), Frijda (1986), Ortony et al. (1988), Roseman et al. (1996)).
Among the theories for categorising or structuring emotions, two main theories are currently established: a discrete approach, claiming the existence of universal “basic emotions” (e.g. Plutchik, 1980; Ekman, 1992), and a dimensional approach, assuming the existence of two or more major dimensions which are able to describe different emotions and to distinguish between them (e.g. Russell, 1980). There is still controversy on the matter of which approach is the one that best captures the structure of emotion even though attempts have been made to conflate the two (Russell & Feldman Barrett, 1999).
2.1 Discrete emotion theories and the concept of basic emotions Discrete emotion theories claim the existence of historically evolved basic emotions which are universal and can therefore be found in all cultures. Several psychologists have suggested a different number of these, ranging from 2 to 18 categories, but there has been considerable agreement on the following six:

Appendix A.2
A-23
anger, disgust, fear, happiness, sadness and surprise. Several arguments for the existence of these categories have been provided, like distinct universal facial signals, distinct universals in antecedent events, presence in other primates etc. Ekman (and also other researchers) based his assumptions mainly on the facial expression of emotions. In his studies, facial expressions of emotions were recognised by people from very different cultures.
Russell (1994), however, found that there are differences in the recognition ability for subjects of different origins. While western literate groups widely agree about emotions presented by photographs, people from isolated groups often do not agree with them. These differences challenge the universality view. Carroll and Russell (1996) conducted an experiment focussing on emotion recognition from pictures in a semantic context and found first, that they could not replicate the high recognition rates for the POFA (Pictures of Facial Affect; Ekman & Friesen, 1976) that had been reported and second, that there exists situational dominance when pictures are presented in an emotionally different context.
Empirical Evidence Over the last decades many experiments have been performed in search of universal physiological patterns specific to basic emotions. Those studies concentrated mainly on activities of the autonomous nervous system (ANS) and characteristic speech signal changes. ANS related studies (e.g. Ax, 1953; Ekman et al., 1983; Palomba et al., 1993, 1999; Prkachin et al., 1999; and many others) showed very interesting results each on its own, but until now no distinct patterns for the six basic emotions mentioned above could be found that all agree on. The results of the studies are controversial and the variables measured do not seem to allow distinguishing clearly between different emotions. Some stable results could be found for variables that seem to characterise certain basic emotions, especially fear and anger which are the two that previous studies have focussed on mostly. Appendix A.2.1 summarizes 13 of these ANS-Studies that resulted in the following commonalities. For fear: increase of heart rate, skin conductance level and systolic blood pressure; for anger: increase of heart rate, systolic and diastolic blood pressure. Measuring sadness seems to be more difficult, which results in the circumstance that only 8 out of the 13 studies assessed that emotion. Because of this, the results are not as clear as for fear and anger. Christie (2002) and Fredrickson et al. (2000) found a decrease in heart rate, while Levenson et al. (1990), Neumann & Waldstein (2001), Prkachin et al. (1999) and Schwartz et al. (1981) reported an increase of heart rate, while Palomba & Stegagno (1993) could not find any significant difference to the measured baseline. Disgust seems to represent an even greater problem. It was only assessed by 4 out of the 13

A-24
studies. The results are not very promising. Also, measuring positive emotions such as happiness seems to be very troublesome as can be observed especially in diastolic and systolic blood pressure and heart rate data, which ranged from decreases to even strong increases in the seven reported studies. Amusement and surprise were only assessed in one study each by Christie (2002) and Ekman et al. (1983) accordingly.
Speech analysis has also been performed with the same goal to find specific patterns in the speech signal that will confirm the existence of basic emotion categories (for a summary see Scherer (2003)). The results were less controversial than those of the ANS-studies, especially when the level of arousal/intensity was taken into account, i.e. when anger was divided into hot and cold anger with high and low arousal, respectively (e.g. Banse & Scherer, 1996). Panic correlated significantly with an increase in intensity of the voice, increase of F0 floor/mean3 and increase of the speech/articulation rate, while for anxiety the F0 floor/mean and voice intensity decreased. For hot and cold anger there were no differences concerning the direction of change from baseline for intensity, nor for F0 floor/mean or hot anger. The parameters all increased, even though the increase in intensity was respectively higher for hot anger than for cold anger. For the analyses of sadness, Banse & Scherer (1996) and Burkhardt & Sendlmeier (2000) divided the emotion into quiet sorrow for low arousal level and crying despair for high arousal level. While Intensity and F0 floor/mean increased for crying despair, it decreased for quiet sorrow. The speech/articulation rate decreased for both forms of sadness, but the decrease was greater for quiet sorrow. Most studies in the past have investigated the low arousal form, which is why they agree on decreases in the mentioned parameters for sadness (Johnstone & Scherer, 2000; Murray & Arnott, 1993; and Scherer, 1993). The positive emotion of happiness has also been investigated. Here also, two arousal states were identified. Happiness is a low arousal form whereas joy is considered being the high arousal version. Intensity, F0 floor/mean and speech rate have all shown to increase for joy, but decrease for happiness. Nonetheless, until today no unambiguous distinctive patterns could be doubtlessly confirmed, especially because arousal levels are often neglected.
Examinations of the semantics of basic emotion terms by Wierzbicka (1992) showed contradictive results. She explained that for some languages certain words describing basic emotions do not exist (such as the word anger for the
3 F0 is the fundamental frequency of a voice signal, see Appendix A.2.2 for a definition.

Appendix A.2
A-25
Ilongot language of the Philippines or the Ifaluk language of Micronesia) and concluded that the basic emotions are just cultural artefacts of the English language.
2.2 Dimensional emotion theories and the Circumplex Model of Affect Dimensional emotion theories use dimensions rather than discrete categories to describe the structure of emotions. According to a dimensional view, all emotions are characterised by their valence and arousal4. Some models have suggested an even greater number of dimensions, but the additional dimensions (e.g. control) could usually not add much to the overall variance that could be accounted for.
However, arousal and valence are not claimed to be the only dimensions or to be sufficient to differentiate equally between all emotions, but they have proved to be the two main dimensions (Russell, 1983). Cowie et al. (1999) suggested additional features that are not part of every emotion, but of certain ones. They found that some emotions that share the same degrees of arousal and valence but are perfectly distinguishable in everyday life (e.g. fear and anger) could be better discriminated by comparing these additional features.
When Russell started conducting self-report studies on the structure of emotion with the two-dimensional approach, he discovered a specific ordering of the words describing the felt emotions. The ratings did not fall in every area of the coordinate system, but instead clustered around the periphery of a circle. He called the resulting configuration the Circumplex of Affect (see figure 1). This structure has been replicated many times in English and many other languages (e.g. Russell, 1983; Russell et al., 1989; Västfjäll, 2000) and it has also been challenged, e.g. by Bradley et al. (1993).
4 While we use the terms valence and arousal here, the exact titling of the two dimensions has been very controversial, see Feldman Barrett & Russell (1998) for a discussion on the topic and Russell & Feldman Barrett (1999) for a review of other dimensional theories.
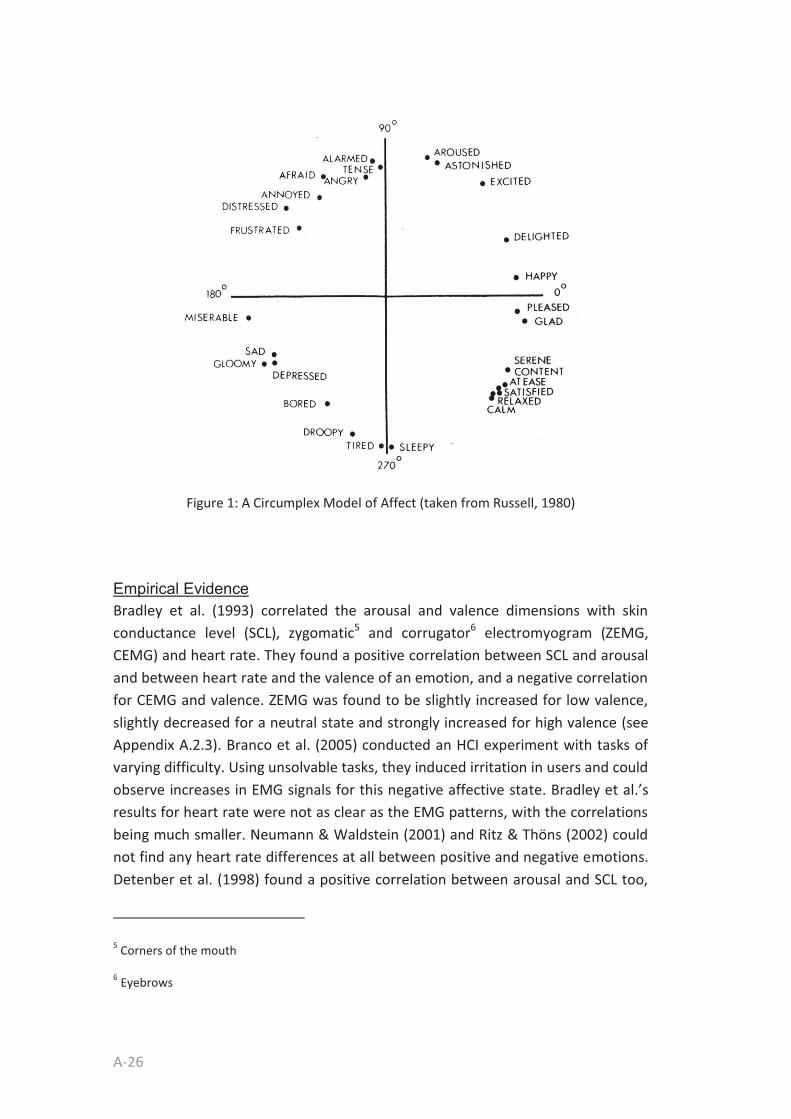
A-26
Figure 1: A Circumplex Model of Affect (taken from Russell, 1980)
Empirical Evidence Bradley et al. (1993) correlated the arousal and valence dimensions with skin conductance level (SCL), zygomatic5 and corrugator6 electromyogram (ZEMG, CEMG) and heart rate. They found a positive correlation between SCL and arousal and between heart rate and the valence of an emotion, and a negative correlation for CEMG and valence. ZEMG was found to be slightly increased for low valence, slightly decreased for a neutral state and strongly increased for high valence (see Appendix A.2.3). Branco et al. (2005) conducted an HCI experiment with tasks of varying difficulty. Using unsolvable tasks, they induced irritation in users and could observe increases in EMG signals for this negative affective state. Bradley et al.’s results for heart rate were not as clear as the EMG patterns, with the correlations being much smaller. Neumann & Waldstein (2001) and Ritz & Thöns (2002) could not find any heart rate differences at all between positive and negative emotions. Detenber et al. (1998) found a positive correlation between arousal and SCL too,
5 Corners of the mouth
6 Eyebrows

Appendix A.2
A-27
but could not quite replicate Bradley’s findings on correlations between heart rate and valence. They did find a deceleration for negative valence stimuli, but they found the same for positive stimuli, although not as strong. In addition, heart rate deceleration correlated with high and low arousal in as far as it was stronger than for medium arousal. Anttonen & Surakka (2005) found similar results while measuring heart rate with the EMFi chair (an office chair that allows unobtrusive heart rate measurement). They presented positive, negative and neutral stimuli to 26 subjects and found a stronger deceleration of heart rate for negative than for positive or neutral stimulation. Interestingly, when comparing individual response patterns to the mean response pattern over all subjects for each of the stimulus groups (positive, negative, neutral), they found that only 62.5% of the individual curves were adequately in line with the mean curve, indicating strong inter-individual differences. In 16.7% of the cases, the authors could not show different responses for positive and negative stimuli at all. These findings suggest that physiological responses can not be generalised for all people but differ considerably from individual to individual. However, care has to be taken with some of Anttonnen & Surakka’s results due to methodological issues. The ratings of all subjects have been grouped by their mean ratings and have not been analysed for their individual differences. In addition, the results have not been controlled for their level of arousal, i.e. stimuli for negative valence also had an arousing effect which has not been considered in the evaluation of the physiological data.
Pereira (2000) and Schröder et al. (2001) correlated voice quality parameters, such as frequency and intensity, with valence and arousal and received promising results (see Appendix A. 2.4, A2.5). Voice correlates seem to be more clear and less controversial than EMG, SCL and heart rate results, but are mainly found for arousal. Küstner et al. (2004) found that in speech more prosody features correlate with arousal than quality features, but that also some prosody features rank high in valence and quality features correlate also with arousal. For instance, for prosody features, energy variance, mean square error of linear regression of F0, and the length of the longest unvoiced region show high correlation with arousal, while F0 at the first voiced frame and the maximum of the F0 derivative correlate strongly with valence. For quality features, the spectral tilt after inverse filtering, the mean bandwidth of F2, and the band energy from 2.5–3.5 kHz correlate with valence, while the maximum harmonics-to-noise ratio correlates with arousal, as do the mean bandwidth and standard deviation of F1, although the correlation is not as strong (see also Laukka et al. 2005).

A-28
Carroll and Russell (1996) found evidence for facial emotion recognition on the basis of dimensions. Subjects in this study had to first listen to a story of some emotional content about a person and were afterwards shown a picture of a person displaying a facial expression. When judged alone, the stories and the pictures of each presented pair suggested different emotions, i.e. the emotional content was non-matching. But when the faces were judged after a subject had listened to the story, the story dominated the judgement. Interestingly, this was only the case if the emotions of the face and the story did not differ in the dimensions of valence and arousal, but only in their emotion categories. Thus, subjects seemed to confuse the emotion displayed by the picture with the one of the story because the situational context was able to explain the face’s degree of valence and arousal and the picture did not offer any further information on the specific emotion. Therefore, the emotion of the situation was chosen by the subjects. These findings implicate recognition of facial expressions on a dimensional instead of a categorical basis and contradict basic emotion theory. If the facial expression of basic emotions were universal, the picture of the face should have been identified “correctly” in spite of the subject having heard the story before.
The comparison of the reported physiological correlates to dimensions with results from studies that are based on discrete emotion theories7 raises further questions, again, especially on the valence dimension. Usually, clearer physiological correlates are found for negative in comparison to positive emotions. Fredrickson et al. (1998, 2000) even suggested that there might not be emotion-specific physiology for positive emotions at all since they might be of a regulatory function. They proposed that after a negative emotion has been experienced, positive emotions serve to bring a person back to a neutral level. They called this regulation function the Undoing Effect.
7 We do consider a comparison of results based on two different structure theories troublesome and do not want to propose that the results should be mingled. However, emotion words such as fear, anger etc. have been placed in coordinate systems and in the circumplex in different experiments (see Feldman Barret & Russel 1998) and do therefore allow to make some considerations about commonalities and differences in different studies as well as in different categories or places in the coordinate system.

Appendix A.2
A-29
3 From psychology to HCI
The two approaches for structuring emotion described above are two main theories followed in current emotion research. Russell and Feldman Barrett (1999) have made an attempt to combine the two approaches (using dimensions as well as discrete emotion categories). They suggest that the reason for the existence of two seemingly opposing theories is that both approaches relate to different concepts of what exactly is being defined as emotion and that, keeping this in mind, they can indeed be combined. While those theoretical issues are of no practical importance for HCI, the differences of the two models are significant. They not only represent different ideas about how emotions should be described and structured, but also, as a consequence, about how emotions can be observed and assessed and how they could be handled within a system. Hence, one has to commit to one emotion model or the other prior to any other step. For the researcher interested in emotions occurring at HCI this is important for setting up an experiment. The outline of an experiment is strongly influenced by the model chosen, from the hypotheses (what will be measured, what outcome is expected), to the tasks to be performed by the subjects (inducing discrete emotions is different from inducing certain arousal and valence states), to how the measured data will be stored, annotated, and analysed. For the designer of an emotion-aware system, committing to a model means that at the very first step of drawing up the system one has to choose the approach that best meets the requirements, that is for a definition of the structure of emotion that will be used throughout the system. This decision is a key element of the design process since it has significant effects on system characteristics like the number and sort of user states that can be distinguished, the level of detail of the emotion information, how emotion information can be stored and communicated within the system, or which analyses can be performed with which degree of accuracy.
A problem that can be observed with all previously mentioned experiments of both approaches is that of labelling emotions. All categories of the discrete emotion theories have in common that their definitions are based on verbal descriptions and hence on semantic categories of the language used. In most languages there are similar, but not identical categories, i.e. there is no one-to-one translation of emotion words; see Russell (1991), Wirzbicka (1992). Because of this, assignments of emotions to certain discrete categories depend on the individual researcher’s cultural and social background as well as on his scientifically driven preferences. Furthermore, the borders of the categories are blurry, and an emotion usually belongs to a category only to a certain degree and to another category to another degree, even when a large number of categories
A-30
are chosen. For instance with anger, anger experienced playing a computer game differs from anger about loss of data, and this even differs depending on who is responsible for it. Accordingly, those angers are states of different emotional experience with different physiological patterns, although they might all be labelled as “anger” by different researchers in different studies.
Emotion words were also used with studies using the dimensional approach to label elicited emotions. While this has no effect on the applicability of the theory itself, it poses similar problems concerning assignments of physiological measures to expressed emotional states. Hence, it is questionable whether results of different studies using words to label emotional states can be compared with each other due to the possible different interpretations of the emotion words. For the same reason it is also worth asking whether the studies’ results can be used for designing emotion processing applications. How can we know which sort of anger was intended to be induced in those experiments and which sort of anger the subjects actually felt?
From the system designer’s point of view, labelling emotions with words is not necessary. For processing emotion information, emotions just need to be referenced somehow, in an unambiguous manner. Using words would even make it more difficult to assign physiological measurements to one internal emotion representation (e.g. choosing hot or cold anger) and hence brings with it uncertainties about the actual user state. Also, from a practical implementation point of view, individual developers of the emotion-aware system might have different interpretations of the emotion words describing the emotional state of the user, especially so when the development team’s members have different cultural or social backgrounds, as is often the case in bigger companies with international development teams.
Another problem observed is closely connected with the methods used to induce emotions in an experiment. Banse and Scherer (1996) discussed the problem of controversial and unclear results in most of the basic emotion studies, which applies also to studies based on the dimensional approach. They pointed out that there exists a serious emotion induction problem and that this methodological issue may be the reason for some poor results. Regularly used induction methods are photograph or video watching, recalling affective situations or sometimes actually bringing the subject in an affective situation, which has been done very carefully for ethical reasons and hence induced fairly weak emotions. But, anger induced through a picture is much different from anger induced by bad news or by a word-processor formatting the text without explicit permission. Hence, care has to be taken when comparing study results with respect to the different induction

Appendix A.2
A-31
methodology. This also adds to our scepticism on the applicability of those studies’ results for designing emotion-aware systems or applications.
Concerning the unclear and controversial results that have occurred during the basic emotion studies, we think that the main reason is not that emotions might not be measurable with the means that have been used in those experiments, but rather that the underlying model of discrete categories is not suited to measure them. As described above, the construct of i.e. anger as a basic emotion is unclear, borders are blurry, and “angry” can be a very different feeling in different situations. Thus, not the physical reaction to “anger” has been measured in those studies, but the physiological reaction to different emotional states that were assigned to a category named “anger” by different researchers with different backgrounds in different studies. Without a clear-cut construct for the emotional state that is to be investigated it is not possible to conduct a reliable study. As a consequence, we conclude that at least for HCI purposes a discrete emotion approach is not a good choice.
Overcoming the named disadvantages of the two main methods to structure emotion seems essential to us for designing advanced and sophisticated emotion-aware HCI systems or applications. A new approach to structure and represent emotions that is based on a concept of mixed emotions, uses dimensions for representation, and which is not restricted by language specifics will be described in the following section.
4 A new approach to structure emotion for use in HCI As has been made clear, defining the structure of emotion has been a troublesome task in the past and still is. However, for research on emotion as well as for designing emotion-aware systems, it is necessary to commit to one model or the other in order to define the basic principles of the studies to be conducted or for the system to be designed.
We propose to base HCI-related emotion research on a dimensional model. Whether to use two or three dimensions depends strongly on the research goal or application in mind. We assume that two dimensions might suffice to characterise and discriminate between most of the emotional states that might occur during human interaction with a system. However, there are applications where the third dimension of power, or control, might be of interest, for instance to detect helplessness of first-time users or the feeling of superiority in computer games.
A-32
While the following explanations refer to a two-dimensional model for reasons of clarity, a third and indeed more dimensions can easily be added to the model without any consequences for its practicability.
There are two reasons to not simply use a dimensional model as described in section 2: First, the problem of distinguishing between emotions, i.e. the issue of pure vs. mixed emotions, and second, the problem of labelling emotions. Those will be discussed in the following sections.
Pure vs. mixed Emotions In their studies on the structure of emotion the pioneers of the dimensional approach derived their data from subjects’ ratings about the similarity of emotion words (e.g. Russell, 1980) and replicated those later with self-reports on subjects’ current emotional states (Feldman Barrett & Russell, 1998). In all of these studies, subjects were given a list of emotion words, which they rated in different ways. Usually, subjects were asked to indicate their current feelings on Likert-type scales ranging from “not at all” to “extremely”, “strong disagreement” to “strong agreement” or “describes me not at all” to “describes me very well”. Subjects rated several emotions as appropriate to describe their current states instead of just one, which showed that the subjects did experience several of the given emotions all at one time. Studies performed by Davis et al. (1995) showed the same effect for subjects that were presented with emotional photographs. Examples of emotion combinations observed are happy/surprise, sad/disgust, anger/sad and love/happy/sad. However, researchers who studied correlates of emotion and physiology never seemed to have paid much attention to that fact. The stimuli used were usually rated before the actual correlate study was conducted to assure source clarity, and resulting correlates with physiology data were ascribed to the emotion that the stimulus was expected to induce (e.g. Fredrickson & Levenson, 1998). Interestingly, although such immense effort has been made to increase source clarity, hardly any of the stimuli achieved source clarity of nearly 100% (see also Schimmack, 2005).
Given the above mentioned results from Feldman Barrett & Russell (1998) and Davis et al. (1995), it seems problematic to us to assign physiological measurements to emotion words like fear, anger, happiness and so on, since they are in fact just like categories and not unique emotions with a characteristic physiological pattern.
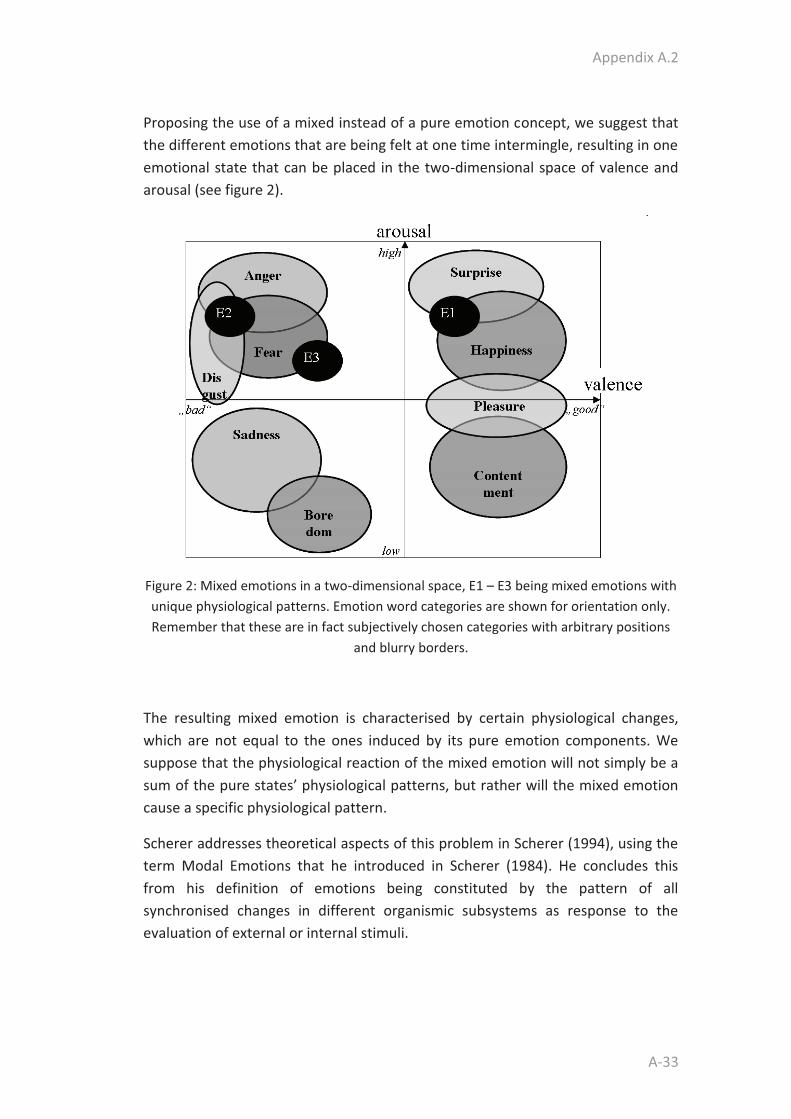
Appendix A.2
A-33
Proposing the use of a mixed instead of a pure emotion concept, we suggest that the different emotions that are being felt at one time intermingle, resulting in one emotional state that can be placed in the two-dimensional space of valence and arousal (see figure 2).
Figure 2: Mixed emotions in a two-dimensional space, E1 – E3 being mixed emotions with unique physiological patterns. Emotion word categories are shown for orientation only. Remember that these are in fact subjectively chosen categories with arbitrary positions
and blurry borders.
The resulting mixed emotion is characterised by certain physiological changes, which are not equal to the ones induced by its pure emotion components. We suppose that the physiological reaction of the mixed emotion will not simply be a sum of the pure states’ physiological patterns, but rather will the mixed emotion cause a specific physiological pattern.
Scherer addresses theoretical aspects of this problem in Scherer (1994), using the term Modal Emotions that he introduced in Scherer (1984). He concludes this from his definition of emotions being constituted by the pattern of all synchronised changes in different organismic subsystems as response to the evaluation of external or internal stimuli.

A-34
Our approach can be considered similar to his, but with a more pragmatic, application-oriented point of view. It’s a view on ongoing emotion-related physiological changes by an observer who wants to use and not study them.
Labelling Emotions As we worked out in sections 2 and 3, naming emotions with words is problematic. For instance, just as the word anger can describe many emotional states, the words that describe a certain type of anger can have very different meanings as well (for instance, anger plus anxiety plus depression when confronted with loss of important data). Adding to this that the category borders are blurry, we suggest to abandon labelling emotions with words.
Whenever studies resulted in a structure that showed emotion words placed in a coordinate system (e.g. Russell, 1983; Morgan & Heise, 1988; Västfjäll et al, 2000; and many others), they all assumed that the list of words given to the subjects to rate their emotion contains words that are universal as to the extend that everyone will associate the same feelings with them. But with Wierzbicka’s and Russell’s findings of intercultural differences in the existence of emotion words (Wierzbicka, 1992; Russell, 1991) we do not support this assumption of universality. We go as far as to propose even individual intracultural differences in the understanding of different emotions, especially in connection with computers.
On the contrary, we do assume the concept of dimensions being universal. Therefore, if it is true that emotions can be described with dimensions only, it should be possible to identify a person’s inner state simply by using these dimensions without using emotion words. The emotion could simply be labelled by its position in the coordinate system.
Practical Implementation This section describes a possible application of the new approach to demonstrate its applicability. It is explained how it could be used to explore correlates between physiological patterns and emotions experienced by the subjects. Again, a two-dimensional model is used for clarity.

Appendix A.2
A-35
In a first step, emotions that typically occur during HCI will have to be identified. This could be done with subjects performing computer tasks and rating their different emotional experiences using a non-verbal method, for instance SAM8 (Lang, 1980). Examples for those tasks for use in a laboratory experiment are writing a letter, playing a game, completing a form, or other things of the kind.
We want to put emphasis on the use of scenarios instead of short stimulus presentation which is mainly used in cognitive psychology. We believe this being necessary to obtain an experimental setting with tasks as close to real life as possible. Since the goal is to measure pure emotional influence on different physiological parameters, we also suggest a control for cognitive influences, such as skilled behaviour vs. problem solving, for instance by varying task difficulty levels.
After subjects have rated their emotions experienced during the task on SAM, the ratings can be placed in the coordinate system according to their degree of arousal and valence and should from that point on be labelled with their x- and y-coordinates (e.g. “emotion (1.5, 4)”, see figure 3).
valence-1 1
1
-1
X(-4, 1)
X(1, -3)
X(2, 1.5)
arousal
X(2, 2)
valence-1 1
1
-1
X(-4, 1)
X(1, -3)
X(2, 1.5)
arousal
X(2, 2)
Figure 3: Emotion ratings in the coordinate system
8 SAM (Self-Assessment-Manikin) consists of pictures of manikins for each of the dimensions valence, arousal and dominance. The manikins represent 5 states with the subjects rating their current feeling either on a manikin or in the space between two manikins, which results in 9 gradations. See also Bradley & Lang (1994).

A-36
Physiology is the second characteristic of interest. For this, certain physiological measures, like heart rate, skin conductance level (SCL), or skin temperature have to be taken of the subjects while performing the above-mentioned tasks and self-assessments. The collected physiological parameters can then, as the second step, be assigned to the related ratings. Because of interpersonal differences, absolute values must not be used. Instead, changes in physiological reactions compared to the baseline are of interest, which is why the data will have to be z-transformed. Appropriate analysis methods, like Multiple Regression Analysis, will then have to be conducted to reveal correlations between the dimensions and physiology.
In a third step, after having attained a respectively high number of emotion ratings and related physiological measures, cluster analysis can be used to group those emotions into clusters that do not differ significantly from each other concerning their physiology and their position in the coordinate system. The resulting emotion can then be defined by its means (see figure 4).
In the fourth and last step, it should be possible to identify a characteristic pattern in the physiological signals for each of the clusters. Those can be used in further processing steps to automatically detect and discriminate distinctive affective states of the user in the given context.
Figure 4: Clustered Emotion
Appendix A.2
A-37
In order for an affective application to measure emotion, distinct patterns of signals from a variety of sensors, cameras, microphones, and other sources need to be found. As described in section 2, some studies have focused on finding dimension-correlates in the past and have turned out to show promising results. Still, there is a great need for further research using the concept of mixed emotions and avoiding labelling emotions with emotion words, for instance by using Wierzbicka’s emotion descriptions or Lang’s SAM.
5 Experimental Validation We made a first effort to validate the two-dimensional model of emotions. We conducted steps one and two as described above. Subjects had to perform computing tasks while emotion-related physiology changes were recorded. Data was obtained for skin conductivity (electro-dermal activity, EDA), skin temperature, heart rate, and pupil dilation. At the end of each task, which took 3-5 minutes each, the subjects had to rate their feeling during the past activity on SAM. Tasks to be performed included: a counting task, a search task, a repetition task (painting), and a game. Each task was to be performed in different difficulty levels to cover as much of the two-dimensional space of valence and arousal as possible and to make sure that the influence of task difficulty would not falsify the affect data. We assumed that the difficulty level will very much influence both, the emotions or feelings about completing the task and the physiological reactions accompanying the completion. Since the goal of the experiment was to find correlations between physiological changes and self-reported emotional states, the part of the physiological response which was due to the cognitive processes such as problem solving or skilled behaviour was a non-interesting variance which had to be controlled.
Results show that physiology does correlate with the emotion dimensions used by the suggested model. For data analysis, we first used Multiple Regression Analyses with rather weak results. We then applied Multivariate Pearson Correlation on all six parameters, revealing several significant coherences. Especially for EDA and pupil diameter highly significant correlations to valence and arousal could be observed. Heart rate correlation was rather weak, but significant also. Skin temperature by itself does not appear to be a useful predictor, but seems to be suitable to further refine predictions based on the other parameters. The most promising data was achieved for pupil diameter which correlated -.328 with arousal and up to -.5 with valence. EDA correlations were almost as strong with up to -.439 for the valence dimension and -.3 for arousal. We did not find any

A-38
significant physiological differences between the three difficulty levels used and did therefore not consider them for further analyses.
We encountered different methodological problems using real life scenarios instead of pictures or films (as usually done in psychological studies): Real-life scenarios are harder to control, i.e. the subjects’ behaviour and resulting emotions are harder to predict. We did have trouble inducing negative, low arousing emotions (quadrant four), which was not indicated by our pre-tests. This problem was probably one of population; by using highly motivated and interested college students, they were not very likely to be bored by the experiment. Our pre-tests also indicated socially desirable emotion ratings, which is why in the main study the introduction put great emphasis on honesty and pointed out that ratings are not assessed to judge the scenarios themselves or even the test-leaders’ competence. Using self-assessment of emotions was additionally difficult because of real-life scenarios lasting several minutes compared to photographs, which are usually presented for a few seconds each. Subjects had to recall their emotions and maybe also to name the prevailing ones, since they might have gone through different emotional states during a task. In addition, the artificial laboratory situation and the fact of being connected to different technical devices are also likely to have prevented subjects from calming down (see Peter et al., 2005). We do believe that further research must be devoted to the set up of an experiment as close to real life HCI as possible in order to increase correlations. For further data and problem discussions please refer to Herbon et al. (2005).
6 Conclusions and Outlook So, did Russell, Ekman, Lang, and all the other emotion researchers miss the point? Not at all! The difference is that the goal of their research was to find out about the nature of emotion itself. Their models and approaches to study emotion serve a different goal and hence feature functions not needed by designers of emotion-aware systems who do not want to know what the current internal state of a user is called or which biological processes cause it, but just that it occurs in order to let the system react sensibly to it.
The new approach introduced in this paper does solve two major problems of common emotion models with regard to designing emotion-aware systems. It provides a means for structuring, representing and processing emotions within a system without compromising the ambiguous nature of emotion. It does not claim

Appendix A.2
A-39
to answer general questions on emotions, like what exactly are emotions or what makes them special in comparison to other mental states. It rather wants to help system designers to get grips with emotions in order to incorporate them into their systems.
We worked out that results of other studies on emotional physiological response, which are based on either a discrete or a dimensional emotion theory, should not be mingled due to the different approaches of those theories. We also pointed out the dangers of using emotion words to label emotional states and concluded that study results based on verbal labelling have to be treated very carefully regarding their comparability as well as their applicability for designing HCI systems. Therefore, we think that further investigation on emotion physiology in HCI is necessary, and that developers of emotion-aware systems should not blindly use results of psychological studies without clarification by independent studies which take into account the induction, labelling, and mixed vs. pure emotion problems.
The applicability of the new approach has been demonstrated in this paper. A first study to apply it in practice has been performed with results supporting the theory. A number of following studies and usage in applications will show to which extent this new approach can serve the variety of requirements of emotion-related HCI activities.
Acknowledgements The authors would like to thank their colleagues for the fruitful discussions and motivation, Anne Fowles and Lisa van Zutphen for proofreading the compuscript, and the anonymous reviewers for the valuable comments and suggestions.

A-40
Appendix A.2.1 - Psychophysiological studies based on a discrete structure of emotion
HR - heart rate SCL - skin conductance level Temp. - finger temperature TWA - t-wave-amplitude BP - blood pressure (systolic/diastolic)
Resp. - respiration
Fear
Ax (1953)
Christie (2002)
Ekman et al. (1983)
Fredrickson et al. (2000)
Levenson et al. (1990)
Nasoz et al. (2003)
Palomba/ Stegagno (1993)
Palomba et al. (1999)
Prkachin et al. (1999)
Sinha et al. (1992)
Scherer (2000)
HR increase increase increase increase increase increase increase increase increase increase increase
SCL increase increase increase no significant difference
increase increase
Temp. no significant difference
decrease decrease no significant difference
TWA decrease
diast. BP
decrease
increase increase no significant difference
syst. BP increase increase increase increase
Resp. increase increase increase
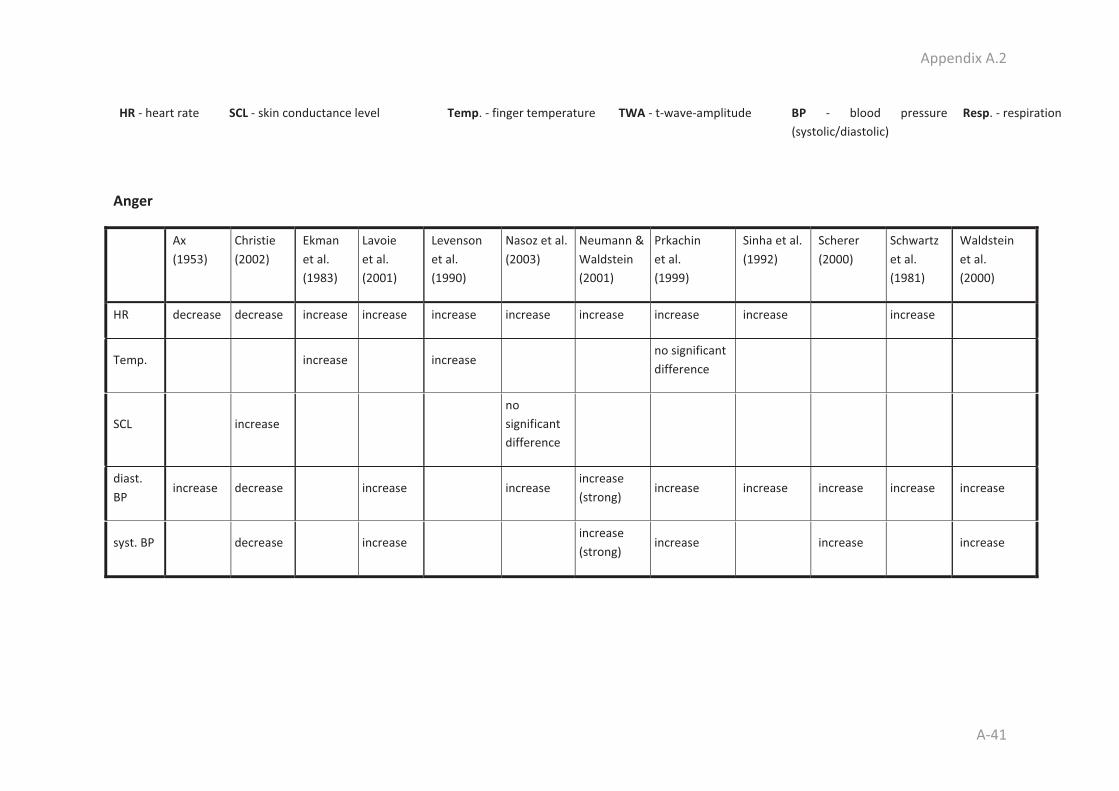
Appendix A.2
A-41
HR - heart rate SCL - skin conductance level Temp. - finger temperature TWA - t-wave-amplitude BP - blood pressure
(systolic/diastolic) Resp. - respiration
Anger
Ax (1953)
Christie (2002)
Ekman et al. (1983)
Lavoie et al. (2001)
Levenson et al. (1990)
Nasoz et al. (2003)
Neumann & Waldstein (2001)
Prkachin et al. (1999)
Sinha et al. (1992)
Scherer (2000)
Schwartz et al. (1981)
Waldstein et al. (2000)
HR decrease decrease increase increase increase increase increase increase increase increase
Temp. increase increase no significant difference
SCL increase no significant difference
diast. BP
increase decrease increase increase increase (strong)
increase increase increase increase increase
syst. BP decrease increase increase (strong)
increase increase increase

A-42
HR - heart rate SCL - skin conductance level Temp. - finger temperature TWA - t-wave-amplitude BP - blood pressure (systolic/diastolic)
Resp. - respiration
Sadness
Christie (2002)
Ekman et al. (1983)
Fredrickson et al. (2000)
Levenson et al. (1990)
Neumann & Waldstein (2001)
Palomba/ Stegagno (1993)
Prkachin et al. (1999)
Schwartz et al. (1981)
HR decrease increase decrease increase increase no significant difference
increase increase
Temp. no significant difference
no significant difference
SCL decrease
diast. BP
decrease no significant difference
increase (strong) increase (strong)
syst. BP
decrease increase increase (strong) increase (strong)
Resp. no significant difference
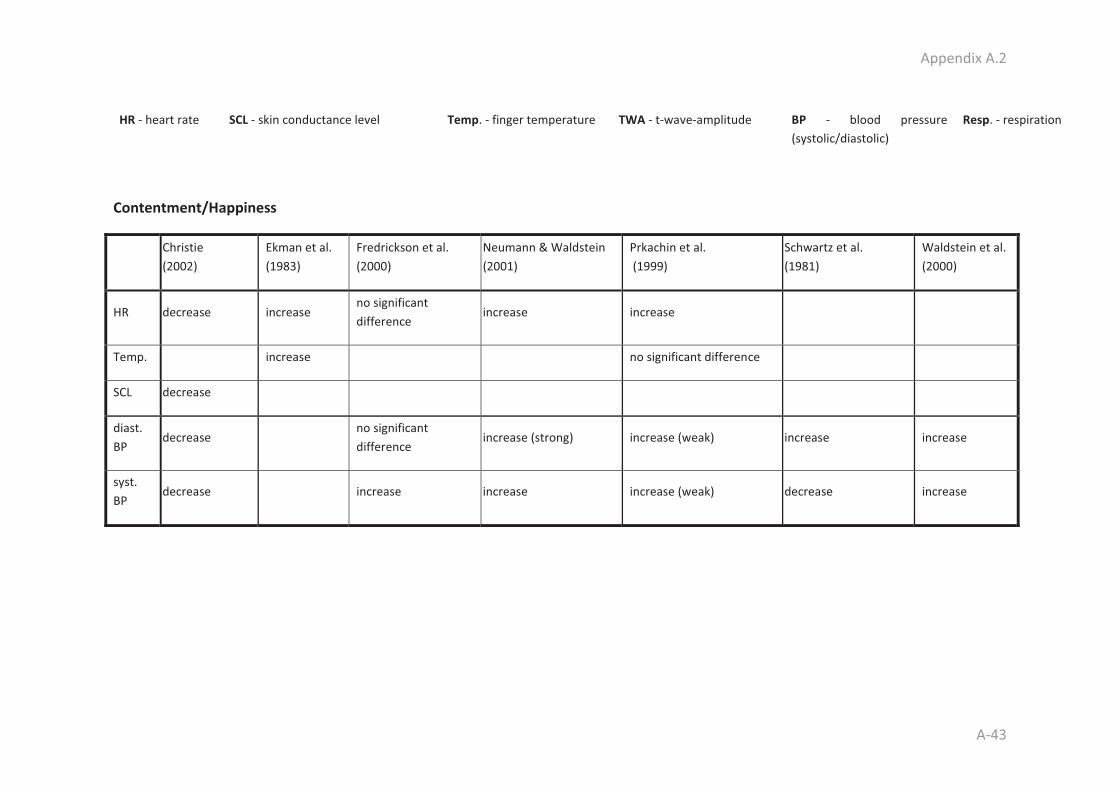
Appendix A.2
A-43
HR - heart rate SCL - skin conductance level Temp. - finger temperature TWA - t-wave-amplitude BP - blood pressure (systolic/diastolic)
Resp. - respiration
Contentment/Happiness
Christie (2002)
Ekman et al. (1983)
Fredrickson et al. (2000)
Neumann & Waldstein (2001)
Prkachin et al. (1999)
Schwartz et al. (1981)
Waldstein et al. (2000)
HR decrease increase no significant difference
increase increase
Temp. increase no significant difference
SCL decrease
diast. BP
decrease no significant difference
increase (strong) increase (weak) increase increase
syst. BP
decrease increase increase increase (weak) decrease increase
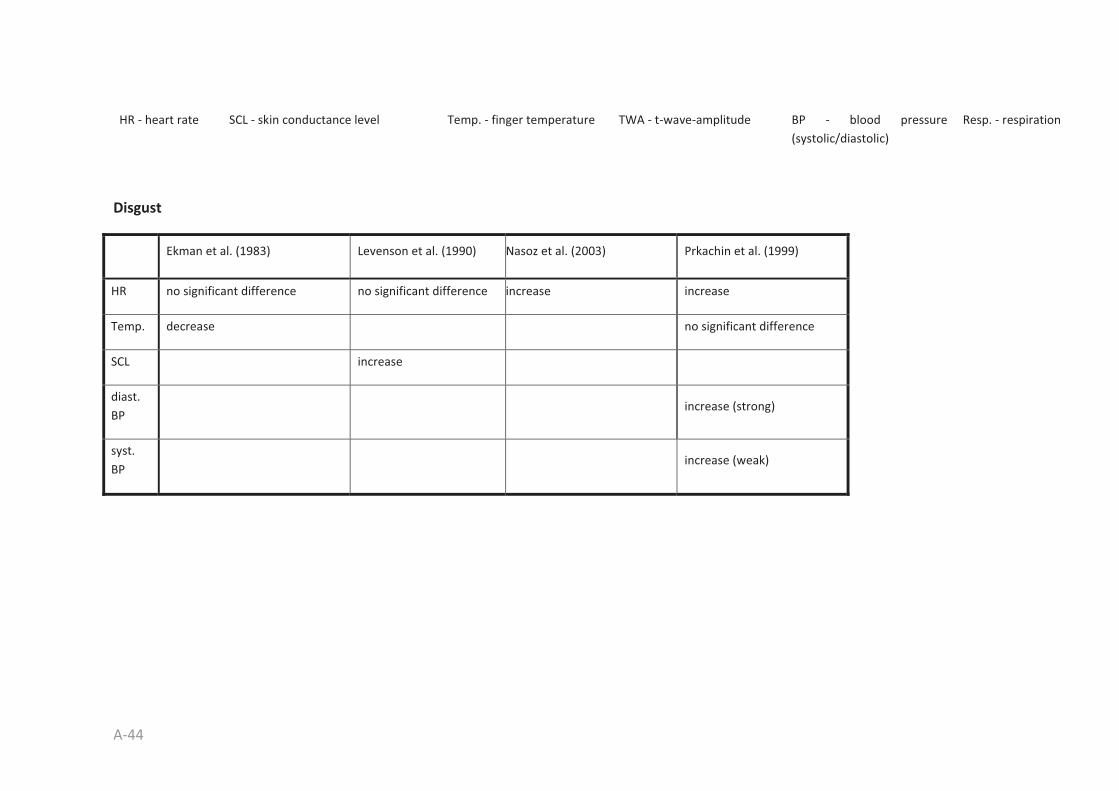
A-44
HR - heart rate SCL - skin conductance level Temp. - finger temperature TWA - t-wave-amplitude BP - blood pressure (systolic/diastolic)
Resp. - respiration
Disgust
Ekman et al. (1983) Levenson et al. (1990) Nasoz et al. (2003) Prkachin et al. (1999)
HR no significant difference no significant difference increase increase
Temp. decrease no significant difference
SCL increase
diast. BP
increase (strong)
syst. BP
increase (weak)

Appendix A.2
A-45
HR - heart rate SCL - skin conductance level Temp. - finger temperature TWA - t-wave-amplitude BP - blood pressure (systolic/diastolic)
Resp. - respiration
Amusement
Christie (2002)
HR decrease
SCL increase
diast. BP increase
syst. BP increase
Surprise
Ekman et al. (1983)
HR increase
Temp. no significant difference
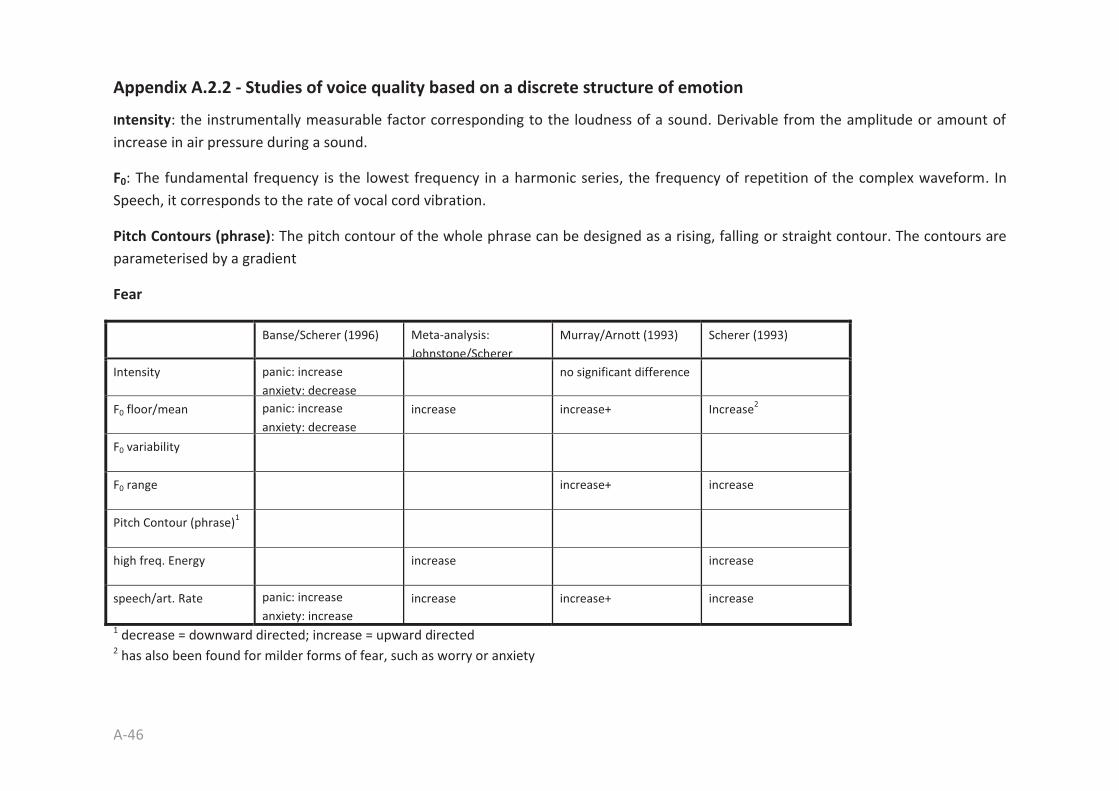
A-46
Appendix A.2.2 - Studies of voice quality based on a discrete structure of emotion
Intensity: the instrumentally measurable factor corresponding to the loudness of a sound. Derivable from the amplitude or amount of increase in air pressure during a sound.
F0: The fundamental frequency is the lowest frequency in a harmonic series, the frequency of repetition of the complex waveform. In Speech, it corresponds to the rate of vocal cord vibration.
Pitch Contours (phrase): The pitch contour of the whole phrase can be designed as a rising, falling or straight contour. The contours are parameterised by a gradient
Fear
Banse/Scherer (1996) Meta-analysis: Johnstone/Scherer
Murray/Arnott (1993) Scherer (1993)
Intensity panic: increase anxiety: decrease
no significant difference
F0 floor/mean panic: increase anxiety: decrease
increase increase+ Increase2
F0 variability
F0 range increase+ increase
Pitch Contour (phrase)1
high freq. Energy increase increase
speech/art. Rate panic: increase anxiety: increase
increase increase+ increase
1 decrease = downward directed; increase = upward directed 2 has also been found for milder forms of fear, such as worry or anxiety

Appendix A.2
A-47
Anger
Banse/Scherer (1996)2 Burkhardt/Sendlmeier (2000)2
Meta-analysis: Johnstone/Scherer (2000)
Murray/Arnott (1993)
Scherer (1993)
Intensity hot anger: increase+ cold anger: increase
increase increase increase
F0 floor/mean hot anger: increase no increase3 increase increase+ increase cold anger: decrease
F0 variability increase increase
F0 range increase increase increase cold anger: increase
Pitch Contour (phrase)1 decrease decrease
high freq. Energy
increase increase
speech/art. rate
hot anger: increase increase increase increase increase hot anger: increase cold anger: increase
1 decrease = downward directed; increase = upward directed 2 In Banse/Scherer (1996) and in Burkhardt/Sendlmeier (2000), basic emotions are split into pairs, differing by the extent of arousal. 3 "In combination with a fast speech rate, a raised mean pitch leads to a lower identification rate of anger. It seems that this combination of features tends to express cold anger, a category not explicitly defined in this exp." (Burkhardt/Sendlmeier (2000))

A-48
Sadness
Banse/Scherer (1996) Burkhardt/Sendlmeier (2000)
Meta-analysis: Johnstone/Scherer (2000)
Murray/Arnott (1993) Scherer (1993)
Intensity high2: increase low: decrease
decrease decrease decrease
F0 floor/mean high2: increase low: decrease
High2: increase low: decrease
decrease decrease decrease
F0 variability high2: decrease low: decrease
decrease
F0 range high2: decrease low: decrease
decrease decrease decrease
Pitch Contour (phrase)1 decrease decrease
high freq. Energy
decrease decrease
speech/art. rate3
high2: decrease low: decrease+
high2: decrease low: decrease+
decrease decrease decrease
1 decrease = downward directed; increase = upward directed 2 high = crying despair, low = quiet sorrow; 3 most studies have investigated the low-arousal form

Appendix A.2
A-49
Stress Amusement
Meta-analysis:
Johnstone/Scherer (2000)
Aubergé (2003)
Intensity increase Intensity increase
F0 floor/mean increase F0 floor/mean no significant difference
F0 variability F0 variability
F0 range F0 range increase
Pitch Contour (phrase)
Pitch Contour (phrase)
high freq. Energy
high freq. Energy
speech/art. rate
speech/art. rate no significant difference
A-50
Joy/Elation
Banse/Scherer (1996)
Burkhardt/Sendlmeier (2000)
Meta-analysis: Johnstone/Scherer (2000)
Murray/Arnott (1993)
Scherer (1993)
Intensity High1: increase low2: decrease
increase increase increase
F0 floor/mean high1: increase
low2: decrease
high1: increase low2: no difference
increase increase+ increase
F0 variability increase increase
F0 range High1: increase increase increase+ increase
Pitch Contour (phrase)
high freq. Energy
increase
speech/art. rate
low2: increase High1: increase low2: decrease
increase controversial increase
1 high = joy/elation (German “Freude”), 2 low = happiness (German “Zufriedenheit”, “Wohlbefinden”), see Burkhardt/Sendlmeier (2000) for more speech variables

Appendix A.2
A-51
Boredom Interest
Banse/Scherer (1996)
Meta-analysis: Johnstone/Scherer (2000)
Banse/Scherer (1996)
Intensity decrease Intensity
F0 floor/mean decrease decrease F0 floor/mean
F0 variability decrease F0 variability
F0 range decrease F0 range
Pitch Contour (phrase)
Pitch Contour (phrase)
high freq. Energy
high freq. Energy
speech/art. rate decrease decrease speech/art. rate increase
A-52
Shame Pride
Banse/Scherer (1996) Banse/Scherer (1996)
Intensity decrease Intensity
F0 floor/mean decrease F0 floor/mean decrease
F0 variability F0 variability
F0 range F0 range
Pitch Contour (phrase) Pitch Contour (phrase)
high freq. Energy high freq. Energy
speech/art. rate decrease speech/art. rate

Appendix A.2
A-53
Disgust Contempt
Murray/Arnott (1993) Banse/Scherer (1996) Banse/Scherer
1996
Intensity decrease
decrease Intensity decrease
F0 floor/mean decrease + decrease F0 floor/mean decrease
F0 variability F0 variability
F0 range increase F0 range
Pitch Contour (phrase)
Pitch Contour (phrase)
high freq. Energy
high freq. Energy
speech/art. rate
decrease+ speech/art. rate


Appendix A.2
A-55
Appendix A.2.3 - Physiology and the dimensional model
Source: Bradley et al. (1993)
Results support a multi-dimensional bipolar approach to defining the structure of emotion
I. EMG
In the study of Bradley et al. EMG and valence correlations were very promising. Zygomatic EMG (ZEMG), which measures muscle activity at the corners of the mouth, correlated up to .9 with the valence dimension. Corrugator EMG (CEMG), which measures muscle activity of the eyebrows, showed a strong correlation, too, which was -.9.
Bradley et al. discovered gender specific issues. The significance rates for zygomatic EMG was 66% for women, compared to only 25% for men. Women appear to express their emotions much more via the face then men. This could be a reason for the differences reported.
ZEMG ZEMG ZEMG
CEMG CEMG CEMGvalence
arousal
ZEMG ZEMG ZEMG
CEMG CEMG CEMGvalence
arousal
A-56
II. Heart Rate
Heart rate showed fairly strong correlations with valence, ranging from .5 up to .76. This indicates that heart rate could be a very good predictor for the valence state of a person.
HR HR HRvalence
arousal
HR HR HRvalence
arousal
III. Skin conductance level (r = 0.81)
Skin conductance level is known to be a measure of pure sympathetic activation and therefore always expected to correlate strongly with a person’s arousal. Bradley et al. reported strong correlations of .81, but again did encounter gender differences. Here, men’s data were more often significant (46%) than women’s data (16%).
valence
arousalSCL
SCL
SCL
valence
arousalSCL
SCL
SCL

Appendix A.2
A-57
Appendix A.2.4 - Speech parameters and the dimensional model
Source: Schröder et al. (2001)9
The results support a multi-dimensional bipolar approach to defining the structure of emotion.
Due to a strong over-representation of female in comparison to male voice material, more and stronger correlates between voice quality and emotion dimensions have resulted for the female voice.
See Schröder et al. (2001) also for voice correlates of the dimension of power. Reported below are the dimensions of arousal and valence.
I. F0 mean and range correlate positively with the arousal dimension.
valence
arousalF0
F0
F0
valence
arousalF0
F0
F0
9 Results mainly congruent with Pereira (2000)

A-58
II. Intensity correlates positively with both, arousal and valence.
valence
arousalI
I II
I
valence
arousalI
I II
I
III. Steepness of F0 rises (F0r) and falls (F0f) in Hz/sec correlate positively with arousal and negatively with valence.
valence
arousalF0f, F0r
F0fF0f, F0r
F0f, F0r
F0fvalence
arousalF0f, F0r
F0fF0f, F0r
F0f, F0r
F0f

Appendix A.2
A-59
Appendix A.2.5 - Emotion recognition in affect bursts
Source: Schröder, M. (2000).
“Affect bursts” are very short utterances expressed spontaneously at sudden events.
The table below shows means and standard deviations (in parentheses) for correct categorical ratings of ten emotions, on the three seven-point scales
- arousal (from 1 = calm to 7 = excited)
- valence (from -3 = negative to 3 = positive)
- control (from 1 = subordinate to 7 = dominant).
Only reliable results (recognition rate >= 80%) are being reported here.
There were no reliable results for anger.
For further information see Schröder (2000).

A-60
Perceived Emotion (Recognition Rate)
Affect Burst Class Arousal Valence Control
admiration (90-91%) Wow
boah
4.8 (1.1) 1.6 (0.9) 4.5 (1.4)
threat (80-81%) Hey
Growl
5.0 (1.1) -1.3 (1.1) 5.5 (1.2)
disgust (92-100%) Buäh
igitt
ih
5.0 (1.1) -2.0 (0.9) 4.0 (1.2)
elation (80-100%) Yippie
Hurra
6.1 (0.8) 2.4 (0.8) 5.0 (1.2)
boredom (81-83%) Yawn
Hmm
2.5 (1.2) -0.8 (1.1) 4.2 (1.0)
relief (85-98%) Sigh
uff
puh
4.1 (1.4) 1.0 (1.3) 3.9 (1.1)
startle (80-92%) rapid breath intake
ah
6.0 (0.9) -1.5 (0.9) 2.9 (1.2)
worry (85-96%) Oje
oh-oh
4.0 (1.4) -1.5 (0.9) 3.1 (1.3)
contempt (95-100%) Pha
Tse
3.9 (1.2) -0.9 (1.5) 5.3 (1.2)

Appendix A.2
A-61
References as used in Appendix A.2
ACII, 2005. First International Conference on Affective Computing and Intelligent Interaction. http://www.affectivecomputing.org/2005. Accessed 22 July 2005.
André E., Klesen M., Gebhart P., Allen, S, Rist T., 2000. Integrating models of personality and emotions into lifelike characters. In: Lecture Notes In Computer Science, Affective interactions: towards a new generation of computer interfaces. Springer-Verlag New York, 150 -165.
Anttonen, J. & Surakka, V., 2005. Emotions and Heart Rate while Sitting on a Chair. In CHI ’05 conference proceedings, pp. 491-499. New York: ACM Press.
Arafa Y., Botelho L.M., Bullock A., Figueiredo P., Gebhard P., Höök K., Mamdani E. H., Paiva A., Petta P., Sengers P., Vala M., 2004. Affective Interactions for in Real-time Applications: the SAFIRA Project. KI – Künstliche Intelligenz 1/2004.
Aubergé, V., Cathiard, M., 2003. Can we hear the prosody of smile? Speech Communication, Volume 40, Issues 1-2, Elsevier Science B.V., 87-97.
Ax, A., 1953. The physiological differentiation between fear and anger in humans. In Psychosomatic Medicine 55 (5), The American Psychosomatic Society, 433-442.
Bamidis, P.D., Papadelis, C., Kourtidou-Papadeli, C., Vivas, A., 2004. Affective computing in the era of contemporary neurophysiology and health informatics. Interacting with Computers, Volume 16, Issue 4; 715–721.
Banse, R. & Scherer, K. R., 1996. Acoustic Profiles in Vocal Emotion Expression. In Journal of Personality and Social Psychology 70 (3), American Psychological Association, Inc, 614-636.
Bradley, M., Greenwald, M. K. & Hamm, A. O., 1993. Affective Picture Processing. In Birbaumer, N. & Öhman, A. (Eds.): The Structure of Emotion, Toronto, Hogrefe & Huber Publishers, 48-65.
Bradley, M., Lang, P., 1994. Measuring emotion: The Self-Assessment Manikin and the semantic differential. Journal of Behavior Therapy and Experimental Psychiatry 25, 49–59.
Branco, P., Firth, P., Encarnaçao, L. M. & Bonato, P., 2005. Faces of Emotion in Human-Computer Interaction. In CHI ’05 extended abstracts, New York: ACM Press, 1236-1239.
Burkhardt, F. & Sendlmeier, W. F., 2000. Verification of Acoustical Correlates of Emotional Speech using Formant-Synthesis. In ISCA Workshop on Speech and Emotion.
A-62
Cañamero, D., 1999. What Emotions are Necessary for HCI? Proceedings of the 8th International Conference on Human-Computer Interaction: Ergonomics and User Interfaces-Volume I, 838-842.
Carroll, J. M. & Olson, J. R., 1988. Mental Models in Human-Computer Interaction. In Helander, M. [Ed.]: Handbook of Human-Computer Interaction. Amsterdam: Elsevier.
Carroll, J. M. & Russell, J. A., 1996. Do Facial Expressions Signal Specific Emotions? Judging Emotion From the Face in Context. In Journal of Personality and Social Psychology 70 (2), pp. 205-218.
Christie, I.C., 2002. Multivariate Discrimination of Emotion-Specific Autonomic Nervous System Activity. MSc Thesis, Virginia Polytechnic Institute and State University.
Cockton, G., 2002. From doing to being: bringing emotion into interaction. Interacting with Computers 14 pp. 89-92.
Cockton, G., 2004. Doing to Be: Multiple Routes to Affective Interaction. Interacting with Computers 16.
Cowie, R., Douglas-Cowie, E., Apolloni, B., Taylor, J., Romano, A., Fellenz, W. , 1999. What a neural net needs to know about emotion words. In CSCC'99 Proceedings, pp. 5311-5316.
Davidson R. J., 2003. Seven sins in the study of emotion: Correctives from affective neuroscience. Brain and Cognition 52 (2003), 129-132.
Davis W. J., Rahman M. A., Smith L. J., Burns A., Senecal L., McArthur D., Halpern J. A., Perlmutter A., Sickels W., Wagner W., 1995. Properties of human affect induced by static color slides (IAPS): dimensional, categorical and electromyographic analysis. In Biological Psychology 41, pp. 229-253. Elsevier Science.
Desmet, P., 2002. Designing Emotions. Doctoral dissertation. Delft University of Technology.
Detenber, B. H., Simons, R. F. & Bennett, G. G., 1998. Roll 'em!: The Effects of Picture Motion on Emotional Responses. In Journal of Broadcasting and Electronic Media 21, pp. 112-126.
Ekman, P., 1992. An argument for basic emotions. In Cognition and Emotion 6 (3/4), Lawrence Erlbaum limited.
Ekman, P., Friesen, W., 1976. Pictures of facial affect. Palo Alto, California: Consulting Psychologists Press.

Appendix A.2
A-63
Ekman, P., Levenson, R. W. & Friesen, W., 1983. Autonomic Nervous System Activity Distinguishes among Emotions. In Science 221. The American Association for Advancement of Science.
Feldman Barrett, L., Russell, J. A., 1998. Independence and Bipolarity in the Structure of Current Affect. In Journal of Personality and Social Psychology 74 (4), Educational Publishing Foundation., 967-984.
Fredrickson, B.L., 1998. What Good Are Positive Emotions? Review of General Psychology, Vol. 2, No. 3, Educational Publishing Foundation, 300 – 319.
Fredrickson, B. L., Levenson, R. W., 1998. Positive Emotions Speed Recovery from the Cardiovascular Sequelae of Negative Emotions. In Cognition and Emotion 12 (2), Psychology Press Ltd., 191-220.
Fredrickson, B. L., Mancuso, R. A., Branigan, C., Tugade, M. M., 2000. The Undoing Effect of Positive Emotions. In Motivation and Emotion 24 (4), Plenum Publishing Corporation, 237-257.
Frijda, N., 1986. The Emotions. Studies in Emotion and Social Interaction. New York: Cambridge University Press.
Haag A., Goronzy S., Schaich P., Williams J., 2004. Emotion Recognition Using Bio-sensors: First Steps towards an Automatic System. In André et al (Eds.): Affective Dialogue Systems, Proceedings of the Kloster Irsee Tutorial and Research Workshop on Affective Dialogue Systems, Lecture Notes in Computer Science 3068, Springer-Verlag Berlin, Heidelberg, New York pp. 36-48.
Herbon A., Peter C., Markert L., van der Meer E., Voskamp J., 2005. Emotion Studies in HCI – a New Approach. Proceedings of the 2005 HCI International Conference, Las Vegas, 2005.
Hudlicka, E., 2003. To feel or not to feel: The role of affect in human–computer interaction. International Journal of Human-Computer Studies, 59(1):1–32.
HUMAINE, 2005. The Human-Machine Network of Emotion, European Union IST project contract no. 507422, http://emotion-research.net. Accessed 22 July 2005.
Johnstone, T., Scherer, K. R., 2000. Vocal communication of emotion. In M. Lewis & J. Haviland-Jones (Eds.), Handbook of Emotions, Second Edition. New York: Guilford Press., 220-235.
Jordan, P. 2002. Designing Pleasurable Products: An Introduction to the New Human Factors. CRC Press.
Klein, J., Moon, Y., Picard, R.W., 2002. This computer responds to user frustration: theory, design, and results. Interacting with Computers 14 (2), 119–140.

A-64
Kort B., Reilly B., Picard R.W., 2001. An Affective Model of Interplay between Emotions and Learning: Reengineering Educational Pedagogy-Building a Learning Companion. Proceedings of the IEEE International Conference on Advanced Learning Technologies, IEEE, 43-46.
Küstner D., Tato R., Kemp T., Meffert B., 2004. Towards Real Life Applications in Emotion Recognition; Comparing Different Databases, Feature Sets, and Reinforcement Methods for Recognizing Emotions from Speech. In André et al (Eds.): Affective Dialogue Systems, Proceedings of the Kloster Irsee Tutorial and Research Workshop on Affective Dialogue Systems, Lecture Notes in Computer Science 3068, Springer-Verlag Berlin, Heidelberg, New York.
Lang, P. J., 1980. Behavioral treatment and bio-behavioral assessment: computer applications. In Sidowski, J.B., Johnson, J.H. & Williams, T.A. (Eds.): Technology in Mental Health Care Delivery Systems, Ablex, Norwood, NJ, 119–137.
Laukka P., Juslin P. N., Bresin R., 2005. A dimensional approach to vocal expression of emotion. Cognition and Emotion 2005, 19 (5), Psychology Press, 633-653.
Lavoie, K. L, Miller, S. B., Conway, M. & Fleet, R. P., 2001. Anger, negative emotions and cardiovascular reactivity during interpersonal conflict in women. In Journal of Psychosomatic Research 51, Elsevier Science Inc., 503-512.
Levenson R.W., Ekman P., Friesen W.V., 1990. Voluntary facial action generates emotion-specific autonomic nervous system activity. Psychophysiology. 1990 Jul; 27(4), 363-84.
Mader, S., Peter, C., Göcke, R., Schultz, R., Voskamp, J., Urban, B., 2004. A Freely Configurable, Multi-modal Sensor System for Affective Computing. In André et al (Eds.): Affective Dialogue Systems, Proceedings of the Kloster Irsee Tutorial and Research Workshop on Affective Dialogue Systems, Lecture Notes in Computer Science 3068, Springer-Verlag Berlin, Heidelberg, New York 313-318.
Marcus A., 2003. The emotion commotion. Interactions, Volume 10, Issue 6. ACM Press New York 28-34.
Morgan, R. L., Heise, D., 1988. Structure of Emotion. In Social Psychology Quarterly 51 (1), American Sociological Association, 19-31.
Muller, M., 2004. Multiple paradigms in affective computing. Interacting with Computers 2004; 759–768.
Murray I. R., Arnott J. L., 1993. Toward the Simulation of Emotion in Synthetic Speech: A Review of the Literature on Human Vocal Emotion., Journal of the Acoustical Society of America, 93(2), February 1993, 1097-1108.

Appendix A.2
A-65
Nasoz, F., Alvarez, K., Lisetti, C. L., Finkelstein, N., 2003. Emotion Recognition from Physiological Signals for Presence Technologies. International Journal of Cognition, Technology, and Work; Vol. 6(1).
Neumann, S. A. & Waldstein, S. R., 2001. Similar patterns of cardiovascular response during emotional activation as a function of affective valence and arousal and gender. In Journal of Psychosomatic Research 50, pp. 245-253.
Norman, D (2004). Emotional Design: Why We Love (Or Hate) Everyday Things, Basic Books.
Ortony, A., Clore, G. L., Collins, A., 1988. The Cognitive Structure of Emotions. Cambridge, England: Cambridge University Press.
Palomba, D., Sarlo, M., Agrilli, A., Mini, A. & Stegagno, L., 1999. Cardiac response associated with affective processing of unpleasant film stimuli. International Journal of Psychophysiology 36, pp. 45-57.
Palomba, D., Stegagno, L., 1993. Physiology, Perceived Emotion and Memory: Responding to Film Sequences. In Birbaumer, N. & Öhman, A. (Eds.): The Structure of Emotion, Hogrefe & Huber Publishers, 158-168.
Peter C., Blyth, G., 2005. The Role of Emotions in Human-Computer Interaction. A workshop held at the 2005 HCI conference, Edinburgh. Proceedings of the HCI 2005 Conference, vol. 2. http://www.emotion-in-hci.net. Accessed 22 June 2005.
Peter, C., Ebert E., Beikirch, H., 2005. A Wearable Multi-Sensor System for Mobile Acquisition of Emotion-Related Physiological Data. Proceedings of the 1st International Conference on Affective Computing and Intelligent Interaction, Beijing 2005. Springer Verlag Berlin, Heidelberg, New York.
Pereira, C., 2000. Dimensions of Emotional Meaning in Speech. In ISCA Workshop on Speech and Emotion.
Picard, R.W., 1997. Affective Computing. M.I.T. Press, Cambridge, MA.
Picard, R.W., 1999. Affective Computing for HCI. Proceedings of the 8th International Conference on Human-Computer Interaction: Ergonomics and User Interfaces-Volume I. Lawrence Erlbaum Associates, Inc.
Picard, R.W., Klein, J., 2002. Computers that recognise and respond to user emotion: theoretical and practical implications. Interacting with Computers 14 (2), 141–169.
Plutchik, R., 1980. A general psychoevolutionary theory of emotion. In R. Plutchik & H. Kellerman (Eds.), Emotion: Theory, research, and experience: Vol. 1. Theories of emotion, New York: Academic, 3-33.

A-66
Prkachin, K. M., Williams-Avery, R. M., Zwaal, C. & Mills, D. E., 1999. Cardiovascular changes during induced emotion: An application of Lang's theory of emotional imagery. In Journal of Psychosomatic Research 47 (3), Elsevier Science Inc., 255-267.
Reeves B., Nass C., 1996. The Media Equation. Center for the Study of Language and Information.
Ritz, T. & Thöns, M., 2002. Airway response of healthy individuals to affective picture series. In International Journal of Psychophysiology 46, Elsevier Science Inc., 67-75.
Rogers, Y., 2004. New Theoretical approaches for Human-Computer Interaction. Annual Review of Information, Science and Technology, 38, 87-143.
Roseman, I.J., Antoniou, A.A., Jose, P.E., 1996. Appraisal determinants of emotions: Constructing a more accurate and comprehensive theory. Cognition and Emotion, 10(3), pp 241-277.
Russell, J. A., 1980. A Circumplex Model of Affect. In Journal of Personality and Social Psychology 39, Elsevier Science Inc., 1161-1178.
Russell, J. A., 1983. Pancultural Aspects of the Human Conceptual Organization of Emotions. In Journal of Personality and Social Psychology 45 (6), American Psychological Association, Inc., 1281-1288.
Russell J. A., 1991. Culture an the categorization of emotions. Psychological Bulletin, 110, 426-450.
Russell, J. A., 1994. Is there universal recognition of emotion from facial expression? A review of the cross-cultural studies. In Psychological Bulletin 115, Elsevier Science Inc., 102-141.
Russell, J. A., 2003. Core Affect and the Psychological Construction of Emotion. In Psychological Review 110 (1), American Psychological Association, Inc.,145-172.
Russell, J. A., Feldman Barrett, L., 1999. Core Affect, Prototypical Emotional Episodes, and Other Things Called Emotion: Dissecting the Elephant. In Journal of Personality and Social Psychology 76 (5), American Psychological Association, 805-819.
Russell, J. A., Lewicka, M. & Niit, T., 1989. A Cross-Cultural Study of a Circumplex Model of Affect. In Journal of Personality and Social Psychology 57 (5), American Psychological Association, Inc., 848-856.
Sabini J., Silver M., 2005. Ekman’s basic emotions: Why not love and jealousy? Cognition and Emotion 2005, 19 (5) Psychology Press, 693-712.
Sasse, M. A., 1997. Eliciting and Describing Users’ Models of Computer Systems. PhD Thesis, School of Computer Science, University of Birmingham.
Appendix A.2
A-67
Scheirer, J., Fernandez, R., Klein, J., Picard, R.W., 2002. Frustrating the user on purpose: a step toward building an affective computer. Interacting with Computers 14 (2), 93–118.
Scherer, K. R., 1984. On the nature and function of emotion: A component process approach. In K.R. Scherer & P. Ekman (Eds.), Approaches to emotion. Hillsdale, NJ: Lawrence Erlbaum, 293-318.
Scherer, K. R., 1993. Studying the emotion-antecedent appraisal process: An expert system approach. Cognition and Emotion, 7, 325-355.
Scherer, K. R., 1994. Toward a concept of "modal emotions". In P. Ekman & R. J. Davidson (Eds.), The nature of emotion: Fundamental questions. New York/Oxford: Oxford University Press, 25-31.
Scherer, K. R., 2003. Vocal communication of emotion: A review of research paradigms. In Speech Communication 40, Elsevier Science Inc.,227-256.
Scherer, T. M., 2000. Stimme, Emotion und Psyche - Untersuchungen zur emotionalen Qualität der menschlichen Stimme, PhD Thesis. Marbug University.
Schimmack U., 2005. Response latencies of pleasure and displeasure ratings: Further evidence for mixed feelings. Cognition and Emotion 2005, 19 (5), Psychology Press, 671-691.
Schröder, M., 2000. Experimental Study of Affect Bursts. In ISCA Workshop on Speech and Emotion.
Schröder, M., Cowie, R., Douglas-Cowie, E., Westerdijk, M. & Gielen, S., 2001. Acoustic Correlates of Emotion Dimensions in View of Speech Synthesis. Proc. Eurospeech 2001, Aalborg, Vol. 1, pp. 87-90.
Schwartz, G. E., Weinberger, D.A. and Singer, J.A., 1981. Cardiovascular differentiation of happiness, sadness, anger and fear following imagery and exercise. Psychosomatic Medicine, 43, pp. 343 –364.
Sinha, R., Lovallo, W.R., & Parsons, O.A., 1992, Cardiovascular differentiation of emotions. Psychosomatic Medicine, 54, 422 - 435.
Västfjäll, D., Friman, M., Gärling, T. & Kleiner, M. , 2000. The measurement of core affects: A Swedish self-report measure derived from the affect circumplex. In Göteborg Psychological Reports 30. Göteborg: Göteborg University.
Waldstein, S. R., Kop W. J., Schmidt L.A., Haufler A.J., Krantz D.S., Fox N.A., 2000. Frontal Electrocortical and cardiovascular reactivity during happiness and anger. Biological Psychology 55, 3-23.

A-68
Ward, R., Marsden, P., 2004. Affective Computing: problems, reactions and intentions. Interacting with Computers, Volume 16, Issue 4, 707–713.
Wierzbicka, A. , 1992. Talking about Emotions: Semantics, Culture, and Cognition. In Cognition and Emotion 6 (3/4). Lawrence Erlbaum limited.
Wilson, G., Sasse, A., 2004. From doing to being: getting closer to the user experience. Interacting with Computers, Volume 16, Issue 4; 715–721.

Appendix B – Emotion descriptions This collection of emotion descriptions was assembled by the EmotionML sub-group of the W3C's MMI activity [SPA+ 11]. It considers categories, dimensions, appraisals, and action tendencies.
For further discussions of those please refer to the EmotionML working draft [SBB+ 11].
Category sets There are several suggestions for sets of emotion categories. Below is a summary of the most influential once.
Ekman's "big six" basic emotions These six terms are proposed by Paul Ekman [Ekman 72] as basic emotions with universal facial expressions. Ekman claims that these emotions are recognized and produced in all human cultures.
Term anger disgust fear happiness sadness surprised

B-2
Everyday emotion vocabulary These 17 terms are the results of a study by Cowie et al. [CDATR 99] investigating emotions that frequently occur in everyday life.
Term affectionate afraid amused angry bored confident content disappointed excited happy interested loving pleased relaxed sad satisfied worried

Appendix B – Emotion descriptions
B-3
OCC categories The 22 OCC categories are proposed by Ortony, Clore and Collins [OCC 88] as part of their appraisal model. See also OCC appraisals below.
Term admiration anger disappointment distress fear fears-confirmed gloating gratification gratitude happy-for hate hope joy love pity pride relief remorse reproach resentment satisfaction shame

B-4
FSRE categories The 24 FSRE categories are used in the study by Fontaine, Scherer, Roesch and Ellsworth [FSRE 07] investigating the dimensionality of emotion space. See also FSRE dimensions below.
Term Anger Anxiety being hurt compassion Contempt contentment Despair disappointment Disgust Fear Guilt Happiness Hate Interest irritation Jealousy Joy Love Pleasure Pride Sadness Shame Stress Surprise

Appendix B – Emotion descriptions
B-5
Frijda's categories This category set is included because according to Nico Frijda's proposal of action tendencies [Frij 86], these 12 categories are related to action tendencies, see below.
Term Description Anger related to action tendency 'agnostic' Arrogance related to action tendency 'approach' Desire related to action tendency 'approach' Disgust related to action tendency 'rejecting' Enjoyment related to action tendency 'being-with' Fear related to action tendency 'avoidance' Humility related to action tendency 'submitting' indifference related to action tendency 'nonattending' Interest related to action tendency 'attending' resignation related to action tendency 'submitting' Shock related to action tendency 'interrupting' Surprise related to action tendency 'interrupting'

B-6
Emotion dimension sets
Mehrabian's PAD dimensions Mehrabian [Mehr 96] proposed a three-dimensional description of emotion in terms of Pleasure, Arousal, and Dominance (PAD).
Term pleasure arousal dominance
FSRE dimensions The four emotion dimensions obtained in the study by Fontaine, Scherer, Roesch and Ellsworth [FSRE 07] investigating the dimensionality of emotion space. See also FSRE categories above.
Term Description valence also named evaluation or pleasantness potency also named control arousal also named activation unpredictability
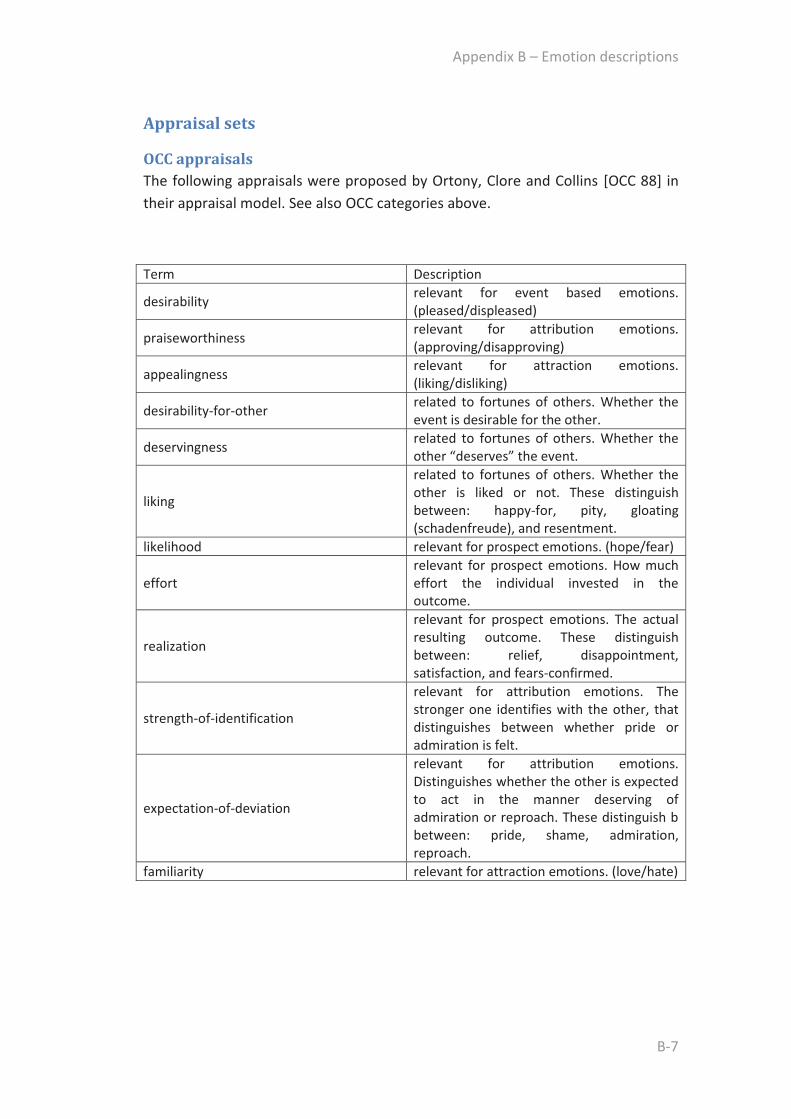
Appendix B – Emotion descriptions
B-7
Appraisal sets
OCC appraisals The following appraisals were proposed by Ortony, Clore and Collins [OCC 88] in their appraisal model. See also OCC categories above.
Term Description
desirability relevant for event based emotions. (pleased/displeased)
praiseworthiness relevant for attribution emotions. (approving/disapproving)
appealingness relevant for attraction emotions. (liking/disliking)
desirability-for-other related to fortunes of others. Whether the event is desirable for the other.
deservingness related to fortunes of others. Whether the other “deserves” the event.
liking
related to fortunes of others. Whether the other is liked or not. These distinguish between: happy-for, pity, gloating (schadenfreude), and resentment.
likelihood relevant for prospect emotions. (hope/fear)
effort relevant for prospect emotions. How much effort the individual invested in the outcome.
realization
relevant for prospect emotions. The actual resulting outcome. These distinguish between: relief, disappointment, satisfaction, and fears-confirmed.
strength-of-identification
relevant for attribution emotions. The stronger one identifies with the other, that distinguishes between whether pride or admiration is felt.
expectation-of-deviation
relevant for attribution emotions. Distinguishes whether the other is expected to act in the manner deserving of admiration or reproach. These distinguish b between: pride, shame, admiration, reproach.
familiarity relevant for attraction emotions. (love/hate)

B-8
Scherer's appraisals The following list of appraisals was proposed by Klaus Scherer as a sequence of Stimulus Evaluation Checks (SECs) in his Component Process Model of emotion [Scher 84], [Scher 99].
Term Description Novelty suddenness familiarity predictability Intrinsic pleasantness intrinsic-pleasantness Goal significance
relevance-person
Relevance to the concerns of the person him- or herself, e.g. survival, bodily integrity, fulfillment of basic needs, self-esteem
relevance-relationship
Relevance to concerns regarding relationships with others, e.g. establishment, continued existence and intactness of relationships, cohesion of social groups
relevance-social-order
Relevance to social order, e.g. sense of orderliness, predictability in a social environment including fairness & appropriateness
outcome-probability consonant-with-expectation goal-conduciveness urgency Coping potential
agent-self The event was caused by the agent him- or herself
agent-other The event was caused by another person
agent-nature The event was caused by chance or by nature
cause-intentional 0: caused by negligence, 1: caused intentionally
control Is the event controllable? power Power of the agent him- or herself
adjustment-possible Is adjustment possible to the agent's own goals?
Compatibility with standards
norm-compatibility Compatibility with external standards, such as norms or demands of a reference group
self-compatibility Compatibility with internal standards, such as the self ideal or internalized moral code

Appendix B – Emotion descriptions
B-9
EMA appraisals The following list of appraisals was compiled by Gratch and Marsella [GrMa 04] for their EMA model.
Term Description relevance desirability agency causal attribution -- who caused the event?
blame blame and credit -- part of causal attribution
likelihood unexpectedness urgency ego-involvement controllability part of coping potential changeability part of coping potential power part of coping potential adaptability part of coping potential
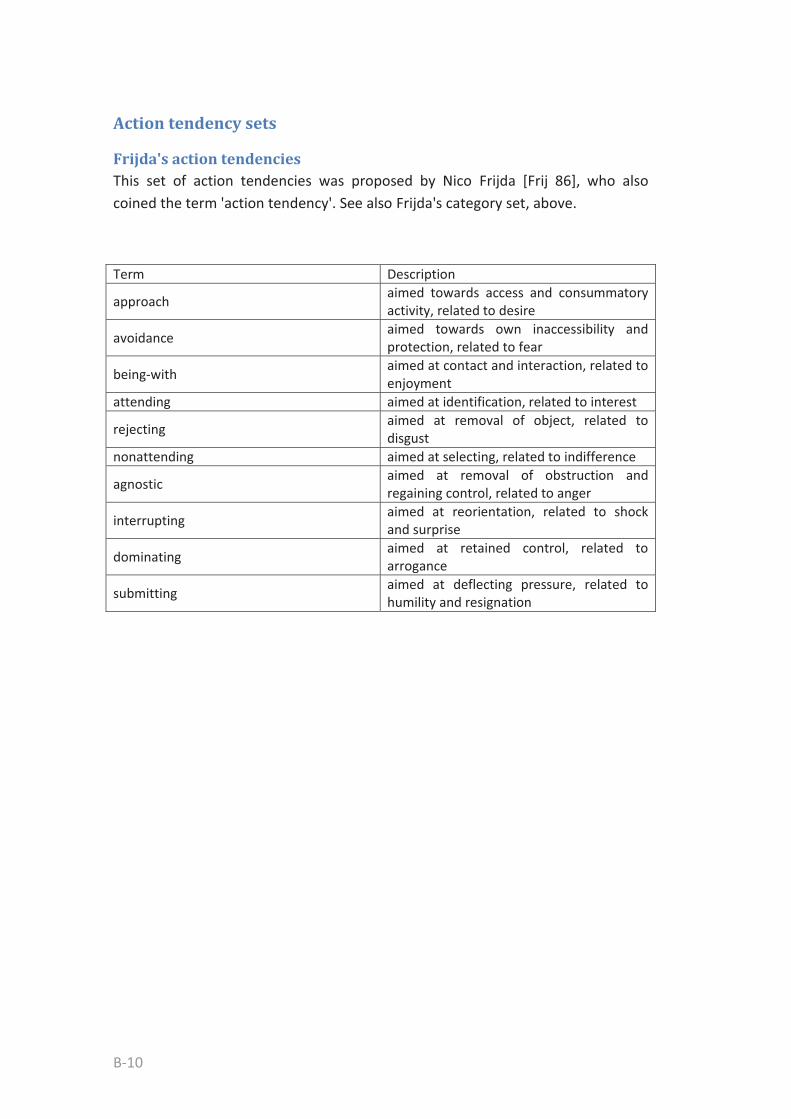
B-10
Action tendency sets
Frijda's action tendencies This set of action tendencies was proposed by Nico Frijda [Frij 86], who also coined the term 'action tendency'. See also Frijda's category set, above.
Term Description
approach aimed towards access and consummatory activity, related to desire
avoidance aimed towards own inaccessibility and protection, related to fear
being-with aimed at contact and interaction, related to enjoyment
attending aimed at identification, related to interest
rejecting aimed at removal of object, related to disgust
nonattending aimed at selecting, related to indifference
agnostic aimed at removal of obstruction and regaining control, related to anger
interrupting aimed at reorientation, related to shock and surprise
dominating aimed at retained control, related to arrogance
submitting aimed at deflecting pressure, related to humility and resignation

I hereby declare that this thesis has been written by myself and is result of my own work, and that it has not been submitted before to this or any other university for a degree.
Rostock, 31st October 2011 Christian Peter
