physiological reaction as an objective measure of presence
TRANSCRIPT

Physiological Reaction as an Objective Measure of Presence in
Virtual Environments
Michael Meehan
A dissertation submitted to the faculty of the University of North Carolina at Chapel Hill in partial
fulfillment of the requirements for the degree of Doctor of Philosophy in the Department of Computer
Science
Chapel Hill
2001
Approved by:
Advisor: Dr. Frederick P. Brooks Jr.
Reader: Dr. Anselmo Lastra
Reader: Dr. Robert McMurray

ii
2001
Michael John Meehan
ALL RIGHTS RESERVED

iii
ABSTRACT
Michael John Meehan
Physiological Reaction as an Objective Measure of Presence in Virtual Environments
(Under the direction of Dr. Frederick P. Brooks, Jr.)
Virtual environments (VEs) are one of the most advanced human-computer interface to date. A
common measure of the effectiveness of a VE is the amount of presence it evokes in users. Presence is
commonly defined as the sense of being there in a VE.
In order to study the effect that technological improvements such as higher frame rate, more visual
realism, and lower lag have on presence, we must be able to measure it. There has been much debate about the
best way to measure presence, and we, as presence researchers, have yearned for a measure that is
Reliable — produces repeatable results, both from trial to trial on the same subject and across subjects;
Valid — measures subjective presence, or at least correlates well with established subjective presence
measures;
Sensitive — is capable of distinguishing multiple levels of presence; and
Objective — is well shielded from both subject bias and experimenter bias.
We hypothesize that to the degree that a VE seems real, it will evoke physiological responses similar to
those evoked by the corresponding real environment, and that greater presence will evoke a greater response.
Hence, these responses serve as reliable, valid, sensitive, and objective measures of presence.
We conducted three experiments that support the use of physiological reaction as a reliable, valid,
sensitive, and objective measure of presence. We found that change in heart rate was the most sensitive of the

iv
physiological measures (and was more sensitive than most of the self-reported measures) and correlated best
among the physiological measures with the reported presence measures. Additionally, our findings showed that
passive haptics and fame rate are important for evoking presence in VEs. Inclusions of the 1.5-inch wooden
ledge into the virtual environment significantly increased presence. Also, for presence evoked: 30 FPS (frames
per second) > 20 FPS > 15 FPS. In conclusion, physiological reaction can be used as a reliable, valid, sensitive,
and objective measure of presence in stress-inducing virtual environments.

v
ACKNOWLEDGEMENTS
I would like to acknowledge the love and support of my family during this dissertation and through the
years. Without them, I could never have made it this far.
I would like to acknowledge the love, support, and sound mind of Anuja Antony, who helped keep me
focused, relaxed, happy, and productive through everything.
I would like to acknowledge the support and encouragement of Dr. Frederick P. Brooks, Jr. and
Professor Mary Whitton and the entire Effective Virtual Reality group at the University of North Carolina.
Without their brilliant ideas, suggestions, and support, this work would not have been possible.
I would also like to thank the rest of my committee Drs. Robert McMurray, Anselmo Lastra, Susan
Girdler, and Gary Bishop for their ideas, support, and encouragement.
I would like to acknowledge the hard work of Brent Insko, Sharif Razaque, Mark Harris, Betsy Ray,
Paul McLaruin, Paul Zimmons, Winnona Poulton, and Dana Pitely. Without them, the experiments could not
have been completed.
I would like to thank Gary Gaddy for his help on choosing the most appropriate statistical techniques.
I would like to thank the National Institutes of Health National Center for Research Resources (Grant
Number P41 RR 02170) and the University of North Carolina Dissertation Completion Fellowship for funding
this work.

1.1.1.2
vi
TABLE OF CONTENTS
LIST OF FIGURES .................................................................................................................................. viiiLIST OF TABLES .......................................................................................................................................ix
Chapter 1 Introduction.................................................................................................................................11.1 Presence and virtual environments......................................................................................................11.2 Measuring presence..............................................................................................................................21.3 Physiological measures of presence ....................................................................................................7
1.3.1 Reliability.......................................................................................................................................71.3.2 Validity.........................................................................................................................................101.3.3 Sensitivity and multi-level sensitivity.........................................................................................111.3.4 Objectivity....................................................................................................................................141.3.5 Summary and discussion .............................................................................................................15
1.4 Physiological reactions as between-subjects measures ....................................................................161.5 The results of the studies ....................................................................................................................19
1.5.1 Effect of multiple exposures on presence (Multiple Exposures) ...............................................201.5.2 Effect of passive haptics on presence (Passive Haptics)............................................................201.5.3 Effect of frame rate on presence (Frame Rate)...........................................................................21
1.6 Future work.........................................................................................................................................22
Chapter 2 Related work .............................................................................................................................242.1 Defining and describing presence explicitly......................................................................................242.2 Previous presence experiments ..........................................................................................................31
2.2.1 Slater et al. ...................................................................................................................................312.2.2 Other presence studies.................................................................................................................40
2.3 Measuring physiological correlates to a virtual environment experience .......................................43
Chapter 3 Experimental design.................................................................................................................463.1 Research question ...............................................................................................................................463.2 Our environment and physiological reaction as a measure of presence..........................................473.3 The measures.......................................................................................................................................483.4 Reliability, validity, multi-level sensitivity, objectivity, and our hypotheses....................................50
3.4.1 Discussion of hypotheses ............................................................................................................543.5 Elements of the experimental design common to all studies.............................................................563.6 Differences in experimental design....................................................................................................60
3.6.1 Experimental design: Effect of multiple exposure on presence (Multiple Exposures).............613.6.2 Experimental design: Effect of passive haptics on presence (Passive Haptics)........................613.6.3 Experimental design: Effect of frame rate on presence (Frame Rate).......................................63
Chapter 4 Discussion of results .................................................................................................................664.1 Overview of statistics..........................................................................................................................664.2 Variables .............................................................................................................................................674.3 Support for hypotheses .......................................................................................................................69
4.3.1 Reliability.....................................................................................................................................69
1.1.1.2
vii
4.3.2 Validity.........................................................................................................................................734.3.3 Sensitivity and multi-level sensitivity.........................................................................................754.3.4 Objectivity....................................................................................................................................824.3.5 Summary ......................................................................................................................................82
4.4 Other findings .....................................................................................................................................844.4.1 Physiological reactions as between-subjects measures..............................................................844.4.2 High-low threshold for presence questionnaire..........................................................................90
Bibliography.................................................................................................................................................95
Appendix A Stress response in human physiology .................................................................................99A. 1 Autonomic nervous system................................................................................................................99A. 2 Peripheral response to stress..........................................................................................................100
A. 2. 1 Heart rate response to stress ...................................................................................................101A. 2. 2 Electrodermal response to stress ............................................................................................102A. 2. 3 Skin temperature response to stress .......................................................................................103A. 2. 4 Relationship between electrodermal activity and skin temperature .....................................104
Appendix B Documents used with subjects ...........................................................................................105B. 1 University College London Presence Questionnaire.....................................................................105B. 2 Simulator Sickness Questionnaire ..................................................................................................110B. 3 Height Anxiety Questionnaire.........................................................................................................113B. 4 Height Avoidance Questionnaire....................................................................................................115B. 5 Informed Consent ............................................................................................................................117B. 6 Participant Health Questionnaire ..................................................................................................120B. 7 Questions asked in oral interview...................................................................................................121
Appendix C Experiment data..................................................................................................................122C. 1 Effect of multiple exposures on presence in virtual environments................................................124C. 2 Experiment data for effect of passive haptics on presence in virtual environments ....................127C. 3 Experiment data for effect of frame rate on presence in virtual environments ............................130

1.1.1.2
viii
LIST OF FIGURES
Figure 1.1. Side view of the virtual environment. ........................................................................................................4Figure 1.2. View of the 20 pit from the edge of the diving board. .............................................................................5Figure 1.3. A typical skin conductance reaction to the Pit Room. ...............................................................................7Figure 1.4. Heart Rate in the Passive Haptics study. ..................................................................................................12Figure 1.5. Average change in heart rate, after correcting for Loss of Balance, between Training Room and Pit
Room at 10, 15, 20, and 30 frames per second...................................................................................................13Figure 1.6. Between-subjects analysis: Response graph of ∆Heart Rate...................................................................19Figure 1.7. A subject drops a block into the virtual pit ..............................................................................................21Figure 2.1. Diagram of environment used for the Slater et al. s dynamic shadow experiment (simplified from
[Slater, 1995a]). ...................................................................................................................................................35Figure 3.1. Side view of the virtual environment. ......................................................................................................48Figure 3.2. Procomp+ device.......................................................................................................................................49Figure 3.3. View of the 20 pit from the edge of the diving board. ...........................................................................57Figure 3.4. A subject drops a block into the virtual pit. .............................................................................................57Figure 3.5. Flow of events for each subject. ...............................................................................................................58Figure 3.6. Subject with toes over 1.5-inch ledge.......................................................................................................59Figure 3.7. Subject with toes over visual ledge without 1.5-inch wooden ledge. .....................................................59Figure 4.1. Pattern of change over multiple exposures for ∆Heart Rate, ∆Skin Conductance, and ∆Skin
Temperature. ........................................................................................................................................................70Figure 4.2. Pattern of change over multiple exposures for Reported Presence, Reported Behavioral Presence,
and Observed Behavioral Presence .....................................................................................................................71Figure 4.3. ∆Heart Rate at the four frame rates. .........................................................................................................79Figure 4.4. ∆Skin Conductance at the four frame rates. .............................................................................................79Figure 4.5. ∆Skin Temperature at the four frame rates. .............................................................................................80Figure 4.6. Reported Behavioral Presence at the four frame rates.............................................................................81Figure 4.7. Reported Presence at the four frame rates................................................................................................81Figure 4.8. Reported Ease of Locomotion at the four frame rates. ............................................................................82Figure 4.9. Observed Behavioral Presence at the four frame rates. ...........................................................................82Figure 4.10. Analyzed between-subjects: ∆Heart Rate for each frame rate. .............................................................87Figure 4.11. Analyzed between-subjects: ∆Skin Conductance for each frame rate..................................................87Figure 4.12. Analyzed between-subjects: ∆Skin Temperature for each frame rate. .................................................88Figure 4.13. Analyzed between-subjects: Reported Presence for each frame rate....................................................89Figure 4.14. Analyzed between-subjects: Reported Behavioral Presence for each frame rate.................................89Figure 4.15. Analyzed between-subjects: Observed Behavioral Presence for each frame rate. ...............................90Figure A.1. A typical PQRST wave. .........................................................................................................................101Figure A.2. Placement of ECG leads.........................................................................................................................102Figure A.3. Typical Skin potential reaction (SPR -above) and skin conductance reaction (SCR -below). ...........103Figure A.4. Bipolar placement of electrodermal sensors and placement of temperature sensor. ...........................103

1.1.1.2
ix
LIST OF TABLES
Table 1.1. Differences in physiological measures between the Training Room and the Pit Room............................8Table 1.2. Significant order effects for each measure in each study............................................................................9Table 1.3. Means and significance for one-sample t-test. Also shown is the count of times that the measure was
below zero ............................................................................................................................................................18Table 3.1. The items scored from videotape for the Observed Behavioral Presence measure. ................................50Table 3.2. Frame rate orders with number of subjects per frame rate........................................................................63Table 3.3. Table of observed lag in our virtual environment for five frame rate. .....................................................64Table 4.1. Significant order effects for each measure in each study..........................................................................72Table 4.2. Significant order effects for each measure in Multiple Exposures...........................................................72Table 4.3. Significant order effects for each measure in Passive Haptics .................................................................72Table 4.4. Significant order effects for each measure in Frame Rate ........................................................................73Table 4.5. Table of correlations among all measures for all three studies.................................................................74Table 4.6. The differences in physiological reaction between the Training Room and the Pit Room were greater
than the differences among conditions................................................................................................................76Table 4.7. Best models for each of the measures in the Passive Haptics study.........................................................77Table 4.8. Statistical models for each measure in the Frame Rate study...................................................................78Table 4.9. Statistical significance for the differences among frame rates for each measure using the models in
Table 4.8...............................................................................................................................................................78Table 4.10. Analyzed between-subjects: correlations between the physiological and observed measures and the
reported measures. ...............................................................................................................................................85Table 4.11. Analyzed between-subjects: statistical models for each measure in Passive Haptics. ..........................86Table 4.12. Analyzed between-subjects: models when correcting for Level of Computer Game Playing for
∆Heart Rate in Passive Haptics. ..........................................................................................................................86Table 4.13. Analyzed between-subjects: the models in Frame Rate for each measure.............................................87Table 4.14. Analyzed between-subjects: differences among frame rates. .................................................................88Table 4.15. Comparison of results for Reported Presence using either [m5] or [m6] as high values. ................91Table 4.16. Comparison of results for Reported Behavioral Presence using either [m5] or [m6] as high
values....................................................................................................................................................................92Table 4.17. Table of correlations for the physiological measures with the reported measures using both [m6]
and [m5] as "high" values. ..................................................................................................................................93Table A.1. The effect of parasympathetic and sympathetic nervous system activity on various human organs ...100Table C.1. Table of variables with brief explanations..............................................................................................123Table C.2. Table of data for Multiple Exposures......................................................................................................126Table C.3. Table of data for Passive Haptics. ...........................................................................................................129Table C.4. Table of data for Frame Rate...................................................................................................................133

1.1.1.3
1
Chapter 1 Introduction
1.1 Presence and virtual environments
Virtual environments (VEs) are the most advanced human-computer interfaces yet developed.
Researchers, by the development of new methods, theories, and technologies, have endeavored to make
effective VEs. The definition of effectiveness changes based on the application of the VE. For flight
simulators, training transfer is important. For architectural walkthroughs, accurate perception of space is
important. For treatment of phobias and post-traumatic stress disorders, presence — evoking in patients the
feeling that they are near the source of their phobia or stress — is important [Hodges, 1994]. It is on this last
concept, presence, that this dissertation focuses.
Rothbaum and Hodges VE system for graded exposure treatment of acrophobia strives to bring
patients near the source of their phobias [Hodges, 1994]. They state that the user s sense of presence is the
defining factor in the [successful treatment of acrophobia]. We believe this is true for all phobia treatment
systems: the system must evoke presence in order to work. Such systems are useful as they allow much of the
effectiveness of in vivo exposure with the safety, convenience, and reduced cost of in-office therapy [Hodges,
1995]. To ensure the systems evoke presence in users, developers endeavor to build the best VEs possible:
stereo portrayal (as opposed to mono) in the headmounted display, realistic models and lighting, low lag, high
frame rate, etc.
VE developers, though, have limited time and resources, and these limitations force system design
choices. When making these choices, it is important for designers to ensure that the users still have a
compelling experience — that the VE still evokes a sense of presence. So they need to know what is important
for evoking presence in VEs: Is increasing the frame rate more important than stereo display in the
headmounted display (HMD)? Is it more important to have lower lag or a richer model? Is pixel density
(resolution) more important than field-of-view? Are dynamic shadows the key to making a VE convincing?

1.1.1.2
2
The answers to these questions may be different for every person and even for the same person at
different times. We believe, however, that a broad suite of thoughtfully constructed studies investigating the
effects of varying VE system parameters (lag, frame rate, realism) on presence would reveal rules of thumb for
what evokes presence for the general population. To find these rules, however, we need to be able to measure
presence, and the measure must be reliable, valid, multi-level sensitive, and objective. This dissertation details
the investigation of physiological reactions as such measures.
1.2 Measuring presence
The concept of presence is difficult to define, and becomes even more so when one tries.
Nevertheless, we attempt to define it here, and we discuss concepts and definitions of presence from the
literature in Chapter 2. We define presence as perceiving stimuli as one would perceive stimuli from the
corresponding real environment. The stimuli that the user perceives come from the VE in our experiments.
Since presence is a subjective condition, it has commonly been measured by self-reporting, either during the
session or afterwards. There has been vigorous debate as to how best to measure presence, and researchers
have yearned for a measure that is
Reliable — produces repeatable results, both from trial to trial on the same subject and across subjects;
Valid — measures subjective presence, or at least correlates well with established subjective presence
measures;
Multi-level sensitive — is capable of distinguishing multiple levels of presence; and
Objective — is well shielded from both subject bias and experimenter bias.
We attempted to create such a measure and report our findings here. We investigated physiological
reactions as measures of presence over multiple exposures, both on a single day and over multiple days. We
also investigated the measures in multiple presence conditions using passive haptics (a rough physical model
corresponding to the VE) and multiple frame rates (the number of times per second that the image in the
headmounted display is updated to reflect the user s current position). The highlights of this investigation are
presented in this chapter. A full discussion of the experimental design and measures are given in Chapter 3.
Detailed results are given in Chapter 4.

1.1.1.2
3
Our thesis is that
To the degree that a virtual environment evokes presence (as defined above), it will evoke
physiological responses similar to those evoked by the corresponding real environment, and greater presence
will evoke a greater response. Hence, these physiological responses can serve as reliable, valid, multi-level
sensitive, and objective measures of presence.
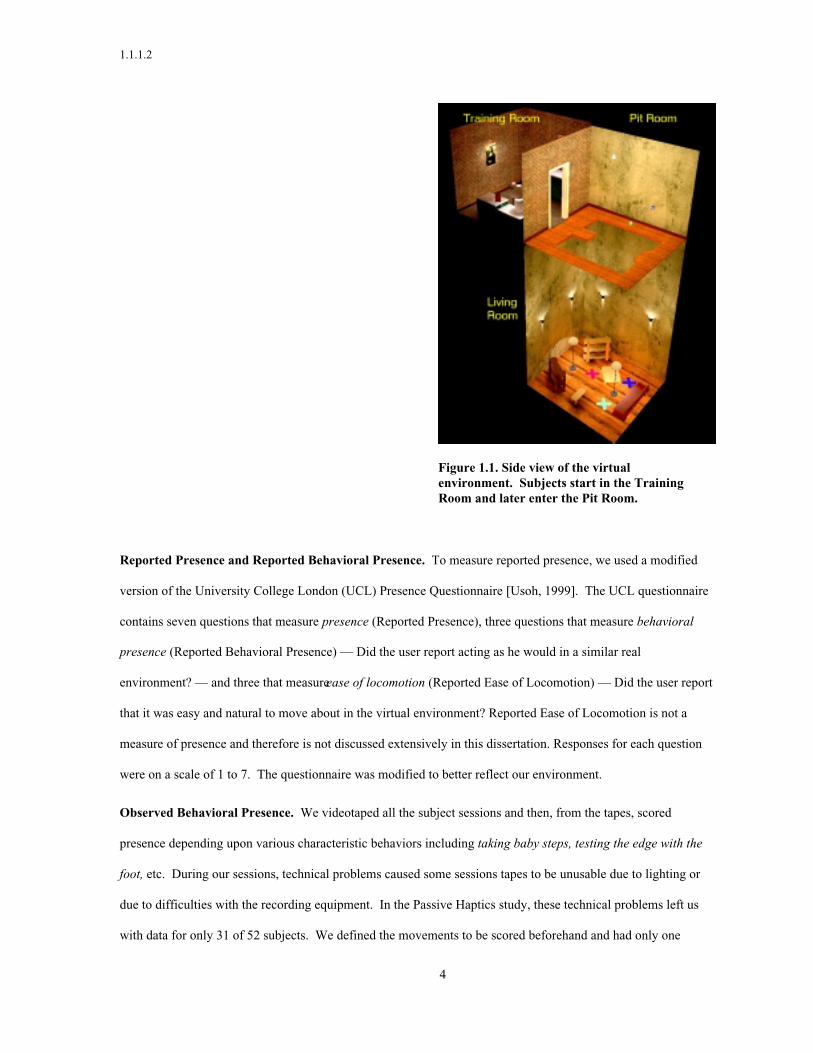
We used a VE that simulates a danger-of-falling, stress-inducing environment (see Figure 1.1) and
selected certain physiological responses that were easy to measure from the hands and chests of the subject and
have documented responses to this stress: heart rate, skin conductance, and skin temperature. Heart rate and
skin conductance are known to increase and skin temperature decrease with exposure to heights and other
stressors. For example, Emmelkamp and Felten reported on nineteen acrophobic patients heart rate reactions
to climbing as high as they could on a fire escape (with a hand rail), waiting one minute, and looking down.
Subjects ascended to the second landing on average. The average heart rate increase for subjects was 13.4 beats
/ minute [Emmelkamp, 1985]. Our subjects were non-phobic, so we would expected their heart rate reactions to
be lower, but in the same direction. See Appendix A and [Andreassi, 1995; Guyton, 1986] for more discussion
on physiological reaction.
Physiological measures of presence. We constructed three physiological measures based on differences
between stress reactions and normal values. These were defined so that they should all increase with increased
presence. That is, if there was more presence, there should have been more physiological reaction to the Pit
Room (Figure 1.1), and these measures should each increase:
∆∆∆∆Heart Rate = Mean Heart Rate Pit Room - Mean Heart Rate Training Room
∆∆∆∆Skin Conductance = Mean Skin Conductance Pit Room - Mean Skin Conductance Training Room
∆∆∆∆Skin Temperature = Mean Skin Temperature Training Room -Mean Skin Temperature Pit Room
1.1.1.2
4
Figure 1.1. Side view of the virtualenvironment. Subjects start in the TrainingRoom and later enter the Pit Room.
Reported Presence and Reported Behavioral Presence. To measure reported presence, we used a modified
version of the University College London (UCL) Presence Questionnaire [Usoh, 1999]. The UCL questionnaire
contains seven questions that measure presence (Reported Presence), three questions that measure behavioral
presence (Reported Behavioral Presence) — Did the user report acting as he would in a similar real
environment? — and three that measure ease of locomotion (Reported Ease of Locomotion) — Did the user report
that it was easy and natural to move about in the virtual environment? Reported Ease of Locomotion is not a
measure of presence and therefore is not discussed extensively in this dissertation. Responses for each question
were on a scale of 1 to 7. The questionnaire was modified to better reflect our environment.
Observed Behavioral Presence. We videotaped all the subject sessions and then, from the tapes, scored
presence depending upon various characteristic behaviors including taking baby steps, testing the edge with the
foot, etc. During our sessions, technical problems caused some sessions tapes to be unusable due to lighting or
due to difficulties with the recording equipment. In the Passive Haptics study, these technical problems left us
with data for only 31 of 52 subjects. We defined the movements to be scored beforehand and had only one

1.1.1.2
5
experimenter scoring for each study. A more detailed investigation of this measure should ensure a complete
data set by ensuring that all sessions are properly recorded. A detailed investigation should also use multiple
scorers and investigate the reliability among these scorers.
Figure 1.2. View of the 20 pit from the edge ofthe diving board.
The environment. The environment shown in Figures 1.1 and 1.2 consisted of 10,000 polygons and 41
megabytes of texture maps. This environment was used in the Frame Rate study. A similar environment was
used for the Passive Haptics and Multiple Exposures studies. It had 20,000 polygons and 50 megabytes of
texture. All environments were rendered in stereo on one Infinite Reality 2 pipe of an SGI Reality Monster.
The head-mounted display was a Virtual Reality 8 with 640x480 tri-color pixel resolution in each eye. Users
walked about in an 18 x 32 space, tracked with a high-accuracy, very-low-lag University of North Caroline
(UNC) Hi-Ball optical tracker [Ward, 1992; Welch, 1997]
Experimental procedures. In the Multiple Exposures study, 10 subjects (average age 24.4; r = 8.2; 7 female,
3 male) were trained to pick up books and move about in the Training Room — at which time a physiological
baseline was taken. Subjects then carried a book from the Training Room and placed it on a chair on the far
side of the Pit Room. After that, they were instructed to return to the Training Room. The subjects performed
this task three times per day on four separate days. In the Multiple Exposures study, we investigated the
hypothesis that the presence-evoking power of a VE declines with multiple exposures. ∆Heart Rate was not
successfully measured in this study due to problems with the sensor. We excluded subjects who had

1.1.1.2
6
experienced VEs more than three times from all studies. Additional exclusions for subjects are listed in
Chapter˚3.
In the Passive Haptics study, 52 subjects (average age 21.4; r = 4.3; 16 female, 36 male) reported on
two days. On one day, a subject experienced the VE with the 1.5-inch wooden ledge. On the other day, he
experienced the VE without the ledge. Subjects were counterbalanced as to the order of presentation of the
ledge. Subjects performed all exposures to the VE wearing only thin sock-like slippers. The task was the same
as in the Multiple Exposures study except subjects were instructed to walk to the edge of the wooden platform,
place their toes over the edge, and count to ten before dropping the book on the chair on the far side of the Pit
Room. In the Passive Haptics study, we investigated the hypothesis that the 1.5-inch wooden ledge increased
the presence-evoking power of the VE.
The Frame Rate study had 33 participants (average age 22.3; r = 3.6; 8 female, 25 male). Subjects
entered the VE four times on one day and were presented the same VE with a different frame rate each time.
The four frame rates were 10, 15, 20, and 30 frames-per-second (FPS). Subjects were counterbalanced as to the
order of presentation of the four frame rates. Subjects were trained to pick up and drop blocks in the Training
Room and then carried a red block to the Pit Room and dropped it on a red X-target on the floor of the Living
Room, a procedural improvement that forced subjects to look down into the pit. They then plucked from the air
two other blocks floating in the Pit Room and dropped each on the same-colored Xs on the floor of the Living
Room. The X-targets and green and blue blocks are visible in Figure 1.1. In this study, we investigated the
effect of frame rate on presence. We hypothesized that the higher the frame rate, the greater the presence
evoked.
Statistical significance. In this dissertation, we defined statistical significance at the 5% level. This is stated as
P˚<˚0.050. Findings significant at the 5% level are discussed as demonstrated or shown . We also chose a
method of statistical model construction in which we added variables to the model that were significant up to
the 10% level (0.05 † P < 0.10).
Summary. Below we discuss our findings for the reliability, validity, multi-level sensitivity, and objectivity of
the three physiological measures. We found that ∆Heart Rate met our requirements for a measure of presence.

1.1.1.2
7
1.3 Physiological measures of presence
1.3.1 Reliability
Reliability is the extent to which the same test applied on different occasions yields the same
result [Sutherland, 1996]. Specifically, we wanted to know whether the virtual environment would
consistently evoke a physiological reaction as the subject entered and remained in the Pit Room. The VE
consists of three rooms. Users start in the Training Room, which looks like a foyer or other small room in a
house. They later move to the Pit Room where, to get to the other side, they can either walk around the 20-foot
drop to the room below using a two-foot-wide wooden catwalk or walk straight across — walking as if on a glass
floor.
Figure 1.3. A typical skin conductance reaction to the Pit Room.
As we hypothesized, there were indeed significant physiological reactions to the Pit Room: heart rate
and skin conductance were significantly higher and skin temperature was significantly lower in the Pit Room in
all three studies. Figure 1.3 shows a typical skin conductance reaction to the Pit Room. Heart rate was higher
in the Pit Room for 90% of the exposures to the VE, skin conductance was higher for nearly 95%, and skin
temperature was lower for 90%. See Table 1.1.

1.1.1.2
8
Distribution of ∆∆∆∆Heart Rate Distribution of ∆∆∆∆SkinConductance
Distribution of ∆∆∆∆SkinTemperature
Effect of Multiple Exposures on
Presence
Not Available
Change in mSiemens
15 -
16
14 -
15
13 -
14
12 -
13
11 -
12
10 -
11
9 -
10
8 -
9
6 -
8
5 -
6
4 -
5
3 -
4
2 -
3
1 -
2
0 -
1
-1 -
0
40
30
20
10
0
S
M
N
Mean = 2.3 mSiemensStandard Deviation = 1.3N = 112Training Room Ave. = 8.3 mSiemensCount (Vals < 0.0) = 1 / 112
Change in Degrees Fahrenheit
5.0
- 5.
54.
5 -
5.0
4.0
- 4.
5
3.5
- 4.
0
3.0
- 3.
5
2.5
- 3.
0
2.0
- 2.
5
1.5
- 2.
0
1.0
- 1.
5
.5 -
1.0
0.0
- .5
-.5
- 0.
0
-1.0
- -
.5
-1.5
- -
1.0
-2.0
- -
1.5
-2.5
- -
2.0
-3.0
- -
2.5
-3.5
- -
3.0
-4.0
- -
3.5
40
30
20
10
0
Std. D
Mean
N = 9
Mean = 0.6 oFStandard Deviation = 0.9N = 94Training Room Ave. = 80.4 oFCount (Vals < 0.0) = 22 / 94
Effect of Passive Haptics on
Presence
Change in Beats / Minute
HRDF H
36 -
40
32 -
36
28 -
32
24 -
28
20 -
24
16 -
20
12 -
16
8 -
12
4 -
8
0 -
4
-4 -
0
-8 -
-4
-12
- -8
-16
- -1
2
30
20
10
0
S
M
N
Mean = 6.3 BPMStandard Deviation = 6.3N = 92Training Room Ave. = 85.9 BPMCount (Vals < 0.0) / N = 10 / 92
Change in mSiemens
14 -
15
13 -
14
12 -
13
11 -
12
10 -
11
9 -
10
8 -
9
7 -
8
6 -
7
5 -
6
4 -
5
3 -
4
2 -
3
1 -
2
0 -
1
-1 -
0
30
20
10
0
Mean = 4.8 mSiemensStandard Deviation = 2.5N = 100Training Room Ave. = 6.7 mSiemensCount (Vals < 0.0) / N = 0 / 100
Change in Degrees Fahrenheit
5.0
- 5.
5
4.5
- 5.
0
4.0
- 4.
5
3.5
- 4.
0
3.0
- 3.
5
2.5
- 3.
0
2.0
- 2.
5
1.5
- 2.
0
1.0
- 1.
5
.5 -
1.0
0.0
- .5
-.5
- 0.
0
-1.0
- -
.5
-1.5
- -
1.0
-2.0
- -
1.5
-2.5
- -
2.0
-3.0
- -
2.5
-3.5
- -
3.0
-4.0
- -
3.5
30
20
10
0
Mean = 1.1 oFStandard Deviation = 1.2N = 100Training Room Ave. = 84.9 oFCount (Vals < 0.0) = 10 / 98
Effect of Frame Rate on Presence
Change in Beats / Minute
HRDF FR
36 -
40
32 -
36
28 -
32
24 -
28
20 -
24
16 -
20
12 -
16
8 -
12
4 -
8
0 -
4
-4 -
0
-8 -
-4
-12
- -8
-16
- -1
2
50
40
30
20
10
0
M
N
Mean = 6.3 BPMStandard Deviation = 5.8N = 132Training Room Ave. = 82.7 BPMCount (Vals < 0.0) = 12 / 132
Change in mSiemens
14 -
15
13 -
14
12 -
13
11 -
12
10 -
11
9 -
10
8 -
9
7 -
8
6 -
7
5 -
6
4 -
5
3 -
4
2 -
3
1 -
2
0 -
1
-1 -
0
40
30
20
10
0
Mean = 2.0 mSiemensStandard Deviation = 2.0N = 132Training Room Ave. = 5.0 mSiemensCount (Vals < 0.0) = 17 / 132
Change in Degrees Fahrenheit
5.0
- 5.
54.
5 -
5.0
4.0
- 4.
5
3.5
- 4.
0
3.0
- 3.
5
2.5
- 3.
0
2.0
- 2.
5
1.5
- 2.
0
1.0
- 1.
5
.5 -
1.0
0.0
- .5
-.5
- 0.
0
-1.0
- -
.5
-1.5
- -
1.0
-2.0
- -
1.5
-2.5
- -
2.0
-3.0
- -
2.5
-3.5
- -
3.0
-4.0
- -
3.5
70
60
50
40
30
20
10
0
Std. D
Mean
N = 13
Mean = 0.8 oFStandard Deviation = 0.5N = 132Training Room Ave. = 83.6 oFCount (Vals < 0.0) = 0 / 132
Table 1.1. Differences in physiological measures between the Training Room and the Pit Room.The means of the distributions were significantly greater than zero (P < 0.001 for all measures in allstudies).
We also wanted to know whether the physiological reactions to the environment diminished over
multiple exposures. Since our hypotheses relied on presence in the VE evoking a stress reaction over a multiple
exposures (2-12 exposures), we wanted to know whether physiological reactions to the VE would drop to zero

1.1.1.2
9
or become unusably small due to habituation. In fact, each measure did decrease with multiple exposures (not
necessarily significantly) in all studies (∆Skin Temperature, Reported Presence, Reported Behavioral Presence,
Observed Behavioral Presence, and ∆Heart Rate) or in all but one study (∆Skin Conductance). None decreased
to zero, though, even after twelve exposures to the VE. Table 1.2 shows the significant order effects. Figures
4.1 and 4.2 graph the reactions of each measure over multiple exposures.
A decrease in physiological reaction over multiple would not necessarily weaken validity, since the
literature shows that habituation diminishes the stress reactions to real heights and other stressors [Abelson,
1989; Andreassi, 1995]. Since all measures, not just the physiological measures decrease over multiple
exposures, the decreases may not be due to habituation. There may be, as Heeter hypothesized, a decrease in
presence evoked by the environment as novelty wears off [Heeter, 1992].
OrderEffects
∆∆∆∆HeartRate
(∆∆∆∆BPM)
∆∆∆∆SkinConductance(∆∆∆∆mSiemens)
∆∆∆∆SkinTemperature
(∆∆∆∆oF)
ReportedPresence(Counthigh )
ReportedBehavioralPresence(Counthigh )
ObservedBehavioralPresence(CountBehvs.)
MultipleExposures
N/A -0.7 (1st) -0.9 (1st) - -0.7 (1st) -0.9 (Sess)
PassiveHaptics
- - - -0.8 (1st) -0.4 (1st) -
FrameRate
-1.0(Task)
-0.8 (1st) -0.3 (1st) - -0.2 (Task) -0.8 (1st)
Table 1.2. Significant order effects for each measure in each study.(1 st) indicates a decrease in a measure after the first exposure only. (Sess) indicates a decrease in themeasure over subsequent sessions (days). (Task) indicates a decrease over tasks on the same day.There was an order effect for each measure in at least one study. N/A is Not available . Fulldescriptions of the order effects are given in Tables 4.2 to 4.4.
Orienting Effect. In general, each measure decreased after the first exposure. Moreover, there was a
significant decrease after the first exposure for each measure except ∆Heart Rate in at least one of the studies
(see Table 1.2). For physiological responses, this is called an orienting effect — a higher physiological reaction
when one sees something novel [Andreassi, 1995]. Though this term traditionally refers to physiological
reactions, we will also use the term for observed behavioral and reported reactions to the novel stimuli.
We attempted, with only partial success, to overcome this orienting effect by exposing subjects to the
environment once as part of their orientation to the experimental setup and before the data-gathering portion of
the experiment. In the Passive Haptics and Frame Rate studies, subjects entered the VE for approximately two

1.1.1.2
10
minutes and were shown both rooms before the experiment started. These pre-exposures reduced but did not
eliminate the orienting effects.
1.3.2 Validity
Validity is the extent to which a test or experiment genuinely measures what it purports to measure
[Sutherland, 1996]. Since the concept of presence is itself vague and debatable, the question is then: How well
do physiological reactions correlate with more traditional measures of presence? We investigated their
correlations with several such measures.
Reported Presence. Among the physiological measures, ∆Heart Rate correlated best with the Reported
Presence. There was a significant correlation in the Frame Rate study (corr. = 0.265, P˚=˚0.002) and a weak and
non-significant positive correlation (corr. = 0.034, P˚=˚0.743) in the Passive Haptics study. In the Multiple
Exposures study, where ∆Heart Rate was not available, ∆Skin Conductance had the highest correlation with
Reported Presence (corr. = 0.245, P˚=˚0.009).
Reported Behavioral Presence. Both ∆Heart Rate and ∆Skin Conductance correlated well with the Reported
Behavioral Presence. ∆Heart Rate had the highest correlation, and a significant one with Reported Behavioral
Presence in the Frame Rate study (corr. = 0.192, P˚=˚0.028), and there was a weak and non-significant positive
correlation between the two (corr. = 0.004, P˚=˚0.972) in the Passive Haptics study. In the Multiple Exposures
study, where ∆Heart Rate was not measured, ∆Skin Conductance had the highest correlation with reported
behavioral presence (corr. = 0.290, P˚=˚0.002). ∆Skin Conductance also had a non-significant positive
correlation with Reported Behavioral Presence in the Passive Haptics Study (corr. = 0.106, P˚=˚0.280).
The correlations of the physiological measures with the reported measures give some support to their
validities. The validity of ˘Heart Rate appears to be well established by its correlation with the well-established
reported measures. There was also support for the validity of ∆Skin Conductance from its correlation with
reported measures, though not as strong support as for ∆Heart Rate.
There was little support for the validity of ∆Skin Temperature. As noted by McMurray, the measure
suffers two limitations: 1) skin temperature response is slow (can take on the order of minutes for full effect)
and is affected by many factors (sympathetic activity, muscular activity, etc.), 2) the sensors for detecting

1.1.1.2
11
temperature changes are slow and can take on the order of one to three minute to fully register a change in
temperature [McMurray, 1999]. We believe that these two lags combined with the limited time of exposure to
the Pit Room (on the order of one minute) do not allow for enough time for useful measurement of ∆Skin
Temperature.
Observed Behavioral Presence. Observed Behavioral Presence consistently correlated well with Reported
Behavioral Presence, but it had mixed correlations with Reported Presence.
Following hypothesized relationships. According to Singleton, the validation process includes examining
the theory underlying the concept being measured, and The more evidence that supports the hypothesized
relationships [between the measure and the underlying concept], the greater one s confidence that a particular
operational definition is a valid measure of the concept [Singleton, 1993] . We hypothesized that presence
should increase with frame rate and with the inclusion of the 1.5-inch wooden ledge. As presented in the next
section, our physiological measures increased with frame rate and with inclusion of the 1.5-inch wooden ledge.
This helps validate the physiological reactions as measures of presence.
1.3.3 Sensitivity and multi-level sensitivity
Sensitivity is the likelihood that an effect, if present, will be detected [Lipsey, 1998]. The fact that the
physiological measures reliably distinguished between subjects being in the Pit Room versus the Training Room
assured us of at least a minimal sensitivity. All measures did so in every study. For example, heart rate
increased an average of 6.3 beats / minute (BPM) in the Pit Room (P < 0.001) compared to the Training Room
in both the Passive Haptics and Frame Rate studies. See Table 1.1 for full details of the means and standard
deviations for each measure.
Multi-level sensitivity. For guiding VE technological development and for better understanding the
psychological phenomena of VEs, we need a measure that reliably yields a higher value as a VE is improved
along some goodness dimension, i.e., is sensitive to multiple condition values. We call this multi-level
sensitivity. The Passive Haptics study provided us some evidence of multi-level sensitivity. Anecdotally, we
have observed that walking into the Pit Room causes a strong reaction in users and this reaction is greater in
magnitude than the differences in reaction to the Pit Room between any two experimental conditions (e.g.
with and without the 1.5-inch wooden ledge). Therefore, we expected the differences among the conditions to

1.1.1.2
12
be less than the difference between the two rooms. For example, in Passive Haptics, we expected there to be a
significant difference in the physiological measures between the two conditions (with and without the 1.5-inch
wooden ledge), but expected it to be less than the difference between the Training Room and Pit Room in the
lower presence condition (without the 1.5-inch wooden ledge). For ∆Heart Rate, we did find a significant
difference between the two conditions of 2.7 BPM (P˚=˚0.016), and it was less than the inter-room difference for
the without-ledge condition: 4.9 BPM. See Figure 1.4.
8586878889909192939495
TrainingRoom
Pit RoomwithoutLedge
Pit Roomwith Ledge
Bea
ts/M
inu
te
2.7
4.9
Figure 1.4. Heart Rate in the Passive Hapticsstudy.
In the Passive Haptics study, we further tested the multi-level sensitivity by testing whether presence
was significantly higher with the 1.5-inch wooden ledge. Presence as measured by ∆Heart Rate (2.7 BPM;
P˚=˚0.016), ∆Skin Conductance (0.8 mSiemens; P˚=˚0.040), and Reported Behavioral Presence (0.5 high
responses; P˚=˚0.004) were significantly higher with the wooden ledge. Reported Presence had a strong trend in
the same direction (0.5 high responses; P˚=˚0.060). ∆Skin Temperature varied in the opposite direction; skin
temperature decreased less when the 1.5-inch wooden ledge was present.

1.1.1.2
13
0
1
2
3
4
5
6
7
8
9
10 15 20 30
Frame Rate
Ch
ang
e in
bea
ts/m
inu
te
Figure 1.5. Average change in heart rate,after correcting for Loss of Balance, betweenTraining Room and Pit Room at 10, 15, 20,and 30 frames per second.
In the Frame Rate study, we hypothesized that for graphics frame rates of 10, 15, 20, and 30 FPS,
physiological reactions would increase monotonically with frame rate. They did not do exactly that (see Figure
1.5). During the 10 FPS condition, there was an anomalous reaction for all of the physiological measures and
both the behavioral measures: Reported Behavioral Presence and Observed Behavioral Presence. That is, at 10
FPS, subjects had higher physiological reaction, reported more behavioral presence, and acted more present in
the Pit Room. We believe that this reaction was due to discomfort, added lag, and reduced temporal fidelity
while they were in the ostensibly dangerous situation of walking next to a 20-foot pit. This is discussed in more
detail in Chapter 4.
We also observed that subjects often lost their balance while trying to inch to the edge of the wooden
platform at this low frame rate (Loss of Balance). Controlling for these Loss of Balance incidents improved the
significance of the statistical model for ∆Heart Rate (3.5 BPM higher when Loss of Balance; P˚=˚0.014) and
brought the patterns of responses closer to the hypothesized monotonic increase in presence with frame rate —
but did not completely account for the increased physiological reaction at 10 FPS. Loss of Balance was not
significant in any other model.

1.1.1.2
14
Beyond 10 FPS, ˘Heart Rate performed well after statistically controlling for Loss of Balance. ˘Heart
Rate significantly increased (3.2 BPM; P˚=˚0.004) between 15 FPS and 30 FPS and between 15 FPS and 20 FPS
(2.4 BPM; P˚=˚0.024). There was also a non-significant increase between 20 FPS and 30 FPS (0.7 BPM;
P˚=˚0.483) and a non-significant decrease between 10 FPS and 15 FPS (1.6 BPM; P˚=˚0.134). Reported
Presence, Reported Behavioral Presence, and ∆Skin Temperature also increased with frame rate from 15-20-30
FPS, but with less distinguishing power. These findings support the multi-level sensitivity of ∆Heart Rate but
do not support those of ∆Skin Conductance and ∆Skin Temperature.
1.3.4 Objectivity
The measure properties of reliability, validity, and multi-level sensitivity are established quantitatively.
Objectivity can only be argued logically. We argue that physiological measures are inherently better shielded
from both subject bias and experimenter bias than are either reported measures or measures based on behavior
observations. Reported measures are liable to subject bias — the subject reporting what he believes the
experimenter wants. Post-experiment questionnaires are also vulnerable to inaccurate recollection and to
modification of impressions garnered early in a run by impressions from later. Subject reporting during the
session, whether by voice report or by hand-held instrument, intrudes on the very presence illusion one is trying
to measure.
Observed measures are obviously liable to scorer bias. The use of videotape helps by making it
possible for the scorer to do replays and to make considered judgments. In some studies, however, it is
impossible to hide the condition from the experimenter scoring the measure. For example, in the Passive
Haptics study, the experimenter can see the 1.5-inch wooden ledge on the videotape. Behavioral measures are
also somewhat liable to subject bias. We observed occasional intentionally exaggerated or intentionally
suppressed fear behaviors near the pit.
Physiological measures, on the other hand, are much harder for subjects to affect, especially with no
bio-feedback. They are not liable to experimenter bias, if instructions given to the users are properly limited
and uniform. We read instructions from a script in the Multiple Exposures study. We improved our procedure
in the later Passive Haptics and Frame Rate studies by playing instructions from a compact disk player located
in the real laboratory and represented with a virtual radio in the VE.

1.1.1.2
15
1.3.5 Summary and discussion
The data presented here and later in Chapter 4 show that physiological reactions can be used as
reliable, valid, multi-level sensitive, and objective measures of presence. Of the physiological measures,
∆Heart Rate performed the best. It significantly differentiated between the Training Room and the Pit Room
and this reaction faded over multiple exposures, but never to zero. It correlated with the well-established
reported measures. It distinguished between the inclusion of passive haptics and among frame rates after 10
FPS. As we argued above, it is objective. In total, it satisfies all of the requirements for a reliable, valid, multi-
level sensitive, and objective measure of presence.
∆Skin Conductance and ∆Skin Temperature have some, but not all, of the properties we desire in a
measure of presence. In our investigation, at least one of the properties of reliability, validity, multi-level
sensitivity, and objectivity were not met for each of these measures. We believe that ∆Skin Temperature
performed poorly because the exposure to the VE was too short for useful measurement of changes in skin
temperature. Moreover, we believe that ∆Skin Temperature has a response time much longer than is useful for
our studies (around two minutes). We do not have a theory as to why ∆Skin Conductance was not multi-level
sensitive in the Frame Rate study.
We found that ∆Heart Rate satisfied the requirements for a presence measure for our VE, which
evokes a strong reaction, but it may not for all VEs. If this did not work for so strong a stimulus, it would not
work for less stressful VEs. Our investigation is only a first step. More investigation would be needed to
determine if physiological reaction could also work as a measure of presence for less stressful or non-stressing
VEs.
Another desirable aspect of a measure is ease of operationalization. We did not measure the time taken
for each measure, but after running many subjects we can say with some confidence that use of the
physiological monitoring and the presence questionnaire added approximately the same amount of time to the
experiment, with the questionnaire taking a little less time. The observed behavioral measure did not add to the
time to conduct the experiment, but added considerable time after the experiment. It took about five minutes of
both the experimenter s and subject s time to put the physiological sensors on and take them off for each
exposure. It took about an extra minute at the beginning and end of each set of exposures to put on and take off

1.1.1.2
16
the ECG sensor — it was left on between exposures on the same day. It took subjects about five minutes to fill
out the 16-item UCL Presence Questionnaire. Time to review the videotape of each session was the longest —
this took an average of eleven minutes per exposure (around 25 hours to review 132 sessions in the Frame Rate
experiment, the only one for which we kept track of the time spent). A benefit of the presence questionnaire
was that the experimenter was free to do something else while the subjects filled them out. The observed
behavioral measure took no additional time for the subject and very little training was needed to do the scoring.
It took some training to learn the proper placement of the physiological equipment on the hands and chest of the
subject — thirty minutes would probably be sufficient for most graduate students. We avoided loosing time
while connecting the physiological monitoring equipment by having one experimenter start up the VE while the
other connected the physiological sensors.
Another aspect of ease of operationalization is ease of use. No subjects reported difficulties with the
questionnaires. None had a problem with being recorded during the sessions. Technical problems, though,
plagued our videotaped measure. Only about one in ten subjects reported noticing the physiological monitoring
equipment on the hands during the VE exposures. Our experiment, though, was designed to use only the right
hand, keeping the sensor-laden left hand free from necessary activity. No subjects reported noticing the ECG
sensor once it was attached. In fact, many subjects reported forgetting about the ECG electrodes when
prompted to take them off at the end of the day. There are groups investigating less cumbersome equipment
including a physiological monitoring system that subjects wear like a shirt [Cowings, 2001].
Overall, questionnaires and physiological monitoring were easy to operationalize, the observed
behavioral measure was less so.
1.4 Physiological reactions as between-subjects measures
We conducted all of the studies as within-subjects to avoid the variance due to natural human
differences. That is, subjects experienced all of the conditions for the study in which they participated. This
allowed us to look at relative differences in subject reaction among conditions and to overcome the differences
among subjects in reporting (for the questionnaires), physiological reaction, and behavior (for the Observed
Behavioral Presence measure).

1.1.1.2
17
The UCL questionnaire has been used successfully between-subjects [Usoh, 1999]. We suspected,
however, that physiological reaction would not perform as well if taken between-subjects. Specifically, we
expected that between-subjects physiological measures would not be able to significantly differentiate among
presence conditions, since the variance among subjects would mask, at least in part, the differences in
physiological reaction evoked by the different conditions. We also expected correlations with the reported
measures to be reduced, since individual differences in physiological reaction and reporting would confound the
correlations. For example, consider a subject presented with a low presence condition who reported low
presence. If the subject was highly physiologically reactive, however, he still could have had a high
physiological reaction relative to the group average — even if it were lower than it would have been if he was
presented with a high presence condition. Such a case would reduce the correlations.
We expected that there would still be a consistent physiological reaction to the Pit Room, since we
expected such a reaction for every exposure to the VE. We expected the significance to be slightly lower,
however, because of the reduced size of the data set.
We discuss these assumptions in this section by analyzing the data using only the first task for each
subject — eliminating order effects and treating the reduced data sets as between-subjects experiments. That is,
we treat each experiment as if only the first task for each subject was run. This means that the analysis uses
only 10 data points (10 subjects — first exposure only) for the Multiple Exposures study, 52 data points for the
Passive Haptics study, and 33 data points for the Frame Rate study.
Reliability between-subjects: Physiological reaction in the Pit Room. As suspected, all of the physiological
reactions were significantly higher in the Pit Room when analyzing between-subjects. See Table 1.3. Also, as
expected, the significance values for the differences were lower when looking at only the first exposure than
when looking at all exposures, due to the reduced number of data points. The means for the physiological
measures for the first exposures were higher than for the full data set (except for ∆Skin Conductance in the
Passive Haptics study). This follows, since we observed physiological orienting effects. The fraction of
exposures in which heart rate and skin conductance were higher and skin temperature was lower in the Pit
Room as compared to the Training Room is the same or better than these for the within-subjects data, and all
are 90% or better. Heart Rate in Passive Haptics is the only exception (85% vs. 89%). See Table 1.3.

1.1.1.2
18
First Exposure Only All exposuresStudy Variable Mean P N Count < 0 Mean P N Count < 0
∆∆∆∆SkinConductance
2.9 .002 9 0 2.3 .000 112 1MultipleExposures
∆∆∆∆SkinTemperature
1.2 .015 7 0 0.6 .000 94 22
∆∆∆∆Heart Rate 6.2 .000 46 7 6.3 .000 92 10∆∆∆∆SkinConductance
4.7 .000 50 0 4.8 .000 100 0PassiveHaptics
∆∆∆∆SkinTemperature
1.1 .000 49 3 1.1 .000 98 10
∆∆∆∆Heart Rate 8.1 .000 33 3 6.3 .000 132 12∆∆∆∆SkinConductance
2.6 .000 33 1 2.0 .000 132 17Frame Rate
∆∆∆∆SkinTemperature
1.0 .000 33 0 0.8 .000 132 0
Table 1.3 . Means and significance for one-sample t-test (test to see if the mean was significantly higherthan zero). Also shown is the count of times that the measure was below zero. Physiological reaction,shown here for first task only and for all tasks together, was higher in the Pit Room. The higher mean isshown in bold face.
Validity between-subjects: Correlation with established measures. As expected, physiological reactions
did not correlate as well with the questionnaires when analyzing between-subjects. There were no significant
correlations between the physiological measures and any of the questionnaire measures in any of the studies.
Multi-level sensitivity between-subjects: Differentiating among presence conditions. We expected inter-
subject variation in physiological reaction to mask the differences in physiological reactions evoked by the
presence conditions (e.g. various frame rates). Contrary to this expectation, though, the physiological measures
did differentiate among the conditions: physiological reaction to the Pit Room was significantly higher that to
the Training Room for all measures in all studies (described above), and we found significant differences in the
physiological measures among conditions in both the Passive Haptics and Frame Rate studies. (The condition
was not varied in the Multiple Exposures study.)
In the Passive Haptics study, both ∆Heart Rate and ∆Skin Conductance performed well as between-
subjects presence measures. In the base statistical model (not correcting for anything) both varied in the
expected direction with some power (P˚=˚0.097 for ∆Heart Rate; P˚=˚0.137 for ∆Skin Conductance). After
correcting for subjects level of computer game playing, the significance for ∆Heart Rate was reduced
(P˚=˚0.180).

1.1.1.2
19
In the Frame Rate study, ∆Heart Rate performed well, but ∆Skin Conductance did not follow
hypothesized patterns. ∆Heart Rate had an anomalous physiological reaction at 10 FPS. This was also the case
for ∆Heart Rate in the full data set (compare Figures 1.5 and 1.6). Additionally, ∆Heart Rate differentiated
among presence conditions: ∆Heart Rate at 30 FPS was higher than at 15 FPS and this difference was nearly
significant (7.2 BPM; P˚=˚0.054).
0123456789
101112
1 2 3 4
Frame RateC
han
ge
in B
eats
/Min
ute
Figure 1.6. Between-subjects analysis:Response graph of ∆∆∆∆Heart Rate.
Overall, ∆Heart Rate shows promise as a between-subjects measure of presence. Though it did not
correlate well with the reported measures (between-subjects), it did differentiate among the conditions with
some statistical power in Passive Haptics and Frame Rate. ∆Skin Conductance and ∆Skin Temperature did not
show as much promise as between-subjects measures. For more discussion of physiological reaction as
between-subjects measures of presence, see Section 4.4.1.
1.5 The results of the studies
To establish the properties of the physiological presence measures, we conducted three controlled user
studies, plus the pilot studies necessary to debug environment, equipment, and procedures. Each was a dual-
1.1.1.2
20
purpose study, both contributing to the development and testing of physiological presence measures and
investigating some other aspect of VEs.
1.5.1 Effect of multiple exposures on presence (Multiple Exposures)
Hypothesis: The presence-inducing power of a VE declines with multiple exposures, but not to zero.
Ten subjects had three exposures to the VE each day on four separate days — a total of twelve
exposures each. The VE and the task were the same for each exposure.
Results. There was a significant order effect for each measure in at least one of the three studies, and
when not significant, the trends were in the same direction. Table 1.2 summarizes the order-effect results
significant at the P˚<˚0.050 level (bold) and P < 0.100 (normal text), not only for this study, but also for the two
subsequent ones. The existence and magnitude of the significant order effects in all the measures supports the
hypothesis that all presence measures decreases over 12 exposures to the same VE, but not to zero.
1.5.2 Effect of passive haptics on presence (Passive Haptics)
Hypothesis: Supplementing a visual-aural VE with even rudimentary, low-fidelity passive haptics cues
significantly increases presence.
This experiment was only one of a set investigating the passive haptics hypothesis. The detailed
design, results, and discussion for the set are reported elsewhere [Insko, 2001].
Design. Fifty-two subjects each had two exposures on separate days. For the passive haptics
condition, the virtual ledge in the Pit Room was augmented with a registered real plywood ledge, 1.5 inches
high. A user in a HMD, unable to see the real world, could feel the edge of the ledge with the foot. The 1.5-
inch height was selected so that the edge-probing foot did not normally contact the real laboratory floor where
the virtual pit was. Each subject experienced the environment with the 1.5-inch wooden ledge ( high presence
condition) and without it ( low presence condition). Presentation of the conditions was counterbalanced
across subjects. Figure 1.7 shows a subject standing on the 1.5-inch wooden ledge.

1.1.1.2
21
Figure 1.7. A subject drops a block into the virtualpit. He is standing on the edge of the 1.5-inchwooden ledge. The physiological monitoringequipment is attached to his left hand.
Results. As discussed above, ˘Heart Rate was significantly higher (P˚=˚0.016) with the wooden ledge
than without it. Reported Behavioral Presence (P˚=˚0.004) and ∆Skin Conductance (P˚=˚0.040) were also
significantly higher. Reported Presence had a strong trend (P˚=˚0.060) in the same direction.
1.5.3 Effect of frame rate on presence (Frame Rate)
Hypothesis: As frame rate increases from 10, 15, 20, 30 frames/second, presence increases.
Thirty-three subjects each had four exposures to the same VE and task, at each of several frame rates.
Presentation order was counterbalanced across subjects.

1.1.1.2
22
Results. Discussed in Section 1.4 above, the hypothesis was confirmed for 15, 20, 30, FPS, but 10
FPS gave anomalous results.
1.6 Future work
Given a compelling VE and a good presence measure, the obvious strategy would be to degrade the
VE quality parameters one at a time so as to answer: What makes a VE compelling? What are the combinations
of minimum system characteristics to achieve this?
For example, we hope to study
• Aural localization,
• Visual Detail,
• Lighting realism,
• Self-avatar fidelity,
• Realistic physics in interactions with objects, and
• Interactions with other people or agents.
We want to begin to establish trade-offs for presence evoked: Is it more important to have lag below 50
ms or frame rate above 20 FPS? These tradeoffs could eventually lead to identification of isosurfaces for
presence, as described by Ellis [Ellis, 1996]. In particular, physiological reaction satisfies his requirement that
an independent measure of human performance or some other independent characteristic of the virtual
environment should be shown to be determined by equivalence classes. We could compare the effect of
varying system parameters (e.g. lag, frame rate, visual realism, etc.) on the extent of physiological reaction
evoked. Assuming repeatable results, sets of VE system parameter (e.g. Lag = Lagj, Frame Rate=FRj, Use of
localized sound = Yes, etc.) that evoke equal physiological reactions would be in the same equivalence class.
Future work should include using VEs that evoke more subtle reactions and different reactions than
ours. To use physiological reaction as a measure of presence, feeling presence in the VE must evoke a
physiological reaction distinct from that of the laboratory environment. Ours did this by evoking in subjects the
perceived danger of moving about near a height. Other VEs might evoke presence in other stressful

1.1.1.2
23
environments, exciting environments, interesting environments, relaxing environments, etc. If future
investigators are unsure of the physiological reaction that the VE should evoke, then a controlled study in the
corresponding real environment should be conducted.
Further investigation should also include VEs that expose the subject to the stressor for less time. In a
study with a shorter exposure to the stressor, one should consider three things:
1) There is a lag of 2-3 seconds from time of stimulus (exposure to stressor) to onset of reaction for
all physiological reaction including heart rate, skin conductance, and skin temperature [Andreassi,
1995].
2) Heart rate is affected by respiration. For accurate measurement, heart rate should be averaged
over one or two respiration cycles. A respiration cycle averages 4 seconds [Seidel, 1995].
3) Skin temperature does not work well for exposures of less than 2 minutes.
We must eliminate the cables that tether subjects to the monitoring, tracking, and rendering equipment.
Our subjects reported this encumbrance as the greatest cause of breaks in presence.

1.1.1.3
24
Chapter 2 Related work
The study of presence dates back, at the very least, to Plato s theory of Forms and his pondering the
nature of being and reality [Plato, 380 B.C.]. The study of presence in virtual environments came into full
swing with the first issue of MIT Press journal Presence: Teleoperators and Virtual Environments in 1992. In
this chapter, we describe theories of presence that have been presented in the literature, discuss previous
experiments on presence, and discuss the work of other groups that have studied physiological reactions to
virtual environments (VEs).
2.1 Defining and describing presence explicitly
This section gives details of published definitions of presence and discusses taxonomies presented in
the literature.
Steuer defines virtual environments in terms of presence and telepresence: a virtual environment is a real or
simulated environment in which a perceiver experiences telepresence [Steuer, 1992]. He defines presence as
the sense of being in an environment and telepresence as the experience of presence in an environment by
means of a communications medium. He elaborates: In other words, presence refers to the natural
perception of an environment, and telepresence refers to the mediated perception of an environment.
Steuer states that the two technical dimensions that contribute to the sense of presence in virtual
environments are vividness and interactivity. He separates vividness, the ability of a technology to produce a
sensorially rich mediated environment, into two categories: breadth and depth. Breadth refers to the number of
senses stimulated by the VE (i.e. does the VE include visual, audio, haptic, and olfactory displays?) Depth
refers to the resolution and quality of each of the included sensory displays.

1.1.1.2
25
He defines interactivity as the extent to which users can participate in modifying the form and content
of a mediated environment [interactively]. It combines speed, range, and mapping. Speed refers to response
time. Real-time interaction (with no lag) is the fastest of possible speeds. Range is determined by the number
of attributes of the mediated environment that can be manipulated and by the amount of variation possible
within each attribute. For example, range includes intensity (of sensory displays), organization (of the world),
frequency characteristics (of the sensory displays), etc. Mapping is the way in which human actions are
connected to actions in the mediated environment. For example, in [Slater, 1995b], Slater studies the
effectiveness of two mappings of movement in a VE: subjects either walked in place or used a 3D mouse to
move about within the VE.
Heeter defines three dimensions of presence: Subjective Personal Presence, Social Presence, and
Environmental Presence [Heeter, 1992]. Subjective Personal Presence is a measure of the extent to which and
the reasons why you feel like you are in a virtual world. The factors that affect this type of presence are the
sense of inclusion in the VE, representation of self within the VE, and familiarity with the VE.
Social Presence refers to the extent to which other beings (living or synthetic) also exist in the world
and appear to react to you. The factor that affects this type of presence is the evidence that you and other
entities exist in the VE. For example, allowing users of a multi-user VE to communicate over an audio channel
should increase social presence.
Environmental Presence is the extent to which the environment itself appears to know that you are
there and reacts to you. Examples include motion sensing lights, creaking floor boards, dynamic shadows, etc.
Held and Durlach assert that one should be able to measure presence with subjective scales, behavioral
responses, and physiological reactions [Held, 1992].
They discuss factors that should contribute to presence:
• Increased sensory depth and breadth should increase evoked presence: this discussion corresponds
closely with Steuer s vividness [Steuer, 1992].
• Displays and tacking systems should be free from artifactual stimuli that signal [their] existence.

1.1.1.2
26
• Head and virtual body movements should be slaved to the user, and lower lag in these movements
should evoke more presence.
• The VE should be predictable.
Sheridan defines presence (or virtual presence) as the sense of being physically present with visual, auditory,
or force displays generated by a computer and telepresence as the sense of being physically present with
virtual object(s) at the remote teleoperator site [Sheridan, 1992]. Sheridan postulates that the factors that affect
virtual presence and telepresence are the same and that they are the extent of sensory information, control of
relation of sensors to environment, and ability to modify the physical environment. The extent of sensory
information refers to the number of senses stimulated and the extent of the stimulation by the displays of the
VE. It corresponds closely to Steuer s depth and breadth of vividness [Steuer, 1992]. Control of relation of
sensors to the environment refers to the ability of the VE to modify body-centered direction of sensory input as
the user moves in the VE. Ability to modify physical environment includes both object manipulation in the VE
and passive effects such as dynamic shadows.
Schloerb describes two novel definitions of presence and discusses their measurement [Schloerb, 1995]. He
defines objective presence as the probability that a user will complete a task. For example,
Consider the task of throwing the ball into the basket. It is assumed that some particular basket, ball,
and manner of throwing are specified. If a person (the operator) can throw the ball into the basket
when asked to do so, then he or she is objectively present.
Therefore, objective presence is different based on the task by which it is defined. Subjective presence
is equal to the probability that [the user] perceives that he or she is physically present in a given remote [or
virtual] environment. He states that presence can be measured along both axes: objective (based on task
performance) and subjective (based on percentage chance subjects say they are in the environment depicted
by the computer). He observes that no existing VE could evoke subjective presence. He addresses this by
suggesting that if a subject s view of the real world was somehow degraded or altered so as to look less real,
then subjective presence could be constructed as a function of the extent of the degradation to the real world and
the probability of saying that he or she is in the VE. Sheridan discusses this in more detail [Sheridan, 1996].

1.1.1.2
27
Sheridan extends his previous work, [Sheridan, 1992], by discussing measurements of presence [Sheridan,
1996]. He states that three basic measures have been presented in the literature: reflex response [Held, 1992;
Slater, 1993], subjective responses to questions [Heeter, 1992; Slater, 1994], and ability to discriminate between
the virtual and real environment [Schloerb, 1995]. He proposes a fourth measurement where noise is added to
both the real and virtual environments (degrade the images, frame rates, etc.) until the difference between the
two is no longer distinguishable. The level of noise needed to degrade the real and virtual stimulation until the
perceived environments are indiscriminable would be used as the measure of presence. No test was
performed.
Ellis discusses the need to be able to find equivalence classes — or isosurfaces — for levels of presence [Ellis,
1996]. He limits his discussion to the case in which users of a medium really are trying to communicate a
precise, often numerical message, and are more concerned about error than appeal or impact. He therefore
discusses a presence measure that correlates with performance and is similar to objective presence discussed by
Schloerb [Schloerb, 1995]. He requires that: (1) Measures of presence as a function of its constituents should
result in identifiable surfaces or hypersurfaces so as to allow identification of level set equivalence classes and
(2) an independent measure of human performance or some other independent characteristics of the virtual
environment should be shown to be determined by equivalence classes. He states that a measure of presence
should be a function of the quantified independent variables of the VE: visual fidelity, audio fidelity,
interactivity, lag, etc.
Witmer and Singer define presence as the subjective experience of being in one place or environment, even
when one is physically situated in another [Witmer, 1998]. With this they encompass both presence and
telepresence. They state: presence is a normal awareness phenomenon that requires directed attention and is
based in the interaction between sensory stimulation, environmental factors that encourage involvement and
enable immersion, and internal tendencies to become involved. They also state that whereas full attention is
not necessary for presence, it is likely that there is a minimum threshold for allocation of attentional resources
before presence is experienced and that attention above that threshold is likely to increase presence.
Slater et al. define three aspects of presence [Slater, 1999]:
• The sense of being there in the environment depicted by the VE.
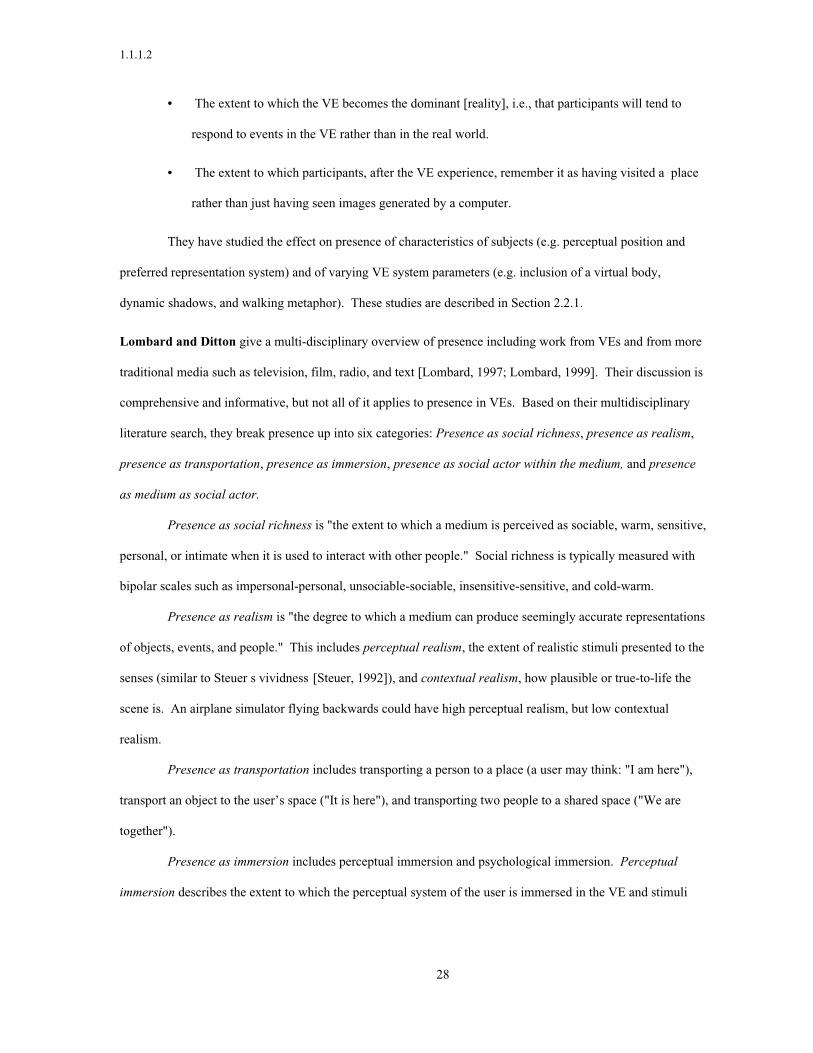
1.1.1.2
28
• The extent to which the VE becomes the dominant [reality], i.e., that participants will tend to
respond to events in the VE rather than in the real world.
• The extent to which participants, after the VE experience, remember it as having visited a place
rather than just having seen images generated by a computer.
They have studied the effect on presence of characteristics of subjects (e.g. perceptual position and
preferred representation system) and of varying VE system parameters (e.g. inclusion of a virtual body,
dynamic shadows, and walking metaphor). These studies are described in Section 2.2.1.
Lombard and Ditton give a multi-disciplinary overview of presence including work from VEs and from more
traditional media such as television, film, radio, and text [Lombard, 1997; Lombard, 1999]. Their discussion is
comprehensive and informative, but not all of it applies to presence in VEs. Based on their multidisciplinary
literature search, they break presence up into six categories: Presence as social richness, presence as realism,
presence as transportation, presence as immersion, presence as social actor within the medium, and presence
as medium as social actor.
Presence as social richness is "the extent to which a medium is perceived as sociable, warm, sensitive,
personal, or intimate when it is used to interact with other people." Social richness is typically measured with
bipolar scales such as impersonal-personal, unsociable-sociable, insensitive-sensitive, and cold-warm.
Presence as realism is "the degree to which a medium can produce seemingly accurate representations
of objects, events, and people." This includes perceptual realism, the extent of realistic stimuli presented to the
senses (similar to Steuer s vividness [Steuer, 1992]), and contextual realism, how plausible or true-to-life the
scene is. An airplane simulator flying backwards could have high perceptual realism, but low contextual
realism.
Presence as transportation includes transporting a person to a place (a user may think: "I am here"),
transport an object to the user’s space ("It is here"), and transporting two people to a shared space ("We are
together").
Presence as immersion includes perceptual immersion and psychological immersion. Perceptual
immersion describes the extent to which the perceptual system of the user is immersed in the VE and stimuli

1.1.1.2
29
from the real world are excluded. Psychological immersion, on the other hand, describes the extent to which
the user is involved, absorbed, engaged, and engrossed.
Presence as social actor within medium is the presence evoked by feeling co-located with a simulated
entity within a medium. This includes feeling co-located with others in a multi-user VE or feeling present,
within a VE, with an entity simulated by the computer.
Presence as medium as social actor involves social responses of media users not to entities (people or
computer characters) within the medium, but to cues provided by the medium itself. They state that because
computers use natural language, interact in real time, and fill traditionally social roles (e.g. bank teller and
teacher), even experienced computer users tend to respond to them as social entities. When people talk to
computers or televisions (often because the equipment is not functioning properly) they are treating the medium
as a social actor.
Next they assert that presence — "the illusion that a mediated experience is not mediated" — can be split
into two categories: "the medium can appear to be invisible" (presence as invisible medium) and "the medium
can appear to be transformed into something other than a medium" (presence as transformed medium). They
also state that presence "does not occur in degrees but either does or does not occur at any instant during media
use; the subjective feeling that a medium or media-use experience produces a greater or lesser sense of presence
is attributable to there being a greater or lesser number of instants during the experience in which the illusion of
nonmediation occurs."
Lombard and Ditton then discuss a number of variables that they hypothesize affect presence:
Number and consistency of sensory outputs. The greater number of senses stimulated and the more
consistent the stimuli, the greater the evoked presence.
Visual display characteristics. Better image quality should improve presence; increased image size
and increased field of view should increase presence; coherent motion and realistic color should increase
presence; use of stereoscopic imagery should increase presence.
Aural presentation characteristics. Better sound quality (frequency range, dynamic range, and signal
to noise ratio) should increase presence. Appropriate three-dimensional sound and ambient noise should
increase presence.

1.1.1.2
30
Stimuli for other senses. Appropriate olfactory cues, movement (either self-propelled or from the
system), tactile stimuli, and use of force displays ( [responding] to user input with the sensations of physical
resistance ) should each increase presence.
Interactivity. They name five variables that relate interactivity to presence. The greater the number of
inputs that a medium accepts from a user, the more presence the system should evoke. Presence should increase
with the number of modifiable characteristics of the media presentation. Presence should increase with the
range of change possible in each media characteristic. The correspondence between user input and media
reaction should increase presence by enforcing more natural cause-effect relationships. Finally, the speed of
response to user input should affect presence, with fast responses evoking more presence.
Obtrusiveness of a medium. "For an illusion of nonmediation to be effective, the medium should not
be obvious or obtrusive." Less obtrusive media should evoke more presence.
Live versus recorded or constructed experience. "Live" media (when events are displayed as they
happen, such as live television) should evoke more presence than recorded or constructed media should.
Number of people. "A ... feature that may encourage a sense of presence is the number of people the
user can (or must) encounter while using the medium." Greater social interactivity should evoke more
presence.
Lombard and Ditton describe a number of variables relating the content of media to presence.
Social realism: More realistic storylines, characters, and actions should evoke more presence.
Use of media conventions. Use of media conventions is likely to reduce presence by reminding the
user that they are engaging with a mediated environment. For example, using a computer in a traditional role,
such as word processing, is likely to remind users that they are engaging with a computer, because many people
associate word processing with computers. Users are not likely to be reminded that they are using a computer
when the computer s role is less conventional, such as playing cards with friends, talking to and seeing their
parents (teleconferencing), or reading a book.
Nature and number of tasks. The type of task in which the user participates, if any, may make it more
or less difficult to establish presence [Heeter, 1992]. Sheridan points out that the degree of control in the task
may also influence presence [Sheridan, 1992].

1.1.1.2
31
They discuss variables that relate characteristics of the user to presence. Willingness to suspend
disbelief. People who are willing to suspend disbelief are more likely to experience a medium as presence-
inducing.
Knowledge of and prior experience with the medium. Presence might increase with multiple exposures
to a medium, as users become comfortable with it [Held, 1992]. Presence might also decrease as novelty wears
off [Heeter, 1992].
They also discuss the effects of presence. They note that high-presence systems can evoke arousal and
other physiological effects and reactions. They hypothesize that high presence might be related to enjoyment,
involvement, task performance, skills training, desensitization, persuasion (e.g. in advertisements), memory,
and social judgment.
2.2 Previous presence experiments
Many of the experiments investigating presence have been conducted by Mel Slater and his group —
first at Queen Mary and Westfield College and more recently at University College London (UCL). First, we
describe Slater et al. s research projects (2.2.1), and then we discuss work done by other groups (2.2.2). Unless
stated otherwise, all findings reported here were significant at the P˚<˚0.050 level. To further clarify some of
the lists of results, we state explicitly whether or not the results are significant.
2.2.1 Slater et al.
Representations systems, perceptual position, and presence. Slater and Usoh investigated the effect on
presence of three things: 1) inclusion of a virtual body (VB), 2) users perceptual position (does the user
remember events in the first, second, or third person?), and 3) users primary representation systems (does the
user experience events primarily using the audio, visual, or kinesthetic representation system?) [Slater, 1993].
Nine of the seventeen subjects (computer science graduate students) were randomly assigned to the
experimental group in which each subject was represented with a VB in the VE. An arrow represented the
subjects in the eight-member control group. The subjects engaged in a number of tasks: movement about a
cluttered room, reacting to flying objects, reacting to being virtually upside-down, building a structure from
blocks, and walking a plank over a virtual precipice. The devices used to measure presence were a direct

1.1.1.2
32
subjective question on a post-experiment questionnaire, a record of subjects behavioral reactions to the virtual
objects flying at them (notes were taken during the experiment), and their behavioral reactions to socially
conditioned responses such as being asked the time.
To assess the primary representation system, they had each subject write a post-experiment essay on
his experience. The essays were broken up into sentences. Long sentences linked by a conjunction were
counted as two sentences. The primary representation system was taken as a three-element vector: the ratios of
the number of audio (A — Audio Ratio), visual (V — Visual Ratio), or kinesthetic (K — Kinesthetic Ratio) words
used in the essay to the total number of sentences. The perceptual position was the three-element vector of
ratios between the counts of reference frames used (first, second, or third person) and the total number of
sentences.
They found that
• Independent of including the virtual body, the higher the Visual Ratio, the greater the sense of
presence.
• For those with a virtual body, the higher the Kinesthetic Ratio, the greater the sense of presence.
• For those without a virtual body, the higher the Kinesthetic Ratio, the lower presence.
• Presence increased up to a ratio of 0.7 first-person usage and declined thereafter.
They stated the results as tentative due to the low number of subjects and the fact that the subjects did
not represent the general population.
Walking metaphor. Slater et al. described an experiment in which sixteen subjects moved about in a VE with
a visual cliff [Slater, 1995b]. Half of the subjects used a walking-in-place metaphor for movement in the VE,
the other half flew by pointing a 3D mouse. In the experiment, subjects moved an object from the ground onto
a chair at the other side of the virtual hole. Within the VE, subjects were represented with a virtual body
consisting of a hand (tracked) and a simple human figure. They used two metrics of presence: a three-question
presence questionnaire and whether the subject walked over the hole in the floor to reach the other side of the
room. The questionnaire also included questions measuring the extent to which the subject felt associated with
the VB.

1.1.1.2
33
They concluded that, for walkers , the greater the association with the VB, the greater the reported
presence. For pointers there was no correlation between VB association and reported presence. They found
that walking over the precipice to reach the chair (and deposit the object) was associated with lower reported
presence. Analysis also showed that a high level of reported nausea (reported on a questionnaire) correlated
significantly with a higher degree of presence.
Presence and presence depth. Slater et al. used a set of nested virtual worlds to investigate how four things
affected presence (measured via post-experiment questionnaire) and presence depth (each additional world-to-
world transition adds one level to the presence depth) [Slater, 1994]. They investigated the effect of 1) world-
to-world transition method (virtual HMD or walking through virtual doors), 2) simulation of gravity, 3)
simulation of a virtual actor, and 4) simulation of a virtual cliff.
The experiment used a fairy-tale-like story line to lead the twenty-four volunteers through a series of
(nested) virtual worlds to collect swords. The volunteer group was counterbalanced into eight groups of three
based on the four independent variables. Within each group, subjects were assigned to go through 2, 4, or 6
levels in the VE. Half of the subjects made the transitions from one virtual world to the next by donning a
virtual HMD, and the other half walked through virtual doors. Half of the volunteers experienced a VE
simulation of the visual cliff; half experienced the VE with no cliff. Half experienced the effect of gravity on
the objects in the world, and half experienced no gravity. Half experienced the presence of a responsive virtual
actor (following them); half experienced an unresponsive virtual actor.
They measured presence with a questionnaire. The questionnaire had three presence questions, and the
presence score was taken as the number of high responses: 6s and 7s on a 7-point scale. They tried alternate
methods of combining the questions including the use of 5s, 6s, and 7s as high responses and a combination
based on principal-components analysis. They found that the use of [m6] as high values best followed
conditions for the study.
They surveyed subjects (via a pre-trial questionnaire) about their primary representation system:
Visual (V) — the world is experience visually,
Auditory (K) — the world is experienced via sound, or

1.1.1.2
34
Kinesthetic (A) — the world is experience kinesthetically
and their representation system:
egocentric — the world is experienced in first person — and
exocentric — the world is experienced in third person.
V, K, and A were computed as the sum of the rankings from the representation system questions.
Egocentric perceptual position was the number of egocentric answers for the egocentric/ exocentric questions.
Their analysis revealed that
• Presence was positively associated with Visual and Kinesthetic, and negatively with Auditory.
• Presence was positively associated with the number of levels (depth) of the virtual environment
experienced if the subject experienced the transitions using the virtual headmounted displays and
negatively if the transitions were made with virtual doors.
They stated that gravity, visual cliff, and virtual actor variables did not show up as significant. This
could be the result of the measurement of presence used. They argued that their presence measure was not
sensitive enough to differentiate the small differences in presence that these simulation techniques might have
evoked.
Dynamic shadows. Slater et al. described an experiment in which the effects of dynamic shadows on both
presence and spatial judgment were studied [Slater, 1995a]. Eight subjects participated. Each was instructed to
use the handheld 3D mouse to select and pick up the virtual spear closest to the wall from behind a virtual
screen (Figure 2.1). The spears were the same height and placed at nearly the same distance, and the virtual
screen hid the bottoms. Therefore, subjects could not have used position on the floor or foreshortening cues to
aid correct spear choice. They hypothesized that subjects would be able to use the shadows of the spears on
the walls to aid their judgment about the closeness to the walls, so that those runs that included shadows would
result in a greater number of correct spears being chosen.
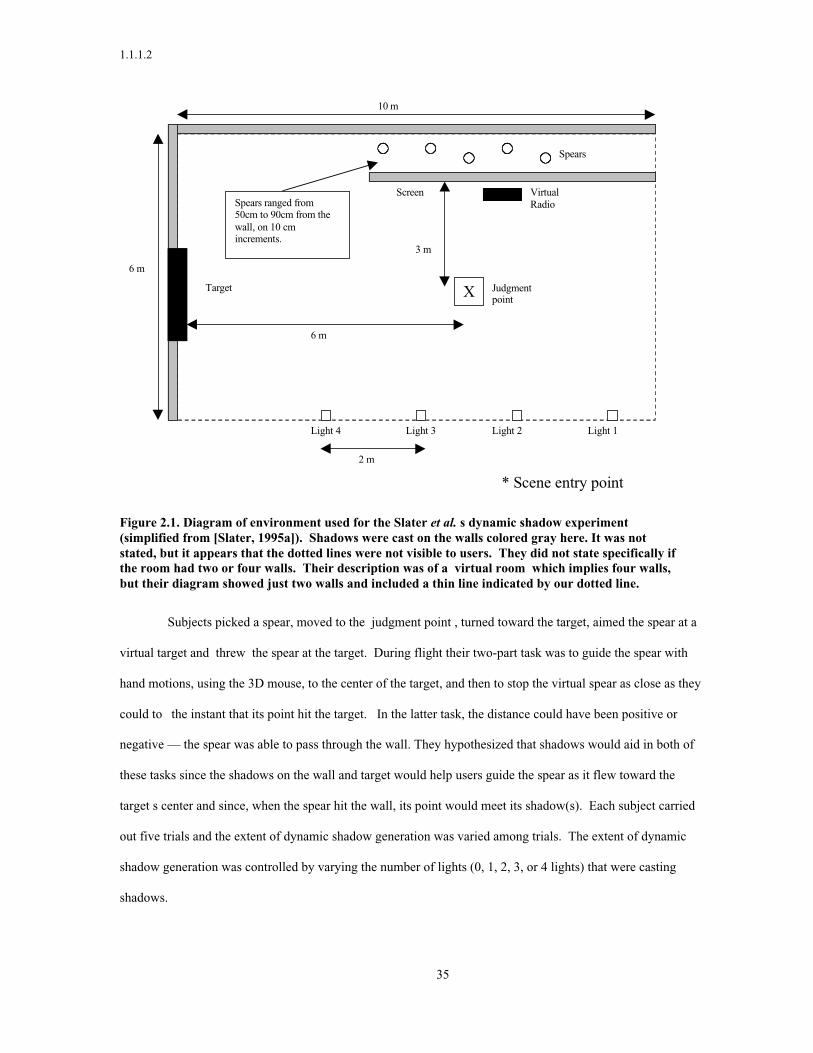
1.1.1.2
35
6 m
Spears ranged from50cm to 90cm from thewall, on 10 cmincrements.
Screen
Spears
VirtualRadio
Light 4 Light 3 Light 2 Light 1
Target
10 m
6 m
3 m
X Judgmentpoint
2 m
* Scene entry point
Figure 2.1. Diagram of environment used for the Slater et al. s dynamic shadow experiment(simplified from [Slater, 1995a]). Shadows were cast on the walls colored gray here. It was notstated, but it appears that the dotted lines were not visible to users. They did not state specifically ifthe room had two or four walls. Their description was of a virtual room which implies four walls,but their diagram showed just two walls and included a thin line indicated by our dotted line.
Subjects picked a spear, moved to the judgment point , turned toward the target, aimed the spear at a
virtual target and threw the spear at the target. During flight their two-part task was to guide the spear with
hand motions, using the 3D mouse, to the center of the target, and then to stop the virtual spear as close as they
could to the instant that its point hit the target. In the latter task, the distance could have been positive or
negative — the spear was able to pass through the wall. They hypothesized that shadows would aid in both of
these tasks since the shadows on the wall and target would help users guide the spear as it flew toward the
target s center and since, when the spear hit the wall, its point would meet its shadow(s). Each subject carried
out five trials and the extent of dynamic shadow generation was varied among trials. The extent of dynamic
shadow generation was controlled by varying the number of lights (0, 1, 2, 3, or 4 lights) that were casting
shadows.

1.1.1.2
36
Spatial judgment was measured by the correctness of spear choice (the subjects were instructed to
chose the spear closest to the wall), closeness of the spear to the center of the target, and distance from the
virtual target that the subject stopped the spear s flight. Presence was measured via a presence questionnaire (as
in [Slater, 1994]) and by having the subject point, while immersed, at a playing radio, whose visual direction in
the VE was different from the audio direction in the real world. Presence was measured as the angle selected:
closer to the virtual radio indicated higher presence.
They also had subjects write an essay before the session in order to determine subjects primary
representation system: visual (V), auditory (A), and kinesthetic (K). This was explained above for [Slater,
1994].
They found
• Shadows made no difference at all to the selection of the correct spear (the one closest to the
wall). No statistical values or means were given.
• Subjects were non-significantly better at guiding the spear toward the center of the target when
shadows were present.
• Subjects were significantly better at stopping the spear as it hit the target when shadows were
generated.
• Presence was significantly and positively related to the number of shadows for subjects whose
visual system dominated over there auditory system (V>A) but not when A>V.
• The angle picked between the virtual and real radios was significantly related to the number of
shadows generated, with a greater number of generated shadows being associated with pointing
closer to the virtual radio.
Immersion, presence, and performance. Slater et al. examined the relationship among immersion, presence,
and performance in a twenty-four-subject study (sixteen males and eight females) [Slater, 1996]. The subjects
task was to reproduce a 3D chess game. The series of moves were the opening moves of a computer vs.
computer game. Subjects could view the sequence of moves as many times as they wished. All of the subjects
were introduced to VEs: they walked around and moved objects in the VE and were introduced to 3D chess.

1.1.1.2
37
The subjects were split into two groups: immersive (inside an HMD) and non-immersive (desktop
VE). Subjects saw the 3D chessboard either in a garden with chessboard in a field on a table, or with no
background setting. The metrics were a questionnaire for presence [Slater, 1994] and a count of the number of
correct moves reproduced for performance.
The experimental data showed that
• Better performance (more chess moves correctly reproduced) was associated with HMD
immersion and with the more realistic (garden) environment.
• Females did not perform as well as males.
• For females, SAT (Spatial Ability Test) scores were positively associated with performance. For
males there was no relation between SAT and performance.
• Previous knowledge of chess was positively associated with better performance.
• Better performance was achieved with a greater number of practice sequences.
• HMD use was positively associated with higher presence.
• Presence was non-significantly higher in the garden environment as compared to the void.
Collision response. Uno and Slater discussed the effects of collision response on presence in VEs [Uno, 1997].
Eighteen subjects participated in two rounds of a virtual bowling game with three independent variables:
elasticity of the colliding bodies; friction among the ball, the pins, and the lanes; and the accuracy of the shape
used to compute the collisions. For the latter, the collision-defining computational shapes of the pins were
simplified to ellipsoids in half of the trials. The dependent variable in the experiment was the subjective sense
of presence as measured by six questions on a post-experiment questionnaire. The presence score was taken as
the number of high responses for the presence questions [m6]. The post-experiment questionnaire also
included questions on simulator sickness.
After the experiment, subjects were asked if they had observed any differences between the two rounds
of bowling (reported on a questionnaire). In the case when elasticity was the changing parameter, half of the
subjects noticed a change. In the case of friction, all of the subjects observed a change. In the case of the
shape, no subjects observed the change. They also found that presence was negatively correlated with reported

1.1.1.2
38
sickness and was not affected by either elasticity or shape (if friction was low). If friction was high, presence
was positively associated with correct shape and negatively associated with elasticity.
Presence, co-presence, and group accord. Steed et al. studied the relationship among presence, co-presence
(the sense of being with other people), and group accord (the sense of harmony, enjoyment, and cooperation
with other people) [Steed, 1999]. In the experiment, twenty groups of three (two on desktops and the third in a
HMD — all geographically distributed) solved a riddle that was described in text posters on the walls of the
virtual room. They shared a virtual space and could communicate via a shared audio channel. Presence, co-
presence, and group accord were measured using questionnaires — six, eight, and seven questions respectively.
For presence and group accord, the questionnaires were scored as the number of high responses [m6]. Co-
presence was measured as a sum of responses to its questions, not the count of high responses.
The analysis of the data showed that there was a significant relationship between presence and co-
presence, that there was no significant effect of immersion on presence, that group accord and co-presence were
significantly positively correlated, and that leadership increased significantly with immersion only for males.
Walking metaphors. In [Usoh, 1999], Usoh et al. described an extension to their earlier experiment, described
in [Slater, 1995b]. The experiment used the visual cliff to investigate the role of walking metaphor on presence
and ease of locomotion. The study consisted of 33 na ve subjects and 11 expert subjects who worked in the
area of computer graphics. The study was performed between-subjects, and subjects were counterbalanced
among real walking, walking-in-place, and point-and-fly. Questionnaires included Kennedy’s simulator
sickness questionnaire (SSQ) [Kennedy, 1993] and an extension of Slater s presence questionnaire [Slater,
1995b]. There was also a post-experiment oral debriefing.
They found that
• Presence correlated with association with the virtual body.
• Presence was higher for virtual walkers than flyers.
• Presence was higher for real walkers than virtual walkers. However, the difference between
groups diminished and was not significant when oculomotor discomfort was taken into account

1.1.1.2
39
(much of the lower presence for virtual walkers was explained by their greater oculomotor
discomfort).
• Real walking was seen as more natural, easy, and uncomplicated.
• There were no significant differences for behavioral presence measure among the locomotion
types.
• There were no significant differences between the expert and naive groups.
• An unexpected result: The virtual environment was reported as very compelling.
Breaks in presence. Slater and Steed investigated a novel measure of presence. They used the number of
times that a subject reported a break in presence (BIP — when something, either internal or external, caused a
subject to remember he was in the laboratory) to assess presence [Slater, 2000]. The number of BIPs (transitions
from virtual to real) was counted, and using some simplifying assumptions, a probabilistic Markov Chain
model [was] constructed to model these transitions. This can be used to estimate the equilibrium probability of
being present in the VE. In summary, a lower number of BIPs resulted in a higher score for this measure.
Subjects reported a BIP only when it happened, thereby lessening the disruptive effect of the reporting. They
also used a five-question version of their earlier presence questionnaire [Usoh, 1999] to assess presence. Body
and hand movements were computed from tracker data.
The study investigated the effect of body movement on presence in VEs. Of the twenty subjects, ten
touched virtual chess pieces on a virtual 3D chess board in order to move them (the active group). The other ten
subjects clicked a handheld mouse button to move the pieces (the control group). The results revealed a
significant correlation between an increase in the number of BIPs and lower presence as reported on the
questionnaires. For the high activity group, there was also a significant positive correlation between body
movement and presence. For the low activity group, there was not a significant association between body
movement and presence. The mean presence levels for the two groups were contrary to expectation. The mean
presence for the low activity group was non-significantly higher than that of the high activity group.
Presence questionnaires in reality. In [Usoh, 2000], Usoh et al. investigated the use of two questionnaires to
discriminate real and virtual experiences. One questionnaire, the Slater, Usoh, and Steed questionnaire (SUS),

1.1.1.2
40
was made up of six of the questions that the authors have used in previous questionnaires [Usoh, 1999].
Throughout this dissertation we refer to this questionnaire as the Reported Presence measure of the UCL
Presence Questionnaire. The other questionnaire (WS) was the Witmer and Singer s presence questionnaire
[Witmer, 1998]. The test was performed between-subjects. Ten subjects searched (individually) for a box in
real office, the other ten searched (individually) for a box in a virtual office. Each group completed both
questionnaires immediately after the experience.
They found that both questionnaires had higher values in the real world, but only the SUS was
significantly so. They stated that the difference was significant due to only two questions:
Please rate your sense of being in the space, and
During the experience, I often thought I was really standing in the office space.
They conclude that although such questionnaires had been previously found to be useful when all
subjects experience the same environment, their utility would be doubtful when comparing experiences across
environments, since they poorly differentiated real and virtual environments.
2.2.2 Other presence studies
In addition to the work by Slater et al., a number of other researchers have studied the effects of
various VE system parameters on presence. Following is a description of these studies.
Presence and fear of heights. Regenbrecht et al. described a 37-subject study in which the relationship
between presence and fear of heights was analyzed [Regenbrecht, 1997]. Subjects were tasked with finding
books in the VE. In order to reach these books they had to cross one of two small virtual bridges in the VE or
walk across the virtual depth (eight meters deep) as if on a glass ceiling. The length of the chasm crossed was
not stated, but it was less than four meters (the size of their interaction space) and appeared in pictures in the
text to be approximately 1-2 meters. All subjects experienced the same condition and each subject entered the
environment only once. Before the experiment, they assessed fear of heights and avoidance behavior using
Cohen s height anxiety and height avoidance questionnaires [Cohen, 1977]. After the 20-minute experiment,
they used a questionnaire developed for this experiment to assess presence and reported fear.

1.1.1.2
41
The analysis showed that reported fear had a significant relationship with height anxiety (positive),
height avoidance (negative), and presence (positive). That is, reported fear was significantly higher for subjects
who reported higher presence and (pre-experiment) higher height anxiety. Reported fear was significantly
lower, however, for subjects who reported higher height avoidance, which suggests that participants with an
established avoidance behavior find a way to lower their fear in the [VE].
Presence, co-presence, and susceptibility for presence. Thie investigated the relationships among presence,
co-presence (the extent that subjects feel they are with others in the VE) , and susceptibility-for-presence
(willingness to accept the VE, to take in the VE, and to block out the real world) [Thie, 1998]. The experiment
had sixteen sets of three users who performed a decision-making task (task not described) using a Netscape-
based multi-user VE on non-immersive desktops. The subjects were split into two groups: one with maximized
co-presence cues, the other with minimized co-presence cues. Maximizing social virtual presence cues was
accomplished by adding an avatar representation in the VE and by allowing nicknames, enabling gestures , and
indicating who said what in the accompanying text-based communication system. Thie measured
susceptibility-for-presence, co-presence, and presence using a modification of questionnaires from [Psotka,
1993]. He also measured comeback rate by observing if subjects reentered the VE after the test but before
leaving the lab. Subjects had to wait for some time (unspecified) after the experiment and were told they could
either read or reenter the VE.
The results showed that co-presence and presence correlated. The results did not replicate Psotka’s
findings that susceptibility-for-presence and presence were related. Maximizing and minimizing the selected
co-presence cues did not significantly affect any of the dependent measures.
Haptic feedback and presence, co-presence, and task performance. Sallnas investigated the effect of haptic
feedback on presence, co-presence, task performance, and perceived task performance [Sallnas, 1999]. She also
measured skin conductance, but has not yet analyzed the results. Fourteen male-female pairs collaborated to
stack virtual blocks — the subjects had to push on opposite sides of the blocks in order to lift and stack the
blocks. Half of the pairs had haptic feedback with the PHANToM. Subject pairs were not in the same room,
but all had audio links. Sallnas used Witmer and Singer s presence questionnaire to measure presence [Witmer,
1998]. The co-presence questionnaire considered the social aspects of the experience: unsociable-sociable,

1.1.1.2
42
insensitive-sensitive, impersonal-personal, cold-warm [Short, 1976]. Task performance was the amount of time
to complete the stacking task. Perceived task performance was measured via questionnaire. The perceived task
performance questionnaire was not explained.
The analysis showed that with haptics
• Task performance was significantly better (P < 0.050),
• There was no significant difference in co-presence,
• Presence was significantly higher (P < 0.050)
• Perceived performance was significantly higher (P < 0.010)
Sensory stimuli and presence. Dihn et al. discussed an experiment that studied the effect of tactile, olfactory,
audio, and visual sensory cues on presence, memory of spatial layout, and memory of object location [Dihn,
1999]. The 322-subject study used two levels of visual details and the existence or absence of tactile, auditory,
and olfactory information. After elimination of a few of the participants for not completing the questionnaires or
for equipment failures, there were at least 15 subjects for each of the 16 experimental condition combinations.
The VE allowed users to proceed on a predefined path in a virtual office place. The subjects could not
veer from the path, but could look around in the VE. While inside the VE, the possible sensory inputs were the
smell of coffee near the coffee pot in the front room, hearing and feeling the wind from a fan, the sound of the
copier running, hearing the toilet flush, and feeling the heat of the virtual sun (a heat lamp) while on the
balcony. Visual fidelity reduction was accomplished by reducing the quality of texture mapping and taking
away directional lighting in the virtual office. To measure presence, they used one question, rating the overall
presence from 0 to 100, and a 13-item questionnaire adapted from Fontaine and Hendrix [Fontaine, 1992;
Hendrix, 1996]. For memory assessment, they used a four-item questionnaire for spatial layout and a five-item
questionnaire for object location.
They found that
• There was a significant correlation between presence (both measures) and both auditory and tactile
cues.
• There was a notable trend (a non-significant correlation) between presence and olfactory cues.

1.1.1.2
43
• The difference in visual cues was not significant in predicting presence.
• There was a significant effect for olfactory and tactile cues on memory of object location.
• There were no significant effects for sensory cues on memory of spatial layout.
They stated that the lack of impact from visual fidelity on presence could have been due to the fact that
both were at the low end of the visual fidelity spectrum.
2.3 Measuring physiological correlates to a virtual environment experience
Eberhart and Kizakevich. The earliest published experiments investigating physiological reactions to a VE
experience were performed by Eberhart and Kizakevich [Eberhart, 1993]. The physiological signals their
system monitored were core body temperature (a swallowed probe), skin temperature, skin resistance, and heart
rate. They described two experiments. In the first, users navigated with a 2D mouse — once at low speed, once
at high speeds. There was a non-significant increase in blood pressure at higher navigation speed and a non-
significant drop in cardiac output over the course of each test. In the second experiment, the task was to keep
the image of the hand inside a virtual cube while walking on a treadmill. The treadmill ran at two speeds.
Feedback on performance was given either via instant audio and visual or via delayed audio. Detailed results
were not given.
Jorgensen et al. used heart rate, skin temperature, and skin conductance to assess the effectiveness of
navigation metaphors in VEs [Jorgensen, 1997]. At the time of publication, results were not available, though
they did state that there were significant heart rate, skin temperature, and breathing responses during the flying
task. We have not located further publication of their work.
Weiderhold et al. used heart rate, skin temperature, respiration, and skin conductance to provide objective
evidence of phobia desensitization [Weiderhold, 1998]. At the time of the publication, data from only two
patients (one phobic, one non-phobic) had been collected and analyzed. They found physiological support for
the desensitization primarily from skin conductance. It was the quickest to react to phobic stimuli and showed
the most change over treatment as desensitization occurred.

1.1.1.2
44
Pugnetti et al. In [Pugnetti, 1996; Pugnetti, 1995], Pugnetti et al. studied human responses to immersion in a
VE using electroencephalography (EEG), and electrocardiography (ECG). Subjects navigated a VE version of
the Wisconsin Card Sorting Test [Jones, 1948]: a series of virtual rooms in which there was a pattern to the
correct choice of three exit doors. The choice was based on correctly following the clues on the entrance door:
its color, shape, or number of dots. They were informed visually if the choice was correct: after a correct
choice, they saw the next room, after an incorrect choice, they had an additional corridor to navigate. Their task
was to find their way through a series of rooms by choosing the correct door to exit in each room.
They found central nervous system activity similar to that seen during learning in a real environment:
amplitude of alpha waves (measured via EEG) increased over time and the brains reaction (quick, high
amplitude brain waves) to irrelevant stimuli (a tone once per second) had greater latency and lower amplitudes
— interpreted as subjects being engrossed in the VE. There were also physiological responses to the frustration
of incorrect choices: heart rate from the ECG recordings served as a correlate of psychological frustration in
sensitive subjects who were [performing poorly]"
Pugnetti, Meehan et al. expanded Pugnetti et al. s previous studies by investigating physiological
correlates of a VE experience [Meehan, 2000c; Pugnetti, 2000]. We confirmed the earlier findings for
learning-related brain activity in the environment and found significant physiological reaction to content of the
virtual environment: heart rate and skin conductance increased when subjects performed poorly at the task in
the VE. We also found that heart rate decreased over time in the environment, supporting the idea that subjects
could relax in VEs even with much physiological and VE equipment attached.
Yamaguchi investigated fatigue caused by immersion in a VE [Yamaguchi, 1999]. Ten male subjects
underwent a thirty minute controlled VE exposure including two psychological interviews by a virtual nurse —
one low stress, one high stress. None of their physiological parameters (heart rate, skin conductance, core body
temperature, urinary catecholamine release) indicated that significantly more fatigue occurred during the VE
exposure than during the a control session in which subjects watched a video of a static picture of a living room
with a TV set in it.
Cobb et al. investigated physiological and reported sickness effects caused during exposure to VEs [Cobb,
1999]. They measured heart rate, and salivary cortisol composition (SCC). They found that both heart rate and

1.1.1.2
45
SCC reflected well (the correlations were not given) the simulator sickness as reported on Kennedy s SSQ
[Kennedy, 1993]. Heart rate rose as subjects put on the equipment and entered the VE (possibly due to
anticipation of the experiment or novelty of the VE) and decreased thereafter. This decrease in heart rate over
time was also found in [Meehan, 2000c].

1.1.1.3
46
Chapter 3 Experimental design
3.1 Research question
Researchers have investigated presence in virtual environments since the early 1990 s. The majority
of the measures used in experiments and discussed in the literature have been subjective [Regenbrecht, 1997;
Slater, 2000; Usoh, 1999; Witmer, 1998]. Most groups have used questionnaires or single question scales.
Some groups have used behavioral measures. All of the measures attempted to assess whether users of virtual
environments (VEs) felt present in the depicted world. There has been much investigation as to how to best do
this [Lombard, 1997; Meehan, 2000a; Meehan, 2000b; Regenbrecht, 1997; Sheridan, 1996; Slater, 1999; Slater,
2000; Usoh, 1999; Witmer, 1998], and researchers have yearned for a measure that is reliable, valid, multi-level
sensitive, and objective.
We propose measures to satisfy these requirements: physiological reactions. Our three experiments
investigated the use of physiological reactions as reliable, valid, multi-level sensitive, and objective measures of
presence in VEs.
In this chapter, we discuss our hypotheses about these measures, how the experimental design
investigated these hypotheses, and details of the experimental design.
The terminology is defined below:
Multiple Exposures - The Effect of Multiple Exposures on Presence. The first experiment.
Passive Haptics - The Effect of Passive Haptics on Presence. The second experiment.
Frame Rate - The Effect of Frame Rate on Presence. The third experiment.
Task - A single exposure of the subject to the environment.
Session - A set of one or more tasks on a single day (Multiple Exposures and Frame Rate had multiple
tasks per session, Passive Haptics did not).

1.1.1.2
47
For more discussion of validity, reliability, multi-level sensitivity, and objectivity of presence
measures, please see Chapters 1 and 4.
3.2 Our environment and physiological reaction as a measure of presence
Many VEs evoke physiological reactions. The physiological reactions evoked will differ from VE to
VE — as they do among real environments. Standing near a flowing stream with a view of a mountain in
autumn should evoke a calming affect (increased parasympathetic nervous system (PNS) tone, decreased
sympathetic nervous system (SNS) tone — see Appendix A). Standing in a raging fire while a building collapses
around you should evoke a stress response (decreased PNS, increased SNS tone). Our understanding of what
people mean by presence is that the psychological sense of being there should correspond to physiological
reactions similar to those evoked by similar real environments. We also believe that the more presence a VE
evokes, the more physiological reaction it should evoke. In short, we believe that the psychological and
physiological responses to the VE should correlate.
In our VE, a 20-foot cliff was depicted (see Figure 3.1). It is well known that standing near a height
and moving about at risk of falling causes physiological reactions in individuals. [Abelson, 1989]. In particular
there is an increase in heart rate and skin conductance and a decrease in skin temperature. Below, we describe
our hypotheses and how our experiments used our VE to investigate them. We chose our VE because users
have reported strong reactions to it. If physiological measures of presence did not work with so strong a
stimulus, they would not in more subtle VEs.

1.1.1.2
48
Figure 3.1. Side view of the virtual environment.Subjects start in the Training Room and laterproceed to the Pit Room.
3.3 The measures
We hypothesized that, in our VE, physiological reaction to the Pit Room (Figure 3.1) would be high
and there would be less physiological reaction to the Training Room. Therefore, we constructed our measures
as differences between the reactions in the two rooms:
∆∆∆∆Heart Rate = mean heart rate Pit Room - mean heart rate Training Room
∆∆∆∆Skin Conductance = mean skin conductance Pit Room - mean skin conductance Training Room
∆∆∆∆Skin Temperature = mean skin temperature Training Room - mean skin temperature Pit Room
The order of the arguments in ∆Skin Temperature was switched so that the measure would increase
with more physiological reaction (as do ∆Heart Rate and ∆Skin Conductance).
We chose heart rate, skin conductance, and skin temperature because 1) they are well studied and well
understood measures, and 2) they are easily measured from the palms and chest of the subjects. See Appendix
A for discussion of the physiological reactions and how we measured them.

1.1.1.2
49
We measured the physiological reactions with the ProComp+ tethered telemetry system from Thought
Technologies, Ltd. The device can accommodate up to 8 sensors, two of which sample at a rate of 256˚Hz. The
other six sample at 32 Hz. The Heart Rate was measured with the Blood Volume Pulse photoplethysmograph
sensor (256˚Hz) in the Multiple Exposures study and with a three-electrode electrocardiograph
(Ag-AgCl˚electrodes) in the Passive Haptics and Frame Rate studies (256˚Hz). Skin conductance was measured
with two 1-cm2 Ag-AgCl electrodes connected to the index and middle fingers of the left hand with Velcro
(32˚Hz). Skin Temperature was measured with a 0.3-cm bead thermistor connected to the index finger of the
left hand with porous tape (32˚Hz). The battery-powered analog to digital converter sent data via fiber-optic
cable to a server running on a PC. The device and sensors are pictured in Figure 3.2. For further information
on physiological reaction and the placement of the sensors, see Appendix A.
Figure 3.2. Procomp+ device.From left to right: the electrocardiograph, skin conductance,and skin temperature sensors.
We used a modified version of the University College London Presence Questionnaire [Usoh, 1999] to
measure Reported Presence (7 questions), Reported Behavioral Presence (3 questions), and Reported Ease of
Locomotion (3 questions). To measure simulator sickness, we used Kennedy s Simulator Sickness
Questionnaire (SSQ) [Kennedy, 1993]. To measure height anxiety and avoidance, we used Cohen s height
questionnaire [Cohen, 1977]. These questionnaires are included in Appendix B.
To measure Observed Behavioral Presence — the extent to which a user acts as if in a corresponding
real environment — we scored actions from videotapes of the sessions. It was scored as a count of behaviors

1.1.1.2
50
believed to be associated with moving about near a real 20-foot drop. These actions were chosen because they
were actions that we had seen users perform in demonstrations of our VE system or because we believed they
were appropriate. The measure was scored by adding together the counts of each action. We believed Walking
across the 20-foot pit as if it were a glass floor was a sign of lower presence, so the count of this was subtracted
from the Observed Behavioral Presence score.
Observed Behavioral Presence = (S Count(j) | j != [1,2]) - Count (1) - Count (2)
Behavior Counts1 Walks across 20-foot pit, outgoing Yes = 1 No = 02 Walks across 20-foot pit, incoming Yes = 1 No = 03 Slows motion when entering Pit Room Yes = 1 No = 04 Leans against wall, outgoing Yes = 1 No = 05 Leans against wall, incoming Yes = 1 No = 06 Curls toes Count7 Tests edge with foot Count8 Kneels to feel ledge Count9 Sticks out arms for balance Count10 Takes series of baby steps Count of series of steps11 Peers over ledge Count12 Vocal Exclamations Count13 Change of breath pattern Count14 Loss of balance (not on the wooden ledge) Count15 Loss of balance on wooden ledge Count
Table 3.1. The items scored from videotape for the Observed Behavioral Presence measure.
3.4 Reliability, validity, multi-level sensitivity, objectivity, and our hypotheses
Singleton identifies three important aspects for a useful measure of psychological constructs:
reliability, validity, and objectivity (which he calls lack of bias) [Singleton, 1993]. Lipsey points out that
experimental measures must be sensitive [Lipsey, 1998]. We extend his discussion by stating that a measure
must be multi-level sensitive. We constructed our hypotheses to analyze these four aspects of a measure:
reliability, validity, multi-level sensitivity, and objectivity. Below, we discuss these properties of a measure and
then summarize and discuss our hypotheses.
Reliability is the extent to which the same test applied on different occasions yields the same
result [Sutherland, 1996]. We tested reliability of the physiological measures by looking at whether there was
consistently greater physiological reaction to the Pit Room as compared to the Training Room — for multiple
exposures and multiple subjects (Hypoth1). In general, when examining the reliability of a measure, one must
1.1.1.2
51
investigate the extent to which adaptation or desensitization reduces repeatability. Therefore, we tested whether
the measures decreased to zero over a limited number of exposures. We hypothesized that they would decrease
over a limited number of exposures, but not to zero (Hypoth2).
Validity is the extent to which a test or experiment genuinely measures what it purports to measure
[Sutherland, 1996]. Validity is first assessed subjectively by answering the question: Does the operational
definition measure what it purports to measure? [Singleton, 1993]. We discuss why we subjectively expect
physiological reactions to measure presence in our VE in Chapter 1 and earlier in this chapter.
Validity is statistically assessed by correlations with related or well-established measures of the same
construct [Singleton, 1993]. We investigated the correlations of the physiological measures with the well-
established UCL Presence Questionnaire (see Hypoth3).
Validity is also assessed by accumulation of research evidence that a measure consistently follows
hypothesized relationships between the underlying concept and the independent variables. For example,
suppose you have developed a measure of presence. In your first experiment, this measure yields significantly
higher results when the VE uses a new global illumination algorithm as compared to Phong Shading. In
absence of other evidence, one might not conclude that you are measuring presence at all, but instead are
measuring lighting realism. Suppose you conduct another study in which your measure is significantly higher
when using 3D aural localization as compared to no sound. Now, there is evidence that you are not measuring
lighting realism. In absence of other evidence, however, one might conclude that you are measuring audio-
visual realism. The more studies and the broader the range of studies in which a measure follows hypothesized
relationships, the greater [your] confidence that a particular operational definition is a valid measure of the
concept [Singleton, 1993]. We tested two independent hypothesized relationships for our measure. We
expected presence, and therefore physiological reaction, to be higher with the inclusion of a 1.5-inch wooden
ledge and to increase with increasing with frame rate (Hypoth4).
To be objective, the measure must be determined by and emphasize the features of the object or thing
dealt with, rather than the thoughts and feelings of the [experimenter or subject] [Webster, 1994]. Lack of
objectivity can come from two sources: Experimenter bias and subject bias. Subject bias can come from
numerous sources including demand characteristics, cues in an experimental situation that communicate to

1.1.1.2
52
subjects what is expected and what the experimenter hopes to find [Singleton, 1993]. Subject bias can also
come from subject apprehension about the evaluation of their performance or [from] their resentment about
being coerced into taking part in an experiment [Singleton, 1993] . Experimenter bias comes from
experimenters non-verbally communicating their own expectations to subjects.
Providing a good cover story for or a distracter task in the experiment can help control bias. Both keep
the subjects distracted and allow less-noticeable manipulation of the independent variable(s) and measurement
of the dependent variable(s) [Singleton, 1993]. We had a distracter task in all three studies: carrying objects
into the Pit Room to be dropped or placed there. In Passive Haptics, we also had a cover story: subjects were
told they were visiting a famous professor s house and were performing his daily routine. In Frame Rate, we
improved the distracter task, subjects picked up and dropped blocks to the lower floor in the Pit Room, but we
did not come up with a suitable cover story.
Bias can also be overcome by keeping experimenters and subjects blind to the conditions of the
experiment. We were able to keep subjects blind to the condition in all three studies. The subjects saw only
half of the real laboratory — that corresponding to the Training Room. Styrofoam walls and a curtain blocked
the view of the Pit Room. This kept subjects blind to the condition in Passive Haptics and kept subjects
guessing as to whether there was really a 20-foot drop. In Frame Rate, subjects were not informed of the frame
rate at which the VE was running — they were blind to the condition. In Multiple Exposures, there was no
condition manipulated. The experimenters were not blind to the condition in either the Passive Haptics or
Frame Rate studies. In Passive Haptics, the experimenter could see the 1.5-inch wooden ledge as he carried the
cables for the subject. In Frame Rate, we chose to keep the experimenter aware of the condition in order to
ensure that the subjects were exposed to the conditions in the proper orders. We have no reason to believe,
however, that the experimenters knowledge of the condition biased the subjects physiological, behavioral, or
questionnaire responses.
Bias can also be lessened by automation of the experiment and instructions given to the subjects
[Singleton, 1993]. The nature of VEs is automatic. Subjects movements and object manipulations in the
environment were handled automatically by the VE software. We additionally automated the experiment by
providing automatic Internet-based administration of all questionnaires. An experimenter sat subjects down at a

1.1.1.2
53
computer and clicked on the appropriate html link for their stage in the experiment (pre-exposure or post-
exposure). After finishing a questionnaire, they were automatically forwarded to the next by the browser. At
the end of a set of questionnaires, a web page asked them to tell the experimenter that they had completed the
questionnaires.
Giving uniform instructions to the subjects also helped reduce bias. In Multiple Exposures, we
accomplished this by reading the instructions from a script. In Passive Haptics and Frame Rate, we improved
our design by playing the instructions from an audio compact disc. In all three studies, we did not talk to
subjects during the experiment unless we had to warn them of some danger (e.g. if a subject was about to trip on
cables). If subjects asked questions during the experiments, we did not respond.
In addition to the attempts to control bias described above, we also argue that the physiological
measures are inherently exposed to less bias than either questionnaires or behavioral measures. This is argued
in Chapter 1.
Sensitivity is the likelihood that an effect, if present, will be detected [Lipsey, 1998]. If a measure is
also valid, then that difference will also represent the effect under investigation [Lipsey, 1998]. Greater
sensitivity improves investigation because it improves the chances of detecting differences in the dependent
variable caused by the manipulation of independent variables, thus helping establish relationships among the
variables. Sensitivity also helps reduce the cost of experimentation. The more sensitive a measure, the fewer
subjects needed to show statistical significance and the lower the time and monetary cost of the experiment.
For a measure to be useful, it must be sensitive to differences along some goodness scale. Therefore,
we extend the idea of sensitivity to multi-level sensitivity — the ability of a measure to differentiate multiple
levels of some condition value or independent variable. We expect our measures to increase monotonically as
we improve the virtual environment along some goodness scale (e.g. increasing frame rate). Specifically, we
expect that if x is the condition value and f(x) is our presence measure:
jiji xxiffxfxf >> ),()(
jiji xxiffxfxf == ),()(

1.1.1.2
54
For this relationship to hold, x must be within some useful range. Personal experience suggests an
upper-limit of 60 FPS for useful measurement. Above 60 FPS, we would expect the reactions to level off since
we would not expect the differences in condition to be detected by the average subject. The frame rate
experiment suggests a lower limit of 15 FPS for useful measurement of the physiological measure. Below this
we began to see anomalous reactions to the condition. For Passive Haptics, an artificial range had to be
constructed to meet the above definition. Ours, for example, was constructed as (0= Training Room, 1 = Pit
Room without ledge, 2 = Pit Room with ledge). We investigated the multi-level sensitivity of the physiological
measures in both Passive Haptics and Frame Rate (see Hypoth4).
In summary, we formed our hypotheses as follows:
Hypoth1: There is a consistent physiological reaction to the VE (Reliability and Sensitivity).
Hypoth2: Presence measures decrease over multiple exposures to the same virtual environment, but
not to zero (Reliability).
Hypoth3: Subjective, physiological, and behavioral presence measures correlate (Validity).
Hypoth4: Physiological presence can differentiate among multiple (high, medium, and low) presence
conditions. Specifically, in terms of presence evoked: with passive haptics > without passive haptics; 30 FPS >
20 FPS > 15 FPS > 10 FPS, and the differences among these conditions are less than the gross differences
between the Pit Room and the Training Room (Validity and Multi-level Sensitivity).
Objectivity of the presence measures cannot be tested, but is argued in Chapter 1.
3.4.1 Discussion of hypotheses
Hypoth1. There is a consistent physiological reaction to the VE.
All three studies investigated whether autonomic reactions could be used to measure presence in VEs.
We hypothesized that there would be physiological reaction to the 20-foot drop. Therefore, there would be
consistently higher heart rate, skin conductance, and (lower) skin temperature in the Pit Room than in the
Training Room.

1.1.1.2
55
Hypoth2: The physiological presence measures decrease over subsequent exposures to the same virtual
environment, but not to zero.
We hypothesized that all presence measures would decrease from task to task on a single day — and
over multiple days. We believed that subjects would acclimate to the environment, the VE would become less
novel to them, and, therefore, that less presence would be evoked for all of the presence measures during each
subsequent task in a single session and over multiple sessions
For our measures to be useful, they must not decrease to zero over a small number of exposures to the
VE. We investigated 2, 4, and 12 exposures / subject. Physiological habituation over multiple exposures, if it
occurred, would not decrease the validity of the measure, since the same habituation diminishes stress reactions
to real heights [Abelson, 1989].
Multiple Exposures, Passive Haptics, and Frame Rate investigated Hypoth2 by looking at whether the
reaction decreased over multiple exposures. In Multiple Exposures, there were three tasks per session and
subjects came in for four sessions (on four different days). In Passive Haptics, subjects came in for one task per
session for two session (on two different days). In Frame Rate, subjects completed four tasks during one
session — they came in for only one day.
Hypoth3: Subjective, physiological, and behavioral presence measures correlate.
We hypothesized that the presence measures would correlate in all three studies (Hypoth3). That is,
when a subject reported more presence, they would act more present, and they would have higher physiological
reactions. We expected that the physiological measures and the behavioral measures would correlate better than
either would with the reported (questionnaire) measures. We expected this since both were observed
contemporaneously — during the session as opposed to reported after the session. We looked at correlations in
all three studies.
Hypoth4: Physiological, behavioral, and reported presence measures can differentiate among multiple
(high, medium, and low) presence conditions.
We hypothesized that the presence measures would be able to differentiate among high, medium, and
low presence-evoking VEs (Hypoth4). There were many parameters which one could vary: frame rate,

1.1.1.2
56
inclusion of passive haptics, lag, visual fidelity, interactivity, and many others. In Passive Haptics, we
investigated two passive haptics environments: one with a 1.5-inch wooden ledge corresponding to the 20-foot
drop (highly presence-evoking) and the control flat-floor condition in the Training Room (no 1.5-inch wooden
ledge). We hypothesized that higher presence would be evoked by the with-ledge environment for all measures.
In Frame Rate, we investigated four frame rates for visual imagery presentation: 10 frames per second (FPS)
(low presence-evoking power), 15 FPS (medium-low), 20 FPS (medium-high), and 30 FPS (highly presence-
evoking). We expected that presence evoked for 10 FPS and 15 FPS would be similar, with 15 FPS being
slightly higher; that significantly more presence would be evoked by 20 FPS and 30 FPS than by 10 FPS and 15
FPS; and that presence evoked by 20 FPS and 30 FPS would be similar, with 30 FPS evoking slightly higher
presence. In short, we expected a monotonic, but non-linear response scale.
3.5 Elements of the experimental design common to all studies
The common elements included
• An environment with three rooms, pictured in Figures 3.1 and 3.3.
• The presence measures used: behavioral, the UCL questionnaire, ∆Heart Rate, ∆Skin
Conductance, and ∆Skin Temperature.
• Participant recruiting method and participant restrictions
The VE. The VE used in the experiments is similar to that used in [Slater, 1995b]. It is pictured in Figures 3.1
and 3.3. It had three rooms: a Training Room, a Pit Room, and a Living Room. The Pit Room had a narrow
unguarded wooden catwalk around a 20-foot drop to the room below — the Living Room.

1.1.1.2
57
Figure 3.3. View of the 20 pit from the edge ofthe diving board.
Figure 3.4. A subject drops a block into thevirtual pit. He is standing on the edge of the 1.5-inch wooden ledge. The physiological sensors areattached to the left hand.
The VE consisted of ten thousand polygons and 41 megabytes of texture maps. This environment was
used in Frame Rate. A similar environment was used for Passive Haptics and Multiple Exposures. It had
twenty thousand polygons and 50 megabytes of texture. One pipe of an SGI Reality Monster 2 was used for
rendering in all experiments. The head-mounted display (HMD) was a Virtual Reality 8 with 640x480 3-color
pixel resolution in each eye. Users walked about in an 18 x 32 space, tracked with a high-accuracy, very-low-
lag UNC˚Tech Hi-Ball optical tracker [Ward, 1992; Welch, 1997].
The view from inside the HMD is shown in Figure 3.3, and a subject with the physiological sensors on
the left hand is shown in Figure 3.4. His right hand holds a tracked control with push-buttons.

1.1.1.2
58
The Procedure. At the beginning of the first session, subjects were given an informed consent sheet to read
and sign (Appendix B). In an attempt to lessen the first-exposure (orienting) effect seen in Multiple Exposures,
subjects were exposed to the environment one time for less than 3 minutes before the first sessions in Passive
Haptics and Frame Rate. The orienting effect is described in Chapters 1 and 4. A diagram of the flow of the
experimental procedure is shown in Figure 3.5.
ShapeLegend
In VE:Pre-
Exposure
In VE:Pre-task baseline
TaskPost-task baseline
More tasks onsame day?
Oral Interview
Return anotherday?
Change Conditionif necessary
Yes No
Yes
PassiveHaptics andFrame Rate
only
Informed Consent(paper)
SSQ
SSQ, HeightAnxiety &
Avoidance, PHQ
SSQ, PHQ
SSQ, UCL
Questionnaire
In VE
ExperimenterAction
Figure 3.5. Flow of events for each subject.
Cohen s height anxiety and avoidance questionnaires were also given at the beginning of the first
session. Kennedy s SSQ was given before and after each exposure in order to assess any sickness occurring
during the sessions. Subjects were asked if they were in their usual state of good physical fitness and if they

1.1.1.2
59
had taken any of the following in the past 24 hours: sedatives, tranquilizers, decongestants, anti-histamines,
alcohol, or other medication (the Participant Health Questionnaire — PHQ in Figure 3.5). All questionnaires and
forms were filled out on a computer except the informed consent, which was a paper form.
At the beginning of each task the subject was fitted with physiological monitoring equipment, HMD,
and a backpack containing the analog-to-digital converter for the physiological equipment and the source for the
magnetic tracker. The electrocardiograph (ECG) electrodes remained in place for all tasks on a given day to
reduce the time and discomfort of removing and replacing them (in Passive Haptics and Frame Rate). All other
equipment, including the skin temperature sensor, the skin conductance electrodes, and blood volume pulse
sensor (in Multiple Exposures only), were taken off at the end of and replaced at the beginning of each task.
The session started in the virtual Training Room where the subjects were read instructions and trained
to pick up and drop virtual objects, either by the experimenter (Multiple Exposures) or audio compact disk
recording (Passive Haptics and Frame Rate). A pre-task baseline of the physiological measures was recorded
during this time. After training, subjects performed the task: either carrying a book into the next room and
dropping a it onto a chair (Multiple Exposures, Passive Haptics), or dropping three colored blocks onto X s of
corresponding colors to the floor of the Living Room (Frame Rate). In Passive Haptics, subjects were also
instructed to walk to the edge of the platform, put the toes of their shoeless feet over the edge (see Figures 3.6
and 3.7) and count to ten while looking around. Each subject was told to perform all tasks at his own pace. It
typically took 40 seconds to complete the task in Multiple Exposures and 90 seconds in Frame Rate and Passive
Haptics.
Figure 3.6. Subject with toes over 1.5-inch ledge. Figure 3.7. Subject with toes over visual ledgewithout 1.5-inch wooden ledge.

1.1.1.2
60
Once the task was completed, subjects returned to the Training Room, where they were asked to relax
and stand still, but were free to look around. In Multiple Exposures and Passive Haptics this lasted about one
minute to allow a post-experiment physiological baseline to be taken. This did not prove useful for our
analysis, however, so we discontinued it for Frame Rate.
Immediately after the task was completed, the HMD and physiological monitoring equipment were
removed. If there were tasks remaining that day for the subject, the ECG electrodes were not removed. The
subject was then led to a computer to fill out the SSQ and the UCL Presence Questionnaire.
After the questionnaires were filled out for the last task of the session, an experimenter conducted an
oral interview in which the subject was asked about the experience and encouraged to relay any thoughts on the
experiences. The post-experiment oral interview was recorded both on tape and in notes taken by the
experimenter.
The participants in each study were either friends of people in the UNC Computer Science Department
or were recruited from undergraduate computer science classes, by fliers posted around campus, or by postings
on campus newsgroups. Subjects were restricted to those reporting that they were 18 and over, had not
experienced immersive virtual environments more than three times, were ambulatory, could use stereopsis for
depth perception, had no history of epilepsy or seizure, were not overly prone to motion sickness, were in their
usual state of good physical fitness at the time of the experiment, and were comfortable with the equipment.
3.6 Differences in experimental design
The elements that differed among the studies were
• The condition,
• The heart rate sensor,
• The task,
• The story read to the subject (either by the experimenter or played on CD), and
• The number of subjects participating.

1.1.1.2
61
3.6.1 Experimental design: Effect of multiple exposure on presence (Multiple Exposures)
In Multiple Exposures, the condition was the same for all sessions and tasks. In this study, we used a
blood volume pulse sensor to measure heart rate — which produced an unusable signal. The task was to carry a
virtual book from the Training Room to a chair on the far side of the Pit Room. Experimenters read instructions
to the subjects from a script. There were 10 subjects (Average age 24.4, σ 8.2; 7 female, 3 male; 2 graduate, 5
undergraduate, 3 professional; $6/hour), each of whom was exposed to the environment three times each day on
four different days.
The hypotheses were:
• Hypoth1: There is a consistent physiological reaction to the VE.
• Hypoth2: Presence measures decrease over multiple exposures to the same virtual environment,
but not to zero.
• Hypoth3: Subjective, physiological, and behavioral presence measures correlate.
• We did not test Hypoth4 — whether measures could differentiate among high, medium, and low
presence conditions in this experiment — the condition was not varied.
The results of this study are discussed in detail in Chapters 1 and 4. Subject data can be found in
Appendix C.
3.6.2 Experimental design: Effect of passive haptics on presence (Passive Haptics)
In the second study, Passive Haptics, each subject entered the environment once on each of two
different days — once for each condition. In one condition, a real 1.5-inch wooden ledge registered to the virtual
20-foot precipice was placed in the real environment. In the other condition, the wooden ledge was absent. The
VE models used for each condition varied slightly. The apparent height of the virtual wooden ledge matched
either the level of the real laboratory floor if the wooden ledge was absent, or 1.5-inch higher. The study was
counter-balanced so that half the subjects experienced the VE with the 1.5-inch wooden ledge before they
experienced it without the ledge. There was an orienting pre-exposure before the first exposure in which

1.1.1.2
62
subjects walked to the doorway of the Pit Room, but did not enter. They looked around the Pit Room to get an
understanding of the layout of the environment. We used an ECG to measure heart rate in this study.
We performed an 8-subject pilot study and predicted that we needed 59 subjects to get significance. In
the pilot study, we did not instruct subjects to touch the ledge. After the pilot, we made improvements in the
design: we instructed subjects to put their barefoot toes over the edge of the ledge and look around. We
believed this design improvement would lower the number of subjects we needed for significance, but we still
planned for 59 subjects.
We started 61 subjects, 6 did not return for their second visit, 1 subject was excluded because he
was a VE expert, 2 were excluded because of big breaks in presence (BIPs) during one of their sessions:
• For one, the HMD went dark for a few seconds while he was on the ledge,
• The other moved too quickly and got tangled in the cables.
The 52 subjects (Average age 21.4, σ 4.3; 16 female, 36 male; 2 graduate, 47 undergraduate, 3
professional; $6/hour) were told a story relating the environment and the task (played from an audio compact
disc). They were told they were visiting the home of a famous professor and they were to perform the tasks
typical to his morning routine. Subjects were tasked with carrying a virtual book from the Training Room to the
end of the wooden diving board, where they counted to ten and looked around. Then they carried the book to a
chair on the far side of the Pit Room and then returned to the Training Room. In the Training Room, they were
free to look around, but were instructed not to walk for one minute.
The hypotheses of this study were:
• Hypoth1: There is a consistent physiological reaction to the VE.
• Hypoth2: Presence measures decrease over multiple exposures to the same virtual environment,
but not to zero.
• Hypoth3: Subjective, physiological, and behavioral presence measures correlate.
• Hypoth4: Physiological presence can differentiate between high and low presence conditions.
Specifically, in terms of presence evoked: with passive haptics > without passive haptics.
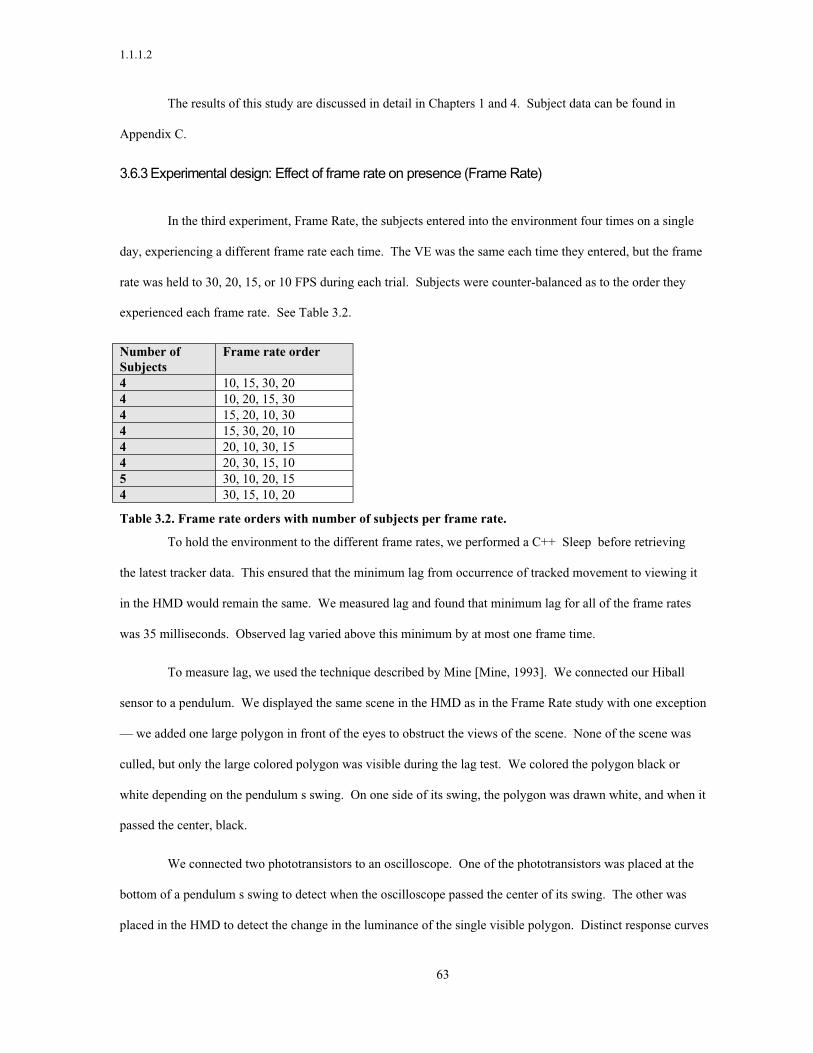
1.1.1.2
63
The results of this study are discussed in detail in Chapters 1 and 4. Subject data can be found in
Appendix C.
3.6.3 Experimental design: Effect of frame rate on presence (Frame Rate)
In the third experiment, Frame Rate, the subjects entered into the environment four times on a single
day, experiencing a different frame rate each time. The VE was the same each time they entered, but the frame
rate was held to 30, 20, 15, or 10 FPS during each trial. Subjects were counter-balanced as to the order they
experienced each frame rate. See Table 3.2.
Number ofSubjects
Frame rate order
4 10, 15, 30, 204 10, 20, 15, 304 15, 20, 10, 304 15, 30, 20, 104 20, 10, 30, 154 20, 30, 15, 105 30, 10, 20, 154 30, 15, 10, 20
Table 3.2. Frame rate orders with number of subjects per frame rate.
To hold the environment to the different frame rates, we performed a C++ Sleep before retrieving
the latest tracker data. This ensured that the minimum lag from occurrence of tracked movement to viewing it
in the HMD would remain the same. We measured lag and found that minimum lag for all of the frame rates
was 35 milliseconds. Observed lag varied above this minimum by at most one frame time.
To measure lag, we used the technique described by Mine [Mine, 1993]. We connected our Hiball
sensor to a pendulum. We displayed the same scene in the HMD as in the Frame Rate study with one exception
— we added one large polygon in front of the eyes to obstruct the views of the scene. None of the scene was
culled, but only the large colored polygon was visible during the lag test. We colored the polygon black or
white depending on the pendulum s swing. On one side of its swing, the polygon was drawn white, and when it
passed the center, black.
We connected two phototransistors to an oscilloscope. One of the phototransistors was placed at the
bottom of a pendulum s swing to detect when the oscilloscope passed the center of its swing. The other was
placed in the HMD to detect the change in the luminance of the single visible polygon. Distinct response curves
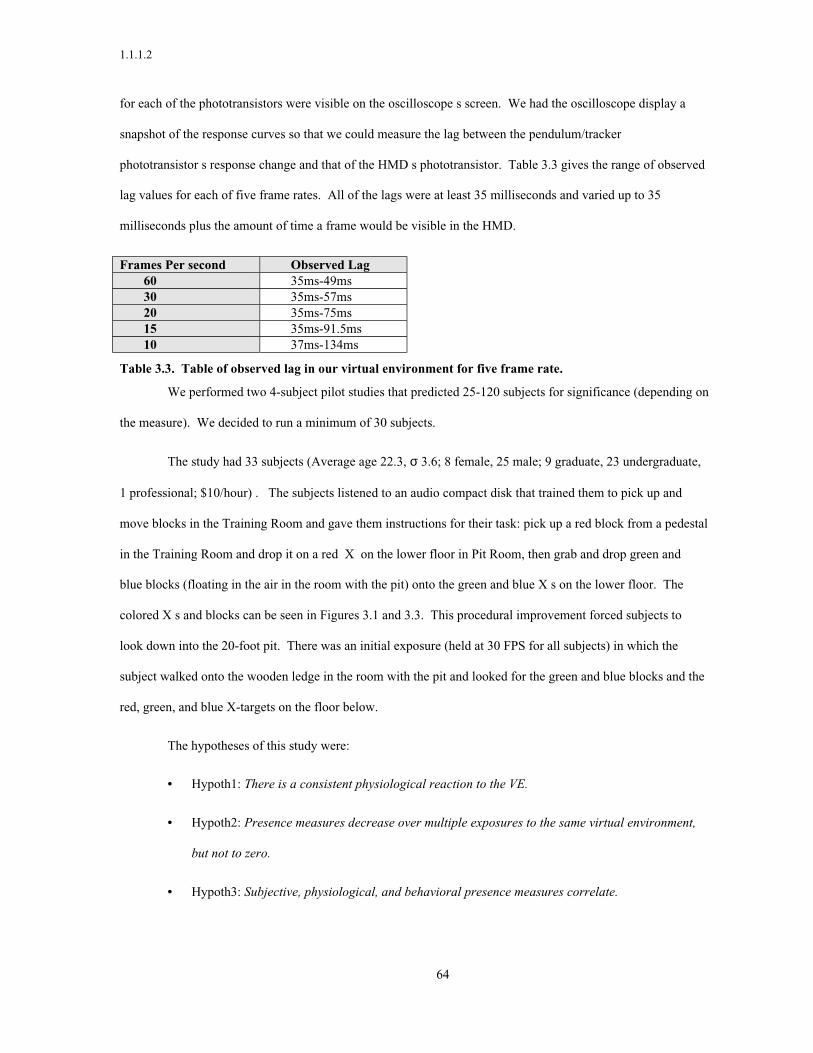
1.1.1.2
64
for each of the phototransistors were visible on the oscilloscope s screen. We had the oscilloscope display a
snapshot of the response curves so that we could measure the lag between the pendulum/tracker
phototransistor s response change and that of the HMD s phototransistor. Table 3.3 gives the range of observed
lag values for each of five frame rates. All of the lags were at least 35 milliseconds and varied up to 35
milliseconds plus the amount of time a frame would be visible in the HMD.
Frames Per second Observed Lag60 35ms-49ms30 35ms-57ms20 35ms-75ms15 35ms-91.5ms10 37ms-134ms
Table 3.3. Table of observed lag in our virtual environment for five frame rate.
We performed two 4-subject pilot studies that predicted 25-120 subjects for significance (depending on
the measure). We decided to run a minimum of 30 subjects.
The study had 33 subjects (Average age 22.3, σ 3.6; 8 female, 25 male; 9 graduate, 23 undergraduate,
1 professional; $10/hour) . The subjects listened to an audio compact disk that trained them to pick up and
move blocks in the Training Room and gave them instructions for their task: pick up a red block from a pedestal
in the Training Room and drop it on a red X on the lower floor in Pit Room, then grab and drop green and
blue blocks (floating in the air in the room with the pit) onto the green and blue X s on the lower floor. The
colored X s and blocks can be seen in Figures 3.1 and 3.3. This procedural improvement forced subjects to
look down into the 20-foot pit. There was an initial exposure (held at 30 FPS for all subjects) in which the
subject walked onto the wooden ledge in the room with the pit and looked for the green and blue blocks and the
red, green, and blue X-targets on the floor below.
The hypotheses of this study were:
• Hypoth1: There is a consistent physiological reaction to the VE.
• Hypoth2: Presence measures decrease over multiple exposures to the same virtual environment,
but not to zero.
• Hypoth3: Subjective, physiological, and behavioral presence measures correlate.

1.1.1.2
65
• Hypoth4: Physiological presence can differentiate among multiple (high, medium, and low)
presence conditions. Specifically, in terms of presence evoked: 30 FPS > 20 FPS > 15 FPS > 10
FPS.
The results of this study are discussed in detail in Chapters 1 and 4. Subject data can be found in
Appendix C.

1.1.1.3
66
Chapter 4 Discussion of results
The overall conclusions and recommendations were treated at the end of Chapter 1. Here we give the
supporting detail.
4.1 Overview of statistics
In this research we used P˚<˚0.050 as the cutoff for statistical significance. For clarity, we discuss
results that were significant at the 0.050 level as demonstrated. That is, even though there is up to a 5% chance
that a given result is false, we discuss it as if it were fact. So, instead of repeatedly stating the data
significantly supported hypothesis A at the 0.050 level we state it as if it were fact: the data demonstrated
hypothesis A to be true. All statistical calculations were performed using the Statistical Package for the Social
Sciences (SPSS) version 10.0.1 [SPSS, 1999].
The comparison of average differences in physiological reaction between the Pit Room and the
Training Room (Figure 1.1) was performed with a One-Sample T-Test. This test determines if the mean of a
distribution is significantly greater than zero.
The correlations among measures were performed using the Bivariate Pearson Correlation. The
correlation tests the extent of linear association between two variables: 1.0 is perfect correlation; -1.0 is perfect
anti-correlation; 0.0 is no correlation.
Tests of the effects on presence of passive haptics and frame rate were performed with the Univariate
General Linear Model, using the repeated measure technique described in the SAS 6.0 Manual [SAS, 1990].
This technique allowed us to investigate the effect of the condition while taking into account the effect of
factors that change from exposure to exposure such as loss of balance on the 1.5-inch ledge (Loss of Balance).
This technique prescribes adding Subject ID as a variable in the statistical models. Statistically, this controls for
the inter-subject variation and decreases the degrees of freedom of the model, and therefore the significance,
appropriately.

1.1.1.2
67
To find the best statistical model for each measure, we used Stepwise Selection and Elimination
described by Kleinbaum et al. [Kleinbaum, 1998]. As suggested by Kleinbaum et al., to account better
(statistically) for variation in the dependent variable (e.g. ∆Heart Rate), we included variables that were
significant at the P˚=˚0.100 level (strong trends) in the statistical models. The procedure is performed as
follows:
1) Add the variable that has not already been added and is most highly correlated with the dependent
variable.
2) Recalculate the statistical model.
3) Compare the highest P-value in the statistical model to a pre-selected significance level P˚=˚0.100,
4) If the highest P-value is higher than 0.100, take out the variable since it does not account for a
significant portion of the variation of the dependent variable, and repeat from 1). If not, stop.
In the statistical tables in this dissertation, we attempt to aid the reader by using three fonts: Bold
indicates findings significant at the 5% level (P < 0.050), regular text indicates findings that are significant at
the 10% level (0.050 † P < 0.100 — strong trends), grayed text (e.g. grayed) indicates findings that are not
significant. We also use abbreviations in some places. β is the estimated magnitude of an effect — the
coefficient determined by the statistics. A P-value or P is the significance value for the variable. P-values
are shown in italics. In a few of the tables, we show data from all three studies. In these tables, the studies are
indicated by acronym: ME — the Multiple Exposures study, PH — the Passive Haptics Study, and FR — the
Frame Rate study. The values in the tables, both β and P-values, were taken from SPSS, which rounds to the
nearest 0.001. In cases where the value was less than 0.0005, the value is displayed in the charts as < 0.001.
4.2 Variables
Dependent variables. There were three categories of dependent variables (presence measures) in this research:
reported, physiological, and observed. The reported measures were obtained via questionnaires. The
physiological measures were recorded from the hands and chests of the subjects during the experiments. The
observed behavioral measure was obtained by scoring height-related behaviors from videotape of the subjects.

1.1.1.2
68
For the reported measures, we used a modified version of the University College London (UCL)
Presence Questionnaire [Usoh, 1999]. The UCL questionnaire contained three measures: Reported Presence
(seven questions), Reported Behavioral Presence (three questions), and Reported Ease of Locomotion (three
questions). Even though subjects rated each question on a scale of 1-7, Slater et al. used the ratings only to
yield a High-Presence/ Low-Presence result. A judgment had to be made as to the high-low threshold. In
Section 4.4.2, we discuss our decision to count [m5] as the high values.
Our physiological measures were constructed as the differences between the physiological reactions in
the Training Room and the Pit Room. Each was constructed to increase with increased physiological reaction.
Independent and random variables. The variable session indicates the number of the day on which an
exposure to the VE took place. Task indicates the number of the exposure within a single day. In Multiple
Exposures, there were four sessions and three tasks per session. In Passive Haptics, there were two sessions,
each with one task. In Frame Rate, there was one session with four tasks.
A variable that was significant in the Frame Rate study was Loss of Balance. Another variable that
was significant was Level of Computer Game Playing. Subjects scored the question from 1 to 7:
To what extent do you play computer games?
I play computer games 1 (not at all) 7 (very much).
We used the raw response as our variable.
There were a number of other variables recorded on a questionnaire that were not significant in the
analysis of the hypotheses: age, race, gender, association with the virtual body (post-experiment), university
status, computer usage, and level of exercise (1˚=˚ not˚at˚all 7˚=˚ 3˚+˚hours˚/˚week ). Subjects also filled
out questionnaires on height anxiety and avoidance [Cohen, 1977] before the experiment and a simulator
sickness questionnaire [Kennedy, 1993] before and after the experiment. The data from these questionnaires
was not significant in our analysis.

1.1.1.2
69
4.3 Support for hypotheses
In Chapter 1, we discussed our goal of finding a presence measure that is reliable, valid, multi-level
sensitive, and objective. Below we expand on the supporting statistics. We discuss the three physiological
measures that are our primary focus: ∆Heart Rate, ∆Skin Conductance, and ∆Skin Temperature. We also
discuss the reported measures, Reported Presence and Reported Behavioral Presence. The third reported
measure, Reported Ease of Locomotion, is not a measure of presence. Therefore, we do not discuss it. We also
discuss our ancillary investigation of Observed Behavioral Presence as a measure of presence.
4.3.1 Reliability
Reliability is the extent to which the same test applied on different occasions yields the same
result [Sutherland, 1996]. We investigated reliability in two ways: 1) Did the Pit Room consistently evoke
more physiological reaction than the Training Room? and 2) Did the physiological reactions to the Pit Room
decrease over multiple exposures to the VE, just as physiological reaction decreases over multiple exposures to
a real height (or other stressor) [Abelson, 1989; Andreassi, 1995], or approach zero after multiple exposures?
Differentiating between the Pit Room and the Training Room. As discussed fully in Chapter 1, average
heart rate and skin conductance were significantly higher and skin temperature was significantly lower in the Pit
Room as compared to the Training Room in all three studies. Moreover, these relationships were observed in
90% of the individual exposure data. See Table 1.1.
Order effects. The following presence measures decreased over multiple exposures in all studies: ∆Heart Rate,
∆Skin Temperature, Reported Presence, Reported Behavioral Presence, and Observed Behavioral Presence.
∆Skin Conductance decreased over multiple exposures in two of three studies. Our data also demonstrated
orienting effects — increased reactions when one sees something novel [Andreassi, 1995]. These were seen for
every measure except ∆Heart Rate in at least one of the studies. See Figures 4.1 and 4.2 for graphs of each
variable over multiple exposures, Table 4.1 for a summary of significant order and orienting effects, and Tables
4.2 to 4.4 for statistical models of order effects for each of the measures in each of the studies. Overall, the
physiological reactions to the Pit Room did decrease over multiple exposures but not to zero. The VE reliably
evoked physiological responses in subjects, even over multiple exposures.
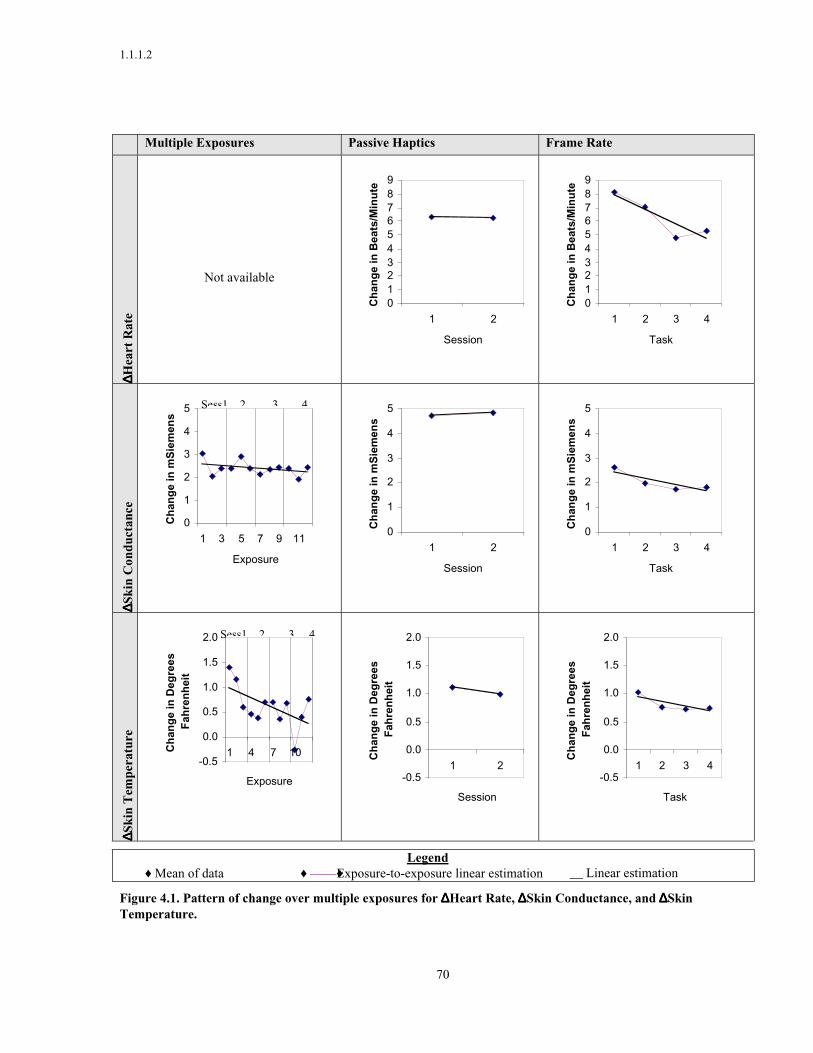
1.1.1.2
70
Multiple Exposures Passive Haptics Frame Rate∆∆∆∆ H
eart
Rat
e
Not available
0123456789
1 2
Session
Ch
ang
e in
Bea
ts/M
inu
te
0123456789
1 2 3 4
Task
Ch
ang
e in
Bea
ts/M
inu
te
∆∆∆∆ Ski
n C
ondu
ctan
ce
0
1
2
3
4
5
1 3 5 7 9 11
Exposure
Ch
ang
e in
mS
iem
ens
0
1
2
3
4
5
1 2
Session
Ch
ang
e in
mS
iem
ens
0
1
2
3
4
5
1 2 3 4
TaskC
han
ge
in m
Sie
men
s
∆∆∆∆ Ski
n T
empe
ratu
re
-0.5
0.0
0.5
1.0
1.5
2.0
1 4 7 10
Exposure
Ch
ang
e in
Deg
rees
F
ahre
nh
eit
-0.5
0.0
0.5
1.0
1.5
2.0
1 2
Session
Ch
ang
e in
Deg
rees
F
ahre
nh
eit
-0.5
0.0
0.5
1.0
1.5
2.0
1 2 3 4
Task
Ch
ang
e in
Deg
rees
F
ahre
nh
eit
♦ Mean of dataLegend
♦ ——♦ Exposure-to-exposure linear estimation __ Linear estimation
Figure 4.1. Pattern of change over multiple exposures for ∆∆∆∆Heart Rate, ∆∆∆∆Skin Conductance, and ∆∆∆∆SkinTemperature.
Sess1 2 3 4
Sess1 2 3 4

1.1.1.2
71
Multiple Exposures Passive Haptics Frame Rate
Rep
orte
d P
rese
nce
0
1
2
3
4
5
6
7
1 3 5 7 9 11
Exposure
0
1
2
3
4
5
6
7
1 2
Session
0
1
2
3
4
5
6
7
1 2 3 4
Task
Rep
orte
d B
ehav
iora
l Pre
senc
e
0
1
2
3
1 3 5 7 9 11
Exposure
0
1
2
3
1 2
Session
0
1
2
3
1 2 3 4
Task
Obs
erve
d B
ehav
iora
l Pre
senc
e
0
1
2
3
1 3 5 7 9 11
Exposure
0
1
2
3
1 2
Session
0
1
2
3
1 2 3 4
Task
♦ Mean of dataLegend
♦ ——♦ Exposure-to-exposure linear estimation __ Linear estimation
Figure 4.2. Pattern of change over multiple exposures for Reported Presence, Reported BehavioralPresence, and Observed Behavioral Presence. Ordinates for the reported measures are the average countof questions scored high . Ordinates for Observed Behavioral Presence are the count of height-relatedreactions.
Sess1 2 3 4
Sess1 2 3 4
Sess1 2 3 4

1.1.1.2
72
OrderEffects
∆∆∆∆HeartRate
(∆∆∆∆BPM)
∆∆∆∆SkinConductance(∆∆∆∆mSiemens)
∆∆∆∆SkinTemperature
(∆∆∆∆oF)
ReportedPresence(Counthigh )
ReportedBehavioralPresence(Counthigh )
ObservedBehavioralPresence(CountBehvs.)
MultipleExposures
N/A -0.7 (1st) -0.9 (1st) - -0.7 (1st) -0.9 (Sess)
PassiveHaptics
- - - -0.7 (1st) -0.4 (1st) -
FrameRate
-1.0(Task)
-0.8 (1st) -0.3 (1st) - -0.2 (Task) -0.8 (1st)
Table 4.1. Significant order effects for each measure in each study.(1 st) indicates a decrease in a measure after the first exposure only. (Sess) indicates a decrease in themeasure over subsequent sessions (days). (Task) indicates a decrease over tasks on the same day.There was an order effect for each measure in at least one study. N/A was Not available .
MultipleExposures
∆∆∆∆Skin Conductance ∆∆∆∆Skin Temperature Reported BehavioralPresence
Observed BehavioralPresence
P P P PModel < 0.001 0.002 < 0.001 < 0.001Intercept 1.9 < 0.001 0.7 < 0.001 1.6 < 0.001 1.2 < 0.001Subject [-0.8, 1.5] < 0.001 [-1.3, 0.2] 0.005 [-1.1, 1.1] < 0.001 [-0.3, 7.6] < 0.001FirstExposure
-0.7 0.059 -0.9 0.011 -0.7 0.004 - -
Task - - - - - - - -Session(Day)
- - - - - - -0.9 < 0.001
Table 4.2. Significant order effects for each measure in Multiple Exposures. There were no significantorder effects for Reported Presence in Multiple Exposures — columns for these variables are not includedin the chart.
Reported Presence Reported BehavioralPresence
P PModel < 0.001 0.003Intercept 1.8 < 0.001 2.0 < 0.001Subject [-1.5, 4.5] < 0.001 [-2.0, 1.0] 0.009Increase with 1.5-inch ledge
0.5 0.06 0.5 0.004
First Exposure -0.8 0.002 -0.4 0.017
Table 4.3. Significant order effects for each measure in Passive Haptics. There were no significant ordereffects for ∆∆∆∆Heart Rate, ∆∆∆∆Skin Conductance, ∆∆∆∆Skin Temperature, and Observed Behavioral Presence inPassive Haptics.

1.1.1.2
73
∆∆∆∆Heart Rate ∆∆∆∆SkinConductance
∆∆∆∆SkinTemperature
ReportedBehavioralPresence
ObservedBehavioralPresence
P P P P PModel < 0.001 < 0.001 < 0.001 < 0.001 < 0.001Intercept 8.8 < 0.001 2.7 < 0.001 0.3 < 0.001 2.9 < 0.001 1.8 < 0.001Subject [-5.5,
12.1]< 0.001 [-2.9,
5.4]< 0.001 [0.0, 1.4] < 0.001 [-2.0,
0.8]< 0.001 [-3.0,
4.8]< 0.001
FrameRate
[-2.7,0.0]
0.073 - - - - [-0.4,0.0]
0.060 - -
FirstExposure
- - -0.8 < 0.001 -0.3 0.001 - - -0.8 < 0.001
Task -1.0 0.003 - - - - -0.2 < 0.001 - -
Table 4.4. Significant order effects for each measure in Frame Rate. There were no significant ordereffects for Reported Presence in Frame Rate.
4.3.2 Validity
Validity is the extent to which a test or experiment genuinely measures what it purports to measure
[Sutherland, 1996]. To examine validity, we performed correlations among the physiological measures and the
well-established questionnaire measures of presence. Singleton states that: The more evidence that supports
the hypothesized relationships [between the measure and the underlying concept], the greater one s confidence
that a particular operational definition is a valid measure of the concept [Singleton, 1993]. Therefore, we also
investigated validity by examining the measures in multiple passive haptics and frame rate conditions.
Among the physiological measures, ∆Heart Rate correlated best with the reported measures. It
correlated positively with the Reported Presence and Reported Behavioral Presence in all three studies. It had
significant correlations with Reported Presence and Reported Behavioral Presence in Frame Rate. There was
no data available for ∆Heart Rate in Multiple Exposures. Overall, ∆Heart Rate s validity as a presence measure
is supported by its correlations with the well-established reported measures. See Table 4.5 for details of the
correlations.

1.1.1.2
74
Correlations Reported Presence Reported BehavioralPresence
MEP
∆∆∆∆Heart Rate PH 0.034 0.004P 0.743 0.972FR 0.265 0.192P 0.002 0.028ME 0.245 0.290P 0.009 0.002
∆∆∆∆Skin PH -0.002 0.106Conductance P 0.986 0.280
FR 0.096 0.125P 0.275 0.154ME -0.098 -0.040P 0.349 0.699
∆∆∆∆Skin PH -0.075 -0.086Temperature P 0.448 0.383
FR 0.171 0.066P 0.050 0.454ME -0.002 0.344P 0.981 < 0.001
Observed PH 0.293 0.317Behavioral P 0.021 0.012Presence FR -0.002 0.163
P 0.982 0.070
Table 4.5. Table of correlations among all measures for all three studies
∆Skin Conductance also correlated well with the reported measures, but less so than ∆Heart Rate.
∆Skin Conductance had significant positive correlations with Reported Presence and Reported Behavioral
Presence in Multiple Exposures (see Table 4.5). It also had non-significant positive and negative correlations
with Reported Presence and Reported Behavioral Presence in the Passive Haptics and Frame Rate studies.
Despite these variable non-significant correlations, its significant, positive correlations in Multiple Exposures
lend support for the validity of ∆Skin Conductance as a measure of presence.
∆Skin Temperature did not correlate well with the reported measures. There was no support from the
correlations for the use of ∆Skin Temperature as a valid measure of presence. As noted in Chapter 1, we
believe the poor correlations seen for ∆Skin Temperature were due to problems in the experimental design
coupled with the limitations of the measure.

1.1.1.2
75
Observed Behavioral Presence correlated well with Reported Behavioral Presence in all three studies
(See Table 4.5). It had significant positive correlations with Reported Presence and Reported Behavioral
Presence in Passive Haptics. Observed Behavioral Presence had non-significant, negative correlations with
Reported Presence in both Multiple Exposures and Frame Rate. Despite its significant positive correlations
with Reported Behavioral Presence, its inconsistent correlation with Reported Presence bring its validity into
question.
Another way to investigate the validity of a measure is to look at whether it changes with conditions as
expected. In the next section, we discuss each measure s ability to differentiate between two passive haptics
conditions (the VE with and without a real 1.5-inch wooden ledge) and among four frame rates (10, 15, 20, and
30 FPS). We expected physiological reaction to be higher when the 1.5-inch wooden ledge was included and to
increase as frame rate increased.
4.3.3 Sensitivity and multi-level sensitivity
Sensitivity. As was shown in Chapter 1, the physiological measures reliably distinguished between the
Training Room and the Pit Room. Average physiological reactions were higher in the Pit Room than in the
Training Room (P < 0.001 for all measures in each study) and subjects had greater reactions in the Pit Room
about 90% of the time. This guarantees us at least minimal sensitivity — we measured a reliable difference in
reaction between the two rooms.
Multi-level sensitivity. A useful measure of presence will reliably yield higher values as a VE is improved
along some goodness dimension. We call this multi-level sensitivity. Both Passive Haptics and Frame Rate
provided us evidence of multi-level sensitivity for the physiological measures. Namely, both verified that there
was a strong reaction to the Pit Room and that more reaction was evoked as the VE was improved (e.g. higher
frame rate). Anecdotally, we have observed that walking into the Pit Room causes a strong subjective reaction
in users and this reaction is greater in magnitude than the difference in subjective reaction to the Pit Room
between any two experimental conditions (e.g. with and without the 1.5-inch wooden ledge). Therefore, we
expected the differences among the conditions to be less than the differences between the two rooms. In terms
of our data, this means that the smallest difference between the Pit Room and Training Room among all of the
conditions should be larger than the greatest difference between any two conditions. We found exactly that in

1.1.1.2
76
all three studies for all measures. The data is given in Table 4.6. Figures 1.4 and 4.3 graphically depict the
differences for ∆Heart Rate in Passive Haptics and Frame Rate.
∆∆∆∆Heart Rate ∆∆∆∆SkinConductance
∆∆∆∆SkinTemperature
Smallest ∆∆∆∆ between PitRoom and Training Roomamong conditions
4.9 BPM(no˚ledge)
4.4 mSiemens (no ledge)
0.9 oF (w/ ledge)
Pas
sive
Hap
tics
Difference: passive haptics- no passive haptics
2.7 BPM 0.8 mSiemens -0.4 oF
Smallest ∆∆∆∆ between PitRoom and Training Roomamong conditions
5.9 BPM (15˚FPS) 2.0 mSiemens(20 FPS)
0.8 oF (15 FPS)
Fra
me
Rat
e
Greatest difference amongconditions
2.7 BPM(30 FPS - 15˚FPS)
-0.4 mSiemens(20 FPS - 10 FPS)
-0.1 oF(15 FPS - 10 FPS)
Table 4.6. The differences in physiological reaction between the Training Room and the Pit Room weregreater than the differences among conditions.
It is important to note that for ∆Skin Temperature in both Passive Haptics and Frame Rate, and for
∆Skin Conductance in Frame Rate, the greatest difference among conditions was in the opposite direction from
that expected. In Frame Rate, we believe this difference was caused by an anomalous reaction by subjects at 10
FPS — explained below. This would have caused reaction at 10 FPS to be higher than at other frame rates. The
decline in ∆Skin Temperature in Passive Haptics was due, we believe, to limitations in the measure and our
design.
In Passive Haptics, we further tested the multi-level sensitivity of the physiological measures by
investigating whether they could significantly differentiate between two conditions: a higher presence
condition (inclusion of a 1.5-inch wooden ledge corresponding to the virtual ledge) and a lower presence
condition (no wooden ledge included). ∆Heart Rate, ∆Skin Conductance, Reported Behavioral Presence, and
Observed Behavioral Presence were significantly higher when the 1.5-inch wooden ledge was included — these
measures were multi-level sensitive to the differences between high and low presence conditions. Table 4.7
shows the statistical models for each measure.

1.1.1.2
77
∆∆∆∆Heart Rate ∆∆∆∆SkinConductance
∆∆∆∆SkinTemperature
ReportedPresence
ReportedBehavioralPresence
ObservedBehavioralPresence
ββββ P ββββ P ββββ P ββββ P ββββ P ββββ PCorrectedModel
0.017 < 0.001 0.003 < 0.001 0.003 0.020
Intercept 9.6 < 0.001 4.7 < 0.001 1.6 < 0.001 1.8 < 0.001 2.0 < 0.001 1.7 < 0.001Subject [-16.2,
11.2]0.026 [-2.7,
8.8]< 0.001 [-3.4,
1.5]0.004 [-1.5,
5.0]< 0.001 [-2.0,
1.0]0.009 [-2.5,
8.0]0.099
Session: 1st -2nd
- - - - - - -0.8 0.002 -0.4 0.017 - -
Increasewith 1.5-inch ledge
2.7 0.016 0.8 0.040 -0.4 0.063 0.5 0.060 0.5 0.004 2.5 < 0.001
Table 4.7. Best models for each of the measures in the Passive Haptics study. ∆∆∆∆Heart Rate, ∆∆∆∆SkinConductance, Reported Behavioral Presence, and Observed Behavioral Presence were significantlyhigher with the 1.5-inch wooden ledge. Only ∆∆∆∆Skin Temperature varied in the opposite direction (strongtrend). Session was significant for Reported Presence and Reported Behavioral Presence.
Among the physiological measures, ∆Heart Rate most significantly differentiated the inclusion of the
1.5-inch wooden ledge. This supports the use of ∆Heart Rate as a multi-level sensitive measure of presence.
∆Skin conductance also increased significantly with the wooden ledge, which supports the use of ∆Skin
Conductance as a measure of presence. ∆Skin Temperature varied in the opposite direction as hypothesized
(strong trend), but we believe that to be meaningless for our exposure length. The data from Passive Haptics
does not support the use of ∆Skin Temperature as a multi-level sensitive measure of presence.
The limited data for Observed Behavioral Presence showed the most significant increase with the 1.5-
inch wooden ledge. Even though the Observed Behavioral Measure did not follow hypotheses as well in the
other two studies, it performed well in Passive Haptics — it differentiated between higher and lower presence
conditions.
Multi-level sensitivity: differentiating among multiple levels of presence. In Frame Rate, we investigated
more fully whether physiological reaction could differentiate among multiple presence conditions: 10 FPS
(lowest), 15 FPS, 20 FPS, and 30 FPS (highest). Table 4.8 shows the significance of the models for each
measure. Table 4.9 shows the differences among the frame rates. Figures 4.3 to 4.9 show the response curves
of each measure to frame rate.

1.1.1.2
78
∆∆∆∆Heart Rate ∆∆∆∆SkinConductance
∆∆∆∆SkinTemperature
ReportedPresence
ReportedBehavioralPresence
ObservedBehavioralPresence
ββββ P ββββ P ββββ P ββββ P ββββ P ββββ PCorrectedModel
< 0.001 < 0.001 < 0.001 < 0.001 < 0.001 < 0.001
Intercept 12.7 < 0.001 2.6 < 0.001 0.3 < 0.001 5.6 < 0.001 2.9 < 0.001 1.9 < 0.001Subject [-5.5,
11.2]< 0.001 [-2.9,
5.4]< 0.001 [0, 1.4] < 0.001 [-5.3,
1.5]< 0.001 [-2.0,
0.8]< 0.001 [-3.0,
4.8]< 0.001
Session -1.0 0.002 - - - - - - -0.2 < 0.001 - -FirstExposure
- - 0.8 < 0.001 0.3 0.001 - - - - 0.7 < 0.001
Loss ofBalance
-3.5 0.014 - - - - - - - - - -
Frame Rate [-3.2, 0] 0.026 [-0.2,0.2]
0.167 [-0.1,0.1]
0.641 [-0.2,0.0]
0.800 [-0.4,0.0]
0.060 [-0.4,0.2]
0.113
Table 4.8. Statistical models for each measure in the Frame Rate study.
∆∆∆∆Heart Rate ∆∆∆∆SkinConductance
∆∆∆∆SkinTemperature
ReportedPresence
ReportedBehavioralPresence
ReportedEase ofLocomotion
ObservedBehavioralPresence
Increase from 10FPS to 15 FPS
-1.6 -0.0 -0.1 0.0 -0.3 0.5 -0.2
P 0.134 0.892 0.198 1.000 0.083 0.004 0.331
Increase from 15FPS to 20 FPS
2.4 -0.4 0.1 0.2 0.2 -0.3 -0.3
P 0.024 0.063 0.537 0.553 0.116 0.123 0.156
Increase from 20FPS to 30 FPS
0.7 0.2 0.0 0.1 0.2 0.2 0.4
P 0.483 0.287 0.931 0.843 0.256 0.204 0.091
Increase from 10FPS to 20 FPS
0.8 -0.4 -0.1 0.2 -0.0 0.2 -0.6
P 0.457 0.046 0.501 0.553 0.869 0.171 0.018Increase from 10FPS to 30 FPS
1.6 -0.2 -0.1 0.2 0.1 0.5 -0.2
P 0.160 0.346 0.558 0.429 0.331 0.009 0.487
Increase from 15FPS to 30 FPS
3.2 -0.2 0.1 0.2 0.4 -0.0 0.1
P 0.004 0.419 0.481 0.429 0.008 0.784 0.781
Table 4.9. Statistical significance for the differences among frame rates for each measure using themodels in Table 4.8.
We hypothesized a monotonic increase in physiological reaction with frame rate. This was not the
case. As depicted in the Figures 4.3 to 4.5, there was strong physiological reaction at 10 FPS. We believe that
this was not caused by an increase in evoked presence, but instead, was caused by increased fear due to walking
near a 20-foot drop with reduced temporal fidelity of visual input — the subject wasn t sure he could dependably
see where he was walking. Our findings supported this. Reported Ease of Locomotion was lowest at 10 FPS

1.1.1.2
79
(see Table 4.8 and Figure 4.8), which indicates that subjects found it difficult to move about at this frame rate.
Physiological reactions were anomalously high at 10 FPS, which tells us that subjects had fear at this frame rate.
Reported Presence, however, was lowest at 10 FPS, which tells us that the increase in fear was not caused by
feeling more presence near the 20-foot drop.
We believe the anomalous reaction at 10 FPS for both Reported Behavioral Presence and Observed
Behavioral Presence was also caused, indirectly, by this fear. We believe our behavioral measures could not
differentiate between the fear due to evoked presence near a 20-foot drop and the fear caused by moving about
near a height with reduced visual temporal fidelity.
∆∆∆∆Heart Rate
0
1
2
3
4
5
6
7
8
9
10 15 20 30
Frame Rate
Ch
ang
e in
bea
ts/m
inu
te
5.9
3.2
∆∆∆∆Skin Conductance
0
1
2
3
4
5
10 15 20 30
Frame Rate
Ch
ang
e in
mS
iem
ens
Figure 4.3. ∆∆∆∆Heart Rate at the four frame rates. Figure 4.4. ∆∆∆∆Skin Conductance at the fourframe rates.

1.1.1.2
80
∆∆∆∆Skin Temperature
-0.5
0.0
0.5
1.0
1.5
2.0
10 15 20 30
Frame Rate
Ch
ang
e in
Deg
rees
Fah
ren
hei
t
Figure 4.5. ∆∆∆∆Skin Temperature at the fourframe rates.
Also associated with lower frame rates was Loss of Balance — when a subject lost his balance while
searching for the 1.5-inch wooden ledge. This happened nine times at 10 FPS, five times at 15 FPS, once at 20
FPS, and once at 30 FPS. We believe the prevalence of Loss of Balance occurring at lower frame rates was also
caused by the reduced temporal fidelity in the visuals — subjects had a hard time moving about and therefore
had difficulty locating the 1.5-inch ledge. This caused them to occasionally find the wooden ledge before
expected. We investigated statistical models to account for (or predict) the anomalous reaction as 10 FPS. The
addition of Loss of Balance to the model for ∆Heart Rate was significant but did not completely account for the
anomalous reaction at 10 FPS. The addition of Loss of Balance was not significant for any other measure s
model. We also investigated whether Simulator Sickness caused the increase in physiological reaction at 10
FPS. Simulator Sickness was not significant in any model.
After 10 FPS, ∆Heart Rate and ∆Skin Temperature increased with frame rate as expected. ∆Heart
Rate differentiated among presence conditions with more statistical power than any of the other presence
measures, including the reported measures. The difference between 30 FPS and 15 FPS (3.5 BPM, P˚=˚0.004)
was the most statistically significant difference between any two frame rates for any measure. ∆Heart Rate also
differentiated significantly between 20 FPS and 15 FPS (2.4 BPM, P˚=˚0.024). Table 4.9 shows the statistical
model and significance values for ∆Heart Rate and each of the other measures. In Frame Rate, ∆Heart Rate was
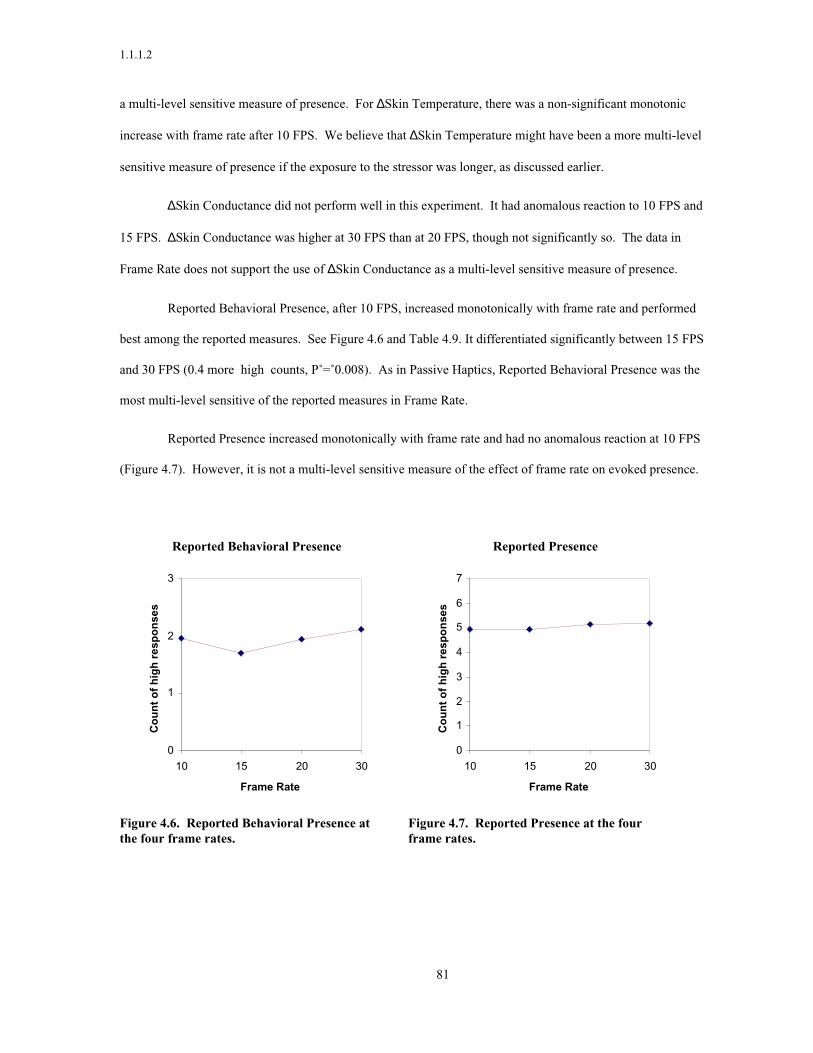
1.1.1.2
81
a multi-level sensitive measure of presence. For ∆Skin Temperature, there was a non-significant monotonic
increase with frame rate after 10 FPS. We believe that ∆Skin Temperature might have been a more multi-level
sensitive measure of presence if the exposure to the stressor was longer, as discussed earlier.
∆Skin Conductance did not perform well in this experiment. It had anomalous reaction to 10 FPS and
15 FPS. ∆Skin Conductance was higher at 30 FPS than at 20 FPS, though not significantly so. The data in
Frame Rate does not support the use of ∆Skin Conductance as a multi-level sensitive measure of presence.
Reported Behavioral Presence, after 10 FPS, increased monotonically with frame rate and performed
best among the reported measures. See Figure 4.6 and Table 4.9. It differentiated significantly between 15 FPS
and 30 FPS (0.4 more high counts, P˚=˚0.008). As in Passive Haptics, Reported Behavioral Presence was the
most multi-level sensitive of the reported measures in Frame Rate.
Reported Presence increased monotonically with frame rate and had no anomalous reaction at 10 FPS
(Figure 4.7). However, it is not a multi-level sensitive measure of the effect of frame rate on evoked presence.
Reported Behavioral Presence
0
1
2
3
10 15 20 30
Frame Rate
Co
un
t o
f h
igh
res
po
nse
s
Reported Presence
0
1
2
3
4
5
6
7
10 15 20 30
Frame Rate
Co
un
t o
f h
igh
res
po
nse
s
Figure 4.6. Reported Behavioral Presence atthe four frame rates.
Figure 4.7. Reported Presence at the fourframe rates.

1.1.1.2
82
Reported Ease of Locomotion
0
1
2
3
10 15 20 30
Frame Rate
Co
un
t o
f h
igh
res
po
nse
s
Observed Behavioral Presence
0
1
2
3
10 15 20 30
Frame Rate
Co
un
t o
f h
eig
ht
reac
tio
ns
Figure 4.8. Reported Ease of Locomotion at thefour frame rates.
Figure 4.9. Observed Behavioral Presence at thefour frame rates.
Observed Behavioral Presence had anomalous reactions at both 10 FPS and 15 FPS. It also had a non-
significant increase from 20 FPS to 30 FPS. See Figure 4.9. Observed Behavioral Presence did not perform
well in Frame Rate.
4.3.4 Objectivity
Reliability, validity, and multi-level sensitivity are investigated experimentally. Objectivity, on the
other hand, can only be argued logically. We gave the argument for the objectivity of the physiological
measures in Chapter 1.
4.3.5 Summary
The data presented in this chapter and in Chapter 1 show that physiological reactions are reliable,
valid, multi-level sensitive, and objective measures of presence. All three physiological measures, ∆Heart Rate,
∆Skin Conductance, and ∆Skin Temperature, were reliable. All three measures significantly differentiated
between Pit Room and Training Room. All three measures decreased with multiple exposures, as is seen in
similar real-life situations [Abelson, 1989; Andreassi, 1995].
1.1.1.2
83
We found the measures to be valid — they correlated with well-established reported measures. Among
the measures, ∆Heart Rate correlated the best with the reported measures. ∆Skin Conductance correlated well,
but not as well as ∆Heart Rate. ∆Skin Temperature did not correlate well with the reported measures.
We found the measures to be multi-level sensitive — they differentiated among various presence
conditions. ∆Heart Rate performed best. It significantly differentiated the inclusion of the 1.5-inch wooden
ledge and, after 10 FPS, increased significantly with frame rate. We had poor results with ∆Skin Conductance
and ∆Skin Temperature. ∆Skin Conductance was significantly higher with the 1.5-inch wooden ledge, but it
showed anomalous reactions at both 10 and 15 FPS. ∆Skin Temperature was non-significantly lower with the
1.5-inch wooden ledge, but increased non-significantly and monotonically with frame rate after 10 FPS.
Each of the physiological measures was objective — free from bias from either the experimenter or the
subjects. They were not exposed to bias from the experimenter, since the instructions read to the subjects were
uniform. Bias from the subjects would have been difficult, especially since physiological reaction is hard to
control, and no bio-feedback was given.
Overall, we suggest ∆Heart Rate as a reliable, valid, multi-level sensitive, and objective measure of
presence. We believe that both ∆Skin Conductance and ∆Skin Temperature have potential as measures of
presence, but more investigation would be needed.
Our Observed Behavioral Presence measure was not an objective measure of presence — it was
exposed to bias from both the experimenter and the subject. It correlated well with Reported Behavioral
Presence in all three experiments but had inconsistent correlations with Reported Presence. There was only a
limited data set for Observed Behavioral Presence in Passive Haptics, but for that data, it significantly
differentiated the 1.5-inch wooden ledge. It showed, however, anomalous reactions at both 10 FPS and 15 FPS
in Frame Rate. Overall, we do not suggest Observed Behavioral Presence as a reliable, valid, multi-level
sensitive, and objective measure of presence.

1.1.1.2
84
4.4 Other findings
4.4.1 Physiological reactions as between-subjects measures
We conducted all of the studies as within-subjects to avoid the substantial variances due to natural
human differences. The UCL questionnaire has been used successfully between-subjects [Usoh, 1999]. How
well would the physiological measures work in between-subjects studies? To investigate this, we analyzed the
data looking at only the first task for each subject. Hence, we had just 10 data points (10 subjects — first
exposure only) for the Multiple Exposures study, 52 data points for the Passive Haptics study, and 33 data
points for the Frame Rate study. Highlights of the between-subjects analysis were give in Chapter 1.
Supporting details are given here.
Reliability between-subjects: Physiological reaction in the Pit Room. As we suspected, all of the
physiological reactions were significantly higher in the Pit Room when analyzing only the first exposure for
each subject. The percentage of exposures in which the physiological reaction is higher in the Pit Room as
compared to the Training Room were at least 90% for all measures in all studies, except ∆Heart Rate in Passive
Haptics — 85%. Table 1.3 shows this. This consistent differentiation supports the reliability of physiological
reactions as between-subjects measures of presence.
Validity between-subjects: Correlation with established measures. Our measures are defined so that, if
valid, all the measures should correlate positively. As expected, physiological reactions did not correlate as
well with the questionnaires when only the first exposure for each subject was considered. As shown in Table
4.10, ∆Heart Rate had a non-significant, positive correlation with Reported Presence and Reported Behavioral
Presence in Frame Rate. It had non-significant negative correlations with Reported Presence and Reported
Behavioral Presence in Passive Haptics. Overall, our data was inconclusive as to the validity of ∆Heart Rate as
a between-subjects measure. The same was true for the other two physiological measures. The data for these
two measures was inconclusive as to the validity of ∆Skin Conductance and ∆Skin Temperature.

1.1.1.2
85
Correlations Study Reported Presence Reported BehavioralPresence
MEP
∆∆∆∆Heart Rate PH -0.234 -0.132P 0.117 0.381FR 0.319 0.196P 0.070 0.274ME 0.09 -0.439P 0.818 0.238
∆∆∆∆Skin PH -0.079 0.09Conductance P 0.583 0.534
FR -0.074 0.28P 0.681 0.115ME 0.316 -0.434P 0.489 0.331
∆∆∆∆Skin PH 0.029 0.094Temperature P 0.842 0.522
FR 0.068 0.213P 0.709 0.233ME 0.109 0.522
Observed P 0.837 0.288Behavioral PH 0.110 0.379Presence P 0.554 0.035
FR -0.132 0.043P 0.479 0.820
Table 4.10. Analyzed between-subjects: correlations between the physiological and observed measuresand the reported measures.
For the between-subjects analysis, Observed Behavioral Presence correlated positively with Reported
Behavioral Presence in all three studies and did so significantly in Passive Haptics (where there was a reduced
data set). It had inconsistent correlations with Reported Presence. See Table 4.10. Overall, our data was
inconclusive as to the validity of Observed Behavioral Presence as a between-subjects measure.
Contrary to this expectation, though, the physiological measures did differentiate among the
conditions: physiological reaction to the Pit Room was significantly higher that to the Training Room for all
measures in all studies (described above), and we found significant differences in the physiological measures
among conditions in both the Passive Haptics and Frame Rate studies
Multi-level sensitivity between-subjects: Differentiating among presence conditions. We expected, when
analyzing the data between-subjects, that inter-subject variation in physiological reactivity would obscure the

1.1.1.2
86
effects seen among conditions in the experiments. Contrary to this expectation, physiological reaction did
differentiate among conditions when analyzing only the first exposure of each study. We found that
physiological reaction to the Pit Room was significantly higher that to the Training Room for all measures in all
studies (described in Chapter 1), and we found significant differences in the physiological measures among
conditions in both the Passive Haptics and Frame Rate studies. In the Passive Haptics study, both ∆Heart Rate
and ∆Skin Conductance varied in the expected direction with some statistical power (P˚=˚0.097 for ∆Heart Rate;
P˚=˚0.137 for ∆Skin Conductance). ∆Skin Temperature also increased with the 1.5-inch ledge in Passive
Haptics, but with less statistical power (P˚=˚0.398). Table 4.11 shows the statistical models for each of the
measures (between-subjects) in Passive Haptics. As shown in Table 4.12, controlling for Level of Computer
Game Playing was significant for ∆Heart Rate. Subjects that reported playing more computer games had
smaller increases in heart rate as they approached the virtual pit. After correcting for Level of Computer Game
Playing, the significance of the 1.5-inch wooden ledge was decreased for ∆Heart Rate (P˚=˚0.180).
∆∆∆∆Heart Rate ∆∆∆∆SkinConductance
∆∆∆∆SkinTemperature
ReportedPresence
ReportedBehavioralPresence
ObservedBehavioralPresence
ββββ P ββββ P ββββ P ββββ P ββββ P ββββ P
CorrectedModel
0.097 0.137 0.398 0.498 0.051 0.001
Intercept 7.9 < 0.001 5.2 < 0.001 1.2 < 0.001 4.9 < 0.001 2.2 < 0.001 4.5 < 0.001
Increase withPassive Haptics
3.3 0.097 1.0 0.137 0.3 0.398 -0.3 0.498 0.5 0.051 2.7 0.001
Table 4.11. Analyzed between-subjects: statistical models for each measure in Passive Haptics.
∆∆∆∆Heart Rateββββ P
Corrected Model 0.005Intercept 13.0 < 0.001Increase with Passive Haptics 2.7 0.180Increase with Computer Game Usage -1.6 0.004
Table 4.12. Analyzed between-subjects: models when correcting for Level of Computer Game Playingfor ∆∆∆∆Heart Rate in Passive Haptics.
Multi-level sensitivity between-subjects in Frame Rate. Even between-subjects, in the Frame Rate study,
∆Heart Rate followed hypothesized patterns after 10 FPS (see Figure 4.10). Additionally, ∆Heart Rate
differentiated with some statistical power among presence conditions: ∆Heart Rate at 30 FPS was higher than at
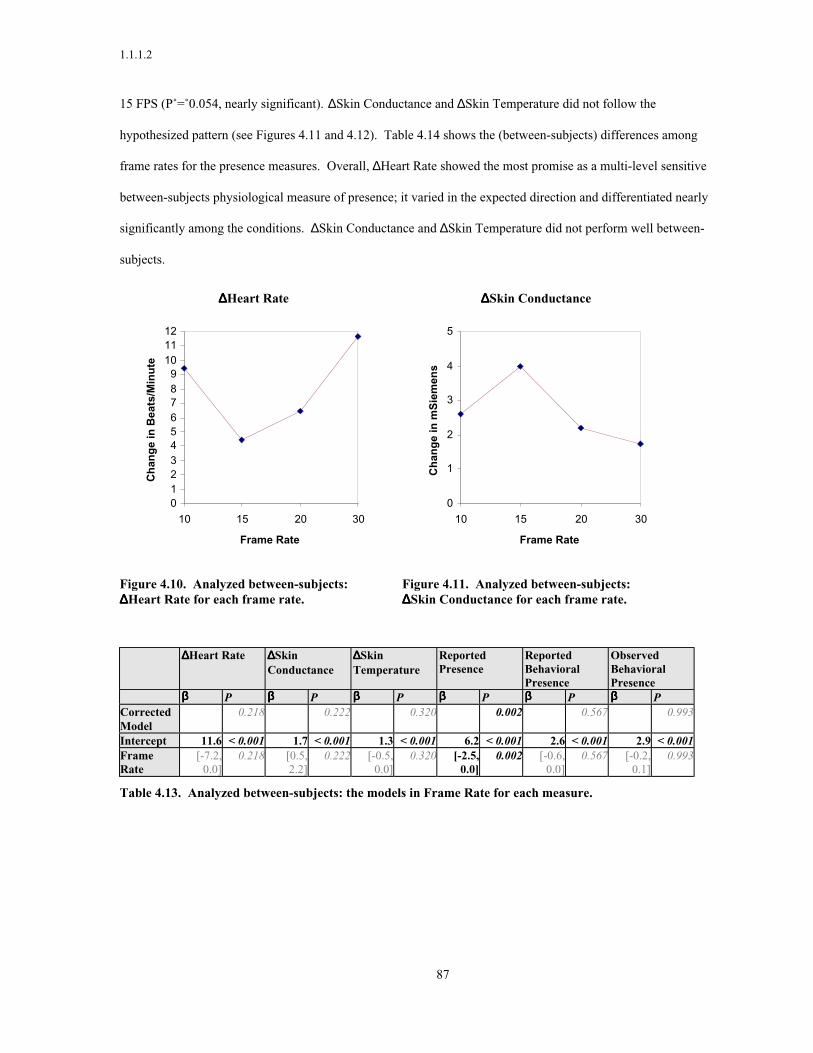
1.1.1.2
87
15 FPS (P˚=˚0.054, nearly significant). ∆Skin Conductance and ∆Skin Temperature did not follow the
hypothesized pattern (see Figures 4.11 and 4.12). Table 4.14 shows the (between-subjects) differences among
frame rates for the presence measures. Overall, ∆Heart Rate showed the most promise as a multi-level sensitive
between-subjects physiological measure of presence; it varied in the expected direction and differentiated nearly
significantly among the conditions. ∆Skin Conductance and ∆Skin Temperature did not perform well between-
subjects.
∆∆∆∆Heart Rate
0123456789
101112
10 15 20 30
Frame Rate
Ch
ang
e in
Bea
ts/M
inu
te
∆∆∆∆Skin Conductance
0
1
2
3
4
5
10 15 20 30
Frame Rate
Ch
ang
e in
mS
iem
ens
Figure 4.10. Analyzed between-subjects:∆∆∆∆Heart Rate for each frame rate.
Figure 4.11. Analyzed between-subjects:∆∆∆∆Skin Conductance for each frame rate.
∆∆∆∆Heart Rate ∆∆∆∆SkinConductance
∆∆∆∆SkinTemperature
ReportedPresence
ReportedBehavioralPresence
ObservedBehavioralPresence
ββββ P ββββ P ββββ P ββββ P ββββ P ββββ PCorrectedModel
0.218 0.222 0.320 0.002 0.567 0.993
Intercept 11.6 < 0.001 1.7 < 0.001 1.3 < 0.001 6.2 < 0.001 2.6 < 0.001 2.9 < 0.001FrameRate
[-7.2,0.0]
0.218 [0.5,2.2]
0.222 [-0.5,0.0]
0.320 [-2.5,0.0]
0.002 [-0.6,0.0]
0.567 [-0.2,0.1]
0.993
Table 4.13. Analyzed between-subjects: the models in Frame Rate for each measure.

1.1.1.2
88
∆∆∆∆Skin Temperature
0.0
0.5
1.0
1.5
2.0
10 15 20 30
Frame Rate
Ch
ang
e in
Deg
rees
Fah
ren
hei
t
Figure 4.12. Analyzed between-subjects:∆∆∆∆Skin Temperature for each frame rate.
∆∆∆∆Heart Rate ∆∆∆∆SkinConductance
∆∆∆∆SkinTemperature
ReportedPresence
ReportedBehavioralPresence
ObservedBehavioralPresence
Increase from 10 FPSto 15 FPS
-5.0 1.4 0.1 1.0 0.1 -0.1
P 0.187 0.221 0.830 0.161 0.769 0.894
Increase from 15 FPSto 20 FPS
2.0 -1.8 -0.1 1.5 0.1 -0.2
P 0.587 0.119 0.630 0.039 0.769 0.868
Increase from 20 FPSto 30 FPS
5.2 -0.5 0.5 -0.0 0.3 0.2
P 0.159 0.686 0.091 0.967 0.462 0.868
Increase from 10 FPSto 30 FPS
2.2 -0.8 0.4 2.5 0.6 -0.1
P 0.541 0.445 0.153 0.001 0.185 0.894
Increase from 15 FPSto 30 FPS
7.2 -2.2 0.3 1.5 0.4 -0.0
P 0.054 0.048 0.223 0.038 0.302 1.000
Table 4.14. Analyzed between-subjects: differences among frame rates.
Reported Presence performed well as a between-subjects presence measure in the Frame Rate study
but not in the Passive Haptics study. It followed the hypothesized monotonic increase with Frame Rate (the

1.1.1.2
89
responses at 20 FPS and 30 FPS were nearly equal on average — see Figure 4.13 and Table 4.14) and was more
multi-level sensitive than any of the other measures in this study: Reported Presence was significantly higher at
30 FPS than at 10 FPS (P < 0.001) and at 30 FPS than at 15 FPS (P˚=˚0.038). See Table 4.14. Reported
Presence, however, did not perform well between-subjects in the Passive Haptics study. It was non-
significantly lower when the 1.5 wooden ledge was present. This was opposite the hypothesized direction.
See Table 4.11.
Reported Presence
0
1
2
3
4
5
6
7
10 15 20 30
Frame Rate
Co
un
t o
f h
igh
res
po
nse
s
Reported Behavioral Presence
0
1
2
3
10 15 20 30
Frame Rate
Co
un
t o
f h
igh
res
po
nse
s
Figure 4.13. Analyzed between-subjects:Reported Presence for each frame rate.
Figure 4.14. Analyzed between-subjects:Reported Behavioral Presence for each framerate.
Reported Behavioral Presence was moderately multi-level sensitive (P˚=˚0.051 — nearly significant) in
the Passive Haptics study. It followed the hypothesized pattern: a monotonic increase with Frame Rate (see
Figure 4.14), but did not differentiate significantly among the different frame rates (See Table 4.14).

1.1.1.2
90
Observed Behavioral Presence
0
1
2
3
10 15 20 30
Frame Rate
Co
un
t o
f b
ehav
iors
Figure 4.15. Analyzed between-subjects:Observed Behavioral Presence for each framerate.
In Passive Haptics, Observed Behavioral Presence was significantly higher with the 1.5-inch wooden
ledge included (between-subjects). Its significance (P˚=˚0.001) was higher than for any other between-subjects
measure. In Frame Rate, however, Observed Behavioral Presence neither followed the hypothesized monotonic
increase (see Figure 4.15) nor did it differentiate among frame rates (Table 4.14).
In conclusion, there was support for the use of physiological reaction as a between-subjects measure of
presence. ∆Heart Rate did not correlate well with the reported measures, but it was able to differentiate among
multiple presence conditions. We suggest it as the best physiological measure for between-subjects presence
studies. ∆Skin Conductance and ∆Skin Temperature did not correlate well and did not follow hypotheses when
analyzed between-subjects. Observed Behavioral Presence correlated well with Reported Behavioral Presence
and differentiated with power for the reduced data set available for Passive Haptics, but did not follow
hypotheses in Frame Rate. Our data did not support its use as a between-subjects measure of presence.
4.4.2 High-low threshold for presence questionnaire.
Even though each question in the UCL questionnaire was rated on a scale of 1-7, Slater et al. used the
questions only to yield a High-Presence/ Low-Presence result. A judgment had to be made as to the high-low
threshold. Slater et al. investigated the use of 6 and 7 [m6] as high responses and the use of 5, 6, and 7 [ m5]

1.1.1.2
91
as high responses — as well as other constructions: addition of raw scores and a combination based on
principal-components analysis. They found that scoring [m6] as high values best followed conditions [Slater,
1994]. We, however, found [m5] to better follow conditions.
Reported Presence [mmmm5] ReportedPresence[mmmm6]
Increase withPassive Haptics
Increase = 0.5, P˚=˚0.060 Increase =0.4, P˚=˚0.215
Frame Rate
0
1
2
3
4
5
6
7
10 15 20 30Frame Rate
Co
un
t o
f h
igh
res
po
nse
s
0
1
2
3
4
5
6
7
10C
ou
nt
of
hig
h r
esp
on
ses
Significance fordifference 10FPS -15FPS
Increase = 0.0, P˚=˚1.000 Increase =0.3, P˚=˚0.409
15 FPS - 20 FPS Increase = 0.2, P˚=˚0.553 Increase =0.1, P˚=˚0.885
20 FPS - 30 FPS Increase = 0.1, P˚=˚0.843 Decrease =0.6, P˚=˚0.090
Table 4.15. Comparison of results for Reported Presence using either [mmmm5] or [mmmm6] as high values.
Using [m5] better followed conditions for Reported Presence for both Passive Haptics and Frame Rate
(Table 4.15). Using [m5] differentiated more significantly than [ m6] in Passive Haptics. In Frame rate, [ m5]
was more multi-level sensitive and followed the hypothesized monotonic increase; [m6] did not closely follow
the hypothesis.

1.1.1.2
92
Reported Behavioral Presence [mmmm5] ReportedBehavioralPresence[mmmm6]
Increase withPassive Haptics
Increase = 0.4, P˚=˚0.004 Increase =0.4, P˚=˚0.003
Frame Rate
0
1
2
3
10 15 20 30
Frame Rate
Co
un
t o
f h
igh
res
po
nse
s
0
1
2
3
10
F
Co
un
t o
f h
igh
res
po
nse
s
Significance fordifference 10FPS -15FPS
Decrease = 0.3, P˚=˚0.083 Decrease =0.3, P˚=˚0.123
15 FPS - 20 FPS Increase = 0.2, P˚=˚0.116 Increase = 0.2,P˚=˚0.175
20 FPS - 30 FPS Increase = 0.2, P˚=˚0.256 Decrease =0.0, P˚=˚0.831
Table 4.16. Comparison of results for Reported Behavioral Presence using either [mmmm5] or [mmmm6] as highvalues.
For Reported Behavioral Presence, using [m6] performed only slightly better (P˚=˚0.003) than [m5]
(P˚=˚0.004) in Passive Haptics. In Frame Rate, [m5] was more multi-level sensitive and more closely followed
the hypothesized monotonic increase with Frame Rate than [m6]. See Table 4.16.
Given the evidence:
• For Reported Presence, [m5] more closely followed conditions and differentiates with more
power among conditions for both studies,
• For Reported Behavioral Presence, [m5] better followed conditions and was more multi-level
sensitive in Frame Rate; [m5] and [ m6] performed equally in Passive Haptics;
Overall, use of [m5] best follows conditions.

1.1.1.2
93
Correlations. The physiological measures correlated better with the reported measures scored as [m6] than
those scored using [m5]. See Table 4.17. Of the ten correlations that were positive and significant between a
physiological measure and a reported measure (e.g. ∆Heart Rate and Reported Presence [m5] in Frame Rate),
in every case the correlation with the [m6] measure was greater than the [m5] measure:
• ∆Heart Rate and Reported Presence in Frame Rate
• ∆Heart Rate and Reported Behavioral Presence in Frame Rate
• ∆Skin Conductance and Reported Presence in Multiple Exposures
• ∆Skin Conductance and Reported Behavioral Presence in Multiple Exposures
• ∆Skin Temperature and Reported Presence in Frame Rate.
Correlations Study Reported Presence[mmmm5]
Reported Presence[mmmm6]
Reported BehavioralPresence [mmmm5]
Reported BehavioralPresence [mmmm6]
MEP
∆∆∆∆Heart Rate PH 0.034 0.003 0.004 0.006P 0.743 0.976 0.972 0.955FR 0.265 0.305 0.192 0.225P 0.002 < 0.001 0.028 0.009ME 0.245 0.303 0.290 0.395P 0.009 0.001 0.002 < 0.001
∆∆∆∆Skin PH -0.002 0.055 0.106 0.041Conductance P 0.986 0.577 0.280 0.674
FR 0.096 0.054 0.125 0.004P 0.275 0.540 0.154 0.968ME -0.098 -0.092 -0.040 0.018P 0.349 0.380 0.699 0.861
∆∆∆∆Skin PH -0.075 -0.007 -0.086 -0.105Temperature P 0.448 0.944 0.383 0.291
FR 0.171 0.221 0.066 0.026P 0.050 0.011 0.454 0.769
Table 4.17. Table of correlations for the physiological measures with the reported measures using both[mmmm6] and [mmmm5] as "high" values.
To make our decision as to where to set the high and low mark for the presence measures, we had to
consider the conflicting evidence: 1) using [m5] better followed conditions than [ m6] and 2) the correlations
were greater using [m6] than [ m5]. While greater correlations would better demonstrate the validity of our
measures, this would not be a suitable reason to choose a threshold. We felt that it would be better to choose a
threshold using the logic that Slater et al. used: Which scoring better followed conditions? Therefore, since
1.1.1.2
94
conditions were better followed using [m5], we chose to score 5, 6, and 7 as high values in the analysis of
this dissertation.
The reporting of 5 s by subjects contributed to our using [m5] instead of [ m6] as Slater et al. did.
Over 25% of our subjects reported 5 s for Reported Presence in our studies (23% for the combination for
Reported Presence, Reported Behavioral Presence, and Reported Ease of Locomotion). For the study for which
data was published, Slater s subjects rarely (<10%) reported 5 values. One explanation for this may be that
university students today expect more technically of a VE than they did several years ago. This heightened
expectation may account for the increased number of 5 s reported in our studies.

1.1.1.2
95
Bibliography
Abelson, J. L. and G. C. Curtis (1989). Cardiac and neuroendocrine responses to exposure therapy in heightphobics. Behavior Research and Therapy, 27(5): 561-567.
Andreassi, J. L. (1995). Psychophysiology: human behavior and physiological response. Hillsdale, N.J.,Lawrence Erlbaum Associates.
Cobb, S., S. Nichols, A. Ramsey and J. R. Wilson (1999). Virtual reality induced symptoms and effects(VRISE). Presence: Teleoperators and Virtual Environments, 8(2): 169-186.
Cohen, D. C. (1977). Comparison of self-report and overt-behavior procedure for assessing acrophobia.Behavior Therapy, 8: 17-23.
Cowings, P., S. Jensen, D. Bergner and W. Toscano (2001). A lightweight ambulatory physiological monitoringsystem. Moffett Field, California, Ames Research Center.
Dihn, H. Q., N. Walker, L. F. Hodges, C. Song and A. Kobayashi (1999). Evaluating the importance of multi-sensory input on memory and the sense of presence in virtual environments. Proceedings of VirtualReality, 222-228, Houston, Texas, USA.
Eberhart, R. C. and P. N. Kizakevich (1993). Determining physiological effects of using VR equipment.Proceedings of First Annual Conference, Virtual Reality and Persons with Disabilities, 47-49.
Ellis, S. R. (1996). Presence of mind: A reaction to Thomas Sheridan’s "Further musings on the psychophysicsof presence". Presence: Teleoperators and Virtual Environments, 5(2): 247-259.
Emmelkamp, P. and M. Felten (1985). The process of exposure in vivo: cognitive and physiological changesduring treatment of acrophobia. Behavior Research and Therapy, 23(2): 219.
Fontaine, G. (1992). The experience of a sense of presence in intercultural and international encounters.Presence: Teleoperators and Virtual Environments, 1(4): 482-490.
Guyton, A. C. (1986). Basic characteristics of the sympathetic and parasympathetic function. In Textbook ofMedical Physiology, 688-697. Philadelphia, W.B. Saunders Company.
Heeter, C. (1992). Being there: The subjective experience of presence. Presence: Teleoperators and VirtualEnvironments, 1: 262-271.
Held, R. M. and N. I. Durlach (1992). Telepresence. Presence: Teleoperators and Virtual Environments,1(Winter): 109-112.
Hendrix, C. and W. Barfield (1996). The sense of presence within auditory virtual environments. Presence:Teleoperators and Virtual Environments, 5(3): 290-301.
Hodges, L., B. Rothbaum, R. Kooper, D. Opdyke, J. Willford, T. Meyer and M. North (1994). Presence as thedefining factor in a VR application. Technical Report GVU-94-06. Georgia Tech University, Graphics,Visualization, and Usability Center.
Hodges, L. F., B. O. Rothbaum, R. Kooper, D. Opdyke, T. Meyer, M. North, J. J. de Graaff and J. Williford(1995). Virtual environments for treating the fear of heights. IEEE Computer, 28(7): 27-34.
Insko, B. (2001). Passive haptics significantly enhance virtual environments. Doctoral Dissertation. ComputerScience Department. Chapel Hill, NC. University of North Carolina.
Jones, O. R. and D. A. Grant (1948). Category difficulty study on the University of Wisconsin Card SortingTest. American Psychologist, 3.
Jorgensen, C., J. Ogden, K. Willis, M. Blessing, K. A. Caudell, G. Patrick and T. P. Caudell (1997).Locomotion in a virtual environment: Performance measures and physiological responses. Proceedingsof Human Factors and Ergonomics Society 41st Annual Meeting, 1148-1151, Albuquerque, NewMexico.

1.1.1.2
96
Kennedy, R., N. Lane, K. Berbaum and M. Lilienthal (1993). A simulator sickness questionnaire(SSQ): A newmethod for quantifying simulator sickness. International Journal of Aviation Psychology, 3(3): 203-220.
Kleinbaum, D., L. Kupper, K. Muller and A. Nizam (1998). Applied regression analysis and other multivariatemethods.
Lipsey, M. W. (1998). Design sensitivity: Statistical power for applied experimental research. In L. Brickmanand D. J. Rog, Eds., Handbook of applied social research methods, 39-68. Thousand Oaks, California,Sage Publications, Inc.
Lombard, M. and T. Ditton (1997). At the heart of It all: The concept of presence. Journal of ComputerMediated Communication, 3(2).
Lombard, M. and T. Ditton (1999). Across media: Toward a standardized conceptual and operational definitionof presence. 2nd Int. Wkshp. on Presence.
McMurray, D. R. (1999). Director of Applied Physiology lab, University of North Carolina. PersonalCommunication.
Meehan, M. (2000a). Measuring presence objectively. British Psychological Society Work Shop on Presenceand Its Measures.
Meehan, M. (2000b). An objective surrogate for presence: Physiological response. 3rd Int. Wkshp. on Presence.
Meehan, M., L. Pugnetti, F. Riva, E. Barbiera, L. Mendozzi and C. E. (2000c). Peripheral responses to amental-stress inducing virtual environment experience. Proceedings of International Conference onDisability, Virtual Reality and Associated Technologies, Sardinia, Italy.
Mine, M. R. (1993). Characterization of end-to-end delays in head-mounted display systems. Technical ReportTR93-001. Chapel Hill, NC, University of North Carolina.
Plato (380 B.C.). Book 5. In The Republic. Indianapolis, Hacket Publishing Company.
Psotka, J. M., S. Davison and S. A. Lewis (1993). Exploring immersion in virtual space. Virtual RealitySystems, 1(2): 70-82.
Pugnetti, L., L. Mendozzi, A. M. Cattaneo, S. Guzzetti, C. Mezzetti, C. Coglati, D. A. E., A. Brancotti and D.Venanzi (1995). Psychophysiological activity during virtual reality (VR) testing. Journal ofPsychophysiology, 8(4): 361-362.
Pugnetti, L., L. Mendozzi, E. Barbieri, F. D. Rose and E. A. Attree (1996). Nervous system correlates of virtualreality experience. Proceedings of 1st European Conference on Disability, Virtual Reality andAssociated Technologies, 239-246.
Pugnetti, L., M. Meehan, L. Mendozzi, F. Riva, E. Barbiera and C. E. (2000). More on Central Nervous SystemCorrelates of Virtual Reality Testing. Proceedings of International Conference on Disability, VirtualReality and Associated Technologies, Sardinia, Italy.
Regenbrecht, H. T. and T. W. Schubert (1997). Measuring presence in virtual environments. Human ComputerInterface International, San Francisco, USA.
Sallnas, E. L. (1999). Presence in multimodal devices. 2nd Int. Wkshp. on Presence.
SAS (1990). SAS/ STAT User’s Guide, Version 6, Fourth Edition. Cary, NC, USA, SAS Institute Inc.
Schloerb, D. W. (1995). A quantitative measure of telepresence. Presence: Teleoperators and VirtualEnvironments, 4(1): 64-80.
Seidel, H. and H. Herzel (1995). Modeling heart rate variability due to respiration and baroreflex. In E.Mosekilde and O. G. Mouritsen, Eds., Modeling the dynamics of biological systems, Springer Verlag.
Sheridan (1992). Musings on telepresence and virtual presence, telepresence. Presence: Teleoperators andVirtual Environments, 1(Winter): 120-126.

1.1.1.2
97
Sheridan, T. B. (1996). Further musings on the psychophysics of presence. Presence: Teleoperators and VirtualEnvironments, 5(2): 241-246.
Short, J., E. Williams and B. Christie (1976). The social psychology of telecommunications. London, Wiley.
Singleton, R. A., B. C. Straits and M. M. Straits (1993). Approaches to Social Research. New York, OxfordUniversity Press.
Slater, M. and M. Usoh (1993). Representations systems, perceptual position, and presence in immersive virtualenvironments. Presence: Teleoperators and Virtual Environments, 2(3): 221-233.
Slater, M., M. Usoh and A. Steed (1994). Depth of presence in virtual environments. Presence: Teleoperatorsand Virtual Environments, 3(2): 130-144.
Slater, M., M. Usoh and Y. Chrysanthou (1995a). The influence of dynamic shadows on presence in immersivevirtual environments. Virtual Environments ’95, 8-21.
Slater, M., M. Usoh and A. Steed (1995b). Taking steps: The influence of a walking technique on presence invirtual reality. Proceedings of ACM Transactions on Computer Human Interaction (TOCHI) 2(3): 201-219.
Slater, M., V. Linakis, M. Usoh and R. Kooper (1996). Immersion, presence and performance in virtualenvironments: An experiment with tri-dimensional chess. Proceedings of ACM Virtual RealitySoftware and Technology (VRST), 163-172.
Slater, M. (1999). Measuring Presence: A Response to the Witmer and Singer Presence Questionnaire.Presence: Teleoperators and Virtual Environments, 8(5): 560-565.
Slater, M. and A. Steed (2000). A Virtual Presence Counter. Presence: Teleoperators and VirtualEnvironments, 9(5): 413-434.
SPSS (1999). SPSS Release 10.0.1 Standard Version, SPSS.
Steed, A., M. Slater, A. Sadagic, A. Bullock and J. Tromp (1999). Leadership and collaboration in sharedvirtual environments. Proceedings of Virtual Reality, 112-115, Houston, Texas.
Steuer, J. (1992). Defining virtual reality: Dimensions determining telepresence. Journal of Communication,42(4): 73-93.
Sutherland, S. (1996). The international dictionary of psychology. New York, The Crossroads PublishingCompany.
Thie, S. and J. Van Wijk (1998). A general theory on presence. 1st Int. Wkshp. on Presence.
Uno, S. and M. Slater (1997). The sensitivity of presence to collision response. Proceedings of Virtual RealityAnnual International Symposium (VRAIS).
Usoh, M., K. Arthur, M. Whitton, R. Bastos, A. Steed, M. Slater and F. Brooks (1999). Walking > walking-in-place > flying in virtual environments. Proceedings of ACM SIGGRAPH 99.
Usoh, M., E. Catena, S. Arman and M. Slater (2000). Using Presence Questionnaires in Reality. Presence:Teleoperators and Virtual Environments, 9(5): 497-503.
Ward, M., R. Azuma, R. Bennett, S. Gottschalk and H. Fuchs (1992). A demonstrated optical tracker withscalable work area for head mounted displays. Proc. of the 1992 Symposium on Interactive 3DGraphics, 25(2): 43-52.
Webster (1994). Webster’s New World Dictionary.
Weiderhold, B. K., R. Gervirtz and M. D. Weiderhold (1998). Fear of flying: A case report using virtual realitytherapy with physiological monitoring. CyberPsychology and Behavior, 1(2): 97-104.
Welch, G. and G. Bishop (1997). SCAAT: Incremental tracking with incomplete information. Proceedings ofACM SIGGRAPH 97, 333-344.

1.1.1.2
98
Witmer, B. G. and M. J. Singer (1998). Measuring presence in virtual environments: A presence questionnaire.Presence: Teleoperators and Virtual Environments, 7(3): 225-240.
Yamaguchi, T. (1999). Physiological studies of human fatigue by a virtual reality system. Presence:Teleoperators and Virtual Environments, 8(1): 112-124.
1.1.1.2
99
Appendix A Stress response in human physiology
The human body releases chemicals into the circulating blood and near organs to regulate visceral
functions. These functions include both homeostasis and stress reactions. Homeostasis includes body
temperature regulation and blood flow control. We are interested in the body’s stress, or fight-or-flight,
response. In particular we are interested in heart rate, electrodermal, and skin temperature response to stress.
The concepts are presented without citations and have been summarized from [Guyton, 1986] and [Andreassi,
1995].
A. 1 Autonomic nervous system
Peripheral response (activity in the internal organs) is controlled by the autonomic nervous system
(ANS). This system controls heart contraction force and rate, sweat gland activity, skin temperature reaction,
gastric motility, metabolism, blood glucose and coagulation levels, skeletal muscle strength, and many other
visceral functions.
The ANS can effect a quick and strong reaction over a broad range of visceral functions. For example,
heart rate can be doubled in 3-5 seconds and sweating can begin within 2 seconds. These reactions are brought
about by chemicals released by the two parts of the autonomic nervous system: the sympathetic nervous system
(SNS) and the parasympathetic nervous system (PNS).
The PNS governs the resting and rehabilitation of the body — homeostasis. It controls the systems
needed to rebuild body tissue and reduce body stress level. The SNS manages the body s reaction to stress and
preparation for periods of vigorous muscle activity. It controls the fight-or-flight reactions to situations
perceived as adverse. At any given time both the PNS and SNS are active. It is the activation level of the two
systems working in concert that determines the body s state.
Both the parasympathetic and sympathetic nervous systems work by firing neurons that cause the
release of neurotransmitters. The PNS releases its neurotransmitters only at the organs to be stimulated. It
selectively stimulates organs. The SNS releases neurotransmitters both at stimulated organs and into the blood

1.1.1.2
100
stream. It stimulates all target organs simultaneously. Table A.1 outlines organs that are stimulated by the PNS
and by the SNS and describes how those systems are affected once stimulated.
Organ Effect of SNS Stimulation Effect of PNS StimulationEye: Pupil Ciliary muscle
DilationSlight relaxation
ConstrictionConstriction
Sweat glands Copious sweating (cholinergic) NoneHeart: Muscle Increased rate
Increased force of contractionSlowed rateDecreased force ofcontraction
Lungs: BronchiBlood vessels
DilatedMildly constricted
ConstrictedDilated
Systemic arterioles:Abdominalmuscle
Skin
ConstrictedConstricted (αααα)Dilated (ββββ2, cholinergic)Constricted
NoneNone
None
Blood: CoagulationGlucose
IncreasedIncreased
NoneNone
Basal metabolism Increased up to 100% NoneAdrenal medullary secretion Increased NoneMental activity Increased NoneSkeletal muscle Increased glycogenolysis
Increased strengthNone
Table A.1. The effect of parasympathetic and sympathetic nervous system activity on various humanorgans. Summarized from Guyton, Pg. 691 [Guyton, 1986].
A. 2 Peripheral response to stress
The sympathetic nervous system governs peripheral stress response. Peripheral stress response
includes increase in heart rate, increase in electrodermal activity, and decrease in skin temperature. Also,
breathing becomes shallower and more rapid and less blood flows to the intestines. During times of stress SNS
activity increases, releasing more neurotransmitters into the blood and at target organs. The stress response
produced is summarized in Table A.1. The stress responses we chose to use in this research are change in heart
rate, electrodermal activity, and skin temperature.
An organ s response to SNS stimulation occurs within 2-3 seconds (from direct stimulation to the
organ) and continues for one to two minutes after stimulation ceases (due to neurotransmitters circulating in the
blood).

1.1.1.2
101
A. 2. 1 Heart rate response to stress
Heart rate (HR) increases in times of stress. Sympathetic stimulation increases both the rate and
strength of contraction. The combination of increased rate and force helps the circulatory system deliver more
oxygen and nutrients to the large muscle groups. This helps the body prepare to either fight its way out of stress
or escape from danger.
HR can be measured in a number of ways. Two common ways are via blood volume pulse (BVP) and
electrocardiogram (ECG). BVP measurement works by monitoring at a high frequency (32Hz) the amount of
blood in a specific region of the body. The amount of blood in the region is determined by either shining
infrared light on the skin and measuring how much of the light is reflected to a neighboring photosensor or by
shining light through a thin region, such as the earlobe, and recording the amount of light transmitted. The
amount of light received at the photosensor over time can be analyzed to determine HR.
It has been known since 1856 that the heart s contractions are accompanied by electrical changes. By
the 1900 s scientists had developed methods of measuring and recording these electrical changes from the
surface of the skin — the birth of the ECG.
The signal produced by the heart on an ECG is a 5-part wave: the PQRST wave, depicted in Figure
A.1. The explanation of what is causing these electrical signals is described in the figure.
Figure A.1. A typical PQRST wave.

1.1.1.2
102
There are many possible lead placements for ECG sensors. When subjects are moving, it is important
to chose ECG lead positions that reduce movement artifacts. McMurray suggests the lead placement illustrated
in Figure A.2 [McMurray, 1999]. It maximizes the amplitude of the signal by placing the leads across the heart
while minimizing artifacts by minimizing the amount of muscle mass beneath the leads. The ground lead
stabilizes the signal.
Figure A.2. Placement of ECG leads
A. 2. 2 Electrodermal response to stress
Electrodermal activity (EDA) is produced by two types of sweat glands: apocrine and eccrine. The
apocrine glands open into hair follicles located in genital areas and armpits and respond primarily to thermal
stimulation. The eccrine glands have a wide distribution over the body and are most concentrated on palms of
hands and soles of feet. Eccrine sweat glands respond primarily to SNS stimulation, hence to stress, by
increasing sweat gland activity. We use eccrine gland activity (SNS) in our investigation.
There are two measures of EDA: skin potential (SP) and skin conductance (SC). The techniques and
ideas behind measuring SP are attributed to Tarchanoff (1890) and SC to Fere (1888). Both researchers
investigated the relationship between EDA and physical and emotional stimuli. SP is a measure of electrical
activity caused by sweat gland activity. It is measured with a unipolar arrangement: the potential on the skin of
the palm or fingers and a ground lead on an inactive site such as the forearm or earlobe. Skin potential can
change slowly over time (called a change in skin potential level (SPL)) or it can change quickly (called a skin
potential reaction SPR). A typical SP reaction wave is depicted in Figure A.3.

1.1.1.2
103
Figure A.3. Typical Skin potential reaction (SPR-above) and skin conductance reaction (SCR -below).
Figure A.4. Bipolar placement of electrodermalsensors and placement of temperature sensor.
SC is the preferred method of measuring EDA because of the natural relationship between the signal
and its interpretation — skin conductance goes up with emotional stimuli. Skin conductance level (SCL) is the
low frequency change in skin conductance. Skin conductance reactions (SCRs) are the high-frequency, short
duration changes in skin conductance. A typical SCR is illustrated in Figure A.3. In this dissertation we call
skin conductance level skin conductance for simplicity.
SC is a measured by passing a weak electrical current across the skin and determining, from the
voltage produced, the conductance on the skin. Electrode placement is bipolar with the two electrodes usually
on adjacent fingers (illustrated in Figure A.4).
SNS activity can cause both increasing SCL, if the SNS activity is long-lasting, and, if the SNS activity
is short-lived, SCRs. SC reaction to stimuli typically occurs within 2-3 seconds and can last as long 1-2
minutes.
A. 2. 3 Skin temperature response to stress
Skin temperature (ST) on the hands, feet, lips, nose, and ears decreases in times of stress. The skin has
below it an extensive capillary system called the venous plexus. In the areas of the skin listed above, blood is
supplied to the venous plexus via a direct connection to the arteries: the arteriovenous anastomoses. When
stimulated by the SNS, these anastomoses constrict, reducing blood flow to these areas of the skin to almost
1.1.1.2
104
nothing. This reduction in blood flow to the subcutaneous venous plexus causes the reduction in skin
temperature.
Reduction in blood flow to the skin also allows the volume of blood usually stored in the skin — usually
5%-10% of total blood volume — to be released into the circulatory system. This release of a blood reservoir,
like the increase in heart rate, can be seen as a preparation for fight or flight reaction: it allows a greater amount
of blood to flow to the large muscle groups.
McMurray, points out that skin temperature reactions can be best observed by placing a thermistor at
the end of one of the fingers and holding it in place with thin porous tape [McMurray, 1999]. The placement at
the end of the finger allows one to see a quick reaction and is little influenced by blood flow in the underlying
muscle. The thin porous tape ensures faster reaction by reducing thermal insulation.
Time to reach a peak ST can be several minutes (up to 5) due to lag both in the subject’s ST and in the
sensor. Therefore, exposures to the stressor of several minutes are suggested for measures using average skin
temperature [McMurray, 1999].
A. 2. 4 Relationship between electrodermal activity and skin temperature
The relationship between electrodermal activity and skin temperature differs in stressful and non-
stressful situations. In non-stress situations, an increase in sweating is usually accompanied by an increase in
skin temperature. Both are used for thermal regulation. The evaporation of the sweat works with the increase
in blood near the surface of the skin to lower the core temperature of the body. Similarly, a decrease in blood
flow and sweat gland activity occur together to conserve body heat. This type of sweating occurs primarily in
the armpits and near the genitals. In stressful situations, in contrast, skin temperature drops while, at the same
time, sweat activity increases on the palms of the hands and feet.

1.1.1.2
105
Appendix B Documents used with subjects
B. 1 University College London Presence Questionnaire
Below is a reproduction of the UCL Presence Questionnaire we used. We extended the questionnaire
used in [Usoh, 1999]. We included an additional question on level of exercise, Question 21, and wording was
changed in Question 2 so that the question referred to objects in our environment — the room with the counters
and radio. The questionnaire was administered using the Internet.
The questionnaire yields three scores: Reported Presence (Questions 2, 5, 12, 14, 15, 17, 18), Reported
Behavioral Presence (Questions 1, 8, 10), and Reported Ease of Locomotion (Questions 4, 6, 9).
Each question is scored on a scale from 1 to 7. As discussed in Chapters 1 and 4, each of these
measures is scored by counting the number of high responses. We investigated using both 5, 6, and 7 as high
responses and using 6 and 7 as high responses. In Question 1, the scale is inverted, so we used the either 1, 2,
and 3 as high responses or 1 and 2. The measures are summed as follows:
Reported Presence = Σ High (2, 5, 12, 14, 15, 17, 18)
Reported Behavioral Presence = Σ High (1, 8, 10)
Reported Ease of Locomotion = Σ High (4, 6, 9)

1.1.1.2
106
VE QuestionnaireID:
The following questions relate to your experience.
1 Please rate the extent to which you were aware of background sounds in the real laboratory inwhich this experience was actually taking place. Rate this on the scale from 1 to 7 (where for example 1 meansthat you were hardly aware at all of the background sounds):
While in the virtual reality I was aware of background sounds from the laboratory:
(Not at all) 1. 2 3 4 5 6 7 (Very much)
2 Please rate your sense of being in the room that has the window on the following scale from 1
to 7, where 7 represents your normal experience of being in a place.
I had a sense of being in the room containing the counters and the radio:
(Not at all) 1. 2 3 4 5 6 7 (Very much)
3 Gender, Age, and Race/ Ethnicity:
Male. Female. Age.
Race/ Ethnicity:
American Indian or Alaskan Native Asian or Pacific Islander Black, not of Hispanic Origin Hispanic White, not of Hispanic Origin Other
4 Did you find it relatively simple or relatively complicated to move through the computer
generated world?To move through the computer generated world was...
(Very complicated) 1. 2 3 4 5 6 7 (Very simple)
5 To what extent were there times during the experience when the virtual rooms you were in
became the "reality" for you, and you almost forgot about the "real world" of the laboratory in which the wholeexperience was really taking place?
There were times during the experience when the virtual rooms became more real for mecompared to the "real world"...
(At no time) 1. 2 3 4 5 6 7 (Almost all of the time)
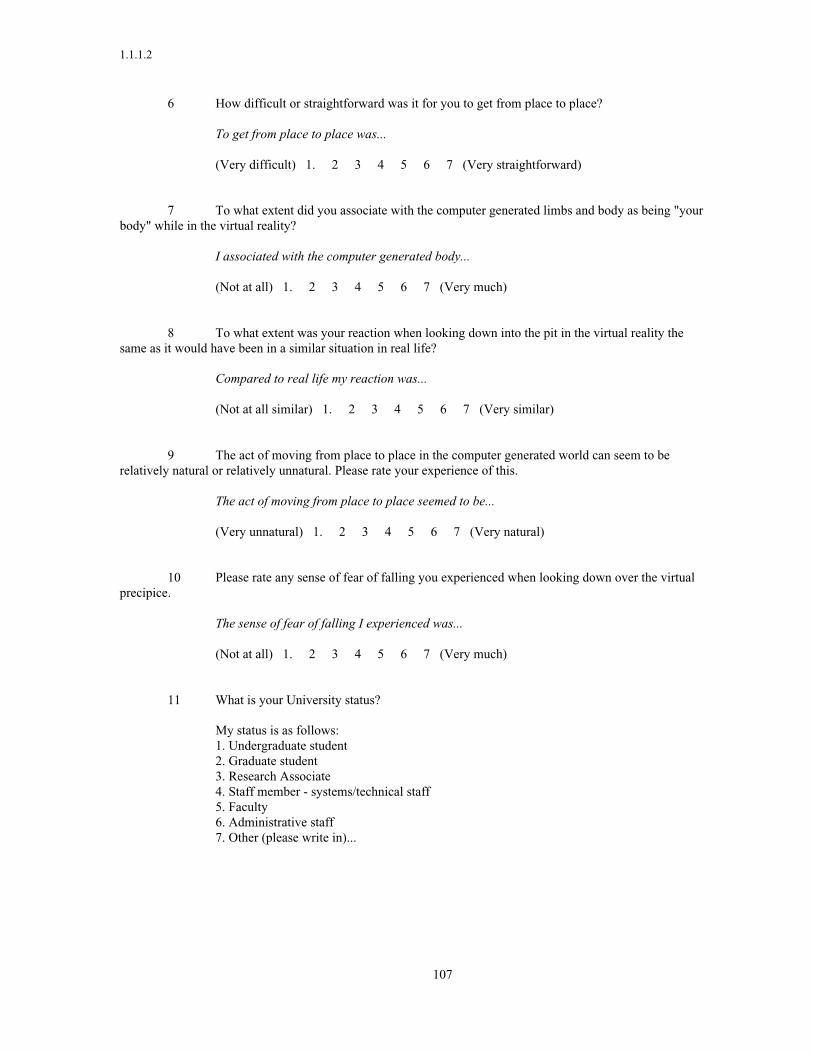
1.1.1.2
107
6 How difficult or straightforward was it for you to get from place to place?
To get from place to place was...
(Very difficult) 1. 2 3 4 5 6 7 (Very straightforward)
7 To what extent did you associate with the computer generated limbs and body as being "your
body" while in the virtual reality?
I associated with the computer generated body...
(Not at all) 1. 2 3 4 5 6 7 (Very much)
8 To what extent was your reaction when looking down into the pit in the virtual reality the
same as it would have been in a similar situation in real life?
Compared to real life my reaction was...
(Not at all similar) 1. 2 3 4 5 6 7 (Very similar)
9 The act of moving from place to place in the computer generated world can seem to be
relatively natural or relatively unnatural. Please rate your experience of this.
The act of moving from place to place seemed to be...
(Very unnatural) 1. 2 3 4 5 6 7 (Very natural)
10 Please rate any sense of fear of falling you experienced when looking down over the virtual
precipice.
The sense of fear of falling I experienced was...
(Not at all) 1. 2 3 4 5 6 7 (Very much)
11 What is your University status?
My status is as follows: 1. Undergraduate student
2. Graduate student 3. Research Associate 4. Staff member - systems/technical staff
5. Faculty 6. Administrative staff 7. Other (please write in)...

1.1.1.2
108
12 When you think back to your experience, do you think of the virtual rooms more as imagesthat you saw, or more as somewhere that you visited?
The virtual rooms seem to me to be more like...
(Images that I saw) 1. 2 3 4 5 6 7 (Somewhere that I visited)
13 Have you experienced virtual reality before?
I have experienced virtual reality...
(Never before) 1. 2 3 4 5 6 7 (A great deal)
14 During the time of the experience, which was stronger on the whole, your sense of being inthe virtual rooms, or of being in the real world of the laboratory?
I had a stronger sense of being in...
(The real world of the laboratory) 1. 2 3 4 5 6 7 (The virtual world)
15 Consider your memory of being in the virtual rooms. How similar in terms of the structure ofthe memory is this to the structure of the memory of other places you have been today? By "structure of thememory" consider things like the extent to which you have a visual memory of the virtual rooms, whetherthat memory is in color, the extent to which the memory seems vivid or realistic, its size, location in yourimagination, the extent to which it is panoramic in your imagination, and other such structural elements.
I think of the virtual rooms as a place in a way similar to other places that I’ve been today...
(Not at all) 1. 2 3 4 5 6 7 (Very much)
16 To what extent do you use a computer in your daily activities?
I use a computer...
(Not at all) 1. 2 3 4 5 6 7 (Very much)
17 Please rate your sense of being in the room with the pit on the following scale from 1 to 7,
where 7 represents your normal experience of being in a place.
I had a sense of being in the room with the pit:
(Not at all) 1. 2 3 4 5 6 7 (Very much)

1.1.1.2
109
18 During the time of the experience, did you often think to yourself that you were actually juststanding in a laboratory wearing a helmet or really in the virtual rooms?
During the experience I often thought that I was really standing in the lab wearing a helmet...
(Most of the timeI realized Iwas in the lab) 1. 2 3 4 5 6 7 (Never because I believed I was
in the virtual environment)
20 To what extent do you play computer games?
I play computer games...(Not at all) 1. 2 3 4 5 6 7 (Very much)
21 How many hour per week do you exercise?
During an average week, I exercise...
Less than 0.5 hours0.5 hours1 hour1.5 hours2 hours2.5 hours3 or more hours
Further Comments
Please write down any further comments that you wish to make about your experience. In particular,what things helped to give you a sense of "really being" in the virtual rooms, and what things acted to "pull youout" and make you more aware of "reality"?
Reminder - all answers will be treated entirely confidentially.
Thank you once again for participating in this study and helping with our research. Please do not
discuss this with anyone for five days. This is because the study is continuing, and you may happen to speak to
someone who may be taking part.

1.1.1.2
110
B. 2 Simulator Sickness Questionnaire
Below is a reproduction of the Kennedy s Simulator Sickness Questionnaire [Kennedy, 1993]. We
administered this questionnaire via the Internet. A html link to a page with definitions of some of the terms was
also available for subjects. This is reproduced after the questionnaire. We added one question assessing hunger
since subjects reported hunger in our precursor work [Meehan, 2000c; Pugnetti, 2000] and we speculated this to
be a precursor to nausea. No such relationship was found. This questionnaire was completed once before and
once after each task. We did not add hunger into the equation for Simulator Sickness, but instead used
Kennedy s original formulation.
Kennedy et al. suggested using the total score, called Simulator Sickness below, from the post-
exposure test as the indicator of sickness. They also suggested looking at the difference between pre- and post-
exposure scores to help explain any sickness seen.
For each question, a score of none (0), slight (1), moderate (2), or severe (3) were assigned. The scores
were then combined as follows:
Nausea = Σ(Questions 1, 6, 7, 8, 9, 15, 16)
Column2 = Σ(Questions 1, 2, 3, 4, 5, 9, 11)
Column3 = Σ(Questions 5, 8, 10, 11, 12, 13, 14)
Nausea = 9.54 x Column1
Ocular Discomfort = 7.58 x Column2
Disorientation = 13.92 _ Column3
Simulator Sickness = 3.74 x (Column1 + Column2 + Column3) (Range: 0-235)

1.1.1.2
111
The questionnaire
For each of the following conditions, please indicate how you are feeling right now, on the scale of
none through severe. Circle your response.
1. General Discomfort None Slight Moderate Severe
2. Fatigue None Slight Moderate Severe
3. Headache None Slight Moderate Severe
4. Eye Strain None Slight Moderate Severe
5. Difficulty Focusing None Slight Moderate Severe
6. Increased Salivation None Slight Moderate Severe
7. Sweating None Slight Moderate Severe
8. Nausea None Slight Moderate Severe
9. Difficulty Concentrating None Slight Moderate Severe
10. Fullness of Head None Slight Moderate Severe
11. Blurred Vision None Slight Moderate Severe
12. Dizzy (with your eyes open) None Slight Moderate Severe
13. Dizzy (with your eyes closed) None Slight Moderate Severe
14. Vertigo None Slight Moderate Severe
15. Stomach Awareness None Slight Moderate Severe
16. Burping None Slight Moderate Severe
17. Hunger None Slight Moderate Severe
In the space below, please list any additional symptoms you are experiencing (continue on the back if
necessary).

1.1.1.2
112
Definitions for Simulator Sickness Questionnaire
The following information was available through a html link from the SSQ form.
Explanation of Conditions
General Discomfort
Fatigue Weariness or exhaustion of the body
Headache
Eye Strain Weariness or soreness of the eyes
Difficulty Focusing
Increased Salivation
Sweating
Nausea stomach distress
Difficulty Concentrating
Fullness of Head
Blurred Vision
Dizzy (with your eyes open)
Dizzy (with your eyes closed)
Vertigo Surroundings seem to swirl
Stomach Awareness A feeling just short of nausea
Burping

1.1.1.2
113
B. 3 Height Anxiety Questionnaire
This questionnaire was administered via the Internet before the first exposure to the VE. It was
developed by Cohen [Cohen, 1977]. Height Anxiety was scored as a simple sum of all of the responses.
Height QuestionnaireID:Below we have compiled a list of situations involving height. We are interested to know how anxious
(tense, uncomfortable) you would feel in each situation nowadays. Please indicate how you would feel bychoosing one of the following numbers (0, 1, 2, 3, 4, 5, 6) in the space to the left of each item:
0 Not at all anxious; calm and relaxed12 Slightly anxious34 Moderately anxious56 Extremely anxious
1. Diving off the low board at a swimming pool. (Not at all anxious) 0 1 2 3 4 5 6 (Extremely Anxious) 2. Stepping over rocks crossing a stream. (Not at all anxious) 0 1 2 3 4 5 6 (Extremely Anxious) 3. Looking down a circular stairway from several flights up. (Not at all anxious) 0 1 2 3 4 5 6 (Extremely Anxious) 4. Standing on a ladder leaning against a house, second story. (Not at all anxious) 0 1 2 3 4 5 6 (Extremely Anxious)
5. Sitting in the front of an upper balcony of a theater. (Not at all anxious) 0 1 2 3 4 5 6 (Extremely Anxious)
6. Riding a ferris wheel. (Not at all anxious) 0 1 2 3 4 5 6 (Extremely Anxious)
7. Walking up a steep incline in country hiking. (Not at all anxious) 0 1 2 3 4 5 6 (Extremely Anxious)
8. Airplane trip (to San Francisco). (Not at all anxious) 0 1 2 3 4 5 6 (Extremely Anxious)
9. Standing next to an open window on the third floor. (Not at all anxious) 0 1 2 3 4 5 6 (Extremely Anxious)
10. Walking on a footbridge over a highway. (Not at all anxious) 0 1 2 3 4 5 6 (Extremely Anxious)
11. Driving over a large bridge (Golden Gate, George Washington). (Not at all anxious) 0 1 2 3 4 5 6 (Extremely Anxious)

1.1.1.2
114
12. Being away from window in an office on the 15th floor of a building. (Not at all anxious) 0 1 2 3 4 5 6 (Extremely Anxious)
13. Seeing window washers 10 flights up on a scaffold. (Not at all anxious) 0 1 2 3 4 5 6 (Extremely Anxious)
14. Walking over a sidewalk grating. (Not at all anxious) 0 1 2 3 4 5 6 (Extremely Anxious)
15. Standing on the edge of a subway platform. (Not at all anxious) 0 1 2 3 4 5 6 (Extremely Anxious)
16. Climbing a fire escape to the 3rd floor landing. (Not at all anxious) 0 1 2 3 4 5 6 (Extremely Anxious)
17. On the roof of a 10 story apartment building. (Not at all anxious) 0 1 2 3 4 5 6 (Extremely Anxious)
18. Riding the elevator to the 50th floor. (Not at all anxious) 0 1 2 3 4 5 6 (Extremely Anxious)
19. Standing on a chair to get something off a shelf. (Not at all anxious) 0 1 2 3 4 5 6 (Extremely Anxious)
20. Walking up the gangplank of an ocean liner. (Not at all anxious) 0 1 2 3 4 5 6 (Extremely Anxious)

1.1.1.2
115
B. 4 Height Avoidance Questionnaire
This questionnaire was administered via the Internet before the first exposure to the VE. It was
developed by Cohen [Cohen, 1977]. Height Avoidance was scored as a simple sum of all of the responses.
Height QuestionnaireID: Now that you have rated each item according to anxiety, we would like you to rate them as to
avoidance. Indicate in the space to the left of the items below how much you now avoid the situation, if it arose.
0 Would not avoid doing it1 Would try to avoid doing it2 Would not do it under any circumstances
1. Diving off the low board at a swimming pool. (Would not avoid it) 0 1 2 (Would not do it under any circumstances)
2. Stepping over rocks crossing a stream. (Would not avoid it) 0 1 2 (Would not do it under any circumstances)
3. Looking down a circular stairway from several flights up. (Would not avoid it) 0 1 2 (Would not do it under any circumstances)
4. Standing on a ladder leaning against a house, second story. (Would not avoid it) 0 1 2 (Would not do it under any circumstances)
5. Sitting in the front of an upper balcony of a theater. (Would not avoid it) 0 1 2 (Would not do it under any circumstances)
6. Riding a ferris wheel. (Would not avoid it) 0 1 2 (Would not do it under any circumstances)
7. Walking up a steep incline in country hiking. (Would not avoid it) 0 1 2 (Would not do it under any circumstances)
8. Airplane trip (to San Francisco). (Would not avoid it) 0 1 2 (Would not do it under any circumstances)
9. Standing next to an open window on the third floor. (Would not avoid it) 0 1 2 (Would not do it under any circumstances)
10. Walking on a footbridge over a highway. (Would not avoid it) 0 1 2 (Would not do it under any circumstances)
11. Driving over a large bridge (Golden Gate, George Washington). (Would not avoid it) 0 1 2 (Would not do it under any circumstances)
12. Being away from window in an office on the 15th floor of a building. (Would not avoid it) 0 1 2 (Would not do it under any circumstances)

1.1.1.2
116
13. Seeing window washers 10 flights up on a scaffold. (Would not avoid it) 0 1 2 (Would not do it under any circumstances)
14. Walking over a sidewalk grating. (Would not avoid it) 0 1 2 (Would not do it under any circumstances)
15. Standing on the edge of a subway platform. (Would not avoid it) 0 1 2 (Would not do it under any circumstances)
16. Climbing a fire escape to the 3rd floor landing. (Would not avoid it) 0 1 2 (Would not do it under any circumstances)
17. On the roof of a 10 story apartment building. (Would not avoid it) 0 1 2 (Would not do it under any circumstances)
18. Riding the elevator to the 50th floor. (Would not avoid it) 0 1 2 (Would not do it under any circumstances)
19. Standing on a chair to get something off a shelf. (Would not avoid it) 0 1 2 (Would not do it under any circumstances)
20. Walking up the gangplank of an ocean liner. (Would not avoid it) 0 1 2 (Would not do it under any circumstances)

1.1.1.2
117
B. 5 Informed Consent
This is the informed consent form for the Frame Rate study. The informed consent forms for the
Passive Haptics and Multiple Exposures study are identical except for description of the extent of
participation and reimbursement. Details of the studies are given in Chapter 3.
Introduction and purpose of the study:
We are inviting you to participate in a study of effect in virtual environment (VE) systems.
The purpose of this research is to measure how presence in (or believability of) VEs changes with
differing display update rates and system lags. We hope to learn things that will help VE researchers
and practitioners using VEs to treat people.
The principal investigator is Michael Meehan (UNC Chapel Hill, Department of Computer
Science, 259 Sitterson Hall, 962-1979, email: [email protected]). The Faculty advisor is Dr.
Frederick Brooks, Jr. (UNC Chapel Hill, Department of Computer Science, 216 Sitterson Hall, 962-
1931, email: [email protected]).
What will happen during the study:
We will ask you to come to the laboratory for one sessions, which will last approximately 1
hour. During the sessions, you will perform a few simple tasks within the VE. You will also be given
questionnaires asking about your perceptions and feelings during and after the VE experience.
Approximately 30 people will take part in this study.
We will use computers to record your hand, head, and body motion during the VE experience.
We will use sensors on your fingers and chest to record heart rate and other physiological measures.
We will also make video and audio recordings of the sessions.
Protecting your privacy:
We will make every effort to protect your privacy. We will not use your name in any of the
data recording or in any research reports. We will use a code number rather than your name. No

1.1.1.2
118
images from the videotapes in which you are personally recognizable will be used in any presentation
of the results.
Risks and discomforts:
While using the virtual environment systems, some people experience slight symptoms of
disorientation, nausea, or dizziness. These can be similar to motion sickness or to feelings
experienced in wide-screen movies and theme park rides. We do not expect these effects to be strong
or to last after you leave the laboratory. If at any time during the study you feel uncomfortable and
wish to stop the experiment you are free to do so.
Your rights:
You have the right to decide whether or not to participate in this study, and to withdraw form
the study at any time without penalty. We will pay you $6 per hour you spend participating in the
study.
Institutional Review Board approval:
The Academic Affairs Institutional Review Board (AA-IRB) of the University of North
Carolina at Chapel Hill has approved this study. If you have any concerns about your rights in this
study you may contact the Chair of the AA-IRB, David A. Eckerman, at CB#4100, 201 Bynum Hall,
UNC-CH, Chapel Hill, NC 27599-4100, (919) 962-7761, or email: [email protected].
Summary:
I understand that this is a research study to measure the change in presence (or believability)
over subsequent exposures to a virtual environment.
I understand that if I agree to be in this study:
• I will visit the laboratory once for approximately 1 hour.
• I will wear a virtual environment headset to perform tasks, and my movements,
physiological signals (via sensors on my fingers and chest), and behavior will be recorded
1.1.1.2
119
by computer and on videotape, and I will respond to questionnaires between and after the
sessions.
• I may experience slight feelings of disorientation, nausea, or dizziness during or shortly
after the VE experiences.
I certify that I am at least 18 years of age.
I have had a chance to ask any questions I have about this study and those questions have
been answered for me.
I have read the information in this consent form, and I agree to be in the study. I understand
that I will get a copy of this consent form after I sign it.
___________________________________ _________________
Signature of Participant Date

1.1.1.2
120
B. 6 Participant Health Questionnaire
The questionnaire reproduced below was administered pre-session via the Internet.
Participant Health Questionnaire
This is filled out when the subject comes to the lab. Once for each day they are there.Please circle your answers to the following questions:
1. Are you in your usual state of good fitness (health)? Yes NoIf not, please explain: ____________________________________________________________________________________________________________
2. In the past 24 hours, which, if any, of the following substances (including alcohol) have you used?Please circle all that apply.
(a) Sedatives or tranquilizers(b) Decongestants(c) Anti-histamines(d) Other(e) None
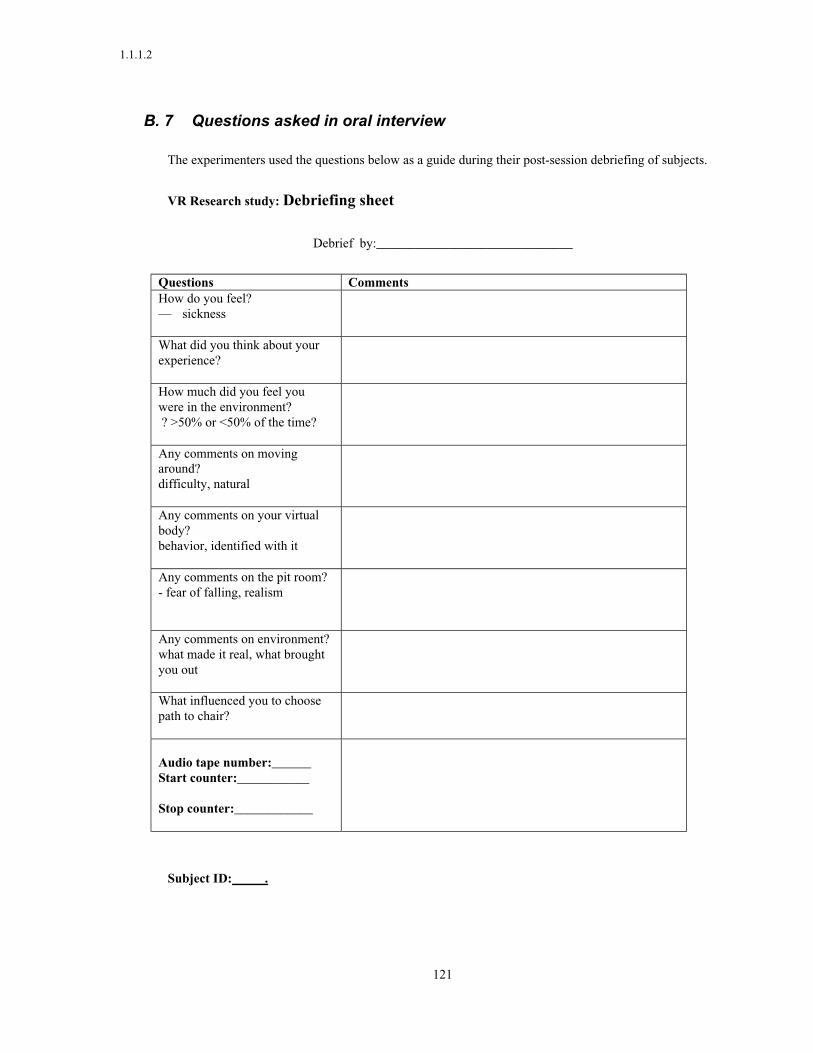
1.1.1.2
121
B. 7 Questions asked in oral interview
The experimenters used the questions below as a guide during their post-session debriefing of subjects.
VR Research study: Debriefing sheet
Debrief by:______________________________
Questions CommentsHow do you feel?— sickness
What did you think about yourexperience?
How much did you feel youwere in the environment? ? >50% or <50% of the time?
Any comments on movingaround?difficulty, natural
Any comments on your virtualbody?behavior, identified with it
Any comments on the pit room?- fear of falling, realism
Any comments on environment?what made it real, what broughtyou out
What influenced you to choosepath to chair?
Audio tape number:______Start counter:___________
Stop counter:____________
Subject ID: .

1.1.1.2
122
Appendix C Experiment data
Variable DescriptionSubject The ID given to the subjectSession The day number. E.g. session=2 is the second day that the subject participates.Task The number of the task, or exposure, for a given day.Condition The code for the condition. In the Passive Haptics study:
0. 1.5 inch wooden ledge was not included.1. 1.5 inch wooden ledge was included.
In the Frame Rate study:10. The content of the visual display was updated ten frames per second.15. The content of the visual display was updated fifteen frames per second.20. The content of the visual display was updated twenty frames per second.30. The content of the visual display was updated thirty frames per second.
Simulator Sickness Reported simulator sickness as reported on Kennedy s Simulator SicknessQuestionnaire [Kennedy, 1993]. See Appendix B.
Reported Presence[mmmm6]
Reported Presence as reported on the University College London PresenceQuestionnaire. A count of the questions on which the participant reported 6 or 7on a scale of 1 to 7. There are seven questions on Reported Presence.
Reported Presence[mmmm5]
Reported Presence as reported on the University College London PresenceQuestionnaire. A count of the questions on which the participant reported 5, 6, or7 on a scale of 1 to 7. There are seven questions on Reported Presence.
Reported BehavioralPresence [mmmm6]
Reported Behavioral Presence as reported on the University College LondonPresence Questionnaire. A count of the questions on which the participantreported 6 or 7 on a scale of 1 to 7. There are three questions on ReportedBehavioral Presence.
Reported BehavioralPresence [mmmm5]
Reported Behavioral Presence as reported on the University College LondonPresence Questionnaire. A count of the questions on which the participantreported 5, 6, or 7 on a scale of 1 to 7. There are three questions on ReportedBehavioral Presence.
Reported Ease ofLocomotion [mmmm6]
Reported Ease of Locomotion as reported on the University College LondonPresence Questionnaire. A count of the questions on which the participantreported 6 or 7 on a scale of 1 to 7. There are three questions on Reported Easeof Locomotion.
Reported Ease ofLocomotion [mmmm5]
Reported Ease of Locomotion as reported on the University College LondonPresence Questionnaire. A count of the questions on which the participantreported 5, 6, or 7 on a scale of 1 to 7. There are three questions on ReportedEase of Locomotion.
Association withVirtual Body
Association with Virtual Body as reported on the University College LondonPresence Questionnaire on a scale from 1=not at all 7=very much .
Gender Gender: 1=male; 2=femaleAge Age.University Status University Status:
1. Undergraduate student2. Graduate student3. Research Associate4. Staff member - systems/technical staff5. Faculty6. Administrative staff7. Other
Virtual EnvironmentExperience
The amount of experience that the subject has had with virtual environments:1=not at all 7=a great deal .
Computer Usage The amount that subjects use a computer: 1=not at all 7=very muchComputer Game The amount that subjects play computer games: 1=not at all 7=very much

1.1.1.2
123
UsageHeight Anxiety Height Anxiety as reported on Cohen s questionnaire [Cohen, 1977]. See
Appendix B.Height Avoidance Height Avoidance as reported on Cohen s questionnaire [Cohen, 1977]. See
Appendix B.∆∆∆∆Heart Rate Change in heart rate between the Pit Room and the Training Room.∆∆∆∆Skin Conductance Change in skin conductance between the Pit Room and the Training Room.∆∆∆∆Skin Temperature Change in skin temperature between the Pit Room and the Training Room.Observed BehavioralPresence
Observed Behavioral Presence scored from videotape.
Loss of Balance onLedge
Count of the number of times that a subject lost balance while on the 1.5 inchwooden ledge.
Table C.1. Table of variables with brief explanations.

1.1.1.2
124
C. 1 Effect of multiple exposures on presence in virtual environments
Data for the experiment Effect of Multiple Exposures on Presence in Virtual Environments (Multiple
Exposures).
Subj
ect
Sess
ion
Tas
k
Sim
ulat
or S
ickn
ess
Rep
orte
d P
rese
nce
[mmmm6]
Rep
orte
d P
rese
nce
[mmmm5]
Rep
orte
d B
ehav
iora
l Pre
senc
e
Rep
orte
d B
ehav
iora
l Pre
senc
e
Rep
orte
d E
ase
of L
ocom
otio
n [mmmm
6]
Rep
orte
d E
ase
of L
ocom
otio
n [mmmm
5]
Gen
der
(1=
mal
e, 2
=fe
mal
e)
Age
Uni
vers
ity
Stat
us
Vir
tual
Env
iron
men
t E
xper
ienc
e
Com
pute
r U
sage
Com
pute
r G
ame
Usa
ge
Hei
ght
Anx
iety
Hei
ght
Avo
idan
ce
∆∆∆∆ Ski
n C
ondu
ctan
ce L
evel
∆∆∆∆ Ski
n T
empe
ratu
re
Obs
erve
d B
ehav
iora
l Pre
senc
e
0 1 1 22.44 1 4 1 2 0 2 2 20 7 1 6 2 24 9 2.87 2.19 50 1 2 14.96 0 1 0 0 0 3 2 20 7 1 6 2 24 9 0.92 2.62 30 1 3 14.96 2 5 0 1 0 3 2 20 7 1 6 2 24 9 3.85 -0.12 20 2 1 18.7 0 4 0 2 0 0 2 20 7 1 6 2 24 9 2.00 70 2 2 18.7 0 4 0 1 0 2 2 20 7 1 6 2 24 9 2.74 -0.23 30 2 3 26.18 0 2 0 1 0 1 2 20 7 1 6 2 24 9 1.08 -0.22 30 3 1 37.4 0 3 0 0 0 0 2 20 7 1 6 2 24 9 0.76 1.78 40 3 2 33.66 0 3 1 1 0 3 2 20 7 1 6 2 24 9 0.83 -1.39 40 3 3 33.66 2 4 1 2 0 3 2 20 7 1 6 2 24 9 1.98 0.09 40 4 1 29.92 0 4 2 2 1 3 2 20 7 1 6 2 24 9 1.51 -1.37 -10 4 2 29.92 2 6 1 1 0 3 2 20 7 1 6 2 24 9 0.91 -0.58 -10 4 3 22.44 2 6 1 2 3 3 2 20 7 1 6 2 24 9 2.23 0.55 01 1 1 11.22 4 5 1 2 2 2 2 27 7 2 7 1 33 8 11 1 2 37.4 4 6 2 2 1 3 2 27 7 2 7 1 33 8 2.67 -0.35 31 1 3 86.02 3 5 1 2 2 3 2 27 7 2 7 1 33 8 51 2 1 44.88 5 7 3 3 1 1 2 27 7 2 7 1 33 8 5.00 0.55 71 2 2 67.32 3 4 3 3 1 2 2 27 7 2 7 1 33 8 2.67 0.34 51 2 3 86.02 4 5 2 3 3 3 2 27 7 2 7 1 33 8 2.21 1.77 51 3 1 26.18 5 6 3 3 3 3 2 27 7 2 7 1 33 8 4.75 31 3 2 41.14 4 5 3 3 3 3 2 27 7 2 7 1 33 8 4.50 1.15 41 3 3 48.62 3 6 3 3 2 3 2 27 7 2 7 1 33 8 6.16 1.271 4 1 3.74 2 3 1 1 3 3 2 27 7 2 7 1 33 8 5.26 1.24 21 4 2 11.22 3 3 0 1 3 3 2 27 7 2 7 1 33 8 1.79 2.98 01 4 3 26.18 0 3 1 1 3 3 2 27 7 2 7 1 33 8 -12 1 1 63.58 5 7 3 3 1 3 1 21 7 1 7 5 26 5 5.84 2.92 32 1 2 26.18 6 6 1 1 3 3 1 21 7 1 7 5 26 5 3.97 22 1 3 11.22 5 5 1 1 3 3 1 21 7 1 7 5 26 5 2.95 -0.15 -22 2 1 26.18 5 6 1 2 3 3 1 21 7 1 7 5 26 5 6.25 -0.42 62 2 2 14.96 5 6 1 1 3 3 1 21 7 1 7 5 26 5 3.89 -0.36 52 2 3 26.18 6 7 0 0 3 3 1 21 7 1 7 5 26 5 -0.51 32 3 1 26.18 4 5 1 1 2 3 1 21 7 1 7 5 26 5 1.79 3

1.1.1.2
125
2 3 2 22.44 5 6 1 1 3 3 1 21 7 1 7 5 26 5 2.22 0.22 12 3 3 29.92 6 7 1 1 3 3 1 21 7 1 7 5 26 5 02 4 1 11.22 4 6 1 1 3 3 1 21 7 1 7 5 26 5 2.83 -0.77 -12 4 2 18.7 6 6 1 1 3 3 1 21 7 1 7 5 26 5 2.37 0.61 -12 4 3 11.22 6 6 1 1 3 3 1 21 7 1 7 5 26 5 13 1 1 11.22 5 7 3 3 3 3 2 47 1 1 6 3 37 7 2.41 0.833 1 2 14.96 5 6 3 3 3 3 2 47 1 1 6 3 37 7 3.253 1 3 22.44 6 7 2 3 3 3 2 47 1 1 6 3 37 7 2.303 2 1 22.44 4 6 3 3 3 3 2 47 1 1 6 3 37 7 2.10 0.49 03 2 2 22.44 2 4 2 3 3 3 2 47 1 1 6 3 37 7 33 2 3 22.44 4 7 1 2 3 3 2 47 1 1 6 3 37 7 1.73 0.78 33 3 1 86.02 7 7 3 3 3 3 2 47 1 1 6 3 37 7 2.02 0.03 43 3 2 82.28 6 6 3 3 3 3 2 47 1 1 6 3 37 7 2.81 1.05 33 3 3 86.02 7 7 3 3 3 3 2 47 1 1 6 3 37 7 2.32 0.8 23 4 1 59.84 3 6 1 2 3 3 2 47 1 1 6 3 37 7 1.69 -0.47 03 4 2 48.62 5 6 3 3 3 3 2 47 1 1 6 3 37 7 3.47 1.37 03 4 3 52.36 6 7 1 2 3 3 2 47 1 1 6 3 37 7 1.80 0.93 14 1 1 11.22 3 7 1 2 0 2 1 21 1 1 5 5 10 1 0.764 1 2 0 5 7 1 2 0 3 1 21 1 1 5 5 10 1 1.57 0.624 1 3 0 7 7 2 3 3 3 1 21 1 1 5 5 10 1 3.25 0.754 2 1 7.48 7 7 2 3 3 3 1 21 1 1 5 5 10 1 3.22 -24 2 2 3.74 7 7 3 3 3 3 1 21 1 1 5 5 10 1 4.25 1.4 -14 2 3 11.22 7 7 3 3 3 3 1 21 1 1 5 5 10 1 2.45 0.87 -24 3 1 14.96 7 7 2 3 3 3 1 21 1 1 5 5 10 1 2.91 -24 3 2 14.96 7 7 2 3 3 3 1 21 1 1 5 5 10 1 3.35 0.13 -24 3 3 14.96 6 6 2 2 3 3 1 21 1 1 5 5 10 1 2.84 1.11 -24 4 1 18.7 7 7 2 2 3 3 1 21 1 1 5 5 10 1 3.08 0.24 -24 4 2 14.96 7 7 2 2 2 3 1 21 1 1 5 5 10 1 2.02 0.44 -24 4 3 26.18 7 7 2 2 3 3 1 21 1 1 5 5 10 1 2.32 0.56 -25 1 1 22.44 4 4 3 3 0 1 2 23 2 1 7 4 22 5 2.37 0.125 1 2 29.92 2 3 0 2 0 1 2 23 2 1 7 4 22 5 1.18 0.695 1 3 33.66 5 7 2 2 0 3 2 23 2 1 7 4 22 5 1.27 0.32 75 2 1 3.74 4 7 2 2 1 3 2 23 2 1 7 4 22 5 1.56 0.265 2 2 22.44 5 6 2 3 3 3 2 23 2 1 7 4 22 5 2.31 -2.3 75 2 3 18.7 6 7 2 3 3 3 2 23 2 1 7 4 22 5 3.04 0.79 75 3 1 18.7 6 7 2 3 3 3 2 23 2 1 7 4 22 5 1.29 75 3 2 7.48 6 7 2 3 3 3 2 23 2 1 7 4 22 5 1.70 -0.97 65 3 3 14.96 6 7 3 3 3 3 2 23 2 1 7 4 22 5 1.28 55 4 1 0 6 7 2 3 3 3 2 23 2 1 7 4 22 5 1.89 -0.985 4 2 0 7 7 3 3 3 3 2 23 2 1 7 4 22 5 1.89 -1.71 55 4 3 29.92 7 7 3 3 3 3 2 23 2 1 7 4 22 5 2.21 0.17 66 1 1 37.4 3 4 3 3 0 0 2 23 2 1 7 5 26 4 2.28 0.62 56 1 2 37.4 2 5 2 2 0 0 2 23 2 1 7 5 26 4 0.67 2.47 36 1 3 37.4 0 5 0 1 0 0 2 23 2 1 7 5 26 4 1.71 0.91 06 2 1 29.92 2 3 0 0 0 0 2 23 2 1 7 5 26 4 1.45 0.68 16 2 2 37.4 2 4 0 0 0 0 2 23 2 1 7 5 26 4 2.41 1.65 16 2 3 37.4 4 4 0 0 0 1 2 23 2 1 7 5 26 4 0.77 1.74 16 3 1 33.66 0 3 0 0 1 2 2 23 2 1 7 5 26 4 0.91 -16 3 2 41.14 3 6 0 0 0 2 2 23 2 1 7 5 26 4 0.91 0.98 -1

1.1.1.2
126
6 3 3 37.4 2 4 0 0 0 3 2 23 2 1 7 5 26 4 0.68 0.57 -16 4 1 33.66 3 4 0 1 0 3 2 23 2 1 7 5 26 4 0.72 -0.79 -26 4 2 33.66 4 4 0 0 0 3 2 23 2 1 7 5 26 4 1.05 1.15 -16 4 3 41.14 3 4 0 0 0 1 2 23 2 1 7 5 26 4 1.63 -27 1 1 48.62 6 7 3 3 1 3 2 20 1 1 5 2 56 11 1.12 0.96 77 1 2 59.84 6 7 2 3 0 1 2 20 1 1 5 2 56 11 1.42 1.12 57 1 3 71.06 2 6 2 2 0 2 2 20 1 1 5 2 56 11 0.98 1.25 57 2 1 29.92 0 6 0 2 0 3 2 20 1 1 5 2 56 11 0.39 0.81 17 2 2 41.14 1 6 2 2 0 0 2 20 1 1 5 2 56 11 0.91 47 2 3 48.62 0 4 0 3 0 1 2 20 1 1 5 2 56 11 0.71 27 3 1 7.48 0 0 0 0 0 0 2 20 1 1 5 2 56 11 1.02 -0.01 27 3 2 11.22 0 0 0 2 0 2 2 20 1 1 5 2 56 11 1.33 0.85 27 3 3 22.44 0 0 0 1 0 2 2 20 1 1 5 2 56 11 1.07 0.52 57 4 1 0 0 1 0 2 0 3 2 20 1 1 5 2 56 11 2.30 27 4 2 14.96 0 1 0 2 0 3 2 20 1 1 5 2 56 11 1.67 -0.23 07 4 3 0 0 0 0 0 1 3 2 20 1 1 5 2 56 11 1.33 -0.02 08 1 1 0 3 6 1 1 0 2 2 22 1 2 6 2 12 2 6.42 38 1 2 0 4 7 1 1 1 2 2 22 1 2 6 2 12 2 2.91 1.16 38 1 3 0 7 7 2 2 3 3 2 22 1 2 6 2 12 2 1.78 0.61 28 2 1 41.14 1 5 1 1 0 0 2 22 1 2 6 2 12 2 -0.75 0.56 28 2 2 33.66 1 3 2 2 0 0 2 22 1 2 6 2 12 2 4.45 2.07 28 2 3 33.66 5 6 2 2 1 3 2 22 1 2 6 2 12 2 5.40 0.65 48 3 1 3.74 4 5 2 2 0 1 2 22 1 2 6 2 12 2 3.96 0.88 3 2 3.74 2 5 2 2 1 2 2 22 1 2 6 2 12 2 3.80 0.948 3 3 3.74 3 5 2 2 2 3 2 22 1 2 6 2 12 2 3.83 1.63 08 4 1 0 5 7 2 2 3 3 2 22 1 2 6 2 12 2 3.01 38 4 2 0 6 7 2 3 3 3 2 22 1 2 6 2 12 2 2.78 -0.48 38 4 3 0 6 7 2 2 3 3 2 22 1 2 6 2 12 2 3.19 1.54 19 1 1 14.96 4 5 0 3 2 3 1 20 1 3 7 5 21 8 1.66 0.999 1 2 18.7 3 5 3 3 3 3 1 20 1 3 7 5 21 8 1.66 1.229 1 3 7.48 5 5 1 1 3 3 1 20 1 3 7 5 21 8 1.96 0.619 2 1 3.74 3 6 2 3 2 3 1 20 1 3 7 5 21 8 2.58 0.96 -19 2 2 3.74 5 6 1 1 3 3 1 20 1 3 7 5 21 8 2.76 -29 2 3 3.74 4 6 1 1 3 3 1 20 1 3 7 5 21 8 3.07 0.54 -29 3 1 11.22 3 5 1 2 3 3 1 20 1 3 7 5 21 8 2.03 0.97 -19 3 2 11.22 4 6 1 1 3 3 1 20 1 3 7 5 21 8 1.91 0.63 -19 3 3 14.96 5 6 1 1 3 3 1 20 1 3 7 5 21 8 0.70 0.71 -19 4 1 0 5 7 1 2 3 3 1 20 1 3 7 5 21 8 1.77 0.57 -29 4 2 3.74 6 7 1 1 3 3 1 20 1 3 7 5 21 8 1.36 0.52 -29 4 3 0 6 7 1 1 3 3 1 20 1 3 7 5 21 8 -2Table C.2. Table of data for Multiple Exposures.Blank cells indicate unavailable data.
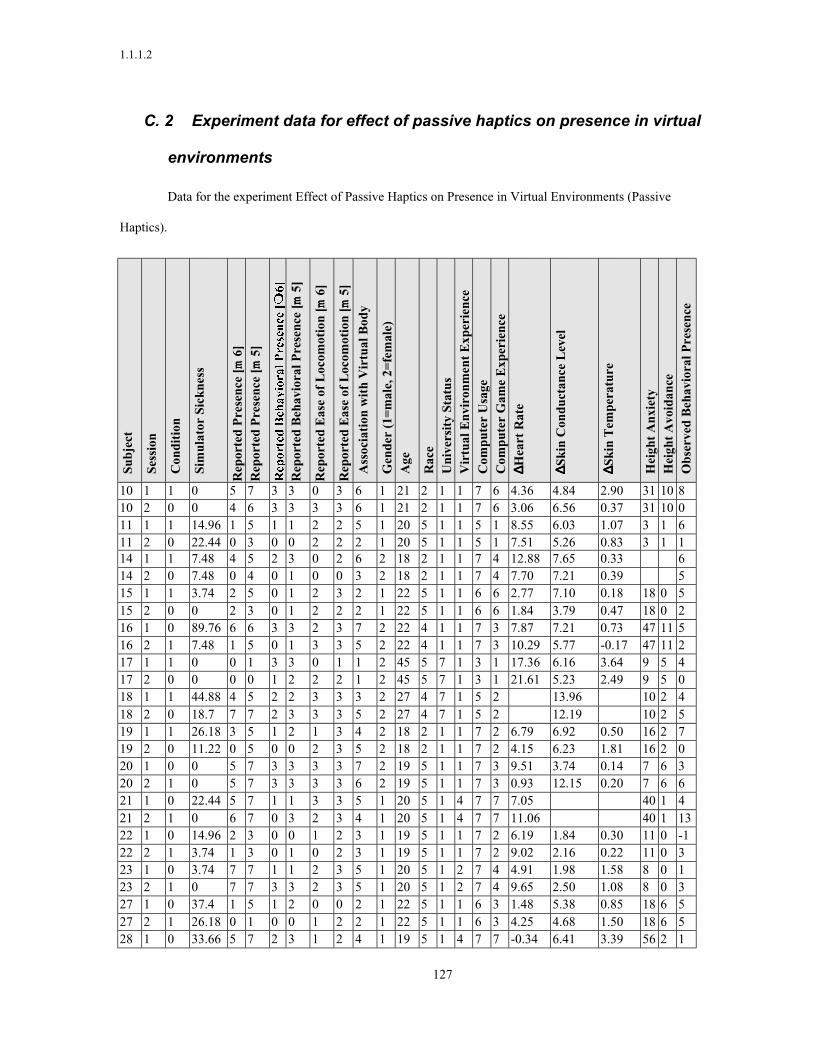
1.1.1.2
127
C. 2 Experiment data for effect of passive haptics on presence in virtual
environments
Data for the experiment Effect of Passive Haptics on Presence in Virtual Environments (Passive
Haptics).
Subj
ect
Sess
ion
Con
diti
on
Sim
ulat
or S
ickn
ess
Rep
orte
d P
rese
nce
[mmmm6]
Rep
orte
d P
rese
nce
[mmmm5]
Rep
orte
d B
ehav
iora
l Pre
senc
e [mmmm
5]
Rep
orte
d E
ase
of L
ocom
otio
n [mmmm
6]
Rep
orte
d E
ase
of L
ocom
otio
n [mmmm
5]
Ass
ocia
tion
wit
h V
irtu
al B
ody
Gen
der
(1=
mal
e, 2
=fe
mal
e)A
ge
Rac
eU
nive
rsit
y St
atus
Vir
tual
Env
iron
men
t E
xper
ienc
eC
ompu
ter
Usa
geC
ompu
ter
Gam
e E
xper
ienc
e∆∆∆∆ H
eart
Rat
e
∆∆∆∆ Ski
n C
ondu
ctan
ce L
evel
∆∆∆∆ Ski
n T
empe
ratu
re
Hei
ght
Anx
iety
Hei
ght
Avo
idan
ceO
bser
ved
Beh
avio
ral P
rese
nce
10 1 1 0 5 7 3 3 0 3 6 1 21 2 1 1 7 6 4.36 4.84 2.90 31 10 810 2 0 0 4 6 3 3 3 3 6 1 21 2 1 1 7 6 3.06 6.56 0.37 31 10 011 1 1 14.96 1 5 1 1 2 2 5 1 20 5 1 1 5 1 8.55 6.03 1.07 3 1 611 2 0 22.44 0 3 0 0 2 2 2 1 20 5 1 1 5 1 7.51 5.26 0.83 3 1 114 1 1 7.48 4 5 2 3 0 2 6 2 18 2 1 1 7 4 12.88 7.65 0.33 614 2 0 7.48 0 4 0 1 0 0 3 2 18 2 1 1 7 4 7.70 7.21 0.39 515 1 1 3.74 2 5 0 1 2 3 2 1 22 5 1 1 6 6 2.77 7.10 0.18 18 0 515 2 0 0 2 3 0 1 2 2 2 1 22 5 1 1 6 6 1.84 3.79 0.47 18 0 216 1 0 89.76 6 6 3 3 2 3 7 2 22 4 1 1 7 3 7.87 7.21 0.73 47 11 516 2 1 7.48 1 5 0 1 3 3 5 2 22 4 1 1 7 3 10.29 5.77 -0.17 47 11 217 1 1 0 0 1 3 3 0 1 1 2 45 5 7 1 3 1 17.36 6.16 3.64 9 5 417 2 0 0 0 0 1 2 2 2 1 2 45 5 7 1 3 1 21.61 5.23 2.49 9 5 018 1 1 44.88 4 5 2 2 3 3 3 2 27 4 7 1 5 2 13.96 10 2 418 2 0 18.7 7 7 2 3 3 3 5 2 27 4 7 1 5 2 12.19 10 2 519 1 1 26.18 3 5 1 2 1 3 4 2 18 2 1 1 7 2 6.79 6.92 0.50 16 2 719 2 0 11.22 0 5 0 0 2 3 5 2 18 2 1 1 7 2 4.15 6.23 1.81 16 2 020 1 0 0 5 7 3 3 3 3 7 2 19 5 1 1 7 3 9.51 3.74 0.14 7 6 320 2 1 0 5 7 3 3 3 3 6 2 19 5 1 1 7 3 0.93 12.15 0.20 7 6 621 1 0 22.44 5 7 1 1 3 3 5 1 20 5 1 4 7 7 7.05 40 1 421 2 1 0 6 7 0 3 2 3 4 1 20 5 1 4 7 7 11.06 40 1 1322 1 0 14.96 2 3 0 0 1 2 3 1 19 5 1 1 7 2 6.19 1.84 0.30 11 0 -122 2 1 3.74 1 3 0 1 0 2 3 1 19 5 1 1 7 2 9.02 2.16 0.22 11 0 323 1 0 3.74 7 7 1 1 2 3 5 1 20 5 1 2 7 4 4.91 1.98 1.58 8 0 123 2 1 0 7 7 3 3 2 3 5 1 20 5 1 2 7 4 9.65 2.50 1.08 8 0 327 1 0 37.4 1 5 1 2 0 0 2 1 22 5 1 1 6 3 1.48 5.38 0.85 18 6 527 2 1 26.18 0 1 0 0 1 2 2 1 22 5 1 1 6 3 4.25 4.68 1.50 18 6 528 1 0 33.66 5 7 2 3 1 2 4 1 19 5 1 4 7 7 -0.34 6.41 3.39 56 2 1

1.1.1.2
128
28 2 1 44.88 5 5 1 1 1 1 5 1 19 5 1 4 7 7 5.11 5.30 0.77 56 2 -129 1 0 3.74 5 7 1 2 1 3 3 1 19 5 1 1 6 1 0.51 4.03 3.31 10 0 029 2 1 7.48 5 7 2 3 1 3 4 1 19 5 1 1 6 1 0.78 6.00 3.33 10 0 130 1 0 3.74 5 7 1 3 3 3 4 1 22 5 1 2 5 5 2.92 4.21 1.14 18 2 330 2 1 3.74 3 6 2 2 2 3 4 1 22 5 1 2 5 5 7.96 4.77 1.87 18 2 431 1 1 11.22 0 2 0 1 3 3 3 1 19 5 1 1 6 3 16.70 9.14 0.82 11 231 2 0 18.7 0 0 0 1 2 2 1 1 19 5 1 1 6 3 7.51 7.30 0.41 11 233 1 0 0 5 7 2 3 3 3 5 1 20 5 1 1 7 6 -2.45 5.16 0.58 0 1 133 2 1 7.48 4 7 2 3 3 3 5 1 20 5 1 1 7 6 20.56 7.84 -0.17 0 1 234 1 1 0 6 7 3 3 0 1 3 1 21 5 1 1 6 1 1.10 5.63 0.97 8 234 2 0 11.22 4 5 0 0 2 3 4 1 21 5 1 1 6 1 -1.50 6.14 5.08 8 235 1 1 7.48 0 5 2 2 0 2 5 2 20 2 1 1 6 5 7.56 4.14 1.47 50 13 535 2 0 7.48 1 3 1 2 2 2 4 2 20 2 1 1 6 5 9.17 3.16 1.78 50 13 236 1 0 22.44 1 6 1 1 2 3 6 1 19 5 1 2 7 2 10.80 4.11 0.65 4 0 236 2 1 26.18 0 4 0 1 1 2 2 1 19 5 1 2 7 2 7.74 5.06 0.29 4 0 237 1 1 0 2 6 1 1 3 3 6 1 20 5 1 1 5 6 6.60 7.47 1.33 18 1 437 2 0 3.74 0 2 0 0 1 3 5 1 20 5 1 1 5 6 7.27 4.32 2.42 18 1 -238 1 1 0 0 4 2 2 2 2 4 1 19 6 1 1 7 5 10.50 1.06 2.64 23 11 138 2 0 0 2 4 1 2 2 2 6 1 19 6 1 1 7 5 6.04 2.18 0.50 23 11 239 1 1 3.74 1 5 0 1 2 3 3 2 19 5 1 1 7 1 27.70 2.46 0.97 17 339 2 0 18.7 2 4 1 2 1 2 2 2 19 5 1 1 7 1 2.14 2.57 0.62 17 340 1 0 0 1 3 1 1 2 3 3 1 21 5 1 1 7 5 -3.07 5.60 1.32 5 0 240 2 1 0 2 4 1 1 2 2 2 1 21 5 1 1 7 5 -0.40 2.49 -0.01 5 0 1141 1 1 18.7 1 5 2 2 1 1 2 2 19 3 1 1 7 6 -5.41 4.72 0.45 38 7 041 2 0 7.48 0 1 0 2 0 0 2 2 19 3 1 1 7 6 -10.46 11.84 0.15 38 7 -242 1 0 0 4 5 0 1 3 3 5 1 18 5 1 1 7 2 2.71 0.91 0 0 142 2 1 0 2 4 1 2 3 3 5 1 18 5 1 1 7 2 8.85 1.67 0 0 243 1 1 11.22 3 5 3 3 3 3 4 1 21 5 1 1 7 1 9.66 2.93 -3.57 49 1543 2 0 22.44 4 7 3 3 1 3 4 1 21 5 1 1 7 1 0.39 1.22 0.29 49 1544 1 1 7.48 4 6 2 3 0 3 6 1 19 5 1 1 3 6 -12.37 2.95 1.08 33 744 2 0 3.74 4 6 2 2 1 3 5 1 19 5 1 1 3 6 1.03 2.72 2.20 33 345 1 1 3.74 2 5 3 3 0 1 3 1 20 5 1 1 6 3 6.40 6.88 2.28 10 145 2 0 0 0 0 0 0 0 0 3 1 20 5 1 1 6 3 2.78 3.61 3.07 10 146 1 1 0 5 6 3 3 3 3 6 1 18 3 1 1 7 4 9.71 2.92 0.68 17 546 2 0 0 6 6 1 2 3 3 5 1 18 3 1 1 7 4 4.77 2.73 1.33 17 548 1 0 26.18 6 6 2 3 3 3 5 1 22 2 1 1 7 4 9.73 7.27 1.39 22 448 2 1 0 7 7 3 3 3 3 6 1 22 2 1 1 7 4 10.83 7.76 -1.07 22 449 1 1 3.74 0 2 1 1 2 2 3 2 21 5 1 2 7 1 9.38 1.72 2.66 37 6 249 2 0 11.22 0 0 0 0 0 0 1 2 21 5 1 2 7 1 3.86 6.17 0.98 37 6 -150 1 0 7.48 1 4 2 3 0 2 6 1 28 5 7 2 6 4 8.17 2.35 0.82 17 6 450 2 1 0 4 7 2 3 2 3 6 1 28 5 7 2 6 4 12.03 4.25 0.31 17 6 051 1 1 3.74 6 6 1 3 3 3 2 2 22 5 1 2 6 2 13.09 2.09 2.79 47 651 2 0 0 2 4 1 1 1 3 2 2 22 5 1 2 6 2 5.91 3.22 2.16 47 652 1 0 11.22 2 6 0 0 2 3 2 2 29 5 2 2 6 1 7.66 12 352 2 1 7.48 1 4 0 0 2 2 3 2 29 5 2 2 6 1 0.51 12 353 1 0 22.44 2 6 1 2 0 2 4 2 21 5 1 4 6 1 4.97 1.39 0.29 73 1653 2 1 26.18 3 6 2 2 0 3 4 2 21 5 1 4 6 1 12.43 2.41 0.28 73 1654 1 1 3.74 5 6 1 2 2 3 3 1 22 5 1 1 7 6 5.25 1.11 11 154 2 0 0 0 4 1 1 2 2 3 1 22 5 1 1 7 6 3.02 2.11 11 1

1.1.1.2
129
55 1 1 59.84 5 6 0 2 1 2 4 1 21 5 1 1 4 2 12.46 6.53 3.07 35 055 2 0 41.14 3 4 0 0 1 1 2 1 21 5 1 1 4 2 9.00 2.26 2.16 35 056 1 0 11.22 1 3 1 1 0 0 3 1 21 5 1 1 5 2 5.66 0.54 5 056 2 1 3.74 0 4 2 2 0 0 2 1 21 5 1 1 5 2 5.04 0.63 5 057 1 0 0 4 7 1 1 3 3 5 1 27 5 2 1 5 5 4.59 1.63 1.24 12 4 157 2 1 0 7 7 2 3 3 3 3 1 27 5 2 1 5 5 3.17 3.92 1.82 12 4 758 1 0 0 4 6 2 2 3 3 5 1 19 5 1 6 7 7 4.72 1.02 4 2 058 2 1 0 7 7 2 2 3 3 6 1 19 5 1 6 7 7 3.53 -0.75 4 2 361 1 0 7.48 4 7 0 1 3 3 2 2 20 5 1 1 4 3 13.27 2.72 -0.30 10 161 2 1 7.48 0 2 0 0 2 3 2 2 20 5 1 1 4 3 9.35 2.71 -1.75 10 162 1 0 11.22 3 4 1 1 1 2 3 2 20 5 1 1 7 1 2.42 9.11 -0.80 18 262 2 1 18.7 3 5 0 2 0 1 3 2 20 5 1 1 7 1 5.71 6.11 0.69 18 263 1 0 0 5 6 1 2 0 3 5 1 23 5 1 1 3 3 -5.43 4.14 0.95 2 0 263 2 1 0 5 7 1 1 0 3 5 1 23 5 1 1 3 3 3.24 9.36 0.75 2 0 364 1 0 0 0 1 0 1 2 3 4 1 21 5 1 2 6 4 1.84 2.69 1.20 0 1 064 2 1 7.48 0 0 1 1 2 2 5 1 21 5 1 2 6 4 3.30 3.63 0.46 0 1 165 1 1 7.48 5 7 1 1 1 2 4 1 19 5 1 2 6 2 9.58 4.22 1.54 11 365 2 0 3.74 5 7 1 1 0 3 3 1 19 5 1 2 6 2 7.47 3.75 1.50 11 366 1 1 11.22 2 3 3 3 0 1 4 1 19 2 1 1 7 6 3.83 5.17 0.44 21 566 2 0 3.74 0 3 2 3 0 0 4 1 19 2 1 1 7 6 2.33 3.35 0.40 21 567 1 1 3.74 6 7 1 2 2 3 6 1 18 2 1 5 5 4 4.01 1.38 0 067 2 0 0 6 7 2 2 3 3 6 1 18 2 1 5 5 4 3.20 0.43 0 068 1 0 11.22 1 4 1 2 3 3 6 2 22 2 1 1 6 2 7.18 2.04 0.73 20 068 2 1 3.74 5 6 2 2 3 3 7 2 22 2 1 1 6 2 13.29 1.20 -2.00 20 069 1 1 0 7 7 2 3 3 3 7 1 20 5 1 1 7 3 -2.85 3.75 1.22 0 169 2 0 3.74 7 7 1 1 3 3 7 1 20 5 1 1 7 3 18.14 1.84 1.53 0 170 1 1 14.96 1 3 2 3 1 2 2 1 21 6 1 1 6 2 12.89 5.03 0.49 11 270 2 0 11.22 1 1 1 1 1 2 2 1 21 6 1 1 6 2 3.61 3.60 3.11 11 2Table C.3. Table of data for Passive Haptics.Blank cells indicate unavailable data.

1.1.1.2
130
C. 3 Experiment data for effect of frame rate on presence in virtual
environments
Data for the experiment Effect of Frame Rate on Presence in Virtual Environments (Frame Rate).
Subj
ect
Tas
k
Con
diti
on
Sim
ulat
or S
ickn
ess
Rep
orte
d P
rese
nce
[mmmm6]
Rep
orte
d P
rese
nce
[mmmm5]
Rep
orte
d B
ehav
iora
l Pre
senc
e [mmmm
6]R
epor
ted
Beh
avio
ral P
rese
nce
[mmmm5]
Rep
orte
d E
ase
of L
ocom
otio
n [mmmm
6]
Ass
ocia
tion
wit
h V
irtu
al B
ody
Gen
der
(1=
mal
e, 2
=fe
mal
e)
Age
Rac
eU
nive
rsit
y St
atus
Vir
tual
Env
iron
men
t E
xper
ienc
eC
ompu
ter
Usa
geC
ompu
ter
Gam
e E
xper
ienc
e∆∆∆∆ H
eart
Rat
e
∆∆∆∆ Ski
n C
ondu
ctan
ce L
evel
∆∆∆∆ Ski
n T
empe
ratu
re
Hei
ght
Anx
iety
Hei
ght
Avo
idan
ce
Los
of
Bal
ance
on
Led
ge
Obs
erve
d B
ehav
iora
l Pre
senc
e
10 1 30 29.92 7 7 2 3 3 3 7 1 22 5 1 1 7 2 10.56 2.63 2.88 13 1 0 210 2 10 33.66 7 7 2 2 3 3 7 1 22 5 1 1 7 2 5.98 3.80 1.98 13 1 0 110 3 20 33.66 7 7 2 2 3 3 7 1 22 5 1 1 7 2 3.22 2.40 0.99 13 1 0 110 4 15 37.4 7 7 2 2 3 3 7 1 22 5 1 1 7 2 7.22 1.94 1.18 13 1 1 111 1 30 0 1 6 2 2 0 3 5 1 34 5 2 1 6 2 6.43 0.07 0.51 14 3 0 211 2 10 0 0 5 2 3 1 3 5 1 34 5 2 1 6 2 8.83 0.03 0.55 14 3 1 511 3 20 0 0 0 0 1 0 1 3 1 34 5 2 1 6 2 0.31 -0.09 0.85 14 3 0 211 4 15 0 0 0 0 0 0 3 2 1 34 5 2 1 6 2 6.86 -0.08 0.40 14 3 0 312 1 30 11.22 1 4 1 3 1 3 3 1 24 5 2 3 5 2 9.16 0.41 1.58 14 1 012 2 10 18.7 0 5 3 3 0 2 5 1 24 5 2 3 5 2 13.47 -0.08 0.47 14 1 012 3 20 14.96 4 7 1 2 0 1 6 1 24 5 2 3 5 2 12.18 -0.12 0.34 14 1 012 4 15 18.7 2 5 0 2 2 3 6 1 24 5 2 3 5 2 8.61 -0.14 0.80 14 1 013 1 30 18.7 7 7 2 2 1 2 6 1 23 3 2 1 6 6 34.12 0.90 1.13 63 12 0 413 2 10 26.18 7 7 2 2 1 2 7 1 23 3 2 1 6 6 9.82 0.94 0.84 63 12 0 213 3 20 22.44 7 7 2 2 3 3 7 1 23 3 2 1 6 6 8.67 1.12 0.93 63 12 0 213 4 15 18.7 7 7 2 2 2 3 7 1 23 3 2 1 6 6 -0.09 1.41 0.56 63 12 0 219 1 30 48.62 6 7 2 3 3 3 3 1 20 2 1 4 7 6 10.59 2.46 1.09 57 9 0 619 2 10 93.5 0 0 0 2 2 3 2 1 20 2 1 4 7 6 6.51 -0.13 0.85 57 9 0 419 3 20 71.06 1 5 3 3 2 3 2 1 20 2 1 4 7 6 3.57 -0.27 1.47 57 9 0 419 4 15 71.06 2 4 2 3 2 3 2 1 20 2 1 4 7 6 3.63 0.24 0.58 57 9 0 320 1 30 3.74 3 7 2 3 2 3 6 1 20 3 1 2 6 7 7.50 1.39 1.68 38 7 0 420 2 15 3.74 5 7 0 3 3 3 6 1 20 3 1 2 6 7 2.99 1.06 1.32 38 7 0 320 3 10 14.96 4 7 2 2 2 3 5 1 20 3 1 2 6 7 2.08 1.46 1.39 38 7 0 420 4 20 3.74 3 7 3 3 3 3 6 1 20 3 1 2 6 7 4.53 1.87 0.83 38 7 0 621 1 30 7.48 2 5 1 2 1 1 4 1 21 5 1 1 7 2 7.92 1.96 1.62 4 0 0 221 2 15 3.74 4 7 2 2 1 2 5 1 21 5 1 1 7 2 7.46 1.80 0.58 4 0 0 021 3 10 3.74 7 7 2 2 2 3 6 1 21 5 1 1 7 2 12.01 1.14 1.05 4 0 0 121 4 20 3.74 7 7 1 1 3 3 5 1 21 5 1 1 7 2 26.35 1.50 3.14 4 0 0 -1
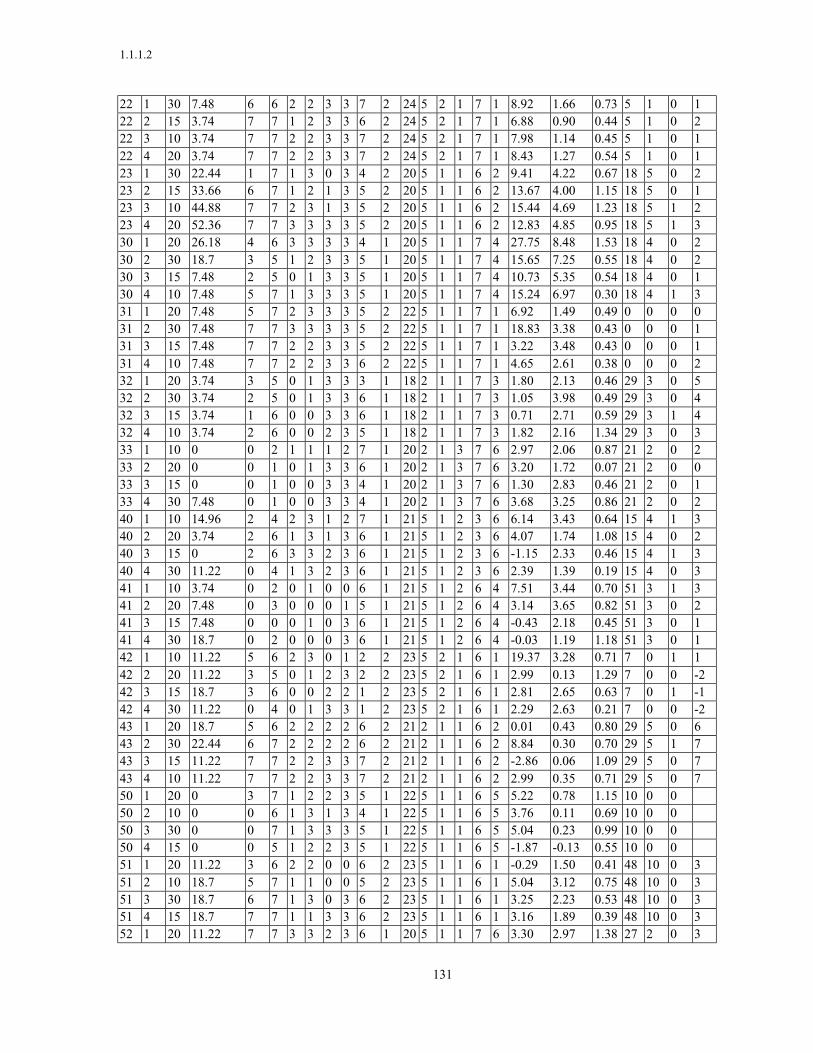
1.1.1.2
131
22 1 30 7.48 6 6 2 2 3 3 7 2 24 5 2 1 7 1 8.92 1.66 0.73 5 1 0 122 2 15 3.74 7 7 1 2 3 3 6 2 24 5 2 1 7 1 6.88 0.90 0.44 5 1 0 222 3 10 3.74 7 7 2 2 3 3 7 2 24 5 2 1 7 1 7.98 1.14 0.45 5 1 0 122 4 20 3.74 7 7 2 2 3 3 7 2 24 5 2 1 7 1 8.43 1.27 0.54 5 1 0 123 1 30 22.44 1 7 1 3 0 3 4 2 20 5 1 1 6 2 9.41 4.22 0.67 18 5 0 223 2 15 33.66 6 7 1 2 1 3 5 2 20 5 1 1 6 2 13.67 4.00 1.15 18 5 0 123 3 10 44.88 7 7 2 3 1 3 5 2 20 5 1 1 6 2 15.44 4.69 1.23 18 5 1 223 4 20 52.36 7 7 3 3 3 3 5 2 20 5 1 1 6 2 12.83 4.85 0.95 18 5 1 330 1 20 26.18 4 6 3 3 3 3 4 1 20 5 1 1 7 4 27.75 8.48 1.53 18 4 0 230 2 30 18.7 3 5 1 2 3 3 5 1 20 5 1 1 7 4 15.65 7.25 0.55 18 4 0 230 3 15 7.48 2 5 0 1 3 3 5 1 20 5 1 1 7 4 10.73 5.35 0.54 18 4 0 130 4 10 7.48 5 7 1 3 3 3 5 1 20 5 1 1 7 4 15.24 6.97 0.30 18 4 1 331 1 20 7.48 5 7 2 3 3 3 5 2 22 5 1 1 7 1 6.92 1.49 0.49 0 0 0 031 2 30 7.48 7 7 3 3 3 3 5 2 22 5 1 1 7 1 18.83 3.38 0.43 0 0 0 131 3 15 7.48 7 7 2 2 3 3 5 2 22 5 1 1 7 1 3.22 3.48 0.43 0 0 0 131 4 10 7.48 7 7 2 2 3 3 6 2 22 5 1 1 7 1 4.65 2.61 0.38 0 0 0 232 1 20 3.74 3 5 0 1 3 3 3 1 18 2 1 1 7 3 1.80 2.13 0.46 29 3 0 532 2 30 3.74 2 5 0 1 3 3 6 1 18 2 1 1 7 3 1.05 3.98 0.49 29 3 0 432 3 15 3.74 1 6 0 0 3 3 6 1 18 2 1 1 7 3 0.71 2.71 0.59 29 3 1 432 4 10 3.74 2 6 0 0 2 3 5 1 18 2 1 1 7 3 1.82 2.16 1.34 29 3 0 333 1 10 0 0 2 1 1 1 2 7 1 20 2 1 3 7 6 2.97 2.06 0.87 21 2 0 233 2 20 0 0 1 0 1 3 3 6 1 20 2 1 3 7 6 3.20 1.72 0.07 21 2 0 033 3 15 0 0 1 0 0 3 3 4 1 20 2 1 3 7 6 1.30 2.83 0.46 21 2 0 133 4 30 7.48 0 1 0 0 3 3 4 1 20 2 1 3 7 6 3.68 3.25 0.86 21 2 0 240 1 10 14.96 2 4 2 3 1 2 7 1 21 5 1 2 3 6 6.14 3.43 0.64 15 4 1 340 2 20 3.74 2 6 1 3 1 3 6 1 21 5 1 2 3 6 4.07 1.74 1.08 15 4 0 240 3 15 0 2 6 3 3 2 3 6 1 21 5 1 2 3 6 -1.15 2.33 0.46 15 4 1 340 4 30 11.22 0 4 1 3 2 3 6 1 21 5 1 2 3 6 2.39 1.39 0.19 15 4 0 341 1 10 3.74 0 2 0 1 0 0 6 1 21 5 1 2 6 4 7.51 3.44 0.70 51 3 1 341 2 20 7.48 0 3 0 0 0 1 5 1 21 5 1 2 6 4 3.14 3.65 0.82 51 3 0 241 3 15 7.48 0 0 0 1 0 3 6 1 21 5 1 2 6 4 -0.43 2.18 0.45 51 3 0 141 4 30 18.7 0 2 0 0 0 3 6 1 21 5 1 2 6 4 -0.03 1.19 1.18 51 3 0 142 1 10 11.22 5 6 2 3 0 1 2 2 23 5 2 1 6 1 19.37 3.28 0.71 7 0 1 142 2 20 11.22 3 5 0 1 2 3 2 2 23 5 2 1 6 1 2.99 0.13 1.29 7 0 0 -242 3 15 18.7 3 6 0 0 2 2 1 2 23 5 2 1 6 1 2.81 2.65 0.63 7 0 1 -142 4 30 11.22 0 4 0 1 3 3 1 2 23 5 2 1 6 1 2.29 2.63 0.21 7 0 0 -243 1 20 18.7 5 6 2 2 2 2 6 2 21 2 1 1 6 2 0.01 0.43 0.80 29 5 0 643 2 30 22.44 6 7 2 2 2 2 6 2 21 2 1 1 6 2 8.84 0.30 0.70 29 5 1 743 3 15 11.22 7 7 2 2 3 3 7 2 21 2 1 1 6 2 -2.86 0.06 1.09 29 5 0 743 4 10 11.22 7 7 2 2 3 3 7 2 21 2 1 1 6 2 2.99 0.35 0.71 29 5 0 750 1 20 0 3 7 1 2 2 3 5 1 22 5 1 1 6 5 5.22 0.78 1.15 10 0 050 2 10 0 0 6 1 3 1 3 4 1 22 5 1 1 6 5 3.76 0.11 0.69 10 0 050 3 30 0 0 7 1 3 3 3 5 1 22 5 1 1 6 5 5.04 0.23 0.99 10 0 050 4 15 0 0 5 1 2 2 3 5 1 22 5 1 1 6 5 -1.87 -0.13 0.55 10 0 051 1 20 11.22 3 6 2 2 0 0 6 2 23 5 1 1 6 1 -0.29 1.50 0.41 48 10 0 351 2 10 18.7 5 7 1 1 0 0 5 2 23 5 1 1 6 1 5.04 3.12 0.75 48 10 0 351 3 30 18.7 6 7 1 3 0 3 6 2 23 5 1 1 6 1 3.25 2.23 0.53 48 10 0 351 4 15 18.7 7 7 1 1 3 3 6 2 23 5 1 1 6 1 3.16 1.89 0.39 48 10 0 352 1 20 11.22 7 7 3 3 2 3 6 1 20 5 1 1 7 6 3.30 2.97 1.38 27 2 0 3
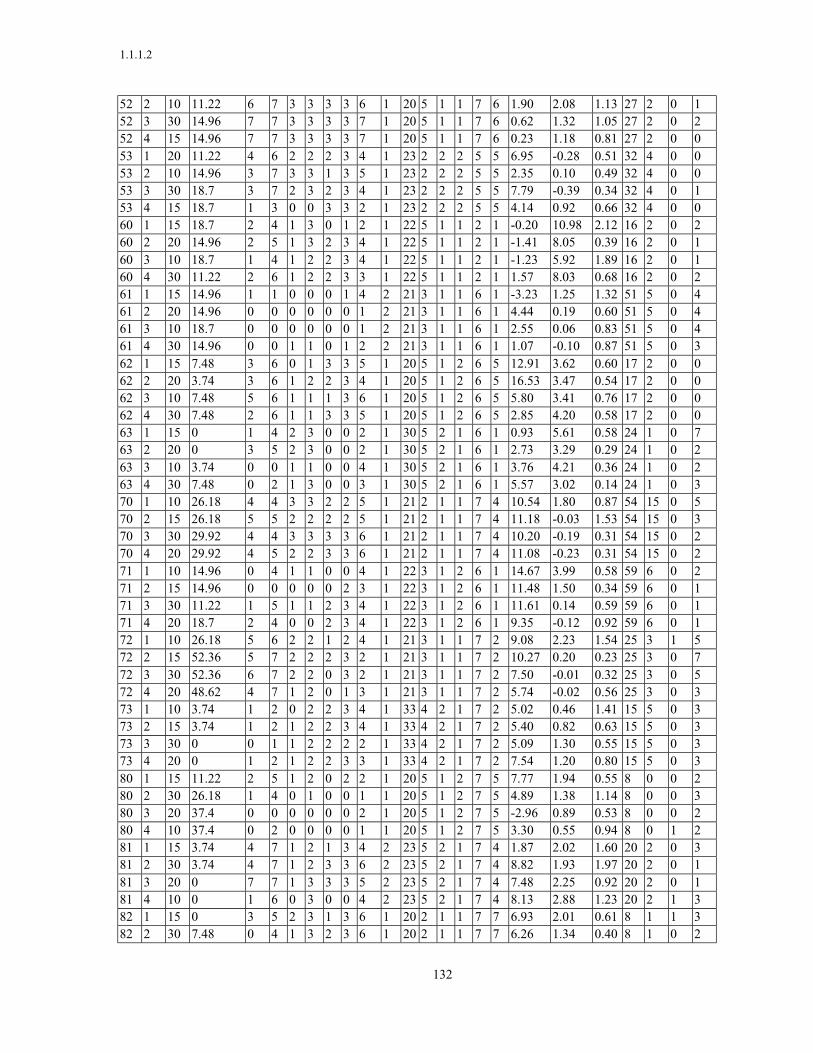
1.1.1.2
132
52 2 10 11.22 6 7 3 3 3 3 6 1 20 5 1 1 7 6 1.90 2.08 1.13 27 2 0 152 3 30 14.96 7 7 3 3 3 3 7 1 20 5 1 1 7 6 0.62 1.32 1.05 27 2 0 252 4 15 14.96 7 7 3 3 3 3 7 1 20 5 1 1 7 6 0.23 1.18 0.81 27 2 0 053 1 20 11.22 4 6 2 2 2 3 4 1 23 2 2 2 5 5 6.95 -0.28 0.51 32 4 0 053 2 10 14.96 3 7 3 3 1 3 5 1 23 2 2 2 5 5 2.35 0.10 0.49 32 4 0 053 3 30 18.7 3 7 2 3 2 3 4 1 23 2 2 2 5 5 7.79 -0.39 0.34 32 4 0 153 4 15 18.7 1 3 0 0 3 3 2 1 23 2 2 2 5 5 4.14 0.92 0.66 32 4 0 060 1 15 18.7 2 4 1 3 0 1 2 1 22 5 1 1 2 1 -0.20 10.98 2.12 16 2 0 260 2 20 14.96 2 5 1 3 2 3 4 1 22 5 1 1 2 1 -1.41 8.05 0.39 16 2 0 160 3 10 18.7 1 4 1 2 2 3 4 1 22 5 1 1 2 1 -1.23 5.92 1.89 16 2 0 160 4 30 11.22 2 6 1 2 2 3 3 1 22 5 1 1 2 1 1.57 8.03 0.68 16 2 0 261 1 15 14.96 1 1 0 0 0 1 4 2 21 3 1 1 6 1 -3.23 1.25 1.32 51 5 0 461 2 20 14.96 0 0 0 0 0 0 1 2 21 3 1 1 6 1 4.44 0.19 0.60 51 5 0 461 3 10 18.7 0 0 0 0 0 0 1 2 21 3 1 1 6 1 2.55 0.06 0.83 51 5 0 461 4 30 14.96 0 0 1 1 0 1 2 2 21 3 1 1 6 1 1.07 -0.10 0.87 51 5 0 362 1 15 7.48 3 6 0 1 3 3 5 1 20 5 1 2 6 5 12.91 3.62 0.60 17 2 0 062 2 20 3.74 3 6 1 2 2 3 4 1 20 5 1 2 6 5 16.53 3.47 0.54 17 2 0 062 3 10 7.48 5 6 1 1 1 3 6 1 20 5 1 2 6 5 5.80 3.41 0.76 17 2 0 062 4 30 7.48 2 6 1 1 3 3 5 1 20 5 1 2 6 5 2.85 4.20 0.58 17 2 0 063 1 15 0 1 4 2 3 0 0 2 1 30 5 2 1 6 1 0.93 5.61 0.58 24 1 0 763 2 20 0 3 5 2 3 0 0 2 1 30 5 2 1 6 1 2.73 3.29 0.29 24 1 0 263 3 10 3.74 0 0 1 1 0 0 4 1 30 5 2 1 6 1 3.76 4.21 0.36 24 1 0 263 4 30 7.48 0 2 1 3 0 0 3 1 30 5 2 1 6 1 5.57 3.02 0.14 24 1 0 370 1 10 26.18 4 4 3 3 2 2 5 1 21 2 1 1 7 4 10.54 1.80 0.87 54 15 0 570 2 15 26.18 5 5 2 2 2 2 5 1 21 2 1 1 7 4 11.18 -0.03 1.53 54 15 0 370 3 30 29.92 4 4 3 3 3 3 6 1 21 2 1 1 7 4 10.20 -0.19 0.31 54 15 0 270 4 20 29.92 4 5 2 2 3 3 6 1 21 2 1 1 7 4 11.08 -0.23 0.31 54 15 0 271 1 10 14.96 0 4 1 1 0 0 4 1 22 3 1 2 6 1 14.67 3.99 0.58 59 6 0 271 2 15 14.96 0 0 0 0 0 2 3 1 22 3 1 2 6 1 11.48 1.50 0.34 59 6 0 171 3 30 11.22 1 5 1 1 2 3 4 1 22 3 1 2 6 1 11.61 0.14 0.59 59 6 0 171 4 20 18.7 2 4 0 0 2 3 4 1 22 3 1 2 6 1 9.35 -0.12 0.92 59 6 0 172 1 10 26.18 5 6 2 2 1 2 4 1 21 3 1 1 7 2 9.08 2.23 1.54 25 3 1 572 2 15 52.36 5 7 2 2 2 3 2 1 21 3 1 1 7 2 10.27 0.20 0.23 25 3 0 772 3 30 52.36 6 7 2 2 0 3 2 1 21 3 1 1 7 2 7.50 -0.01 0.32 25 3 0 572 4 20 48.62 4 7 1 2 0 1 3 1 21 3 1 1 7 2 5.74 -0.02 0.56 25 3 0 373 1 10 3.74 1 2 0 2 2 3 4 1 33 4 2 1 7 2 5.02 0.46 1.41 15 5 0 373 2 15 3.74 1 2 1 2 2 3 4 1 33 4 2 1 7 2 5.40 0.82 0.63 15 5 0 373 3 30 0 0 1 1 2 2 2 2 1 33 4 2 1 7 2 5.09 1.30 0.55 15 5 0 373 4 20 0 1 2 1 2 2 3 3 1 33 4 2 1 7 2 7.54 1.20 0.80 15 5 0 380 1 15 11.22 2 5 1 2 0 2 2 1 20 5 1 2 7 5 7.77 1.94 0.55 8 0 0 280 2 30 26.18 1 4 0 1 0 0 1 1 20 5 1 2 7 5 4.89 1.38 1.14 8 0 0 380 3 20 37.4 0 0 0 0 0 0 2 1 20 5 1 2 7 5 -2.96 0.89 0.53 8 0 0 280 4 10 37.4 0 2 0 0 0 0 1 1 20 5 1 2 7 5 3.30 0.55 0.94 8 0 1 281 1 15 3.74 4 7 1 2 1 3 4 2 23 5 2 1 7 4 1.87 2.02 1.60 20 2 0 381 2 30 3.74 4 7 1 2 3 3 6 2 23 5 2 1 7 4 8.82 1.93 1.97 20 2 0 181 3 20 0 7 7 1 3 3 3 5 2 23 5 2 1 7 4 7.48 2.25 0.92 20 2 0 181 4 10 0 1 6 0 3 0 0 4 2 23 5 2 1 7 4 8.13 2.88 1.23 20 2 1 382 1 15 0 3 5 2 3 1 3 6 1 20 2 1 1 7 7 6.93 2.01 0.61 8 1 1 382 2 30 7.48 0 4 1 3 2 3 6 1 20 2 1 1 7 7 6.26 1.34 0.40 8 1 0 2

1.1.1.2
133
82 3 20 11.22 2 4 1 3 2 3 7 1 20 2 1 1 7 7 4.91 0.94 0.68 8 1 0 182 4 10 18.7 0 4 0 2 3 3 7 1 20 2 1 1 7 7 2.33 1.13 0.57 8 1 0 283 1 15 11.22 5 6 3 3 2 3 4 1 20 2 7 1 6 4 8.56 4.50 0.45 16 9 0 283 2 30 0 4 6 2 2 0 2 5 1 20 2 7 1 6 4 4.78 2.94 0.31 16 9 0 283 3 20 0 1 5 2 2 2 3 4 1 20 2 7 1 6 4 7.26 1.45 0.15 16 9 0 283 4 10 0 2 5 2 2 0 3 4 1 20 2 7 1 6 4 0.20 2.58 0.48 16 9 0 2
Table C.4. Table of data for Frame Rate.