physics experiment
DESCRIPTION
Lab report from a physics experimentTRANSCRIPT

Determination of Planck’s Constant using the
Photoemission of Electrons from Metallic Surfaces
A. Heslop
Abstract
The objective of this experiment was to determine a value of Planck’sconstant, denoted as h, which has a current literature value of 6.62606957×10⁻³⁴ ± 0.00000029× 10⁻³⁴Js. The value of h to be found in the fol-lowing experiment was ascertained by the method of measuring theenergy levels of emitted electrons from a mercury lamp. From this,a value for the work function of the anode in the photocell was alsofound. From the results, it was found that the value for Planck’s con-stant in this experiment was 6.18372 × 10⁻³⁴ ± 7.175358 × 10⁻³⁵Js.The work function, φA, calculated was 1.74282± 0.30174eV . The an-ode used has been specially prepared to reduce φA to below that of apure platinum anode, which would typically have a work function of6.35eV . From these results, it would appear that the experiment hascome close to replicating that done by Lenard. It is within a power of10 of the literature value of Planck’s constant, and the work functionof the anode falls below that of pure platinum, as it should do.
1 Introduction
Much of modern physics is concerned with the understanding of the micro-scopic world and the fundamental laws of physics that govern it. At suchsmall scales, the classical rules that were developed by pre-20th centuryphysicists do not apply. A new set of laws were developed to describe theinteractions of particles at this level. One of the pioneers of this new waveof physics, Max Planck, realised a flaw in the fundamental laws when de-termining orbits of electrons around the nucleus of atoms. He resolved thisflaw by assuming that energy is, on microscopic scales, transferred in smallunits, known as quanta. He determined the Planck constant in his famouspaper, Uber Irreversible Strahlungsvorgange [1] (1899), which sets a limit onthe smallest unit of action that can occur in the quantum universe. Thisconstant is one of the most important in physics, as it occurs in all equationsthat deal with quantum interactions.
The work function of the anode in the photocell that was determinedin the experiment is unique to that metal, and is defined as the minimumenergy necessary to remove an electron from a metal surface[2]. This valuehas many uses, and also gives a good detailing about the metal itself. It hasapplications in a vast array of areas in physics. For example, a thermionic
1
electron gun relies almost entirely on the work function of the cathode insideit, as that is a parameter on the amount of current that is emitted. Workfunctions are also highly useful in solid-state physics.
Many physicists have attempted to experimentally measure an accuratevalue of h, with vary degrees of accuracy. The method used in this exper-iment is one used by Lenard (1902). This method was improved upon byMilikan when trying to disprove Einstein’s theory of the Photoelectric effect(which conversely proved it correct), which gave a more precise and accuratefigure, and won him the 1924 Nobel Prize.
2 Theory
2.1 The Photoelectric Effect
This experiment relies on the principle of the Photoelectric effect[3], devisedby Albert Einstein (1905). In this paper, Einstein evaluated the experimen-tal results, explaining the relation between energy and frequency, and alsothat the number of emitted electrons is proportional to the intensity of theradiation. This is one of the most important papers of recent years, as itfounded many of the ideas that brought on the so-called ’quantum revolu-tion’. These are two points that the classical electromagnetic theory hadfailed to explain. He found the following:
• A photon absorbed by the surface of a metal can impart its energy toone or more electrons.
• The probability that an electron takes energy from more than onephoton is small enough to be considered zero.
• A photon is a quantum of electromagnetic radiation, which has an en-ergy equal to hv, where h is the Planck constant and v is the frequencyof the electron. This gives rise to the equation
E = h(v − v0) (1)
in which v0 is the threshold frequency unique to that surface. Thethreshold frequency is the minimum frequency at which electrons areemitted from the surface of the metal.
From this, Einstein summarised that the value hv0 is individual to eachmetal, thus it could be viewed as a constant, denoted φ, and named it thework function of the material. Therefore (1) can be simplified to
E = hv − φ (2)
2

2.2 Spectral Lines
Spectra have many applications in optical physics. The spectra of a mercuryvapour lamp contains, as all spectra do, lines of measurable wavelength. Weknow the wavelength of the light in the Yellow, Green, Blue-violet, Deep-violet and Ultra-violet lines on this spectrum, which are the main emissionlines for mercury. As a part of the optical setup for this experiment, lightfrom a mercury vapour lamp is directed onto a prism, which disperses thelight into a spectrum (Figure 1), which is projected onto a card, coatedwith fluorescent composite which, upon incidence with light of shorter wave-lengths, emits blue light.
The card used had a small slit, S2, behind which was the photocell de-tecting the dispersed light. This detection of photons creates a photocurrentin the system, which can then be measured by an ammeter. This ammeterreading was one of the main required data points in the experiment.
Figure 1: The emission spectrum of a mercury lamp[4]
Because we know the wavelength of the light, we can easily work outthe frequency using the relation v = λf (proof in Appendix 1), thus forelectromagnetic waves:
f =c
λ(3)
where c is the speed of electromagnetic waves in a vacuum.To determine the stopping voltages for each wavelength of light, we look
at the graph of voltage across the anode against the photocurrent from theanode. The actual stopping voltage is a metered value;
Vm = V + (φC − φA) (4)
where φC is the work function of the potassium cathode.From this it becomes obvious (see Appendix 1) that the actual stopping
voltage of the metal is, in terms of work functions and Planck’s constant,
Vm,0 =hv
e− φA (5)
3

3 Method
The setup of the experiment, described in Figure 2, is a fairly simple one.One point which must be taken care of is the clarity of the spectra. This wasachieved by adjusting the thickness of the first slit, S1, which produces asharper beam of light from the PASCO OS-9286 Hg Light source entering theprism. After dispersion inside the prism, the resulting spectra was focusedonto the card containing S2, and then the photo cell was moved as to allowthe light of wavelength for which readings of IA, the photocurrent from theanode, was required, to travel through S2 and hit the photon detector. Thephotocell used was a Newport Photodetector with a potassium cathode anda platinum anode.
Figure 2: The layout of the equipment used in the experiment, as seen fromabove
Before each set of values for the photocurrent taken, it is crucial toensure that there is no emission of photoelectrons from the anode of thephoton detector when there is no ’useful’ light incident upon it. This isdone, initially, by using an anode with a high enough work function thatit won’t undergo the photoelectric effect unless it is directly excited by thelight from the source. A platinum anode is used for this reason. However,the surface can become contaminated, resulting in a reduced work function,which could lead to unwanted photocurrent, which would affect the results ofthe experiment. To prevent this, a feature on the Phase Sensitive Amplifier(PSA) allows you to purge the anode. It achieves this by running a highcurrent through the anode, which cleans the surface of any contamination.The unit then locks out for a few seconds, and then the experiment cancontinue.
In this experiment, we measured the photocurrent across the anode, IA inamps, for a varying voltage across the anode, VA in volts. This was then re-peated for each of the wavelength in Table 1.
Wavelength (nm) Colour
365 Ultra-Violet405 Deep Violet436 Blue-Violet546 Green578 Yellow
The values are then evaluated, and a stopping voltageis estimated for each wavelength. This stopping voltageis estimated by looking at the point at which the graphof VA against IA begins to increase, that is, to go fromthe gradient being non-zero. Around this voltage, itis necessary to take many readings to ensure increased
4
accuracy in estimation. When an accurate set of datais found around this point, the stopping voltage is fareasier to read straight off of the graph.
Each wavelength of light was measured, and the stopping voltages wasdetermined. The experiment was repeated to ensure validity and precisionin the data received, and then error calculations were made.
4 Results
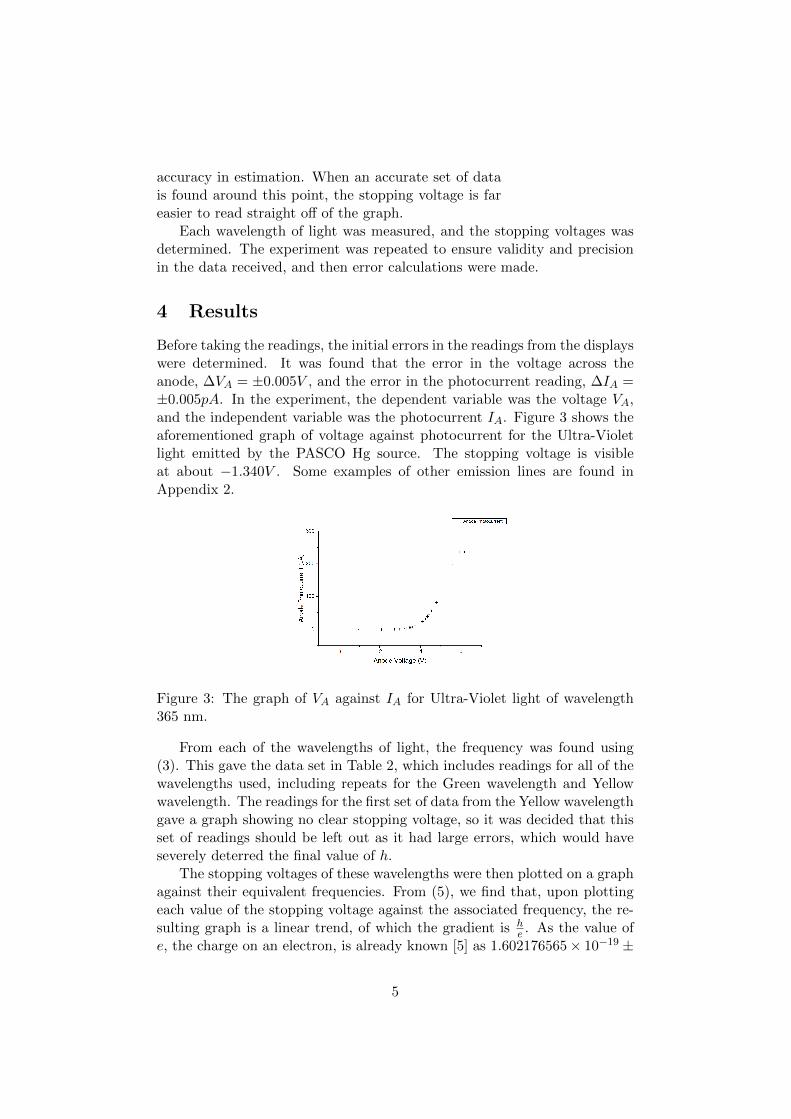
Before taking the readings, the initial errors in the readings from the displayswere determined. It was found that the error in the voltage across theanode, ∆VA = ±0.005V , and the error in the photocurrent reading, ∆IA =±0.005pA. In the experiment, the dependent variable was the voltage VA,and the independent variable was the photocurrent IA. Figure 3 shows theaforementioned graph of voltage against photocurrent for the Ultra-Violetlight emitted by the PASCO Hg source. The stopping voltage is visibleat about −1.340V . Some examples of other emission lines are found inAppendix 2.
Figure 3: The graph of VA against IA for Ultra-Violet light of wavelength365 nm.
From each of the wavelengths of light, the frequency was found using(3). This gave the data set in Table 2, which includes readings for all of thewavelengths used, including repeats for the Green wavelength and Yellowwavelength. The readings for the first set of data from the Yellow wavelengthgave a graph showing no clear stopping voltage, so it was decided that thisset of readings should be left out as it had large errors, which would haveseverely deterred the final value of h.
The stopping voltages of these wavelengths were then plotted on a graphagainst their equivalent frequencies. From (5), we find that, upon plottingeach value of the stopping voltage against the associated frequency, the re-sulting graph is a linear trend, of which the gradient is h
e . As the value ofe, the charge on an electron, is already known [5] as 1.602176565× 10⁻¹⁹ ±
5

3.500 × 10⁻²⁷C. This allows the value of Planck’s constant h to be deter-mined easily.
Colour Wavelength (nm) Stopping Voltage (V) Frequency (×1014 Hz)
Ultra-Violet 365 -1.340 8.22Deep-Violet 405 -1.150 7.41Blue-Violet 436 -1.020 6.88Green (1) 546 -0.525 5.49Green (2) 546 -0.400 5.49Green (3) 546 -0.414 5.49Yellow (2) 578 -0.250 5.19Yellow (3) 578 -0.175 5.19
Figure 4: Table of values for each of the tested wavelengths and their cal-culated equivalences.
Figure 5: Graph of Frequency against Stopping Voltage for each wavelengthof light used in the experiment.
From this, the value of the gradient was determined to be −0.386×10⁻¹⁴.Thus the value of h = −1.602× 10⁻¹⁹ ×−0.386× 10−14 = 6.18372× 10⁻³⁴.
As (5) is a linear trend with gradient he , we can see that the y-intercept
of this graph is equal to the workfunction of the platinum anode. From ourdata, we find the value to be 1.74282eV .
Looking at the errors in the experiment, we find from statistical analysison the Origin Lab Software, that the error in the gradient of the line h
e ,∆m = 0.04479 × 10⁻¹⁴ and the error in the y-intercept, ∆φA = 0.3017.Combining these errors (see Appendix 1) we find that the error in h, ∆h =7.175358× 10⁻³⁵.
6

Thus our results for the experiment are as follows:
h = 6.18372× 10⁻³⁴ ± 7.175358× 10⁻³⁵Js
φA = 1.74282± 0.30174eV
5 Discussion
In comparison between the errors in the data values obtained from the ex-periment and the actual literature values, the results seem within reasonableaccuracy. They are within the same order of 10 as the literature value forboth of the values measured. There were a few sources of systematic errorwithin the experiment. One of these was the fact that the photocell wassensitive to light from sources other than the PASCO Hg source. The errorin calculation was reduced by working in a dark room with the only lightbeing that from the mercury lamp being used. Another way of reducing theerror would have been by using a plane polariser, and ensuring only photonsthat were travelling exactly from the prism enter the photocell.
Another fault occured due to the unwanted photocurrent from emissionon the cathode. An attempt was made to minimise the error by regularlypurging the anode, however this did leave some unwanted residue. Thiscaused some slight fluctuation in the readings, which introduced systematicerrors throughout the experiment.
An error in calculation occurred when estimating the stopping voltage.This estimate induced quite a significant error into our test as it relied ongood guesswork. The error in the first yellow wavelength graph was enoughto force these results to be dropped from the experimental results, as itwould have caused more discrepancy in the results. It would have beenbeneficial to take more readings for the Ultra-Violet, Deep-Violet and Blue-Violet wavelength. This would have brought down the error in those results,reducing the overall error distinctly.
6 Conclusion
Planck’s constant has a current literature value of 6.62606957 × 10⁻³⁴ ±0.00000029 × 10⁻³⁴Js. The value ascertained by this method was h =6.18372×10⁻³⁴±7.175358×10⁻³⁵Js. Upon determination of the constant h,the work function φA was found, and gave φA = 1.74282± 0.30174eV whichis, as previously stated, below the work function of platinum of 6.35eV . Theanode used has been specially prepared to reduce φA to below that of a pureplatinum anode, which would typically have a work function of 6.35eV . Itwould appear that the work function is within the appropriate proximityto the given value. These values are vital in many areas of research and
7

theoretical development, and thus require accurate and precise evaluationsto be made.
7 References
[1] Planck, Max: Uber Irreversible Strahlungsvorgange, Annalen der Physik311, 1901, p. 818831.
[2] Tipler, Paul A. & Mosca, Gene: Physics for Scientists and Engineers,Sixth Edition with Modern Physics, 2008, p.1177.
[3] Einstein, Albert: Uber einen die Erzeugung und Verwandlung des Lichtesbetreffenden heuristischen Gesichtspunkt, Annalen der Physik 17(6),1905, 132148.
[4] Reidel, Adric: Spectral Images taken at Georgia State University, 2009.
[5] CODATA: 2010 CODATA Recommended values, 2011.
8

8 Appendix 1
8.1 Proof of v = λf
The famous relation between frequency and wavelength is easily proven usingthe basic principles of motion, that is, distance = speed × time.
s =d
t
s = v,1
t= f, d = λ
⇒ v = λf
8.2 Stopping Voltage Equation (5)
Using equation (4) and the equation
eV0 = hv − eφC
we find that the actual stopping voltage is a metered value Vm,0. This isfound by
V = Vm − (φC − φA)
e[Vm,0 − (φC − φA)] = hv − eφCeVm,0 − eφA = hv − eφC + eφC
eVm,0 = hv − eφA
Vm,0 =hv
e− φA
8.3 Error Formula for h
By the method of partial differentiation, the error in h can be determined.
h = eV0
(∆h
h)2 = (
∆e
e)2 + (
∆V
V)2
∆h = h
√(∆e
e)2 + (
∆V
V)2
9

9 Appendix 2
Figure 6: The graph of VA against IA for Deep-Violet light of wavelength405 nm.
Figure 7: The graph of VA against IA for Blue-Violet light of wavelength436 nm.
Figure 8: The graph of VA against IA for Green light of wavelength 546 nm.
10