physics engine development - box2d.orgbox2d.org/files/...physicsenginedevelopment.pdf · 2 while...
TRANSCRIPT

1
Hello! My name is Sergiy Migdalskiy and I work at Valve with Dirk Gregorius. I helped port,
develop and optimize our in-house physics engine, Rubikon. Also, I have implemented a physics engine for Uncharted: Drake's Fortune on PS/3.

2
While this talk is about physics development, I'd like to emphacise that tools and techniques
I'm describing are general purpose. They are probably applicable to any complex system written in C++.

3
Run Playing_with_Physics.mov This is what I do the whole day long. I play with physics, throw ragdolls into sandboxes, and such silliness. (wait) Here I'm piling up some ragdolls, it's looking good, until.. I notice one of the ragdolls, the very first, doesn't seem to collide with anything. I'm testing some more. I make sure the other ragdolls work fine. Then I notice something. Here it is – the collision flags on the very first ragdoll are set to not collide with anything. Now the mystery is solved, and I go on to other tests.

4
We started working with Dirk by porting his rigid body engine to Valve's framework. I knew Qt and I like playing with stuff I'm working on, for fun and to make it easier. So I implemented a little IDE for our physics project.
It was incremental. Every time something took more than 30 seconds seconds to look up in the debugger, I made a widget that makes it a split-second.
We had physics running in an isolated tool with buttons, sliders and 3D window with shadows, the one you've just seen, which was pretty cool. And it restarted in seconds. We call it the Physics Testbed, or the Physics Debugger. Not to be confused with Visual Studio debugger.

5
But there comes the time for every game physics engine to be put into an actual game.
Once we started integrating physics with the game, we had to debug it inside the game. So we lost our fast-iteration, nice UI.
Every engine has in-game visualization of physics. So we make do. It has some serious drawbacks, though. You can't easily use mouse cursor for clicking collision or UI. You cannot fly around easily, you have to implement a special camera for it. You need to render inside game engine, which can be pretty tricky. You have to implement a special pause that pauses absolutely everything
while you're examining something. It's non-trivial to implement rich UI, like you can do with Qt.

6
Physics Testbed was a great UI with a bunch physics-centric widgets. It was a great help already in making physics work. I felt I can reuse it in the game integrated physics.
But how do we display in-game physics world in a separate window?

7
I briefly entertained an idea to open an extra Qt window in the game process. I find it:
inconvenient to implement It's intrusive to the main game loop does not work when the game is crashed or stopped on a breakpoint You have to implement “full pause” in the game, both on server and client So I decided against in-process window. This means I could just reuse the existing
separate tool, our Physics Testbed.

8
To visualize in external process, you need to send data to it. The hardest part about sending physics data to external app is serialization. But if you can properly and fully serialize your world state into a stream of bits and
send it over the wire, it becomes very straightforward to visualize your physics in a separate app.
Playing with physics in external app is a nice bonus feature.

9
So serialization is the biggest obstacle here. But once we solve it, it becomes very useful:
- we can save and look at something later - we can implement nice data and time profilers - we can record and replay bugs Once you can serialize, it is trivial to stream to external app.

10
By the way, of course, serialization works two ways. The external app has to somehow turn our stream of bits into data structures..
So How do we serialize? Physics engine is complex. There are so many classes and
data structures in there! Serializing pointers is hard. How do we build software that doesn’t miss anything, and then reconstructs everything faithfully. And hopefully it updates itself every time we add or remove a field in a class?
Definitely not! by writing serialization by hand.
11
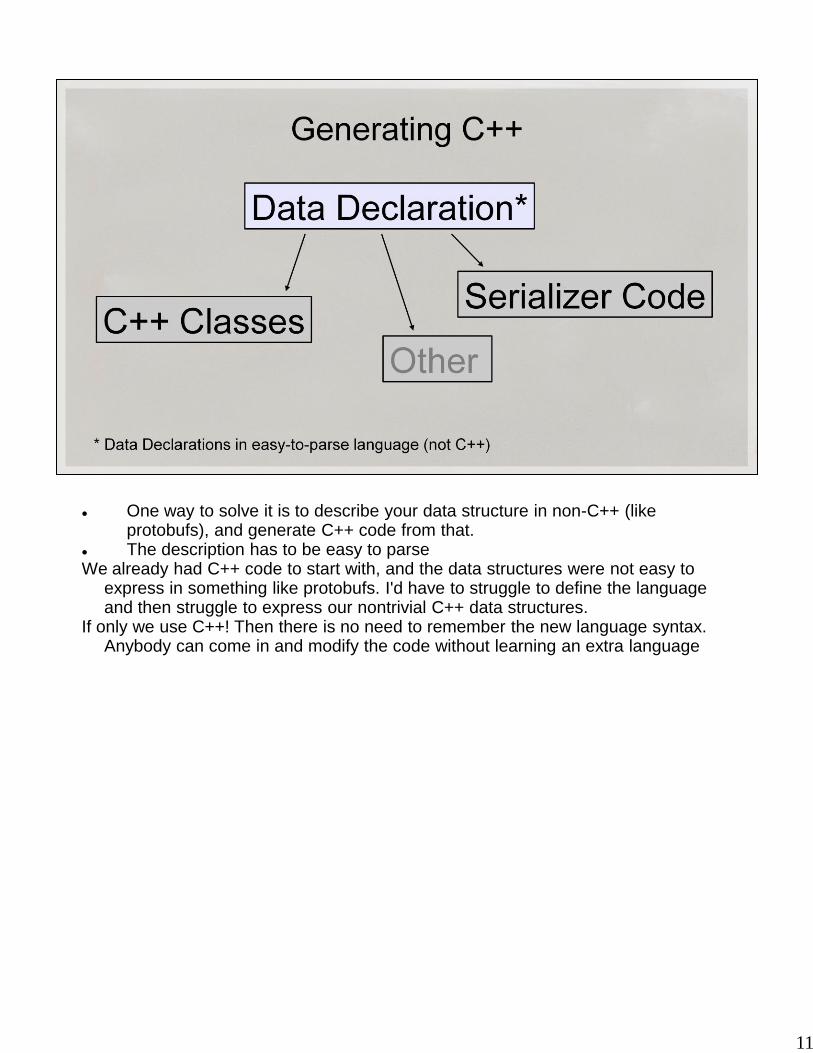
One way to solve it is to describe your data structure in non-C++ (like protobufs), and generate C++ code from that.
The description has to be easy to parse We already had C++ code to start with, and the data structures were not easy to
express in something like protobufs. I'd have to struggle to define the language and then struggle to express our nontrivial C++ data structures.
If only we use C++! Then there is no need to remember the new language syntax. Anybody can come in and modify the code without learning an extra language

12
ANTLR is a parser generator and was the first thing I used. It has a whole IDE for debugging grammars. It's very powerful.
In house, we use ANTLR for our reflection API. We only parse a subset of C++ specification. I took that parser and I still use it to generate clean public interfaces to our physics engine. They take care of type conversions, they log external activity and do some other things.
ANTLR is not ideal for parsing C++, though. You have to maintain C++ grammar, Java is its native language so it's the easiest target to generate parsers. It's fast, but an optimized C++ parser is faster.

13
We can analyze the engine's header files to generate serialization code. That's what we would do if we wrote the serialization by hand. But instead of doing it by hand we can parse C++ in a utility and spit out C++ which
will serialize our data. But parsing C++ is extremely hard. Or is it?
14
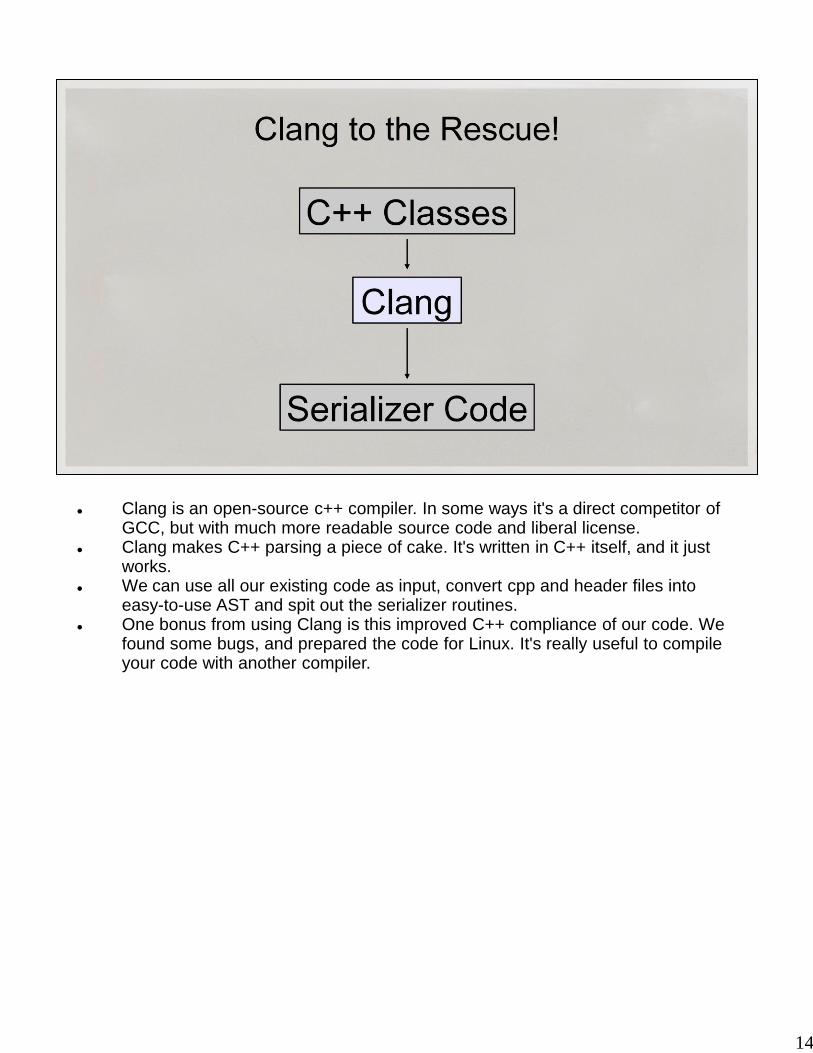
Clang is an open-source c++ compiler. In some ways it's a direct competitor of GCC, but with much more readable source code and liberal license.
Clang makes C++ parsing a piece of cake. It's written in C++ itself, and it just works.
We can use all our existing code as input, convert cpp and header files into easy-to-use AST and spit out the serializer routines.
One bonus from using Clang is this improved C++ compliance of our code. We found some bugs, and prepared the code for Linux. It's really useful to compile your code with another compiler.

15
I mentioned the term AST. It means Abstract Syntax Tree. It's a tree that describes everything there is to know about your source code. This is how it looks, schematically. For every class, you'll have a node. For every
member, its type or size, or annotation, or anything you can think of you'll probably get a node of some type.

16
In effect, we are transforming C++ code into additional C++ code It's very tempting at first to put code generation as a bunch of printf() statement
right into the your parser I decided to resist the urge, and I consider myself lucky I did. It would be
horribly slow to iterate on the generated code with printfs.

17
Parse, then Generate. Decouple these two stages, and unless your project is trivial, you'll be rewarded.
I'm distilling the huge AST of the physics engine into a very concise json file. Json is
a human readable format that is widely used nowadays. After adding features for a year, my Visitor class in the code that uses Clang that just
prints out the json with relevant information is about 1000 lines long, and it would be incomprehensible if I generated code there.

18
So, I'm taking my C++ code, let Clang parse it and spit out Json.
But I ultimately need my serializer and potentially other useful tools to be written in C++ This begs the question: how do I generate C++ code from Json?

19
Fortunately, there is no need to reinvent the wheel, because it was invented many times over before us. There are a lot of text template libraries, and languages. They are widely used and freely available.
I chose StringTemplate. It's a text library that's very easy to use, and it's very well suited to code generation. It's declarative style, which is appealing for this kind of task.

20
You could use something else. In fact, if you're very familiar and comfortable with, say, PHP, you should absolutely use it.
You could also use XML instead of Json. In fact, standard Clang tools can output full abstract syntax tree in XML directly. XSLT is a powerful transformation language for XML. StringTemplates and Json are much easier to learn and much more human-readable. That's why I personally chose them.
There are many ways to configure this pipeline, I'm just describing what worked for me.

21
StringTemplate looks like this. The tool itself is written in java, but there's no need to know Java to use it. All my serialization, unserialization and memory statistics code is generated from a 400-line template. These are a few of those lines. They auto-generate the code to serialize most classes in our physics engine.
You feed it json file, it spits out C++ file. Quite simple.

22
So, to recap.
We start with the source code of the engine – it's arbitrary C++, potentially annotated. For instance, you can annotate only the classes you want serialized. And exclude some fields from serialization. And add a member to call after serialization.
23
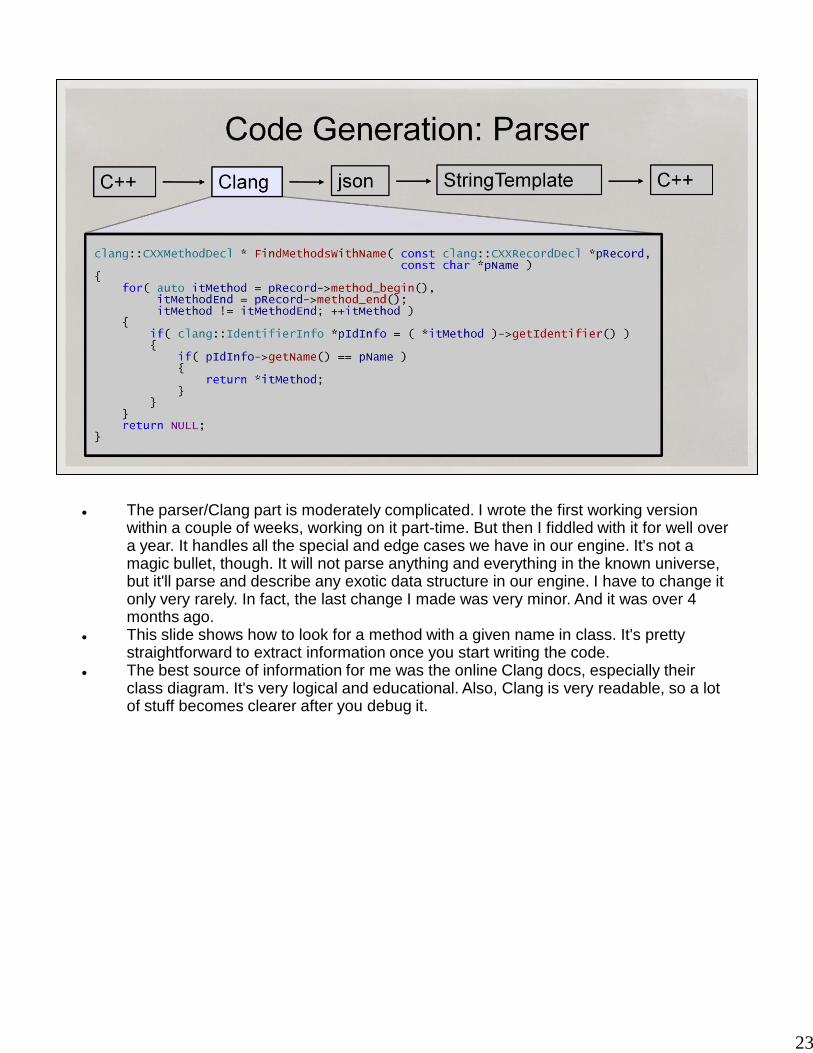
The parser/Clang part is moderately complicated. I wrote the first working version within a couple of weeks, working on it part-time. But then I fiddled with it for well over a year. It handles all the special and edge cases we have in our engine. It's not a magic bullet, though. It will not parse anything and everything in the known universe, but it'll parse and describe any exotic data structure in our engine. I have to change it only very rarely. In fact, the last change I made was very minor. And it was over 4 months ago.
This slide shows how to look for a method with a given name in class. It's pretty straightforward to extract information once you start writing the code.
The best source of information for me was the online Clang docs, especially their class diagram. It's very logical and educational. Also, Clang is very readable, so a lot of stuff becomes clearer after you debug it.

24
The generated json file looks like this. I already explained the meaning of this snippet before.
It contains all the data necessary to generate the serializer and whatever other toold you might wish to generate, and nothing else. It's very much human-readable, which helps a lot when developing it
On the slide, it shows the class name, the list of its fields with field names and types and if the field is an array, then the array count. There's also the base class name. It's what you would expect.
25
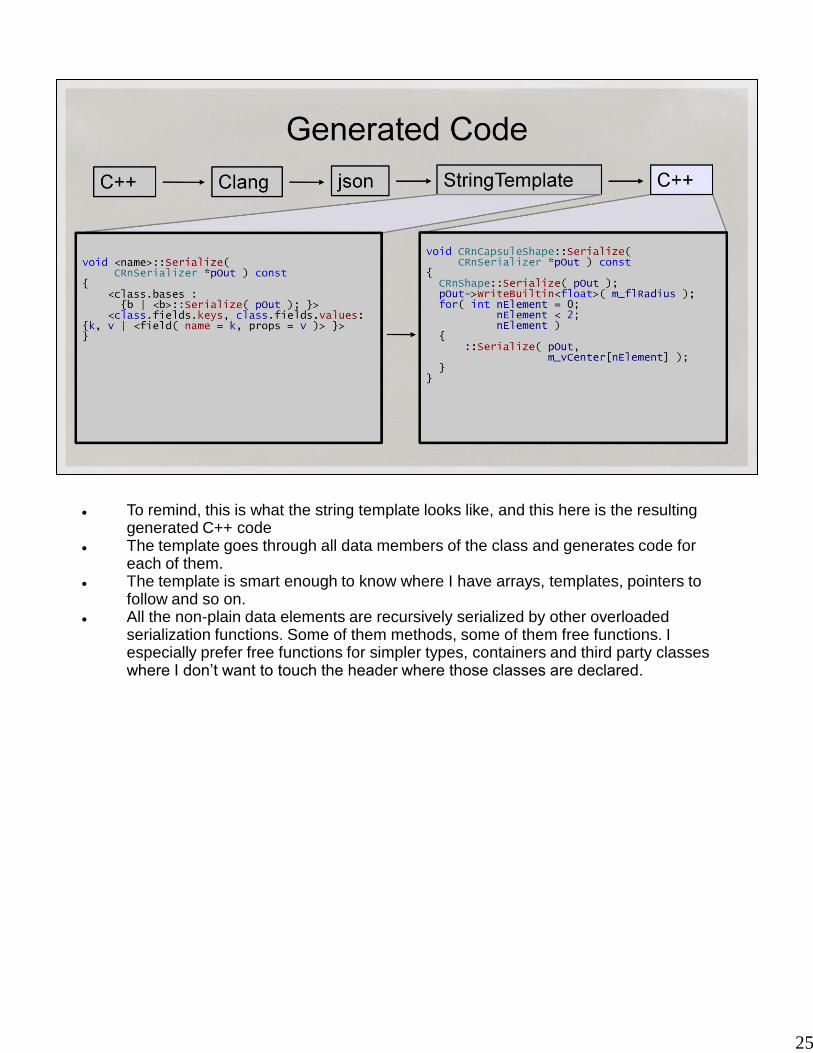
To remind, this is what the string template looks like, and this here is the resulting generated C++ code
The template goes through all data members of the class and generates code for each of them.
The template is smart enough to know where I have arrays, templates, pointers to follow and so on.
All the non-plain data elements are recursively serialized by other overloaded serialization functions. Some of them methods, some of them free functions. I especially prefer free functions for simpler types, containers and third party classes where I don’t want to touch the header where those classes are declared.

26
Once you complete these 5 easy steps, you'll have yourself one wholesome serializer. It will be self-maintaining. You will forever be able to visualize your physics in all detail.
Sometimes we don't even know something is wrong. Some bugs ship and go unnoticed for years. This will never happen to you again.
Well..., I can't make guarantees... But I really hope I convinced you that visualizing stuff is great. Having serializer auto-magically generate itself makes everything even better.
But we have quite a bit more to discuss before we wrap up.

27
=Play= Top_Heavy_Lamp.wmv Here's an example of one workflow when you have full serialization. I noticed something weird with a lamp here. It was always falling down. Lamps are
supposed to stand straight, and this one was always on its side. So I snooped and looked at the lamp. (wait) When I figured out why it's not standing (because its center of mass is too
high), I just sent out an email to an artists – and I attached the file he can play with to prove my words. It's quite intuitive.

28
Here is the Clang's “Hello World” program relevant to this use case is called ClangCheck and it is a great starting point to write your own tool. It's part of the Clang distro, and I urge you to have a look at it.
It uses visitor pattern. For every top-level declaration in your source file, such as a class or function definition, or a typedef, or a global, you get a callback. In that callback, you can drill down the AST.
This self-contained example is dumping those declarations as XML to a log. If XML is your thing and performance is not the most critical issue, this here just may be your parser.
29
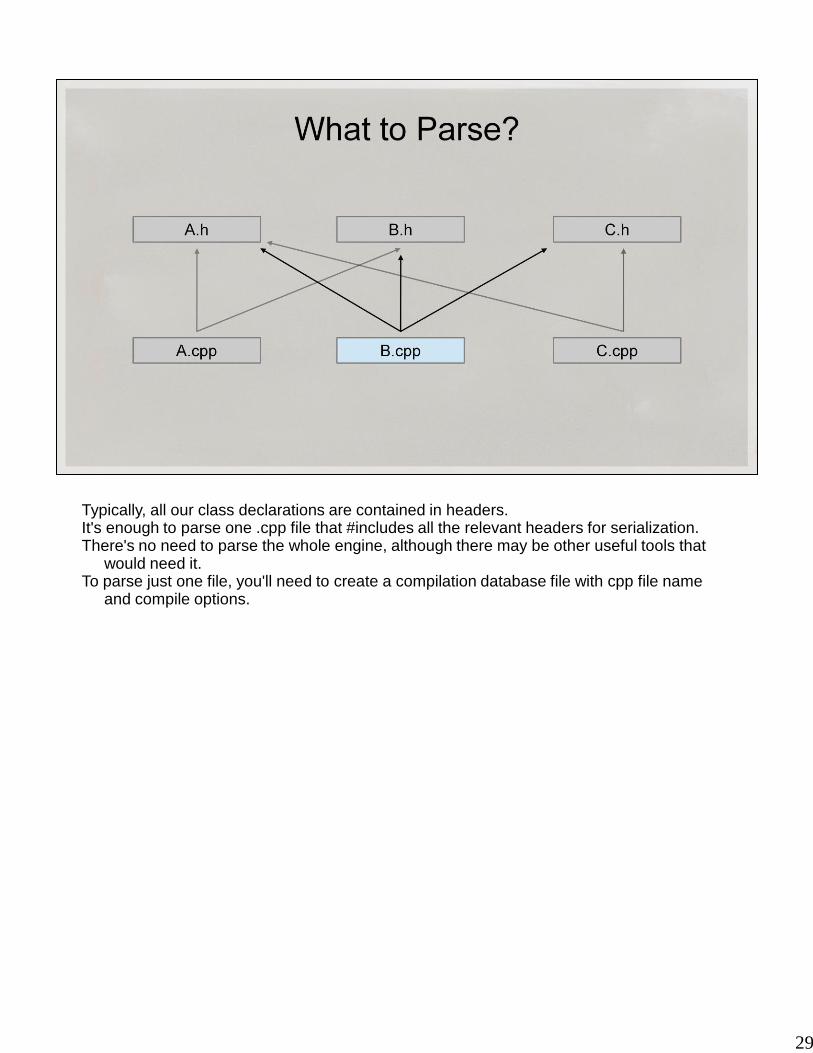
Typically, all our class declarations are contained in headers. It's enough to parse one .cpp file that #includes all the relevant headers for serialization. There's no need to parse the whole engine, although there may be other useful tools that
would need it. To parse just one file, you'll need to create a compilation database file with cpp file name
and compile options.

30
Here's an example of compilation database. The most interesting options are highlighted here.
Compilation database is like a makefile, or vcproj. If you don't want to do anything non-standard, you can simply generate a .json file with all the information and give it to clang.
We use a tool to generate VCPROJ files, and we changed that tool to also spit out compilation databases.

31
And here is a little cheatsheet. In your parser tool, that you carefully link with all the clang libraries, what do you do first?
Start with implementing ASTConsumer, make a factory class for it, and then in your main() function, load compilation database and then run an instance ClangTool. It's all here in this slide.
One thing to remember: you may have to flush std out and std error.

32
Before going further, I'd like to clarify what I mean by box cast. We often use it in Source engine. It's like raycast, but with a box.

33
Just take a box, move it linearly until you hit something. At that point, you sometimes create a contact point for the solver. We use it for player movement a lot, so debugging it is a common thing to do.

34
=Run= Player_Movement.mov Let's see what we've got for our efforts so far. Here's a game running alongside visualization tool. I'm walking around a room, and I'm looking at the raycasts and box casts our player
movement is making I can look at it from the 3rd person view, I can only render the relevant data. I'm noticing something strange, there's a flurry of box casts sometimes. It might
probably result in a framerate hitch. So I'm trying to reproduce this. I find a place where it's happening. And I'm flying around to see what causes it. So far, so good. By the way, I can play with that physics at any point, but it won't
affect the game, so it's not useful in this case.

35
Well, what if just looking at the problem does not present an obvious fix? What if we have to actually debug code?
36
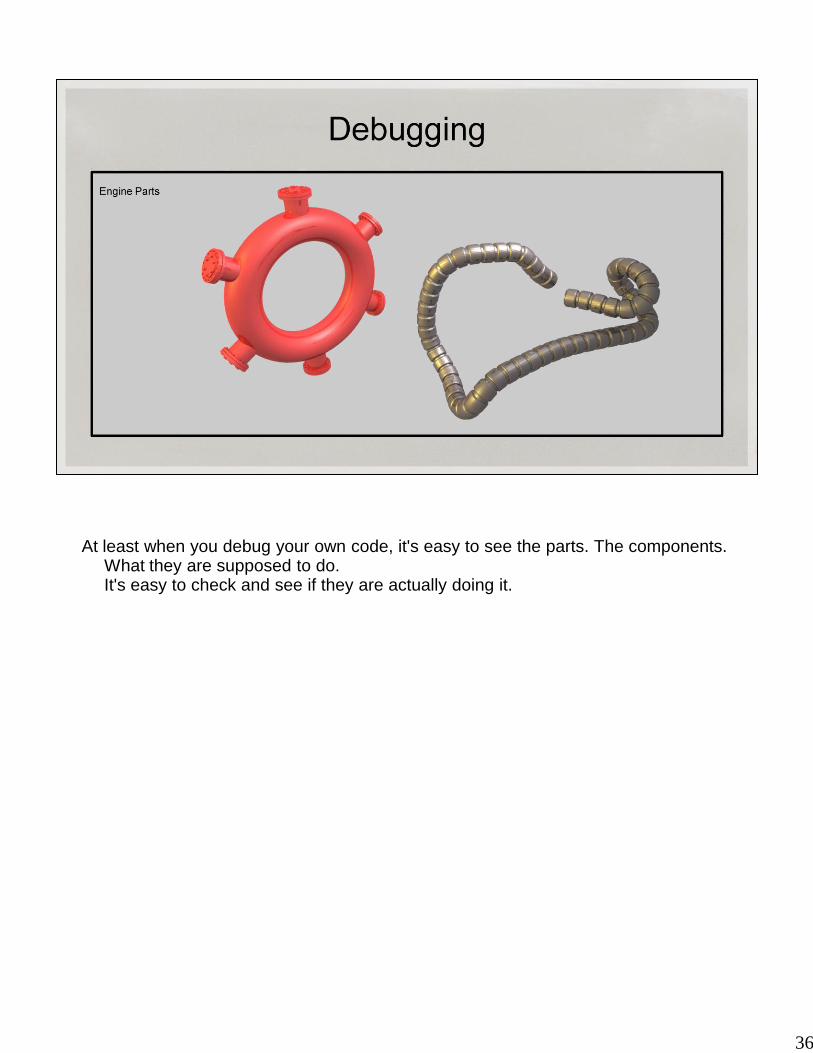
At least when you debug your own code, it's easy to see the parts. The components. What they are supposed to do. It's easy to check and see if they are actually doing it.

37
Working in a team, it's different... It's hard to see the whole picture. It's hard to check if the parts are working properly.
38
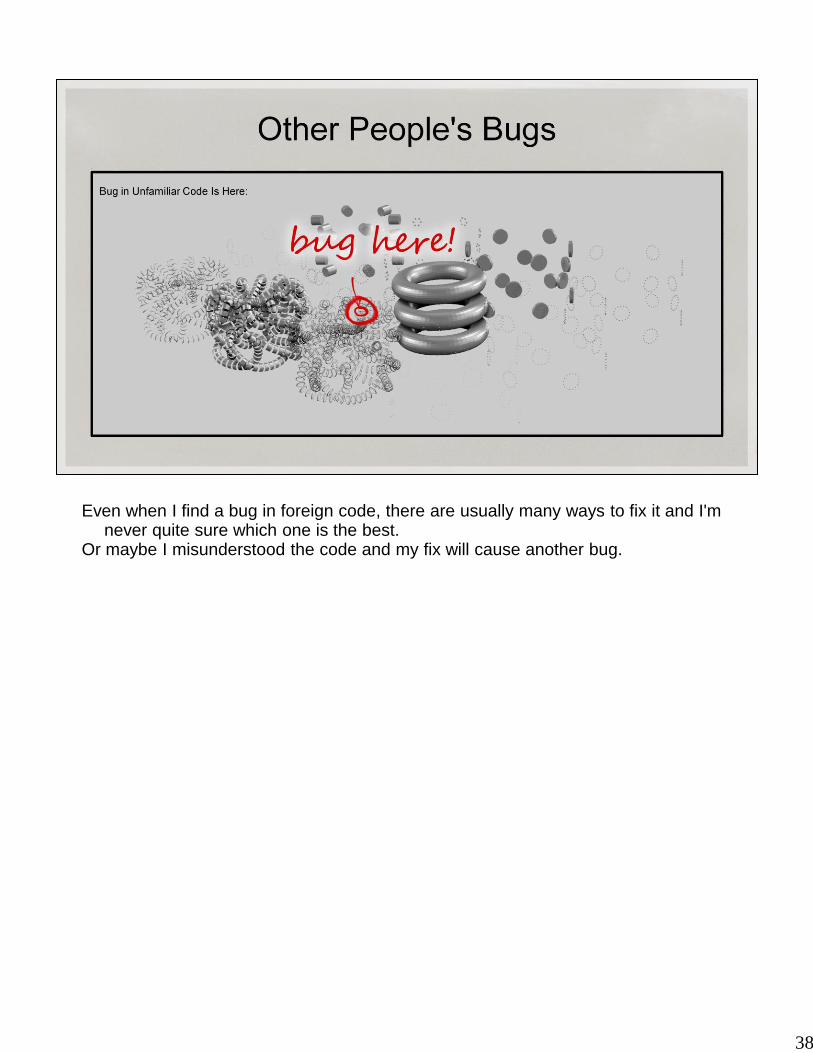
Even when I find a bug in foreign code, there are usually many ways to fix it and I'm never quite sure which one is the best.
Or maybe I misunderstood the code and my fix will cause another bug.

39
And the debugging tools we have are very basic: We have the Watch window, and printf. That's just inadequate.
40
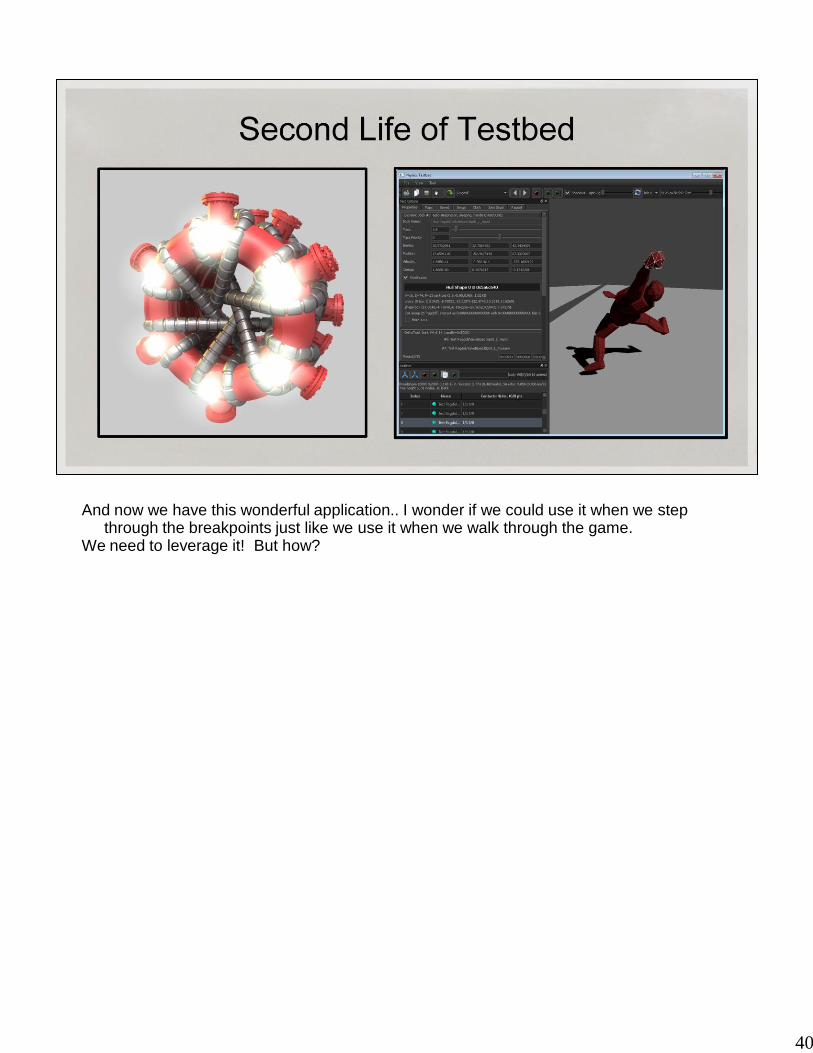
And now we have this wonderful application.. I wonder if we could use it when we step through the breakpoints just like we use it when we walk through the game.
We need to leverage it! But how?

41
The usual debug experience consists of sifting through Watch windows, stepping
through lines of code, imagining our 3D world in our mind's eye..

42
Ideally, I want to see the world just like I did in the Physics Testbed, but I also want to see it
changing just in time as I step through my breakpoints.
I want to be able to fly around the physics world frozen at a breakpoint. That would be ideal for me.
That would make debugging much more comfortable, enjoyable and productive.
Ideally, I want to see the world just like I did in the Physics Testbed, but I also want to see it changing just in time as I step through my breakpoints. I want to be able to fly around the physics world frozen at a breakpoint. That would be ideal for me. That would make debugging much more comfortable, enjoyable and productive.

43
Let me show you what I mean. As you can see, this is the place with too many box casts that I discovered in the
previous demo. I place a breakpoint in the box trace function. Every time the it hits, I'm looking at the
3D world. I'm seeing the very last box cast. This lets me step through bunch of casts, visualizing each of them in Physics
Testbed. This whole thing happens inside of a frame. Please note that the game didn't send any data packets to Physics Testbed. It's
casting boxes in a very tight loop. The testbed is effectively acting like a watch window.
44
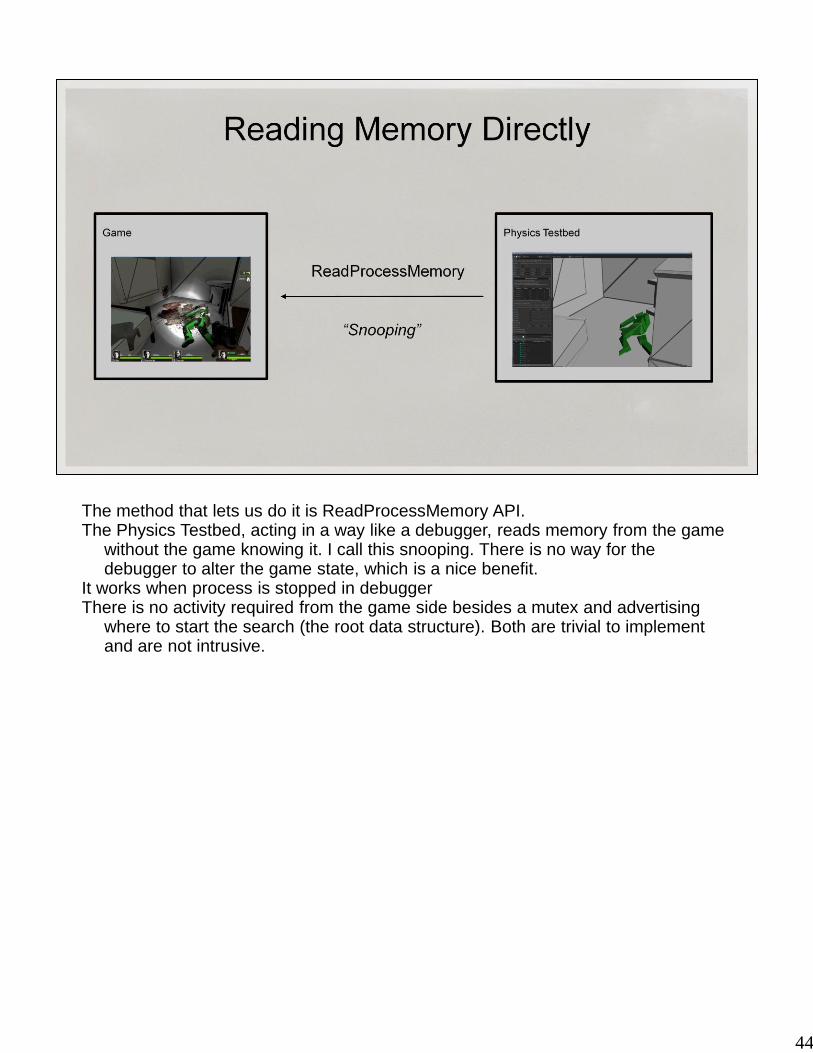
The method that lets us do it is ReadProcessMemory API. The Physics Testbed, acting in a way like a debugger, reads memory from the game
without the game knowing it. I call this snooping. There is no way for the debugger to alter the game state, which is a nice benefit.
It works when process is stopped in debugger There is no activity required from the game side besides a mutex and advertising
where to start the search (the root data structure). Both are trivial to implement and are not intrusive.

45
The biggest question when I thought of this idea was whether it's fast enough. So I wrote a small benchmark.
It is slow to read every 4- or 8-byte field across the Process boundary Every call to ReadProcessMemory descends into kernel, performs a syscall —
it costs you at least 1us, limiting your bandwidth. But just copying 4 bytes in-process takes a thousandth of that time.
46
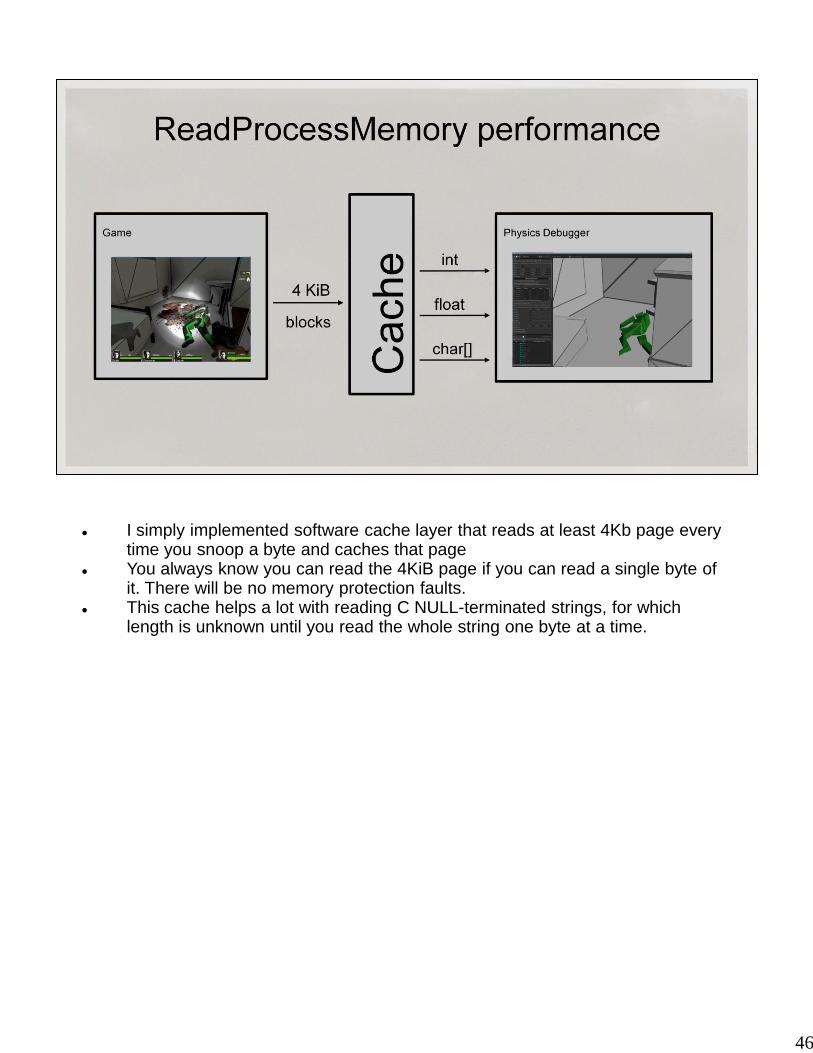
I simply implemented software cache layer that reads at least 4Kb page every
time you snoop a byte and caches that page You always know you can read the 4KiB page if you can read a single byte of
it. There will be no memory protection faults. This cache helps a lot with reading C NULL-terminated strings, for which
length is unknown until you read the whole string one byte at a time.

47
So, we can snoop the bytes from the game physics, but how do we know what to do with them?
In fact, walking the memory of the other process is very much like serialization. If you know your data structures, you can traverse them in another process using ReadProcessMemory just the same as you traverse them in the same process when you serialize them.

48
We can still use Clang to understand our data structures. We can use all our existing code as input and spit out the snooper routines.

49
Just like with the serializer, we are transforming C++ code into additional C++ code for snooper
Something is becoming clearer now. Generating code as a bunch of printf() statements would really be awkward. Because we now have to print out serialize, unserialize, snoop and possibly collect statistics routines.
50
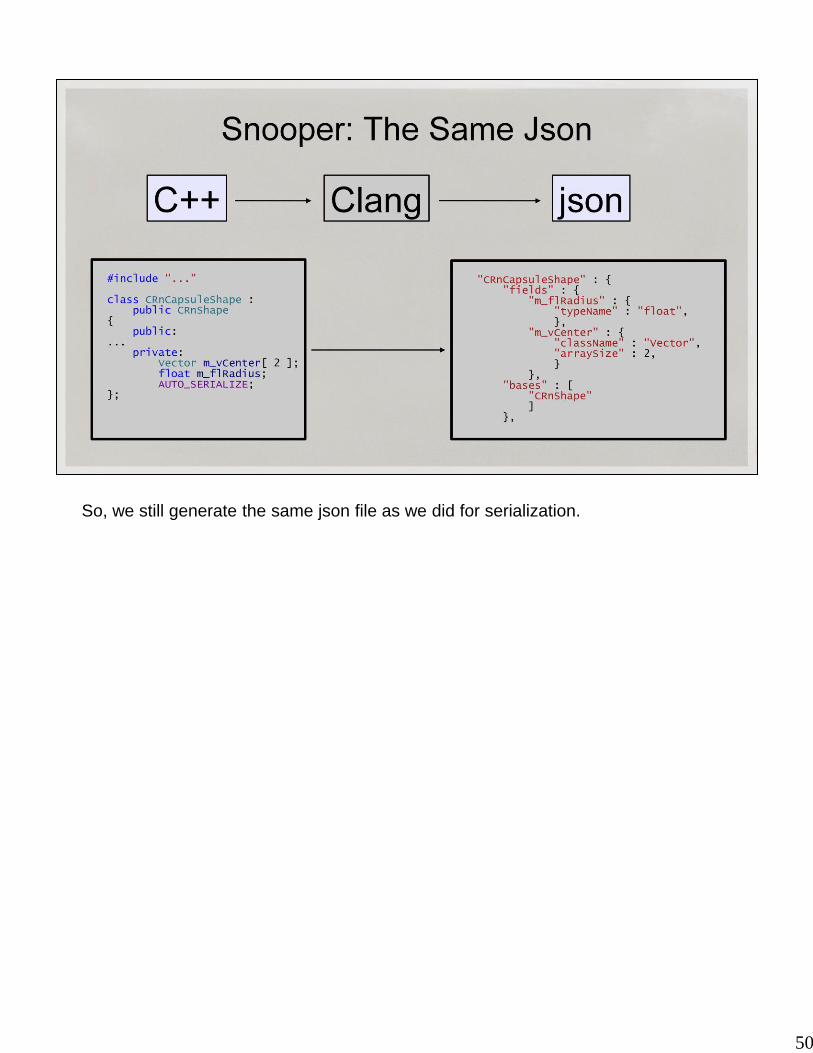
So, we still generate the same json file as we did for serialization.

51
The StringTemplate for the snooper looks like this. It's a different string template, but it's small. All my snoop code is generated from a 200-line template. These are a few of those lines. They auto-generate the code to snoop most classes in our physics engine.
You feed it the same json file as for the serializer. It spits out snooper C++ file. It's that simple.

52
This here is the template and the resulting generated C++ code for snooper. I'm snooping the whole struct into a local copy. Then I read out all the plain data
elements. All the non-plain data elements are recursively snooped by other overloaded Snoop
functions. The template is smart enough to know where I have arrays, templates, pointers to
follow and so on.

53
Just to bring the point home, here's how the full code parsing and
generation pipeline looks in our case
Parsing C++ is probably the most intimidating thing in this case. But after you spend a day or two learning Clang's API, you might find it rather intuitive.

54
Let's see a little demo of what we have as a result. I configured a projection-type solver of a chain of hinge joints. As you can see, small
chains solve fine, but larger chains start to break constraints. I wanted to see how the solver behaves inside the iteration loop. So I put a breakpoint where each joint is solved. After each breakpoint hits, I switch to the Testbed and snoop. I have two testbeds
here, one debugging the other. Notice that one is unresponsive – that's the one that I'm debugging. And another one acts like a watch window.
So what we have here effectively a visualization of the internal loop of a projection constraint solver.

55
Fixing stuff, whether it's yours or not, is unavoidable. At least if you make anything complex.
The faster you can drill down to details, the more efficient you are while debugging problems, the more time you spend developing and not fixing stuff. Once you make debugging 10x faster and more convenient, there's a quantum leap : you can develop features with complexity that would otherwise be infeasible to develop.
That's why it's important to make the process as seamless and convenient as possible. It pays with higher productivity in the end.
There are a few more technical details, though

56
Our Testbed is a tool for divide-and-conquer debugging. It makes it quick and painless.
For example, we have a collision filtering system, and time to time something is not colliding right in the game. We just fly around, click on objects that don't collide and drill down to their flags. In most cases we see exactly what's happening within seconds, and you don't have to be a programmer to do that.
Another example: we had an incredibly slow physics. It worked fine, but was very slow. All contacts looked correctly. So we snooped and clicked the objects that were awake. Their contacts looked fine. It took us some seconds to realize there were too many contacts on them.
57
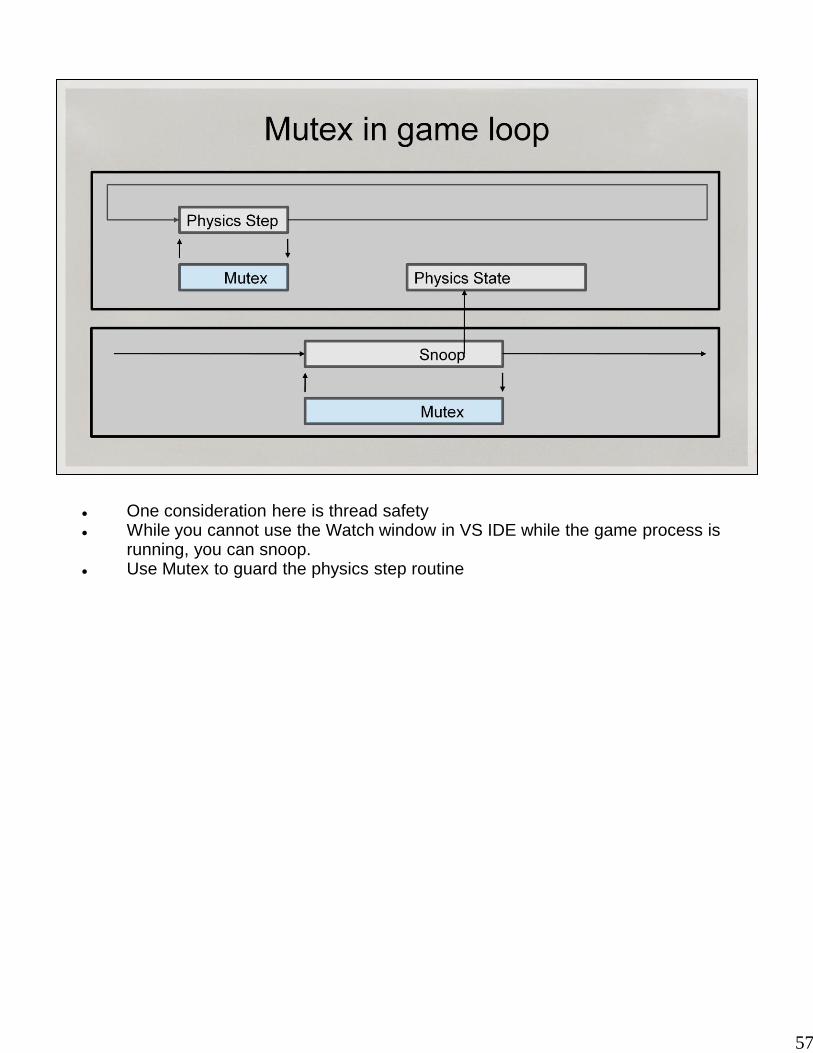
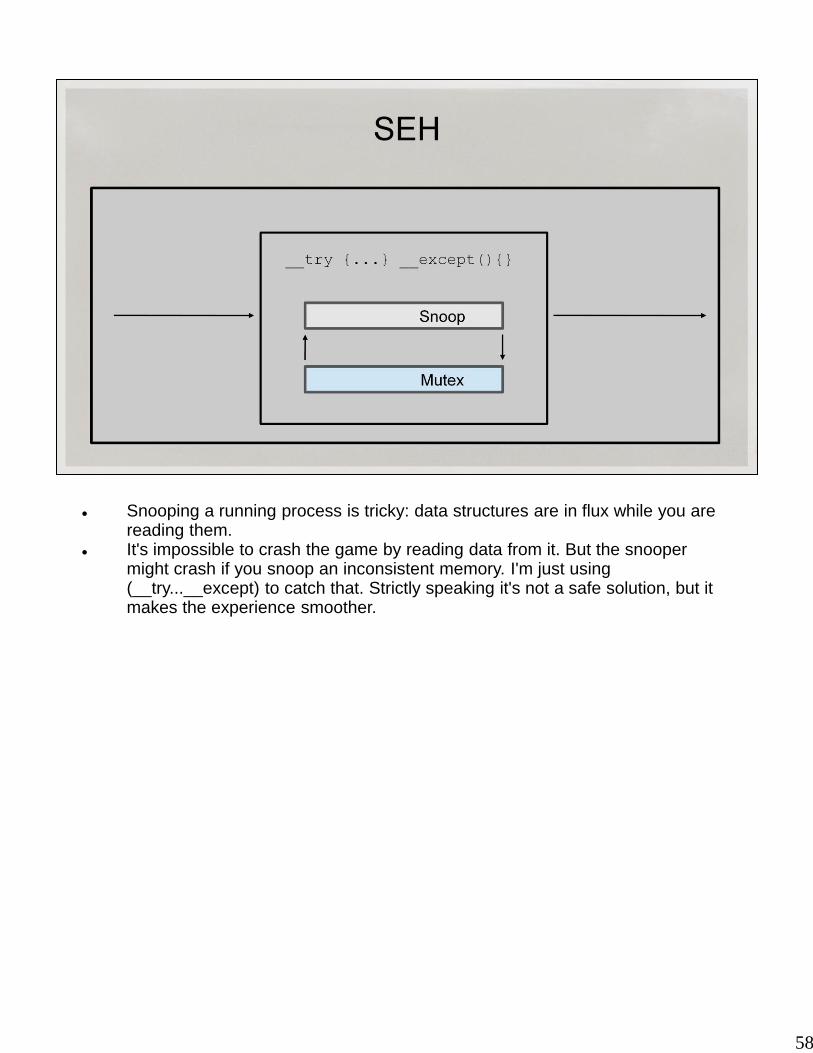
One consideration here is thread safety While you cannot use the Watch window in VS IDE while the game process is
running, you can snoop. Use Mutex to guard the physics step routine
58
Snooping a running process is tricky: data structures are in flux while you are reading them.
It's impossible to crash the game by reading data from it. But the snooper might crash if you snoop an inconsistent memory. I'm just using (__try...__except) to catch that. Strictly speaking it's not a safe solution, but it makes the experience smoother.

59
Just to be clear
Structured exception handling is not the same as C++ exception handling. This goes outside the topic of this talk. In any case, you don't really have to use either of these. I just find it nice to wrap my sloppy debugging tool code in case I happen to snoop
bad data structure. If I released it as a commercial product, I'd expend the extra effort to detect that
memory is unreadable and not crash.
60
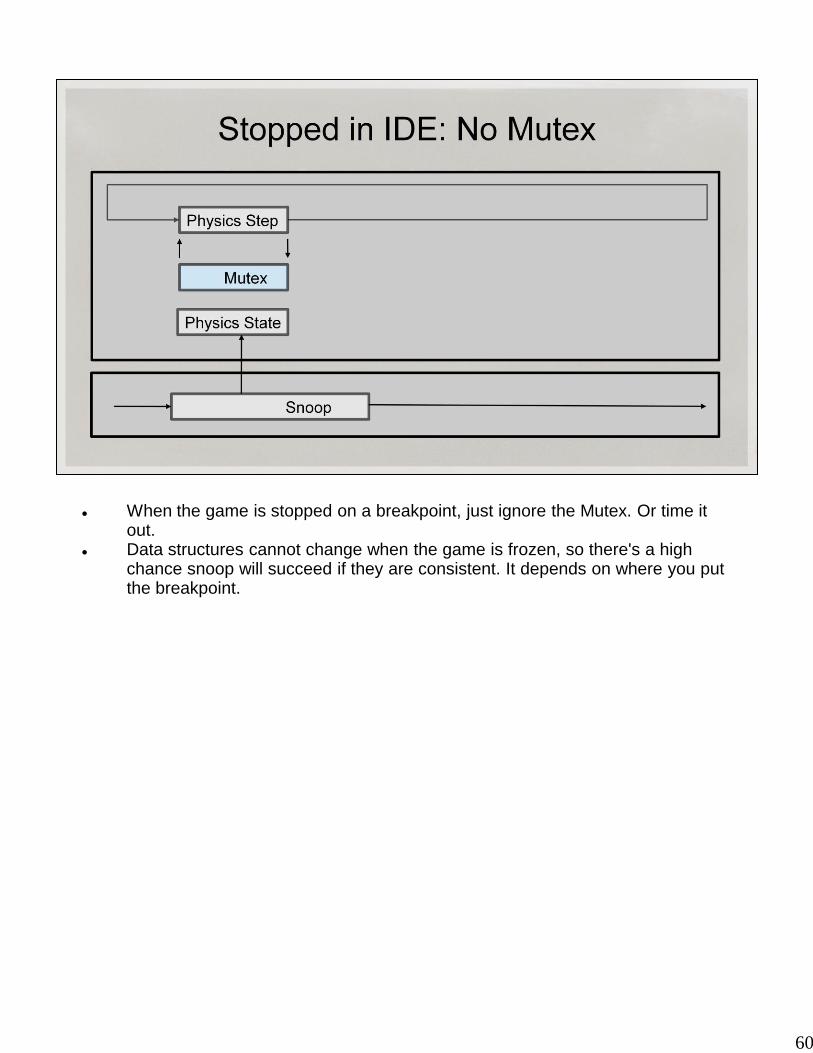
When the game is stopped on a breakpoint, just ignore the Mutex. Or time it out.
Data structures cannot change when the game is frozen, so there's a high chance snoop will succeed if they are consistent. It depends on where you put the breakpoint.

61
Sometimes we need some annotations to our code. E.g. for each pointer you serializer will need to know how many objects it's pointing to. It's easy to put this in (see the left slide).
And ot's easy to add and read those annotations in the parser ( see the right slide )

62
I'd like to talk about a couple of less trivial cases, like classes with Vtables. I auto-generate a function that creates an instance of each class with Vtable,
and copies its Vtable point into a known place (an array of uintptr_t). The snooper can then read the array and use it to recognize class type by its
vtable pointer. It's like RTTI that works across process boundaries.

63
This is how I generate that code with StringTemplates

64
And this is what the generated code looks like. One line is generated for every class with vtable. It’s done automatically, so you don’t have to remember to add a class to the list once you add a virtual .
You don’t have to remove a class when you remove the last virtual from it either.

65
For some data structures, it's just easier to write serialization code by hand. The code generator should know about leafy data types like int and float, and generate serialization code automatically. There's no problem with structures only consisting of those data types, those can be simply copied directly from another process address space.
It's a bit more involved with pointers. In general, C++ does not provide enough semantics for you to know if a pointer points to one object, or a vector of objects. I'm using clang annotation to add that semantics. So, the code generator looks at that annotation and computes the size of the array and serializes accordingly.
We don't use multiple heaps for our physics engine, but if you do, you'll have to provide semantics about how to allocate the snooped or unserialized data structures.
In strange cases, like an int that is a pointer, but the lower 2 bits have a special meaning, you probably want to write that routine by hand. Also when you have a union and have to run code to decide what it means.
You have a choice whether to make your code auto-generator smarter (and harder to maintain) or snoop a specific class manually. It's a judgement call.
66
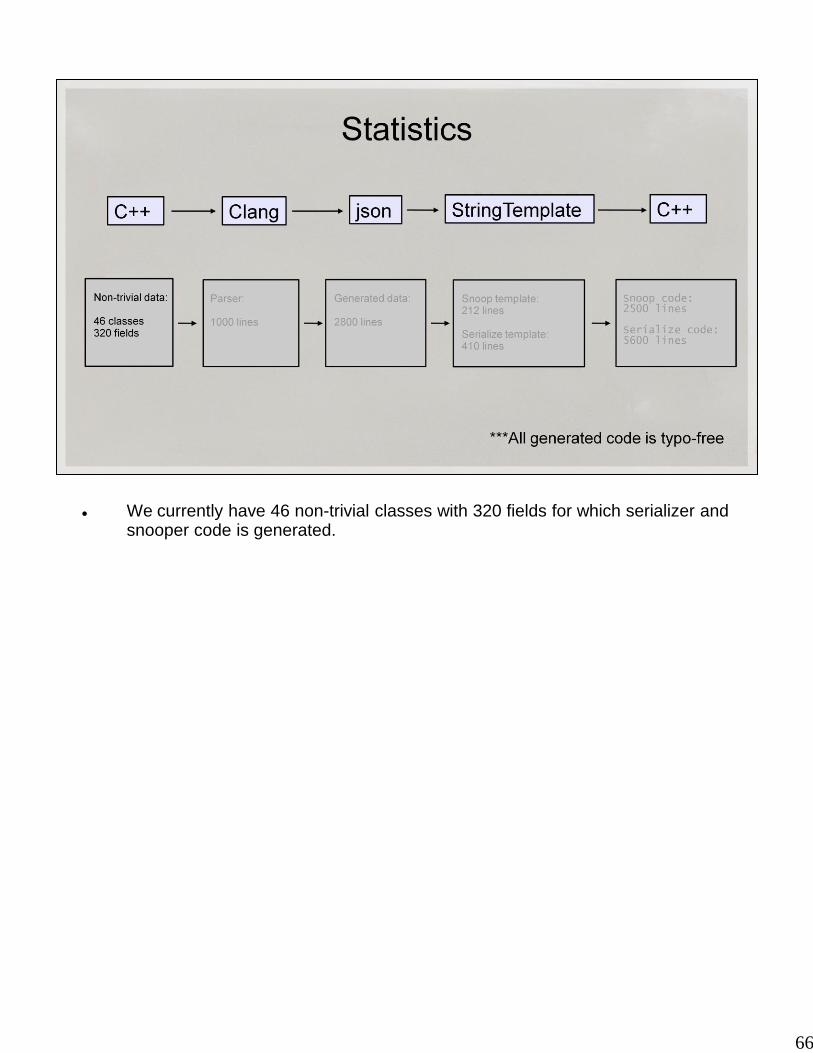
We currently have 46 non-trivial classes with 320 fields for which serializer and snooper code is generated.

67
The parser that uses clang is about 1000 lines long. I probably spent a couple of weeks part time writing it, and I've been using it for a year.

68
The generated json is 2800 lines long

69
Snooper template is 200 lineslong . Serializer template is 400 lines.

70
Auto-generated snooper is 2500 lines long. Serializer is 5600 lines long, because it includes 3 directions: serialize to
stream, unserialize from stream, count number of bytes used (very similar to Serialize, but actually counts allocated memory).
It takes 2-8ms to snoop a typical game frame, which is normally maybe 10 mb large
71
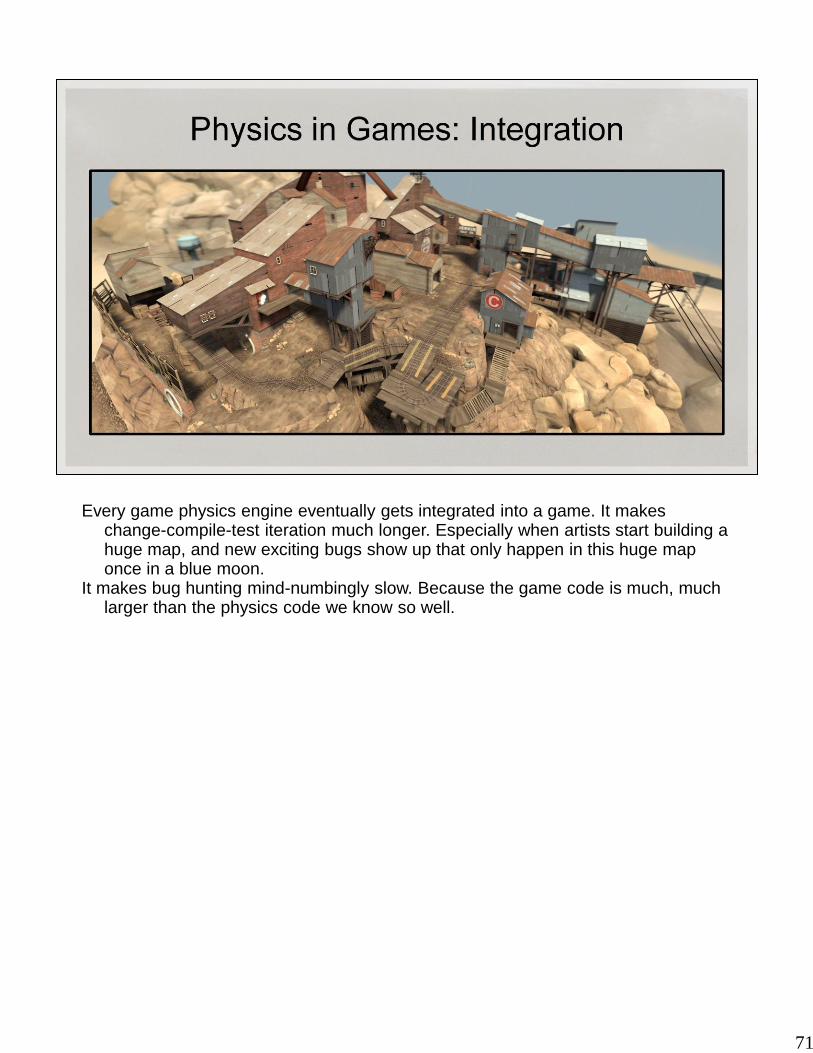
Every game physics engine eventually gets integrated into a game. It makes change-compile-test iteration much longer. Especially when artists start building a huge map, and new exciting bugs show up that only happen in this huge map once in a blue moon.
It makes bug hunting mind-numbingly slow. Because the game code is much, much larger than the physics code we know so well.

72
Game code is written by many people over many years. Physics engine is self-contained
and neat, almost miniature in comparison. At valve, the sheer amount of logic in the old game code with history is very large.

73
It's really easy to lose perspective when you work on physics for a long time. The ultimate goal of physics in a game is to make the game better. It's not to make the best
or fastest or true to life physics simulation. That is why in-game debugging and optimization is very important.
If the game wants to cast a lot of rays, we need to optimize that first. Games don't generally have stacks of cubes everywhere, so that's not the best benchmark for a game physics engine. It's best to put it in the game and debug and profile it in the game, if you want it to perform well in the game.

74
Run Generating_Nav Here's another example of an unexpected benefit of visualizing everything in physics engine. Testbed records and displays all traces. And left4dead navigation system does a lot of
traces. So, when connected to the game, Testbed visualizes an AI algorithm.

75
I suggest we can all spend a couple of weeks up front to make our life more comfortable and deliver a better product. Sometimes you can't do that, but generally if your time horizon is years, you can afford a couple of weeks.
What I'm describing is pretty general technique. Game physics is just an example, but it's usable in any complex software.

76
Eventually, I want my Visual Studio to look like this when I'm debugging. You can make a debugger extension with VS Extensibility, and I might make one
some day. But when I experimented with it, it was very inconvenient to write a VS extension of such complexity.

77
I hope everyone knows about autoexp.dat. It lets you visualize in text, so to say. I strongly suggest you just put all your data structures in there. Try to make them
more readable - in your Watch window. It helps a lot.

78
A word about organizing your data strucutres. It's most convenient to have a root object from which you can crawl all your data. I just gather all the globals in one object, and only publish a pointer to that one object
to the snooper. Physics will have some data structures. You'll parse and process them. You'll probably have some external pointers, like pointers to the vertex and index
buffers for debug drawing. You can write routines for snooping and serialization of those things manually

79
Another thought. Visualizing in an external app doesn't have to use ReadProcessMemory API.

80
All the leading physics engine have some sort of over-TCP/IP visualization. Unfortunately it doesn't work when the game is stopped in debugger, frozen or
crashed. Unless you stream your game state all the time, and that spends CPU. If you don't know where the problem is, and stream a lot of detailed data, it really takes a lot of CPU. And you have to remember to turn it on.
But it works on remote machine. So it's a viable option.
81
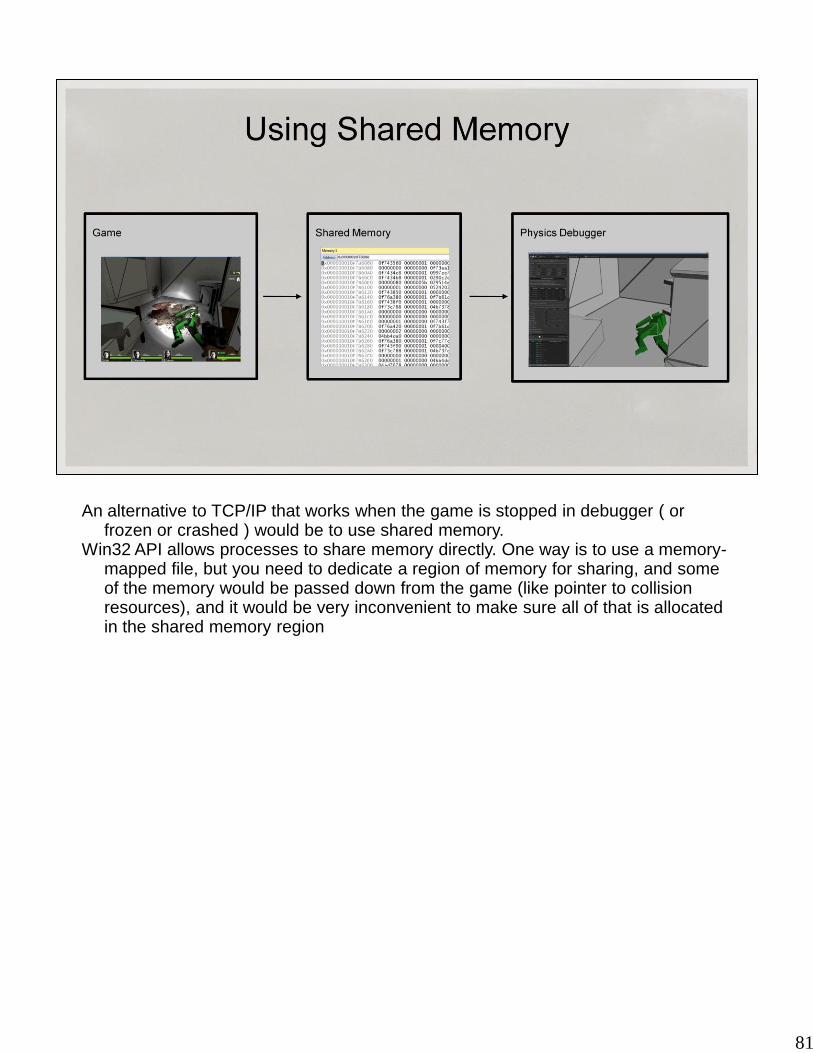
An alternative to TCP/IP that works when the game is stopped in debugger ( or frozen or crashed ) would be to use shared memory.
Win32 API allows processes to share memory directly. One way is to use a memory-mapped file, but you need to dedicate a region of memory for sharing, and some of the memory would be passed down from the game (like pointer to collision resources), and it would be very inconvenient to make sure all of that is allocated in the shared memory region

82
Hopefully we'll eventually be able to save/load/rewind the whole game with this
method. Our game code base is much bigger than physics engine though, so that's a lot of work.

83
We are using the same framework to generate serialize/unserialize code. Every time we change our data structures, we just re-run the parser/generator, and it's all updated
We serialize/unserialize a byte stream. But another variant would be e.g. to generate a reflected version of all your data, with indices instead of pointers. If you have reflection API, it will let you version the serialized data
84
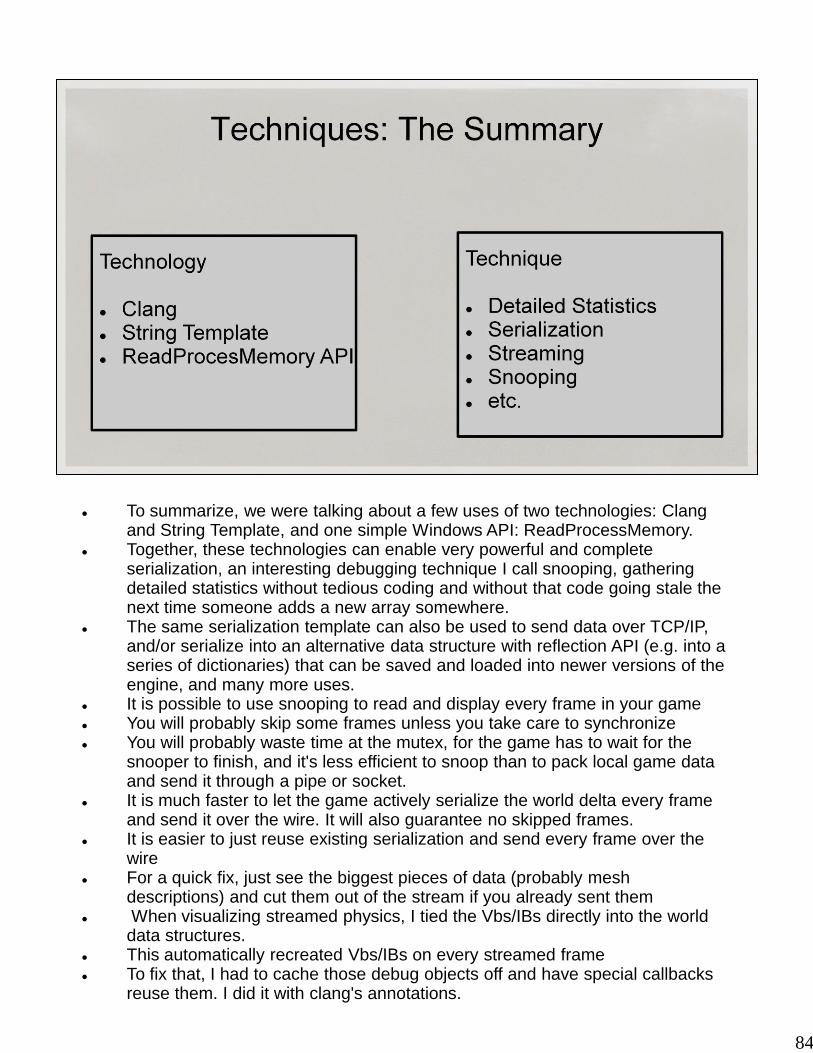
To summarize, we were talking about a few uses of two technologies: Clang and String Template, and one simple Windows API: ReadProcessMemory.
Together, these technologies can enable very powerful and complete serialization, an interesting debugging technique I call snooping, gathering detailed statistics without tedious coding and without that code going stale the next time someone adds a new array somewhere.
The same serialization template can also be used to send data over TCP/IP, and/or serialize into an alternative data structure with reflection API (e.g. into a series of dictionaries) that can be saved and loaded into newer versions of the engine, and many more uses.
It is possible to use snooping to read and display every frame in your game You will probably skip some frames unless you take care to synchronize You will probably waste time at the mutex, for the game has to wait for the
snooper to finish, and it's less efficient to snoop than to pack local game data and send it through a pipe or socket.
It is much faster to let the game actively serialize the world delta every frame and send it over the wire. It will also guarantee no skipped frames.
It is easier to just reuse existing serialization and send every frame over the wire
For a quick fix, just see the biggest pieces of data (probably mesh descriptions) and cut them out of the stream if you already sent them
When visualizing streamed physics, I tied the Vbs/IBs directly into the world data structures.
This automatically recreated Vbs/IBs on every streamed frame To fix that, I had to cache those debug objects off and have special callbacks
reuse them. I did it with clang's annotations.

85
Full-world serialization of this type includes everything, and has very high reliability. You don't have to worry about missing a thing or two: the parser/generator is unlikely to make a human error.
This is usable to dump suspicious game frames for later examination, or streaming them. When debugging later, it's very much like debugging in-game, but it's repeatable and much more convenient.
I don't like manual non creative work, and serialization code is always very low in creativity. Getting rid of it makes iteration faster and doesn't distract me from the creative process.
Among the drawbacks, this method is more complex to start using it. You can still use the old methods in parallel with this method.

86
Make work fun! It pays to do that.

87

88