physics, economics and ecology
DESCRIPTION
Sorin Solomon, Hebrew University of Jerusalem. Physics, Economics and Ecology. Boltzmann, Pareto and Volterra. Pavia Sept 8 , 2003. Franco M.Scudo (1935-1998). Lotka. Volterra. +. + c i. ( X.,t ) ) X i + j a ij X j. d X i = ( a i. Lotka. Volterra. Boltzmann. (. ). +. x. - PowerPoint PPT PresentationTRANSCRIPT

Physics, Economics and Ecology
Boltzmann, Pareto and Volterra
Pavia Sept 8 , 2003
Franco M.Scudo (1935-1998)
Sorin Solomon, Hebrew University of Jerusalem

+
d Xi = ( ai
Lotka Volterra
+ ci (X.,t)) Xi +j aij Xj

x+( )d Xi = (randi
Lotka Volterra Boltzmann
+ ci (X.,t)) Xi +j aij Xj

x+( )
= P(Xi) ~ Xi –1- d Xi
Lotka Volterra Boltzmann
Pareto
d Xi = (randi + c (X.,t)) Xi +j aij Xj
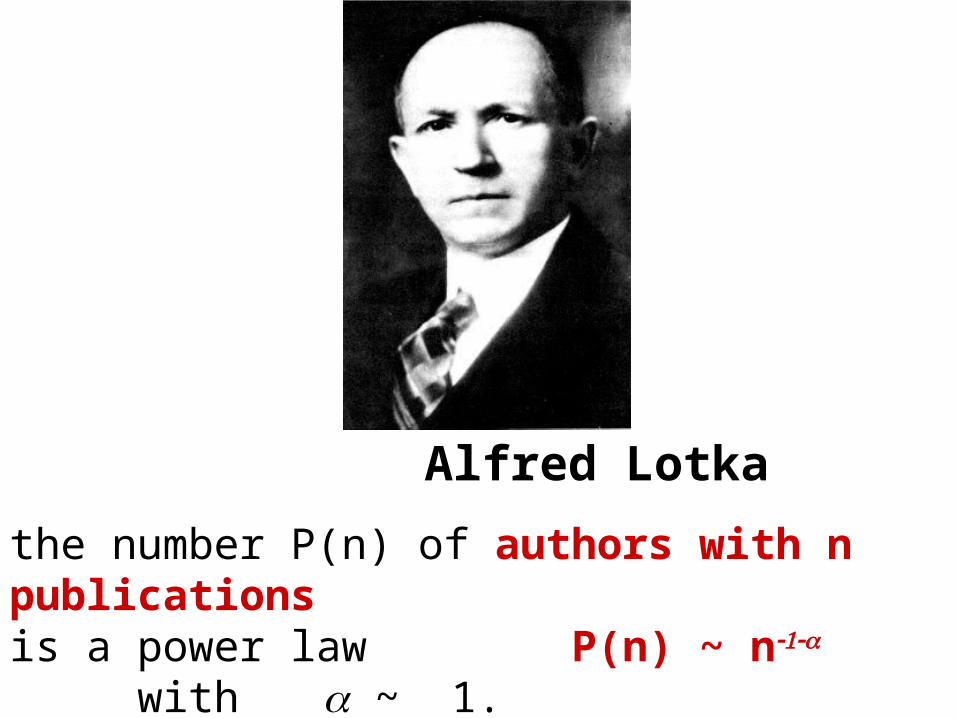
Alfred Lotka
the number P(n) of authors with n publications is a power law P(n) ~ n with ~ 1.

No. 6 of the Cowles Commission for Research in Economics, 1941.
HAROLD T. DAVIS
No one however, has yet exhibited a stable social order, ancient or modern, which has not followed the Pareto pattern at least approximately. (p. 395)
Snyder [1939]:
Pareto’s curve is destined to take its place as one of the great generalizations of human knowledge

d x= (t) x + P(x) dx ~ x –
1- d xfor fixed distribution with negative drift < ln > < 0
Not good for economy !

d x= (t) x + P(x) dx ~ x –
1- d xfor fixed distribution with negative drift < ln > < 0
Herbert Simon; intuitive explanation
Not good for economy !
d ln x (t) = (t) + lower bound
= diffusion + down drift + reflecting barrier

Boltzmann (/ barometric) distribution for ln x
P(ln x ) d ln x ~ exp(- ln x ) d ln x
~ x -1- d x
d x= (t) x + P(x) dx ~ x –
1- d xfor fixed distribution with negative drift < ln > < 0
Herbert Simon; intuitive explanation
Not good for economy !
d ln x (t) = (t) + lower bound
= diffusion + down drift + reflecting barrier

Can one
obtain stable power laws
in systems with variable growth rates
(economies with both recessions and growth periods) ?
Yes! in fact all one has to do is to recognize the statistical character of the
Logistic Equation

d Xi = (ai + c (X.,t)) Xi +j aij Xj
Montroll
almost all the social phenomena, except in their relatively
brief abnormal times obey the logistic growth.
Elliot W Montroll: Social dynamics and quantifying of social forces (1978 or so)

d Xi = (ai + c (X.,t)) Xi +j aij Xj
Volterra
Scudo
Lotka
MontrollEigen
almost all the social phenomena, except in their relatively
brief abnormal times obey the logistic growth.
Elliot W Montroll: Social dynamics and quantifying of social forces (1978 or so)

Stochastic Generalized Lotka-Volterra
d Xi = (rand i (t)+ c (X.,t) ) Xi +j aij Xj
for clarity take j aij Xj = a / N j Xj = a X

Stochastic Generalized Lotka-Volterra
d Xi = (rand i (t)+ c (X.,t) ) Xi +j aij Xj
Assume Efficient market: P(rand i (t) )= P(rand j (t) )
for clarity take j aij Xj = a / N j Xj = a X

Stochastic Generalized Lotka-Volterra
d Xi = (rand i (t)+ c (X.,t) ) Xi +j aij Xj
Assume Efficient market: P(rand i (t) )= P(rand j (t) )
=> THEN the Pareto power law P(Xi ) ~ X i –1-
holds with independent on c(w.,t)
for clarity take j aij Xj = a / N j Xj = a X

Stochastic Generalized Lotka-Volterra
d Xi = (rand i (t)+ c (X.,t) ) Xi +j aij Xj
Assume Efficient market: P(rand i (t) )= P(rand j (t) )
=> THEN the Pareto power law P(Xi ) ~ X i –1-
holds with independent on c(w.,t)
for clarity take j aij Xj = a / N j Xj = a X
Proof:

d Xi = (rand i (t)+ c (X.,t) ) Xi + a X
d X = c (X.,t) ) X + a X
Denote x i (t) = Xi (t) / X(t)
Then dxi (t) = dXi (t)/ X(t) + X i (t) d (1/X)
=dXi (t) / X(t) - X i (t) d X(t)/X2
= (randi (t) –a ) xi (t) + a
= [randi (t) Xi +c(w.,t) Xi + aX ]/ X
-Xi /X [c(w.,t) X + a X ]/X
= randi (t) xi + c(w.,t) xi + a
-x i (t) [c(w.,t) + a ] =

dxi (t) = (ri (t) –a ) xi (t) + a of Kesten type: d x= (t) x +
and has constant negative drift !
Power law for large enough xi : P(xi ) d xi ~ xi -1-2 a/D d xi
Even for very unsteady fluctuations of c; X

dxi (t) = (ri (t) –a ) xi (t) + a of Kesten type: d x= (t) x +
and has constant negative drift !
Power law for large enough xi : P(xi ) d xi ~ xi -1-2 a/D d xi
In fact, the exact solution is: P(xi ) = exp[-2 a/(D xi )] xi -1-2 a/D
Even for very unsteady fluctuations of c; X

Prediction:
=(1/(1-minimal income /average income)
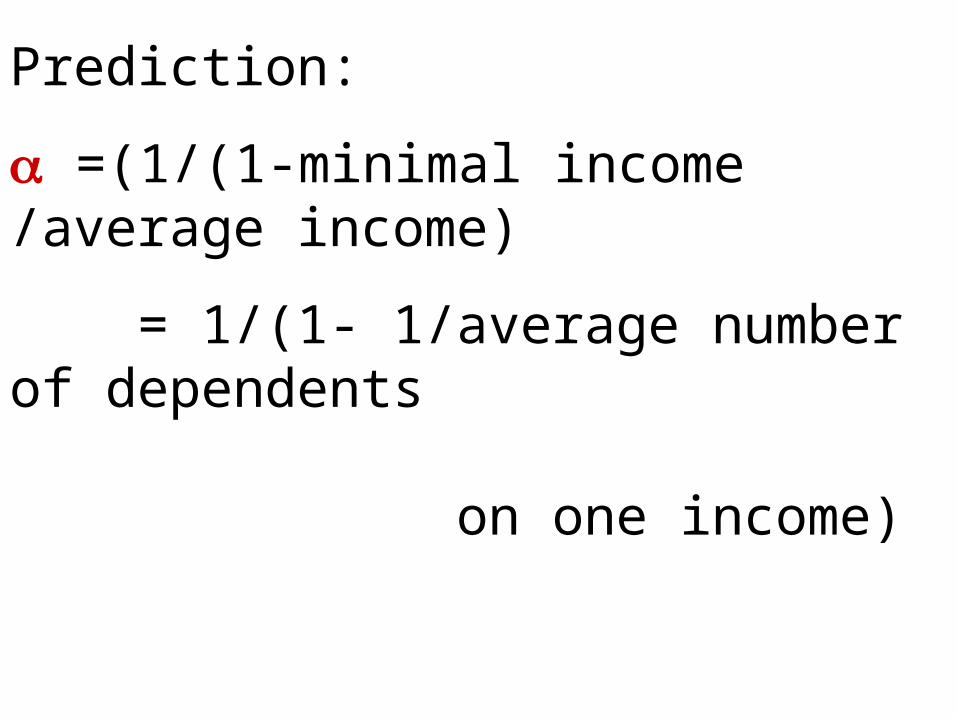
Prediction:
=(1/(1-minimal income /average income)
= 1/(1- 1/average number of dependents on one income)

Prediction:
=(1/(1-minimal income /average income)
= 1/(1- 1/dependents on one income)
= 1/(1- generation span/ population growth)

Prediction:
=(1/(1-minimal income /average income)
= 1/(1- 1/dependents on one income)
= 1/(1- generation span/ population growth)
3-4 dependents at each moment Doubling of population every 30 years minimal/ average ~ 0.25-0.33 (ok US, Isr)

Prediction:
=(1/(1-minimal income /average income)
= 1/(1- 1/dependents on one income)
= 1/(1- generation span/ population growth)
3-4 dependents at each moment Doubling of population every 30 years minimal/ average ~ 0.25-0.33 (ok US, Isr) => ~ 1.3-1.5 ; Pareto measured ~ 1.4

Inefficient Market:
Green gain statistically more (by 1 percent or so)
No Pareto straight line
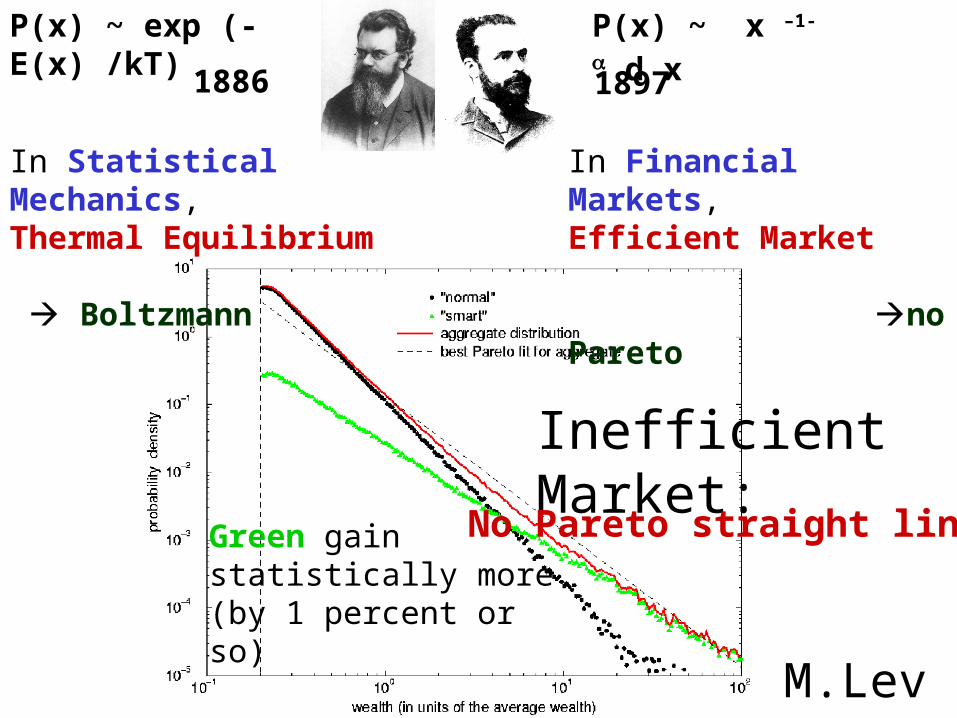
In Statistical Mechanics, Thermal Equilibrium Boltzmann
In Financial Markets, Efficient Market no Pareto
P(x) ~ exp (-E(x) /kT)
1886
P(x) ~ x –1- d x
1897
Inefficient Market:
Green gain statistically more (by 1 percent or so)
No Pareto straight line
M.Levy

Market Fluctuations
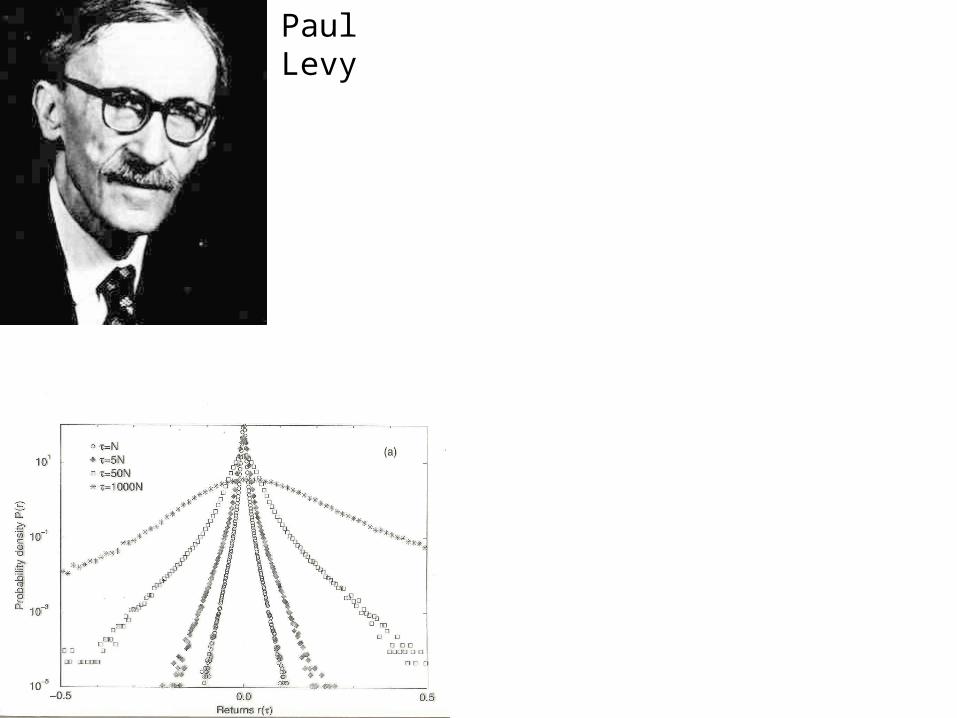
Paul Levy
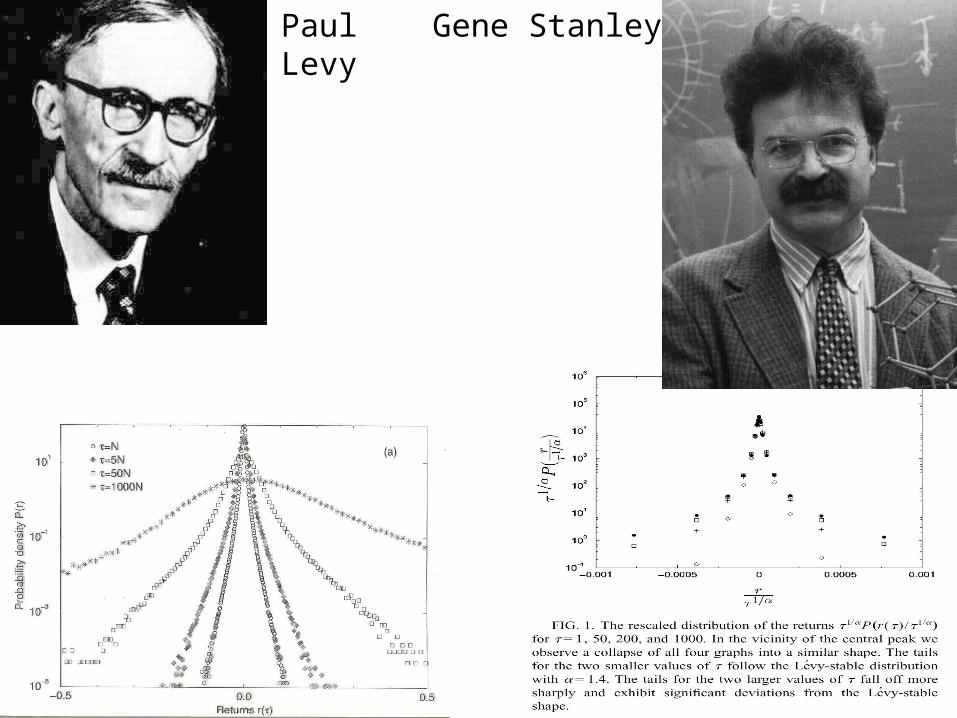
Paul Levy Gene Stanley

Paul Levy Gene Stanley
(see him here in person)

M. Levy
One more puzzle:
For very dense (trade-by-trade) measurements
and very large volumes the tails go like 2

One more puzzle:
For very dense (trade-by-trade) measurements
and very large volumes the tails go like 2
Explanation:
Volume of trade = minimum of ofer size and ask size
P(volume > v) = P(ofer > v) x P(ask >v)
= v –2
P(volume = v) d v = v –1-2 d v as in measurement

Conclusion
The 100 year Pareto puzzle
Is solved
by combining
The 100 year Logistic Equation of Lotka and Volterra
With the 100 year old statistical mechanics of Boltzmann