physics-based reliability simulation of dental fillings · physics-based reliability simulation of...
TRANSCRIPT
39
AMO - Advanced Modeling and Optimization, Volume 18, Number 1, 2016
Physics-based reliability simulation of dental fillings
Osama M. Al-Habahbeh1, Ameen S. Khraisat2, Mohannad A. Jaber3, Tamer H. Ibrahim4, Ahmad Mousa5
1, 3, 4, 5 Department of Mechatronics Engineering, School of Engineering, The University of Jordan, 11942,
Amman, Jordan, 1Corresponding author, [email protected], Tel: +962(0)6-5355000.
[email protected], [email protected], [email protected]
2Department of Conservative Dentistry, School of Dentistry, The University of Jordan, 11942, Amman, Jordan,
Abstract
Developing new dental filling materials is an elaborate process. It is desirable to reduce the time and
cost required to develop and test such materials. This work introduces a simulation tool that helps in
testing the reliability of the filling before introducing actual models. That means all necessary
modifications can be easily accomodated during the simualtion phase. Finite element modeling (FEM)
is used to analyze the stress on the dental filling within the tooth. Thermal and structural loads result in
normal, shear, and equivalent stresses. The stress results are used to find the fatigue life of the filling.
Performing systmatic iterations of this process yields a probability density function (PDF) of the
filling life. This PDF is used to calculate the reliability of the filling. A sensitivity analysis is
conducted to identify the major factors affecting reliability. After being verified using previous studies
on Amalgam-type filling, the presented method can be used to simulate the reliability of any filling
design or material. By using this method, We can find how reliable will the filling be after a given life
span. On the other hand, for a given reliability level, we can find the expected life of the filling.
Keywords: Amalgam filling, Physics-based reliability simulation, Stress life, Filling reliability,
Finite element modeling
1. Introduction
Dental caries is the most common type of tooth disease which occur on the chewing surface of the
teeth. Dentists treat the tooth by removing the decayed tooth material with a drill and replacing it with
a filler material. In order to improve the servicability of these fillings, new designs and materials with
AMO - Advanced Modeling and Optimization. ISSN: 1841-4311
40
Osama M. Al-Habahbeh, Ameen S. Khraisat, Mohannad A. Jaber, Tamer H. Ibrahim, Ahmad Mousa
better performance are constantly being sought after. To enhance the testing and verification process
of these new fillings, various methods to estimate their life were proposed; [Gonzaga et al., 2011]
determined experimentally the slow crack growth and Weibull parameters of five dental ceramics.
[Lavelle, 1976] estimated the durability of amalgam restorations using a cross-sectional survey based
on 6000 defective restorations spanning a 20-year period. His data showed that amalgam restorations
were not as durable as traditionally assumed, with failure on the part of the dental surgeon being the
pre-dominant defect. [Qvist et al., 1986] made a survey of the reasons for replacement of amalgam
restorations in Denmark. Resaons included failed restorations, bulk fracture of fillings, and loss of
fillings. The age of the restorations replaced ranged from 0 to 38 years. In these studies, no
quantitative reliability information were provided.
Finite element method has been used successfully to study the stress in teeth as well as in fillings;
[Wright and Yettram, 1978] presented a finte element stress analyses of an amalgam restoration. They
examined the effects of amalgam setting and thermal expansion on principal stresses and deformation.
However, as in other FEM simulations, filling reliability was not addressed. In this work, FEM is used
to study the failure of the filling, as well as its expected life and reliability. By doing so, more
quantitative information will be available linking the filling life span with its reliability, where the
latter decreases as life increases. This means there is no clear-cut life span of the filling, but rather
gradual deterioration as age progresses. This work estimates the reliability of dental filling (amalgam)
used in the treatment of tooth decay. FEM is used to analyze the stress on the dental filling within
thetooth. The stress result is used to find the fatigue life of the filling. Performing systmatic iterations
of this process results in a PDF of life. This PDF is used to evaluate the reliability of the filling.
A representative design of the filling is built inside the tooth. The filling model represents the
physical and thermal properties of the actual filling.Pressure and thermal loads are imposed on the
filling resulting in structural and thermal stresses. The expected service life of the filling is calculated
based on the stress level. Accodring to stress-life theory and the S-N curve, damage is expected to start
at the end of the filling useful life. The FEM and stress-life models are verified using experimental
results available in the literature. The model is subjected to the same conditions and loads that are
41
Physics-based reliability simulation of dental fillings
normally imposed. The stochastic nature of the dimensions, physical properties, and environmental
conditions will result in a stochastic response as well. The effects of the different input variables will
be compared based on a sensitivity study. Then the major effective parameters will be identified and
used in the stochastic simulation. The process will result in the reliability assessment of the dental
filling.
2. Filling FEM Model
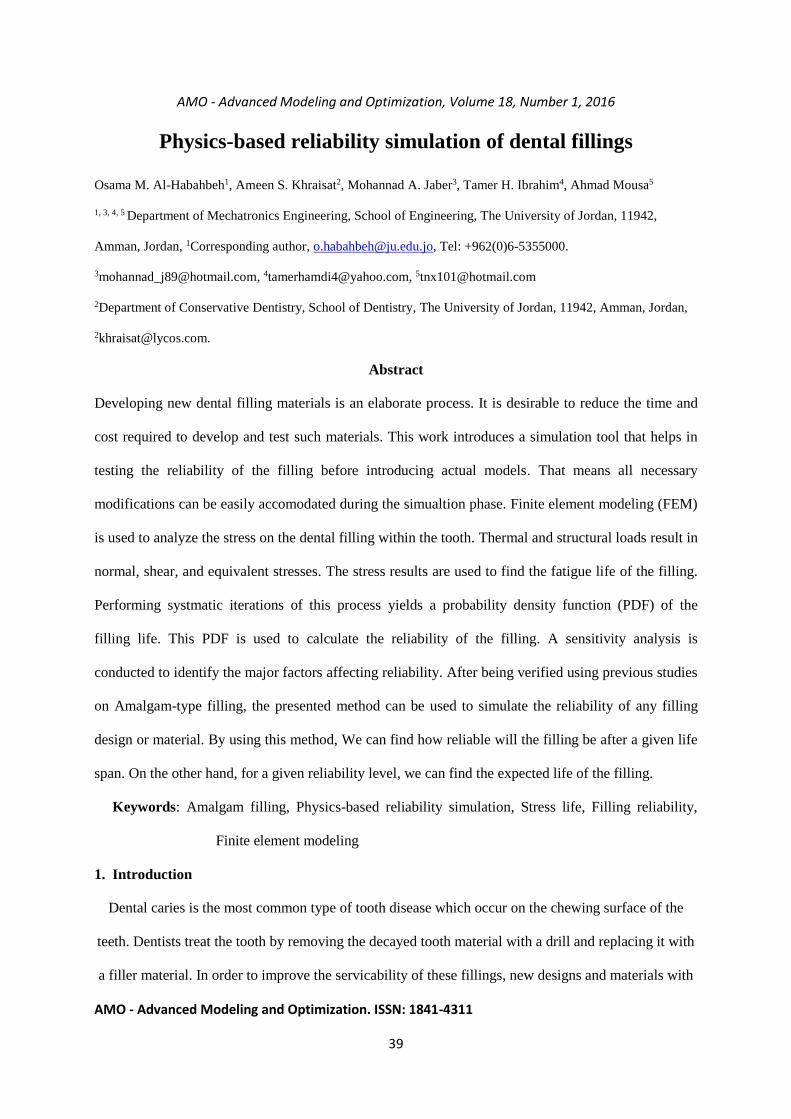
A commonly used type of filling called Dental amalgam is used in this work. The geometry of the
filling is shown in Fig. 1. As there are a good amount of data on this amalgam, it is used to verify the
proposed filling reliability simulation method. After being verified, the method can be used to
determine the reliability of other filling materials. The tooth model consists of the top Enamel and the
lower Dentin parts, while the filling is positioned in the tooth as shown in Fig. 1.Table 1 shows the
thermal and mechanical properties of the filling, while the physical properties of the filling are shown
in Table 2. The physical and thermal properties of the tooth are shown in Table 3. The model
geometry shown in Fig. 1 is meshed as shown in Fig. 2. Pressure and thermal loads are applied on this
meshed model, which has 55,000 elements.
Figure 1: Filing design inside the tooth
42
Osama M. Al-Habahbeh, Ameen S. Khraisat, Mohannad A. Jaber, Tamer H. Ibrahim, Ahmad Mousa
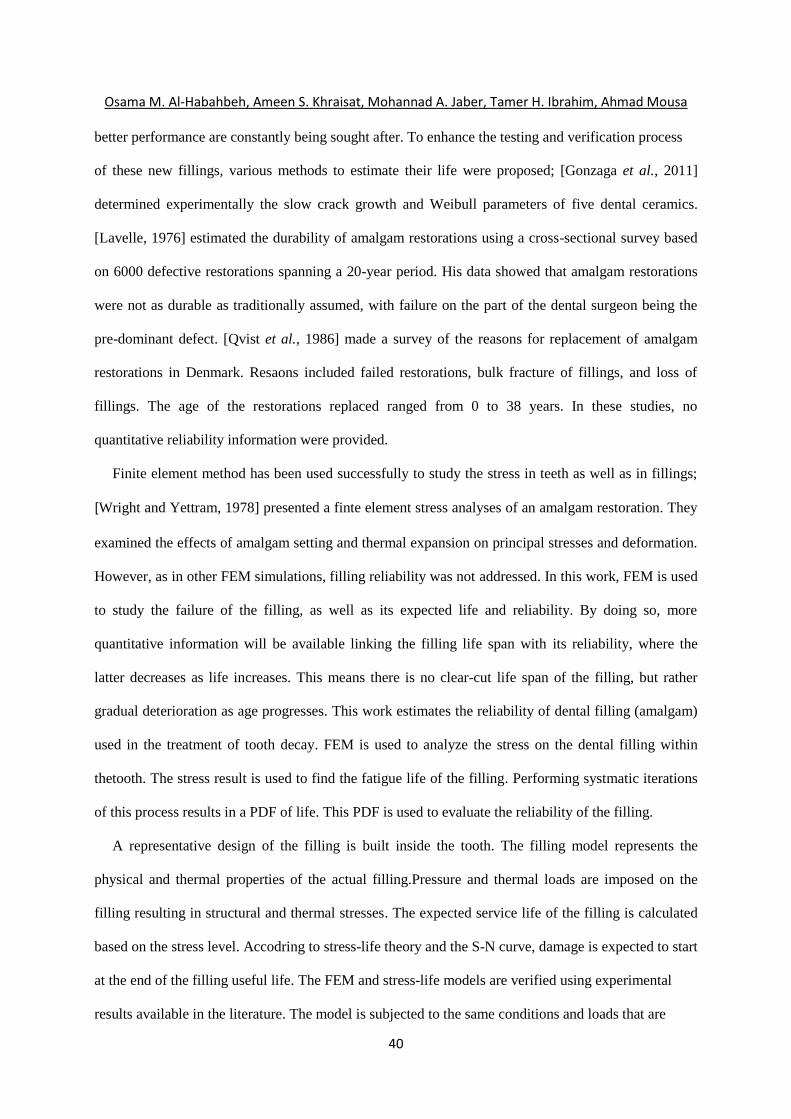
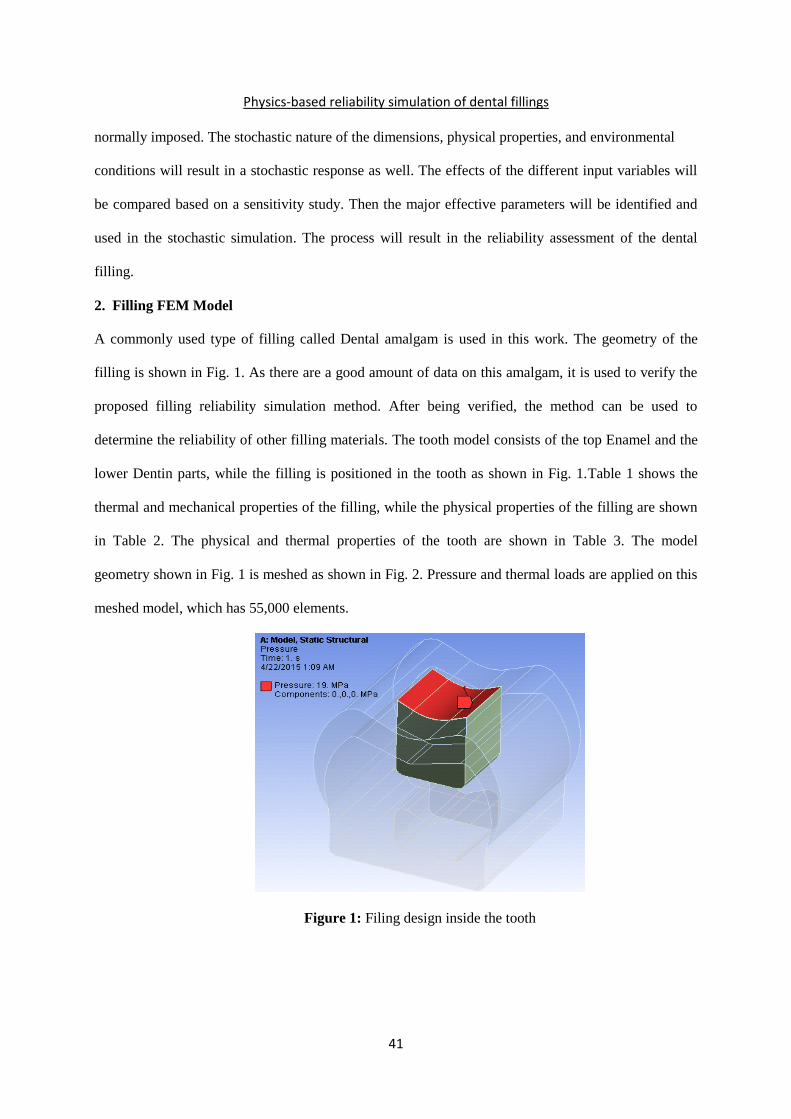
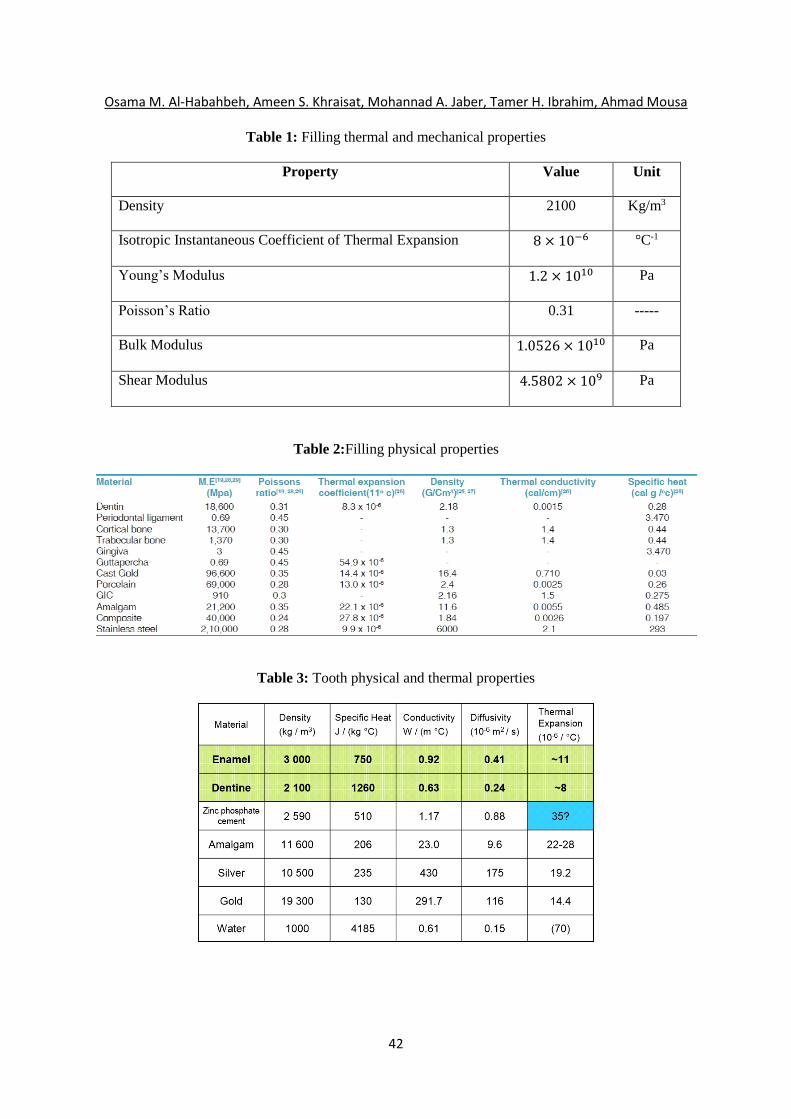
Table 1: Filling thermal and mechanical properties
Property Value Unit
Density 2100 Kg/m3
Isotropic Instantaneous Coefficient of Thermal Expansion 8 × 10⁻⁶ °C-1
Young’s Modulus 1.2 × 10¹⁰ Pa
Poisson’s Ratio 0.31 -----
Bulk Modulus 1.0526 × 10¹⁰ Pa
Shear Modulus 4.5802 × 10⁹ Pa
Table 2:Filling physical properties
Table 3: Tooth physical and thermal properties

43
Physics-based reliability simulation of dental fillings
Figure 2: FEM Mesh of the filling and the tooth
3. Simulation of the Filling FEM Model
The purpose of the FEM simulation is to find the maximum stress on the dental filling. The procedure
presented by [Al-Habahbeh et al. 2009] is used to find the maximum transient stress. Typically, the
stress results from exposure to bite pressure and food/drink temperature. The types of applied loading
include structural and thermal loads. The structural load is further classified into normal and shear
loading. Average temperature experienced by the tooth is 15-55°C, therefore, temperature is increased
from 15-55°C in increments of 5°C. Since the average human bite pressure is typically between 19 and
29MPa, [Vallee and Benoit, 2010], pressure values of 19, 24, and 29MPa are examined. Full factorial
design (FFD) is used to simulate the loading so as to cover all possible scenarios, [Batra and Jaggi,
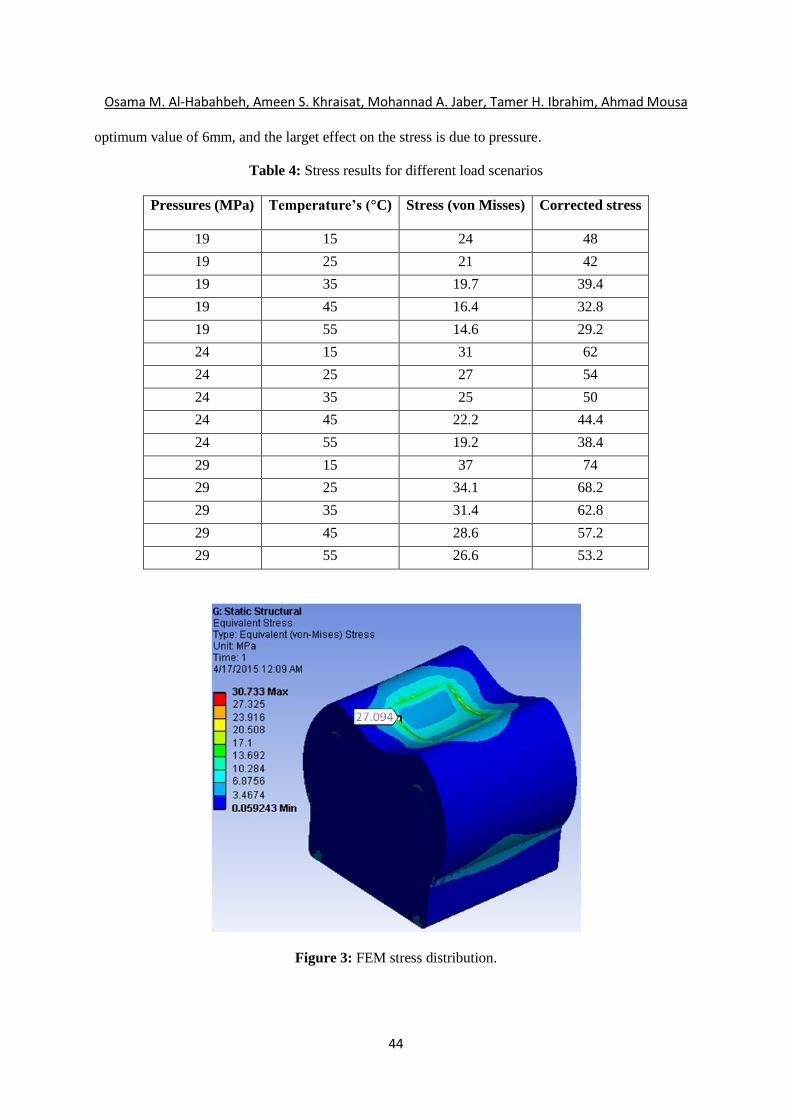
2015]. Von Mises stress is calculated to find the resulting loading on the filling. Table 4 lists the stress
values resulting from the simulation, as well as the effect of the fatigue correction factor [Al-
Habahbeh, 2009]. Fig. 3 shows the thermal and structural stress countours on the filling and the tooth.
It is noted that maximum stress occures at the border of the tooth and the filling.
In order to study the relative impact of the various input parameters affecting the reliability. Fig. 4
shows the sensitivity of the maximum shear stress to pressure and filling depth. The pressure is varied
from 19-29MPa, while the filling depth is varried from 3-7mm. It is noted that the filling depth has an
44
Osama M. Al-Habahbeh, Ameen S. Khraisat, Mohannad A. Jaber, Tamer H. Ibrahim, Ahmad Mousa
optimum value of 6mm, and the larget effect on the stress is due to pressure.
Table 4: Stress results for different load scenarios
Pressures (MPa) Temperature’s (°C) Stress (von Misses) Corrected stress
19 15 24 48
19 25 21 42
19 35 19.7 39.4
19 45 16.4 32.8
19 55 14.6 29.2
24 15 31 62
24 25 27 54
24 35 25 50
24 45 22.2 44.4
24 55 19.2 38.4
29 15 37 74
29 25 34.1 68.2
29 35 31.4 62.8
29 45 28.6 57.2
29 55 26.6 53.2
Figure 3: FEM stress distribution.

45
Physics-based reliability simulation of dental fillings
Figure 4: Sinsitivity response chart
4. Filling Stress-Life Analysis
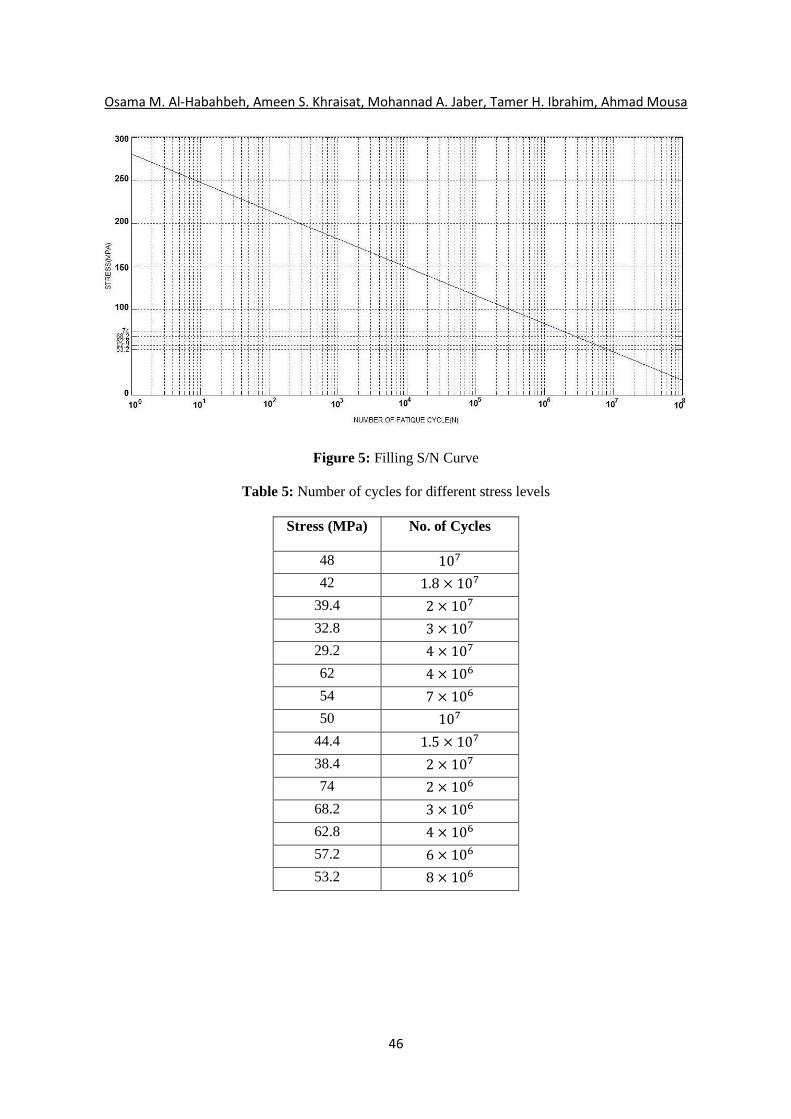
Stress-life method is used to estimate the faigue life of the filling model. For this purpose, the S-N
curve of the filling shown in Fig. 5 is used in conjunction with the stress results. Table 5 lists life
values for the applied stress. As an example, for an assumed daily loading of 2000 cycles, and using
Table 5, 107 total life-time cycles divided by 2000 daily cycles is equal to 5000 days, or 13.7 years.
This is the approximate life span of the dental amalgam filling, which is only 7% away from previous
studies performed by [Animated-teeth, 2015].
5. Filling Reliability Simulation
Reliability is the probability that a structure will last a specified time under specified conditions. Mean
time to failure (MTTF) is the mean time to the first failure under specifiedconditions.The results of the
filling fatigue life are represented in the histogram shown in Fig. 6. Using the information in this
figure, the Probability Density Function (PDF) and the Cumulative Distribution Function (CDF) of the
reliability can be drawn.
46
Osama M. Al-Habahbeh, Ameen S. Khraisat, Mohannad A. Jaber, Tamer H. Ibrahim, Ahmad Mousa
Figure 5: Filling S/N Curve
Table 5: Number of cycles for different stress levels
Stress (MPa) No. of Cycles
48 107
42 1.8 × 10⁷
39.4 2 × 10⁷
32.8 3 × 10⁷
29.2 4 × 10⁷
62 4 × 10⁶
54 7 × 10⁶
50 107
44.4 1.5 × 10⁷
38.4 2 × 10⁷
74 2 × 10⁶
68.2 3 × 10⁶
62.8 4 × 10⁶
57.2 6 × 10⁶
53.2 8 × 10⁶
47
Physics-based reliability simulation of dental fillings
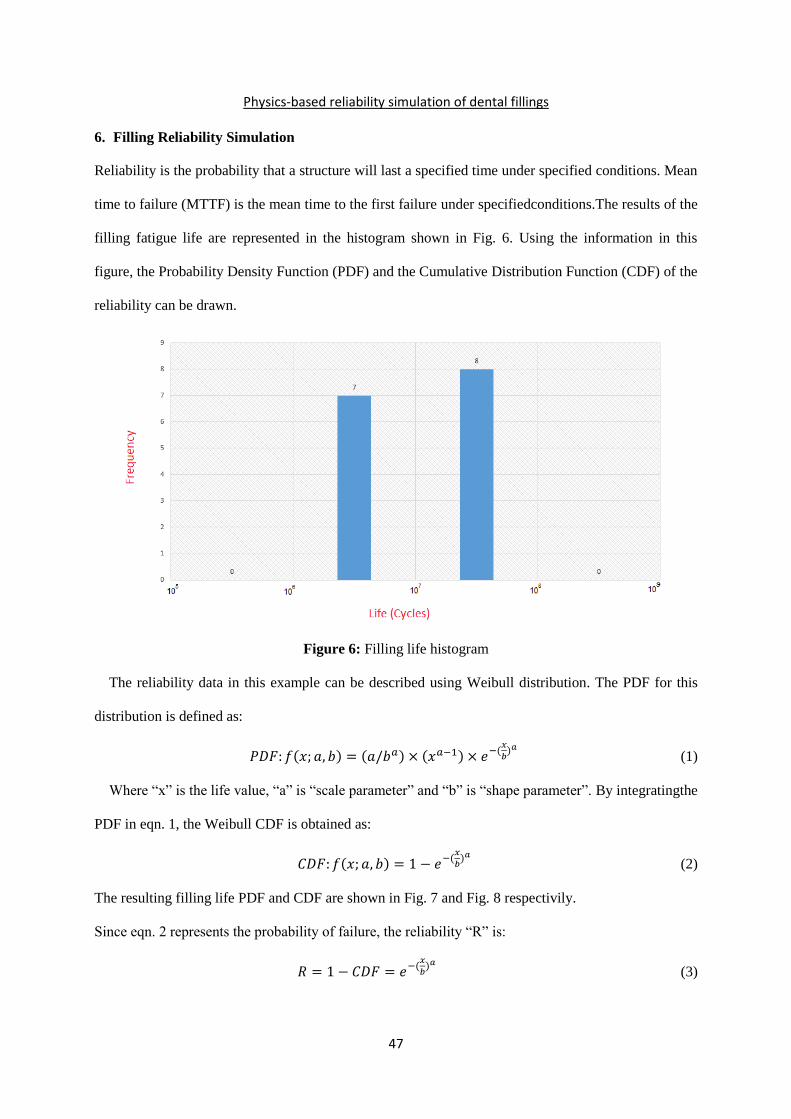
6. Filling Reliability Simulation
Reliability is the probability that a structure will last a specified time under specified conditions. Mean
time to failure (MTTF) is the mean time to the first failure under specifiedconditions.The results of the
filling fatigue life are represented in the histogram shown in Fig. 6. Using the information in this
figure, the Probability Density Function (PDF) and the Cumulative Distribution Function (CDF) of the
reliability can be drawn.
Figure 6: Filling life histogram
The reliability data in this example can be described using Weibull distribution. The PDF for this
distribution is defined as:
𝑃𝐷𝐹: 𝑓(𝑥; 𝑎, 𝑏) = (𝑎/𝑏𝑎) × (𝑥𝑎−1) × 𝑒−(𝑥
𝑏)𝑎
(1)
Where “x” is the life value, “a” is “scale parameter” and “b” is “shape parameter”. By integratingthe
PDF in eqn. 1, the Weibull CDF is obtained as:
𝐶𝐷𝐹: 𝑓(𝑥; 𝑎, 𝑏) = 1 − 𝑒−(𝑥
𝑏)𝑎
(2)
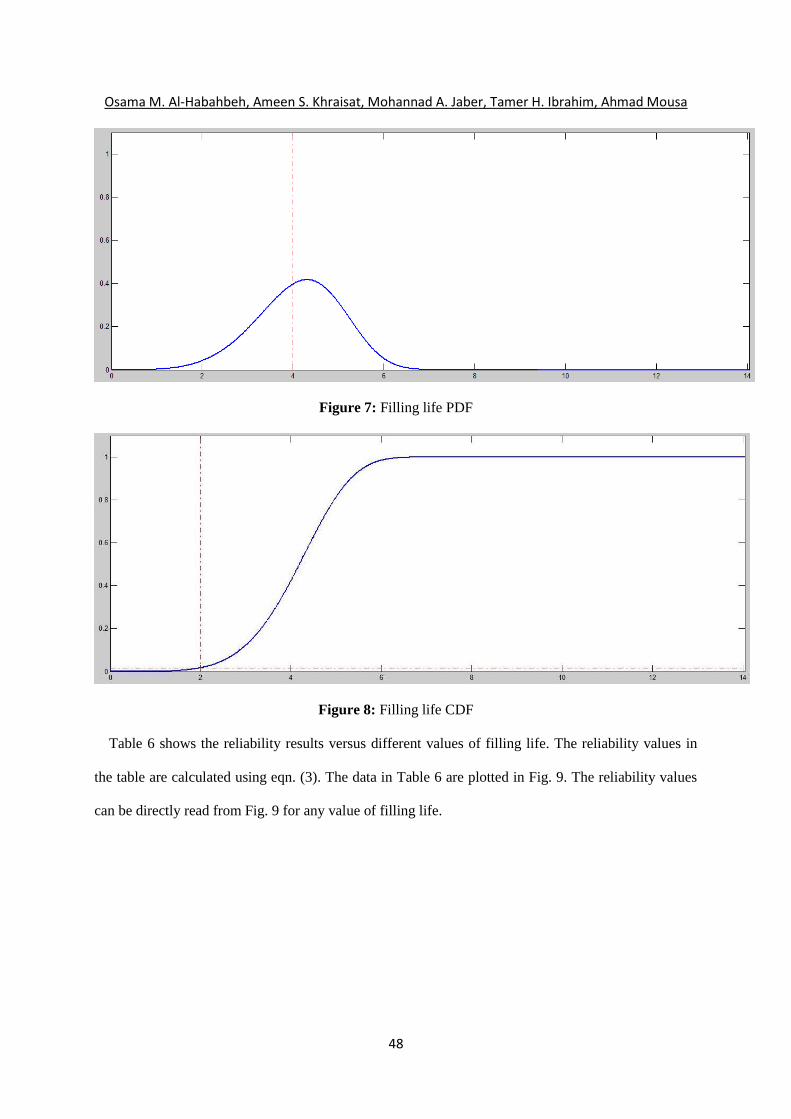
The resulting filling life PDF and CDF are shown in Fig. 7 and Fig. 8 respectivily.
Since eqn. 2 represents the probability of failure, the reliability “R” is:
𝑅 = 1 − 𝐶𝐷𝐹 = 𝑒−(𝑥
𝑏)𝑎
(3)
48
Osama M. Al-Habahbeh, Ameen S. Khraisat, Mohannad A. Jaber, Tamer H. Ibrahim, Ahmad Mousa
Figure 7: Filling life PDF
Figure 8: Filling life CDF
Table 6 shows the reliability results versus different values of filling life. The reliability values in
the table are calculated using eqn. (3). The data in Table 6 are plotted in Fig. 9. The reliability values
can be directly read from Fig. 9 for any value of filling life.

49
Physics-based reliability simulation of dental fillings
Table 6: Reliability for different life values
No. Life (Cycles) Probability of Failure (%) Reliability (%)
0 105 0 100
1 505 0.054 99.9
2 1005 1.7 98.3
3 5005 12.3 87.7
4 1,0005 45.9 54.1
5 5,0005 81.6 18.4
6 10,0005 98.5 1.5
7 50,0005 99.9 0.1
8 100,0005 100 0
Figure 9: Filling reliability vs. life
6. Discussion and Conclusion
The expected life of a dental amalgam filling is found to be between 106 and 108 cycles. This is in
agreement with previous work. By converting this life duration into years, the average life span of the
filling is approximately 12-13 years. The final reliability result shown in Fig. 9 is an excellent tool to
determine the expected life of the filling under investigation. We can find how reliable will the filling
be after a given life span. On the other hand, for a given reliability level, we can find the expected life
span of the filling. A sinsitivity study revealed that, in terms of reliability, the filling depth has an
optimum value of 6 mm. However, other factors do affect the depth of the filling such as the extent of

50
Osama M. Al-Habahbeh, Ameen S. Khraisat, Mohannad A. Jaber, Tamer H. Ibrahim, Ahmad Mousa
tooth decay.
The proposed reliability estimation tool can be used to simulate the reliability of any filling material
simply by changing the properties of the filling in the FEM simulation program, then following the
same numerical steps shown earlier. Moreover, the tool can be helpful in designing new fillings; By
reducing the time and cost required to develop and test the new design or material. Actual models can
only be introduced after the success of their reliability models. That means all necessary modifications
can be easily accomodated during the simualtion phase.The proposed tool can be further expanded by
adding other life prediction methods such as strain-life or crack growth methods.
References
Al-Habahbeh, O.M., (2009) Integrated Approach for Physics-Based Reliability Assessment of
Engineering Systems. PhD Dissertation, Department of Mechanical and Aeronautical Engineering,
Clarkson University.
Al-Habahbeh, O.M., Aidun, D.K., Marzocca, P., and Lee, H., (2009) Integrated approach for life
prediction of thermo-fluidic systems. AMO-Advanced Modeling and Optimization, vol.11, nr. 4,
pp.449-471.
Animated-teeth, http://www.animated-teeth.com/tooth-bonding/a9-white-composite-fillings.htm.
Batra, P.K., and Jaggi, S., (2015) Factorial Experiments. Indian agricultural statistics research
institute, New delhi, Researchgate.
Gonzaga, C.C., Cesar, P.F., Miranda Jr., W.G., and Yoshimura, H.N., (2011) Slow crack growth and
reliability of dental ceramics. J Dental Materials, vol.27, pp.394-406.
Lavelle, C.L.B., (1976) A cross-sectional longitudinal survey into the durability of amalgam
restorations. J Dentistry, vol.4, nr. 3, pp.139-143.
Qvist, V., Thylstrup, A., and Mjör, I.A., (1986) Restorative treatment pattern and longevity of
amalgam restorations in Denmark. Acta Odontologica Scandinavica, vol.44, nr. 6, pp.343-349.
Vallee, G.E., and Benoit, R.P., (2010) Translating dental performance into engineering science within
a senior capstone design project. Proceedings of the American Society for Engineering Education
(ASEE) Northeast Section Conference, Boston, MA.
51
Physics-based reliability simulation of dental fillings
Wright, K.W.J., and Yettram, A.L., (1978) Finite Element Stress Analysis of a Class I Amalgam
Restoration Subjected to Setting and Thermal Expansion. J Dental Research, vol.57, nr. 5, pp.715-
723.