physics 15b lab 3: magnetic fields and inductionscphys/courses/15b/2008/15b_3.pdf · physics 15b...
TRANSCRIPT

Physics 15b Lab 3: Magnetic Fields and Induction
In Chapter 5, Purcell uses relativity to derive the force acting between two moving charges, given the forces and charge densities in a stationary frame. The velocity dependent component of the force on a moving charge is associated with the magnetic field. In Chapter 6 the magnetic field is discussed in more detail. Faraday’s Law of induction presented in Chapter 7, the principle that underlies the inductor which is the third lumped circuit element along with the capacitor that was studied in Lab 1 and the Resistor that was considered in Lab 2. One application of inductors is the removal of unwanted high frequency components from a signal, a result that you can understand by considering section 7.9. A major application of inductors is resonant (tuned) circuits that pick out particularly frequencies preferentially, such as radio tuners. The physics underlying this latter application is discussed in great detail in Chapter 8. The highest constant magnetic fields that we are able to produce on Earth are less than 100 Tesla and they are obtained using currents flowing in superconducting magnets. Permanent magnets have peak magnetic fields < 1 Tesla (0.2-0.5 Tesla is typical for strong magnets). Using normal current carrying wires it is difficult to achieve peak fields above 0.1 T. Purcell shows in Chapter 11 that the fields of thin disk magnets are similar to the fields due a current spool flowing around the outer edge of the disk. See for example figures 11.7 and 11.8. Thus, we will use permanent magnets to generate large magnetic fields and model the fields using the expressions derived in Chapter 6 of Purcell for current loops that follow the outside of the magnets.
Pre-lab Questions:
1. Consider a long straight wire with a wire spool with length L and width w. Let a current ISpool flowing through it. Let the spool be adjacent to a long straight wire with a current Iwire flowing through it, as shown in the figure below. Is the top of the loop attracted to the wire? Is the bottom of the loop attracted to the wire? If

the spool is centered on the wire, what is the force on the spool due to the wire? (Hint: see Purcell equation 7’ in Chapter 6. How is this related to the force on the wire due to the spool? If the wire has 6 amps flowing through it, what is the force on the spool if the spool current is 10000 A, and L=4 cm , W=5 mm, and d= 3 mm? Bonus: What is the force if the spool is rotated 90 degrees? Bonus: Recast your solution in the reference frame where the electrons flowing in the wire are stationary.
2. Consider a circuit with consisting of a battery with potential difference V and a
resistor with resistance R. What is the energy energy/time lost to the circuit? Does it increase or decrease with R?
3. Figure 6.18 shows the magnetic field due to a finite solenoid with a radius r. The field lines in the image above correspond to a similar finite solenoid, with a wire loop shown in red where the axis of the wire loop is parallel to the axis of the solenoid. Let the solenoid be mounted on a pendulum that swings back and force in front of a wire loop. Sketch the induced EMF as a function of time in a wire loop when the pendulum moves the solenoid over the spool at a velocity v, where the axis of the solenoid is parallel to the axis of the spool. Let the spool have a radius r and be separated from the face of the solenoid by a distance s>>r. Please note, you do NOT need to do a calculation, a qualitative sketch is all that is required. Does the EMF depend on the resistance of the spool? Bonus: Sketch the EMF for the case where the wire spool has a radius much greater than the

radius of the solenoid. Bonus: When the magnet is moving toward the center of the wire loop, does the induced current in the wire loop result in a magnetic field that adds to or subtracts from the field generated by the magnet? Would this induced field correspond to a magnet aligned or anti-aligned with the permanent magnet? Is the magnet attracted toward or repelled from the center of the loop? Answer the same question for the case where the magnet is moving away from the loop. Bonus: Sketch the EMF for the case where s<<r. Bonus:
4. If the voltage difference across a wire spool with resistance R is given by Vo Cos[w t], what is the time dependent current flowing in the wire? What is the phase difference between the current and the magnetic field generated by the current? What is the phase difference between the driving voltage Vo Cos[wt], and magnetic field flux due to the driving voltage? If a second wire spool is right next to the first, so the magnetic field flux through both loops is the same, what is the EMF induced in the second loop due to the time changing current in the first loop? Does this induced EMF increase or decrease with increasing frequency? Bonus: If the loops each have an area A, what is the analytical expression for the induced EMF?
5. Consider a pair of identical wire spools attached to a solid substrate as shown in the figure below, where the green background is the substrate. Let a wire current carrying wire run on top of the two spools. What is the net force on substrate? What is the torque on the substrate?
Bonus: Consider the setup described above with the addition of two more wires centered on the substrate and at the same height as the first wire. Let the second wire have a 60 degree angle with respect to the first wire. Let the third wire have a 120 degree angle with respect to the first wire. Explain how you could use time dependent currents in the three wires to make the substrate rotate.
6. If energy can be stored in the magnetic field of an inductor just as well as in the electric field of a capacitor, why aren’t inductors often used for energy storage or memory? Bonus: Apart from magnetic storage, do magnetic fields play any role in your daily life?
Bonus: If the magnetic field at a center of a wire ring with a 1 inch radius is 0.2 Tesla, how much current is flowing in the ring? (Hint: See equation 42 of Chapter 6 in Purcell). Bonus: What is the approximate inductance of a wire coil with a diameter of 3 mm, and 100 turns of wire? The coil can be approximated by a single wire spool with 100 times the current that actually flows through the coil.
Lab Goals:

1. Improve understanding of the velocity dependent component of the Lorentz force. 2. Improve understanding of Faraday’s Law 3. Experience oscilloscope based measurement. 4. Present a simplified model of an electrical motor.
The magnet arrays are assembled for you, please do NOT disassemble them. All of the experiments use the arrays in their existing configurations. No modification is required.
1. Lorentz Force
Materials: Digital scale; current carrying wire; permanent magnet array; electrostatic voltage source; compass
Apparatus Assembly Directions
a. Choose the magnet array where all of the magnets are poled in the same direction.
i. The letter N is attached to the north face of each magnet. b. Place the magnet array on the digital scale. A photograph of the magnets on
the scale is shown above, and a schematic is shown at left in the second row. i. The light blue line shows the current loop that would produce almost
the same magnetic field as the magnet arrays ii. Pass a compass across the face of the array and note the magnetic field
direction.

c. Align the wire attached to the plastic so that it is centered on the six magnet array
i. A photograph of the wires and the plastic tube are shown on the right in the top row.
d. Zero the digital scale e. Close the switch to run current through the wire f. Measure and record the mass shown on the scale. Convert the “mass”
measurement to force. Move the wire up and down along the face of the magnets. Is the wire attracted to the top edge of the magnets? Is it attracted toward the bottom face? Is this result consistent with your mass measurement?
g. Open the switch again h. Calculate the effective current for the magnet array. Note the magnetic
field due to the permanent magnets is equivalent to the field for a wire spool with the same width and length as the magnet array. Compare your result to the answer to Prelab question 1.
i. Rotate the magnet array so that north faces are pointing up, as shown in the
diagram on the left above. j. Measure and record the force exerted on the scale. k. Open the switch again l. Explain your result. Compare with theory.
i. Bonus: Rotate the magnet array so the long direction is vertical, as shown in the figure in the center above.
ii. Measure and record the force exerted on the scale. iii. Open the switch again iv. Explain your result. Compare with theory. v. Remove the array of six aligned magnets and replace them with the
array of six magnets that alternate direction (This arrangement is used as a magnetic mirror in atomic physics)
1. The corresponding schematic is shown on the right in the second row.
vi. Pass a compass across the array and note the magnetic field direction. vii. Zero the digital scale
viii. Close the switch to run current through the wire

ix. Measure and record the force exerted on the scale. x. Open the switch again
xi. Explain your result. Compare with theory. A magnetic force microscope uses the force on a magnetic prove to determine the spatial structure of magnetic objects. If you slide the wire loop across the alternately poled magnet array when it is in the vertical position, you can make a primitive magnetic force microscope measurement.
2. Faradays law
a. Electrostatic Damping Experiment Materials: Pendulum with a permanent magnet mounted in it ; two 1 inch diameter wire spools with 100 turns each and red and black labeled leads; one 2.5 cm diameter wire spool with 100 turns; 100 Ohm resistor; alligator clips; wire spool holder
Apparatus Assembly Directions
a. Assemble the wire spool holder so it contains only one 1 inch wire spool. b. Align the magnet on the pendulum with the wire spool as shown above
i. Make the faces parallel ii. Align the centers
iii. Make the separation between the magnet and the spool 1 to 2 mm c. Make sure there is no electrical connection between the two leads to the spool
i. A circuit diagram is shown on the left in the image below

d. Start the pendulum
i. Lift the pendulum so that the center of the magnet is 20 cm from the center of the spool
ii. Release the pendulum and allow the pendulum to swing for 1 minute e. Measure oscillation height at the end of one minute f. Make an electrical connection that shorts the leads
i. Use a micrograbber patch cord like those shown in the image on the far right above to short the two leads to the wire coil
ii. The circuit diagram for this connection is shown in the center above. g. Start the pendulum
i. Lift the pendulum so that the center of the magnet is 20 cm from the center of the spool
ii. Release the pendulum and allow the pendulum to swing for 1 minute h. Measure oscillation height at the end of one minute i. Make a new electrical connection that adds a 100 Ohm resistance in series
i. Detach the micrograbber connected to the red lead on the spool ii. Connect this micrograbber to one lead of a 100 Ohm resistor
iii. Connect one end of a second micrograbber patch cord to the other lead of the 100 Ohm resistor.
iv. Connect the other end of this second patch to the red lead on the spool v. This circuit is shown in the circuit diagram on the right in the image
above. j. Start the pendulum
i. Lift the pendulum so that the center of the magnet is 20 cm from the center of the spool
ii. Release the pendulum and allow the pendulum to swing for 1 minute k. Measure oscillation height at the end of one minute
Is the EMF across the wire spool the same in all three cases the first time that the magnet passes across the wire spool? What case has the highest current flow? What case has the highest transfer of kinetic energy to heat? Give an expression for the energy loss in terms of VEMF, the induced voltage, and R the total resistance of the circuit. Does the energy loss increase or decrease with R? Bonus: Describe the damping in terms of the attraction between two magnets, where second “magnet” is due to the current induced in the wire loop by the motion of the real magnet.(Hint: think about Lenz’ Law) b. Measuring Induced EMF due to a magnet on a pendulum
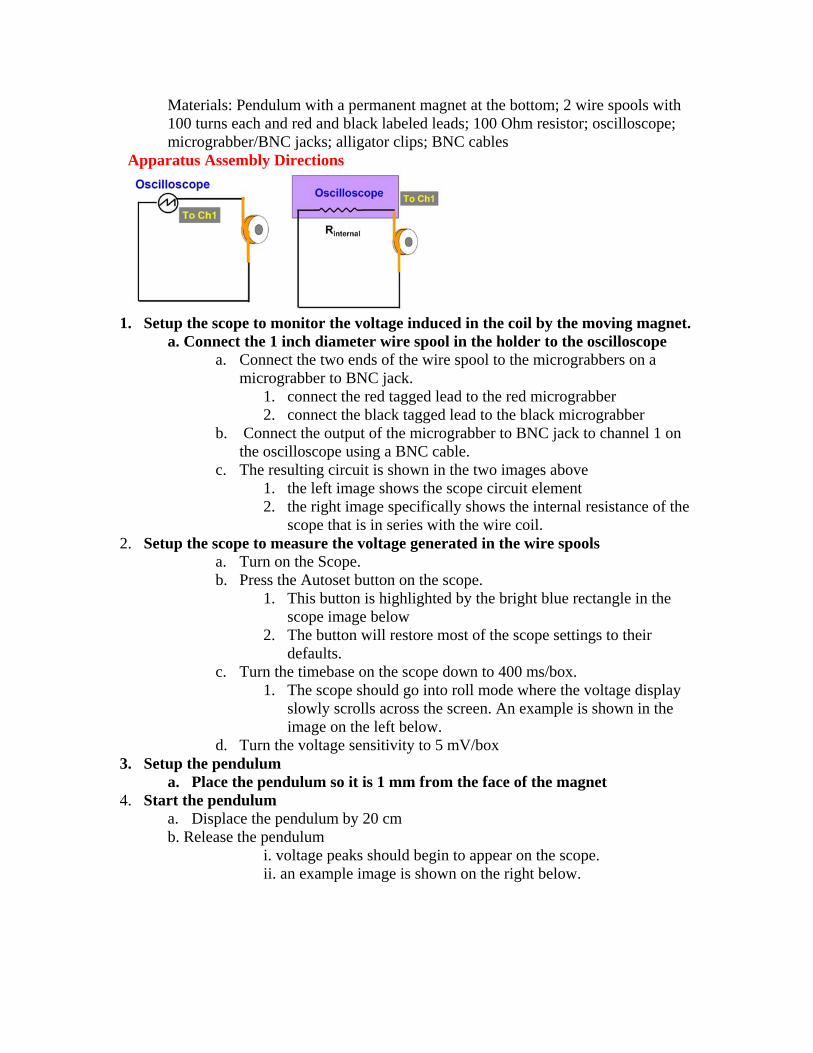
Materials: Pendulum with a permanent magnet at the bottom; 2 wire spools with 100 turns each and red and black labeled leads; 100 Ohm resistor; oscilloscope; micrograbber/BNC jacks; alligator clips; BNC cables
Apparatus Assembly Directions
1. Setup the scope to monitor the voltage induced in the coil by the moving magnet.
a. Connect the 1 inch diameter wire spool in the holder to the oscilloscope a. Connect the two ends of the wire spool to the micrograbbers on a
micrograbber to BNC jack. 1. connect the red tagged lead to the red micrograbber 2. connect the black tagged lead to the black micrograbber
b. Connect the output of the micrograbber to BNC jack to channel 1 on the oscilloscope using a BNC cable.
c. The resulting circuit is shown in the two images above 1. the left image shows the scope circuit element 2. the right image specifically shows the internal resistance of the
scope that is in series with the wire coil. 2. Setup the scope to measure the voltage generated in the wire spools
a. Turn on the Scope. b. Press the Autoset button on the scope.
1. This button is highlighted by the bright blue rectangle in the scope image below
2. The button will restore most of the scope settings to their defaults.
c. Turn the timebase on the scope down to 400 ms/box. 1. The scope should go into roll mode where the voltage display
slowly scrolls across the screen. An example is shown in the image on the left below.
d. Turn the voltage sensitivity to 5 mV/box 3. Setup the pendulum
a. Place the pendulum so it is 1 mm from the face of the magnet 4. Start the pendulum
a. Displace the pendulum by 20 cm b. Release the pendulum
i. voltage peaks should begin to appear on the scope. ii. an example image is shown on the right below.

Meaning of the scope display
Channel 1, which is shown in yellow, displays the EMF across the wire spool as a function of time.
5. Begin data acquisition
a. Once you see a signal, increase the time base to 4 ms/box b. Decrease the voltage sensitivity until voltage peaks are visible on
screen. 1. An example is shown on the left above.
c. Freeze the signal on the scope. i. Press the Run/Stop button
ii. The button is highlighted by the green rectangle in the image on the right above. Pressing the button will freeze the frame.
iii. Press the button again, and normal data acquisition will resume d. Send the scope display to the computer
i.. Open Safari web browser ii. Type in scope IP address: 192.168.15.15 i. Right-click image of scope screen and choose "Save Image to
the Desktop". 1. This saves the image as a PNG file that can easily be
inserted into documents. Explain the qualitative features of the EMF vs time by describing the relationship between the position of the magnet with respect to the coil and the measured EMF. What is the relationship between the frequency of the EMF signal and the frequency of the pendulum? Why is the EMF vs time the same

regardless of the direction of that the pendulum is moving? Does the EMF amplitude change gradually over many oscillations? Explain the origin of the change.
Bonus: Reverse the leads on the micrograbber 1. Connect the red micrograbber to the wire lead to which the
black micrograbber had been connected 2. Connect the black micrograbber to the wire lead to which the
red micrograbber had been connected. 3. Record the EMF and compare the result with the previous
result. Explain any differences. What is the period of the pendulum? What is the velocity of the pendulum at the position where the magnet passes across the center of the coil if the pendulum started at a displacement of 20 cm? ( Hint: The position of a pendulum as a function of time is approximately harmonic, so it is give by xo Cos[w t], where xo is the initial position of the pendulum when it is at rest and w is the angular frequency of the pendulum.) How long does it take the magnet to traverse a distance equal to the radius of the wire spool? If the B field of the magnet is 0.2T, what is the approximate B field flux when the magnet is centered on the coil? what is the approximate B field flux through the coil when the magnet edge of the magnet is at the center of the coil? If the coil has 100 turns, what is the EMF you would predict? How well does this match your result?
Bonus: Observe the effect on the EMF of changing the angle between the magnet and the wire loop
Change the angle between the magnet and the wire loop by rotating the holder to which the wire loop is attached. Adjust the holder so that the wire loop is parallel to the magnet. Explain the technique that you used to do this.
6. Place the 2 inch wire loop in the holder a. Remove the 1 inch wire loop from the holder b. Place the 2 inch wire lop in the holder
7. Measure the induced EMF as a function of the spacing between the magnet and the wire loop
a. Measure the induced EMF when the magnet is 2 cm from the wire spool b. Measure the induced EMF when the magnet is 1 cm from the wire spool c. Measure the induced EMF when the magnet is 1 mm from the wire spool
Do the results differ qualitatively? Explain the qualitative differences.
c. Measuring Induced EMF due to an oscillating current in a neighboring coil Materials: 2 wire spools with 100 turns each and red and black labeled lead; 100 Ohm resistor; 1 k Ohm resistor; signal generator; oscilloscope; scope probe; micrograbber/BNC jacks; alligator clips; BNC cables

Apparatus Assembly Directions 1. Connect the two 1 inch wire loops using a screw
a. The photograph on the upper right shows the two wire spools separated, with a screw fully inserted through one. b. Screw the same screw into the second loop, as shown in the lower photograph. c. note there is no electrical connection between the loops
2. Setup the scope to monitor the signal generator a. Connect a BNC T to the output of the signal generator. b. Connect one side of the BNC T to Ch1 on the scope. c. Setup the scope so it displays Ch1. d. The voltage difference across the signal generator will be now be displayed on Ch1, as illustrated in the circuit diagram above.
3. Connect the signal generator to the leads of one wire spool with a 100 Ohm resistor in series
a. Connect a BNC cable to the other side of the BNC T on the signal generator b. Connect a BNC/micrograbber to the end of this BNC cable c. Connect the black micrograbber to the black lead on one of the wire spools d. Connect the red micrograbber to one side of a 100 Ohm resistor e. Use an alligator clip to connect the other side of 100 Ohm resistor to the red lead from the wire spool whose black lead is connected to the black micrograbber.
4. Connect the leads from the other wire spool to the input of Ch2 on the scope a. Connect the micrograbber from the scope probe to the red lead on the wire spool a. Connect alligator clip from the scope probe to the black lead on the wire spool b. Connect the BNC side of the scope probe to the input of Ch2 on the scope using a BNC cable c. Setup the scope so it displays Ch2 as well as Ch1.
5. Setup the signal generator to produce a 10V amplitude sine wave at 2000 Hz

Meaning of the program display a. Ch1 shows the voltage difference across the signal generator
b. Ch2 shows the EMF induced in the second coil by the time changing magnetic field flux generator by the first coil, which is connected to the signal generator through the 100 Ohm series resistor.
6. Adjust the scope and begin taking data
a. Adjust the voltage sensitivity and time base so that Ch1 shows approximately two periods of the sine wave from the signal generator b. Adjust the voltage sensitivity on Ch2
What is the phase difference between the driving voltage and the induced voltage? Explain. What is the amplitude of the induced EMF? Is the induced voltage a perfect sine wave? If not, explain the origin of the difference. Plot the amplitude and phase as a function of driving frequency for frequencies from 200 Hz to 200 kHz (Hint: take data at 200 Hz, 2 kHz, 20 kHz, and 200 kHz only)
Bonus: Change the series resistor to 1k. What is the amplitude of the induced EMF? Explain any difference between this result and the result when the series resistor was 100 Ohms. Bonus: Change the scope probe for a micrograbber/BNC jack. Change the signal generator to a 1 kHz triangle wave. Is the induced EMF also a triangle wave? Explain your result in terms of a differentiator, which is a device that produces a voltage proportional to the derivative of the input voltage. Bonus: Try the ramp generator with different duty cycles and explain the result.
3. Motor Demonstration
Materials: Magnet array with magnets poled on one side on the left half, and magnetis poled in the opposite direction on the other half; battery; switch, wire spool attached to the battery and switch.

Apparatus Assembly Directions 1. Adjust the magnet position
a. Hang the magnet array so it is just above one of the wires in the wire spool b. Adjust the angle so that the magnet array is roughly parallel to the wire
2. Close the Switch and allow current to flow 3. Time the opening and closing of the switch so that the magnet bar keeps turning as long as possible

Challenge Problems:
1. Setup the pendulum with both of the 1 “ coils attached to the sides of the holder so that the pendulum passes between both of them. Find the circuit that gives the maximum EMF. Develop a technique for precisely centering the pendulum between the coils.
2. Create an apparatus the damps a pendulum most efficiently without making mechanical contact with it.
3. Read out values in the smallest magnetic memory value using a current spool, where the magnetic memory consists of a screw with a current carrying coil wrapped around it to generate the B field. Keep lowering the current running through the coil to simulate smaller magnetic memory. What ultimately limits you?
4. Given a coil of wire and an voltmeter and freedom to go anywhere in the Science Center, generate the largest possible voltage WITHOUT connecting the wire to anything.
5. Given a permanent magnet and a rotating metallic disk, make the magnet float at the highest height above the disk. (you have access to a hair drier and liquid nitrogen).
6. Using a conducting pipe, a plexiglass pipe, and permanent magnets build a magnetic shock absorber that can supports the greatest possible weight damps most rapidly. You have access to liquid nitrogen and a hair dryer.
7. In an atomic force microscope (AFM), the composition of a surface is determined by measuring the force that it exerts on a very narrow tip. An AFM can be converted to a magnetic force mircroscope by adding a magnetic tip. Most MFMs only accurately measure field gradients. Using a power supply and a spool of wire design an MFM that can measure magnetic fields. Optimize the device to measure a pattern with the smallest possible spatial period.
8. Measure the force due to electrostatic repulsion and compare with the magnetic
force. i. Make sure the switch connected to the wire is OPEN so no current
can flow in the circuit containing the wire ii. Zero the digital scale by pressing the zero button
iii. Charge the wire to +10000 V iv. Charge each magnet to -10000 V v. Measure and record the force on the scale
vi. Ground the wire and magnets
9. Theory Challenge: Calculate the magnetic field and magnetic field gradient associated with the cartoon below that represents the magnetic field direction of an array of permanent magnets. Explain why a permanent magnet will magnetically levitate above a superconductor, but not above a conductor.

10. Theory Challenge : Prove Bush’s theorem that any cylindrically symmetric
configuration of magnetic fields will focus a beam of charged particles moving along the central axis with a velocity v.
8. Theory Challenge: Prove that there cannot be a magnetic field maximum in free space.

Supplemental Information
More on Magnetic Fields One can argue that magnetic fields play a much smaller role than electric fields:
atoms and molecules are held together by electrical forces with magnetism playing a negligible role. Similarly, electrical effects play a strong role in biology, whereas magnetic effects seem to be negligible with the possible exception of navigation. For purposes of this lab, particles with spin can be modeled as small current spools, where the current in the spool is an inherent property of the particle that cannot be changed and requires no energy to maintain.
The earth’s magnetic field provides some deflection of charged particles moving toward earth from space. Magnetic field control of particle velocities and positions is also strongly exploited by people. In high energy physics experiments, fusion experiments, cold atom/ion experiments, and scanning electron microscopy. http://news.bbc.co.uk/2/hi/science/nature/6522189.stm http://public.web.cern.ch/Public/Welcome.html http://press.web.cern.ch/press/PressReleases/Releases2006/PR17.06E.html http://www-project.slac.stanford.edu/ssrltxrf/bending_magnet.htm http://www.slac.stanford.edu/ http://cerncourier.com/cws/article/cern/100577 http://www.iter.org/a/index_nav_4.htm http://www.cmse.ed.ac.uk/AdvMat45/SEM.pdf magnetic fields are used to control the position and/or velocity of particles. Bose Einstein condensation was achieved using magnetic traps and the Nobel Prize was awarded in 2001. http://www.colorado.edu/physics/2000/bec/mag_trap.html It is hoped that magnetically levitated trains will make transport much more energy efficient, though these gains have not yet been realized. In biology and medicine magnetic tags with functionalized surfaces designed to specifically bind to biological targets are used to separate the targets from vast numbers of untagged particles. http://www.lerner.ccf.org/bme/zborowski/lab/ Magnetic separation is much more desirable than electric field separation precisely because most biological material is not strongly affected by magnetic fields. Large scale magnetic separation is used to isolate metallic ores from soils obtained through mining. http://www.met.sgs.com/met_magnetic_separation MRI imaging uses the gradient of magnetic fields to provide the three dimensional location of material inside people. Purcell won the Nobel Prize for inventing Nuclear Magnetic Resonance http://nobelprize.org/nobel_prizes/physics/laureates/1952/purcell-lecture.pdf which is the basis of MRI. http://en.wikipedia.org/wiki/Magnetic_resonance_imaging#2003_Nobel_Prize for which a Nobel Prize in medicine was awarded in 2003. Most long term computer memory uses magnetic fields, though current flash drives actually use electric fields. Old style magnetic memory systems read the values stored in memory using Faraday’s Law, but most hard drives now use Giant Magneto-resistance instead. http://www.research.ibm.com/research/gmr.html Switching to GMR permitted an enormous decrease in the size of stored memory bits, and the Nobel Prize for 2007 was

awarded for the fundamental scientific discovery underlying this technology. http://nobelprize.org/nobel_prizes/physics/laureates/2007/phyadv07.pdf Unfortunately, magnetic separation, MRI, and magnetic memory depend on the spin of particles, a topic that is not considered in 15b until Chapter 11 of Purcell. In Chapter 11 of Purcell it will be shown that the magnetic properties of ferromagnets are a consequence of electrical interactions rather than magnetic interactions. .

Improving the Signal to Noise on the EMF experiment The voltage features at the edges of the EMF signal are more than a factor of 20 smaller than the larger features. Both of the displays below show the same signal, only the scales are different.
One of the biggest challenges in experimental physics is to improve signal to noise WITHOUT distorting the true signal. This is not trivial, and even quite famous professional scientists have made mistakes by either not analyzing data enough or processing the data too much. In the section below, techniques for improving the signal to noise in the EMF experiment are discussed. First, note that the noise is very high frequency. This “noise” might have great significance, but assuming that we understand how changing magnetic flux generates EMF, the high frequency components are artifacts. The scope has various frequency filters. The topic of frequency filtering will be considered in detail in the next lab. In this lab, we will use the filter that discriminates between signals at frequencies above and below 20 MHz. Apparatus Assembly Directions 1. Set the frequency filter to accept only frequencies below 20 MHz
a. Bring up vertical control menu i. Press the vertical adjust menu button.
a. It is below the voltage sensitivity control knob and is This highlighted by the red rectangle in the scope image below.
b. Bring up the Bandwidth control menu i. Press the menu button below the menu item highlighted by the pink rectangle in the image on the right above. ii. This should bring up the menu shown in the screen shot on the right in the first row of images below.
c. Choose the 20 MHz filter i. Press the menu button to the right of the “20 MHz” menu item that is highlighted by the red rectangle. ii. The menu item in the lower toolbar should change from “Full Bandwidth” to “20 MHz”

iii. The signal to noise should improve, and the signal should look something like the screen shot on the left on the second row below.
2. Engage signal averaging
a. Bring up the data acquisition menu by pressing the button highlighted by the bright blue rectangle in the scope image above. b. Bring up the Mode averaging menu by pressing the button below the “Mode Average” menu item highlighted by the light blue rectangle above. c. Choose “Average” choice by pressing the menu button to the right of the menu item highlighted by the orange rectangle. d. Select the number of signals to be averaged by turning the adjustment knob highlighted by the purple circle in the scope image above.
In the experiments you did in lab 2, the averaging meant that neighboring TIME points were averaged. In this case, averaging means that several signals are added together. If the signal is the same, but the noise is random then the random noise will cancel giving beautiful signals. If the signals change, the result can be confusion.

.Insert the second wire spool into the holder 12. Connect the second wire spool in series with the first
a. Keep the black lead on the first spool attached to the black micrograbber that connected to Ch2 on the scope b. Connect the red lead on the first spool to the black lead on the second spool b. Connect red lead on the second spool to the red lead on the micrograbber that is connected to Ch2 on the scope
13. Begin data acquisition with both spools connected in series a. Displace the pendulum by 20 cm b. Release the pendulum c. Adjust the scope settings so more than 1 period of the EMF signal is shown on the screen. d. Freeze the display
i. Hit the Run/Stop button Is the voltage the same as in the previous case? Explain your result. 14. Reverse the connection between the leads of the wire spools
a. Connect the red leads on the two wire spools directly together b. Connect the black lead from the first spool to the black micrograbber on the micrograbber to BNC jack attached to Ch2 b. Connect black lead on the second spool to the red lead on the micrograbber that is connected to Ch2 on the scope
15. Begin data acquisition with the leads reversed. a. Displace the pendulum by 20 cm b. Release the pendulum c. Adjust the scope settings so more than 1 period of the EMF signal is shown on the screen. d. Freeze the display
ii. Hit the Run/Stop button Bonus: Return to the single spool setup and measure the induced EMF for the small magnet when the magnet is 1 inchfrom the face of a wire spool and compare with the result where it is 1 mm from the face of the wire spool

The images above corresponds to the same signal, shown on a different scale. This is an illustration of how important information can be lost in data taking. These features were present in the signals that you analyzed above, but they were not evident on the data acquisition scales that you were using. There are many famous cases where people possessed important data and did not realize it because they had not completely analyzed its features. Instructions on obtaining this signal are in supplemental information. You do NOT need to get this signal yourself if you do not want to; however, you do need to explain the origin of the signal. Explain the qualitative features of this signal Observe the effect of initial displacement on the induced EMF
a. Change the initial displacement of the pendulum to 10 cm b. Release the pendulum c.Freeze the display after one or two oscillations.
What is the period for the 10 cm displacement. Explain any differences between the result for the 10 cm displacement and the result for the 20 cm displacement. If you were to integrate the curve for the 10 cm displacement and the 20 cm displacement would they have the same value. Explain.

8. Observe the effect of changing the resistance in the circuit by changing the scope impedance
a. Press the vertical menu button that is just below the voltage sensitivity knob on the scope. This button is highlighted in red in the scope image above.
i. Pressing the button should bring up the menus shown in the figure on the left above.
ii. The scope impedance menu is highlighted by the pink rectangle. iii. There are two choices: “1 M Ohm and 50 Ohms” iv. When you open the menu, it should show 1 M, which is the setting
highlighted by the light green rectangle in the image above. b. Choose the scope impedance, which is the resistance in series with the loop
i. Press the menu button to the right of the menu item highlighted by the pink rectangle. to toggle between 1 M Ohm and 50 Ohms. The two resulting circuits are shown on the right in the image above. Note that the voltage difference on the scope is the voltage difference across the internal resistor
ii. Choose 50 Ohms input impedance Is the voltage the same as in the previous case? Is the current the same? Why did changing the series resistance have such a big effect on the damping, but no effect on the signal displayed on Ch1 on the oscilloscope?
Bonus: measure the voltage with an additional 100 Ohm resistor in series with the 50 Ohm internal resistance. Is the voltage shown on channel 1 the same? Explain your result.
Restore the scope impedance to 1 M Ohm