physicochemical changes of coffee beans during roasting
TRANSCRIPT
Physicochemical Changes of Coffee Beans During Roasting
by
Niya Wang
A Thesis
Presented to
The University of Guelph
In partial fulfilment of requirements
for the degree of
Master of Science
in
Food Science
Guelph, Ontario, Canada
© Niya Wang, April, 2012
ABSTRACT
PHYSICOCHEMICAL CHANGES OF COFFEE BEANS DURING
ROASTING
Niya Wang Advisor:
University of Guelph, 2012 Professor Loong-Tak Lim
In this research, physicochemical changes that took place during roast
processing of coffee beans using fluidized air roaster were studied. The results
showed that high-temperature-short-time resulted in higher moisture content,
higher pH value, higher titratable acidity, higher porous structure in the bean cell
tissues, and also produced more aldehydes, ketones, aliphatic acids, aromatic
acids, and caffeine than those processed at low-temperature-long-time process.
Fourier transform infrared (FTIR) spectroscopy and chemometric analysis
showed that clusters for principal components score plots of ground coffee,
extracted by a mixture of equal volume of ethyl acetate and water, were well
separated. The research indicated that variations in IR-active components in the
coffee extracts due to different stages of roast, roasting profiles, and
geographical origins can be evaluated by the FTIR technique.
iii
ACKNOWLEDGMENTS
I am most grateful to Prof. Dr. Loong-Tak Lim for giving me the opportunity
to work in his group. I have always appreciated his far-sighted guidance,
continued support, and constructive evaluation throughout my research and in
many aspects of my life. Further, I am much indebted to my advisory committee
members Dr. Lisa Duizer, and Dr. Massimo Marcone for their unlimited
confidence on my research work and helps during the writing of the thesis.
Special thanks to Natural Sciences and Engineering Research Council of
Canada (NESRC) and Mother Parkers Tea & Coffee Inc., for their essential
financial support, without which this research will not be possible. Many thanks to
my Packaging and Biomaterials Group sisters and brothers: Ana Cristina Vega
Lugo, Solmaz Alborzi, Suramya Minhindukulasuriya, Roc Chan, Grace Wong,
Alex Jensen, Khalid Moomand, Qian Xiao, Xiuju Wang, and Ruyan Dai for their
assistance, friendship, patience, and bringing colourful life for these years. Many
thanks are also going to Dr. Yukio Kakuda, Dr. Sandy Smith, and Bruce Manion
for their technical assistance along the way.
I would like to take this opportunity to express my deepest gratefulness to
my parents, my husband Dr. Yucheng Fu, my son Stanley Fu, and other family
members for their infinite love, support and encouragement throughout these
years of my studies at Guelph.
iv
TABLE OF CONTENTS
ACKNOWLEDGMENTS.……………………………………………………….….......iii
TABLE OF CONTENTS.…………………………………………………………...…..iv
LIST OF FIGURES.………………………………………………………………...…..vi
LIST OF TABLES.…..………………………..…………………………………...…..viii
LIST OF ABBREVIATIONS.………………………………………………….…...…..ix
1 INTRODUCTION ............................................................................................... 1
2 LITERATURE REVIEW ..................................................................................... 4
2.1 THE GREEN COFFEE BEANS ............................................................................. 4
2.2 ROASTING OF COFFEE BEANS .......................................................................... 8
2.3 AROMA COMPOUNDS IN ROASTED COFFEE ...................................................... 14
2.4 FOURIER TRANSFORM INFRARED (FTIR) SPECTROSCOPY ................................ 19
2.5 CHEMOMETRICS ........................................................................................... 21
3 JUSTIFICATION AND OBJECTIVES .............................................................. 26
4 FEASIBILITY STUDY ON CHEMOMETRIC DISCRIMINATION OF ROASTED
ARABICA COFFEES BY SOLVENT EXTRACTION AND FOURIER
TRANSFORM INFRARED SPECTROSCOPY ................................................... 27
4.1 INTRODUCTION ............................................................................................. 27
4.2 MATERIALS AND METHODS ............................................................................ 29
4.2.1 Chemicals ............................................................................................ 29
4.2.2 Coffee Beans and Roasting Conditions ............................................... 29
4.2.3 Degree of Roast as Determined by Color Measurements ................... 30
4.2.4 Solvent Extraction of Ground Coffee ................................................... 30
4.2.5 ATR-FTIR Analysis .............................................................................. 31
4.2.6 Data Analysis ...................................................................................... 32
4.3 RESULTS AND DISCUSSIONS .......................................................................... 32
4.3.1 Optimization of Solvent Extraction for FTIR-ATR ................................ 33
4.3.2 Color Analysis ..................................................................................... 38
v
4.3.3 PCA Analysis of Solvent Extracts of Coffee Beans ............................. 40
4.3.4 PCA Analysis for Coffees According to Degree of Roast .................... 47
4.3.5 SIMCA Analysis ................................................................................... 52
5 EFFECTS OF DIFFERENT TIME-TEMPERATURE PROFILES ON COFFEE
PHYSICAL AND CHEMICAL PROPERTIES ...................................................... 54
5.1 INTRODUCTION ............................................................................................. 54
5.2 MATERIALS AND METHODS ............................................................................ 57
5.2.1 Chemicals and materials ..................................................................... 57
5.2.2 Green Beans and Roasting Conditions ............................................... 57
5.2.3 Degree of Roast as Determined by Color Measurements ................... 58
5.2.4 Moisture Content of Ground Coffee ..................................................... 58
5.2.5 pH Value .............................................................................................. 59
5.2.6 Titratable Acidity .................................................................................. 59
5.2.7 Solvent Extraction and ATR-FTIR Analysis of Ground Coffee ............. 59
5.2.8 Chemometric Analysis ......................................................................... 60
5.2.9 Scanning Electron Microscopy (SEM) Analysis ................................... 60
5.3 RESULTS AND DISCUSSION ........................................................................... 60
5.3.1 Evolution of physical and chemical properties during roasting ............ 60
5.3.2 Changes in coffee at various stages of roast ....................................... 66
5.3.3 Effects of roast temperature on changes in coffee .............................. 72
5.3.4 Microstructural analysis ....................................................................... 74
6 CONCLUSIONS AND FUTURE WORKS ........................................................ 78
7 REFERENCE ................................................................................................... 82
vi
LIST OF FIGURES
Figure 1 Chemical composition of green, roasted, and brewed coffee (Barter
2004) ..................................................................................................................... 9
Figure 2 Schematic diagram of a typical FTIR spectrometer ............................. 20
Figure 3 Vibrational absorbance due to common bands .................................... 20
Figure 4 Schematic diagram of PCA analysis .................................................... 24
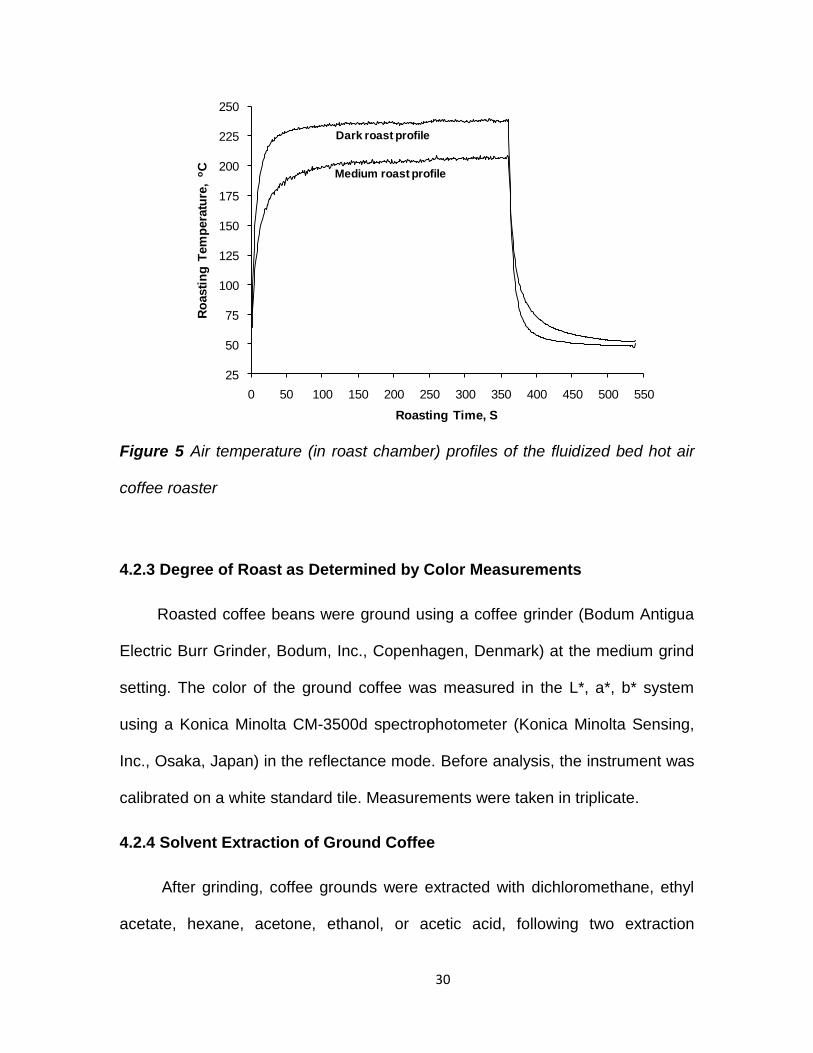
Figure 5 Air temperature (in roast chamber) profiles of the fluidized bed hot air
coffee roaster ...................................................................................................... 30
Figure 6 Appearance of coffee extracts by dichloromethane, hexane, ethyl
acetate, acetone, ethanol, and acetic acid (the right vial represent the extracts by
Method #1) .......................................................................................................... 35
Figure 7 FTIR spectra of coffee extracts obtained with hexane, dichloromethane,
ethyl acetate, acetone, ethanol, or acetic acid using method #1 (with water) and
method #2 (no water) .......................................................................................... 38
Figure 8 Selected FTIR spectra of dark roast coffee extract obtained with
dichloromethane as a solvent (using method 1#)................................................ 41
Figure 9 PCA of FTIR data for hexane, dichloromethane, ethyl acetate, and
acetone extracts of medium roast coffee. Row A: Two-factor score plots. Row B:
Loading plots of PC1. Row C: Corresponding FTIR raw spectra ........................ 42
Figure 10 PCA of FTIR data for hexane, dichloromethane, ethyl acetate, and
acetone extracts of dark roast coffee. Row A: Two-factor score plots. Row B:
Loading plots of PC1. Row C: Corresponding FTIR raw spectra ........................ 43
Figure 11 PCA of FTIR data for dichloromethane extracts of coffee (from the
vii
same origin) with two degrees of roast. Row A: Two factor score plots. Row B:
Loading plots of PC1. Row C: Corresponding FTIR raw spectra ........................ 50
Figure 12 PCA of FTIR data for ethyl acetate extracts of coffee (from the same
origin) with two degrees of roast. Row A: Two factor score plots. Row B: Loading
plots of PC1. Row C: Corresponding FTIR raw spectra ...................................... 51
Figure 13 Changes in lightness, moisture content, pH value, and titratable acidity
of coffee beans processed to different roast stages (A). The same data are
plotted as a function of actual roast time (B). Roasting occurred isothermally at
210, 220, 230 and 240oC .................................................................................... 62
Figure14 PCA analysis for coffees during roasting. Column A: Two-factor score
plots. Column B: Loading plots of PC2. Column C: Representative FTIR spectra
at the start-of-second-crack ................................................................................ 69
Figure15 The expanded 2910-2850 cm-1, and 1800-1500 cm-1 regions of the
spectra of coffee roasted at 230oC ...................................................................... 71
Figure16 PCA analysis for coffees collected at the same sampling point. Row A:
Two-factor score plots. Row B: Loading plots of PC1. Row C: Representative
FTIR spectra at 230oC ........................................................................................ 73
Figure 17 SEM micrographs of internal texture for coffee beans collected at
different stages of roast. The temperatures indicated on each row of micrographs
were the roast temperature ................................................................................. 76
viii
LIST OF TABLES
Table 1 Chemical composition of green Arabica and Robusta coffee beans
(g/100g) ................................................................................................................ 7
Table 2 Potent odorants in Arabica coffee from Colombia ................................. 16
Table 3 Physical properties of the investigated solvents (Pagni 2005) ............... 34
Table 4 Evaporation time of the coffee extracts.................................................. 36
Table 5 L* Value of Roasted Ground Arabica Coffee Beans .............................. 39
Table 6 Turkey method for L* value comparisons .............................................. 40
Table 7 SIMCA Classification Results for Coffees from Different Geographic
Origins ................................................................................................................ 52
Table 8 SIMCA classification results for coffees according to degree of roast ... 53
Table 9 Time Taken to Achieve Different Stages of Roasting at Four Different
Final Roast Temperatures .................................................................................. 58
ix
LIST OF ABBREVIATIONS
FTIR Fourier transform infrared
ATR Attenuated total reflectance
PTR-MS Proton transfer reaction-Mass spectrometry
PAS Photoacoustic spectroscopy
PCA Principal component analysis
HCA Hierarchical cluster analysis
PLS Partial least squares
PCR Principal component regression
PLS-DA Partial least squares-discriminant analysis
KNN K-nearest neighbour
SIMCA Soft independent modeling of class analogy
PCs Principal components
HS-SPME Headspace solid phase microextraction
NMR Nuclear magnetic resonance
GC-MS Gas chromatography-mass spectrometry
GC Gas chromatography
L* Lightness
SEM Scanning electron microscope
1
1 INTRODUCTION
Coffee is one of the most popular beverages in the world. Nearly 25 million
farmers in 50 countries around the world depend on coffee for a significant part of
their livelihoods (Cague et al. 2009). Coffee is the most traded commodity
second after oil (Ponte 2002). Among coffee drinkers, the average consumption
in the United States is 3.2 cups of coffee per day versus 2.6 cups in Canada
(Canada 2003).
A good quality cup of coffee is depended on many factors, such as the
quality of green beans, the roasting conditions, the time since the beans are
roasted, and the type of water used for brewing. More than 800 volatile
compounds have been identified in roasted coffee, whereof around 30
compounds are responsible for the main impression of coffee aroma
(Baggenstoss et al. 2008).
The overall quality and chemical composition of green coffee beans are
affected by many factors, such as the composition of the soil and its fertilization,
the altitude and weather of the plantation, the cultivation, and the drying methods
used for the beans. Coffee plants are mainly grown in tropical and subtropical
regions of central and South America, Africa and South East Asia, in temperate
and humid climates at altitudes between 600 and 2500 m (Schenker 2000). The
genus coffee belongs to the botanical family of Rubiaceae and comprises more
than 90 different species (Davis 2001). However, only C. arabica, C. canephora,
and C. liberica are of commercial importance (Schenker 2000). As a result of
modem breeding techniques some hybrids of C. arabica and C. canephora have
2
recently been introduced with success. Usually roasted coffee beans from
different origins are blended at specific ratios to provide coffee of unique flavour
profiles. Often time, coffee beans are blended for the purpose of cost saving.
Coffee cherries are harvested each year when they are bright-red, glossy,
and firm. After removing the outer hull, the seeds inside of the cherry are
commonly called "green coffee beans". The quality of the green coffee beans is
dictated by a number of parameters, including bean size, color, shape, method of
drying, crop year, and presence of defects (crack, withered bean, bean in
parchment, mouldy bean, etc.).
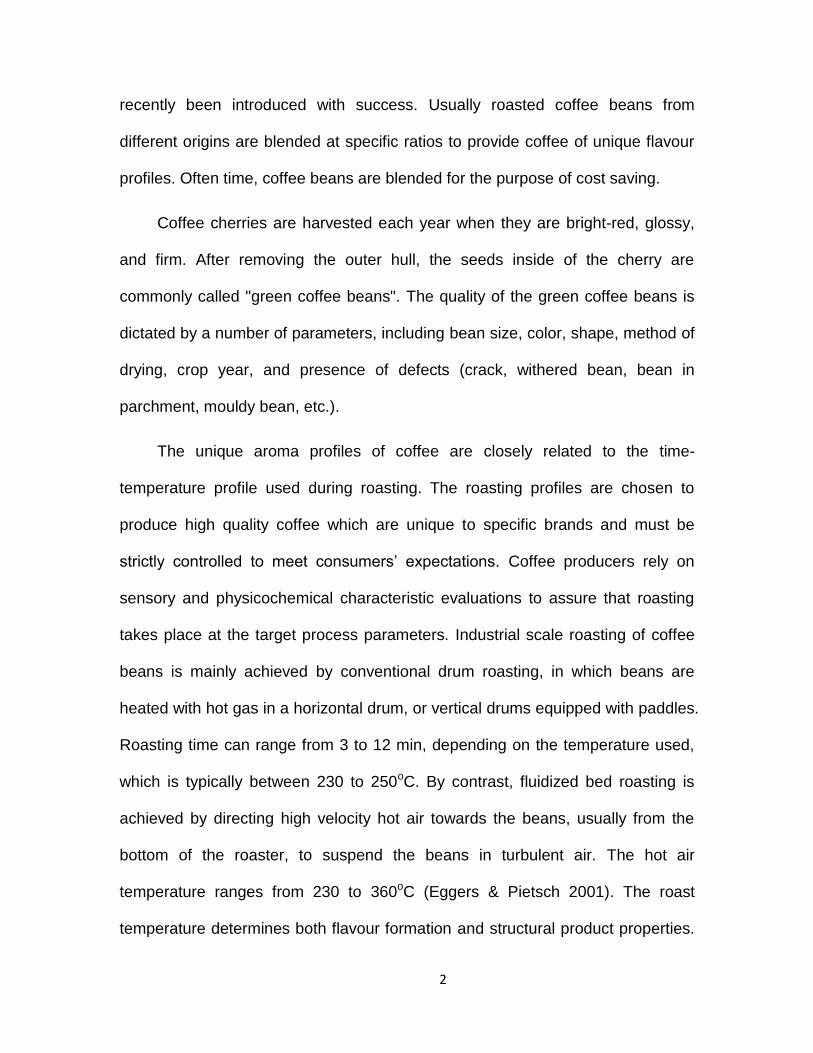
The unique aroma profiles of coffee are closely related to the time-
temperature profile used during roasting. The roasting profiles are chosen to
produce high quality coffee which are unique to specific brands and must be
strictly controlled to meet consumers’ expectations. Coffee producers rely on
sensory and physicochemical characteristic evaluations to assure that roasting
takes place at the target process parameters. Industrial scale roasting of coffee
beans is mainly achieved by conventional drum roasting, in which beans are
heated with hot gas in a horizontal drum, or vertical drums equipped with paddles.
Roasting time can range from 3 to 12 min, depending on the temperature used,
which is typically between 230 to 250oC. By contrast, fluidized bed roasting is
achieved by directing high velocity hot air towards the beans, usually from the
bottom of the roaster, to suspend the beans in turbulent air. The hot air
temperature ranges from 230 to 360oC (Eggers & Pietsch 2001). The roast
temperature determines both flavour formation and structural product properties.
3
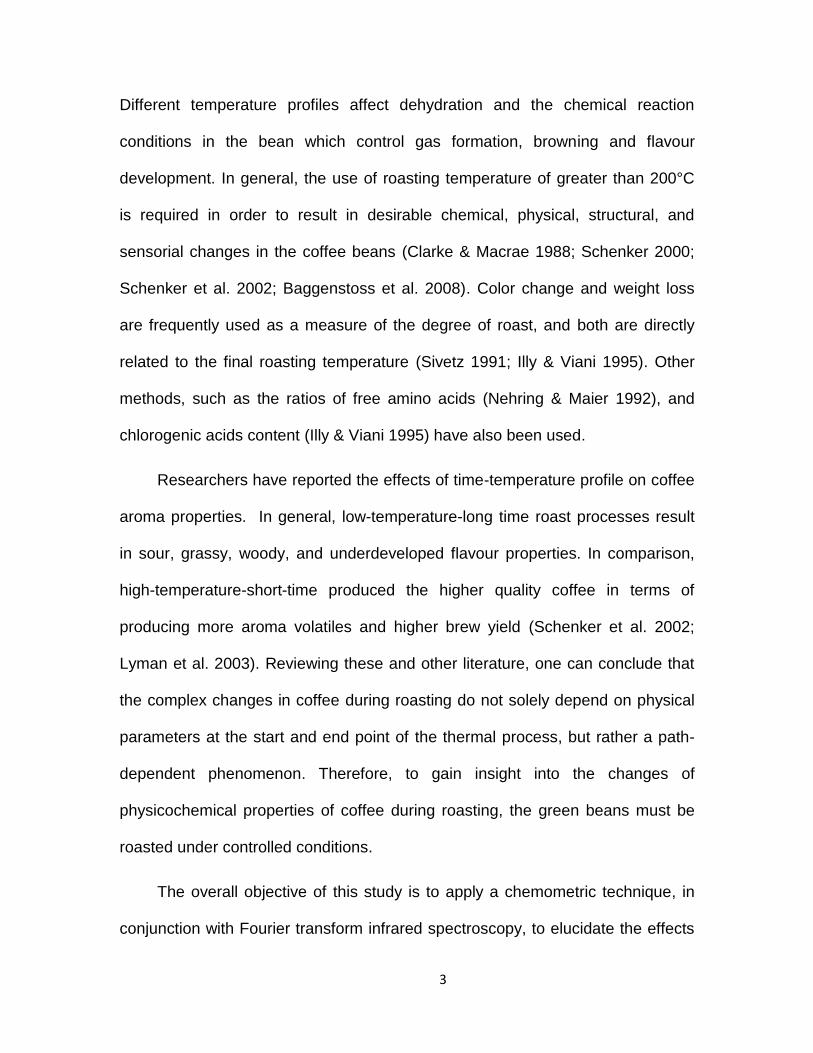
Different temperature profiles affect dehydration and the chemical reaction
conditions in the bean which control gas formation, browning and flavour
development. In general, the use of roasting temperature of greater than 200°C
is required in order to result in desirable chemical, physical, structural, and
sensorial changes in the coffee beans (Clarke & Macrae 1988; Schenker 2000;
Schenker et al. 2002; Baggenstoss et al. 2008). Color change and weight loss
are frequently used as a measure of the degree of roast, and both are directly
related to the final roasting temperature (Sivetz 1991; Illy & Viani 1995). Other
methods, such as the ratios of free amino acids (Nehring & Maier 1992), and
chlorogenic acids content (Illy & Viani 1995) have also been used.
Researchers have reported the effects of time-temperature profile on coffee
aroma properties. In general, low-temperature-long time roast processes result
in sour, grassy, woody, and underdeveloped flavour properties. In comparison,
high-temperature-short-time produced the higher quality coffee in terms of
producing more aroma volatiles and higher brew yield (Schenker et al. 2002;
Lyman et al. 2003). Reviewing these and other literature, one can conclude that
the complex changes in coffee during roasting do not solely depend on physical
parameters at the start and end point of the thermal process, but rather a path-
dependent phenomenon. Therefore, to gain insight into the changes of
physicochemical properties of coffee during roasting, the green beans must be
roasted under controlled conditions.
The overall objective of this study is to apply a chemometric technique, in
conjunction with Fourier transform infrared spectroscopy, to elucidate the effects
4
of time-temperature effects on physical and chemical properties of coffee from
different grown regions during fluidized-bed roasting.
2 LITERATURE REVIEW
2.1 The green coffee beans
The overall quality and chemical composition of green coffee beans are
affected by many factors, such as the composition of the soil and its fertilization,
the altitude and weather of the plantation, and the final cultivation and drying
methods used. Coffee plants are grown in tropical and subtropical regions of
central and South America, Africa, and South East Asia, mainly in regions with
temperate and humid climates (Schenker 2000). Brazil is by far the largest
grower and exporter of green coffee beans in the world followed by Vietnam,
Colombia, Indonesia, Ethiopia and India – producing nearly 2.5 million tons of
green coffee beans per year (Franca & Oliveira 2009).
The genus coffee belongs to the botanical family of Rubiaceae and
comprises more than 90 different species (Davis 2001). However, only Coffea
Arabica (Arabica), Coffea canephora (Robusta), and Coffea liberica are of
commercial importance (Schenker 2000). Arabica accounts for approximately 64%
while Robusta accounts for about 35% of the world’s production; other species
with not much commercial value like Coffea liberica and Coffea excelsa represent
only 1% (Rubayiza & Meurens 2005). Due to its more pronounced and finer
flavour qualities, Arabica is considered to be of better quality and accordingly
5
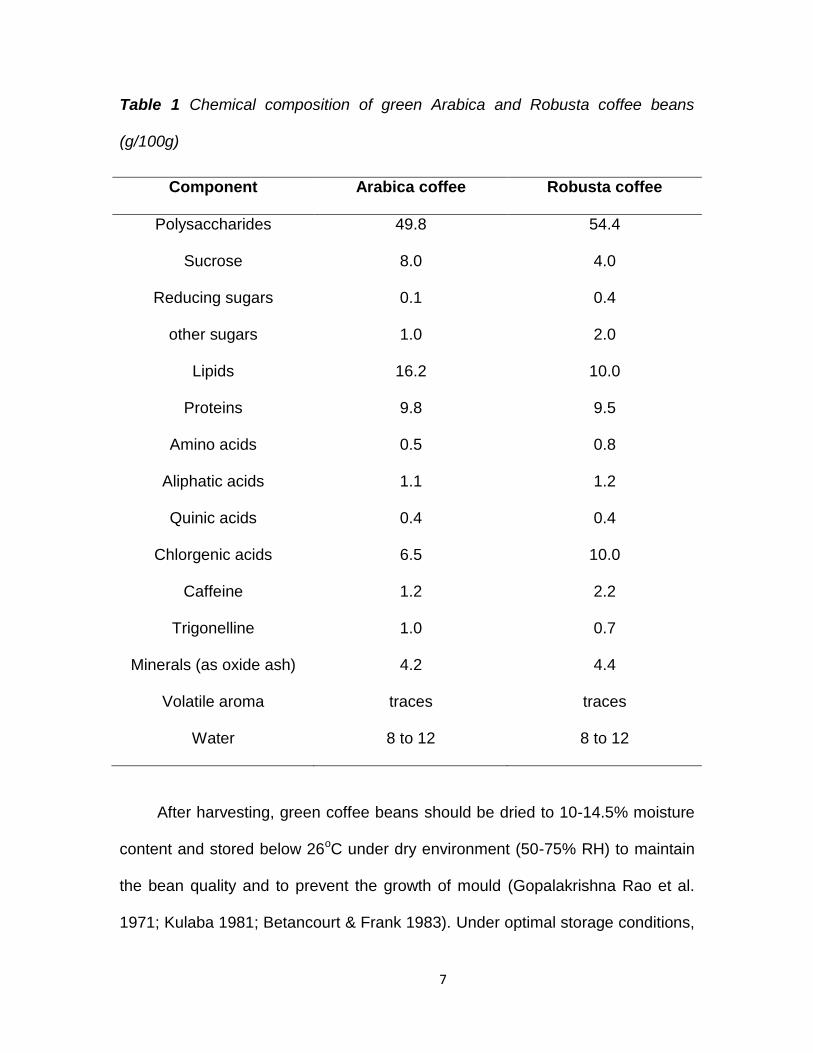
command higher prices (Valdenebro et al. 1999). Table 1 provides a general
survey on the chemical composition of green Arabica and Robusta coffee beans
(Illy & Viani 1995).
Coffee cherries are harvested when they become bright-red, glossy, and
firm, either by selective hand-picking or non-selective stripping of whole branches
or mechanical harvesting. The hand-picking method is very time-consuming, but
results in a superior product quality because only ripe cherries are selected. After
harvesting, the coffee fruits are separated from the pulp, which is carried out by
dry or wet processing (Clarke & Macrae 1987; Illy & Viani 1995). The dry process
is simple and inexpensive. The whole cherries are dried under the sun in open air,
followed by the separation of the hull (dried pulp and parchment) mechanically to
yield the green beans. On the contrary, the wet process requires greater
investment and more care, but results in a superior coffee quality. In the wet
process, the pulp of the coffee cherries, which is made up of exocarp and
mesocarp, is removed mechanically, but the parchment remains attached to the
beans. After drying either under the sun or in a dryer, the parchment is removed
to produce the green coffee beans. Bean size, color, shape, processing method,
crop year, and presence of defects, are some of the parameters used to evaluate
the quality of green coffee beans (Banks 2002).
Green coffee beans have minimal flavour. However, upon roasting,
characteristic coffee aroma is developed due to the complex reactions that take
place in the beans. To develop a unique flavour, green coffee beans are roasted
according to different time-temperature profiles (Buffo & Cardelli-Freire 2004).
6
The aroma profile of roasted ground coffee is also related to the origin and
variety of the beans. In general, blends with greater Arabica content tend to carry
more fruity notes due to the aldehydes, acetaldehyde, and propanal, while the
pyrazines give the earthy odor. In comparison, Robusta beans carry stronger
“roasty” and “sulphury” note due to the presence of greater amount of sulphur-
containing compounds (Sanz et al. 2002). Thus, Arabica is often added for the
aroma effect while Robusta is used for enhancing the body, earthy and phenolic
notes of the coffee blend (Parliment & Stahl 1995). Besides contributing to
balanced flavour profiles, Robusta coffee is often blended with Arabica for cost
reduction purpose. Robusta beans are lower in cost since the crops are more
hardy to grow (more resistant to infestation) and easier to harvest (grown in
regions of low elevation) than the Arabica counterpart.
Defective beans (black or brown, sour, immature, insect-damaged, split),
which represent about 11-20% of coffee production, can impact the flavour of the
roasted products. Mazzafera compared the chemical composition of defective
beans and non-defective beans. The researcher found that non-defective beans
were heavier, had higher water activity, and lower titratable acidity than the
defective beans. The content of sucrose, protein, 5-caffeoylquinic acid, and
soluble phenols were also higher in non-defective coffee beans (Mazzafera 1999).
Nevertheless, the antioxidant level in the defective beans, especially chlorogenic
acids, remains high which may be a good source of antioxidant or radical
scavenger for other food applications (Nagaraju et al. 1997).
7
Table 1 Chemical composition of green Arabica and Robusta coffee beans
(g/100g)
Component Arabica coffee Robusta coffee
Polysaccharides 49.8 54.4
Sucrose 8.0 4.0
Reducing sugars 0.1 0.4
other sugars 1.0 2.0
Lipids 16.2 10.0
Proteins 9.8 9.5
Amino acids 0.5 0.8
Aliphatic acids 1.1 1.2
Quinic acids 0.4 0.4
Chlorgenic acids 6.5 10.0
Caffeine 1.2 2.2
Trigonelline 1.0 0.7
Minerals (as oxide ash) 4.2 4.4
Volatile aroma traces traces
Water 8 to 12 8 to 12
After harvesting, green coffee beans should be dried to 10-14.5% moisture
content and stored below 26oC under dry environment (50-75% RH) to maintain
the bean quality and to prevent the growth of mould (Gopalakrishna Rao et al.
1971; Kulaba 1981; Betancourt & Frank 1983). Under optimal storage conditions,
8
green coffee beans may be stored for more than 3 years (Bucheli et al. 1998).
Usually, green coffee beans are packaged in natural jute, sisal or burlap bags,
although high quality beans may be packaged in high barrier synthetic vacuum
packages fabricated from synthetic thermoplastic polymers. Cupping is a method
to detect the early stages of coffee deterioration. Bucheli and others (Bucheli et al.
1996) reported that glucose was a sensitive marker for green coffee bean quality
during storage. Glucose is present only in trace amount of good quality green
coffee, and the content will increase when deterioration occurs (Wolfrom & Patin
1965; Bucheli et al. 1996).
2.2 Roasting of coffee beans
Green coffee beans provide neither the characteristic aroma nor flavour of
brewed coffee until they are roasted. Moreover, the roasting process increases
the value of coffee beans, by 100-300% of the raw material (Yeretzian et al.
2002). Roasting of coffee beans typically takes place at 200-240°C for different
times depending on the desired characteristics of the final product. Events that
take place during roasting are complex, resulting in the destruction of some
compounds initially present in green beans and the formation of volatile
compounds that are important contributors to the characteristic of coffee’s aroma.
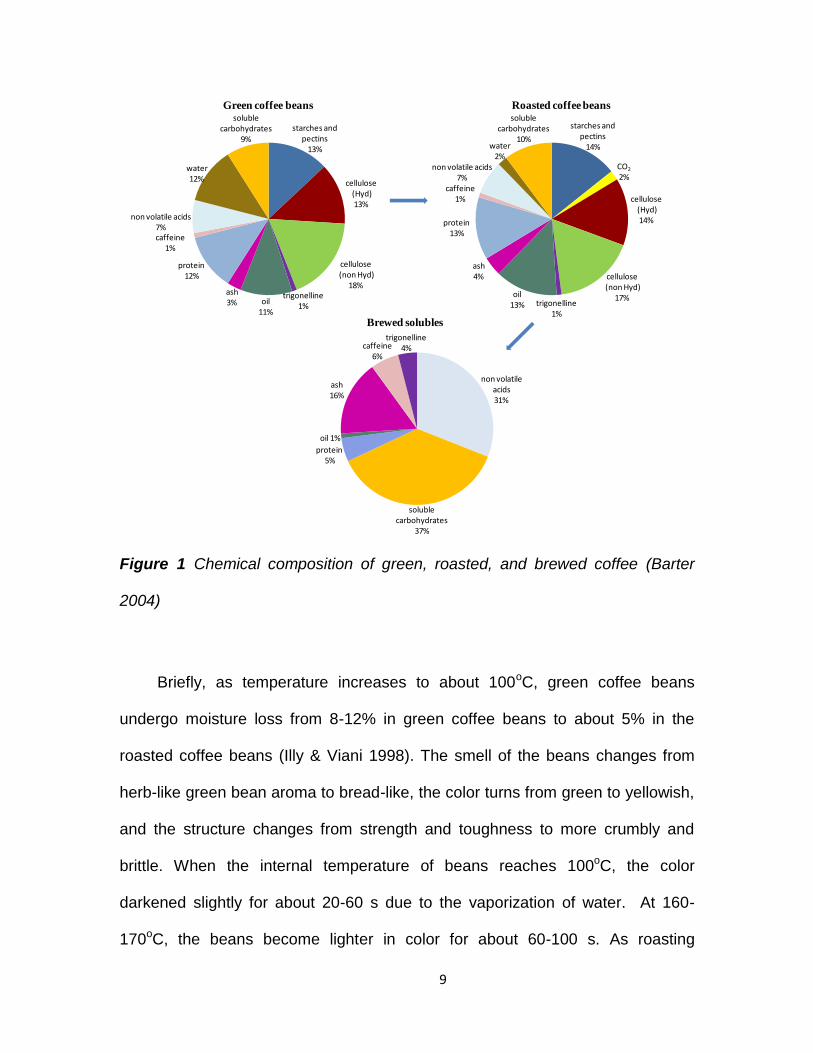
The chemical compositions of green, roasted, and brewed coffee are shown in
Figure 1 (Barter 2004).
9
Figure 1 Chemical composition of green, roasted, and brewed coffee (Barter
2004)
Briefly, as temperature increases to about 100oC, green coffee beans
undergo moisture loss from 8-12% in green coffee beans to about 5% in the
roasted coffee beans (Illy & Viani 1998). The smell of the beans changes from
herb-like green bean aroma to bread-like, the color turns from green to yellowish,
and the structure changes from strength and toughness to more crumbly and
brittle. When the internal temperature of beans reaches 100oC, the color
darkened slightly for about 20-60 s due to the vaporization of water. At 160-
170oC, the beans become lighter in color for about 60-100 s. As roasting
cellulose(non Hyd)
18%
cellulose(Hyd) 13%
starches and pectins
13%
soluble carbohydrates
9%
water12%
non volatile acids7%caffeine
1%
protein12%
ash 3% oil
11%
trigonelline1%
Green coffee beans
caffeine1%
water2%
starches and pectins
14%
CO2
2%
cellulose(Hyd) 14%
cellulose(non Hyd)
17%trigonelline
1%
oil 13%
ash 4%
protein13%
non volatile acids7%
soluble carbohydrates
10%
Roasted coffee beans
oil 1%
soluble carbohydrates
37%
non volatile acids31%
caffeine6%
protein5%
ash 16%
trigonelline4%
Brewed solubles
10
continues at this temperature, Maillard and pyrolytic reactions start to take place,
resulting in gradually darkening of the beans (Hernandez et al. 2007). The
buildup of water pressure, along with the large amount of gases generated
causes the cellulose cell wall to crack, giving rise to the so called “first crack”. As
heating continues at the roasting temperature (160-170oC), the coffee becomes
darker and more rapid popping of coffee bean occurs (“second crack”) as the
carbon dioxide (CO2) buildup exceeds the strength of the cellulosic walls of the
bean. Finally, after roasting, the fresh roasted coffee beans are quickly cooled to
stop roasting (Yeretzian et al. 2002).
The final quality of roasted coffee is influenced by the design of the roasters
and time-temperature profiles used. Although heat transfers during roasting can
involve conduction, convection, and radiation, convection by far is the most
important mode of heat transfer that determines the rate and uniformity of
roasting (Baggenstoss et al. 2008). Coffees roasted in fluidized-bed roaster that
is almost exclusive based on convective heating can result in low density and
high yield coffee (Eggers & Pietsch 2001). On the other hand, coffees roasted in
drum roaster that involves mainly conductive heat transfer have less soluble
solids, more degradation of chlorogenic acids, more burnt flavour, and higher
loss of volatiles than the fluidized bed roasters (Nagaraju et al. 1997).
The effects of time-temperature profile on coffee aroma properties have
been reported by Lyman et al. (Lyman et al. 2003). They observed that the
medium roasted process (6.5 min to the onset of the first crack and 1.0 min to the
onset of the second crack) resulted in good balance of taste and aroma with
11
citrus flavour. However, the “sweated process” (4.5 min to the first crack and 6.5
min to the second crack) resulted in non-uniform bean color and the coffee was
“sour, grassy, and underdeveloped”. Reducing the heating rate further by using
the “baked process” (11 min to the first crack and 18 min to the second crack)
produced coffee of “flat, woody with low brightness and acidity” (Lyman et al.
2003). In another study, Schenker et al. reported that LHC process (150 to 240oC
in 270 s; 240oC for 55 s) resulted in the formation of the highest quantities of
aroma volatiles, while the long time low temperature (LTLT) approach (isothermal
heating at 220oC for 600 s) generated the lowest aroma volatiles. Moreover, the
distribution of the 13 volatile compounds monitored was considerably different
depending on the roasting profiles used (Schenker et al. 2002).
Depending on the extent of heat treatment, coffee can be largely
categorized as light, medium or dark roasts. Light roast process tends to give
non-uniform bean color with sour, grassy, and underdeveloped flavour, while
medium roast process produces a balanced taste and aroma with citrus flavour.
By contrast, dark roast process produces coffee of low acidity sensory profiles
(Lyman et al. 2003). Physical characteristics such as temperature, color, and
weight-loss are often used as indicators of roast degree. However, these
parameters only allow assessment of the flavour profile for coffee roasted under
narrow process conditions (Sivetz 1991; Illy & Viani 1995). Other analytical
methods for quantifying the degree of roast include ratio of free amino acids
(Nehring & Maier 1992), alkylpyrazines (Hashim & Chaveron 1995), and
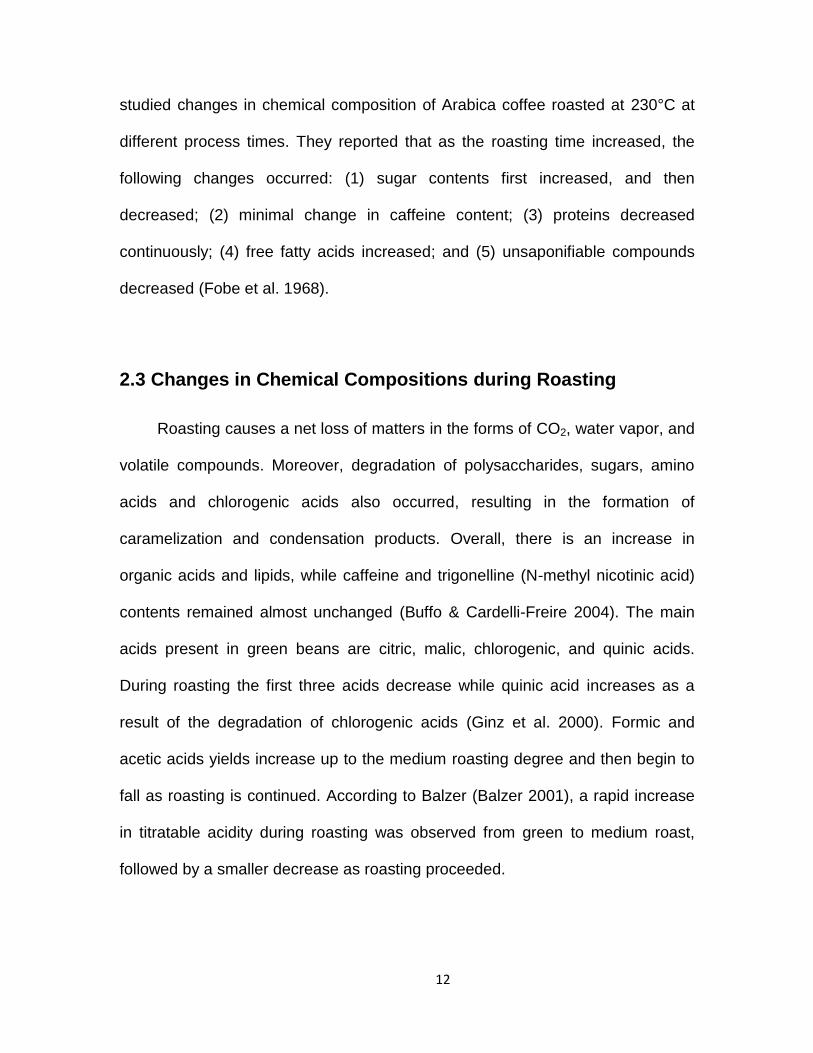
chlorogenic acids content (Illy & Viani 1995). Fobe and others (Fobe et al. 1968)
12
studied changes in chemical composition of Arabica coffee roasted at 230°C at
different process times. They reported that as the roasting time increased, the
following changes occurred: (1) sugar contents first increased, and then
decreased; (2) minimal change in caffeine content; (3) proteins decreased
continuously; (4) free fatty acids increased; and (5) unsaponifiable compounds
decreased (Fobe et al. 1968).
2.3 Changes in Chemical Compositions during Roasting
Roasting causes a net loss of matters in the forms of CO2, water vapor, and
volatile compounds. Moreover, degradation of polysaccharides, sugars, amino
acids and chlorogenic acids also occurred, resulting in the formation of
caramelization and condensation products. Overall, there is an increase in
organic acids and lipids, while caffeine and trigonelline (N-methyl nicotinic acid)
contents remained almost unchanged (Buffo & Cardelli-Freire 2004). The main
acids present in green beans are citric, malic, chlorogenic, and quinic acids.
During roasting the first three acids decrease while quinic acid increases as a
result of the degradation of chlorogenic acids (Ginz et al. 2000). Formic and
acetic acids yields increase up to the medium roasting degree and then begin to
fall as roasting is continued. According to Balzer (Balzer 2001), a rapid increase
in titratable acidity during roasting was observed from green to medium roast,
followed by a smaller decrease as roasting proceeded.
13
The reaction products formed are highly dependent on the roasting time-
temperature profile used. Excessive roasting produces more bitter coffee lacking
satisfactory aroma, whereas very short roasting time may be insufficient to
develop full organoleptic characteristics (Yeretzian et al. 2002; Lyman et al. 2003;
Buffo & Cardelli-Freire 2004). Although the majority of phenolic antioxidants
naturally occurring in coffee bean are lost during roasting, the formation of other
antioxidants from Maillard reactions during roasting can enhance the antioxidant
activity of coffee. Compared to medium roast coffee, dark roast coffee exhibited
lower radical scavenging activity than medium roasted coffee due to the
degradation of polyphenol, and thus the antioxidant activity will also depend on
roasting severity and type of coffee (Giampiero Sacchetti 2009).
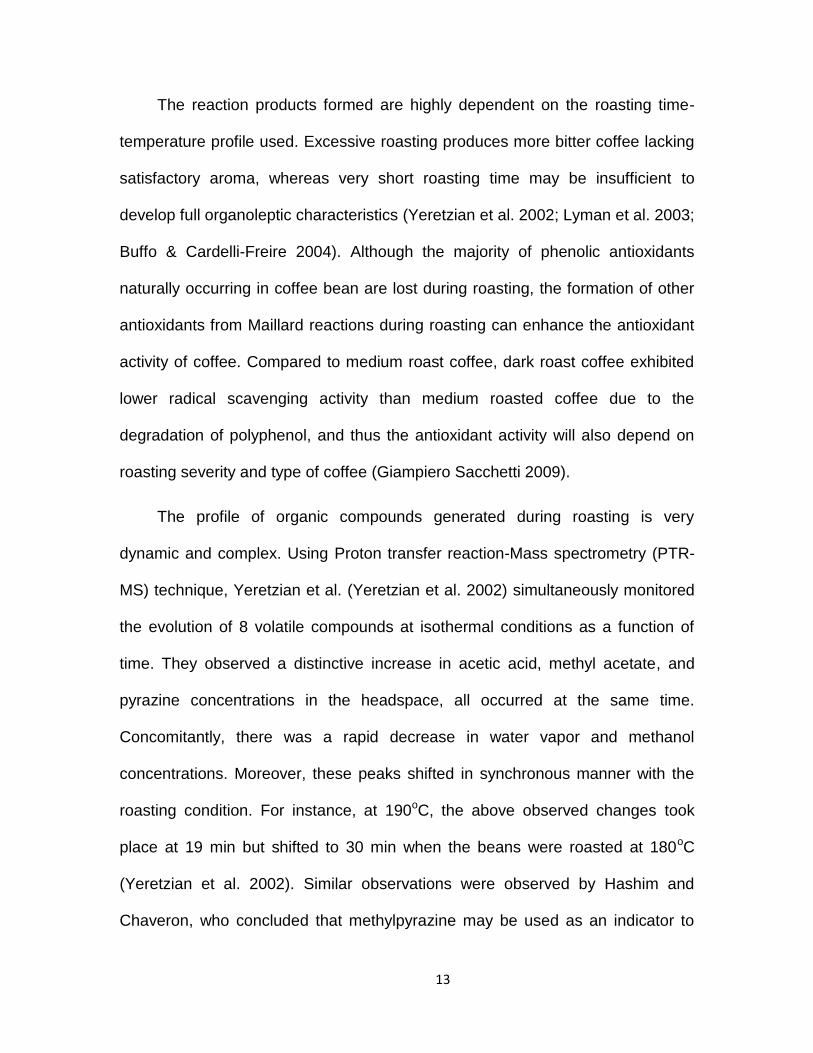
The profile of organic compounds generated during roasting is very
dynamic and complex. Using Proton transfer reaction-Mass spectrometry (PTR-
MS) technique, Yeretzian et al. (Yeretzian et al. 2002) simultaneously monitored
the evolution of 8 volatile compounds at isothermal conditions as a function of
time. They observed a distinctive increase in acetic acid, methyl acetate, and
pyrazine concentrations in the headspace, all occurred at the same time.
Concomitantly, there was a rapid decrease in water vapor and methanol
concentrations. Moreover, these peaks shifted in synchronous manner with the
roasting condition. For instance, at 190oC, the above observed changes took
place at 19 min but shifted to 30 min when the beans were roasted at 180oC
(Yeretzian et al. 2002). Similar observations were observed by Hashim and
Chaveron, who concluded that methylpyrazine may be used as an indicator to
14
monitor the roasting progress of coffee beans (Hashim & Chaveron 1995). It has
been suggested that the pressure buildup within intact bean cells is comparable
to inside an autoclave, which can further complicated the chemical reactions
occurred in coffee bean during roasting (Buffo & Cardelli-Freire 2004).
Chemical reactions happened during coffee roasting are very complex,
which have not been fully understood. Based on the literature reviewed, we can
conclude that the quality of roasted coffee cannot be solely described in terms of
physical parameters at the start and end point of roasting, but rather it is
dependent on the path taken during the roasting process. To reach a specific
flavour profile, not only that precise control of roasting time and temperature is
needed, the variety/quality of green beans, cooling, and degassing conditions are
expected to be important as well.
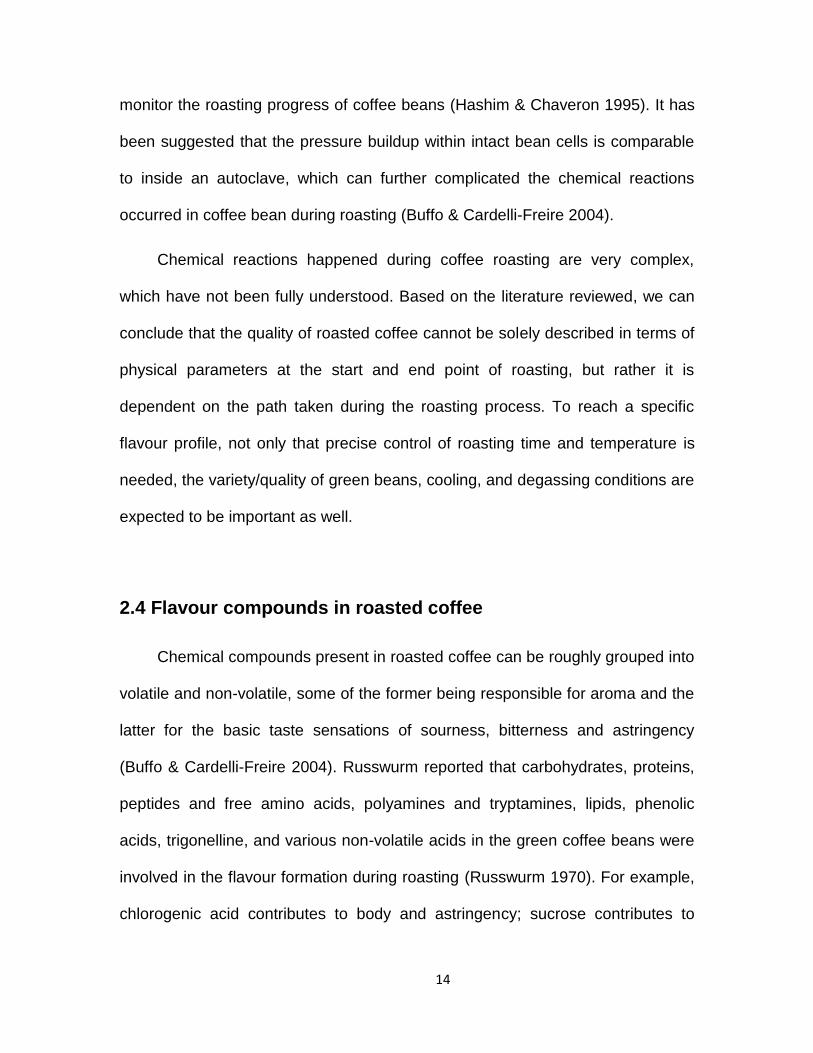
2.4 Flavour compounds in roasted coffee
Chemical compounds present in roasted coffee can be roughly grouped into
volatile and non-volatile, some of the former being responsible for aroma and the
latter for the basic taste sensations of sourness, bitterness and astringency
(Buffo & Cardelli-Freire 2004). Russwurm reported that carbohydrates, proteins,
peptides and free amino acids, polyamines and tryptamines, lipids, phenolic
acids, trigonelline, and various non-volatile acids in the green coffee beans were
involved in the flavour formation during roasting (Russwurm 1970). For example,
chlorogenic acid contributes to body and astringency; sucrose contributes to
15
color, aroma, bitterness, and sourness; minor protein components like free amino
acids are highly reactive by interacting with reducing sugars, which make the
Maillard reaction happen; triogenlline generates pyridine and may be
consequently be responsible for some objectionable flavours; and caffeine can
be contributed to the bitterness (Flament 2002).
Maillard reactions have been identified to be the major pathway in the
formation of volatile compounds in coffee roasting (Shibamoto 1991). In the
Maillard reaction, reducing sugars such as glucose or fructose react with free
amino acids to form N-substituted glycosylamine adducts, which are then
rearranged to aminoketones and aminoaldoses by Amadori and Heynes
rearrangements. A complex reaction cascade of Amadori and Heynes
rearrangement products leads to numerous volatile compounds and complex
melanoidins.
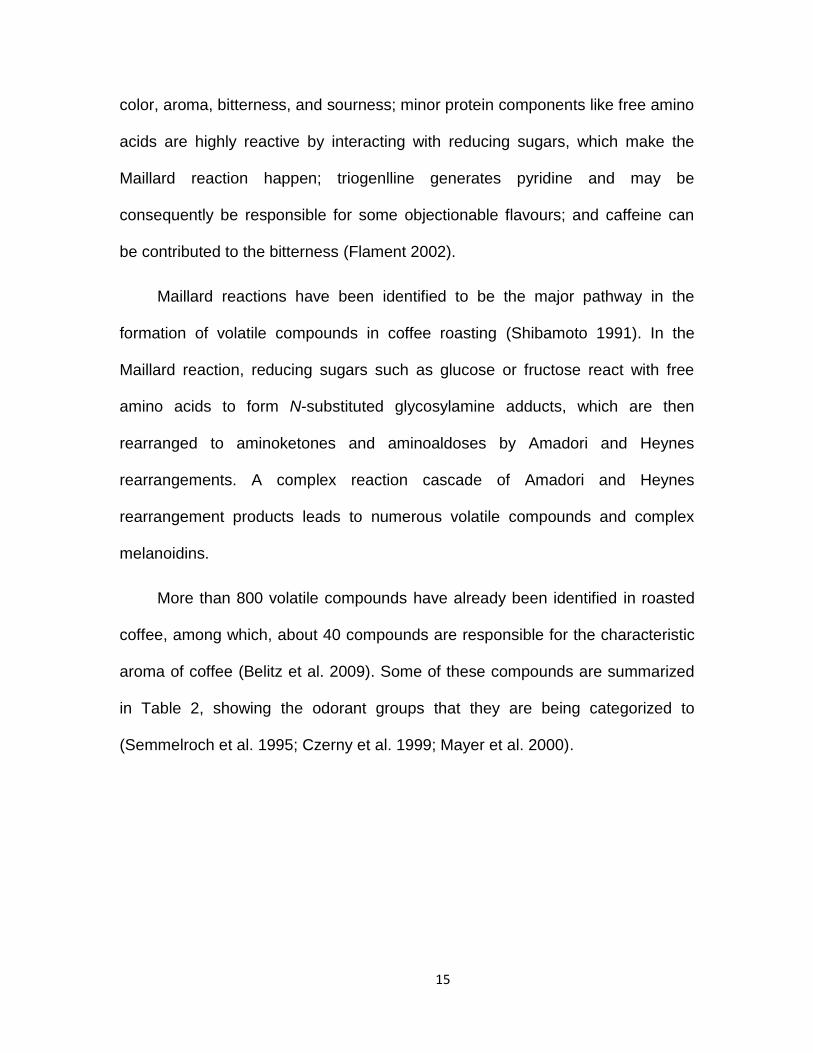
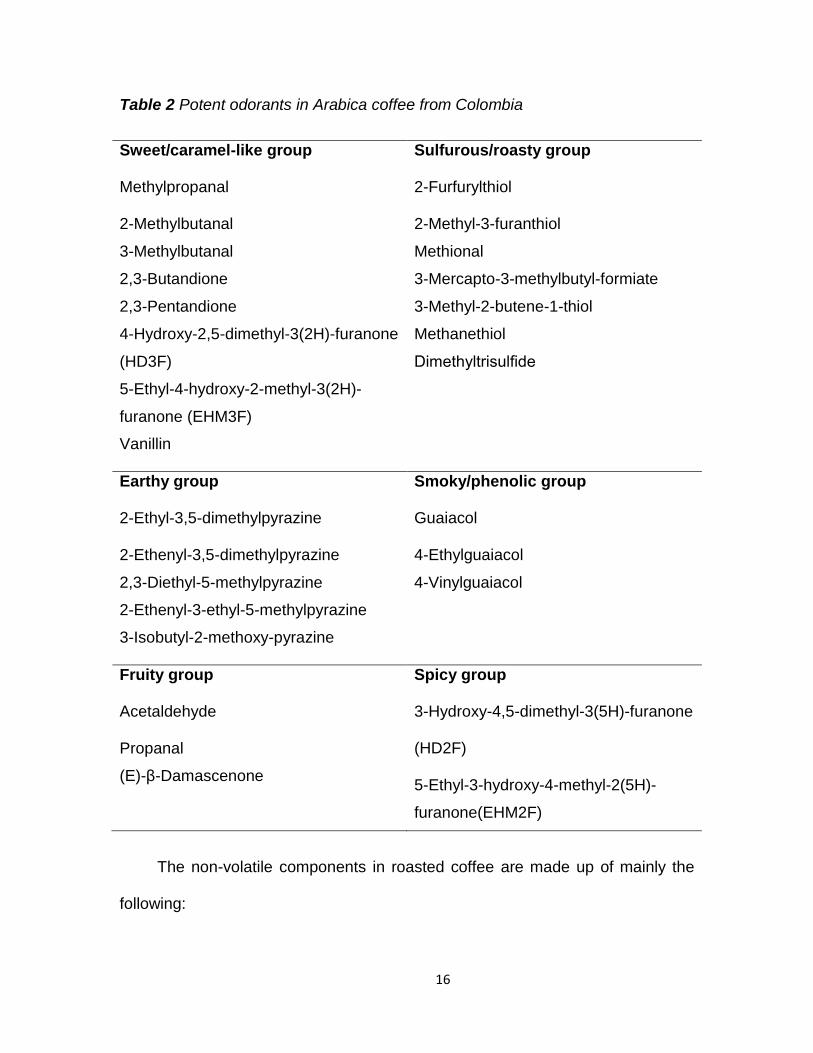
More than 800 volatile compounds have already been identified in roasted
coffee, among which, about 40 compounds are responsible for the characteristic
aroma of coffee (Belitz et al. 2009). Some of these compounds are summarized
in Table 2, showing the odorant groups that they are being categorized to
(Semmelroch et al. 1995; Czerny et al. 1999; Mayer et al. 2000).
16
Table 2 Potent odorants in Arabica coffee from Colombia
Sweet/caramel-like group
Methylpropanal
2-Methylbutanal
3-Methylbutanal
2,3-Butandione
2,3-Pentandione
4-Hydroxy-2,5-dimethyl-3(2H)-furanone
(HD3F)
5-Ethyl-4-hydroxy-2-methyl-3(2H)-
furanone (EHM3F)
Vanillin
Sulfurous/roasty group
2-Furfurylthiol
2-Methyl-3-furanthiol
Methional
3-Mercapto-3-methylbutyl-formiate
3-Methyl-2-butene-1-thiol
Methanethiol
Dimethyltrisulfide
Earthy group
2-Ethyl-3,5-dimethylpyrazine
2-Ethenyl-3,5-dimethylpyrazine
2,3-Diethyl-5-methylpyrazine
2-Ethenyl-3-ethyl-5-methylpyrazine
3-Isobutyl-2-methoxy-pyrazine
Smoky/phenolic group
Guaiacol
4-Ethylguaiacol
4-Vinylguaiacol
Fruity group
Acetaldehyde
Propanal
(E)-β-Damascenone
Spicy group
3-Hydroxy-4,5-dimethyl-3(5H)-furanone
(HD2F)
5-Ethyl-3-hydroxy-4-methyl-2(5H)-
furanone(EHM2F)
The non-volatile components in roasted coffee are made up of mainly the
following:
17
(1) Proteins, peptides and amino acids: Crude protein content is relatively
stable during roasting, while the free amino acids decrease by 30%, with dark
roast espresso reaching up to 50% (Belitz et al. 2009). Protein content plays an
important role in espresso coffee as it affects the foamability of the beverage that
the foamability increased generally with increase total protein concentration until
a maximum value is reached (Nunes et al. 1997). The composition of the amino
acids vary dependent on their thermal stability and reactions involved. For
instance, changes in glutamic acid content are less dramatic as compared to
cysteine and arginine. The latter amino acids tend to deplete rapidly during
roasting due to their involvement in Maillard browning reactions (Illy & Viani
2005).
(2) Carbohydrates: Only traces of free mono and disaccharides in green
coffee remain after roasting. Cellulose, hemicellulose, arabinogalactan and
pectins play important roles in the retention of volatiles and contribute to coffee
brew viscosity. It is reported that in espresso coffee, the foam stability is related
to the amount of galactomannan and arabinogalactan (Nunes et al. 1997).
(3) Non-volatile lipids and lipid-solubles: Triglycerides, terpenes,
tocopherols and sterols contribute to brew viscosity. The lipid fraction tends to be
stable and survive the roasting process with only minor changes. Linoleic and
palmitic acids are the predominant fatty acids in coffee. Cafestol and kahweol are
diterpenes that degrade by the roasting process. Another diterpene, 16-O-
methylcafestol, is present in Robusta but not Arabica coffee, making it a suitable
18
indicator for detecting Robusta content in coffee blend (Speer et al. 1991; Belitz
et al. 2009).
(4) Caffeine: Caffeine is of major importance with respect to the
physiological properties of coffee, and also in determining the strength, body and
bitterness of brewed coffee. The caffeine content of green coffee beans varies
according to the species that Robusta coffee contains about 2.2%, and Arabica
about 1.2%. Environmental and agricultural factors appear to have a minimal
effect on caffeine content. During roasting there is no significant loss in terms of
caffeine (Ramalakshmi & Raghavan 1999). However, caffeine content per 177
mL (6 oz) of coffee range from 50 to 143 mg, depending on the mode of
preparation(Rogers & Richardson 1993; Bell et al. 1996). Bell and others (Bell et
al. 1996) reported that more coffee solids, larger extents of grinding, and larger
volumes of coffee prepared at a constant coffee solids to water ratio led to
significantly higher caffeine content. Home-grinding yielded caffeine content
similar to that of store-ground coffee, and boiled coffee had caffeine contents
equal to or greater than filtered coffee (Bell et al. 1996).
(5) Acids: Acids are responsible for acidity, which together with aroma and
bitterness is a key contributor to the total sensory impact of a coffee beverage.
Carboxylic acids, mainly citric, malic and acetic acids are responsible for acidity
in brewed coffees. Arabica coffee brews are more acidic (pH 4.85-5.15) than
Robusta brews (pH 5.25-5.40) (Vitzthum 1975).
(6) Melanoidins: The final products of the Maillard reaction between amino
acids and monosaccharides, are the brown-coloured substances that impart to
19
roasted coffee its characteristic color, possess antioxidant activity, and affect on
the flavor volatiles (Hofmann & Schieberle 2001; Del Castillo et al. 2002; Vignoli
et al. 2011).
2.5 Fourier transform infrared (FTIR) spectroscopy
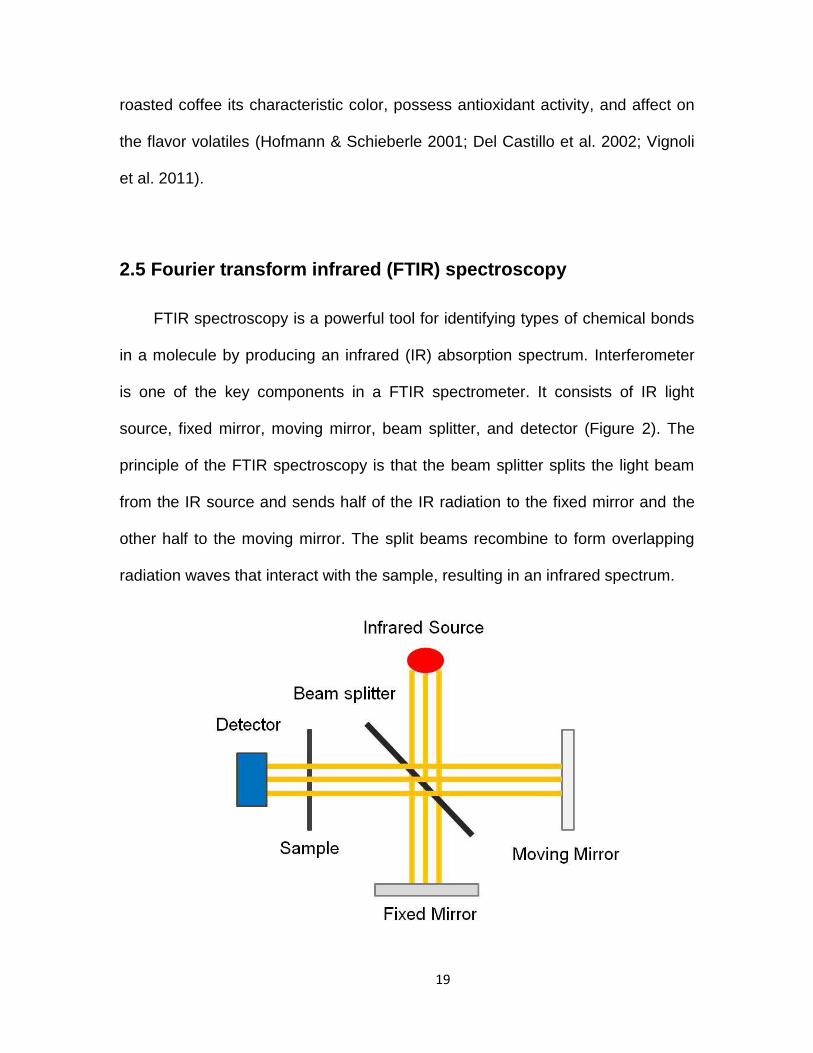
FTIR spectroscopy is a powerful tool for identifying types of chemical bonds
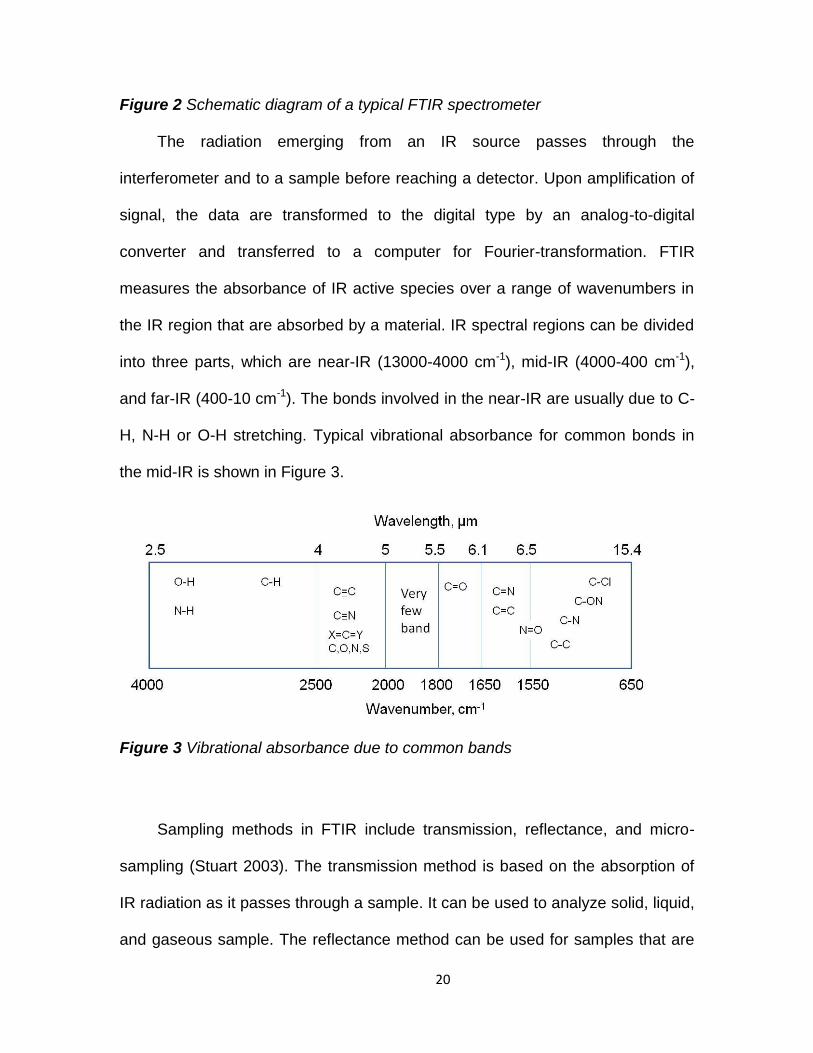
in a molecule by producing an infrared (IR) absorption spectrum. Interferometer
is one of the key components in a FTIR spectrometer. It consists of IR light
source, fixed mirror, moving mirror, beam splitter, and detector (Figure 2). The
principle of the FTIR spectroscopy is that the beam splitter splits the light beam
from the IR source and sends half of the IR radiation to the fixed mirror and the
other half to the moving mirror. The split beams recombine to form overlapping
radiation waves that interact with the sample, resulting in an infrared spectrum.
20
Figure 2 Schematic diagram of a typical FTIR spectrometer
The radiation emerging from an IR source passes through the
interferometer and to a sample before reaching a detector. Upon amplification of
signal, the data are transformed to the digital type by an analog-to-digital
converter and transferred to a computer for Fourier-transformation. FTIR
measures the absorbance of IR active species over a range of wavenumbers in
the IR region that are absorbed by a material. IR spectral regions can be divided
into three parts, which are near-IR (13000-4000 cm-1), mid-IR (4000-400 cm-1),
and far-IR (400-10 cm-1). The bonds involved in the near-IR are usually due to C-
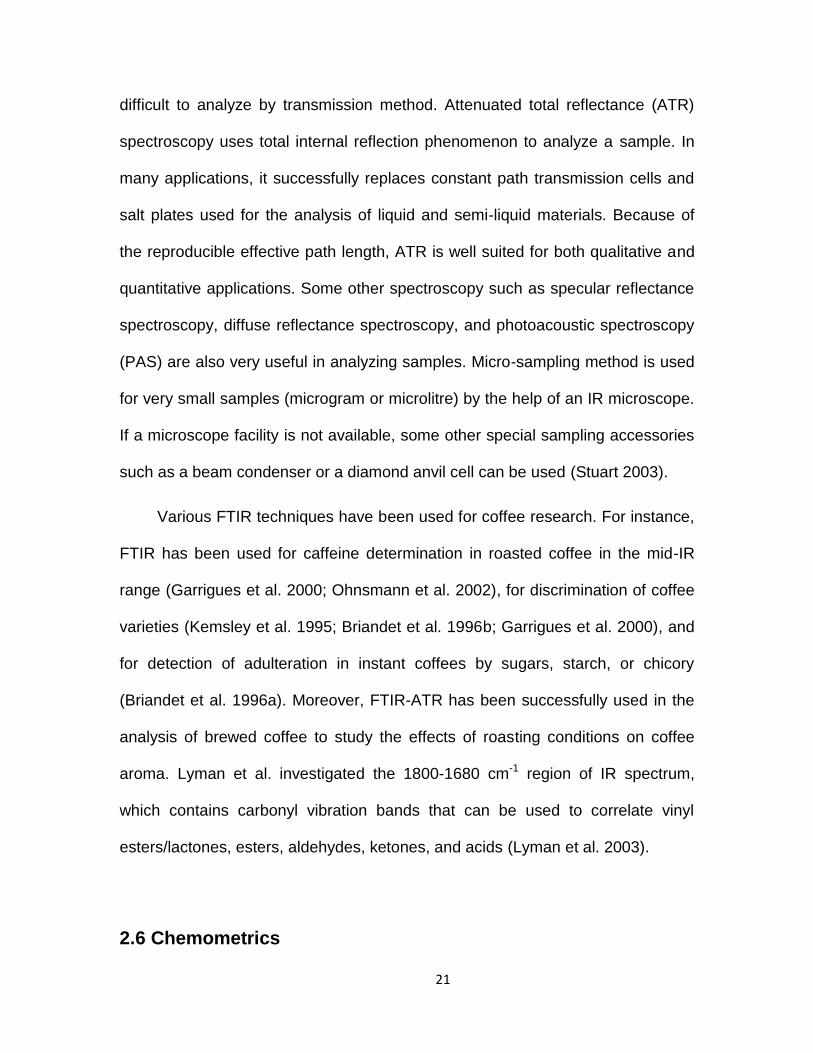
H, N-H or O-H stretching. Typical vibrational absorbance for common bonds in
the mid-IR is shown in Figure 3.
Figure 3 Vibrational absorbance due to common bands
Sampling methods in FTIR include transmission, reflectance, and micro-
sampling (Stuart 2003). The transmission method is based on the absorption of
IR radiation as it passes through a sample. It can be used to analyze solid, liquid,
and gaseous sample. The reflectance method can be used for samples that are
21
difficult to analyze by transmission method. Attenuated total reflectance (ATR)
spectroscopy uses total internal reflection phenomenon to analyze a sample. In
many applications, it successfully replaces constant path transmission cells and
salt plates used for the analysis of liquid and semi-liquid materials. Because of
the reproducible effective path length, ATR is well suited for both qualitative and
quantitative applications. Some other spectroscopy such as specular reflectance
spectroscopy, diffuse reflectance spectroscopy, and photoacoustic spectroscopy
(PAS) are also very useful in analyzing samples. Micro-sampling method is used
for very small samples (microgram or microlitre) by the help of an IR microscope.
If a microscope facility is not available, some other special sampling accessories
such as a beam condenser or a diamond anvil cell can be used (Stuart 2003).
Various FTIR techniques have been used for coffee research. For instance,
FTIR has been used for caffeine determination in roasted coffee in the mid-IR
range (Garrigues et al. 2000; Ohnsmann et al. 2002), for discrimination of coffee
varieties (Kemsley et al. 1995; Briandet et al. 1996b; Garrigues et al. 2000), and
for detection of adulteration in instant coffees by sugars, starch, or chicory
(Briandet et al. 1996a). Moreover, FTIR-ATR has been successfully used in the
analysis of brewed coffee to study the effects of roasting conditions on coffee
aroma. Lyman et al. investigated the 1800-1680 cm-1 region of IR spectrum,
which contains carbonyl vibration bands that can be used to correlate vinyl
esters/lactones, esters, aldehydes, ketones, and acids (Lyman et al. 2003).
2.6 Chemometrics
22
Chemometrics can be generally described as the application of
mathematical and statistical methods to improve chemical measurement
processes, and extract more useful information from chemical and physical
measurement data (Workman et al. 1996; Paul 2006; Fu 2011).
In general, there are three categories of chemometric analysis (InfoMetrix
2010):
(1) Exploratory data analysis is often used to reveal hidden patterns in
complex data by reducing the information to a more comprehensible form, to
expose possible outliers, and to indicate whether there are patterns or trends in
the dataset. Principal component analysis (PCA) and hierarchical cluster analysis
(HCA) are some of the exploratory algorithms.
(2) Continuous property regression is used to develop calibration models
that correlate the information in a set of known measurements to the property of
interest. Partial least squares (PLS) and principal component regression (PCR)
are two algorithms commonly used for regression and are designed to avoid
problems associated with noise in the data.
(3) Classification modeling is applied in scenarios where samples are
required to be classified into predefined categories or "classes". A classification
model is used to assign a sample's class by comparing the sample to a
previously analyzed data set, for which its categories are already known. PLS
discriminant analysis (PLS-DA), k-nearest neighbor (KNN) and soft independent
modeling of class analogy (SIMCA) are some of the primary chemometric
workhorses in classification modeling.
23
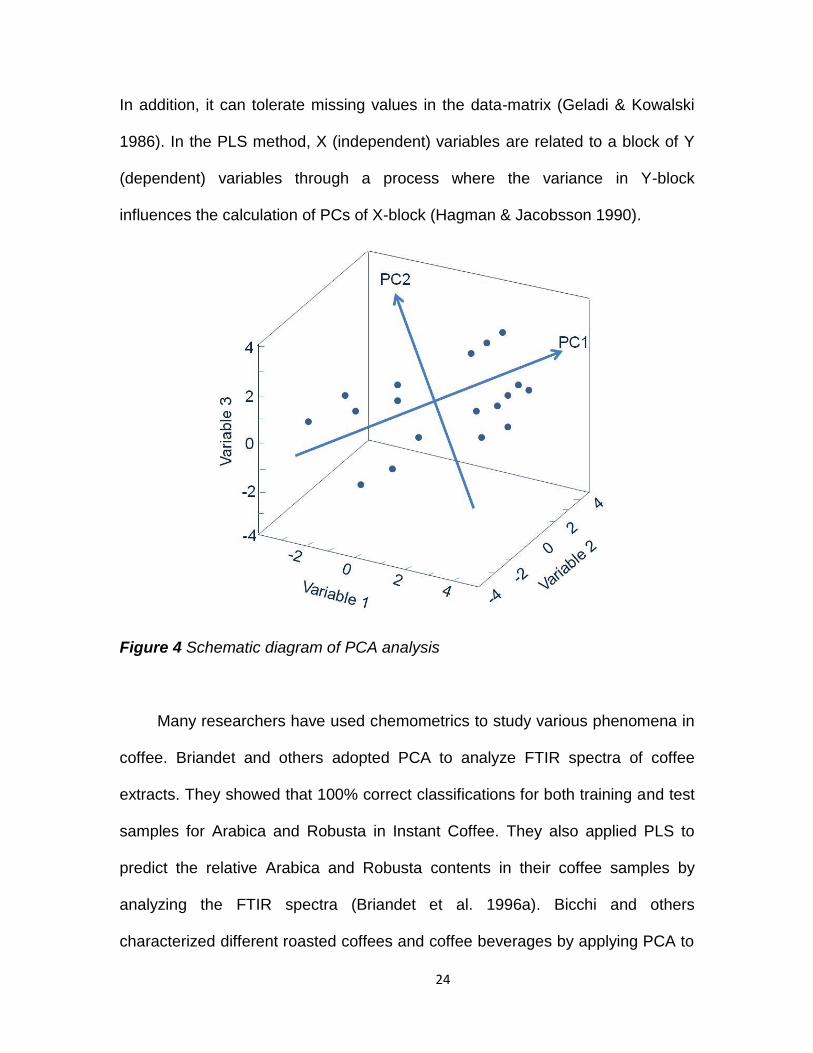
Among the chemometric analyses used, PCA by far is the most commonly
used. It is a linear and non-parametric pattern recognition technique which
reduces multidimensionality by correlating data to two or three dimensions (Anil
et al. 2004). The goal of PCA is to visualize the inherent data structure and reveal
how different variables change in relation to each other. This is achieved by
transforming correlated original variables into a new set of uncorrelated
underlying variables, known as principal components (PCs), using the covariance
matrix. The new variables are linear combinations of the original ones. The
principle of PCA can be illustrated using a simple dataset, where the 3 variables
needed to describe the dataset are represented by three axes in the data-space
(Figure 4). PC1 has a direction that takes into account as much variance in the
data as possible. PC2, orthogonal to PC1, has a direction where the second
largest variance occurs. The objects are then projected down to the plane of the
two PCs. A large data-set may therefore be represented by only a few PCs,
which describe a large part of the variance in the data as a linear combination of
the original variables. PCA is very useful for solving pattern recognition problems
arising from chromatographic and spectroscopic data (Hagman & Jacobsson
1990).
On other hand, PLS is a useful multivariate regression technique for
correlating two or more blocks of data with each other, or predicting a value of
one block by using the data from the other block that is easier to measure
(Gerlach et al. 1979). PLS can handle more than one dependent variable and is
not significantly influenced by the correlation between the independent variables.
24
In addition, it can tolerate missing values in the data-matrix (Geladi & Kowalski
1986). In the PLS method, X (independent) variables are related to a block of Y
(dependent) variables through a process where the variance in Y-block
influences the calculation of PCs of X-block (Hagman & Jacobsson 1990).
Figure 4 Schematic diagram of PCA analysis
Many researchers have used chemometrics to study various phenomena in
coffee. Briandet and others adopted PCA to analyze FTIR spectra of coffee
extracts. They showed that 100% correct classifications for both training and test
samples for Arabica and Robusta in Instant Coffee. They also applied PLS to
predict the relative Arabica and Robusta contents in their coffee samples by
analyzing the FTIR spectra (Briandet et al. 1996a). Bicchi and others
characterized different roasted coffees and coffee beverages by applying PCA to
25
chromatographic data obtained by headspace solid phase microextraction (HS-
SPME), and the results showed that coffees from different origins can be
successfully separated (Bicchi et al. 1997). In another study, Charlton and others
applied PCA to analyze Nuclear magnetic resonance (NMR) spectra from 98
coffee samples obtained from three different producers (Charlton et al. 2002). In
their study, 99% of the samples were correctly classified accordingly to their
manufacturers. Also, blind testing of the PCA model with a further 36 samples of
instant coffee resulted in a 100% success rate in identifying the samples from the
three manufacturers.
26
3 OBJECTIVES
Currently, integrated studies are lacking on elucidating the effects of bean
variety and roast degree, under different time-temperature conditions, on the
physical and chemical properties of coffee. The objectives of this study are:
To analyze coffee from different geographical origins (Colombia, Costa
Rica, Ethiopia, and Kenya) processed to medium and dark roasts, using
FTIR spectroscopy and chemometric analysis.
Developing the understanding of the effects of time-temperature
conditions on the physicochemical properties (color, moisture contents, pH,
titratable acidity, and microstructure) of coffee from Brazil.
To study the physicochemical changes (color, moisture contents, pH,
titratable acidity, and microstructure) in coffee beans at different stages of
roast using FTIR spectroscopy and chemometric analysis.
27
4 FEASIBILITY STUDY ON CHEMOMETRIC DISCRIMINATION OF
ROASTED ARABICA COFFEES BY SOLVENT EXTRACTION AND
FOURIER TRANSFORM INFRARED SPECTROSCOPY
4.1 Introduction
Coffee is one of the most popular beverages in the world due to its unique
aroma, taste, and stimulating effects of caffeine. The quality of brewed coffee is
affected by many parameters. Depending on the species (Arabica, Robusta, or
Liberica) and method used to process the coffee cherries (dry vs wet), the overall
quality and chemical composition of coffee bean can vary considerably. By and
large, the Arabica coffees have more pronounced and finer flavor profiles that are
considered better quality and, accordingly, command a higher price than the
Robusta and Liberica coffees (Davis 2001). The composition of the soil and its
fertilization, the altitude and weather of the plantation, and the final cultivation
and drying methods used will all affect the green bean quality (Costa Freitas &
Mosca 1999). Roasting, the final processing step before grinding and brewing,
ultimately determines the organoleptic properties of the coffee beverage. During
the roasting process, the reactions that occur in the coffee bean are complex and
strongly dependent on the time-temperature profile used (Lyman et al. 2003;
Baggenstoss et al. 2008).
Grading of whole roasted coffee beans is relatively easy as compared to
ground coffee due to the presence of visual clues in the former (size, shape,
defect, etc.). By contrast, these indicators are absent for ground coffees;
28
therefore, sample discriminating can be difficult. Often time, sensory evaluation
and cupping are needed (Martin et al. 1999). Analytical methods have been
successfully used for component analysis of coffee, including mineral contents
(Krivan et al. 1993; Martin et al. 1999), volatile compounds (Silvia et al. 2004),
chlorogenic acids (Maria et al. 1998), fatty acids (Bertrand et al. 2008), and
amino acid enantiomers (Casal et al. 2003).
FTIR spectroscopy is a rapid and non-destructive technique that has been
used for investigating covalent bond vibration in coffee. This method has been
used to determine the caffeine content in roasted coffee (Garrigues et al. 2000;
Ohnsmann et al. 2002), to discriminate coffee varieties (Kemsley et al. 1995;
Briandet et al. 1996b; Garrigues et al. 2000), and to detect adulteration in instant
coffees (Briandet et al. 1996a). Because of the complexity of FTIR spectral data,
chemometric analysis [e.g., PCA and SIMCA] is often used to reduce the
dimensionality of spectral data to aid the extraction of useful information,
identification of natural data trends, and classification unknown samples
(Hendriks et al. 2005). Chemometric analysis has been successfully applied to
analyze FTIR spectral data of coffee, for instance in the chemical discrimination
of Arabica and Robusta coffees (Briandet et al. 1996b), quality control and
authentication of instant coffees (Charlton et al. 2002), and adulteration detection
of freeze-dried instant coffees (Briandet et al. 1996a).
In this study, we employed ATR-FTIR to analyze coffee extracts prepared
using six organic solvents (dichloromethane, ethyl acetate, hexane, acetone,
ethanol, and acetic acid). Our objective was to investigate the feasibility of using
29
infrared spectral data of these extracts, in conjunction with PCA and SIMCA, to
discriminate four Arabica ground coffees from different origins (Colombia, Costa
Rica, Ethiopia, and Kenya) that had been roasted to two roast degrees (medium
or dark).
4.2 Materials and Methods
4.2.1 Chemicals
Hexane was purchased from Sigma-Aldrich Ltd. (St. Louis, MO).
Dichloromethane, ethyl acetate, acetone, and acetic acid were purchased from
Fisher Scientific (Ottawa, Canada). Ethanol was purchased from Greenfield
Ethanol Inc. (Brampton, Canada).
4.2.2 Coffee Beans and Roasting Conditions
Wet-processed green coffee beans (Arabica variety) from Colombia, Costa
Rica, Kenya, and Ethiopia were purchased from Green Beanery (Toronto,
Canada). Green coffee beans (45 g) were roasted in a fluidized bed hot air
roaster (Fresh Roast SR 500, Fresh Beans Inc., Park City, UT). Two isothermal
roasting programs were used for preparing dark and medium roast coffees
(Figure 5). The roasted beans were stored in hermetic glass bottles in the dark at
15°C before grinding.
30
Figure 5 Air temperature (in roast chamber) profiles of the fluidized bed hot air
coffee roaster
4.2.3 Degree of Roast as Determined by Color Measurements
Roasted coffee beans were ground using a coffee grinder (Bodum Antigua
Electric Burr Grinder, Bodum, Inc., Copenhagen, Denmark) at the medium grind
setting. The color of the ground coffee was measured in the L*, a*, b* system
using a Konica Minolta CM-3500d spectrophotometer (Konica Minolta Sensing,
Inc., Osaka, Japan) in the reflectance mode. Before analysis, the instrument was
calibrated on a white standard tile. Measurements were taken in triplicate.
4.2.4 Solvent Extraction of Ground Coffee
After grinding, coffee grounds were extracted with dichloromethane, ethyl
acetate, hexane, acetone, ethanol, or acetic acid, following two extraction
25
50
75
100
125
150
175
200
225
250
0 50 100 150 200 250 300 350 400 450 500 550
Ro
asti
ng
Tem
pera
ture
, oC
Roasting Time, S
Medium roast profile
Dark roast profile
31
procedures. In the first procedure (method #1), 0.2500 g of ground coffee was
accurately weighed into a glass vial, and 1 mL deionized water was added to wet
the sample. The glass vial was shaken for 1 min with an IKA-VIBRAX-VXR
vibrator (Janke & Kunkel, Inc., Staufen, Germany) at the 200 dial setting; 1 mL of
organic solvent was added and the mixture was shaken for an additional 5 min.
The organic phase was then transferred to another vial and allowed to rest for 10
min before ATR-FTIR analysis. In the second procedure (method #2), a similar
procedure was used except that water was not added prior to solvent extraction.
All extractions were performed in triplicate.
4.2.5 ATR-FTIR Analysis
The coffee extract was scanned using an FTIR spectrometer (IR Prestige-
21; Shimadzu Corp., Tokyo, Japan) equipped with a deuterated triglycine sulfate
detector and a KBr beam-splitter. A MIRacle ATR accessory equipped with a
diamond crystal (Pike Technologies, Madison, WI) was used for sampling. The
background spectrum was collected using an empty ATR cell. To collect each IR
spectrum, coffee extract (6 μL) was placed onto the ATR crystal, and the solvent
was allowed to evaporate until no further changes through consistently controlling
evaporation time during the experiment in IR spectrum were observed. This
technique removed interference from the solvent signals and increased the
sensitivity of chemometric analysis. The times required for complete evaporation
of solvent were different due to the different solubilities of each solvent in water.
Samples were scanned from 600 to 4000 cm−1 at 4 cm−1 resolution. Each
spectrum was an average of 20 scans. For each extract, 3 FTIR spectra
32
replicates were scanned. Between samples, the ATR crystal was carefully
cleaned with 95% (v/v) aqueous ethanol solution, and dried with lint-free tissue
paper. The spectral baseline was examined visually to ensure that no residue
from the previous sample was retained on the crystal. All spectra were recorded
at room temperature (23 ± 0.5 °C).
4.2.6 Data Analysis
Statistical comparison of color values of ground coffee samples was
conducted based on Tukey pairwise comparisons using R software (www.r-
project.org). For chemometric analysis, FTIR spectra were exported as ASCII
format, organized in Excel spreadsheets, and then analyzed using Pirouette v.4.0
software (Woodinville, WA). During PCA, second derivative and mean-center
were applied to FTIR spectra to reduce baseline variation and enhance spectral
features. Nine spectra (3 extracts for each coffee and 3 replicate spectra for each
extract) for each coffee were divided into two groups: 6 spectra from the first two
extracts were used to calibrate the SIMCA model, while the remaining 3 spectra
from the third extract were used for validation to evaluate the prediction accuracy
of the calibrated SIMCA model. The optimum number of PCs in each class was
selected on the basis of the lowest number of PCs giving minimum value of
variance.
4.3 Results and Discussions
33
4.3.1 Optimization of Solvent Extraction for FTIR-ATR
From the preliminary experiments, we observed that wetting of coffee grinds
prior to solvent treatment was necessary to enhance extraction. The effects of
deionised water, NH4OH solutions (0.25, 0.5, 0.75, and 2.5 M), and HCl solutions
(0.05, 0.1, 0.15, and 0.25 M) on coffee wetting were evaluated at different
volumes (0.5, 1.0, and 1.5 mL). The FTIR spectra data showed that there was no
significant difference between alkaline, acid, and neutral wetted samples (data
not shown). There was no difference between adding 0.5 mL and 1.0 mL
solutions, but spectral intensities were weakened when 1.5 mL of aqueous
solutions were added, probably due to the dilution effect. On the basis of the
positive preliminary experiment findings, 1.0 mL water was added during ground
coffee extraction.
The effects of water on the solvent extraction have been reported previously.
Yamamoto et al. studied the efficiency of various organic solvents for cadmium
dithizonate extraction from an aliquot of cadmium solution, and found that an
enhanced extraction efficiency of extraction was achieved by using a 50%
aqueous phase/solvent volume ratio (Yamamoto et al. 1972). Murphy et al.
reported that solvent at 53% (organic phase to water) was the most efficient in
maximizing the isoflavone extraction in soy food matrix (Murphy et al. 1999).
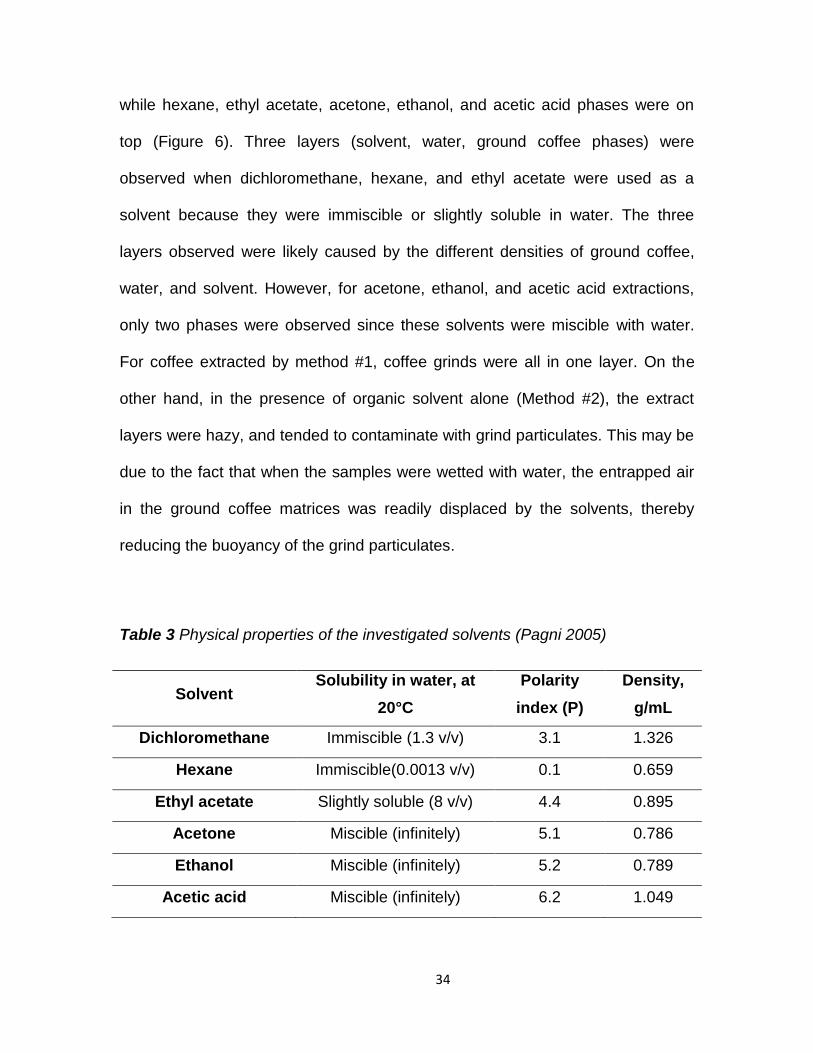
During the extraction of ground coffee, different phase separation
behaviours were observed among the tested solvents due to their different
physical properties (Table 3). When extraction was carried out in the presence of
water (Method #1), the solvent phase of dichloromethane was at the bottom,
34
while hexane, ethyl acetate, acetone, ethanol, and acetic acid phases were on
top (Figure 6). Three layers (solvent, water, ground coffee phases) were
observed when dichloromethane, hexane, and ethyl acetate were used as a
solvent because they were immiscible or slightly soluble in water. The three
layers observed were likely caused by the different densities of ground coffee,
water, and solvent. However, for acetone, ethanol, and acetic acid extractions,
only two phases were observed since these solvents were miscible with water.
For coffee extracted by method #1, coffee grinds were all in one layer. On the
other hand, in the presence of organic solvent alone (Method #2), the extract
layers were hazy, and tended to contaminate with grind particulates. This may be
due to the fact that when the samples were wetted with water, the entrapped air
in the ground coffee matrices was readily displaced by the solvents, thereby
reducing the buoyancy of the grind particulates.
Table 3 Physical properties of the investigated solvents (Pagni 2005)
Solvent Solubility in water, at
20°C
Polarity
index (P)
Density,
g/mL
Dichloromethane Immiscible (1.3 v/v) 3.1 1.326
Hexane Immiscible(0.0013 v/v) 0.1 0.659
Ethyl acetate Slightly soluble (8 v/v) 4.4 0.895
Acetone Miscible (infinitely) 5.1 0.786
Ethanol Miscible (infinitely) 5.2 0.789
Acetic acid Miscible (infinitely) 6.2 1.049
35
Dichloromethane Extract
Hexane Extract
Ethyl acetate Extract
Acetone Extract
Ethanol Extract
Acetic acid Extract
Figure 6 Appearance of coffee extracts by dichloromethane, hexane, ethyl
acetate, acetone, ethanol, and acetic acid (the right vial represent the extracts by
Method #1)
In order to increase the sensitivity of FTIR analysis, extracts were allowed
to evaporate on the ATR crystal to remove the solvent. The required times for
completing evaporation of solvent are summarized in Table 4. As shown,
dichloromethane, and hexane had relatively short evaporation times due to their
immiscibility with water. Intermediate evaporation time was observed for ethyl
acetate since it is partially soluble in water. By contrast, acetone, ethanol, and
acetic acid are completely miscible with water, resulting in relatively long
evaporation times. The extended evaporation time for these solvents may not be
desirable due to the potential loss of coffee volatile compounds (Mottaleb et al.
1997) .
36
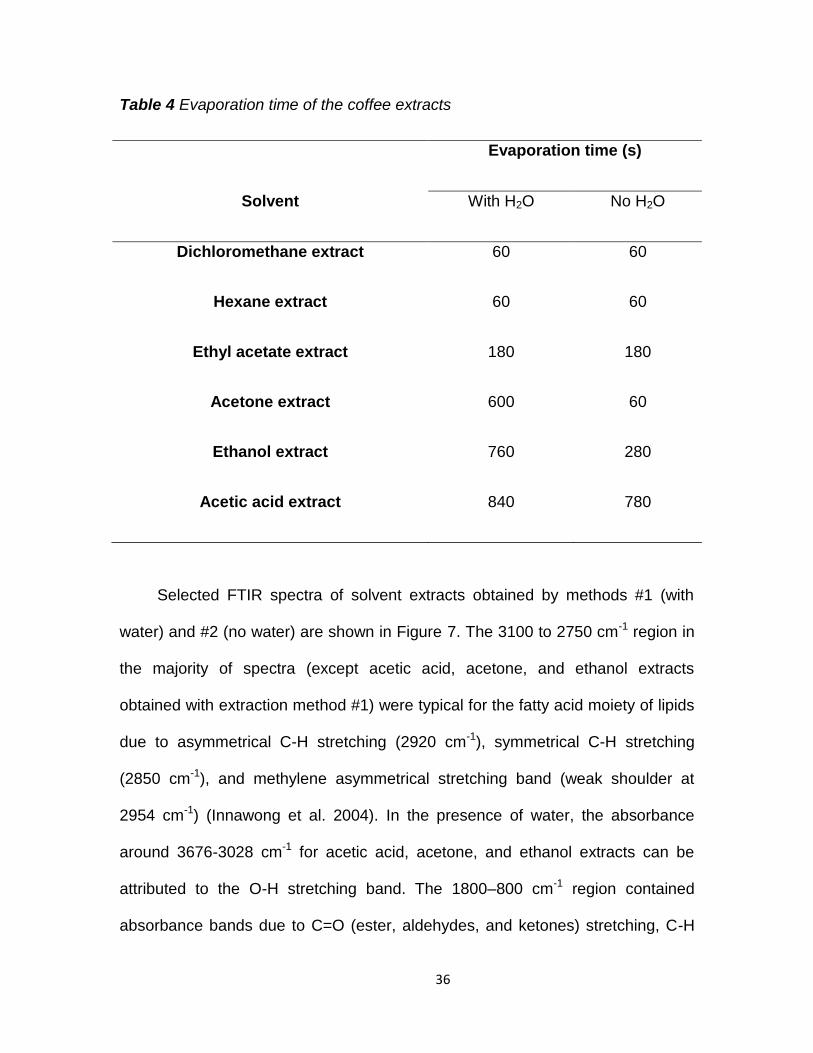
Table 4 Evaporation time of the coffee extracts
Evaporation time (s)
Solvent With H2O No H2O
Dichloromethane extract 60 60
Hexane extract 60 60
Ethyl acetate extract 180 180
Acetone extract 600 60
Ethanol extract 760 280
Acetic acid extract 840 780
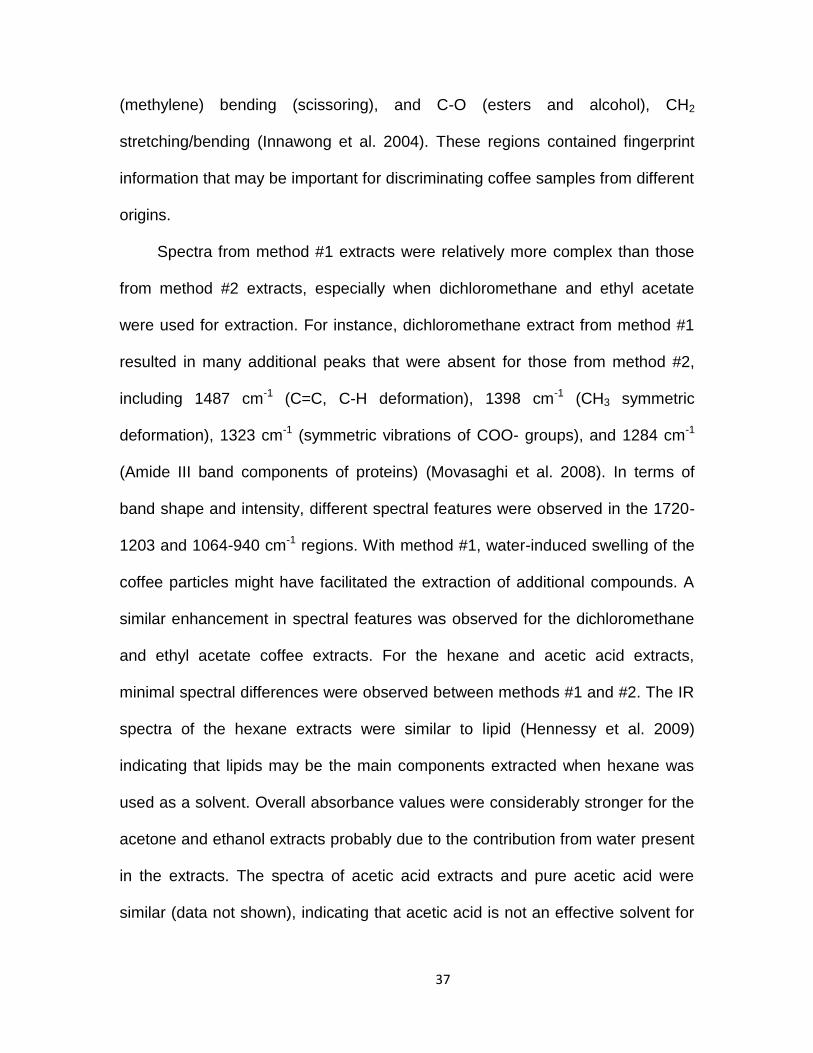
Selected FTIR spectra of solvent extracts obtained by methods #1 (with
water) and #2 (no water) are shown in Figure 7. The 3100 to 2750 cm-1 region in
the majority of spectra (except acetic acid, acetone, and ethanol extracts
obtained with extraction method #1) were typical for the fatty acid moiety of lipids
due to asymmetrical C-H stretching (2920 cm-1), symmetrical C-H stretching
(2850 cm-1), and methylene asymmetrical stretching band (weak shoulder at
2954 cm-1) (Innawong et al. 2004). In the presence of water, the absorbance
around 3676-3028 cm-1 for acetic acid, acetone, and ethanol extracts can be
attributed to the O-H stretching band. The 1800–800 cm-1 region contained
absorbance bands due to C=O (ester, aldehydes, and ketones) stretching, C-H
37
(methylene) bending (scissoring), and C-O (esters and alcohol), CH2
stretching/bending (Innawong et al. 2004). These regions contained fingerprint
information that may be important for discriminating coffee samples from different
origins.
Spectra from method #1 extracts were relatively more complex than those
from method #2 extracts, especially when dichloromethane and ethyl acetate
were used for extraction. For instance, dichloromethane extract from method #1
resulted in many additional peaks that were absent for those from method #2,
including 1487 cm-1 (C=C, C-H deformation), 1398 cm-1 (CH3 symmetric
deformation), 1323 cm-1 (symmetric vibrations of COO- groups), and 1284 cm-1
(Amide III band components of proteins) (Movasaghi et al. 2008). In terms of
band shape and intensity, different spectral features were observed in the 1720-
1203 and 1064-940 cm-1 regions. With method #1, water-induced swelling of the
coffee particles might have facilitated the extraction of additional compounds. A
similar enhancement in spectral features was observed for the dichloromethane
and ethyl acetate coffee extracts. For the hexane and acetic acid extracts,
minimal spectral differences were observed between methods #1 and #2. The IR
spectra of the hexane extracts were similar to lipid (Hennessy et al. 2009)
indicating that lipids may be the main components extracted when hexane was
used as a solvent. Overall absorbance values were considerably stronger for the
acetone and ethanol extracts probably due to the contribution from water present
in the extracts. The spectra of acetic acid extracts and pure acetic acid were
similar (data not shown), indicating that acetic acid is not an effective solvent for
38
coffee extraction. On the basis of the evaporation time data and FTIR spectral
features observed, dichloromethane, hexane, ethyl acetate, and acetone extracts
obtained via method #1 were selected for subsequent analyses.
Figure 7 FTIR spectra of coffee extracts obtained with hexane, dichloromethane,
ethyl acetate, acetone, ethanol, or acetic acid using method #1 (with water) and
method #2 (no water)
4.3.2 Color Analysis
Ground coffee samples from different geographical regions could not be
distinguished readily by visual inspection. The L* (lightness) values of ground
coffee beans from different geographic regions (Colombia, Costa Rica, Ethiopia,
and Kenya) were similar among medium roast or dark roast samples (Table 5).
0.0
0.4
0.8
1.2
1.6
2.0
2.4
2.8
3.2
3.6
60012001800240030003600
Ab
so
rban
ce
Wavenumber, cm-1
With water
80010001200140016001800Wavenumber, cm-1
Enlarge region (1800-800 cm-1)
No water
No water
With water
Hexane extract
0.0
0.4
0.8
1.2
1.6
2.0
2.4
2.8
3.2
3.6
60012001800240030003600
Ab
so
rban
ce
Wavenumber, cm-1
With water
80010001200140016001800Wavenumber, cm-1
No water
With water
No water
Dichloromethane extract Enlarge region (1800-800 cm-1)
0.0
0.4
0.8
1.2
1.6
2.0
2.4
2.8
3.2
3.6
60012001800240030003600
Ab
so
rban
ce
Wavenumber, cm-180010001200140016001800
Wavenumber, cm-1
No water
With water
No water
With water
Enlarge region (1800-800 cm-1)Ethyl acetate extract
0.0
0.4
0.8
1.2
1.6
2.0
2.4
2.8
3.2
3.6
60012001800240030003600
Ab
so
rban
ce
Wavenumber, cm-1
With water
80010001200140016001800Wavenumber, cm-1
With water
No water
No water
Enlarge region (1800-800 cm-1)Ethanol extract
80010001200140016001800Wavenumber, cm-1
With water
No water
0.0
0.8
1.6
2.4
3.2
4.0
4.8
5.6
6.4
60012001800240030003600
Ab
so
rban
ce
Wavenumber, cm-1
No water
With water
Enlarge region (1800-800 cm-1)Acetic acid extract
0.0
0.4
0.8
1.2
1.6
2.0
2.4
2.8
3.2
3.6
60012001800240030003600
Ab
so
rban
ce
Wavenumber, cm-1
With water
80010001200140016001800Wavenumber, cm-1
No water
With water
No water
Acetone extract Enlarge region (1800-800cm-1)
39
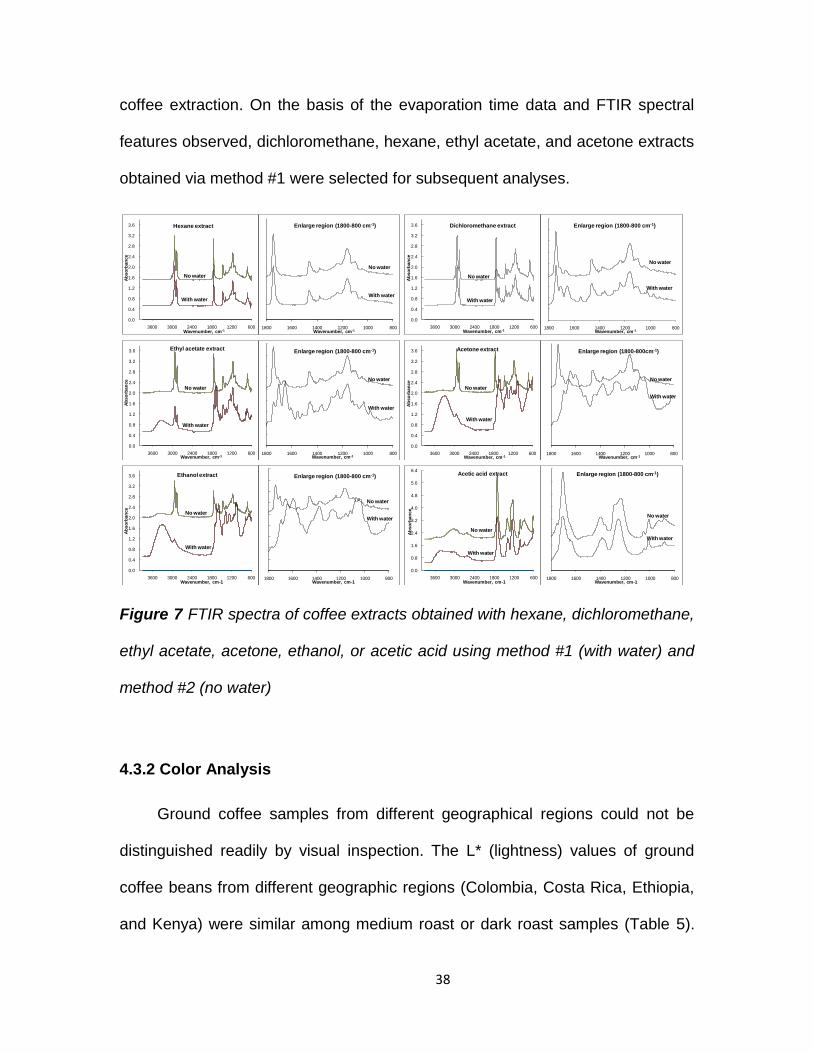
Tukey pairwise comparison analysis (Table 6) confirmed that differences in L*
values were not significant between ground samples for dark or medium roasted
beans, implying that samples from the same degree of roast exhibited the same
lightness.
Table 5 L* Value of Roasted Ground Arabica Coffee Beans
Roast degree Coffee bean sample Lightness [L*]
Dark Colombian 19.83 ± 0.05
Costa Rican 19.61 ± 0.18
Ethiopian 19.46 ± 0.21
Kenyan 19.72 ± 0.06
Medium Colombian 25.21 ± 0.16
Costa Rican 25.35 ± 0.29
Ethiopian 25.64 ± 0.06
Kenyan 25.28 ± 0.09
40
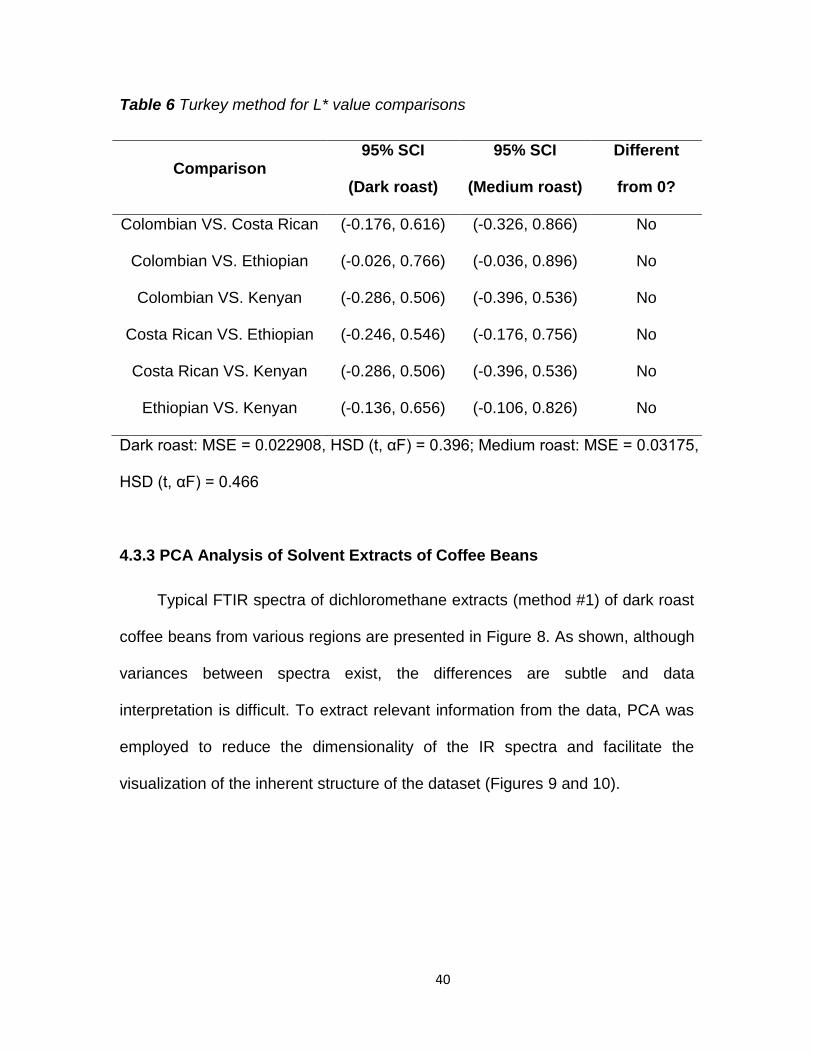
Table 6 Turkey method for L* value comparisons
Comparison 95% SCI
(Dark roast)
95% SCI
(Medium roast)
Different
from 0?
Colombian VS. Costa Rican (-0.176, 0.616) (-0.326, 0.866) No
Colombian VS. Ethiopian (-0.026, 0.766) (-0.036, 0.896) No
Colombian VS. Kenyan (-0.286, 0.506) (-0.396, 0.536) No
Costa Rican VS. Ethiopian (-0.246, 0.546) (-0.176, 0.756) No
Costa Rican VS. Kenyan (-0.286, 0.506) (-0.396, 0.536) No
Ethiopian VS. Kenyan (-0.136, 0.656) (-0.106, 0.826) No
Dark roast: MSE = 0.022908, HSD (t, αF) = 0.396; Medium roast: MSE = 0.03175,
HSD (t, αF) = 0.466
4.3.3 PCA Analysis of Solvent Extracts of Coffee Beans
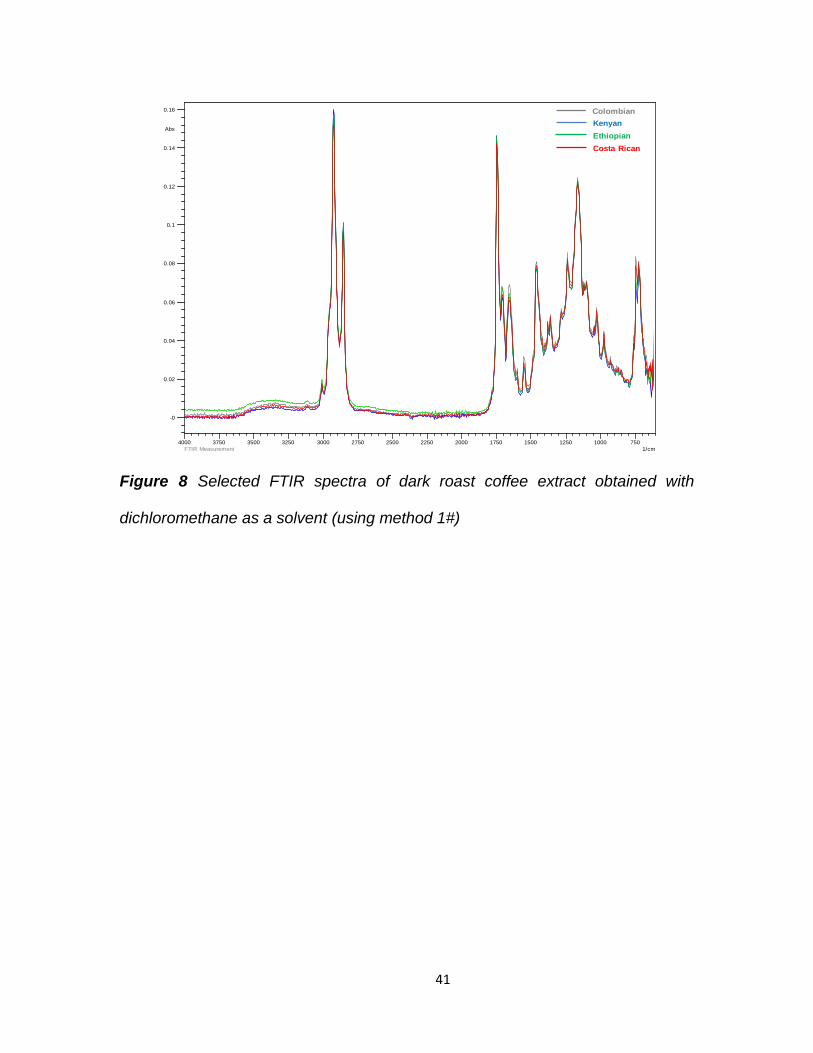
Typical FTIR spectra of dichloromethane extracts (method #1) of dark roast
coffee beans from various regions are presented in Figure 8. As shown, although
variances between spectra exist, the differences are subtle and data
interpretation is difficult. To extract relevant information from the data, PCA was
employed to reduce the dimensionality of the IR spectra and facilitate the
visualization of the inherent structure of the dataset (Figures 9 and 10).
41
Figure 8 Selected FTIR spectra of dark roast coffee extract obtained with
dichloromethane as a solvent (using method 1#)
7501000125015001750200022502500275030003250350037504000
1/cm
-0
0.02
0.04
0.06
0.08
0.1
0.12
0.14
0.16
Abs
HIGH T-COLOM 2-2HIGH T-KENYA 1-1
HIGH T-ETHIOPIAN 1-1HIGH T-COSTA 1-1
FTIR Measurement
Costa Rican
Colombian
Kenyan
Ethiopian
42
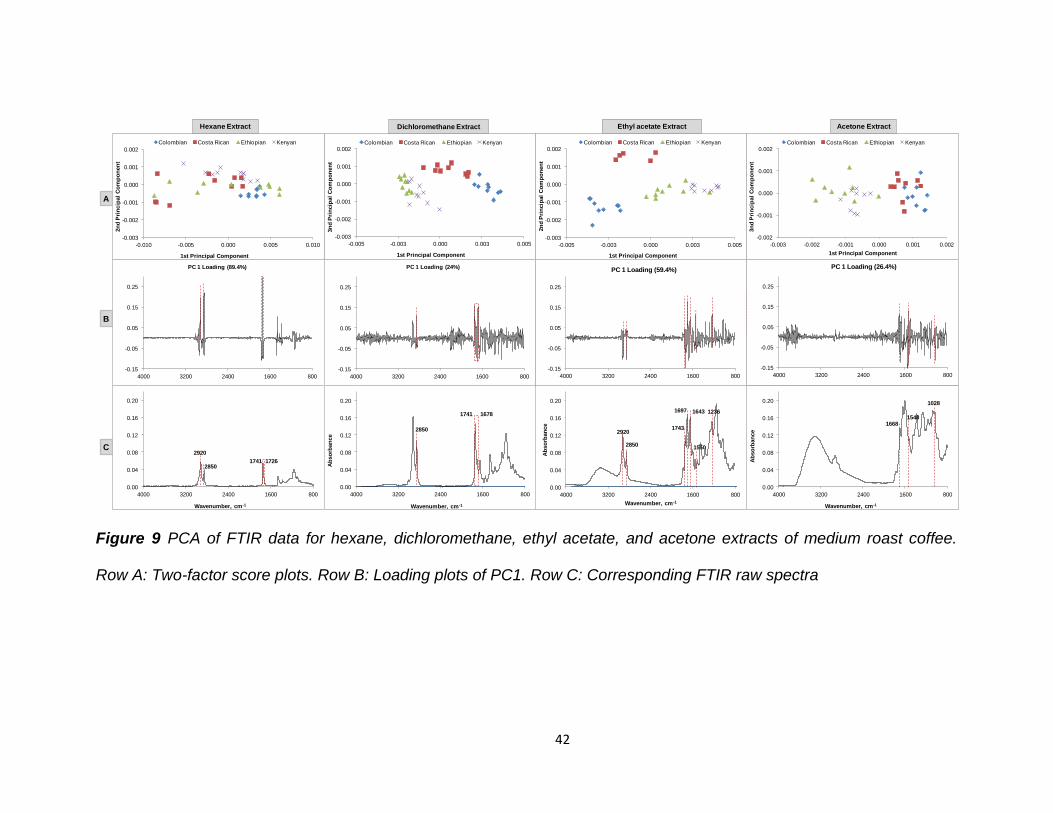
Figure 9 PCA of FTIR data for hexane, dichloromethane, ethyl acetate, and acetone extracts of medium roast coffee.
Row A: Two-factor score plots. Row B: Loading plots of PC1. Row C: Corresponding FTIR raw spectra
A
B
C
-0.003
-0.002
-0.001
0.000
0.001
0.002
-0.010 -0.005 0.000 0.005 0.010
2n
d P
rin
cip
al
Co
mp
on
en
t
1st Principal Component
Colombian Costa Rican Ethiopian Kenyan
Hexane Extract
-0.003
-0.002
-0.001
0.000
0.001
0.002
-0.005 -0.003 0.000 0.003 0.005
3n
d P
rin
cip
al
Co
mp
on
en
t
1st Principal Component
Colombian Costa Rican Ethiopian Kenyan
Dichloromethane Extract
-0.003
-0.002
-0.001
0.000
0.001
0.002
-0.005 -0.003 0.000 0.003 0.005
2n
d P
rin
cip
al
Co
mp
on
en
t
1st Principal Component
Colombian Costa Rican Ethiopian Kenyan
Ethyl acetate Extract
-0.002
-0.001
0.000
0.001
0.002
-0.003 -0.002 -0.001 0.000 0.001 0.002
3n
d P
rin
cip
al
Co
mp
on
en
t
1st Principal Component
Colombian Costa Rican Ethiopian Kenyan
Acetone Extract
-0.15
-0.05
0.05
0.15
0.25
8001600240032004000
PC 1 Loading (89.4%)
-0.15
-0.05
0.05
0.15
0.25
8001600240032004000
PC 1 Loading (24%)
0.00
0.04
0.08
0.12
0.16
0.20
8001600240032004000
Ab
so
rban
ce
Wavenumber, cm-1
2850
1741 1678
0.00
0.04
0.08
0.12
0.16
0.20
8001600240032004000
Ab
so
rban
ce
Wavenumber, cm-1
16681548
1028
0.00
0.04
0.08
0.12
0.16
0.20
8001600240032004000
Wavenumber, cm-1
2850
2920
1741 1726
-0.15
-0.05
0.05
0.15
0.25
8001600240032004000
PC 1 Loading (59.4%)
0.00
0.04
0.08
0.12
0.16
0.20
8001600240032004000
Ab
so
rban
ce
Wavenumber, cm-1
2920
2850
1236
1550
16431697
1743
-0.15
-0.05
0.05
0.15
0.25
8001600240032004000
PC 1 Loading (26.4%)
43
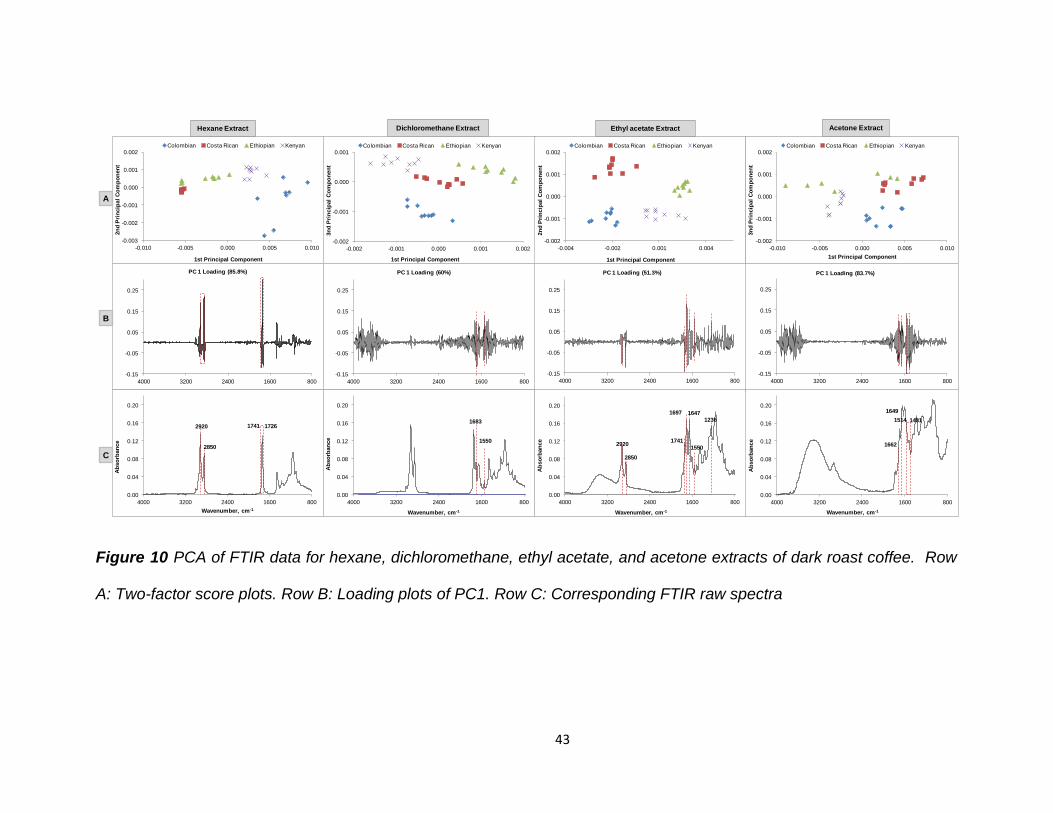
Figure 10 PCA of FTIR data for hexane, dichloromethane, ethyl acetate, and acetone extracts of dark roast coffee. Row
A: Two-factor score plots. Row B: Loading plots of PC1. Row C: Corresponding FTIR raw spectra
Hexane Extract
Dic
hlo
rom
eth
an
e
Ethyl acetate Extract
Ace
ton
e
-0.003
-0.002
-0.001
0.000
0.001
0.002
-0.010 -0.005 0.000 0.005 0.010
2n
d P
rin
cip
al
Co
mp
on
en
t
1st Principal Component
Colombian Costa Rican Ethiopian Kenyan
-0.15
-0.05
0.05
0.15
0.25
8001600240032004000
PC 1 Loading (85.8%)
-0.002
-0.001
0.000
0.001
-0.002 -0.001 0.000 0.001 0.002
3n
d P
rin
cip
al
Co
mp
on
en
t
1st Principal Component
Colombian Costa Rican Ethiopian Kenyan
-0.15
-0.05
0.05
0.15
0.25
8001600240032004000
PC 1 Loading (60%)
-0.002
-0.001
0.000
0.001
0.002
-0.004 -0.002 0.001 0.004
2n
d P
rin
cip
al
Co
mp
on
en
t
1st Principal Component
Colombian Costa Rican Ethiopian Kenyan
-0.002
-0.001
0.000
0.001
0.002
-0.010 -0.005 0.000 0.005 0.010
3n
d P
rin
cip
al
Co
mp
on
en
t
1st Principal Component
Colombian Costa Rican Ethiopian Kenyan
0.00
0.04
0.08
0.12
0.16
0.20
8001600240032004000
Ab
so
rban
ce
Wavenumber, cm-1
2920
2850
1741 1726
0.00
0.04
0.08
0.12
0.16
0.20
8001600240032004000
Ab
so
rban
ce
Wavenumber, cm-1
1550
1683
-0.15
-0.05
0.05
0.15
0.25
8001600240032004000
PC 1 Loading (51.3%)
0.00
0.04
0.08
0.12
0.16
0.20
8001600240032004000
Ab
so
rban
ce
Wavenumber, cm-1
2920
2850
16471697
1236
1550
1741
-0.15
-0.05
0.05
0.15
0.25
8001600240032004000
PC 1 Loading (83.7%)
0.00
0.04
0.08
0.12
0.16
0.20
8001600240032004000
Ab
so
rban
ce
Wavenumber, cm-1
1514
1662
1649
1481
A
B
C
Dichloromethane Extract Acetone Extract
44
For the medium roast coffee samples, FTIR data for dichloromethane and
ethyl acetate extracts resulted in well-separated clusters in PCA score plots,
which corresponded to the four countries of origin (Figure 9, row A); however,
cluster patterns were less discernible for hexane and acetone extracts. For the
dark roast samples, the PCA score plots of FTIR data for all the solvent extracts
showed clear distinctive groupings for coffee beans from the four countries of
origin (Figure 10, row A). Overall, separation distances between clusters were
greater for the dark roast samples than for the medium roast counterparts,
implying that the IR active-active components that were distinctive to the bean
origin tended to develop when the beans were roasted to a darker degree.
Roasting of green coffee beans results in the formation of large quantities of
aroma compounds, and aroma profiles are dependent on the time and
temperature regimes applied during the roast process (Lyman et al. 2003). The
greater cluster separation for dark roast samples observed in the current study
may be due to a larger number of aroma compounds produced in the dark
roasted coffee (Byers 2003).
The different clustering behaviors observed for extracts prepared from
different solvents could be attributed to the different polarities of the solvents
used. The polarity index for hexane, dichloromethane, ethyl acetate, and acetone
are 0.1, 3.1, 4.4, and 5.1, respectively (Byers 2003). Thus, hexane is non-polar
and extracts only non-polar compounds from coffee. On the other hand, acetone
is relatively more polar and tends to extract polar compounds. For
dichloromethane and ethyl acetate, both polar and non-polar compounds are
45
extracted. The polarity effect can be observed in the original spectra (Figures 9
and 10, row C). The spectral region from 3676-3028 cm-1 is mainly due to the O-
H stretching band from water. As shown, the absorbance intensity in this region
progressively became stronger for hexane, dichloromethane, ethyl acetate, and
acetone in ascending order. This result is consistent with the polarity for these
solvents.
To further investigate regions of spectra that contribute to the variance of
samples, the loading plots for a corresponding PC were inspected. Here we
focused on PC1 since it explained the maximum variance existing in the dataset
(Figures 9 and 10, row B). The percent variance accounted by PC1 was also
indicated on each loading plot. Regions of each spectrum with a relatively large
loading score (>0.1) were highlighted as red dotted lines. As shown, the loading
plots for hexane extracts were markedly different than those of the other three
solvent extracts, due to the non-polar nature of hexane. The loading plots of
hexane extracts for medium and dark roasts were similar, except that
absorbance at region 1741-1726 cm-1, which is due to C=O stretching band
mode of fatty acid esters, was higher and wider in the medium roast compared
with the dark roast coffee (Yoshida et al. 1997). For dichloromethane extracts,
the most prominent difference in loading plots for dark and medium roast coffees
was in the region of 2920-2850 cm-1, which can be attributed to CH2
asymmetrical stretching vibrations of hydrocarbon methyl groups (Eliane
Nabedryk 1982). The medium roast coffees exhibited significant loading score
around this region, but negligible for dark roast coffees. A similar trend was
46
observed for the region around 1741-1678 cm-1 The minimal changes observed
for these spectral regions for the dark roast samples could be caused by a
decrease in protein and lipids due to the Maillard reaction and pyrolytic cleavage,
respectively (De Maria et al. 1994; Yeretzian et al. 2002).
For ethyl acetate extracts, loading plots for medium and dark roast coffees
were comparable, indicating that the compounds extracted by ethyl acetate from
medium and dark roast coffees were similar, although subtle differences did exist.
The main regions that contribute to the differences between samples are 1743-
1741, 1647-1643, and 1697 cm-1. The band at 1697 cm-1 is due to isolated
carbonyl stretching of C=O bonds, and the band at 1647 cm-1 is due to
conjugated carbonyl stretching of C=O bonds of caffeine compounds (Falk et al.
1990). Garrigues et al. (Garrigues et al. 2000) and Ohnsmann et al. (Ohnsmann
et al. 2002) also utilized absorbance at 1659 and 1704 cm-1 to determine the
caffeine content in coffee and tea, respectively. In these cited studies, the C=O
bands investigated shifted to higher frequencies due to the different solvent used
(i.e., chloroform). Based on this information, it is conceivable that the separated
clusters observed were partly caused by the different caffeine contents of among
the various coffee samples.
Other important vibration bands that contributed to the separated clusters
for dichromethane extracts were at 1705 cm-1 (C=O stretching vibrations of
ketones), 1655 cm-1 (C=O stretching of caffeine compounds), 1599 cm-1 (-NH
group), and 1548 cm-1 (N-H bending of peptide groups). These bands were also
detected in ethyl acetate and acetone extracts with some shifts (1701, 1651,
47
1604, and 1552 cm-1 for ethyl acetate; 1699, 1647, 1599, and 1558 cm-1 for
acetone) (Magidman 1984; Mishra & Kumar 2002). For hexane extracts, the most
prominent spectral difference between the medium and dark roast coffees is that
the latter showed a stronger overall absorbance, implying that more lipids (1600-
1700 cm-1) and fatty acid esters (1700-1800 cm-1) were being extracted from the
dark roast coffee.
4.3.4 PCA Analysis for Coffees According to Degree of Roast
Roasting results in many physical changes and chemical reactions in the
coffee beans. Depending on the extent of the roast, which is time-temperature
dependent, the quality and sensory properties of the resulting coffees can vary
considerably. Medium roast coffee has a more full-bodied flavour, a balance of
taste and aroma, and carries citrus taste. In comparison, dark roast coffee has a
heavier sweet taste, with a lingering aftertaste of chocolate (Schenker et al. 2002;
Lyman et al. 2003).
Dichloromethane and ethyl acetate extracts were tested for the
discrimination of dark and medium roast coffees. As shown in Figures 11 and 12
(Row A), two-component score plots resulted in well-separated clusters
corresponding to dark coffees (right clusters) and medium coffees (left clusters)
from the four origins. The loading plots for dichloromethane extracts showed that
all coffee samples, except the Columbian coffee, exhibited strong loading scores
at 2920, 2850, and 1743 cm-1 due to CH2 asymmetrical stretching of methyl
groups, C-H symmetrical stretching of methyl groups, and C=O stretching of
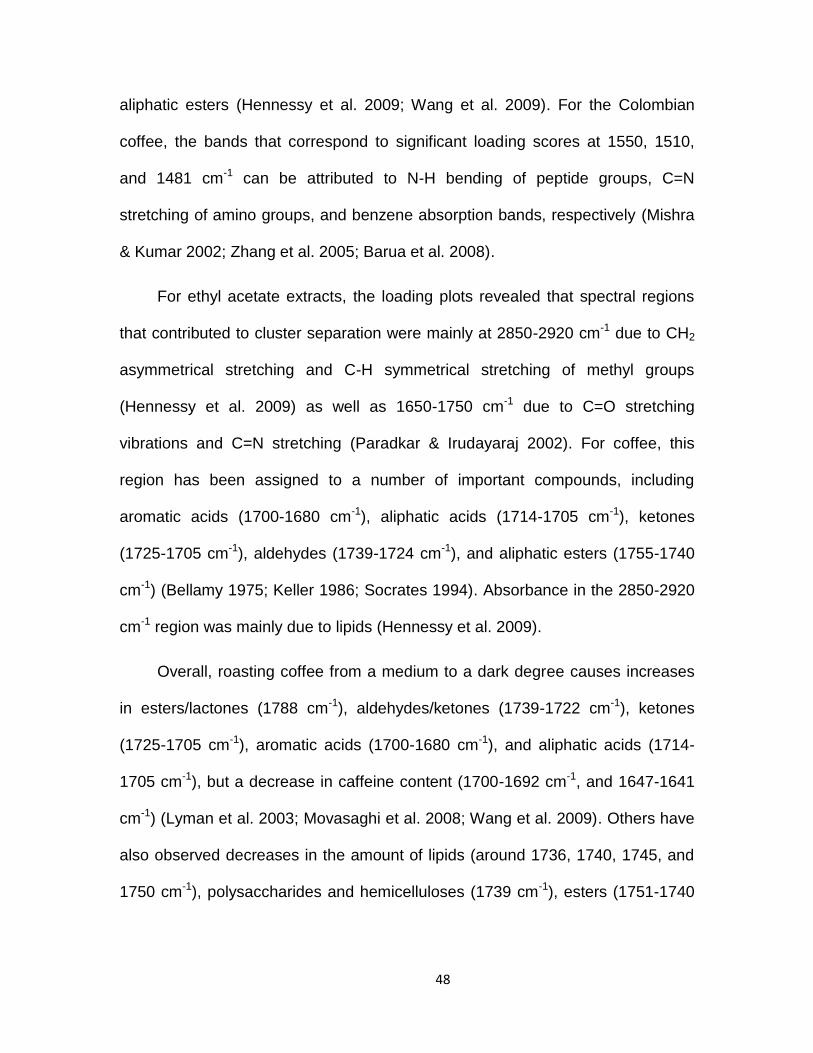
48
aliphatic esters (Hennessy et al. 2009; Wang et al. 2009). For the Colombian
coffee, the bands that correspond to significant loading scores at 1550, 1510,
and 1481 cm-1 can be attributed to N-H bending of peptide groups, C=N
stretching of amino groups, and benzene absorption bands, respectively (Mishra
& Kumar 2002; Zhang et al. 2005; Barua et al. 2008).
For ethyl acetate extracts, the loading plots revealed that spectral regions
that contributed to cluster separation were mainly at 2850-2920 cm-1 due to CH2
asymmetrical stretching and C-H symmetrical stretching of methyl groups
(Hennessy et al. 2009) as well as 1650-1750 cm-1 due to C=O stretching
vibrations and C=N stretching (Paradkar & Irudayaraj 2002). For coffee, this
region has been assigned to a number of important compounds, including
aromatic acids (1700-1680 cm-1), aliphatic acids (1714-1705 cm-1), ketones
(1725-1705 cm-1), aldehydes (1739-1724 cm-1), and aliphatic esters (1755-1740
cm-1) (Bellamy 1975; Keller 1986; Socrates 1994). Absorbance in the 2850-2920
cm-1 region was mainly due to lipids (Hennessy et al. 2009).
Overall, roasting coffee from a medium to a dark degree causes increases
in esters/lactones (1788 cm-1), aldehydes/ketones (1739-1722 cm-1), ketones
(1725-1705 cm-1), aromatic acids (1700-1680 cm-1), and aliphatic acids (1714-
1705 cm-1), but a decrease in caffeine content (1700-1692 cm-1, and 1647-1641
cm-1) (Lyman et al. 2003; Movasaghi et al. 2008; Wang et al. 2009). Others have
also observed decreases in the amount of lipids (around 1736, 1740, 1745, and
1750 cm-1), polysaccharides and hemicelluloses (1739 cm-1), esters (1751-1740
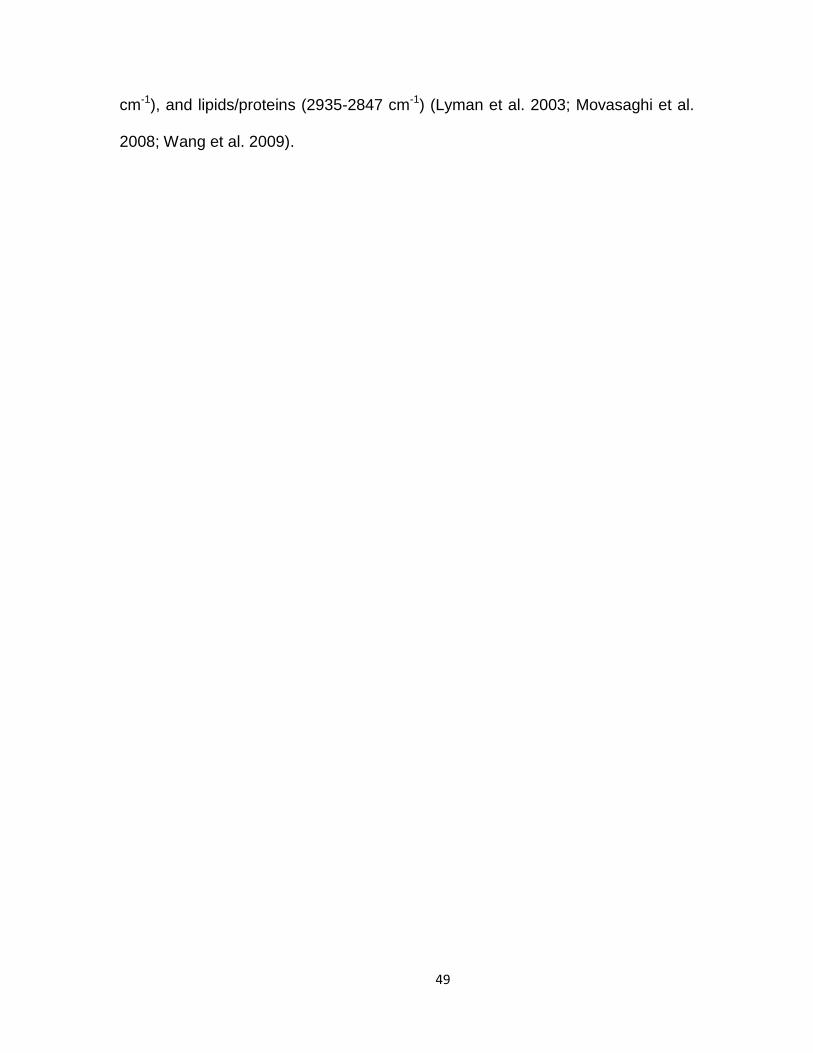
49
cm-1), and lipids/proteins (2935-2847 cm-1) (Lyman et al. 2003; Movasaghi et al.
2008; Wang et al. 2009).
50
Figure 11 PCA of FTIR data for dichloromethane extracts of coffee (from the same origin) with two degrees of roast. Row
A: Two factor score plots. Row B: Loading plots of PC1. Row C: Corresponding FTIR raw spectra
-0.002
-0.001
0.000
0.001
0.002
-0.003 -0.001 0.001 0.003
2n
d P
rin
cip
al
Co
mp
on
en
t
1st Principal Component
Dark roast Medium roast
-0.002
-0.001
0.000
0.001
0.002
-0.003 -0.001 0.001 0.003
2n
d P
rin
cip
al
Co
mp
on
en
t
1st Principal Component
Dark roast Medium roast
-0.002
-0.001
0.000
0.001
0.002
-0.003 -0.001 0.001 0.003
2n
d P
rin
cip
al
Co
mp
on
en
t
1st Principal Component
Dark roast Medium roast
-0.002
-0.001
0.000
0.001
0.002
-0.003 -0.001 0.001 0.003
2n
d P
rin
cip
al
Co
mp
on
en
t
1st Principal Component
Dark roast Medium roast
Colombian Costa Rican Ethiopian Kenyan
A
-0.1
0.0
0.1
0.2
8001600240032004000
PC 1 loading (75.9%)
-0.1
0.0
0.1
0.2
8001600240032004000
PC 1 loading (67.8%)
-0.1
0.0
0.1
0.2
8001600240032004000
PC 1 loading (46.6%)
-0.1
0.0
0.1
0.2
8001600240032004000
PC 1 loading (29.2%)
B
0.00
0.04
0.08
0.12
0.16
0.20
8001600240032004000
Ab
so
rban
ce
Wavenumber, cm-1
1481
1510
1550
0.00
0.04
0.08
0.12
0.16
0.20
8001600240032004000
Ab
so
rban
ce
Wavenumber, cm-1
2850
17432920
0.00
0.04
0.08
0.12
0.16
0.20
8001600240032004000
Ab
so
rban
ce
Wavenumber, cm-1
2850
1743
1465
2920
1678
0.00
0.04
0.08
0.12
0.16
0.20
8001600240032004000
Ab
so
rban
ce
Wavenumber, cm-1
2850
1743
1695
2920
860
829C
51
Figure 12 PCA of FTIR data for ethyl acetate extracts of coffee (from the same origin) with two degrees of roast. Row A:
Two factor score plots. Row B: Loading plots of PC1. Row C: Corresponding FTIR raw spectra
C
0.00
0.04
0.08
0.12
0.16
0.20
8001600240032004000
Ab
so
rban
ce
Wavenumber, cm-1
2920
2850
1741
2355-2347
16741647
0.00
0.04
0.08
0.12
0.16
0.20
8001600240032004000
Ab
so
rban
ce
Wavenumber, cm-1
2928-2916
2850
1741
16741701
0.00
0.04
0.08
0.12
0.16
0.20
8001600240032004000
Ab
so
rban
ce
Wavenumber, cm-1
2920
2850
1741
1674
1030
0.00
0.04
0.08
0.12
0.16
0.20
8001600240032004000
Ab
so
rban
ce
Wavenumber, cm-1
2920
2850
1741
1701
1674
1647
1550
1236
-0.002
-0.001
0.000
0.001
0.002
-0.003 -0.001 0.001 0.003
2n
d P
rin
cip
al
Co
mp
on
en
t
1st Principal Component
Dark roast medium roast
Kenyan
-0.002
-0.001
0.000
0.001
0.002
-0.003 -0.001 0.001 0.003
2n
d P
rin
cip
al
Co
mp
on
en
t
1st Principal Component
Dark roast Medium roast
Colombian
-0.002
-0.001
0.000
0.001
0.002
-0.003 -0.001 0.001 0.003
2n
d P
rin
cip
al
Co
mp
on
en
t
1st Principal Component
Dark roast Medium roast
Costa Rican
-0.002
-0.001
0.000
0.001
0.002
-0.003 -0.001 0.001 0.003
2n
d P
rin
cip
al
Co
mp
on
en
t
1st Principal Component
Dark roast Medium roast
Ethiopian
A
-0.1
0.0
0.1
0.2
8001600240032004000
PC 1 loading (44.6%)
-0.1
0.0
0.1
0.2
8001600240032004000
PC 1loading (59.5%)
-0.1
0.0
0.1
0.2
8001600240032004000
PC 1 loading (46.7%)
-0.1
0.0
0.1
0.2
8001600240032004000
PC 1 loading (74%)
B
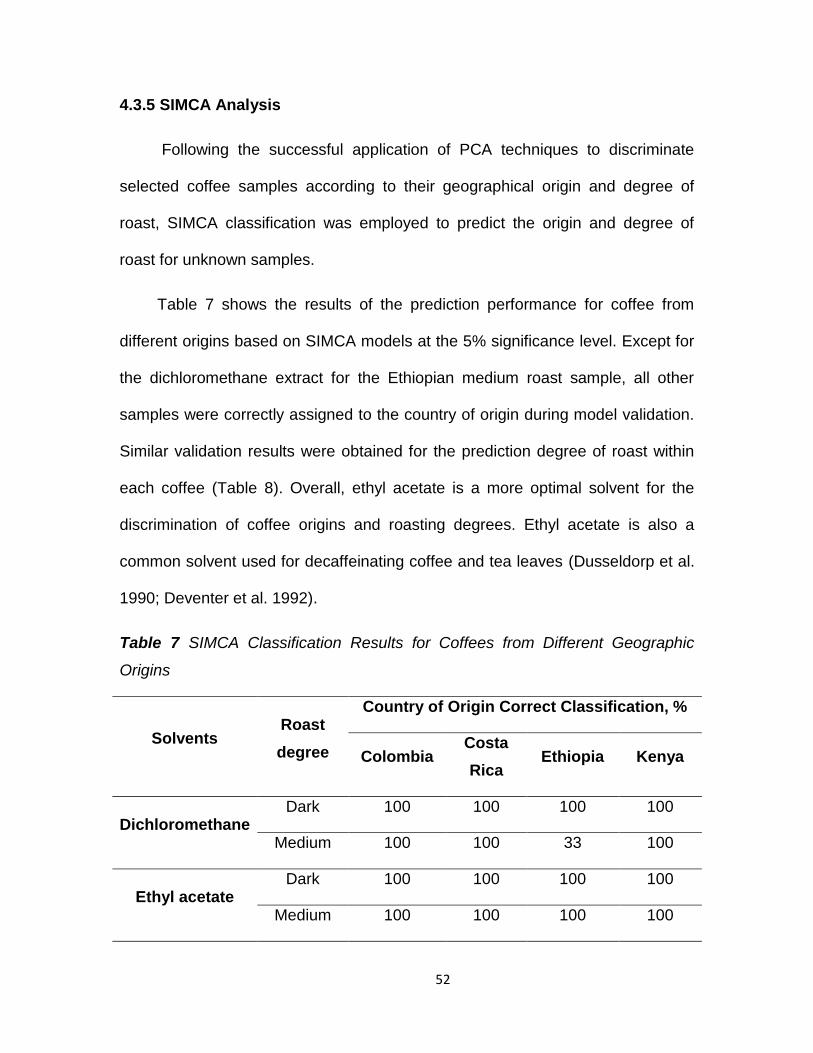
52
4.3.5 SIMCA Analysis
Following the successful application of PCA techniques to discriminate
selected coffee samples according to their geographical origin and degree of
roast, SIMCA classification was employed to predict the origin and degree of
roast for unknown samples.
Table 7 shows the results of the prediction performance for coffee from
different origins based on SIMCA models at the 5% significance level. Except for
the dichloromethane extract for the Ethiopian medium roast sample, all other
samples were correctly assigned to the country of origin during model validation.
Similar validation results were obtained for the prediction degree of roast within
each coffee (Table 8). Overall, ethyl acetate is a more optimal solvent for the
discrimination of coffee origins and roasting degrees. Ethyl acetate is also a
common solvent used for decaffeinating coffee and tea leaves (Dusseldorp et al.
1990; Deventer et al. 1992).
Table 7 SIMCA Classification Results for Coffees from Different Geographic
Origins
Solvents Roast
degree
Country of Origin Correct Classification, %
Colombia Costa
Rica Ethiopia Kenya
Dichloromethane Dark 100 100 100 100
Medium 100 100 33 100
Ethyl acetate Dark 100 100 100 100
Medium 100 100 100 100
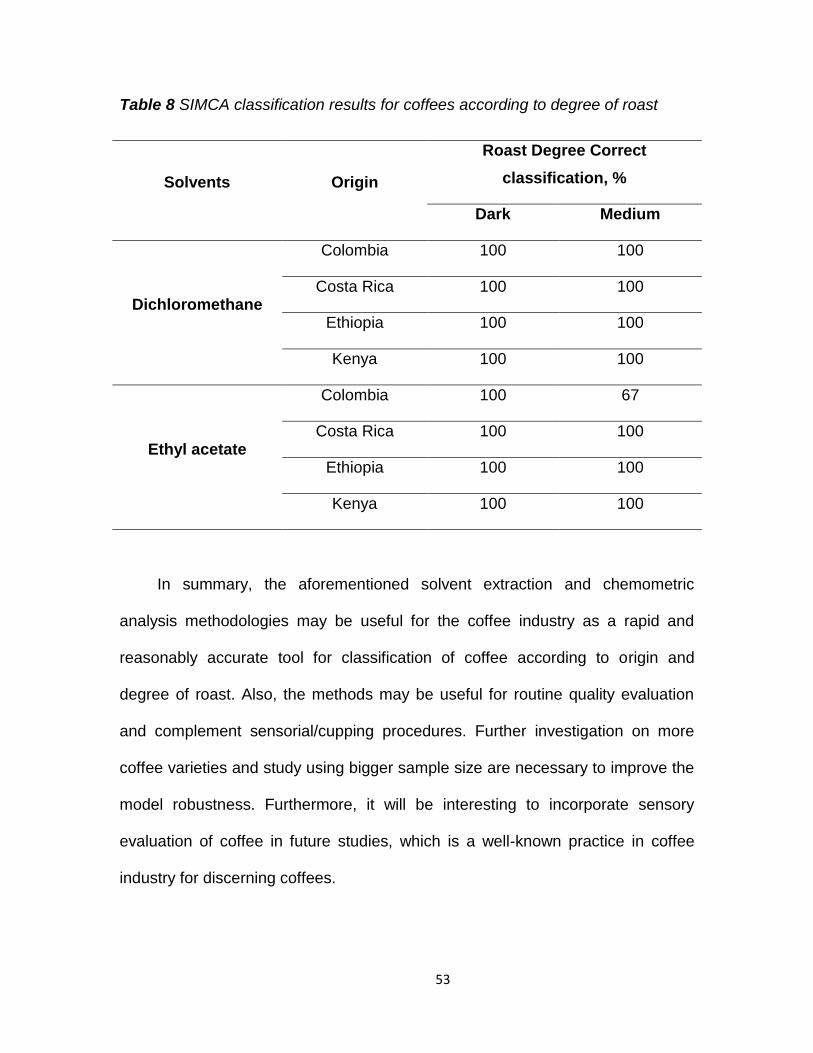
53
Table 8 SIMCA classification results for coffees according to degree of roast
Solvents Origin
Roast Degree Correct
classification, %
Dark Medium
Dichloromethane
Colombia 100 100
Costa Rica 100 100
Ethiopia 100 100
Kenya 100 100
Ethyl acetate
Colombia 100 67
Costa Rica 100 100
Ethiopia 100 100
Kenya 100 100
In summary, the aforementioned solvent extraction and chemometric
analysis methodologies may be useful for the coffee industry as a rapid and
reasonably accurate tool for classification of coffee according to origin and
degree of roast. Also, the methods may be useful for routine quality evaluation
and complement sensorial/cupping procedures. Further investigation on more
coffee varieties and study using bigger sample size are necessary to improve the
model robustness. Furthermore, it will be interesting to incorporate sensory
evaluation of coffee in future studies, which is a well-known practice in coffee
industry for discerning coffees.
54
5 EFFECTS OF DIFFERENT TIME-TEMPERATURE PROFILES ON
COFFEE PHYSICAL AND CHEMICAL PROPERTIES
5.1 Introduction
Green coffee beans provide neither the characteristic aroma nor the taste of
a cup of coffee. To reveal their flavour, green coffee beans need to be roasted.
Roasting is one of the most important steps in coffee processing that leads to the
development of the desired aroma, taste, and color of the final brewed product. In
general, the use of roasting temperature of greater than 200oC is required in
order to result in desirable chemical, physical, structural, and sensorial changes
in the coffee beans (Schenker 2000; Schenker et al. 2002; Baggenstoss et al.
2008).
The time and temperature conditions applied during roasting have a major
impact on the physical and chemical properties of roasted coffee beans. Geiger
et al. reported that CO2, a by-product formed due to Strecker reactions and the
degradation of organic compounds, increased greatly towards the end phase of a
high-temperature-short-time process (260oC, 170 s), while the CO2 formed was
much lower when a low-temperature-long-time (228oC, 720s) process was
employed (Geiger et al. 2005). Schenker et al. found that roasting process that
involved a ramping temperature profile (150 to 240oC in 270 s; 240oC for 55 s)
resulted in the formation of a greater quantity of aroma volatiles than a low-
temperature-long-time process (isothermal heating at 220oC for 600 s) (Schenker
et al. 2002). Baggenstoss also reported that high-temperature-short-time roasting
55
led to beans of lower density, higher volume, less roast loss, and lower moisture
content as compared to the low-temperature-short time process (Baggenstoss et
al. 2008). Lyman et al. roasted green coffee beans under various process
conditions to study the effect of roasting on brewed coffee (Lyman et al. 2003).
Using a medium roast process (6.5 min to the onset of the first crack and 1.0 min
to the onset of the second crack), Lyman et al. observed that coffee of balanced
taste and aroma with citrus flavour was produced. However, using the so-called
“sweated process” (4.5 min to the first crack and 6.5 min to the second crack),
coffee beans of non-uniform bean color with “sour, grassy, and underdeveloped”
were resulted. In comparison, the “baked process” (11 min to the first crack and
18 min to the second crack) produced coffees that were “flat, woody with low
brightness and acidity” (Lyman et al. 2003). Based on the these observations,
one can conclude that the quality of roasted coffee does not solely depend on the
physical parameters at the start and end point of roasting, but rather it is
dependent on the time-temperature conditions applied during the roasting
process.
Chemometrics employ statistical and mathematical techniques to convert
complex spectral and chromatographic data into information with reduced
dimensionality to facilitate interpretation (Socrates 1994). Chemometric
methodologies, such as PCA, PCR, PLS, ANN have been successfully applied in
process monitoring, detection of product adulteration, quality evaluation,
screening of defective green coffee beans, and shelf-life study (Eliane Nabedryk
1982; Keller 1986; Socrates 1994; Dovbeshko 1997; Yoshida et al. 1997;
56
Fukuyama 1999; Hennessy et al. 2009). Although gas chromatography-mass
spectrometry (GC-MS), gas chromatography (GC), and sensory array
instruments (electronic noses and tongues) have been used for studying the
aroma compounds in roasted coffee (Rahn & Konig 1978; Parliment & Stahl 1995;
Kantor & Fekete 2006), analyses involving these techniques are time-consuming
and some of these instruments are complicated. FTIR- ATR spectroscopy is a
simple technique which is rapid and provides an overall infrared fingerprint of the
specimen. Using an FTIR-ATR technique, Lyman et al. investigated 1800-1680
cm-1 region of the IR spectrum of coffee brews. The carbonyl stretching region
provided compositional information that can be used to correlate vinyl
esters/lactones, esters, aldehydes, ketones, and acids (Lyman et al. 2003). In our
previous study, FTIR-ATR spectroscopy was used as a rapid tool for
discriminating geographical origin of roasted coffee extracts and studying the
changes in chemical compositions when coffees were roasted to different degree
(Wang et al. 2011).
In the study, we applied a chemometric technique to analyze FTIR-ATR
fingerprints of coffee beans at different stages of roast. The objectives of this
study are to: (1) develop the understanding of the effects of time-temperature
conditions on the physical and chemical properties of coffee; (2) to analyze
coffees roasted to the same stage by different roasting profiles using FTIR-ATR
technique.
57
5.2 Materials and Methods
5.2.1 Chemicals and materials
Ethyl acetate was purchased from Fisher Scientific (Ottawa, Canada),
ethanol from Greenfield Ethanol Inc. (Brampton, Canada), and sodium hydroxide
from Sigma Aldrich (Ontario, Canada). Wet-processed green coffee beans
(Arabica) from Brazil were donated by Mother Parkers Tea & Coffee Inc.
5.2.2 Green Beans and Roasting Conditions
Green coffee beans (45 g) were roasted in a fluidized bed hot air roaster
(Fresh Roast SR 500, Fresh Beans Inc., Park City, UT). Four isothermal roasting
programs were used for roasting (Table 9). Coffee beans were collected at six
roast stages (start-of-first-crack, end-of-first-crack, 48 s-after-first-crack, start-of-
second-crack, end-of-second-crack, and 48 s-after-second-crack) and air-
quenched. The roasted bean samples were stored in hermetic glass bottles in the
dark at 15oC before grinding.
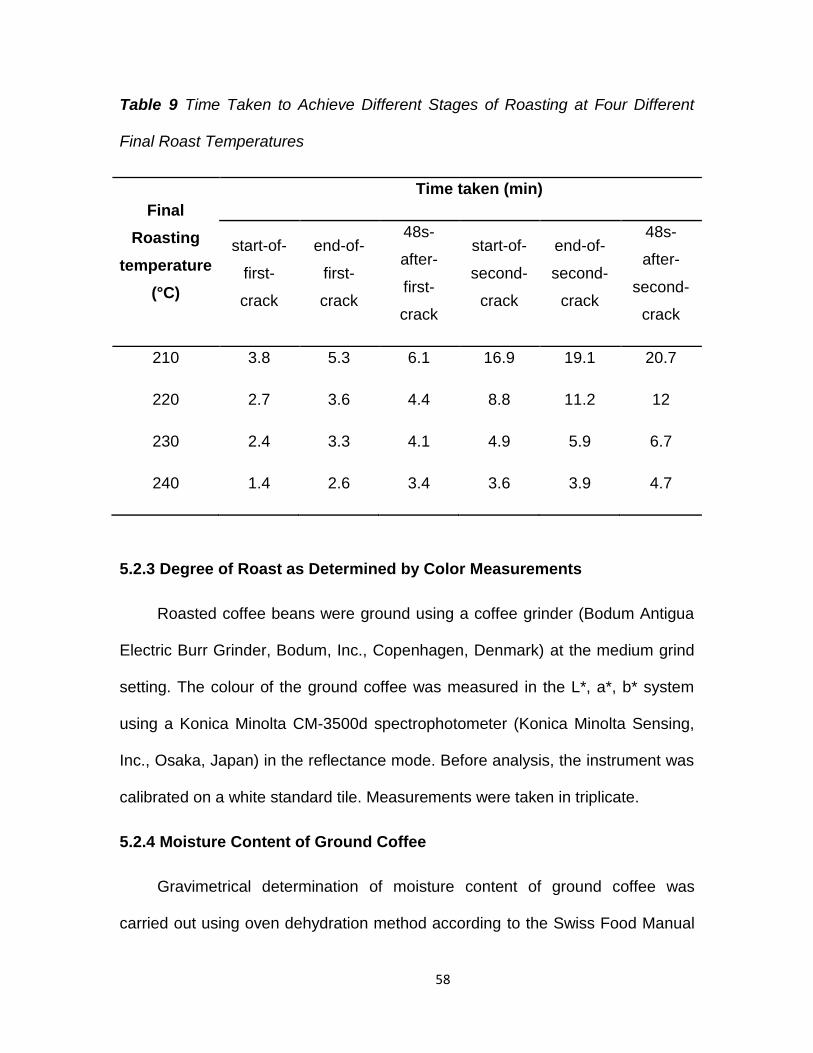
58
Table 9 Time Taken to Achieve Different Stages of Roasting at Four Different
Final Roast Temperatures
Final
Roasting
temperature
(°C)
Time taken (min)
start-of-
first-
crack
end-of-
first-
crack
48s-
after-
first-
crack
start-of-
second-
crack
end-of-
second-
crack
48s-
after-
second-
crack
210 3.8 5.3 6.1 16.9 19.1 20.7
220 2.7 3.6 4.4 8.8 11.2 12
230 2.4 3.3 4.1 4.9 5.9 6.7
240 1.4 2.6 3.4 3.6 3.9 4.7
5.2.3 Degree of Roast as Determined by Color Measurements
Roasted coffee beans were ground using a coffee grinder (Bodum Antigua
Electric Burr Grinder, Bodum, Inc., Copenhagen, Denmark) at the medium grind
setting. The colour of the ground coffee was measured in the L*, a*, b* system
using a Konica Minolta CM-3500d spectrophotometer (Konica Minolta Sensing,
Inc., Osaka, Japan) in the reflectance mode. Before analysis, the instrument was
calibrated on a white standard tile. Measurements were taken in triplicate.
5.2.4 Moisture Content of Ground Coffee
Gravimetrical determination of moisture content of ground coffee was
carried out using oven dehydration method according to the Swiss Food Manual
59
(SWFOH 1973). Samples of roasted beans were ground finely, and then dried at
103°C for 5 h. Measurements were taken in triplicate.
5.2.5 pH Value
A 2.00 g ground coffee was accurately weighed into a 200 mL glass bottle,
and 100 mL of deionized water was added in. The glass bottle was boiled for 10
min. Then, 50 mL of the filtered extract was used for pH value determination with
a pH meter. Measurements were taken in triplicate.
5.2.6 Titratable Acidity
A 10.00 g of ground coffee was accurately weighed into a 200 mL glass
bottle, and 75 mL 80% ethanol was added to wet the sample. The glass bottle
was shaken for 16 h under magnetic stirring. After that, 50 mL of the filtered
extract was titrated against 0.1 N NaOH solution (Horwitz 2000). Measurements
were taken in triplicate.
5.2.7 Solvent Extraction and ATR-FTIR Analysis of Ground Coffee
After grinding, coffee grounds were extracted with ethyl acetate following
the extraction procedure: 0.2500 g of ground coffee was accurately weighed into
a glass vial, and 1 mL of deionized water was added to wet the sample. The
glass vial was shaken for 1 min; 1 mL of ethyl acetate was added, and the
mixture was shaken for an additional 5 min. The organic phase was used for
ATR-FTIR analysis in the region of 600 to 4000 cm-1 at 4 cm-1 resolution (Wang
et al. 2011). All extractions were performed in triplicate.
60
5.2.8 Chemometric Analysis
Raw FTIR spectra were exported as ASCII format, organized in Excel
spreadsheets, and then analyzed using Pirouette v.4.0 software (Woodinville,
WA). A principal component analysis (PCA) was adopted to reduce the
dimensionality of complex FTIR data, as well as to facilitate the visualization of
the data structure. Second derivative and mean-center were applied to FTIR
spectra to reduce baseline variation and enhance spectral features.
5.2.9 Scanning Electron Microscopy (SEM) Analysis
Coffee bean samples were cut perpendicular to the crevice to expose the
internal bean structure. The bean samples were coated with 20 nm of gold in a
sputter coater (Model K550, Emitech, Ashford, Kent, England). The pore
structure of coffee beans was examined using a scanning electron microscope
(SEM S-570, Hitachi High Technologies Corporation, Tokyo, Japan) at an
accelerating voltage of 10 kV. Micrographs were collected using Image capture
system (Quartz PCI, Version 7, Quartz Imaging Inc., Vancouver, BC).
5.3 Results and Discussion
5.3.1 Evolution of physical and chemical properties during roasting
Roasting causes the buildup of pressure within the coffee bean due to the
formation of steam and other gases. The increased internal pressure causes the
bean to expand and crack, resulting in a phenomenon known as the “first crack”.
As heating continues to higher temperatures (>160°C), the beans become darker
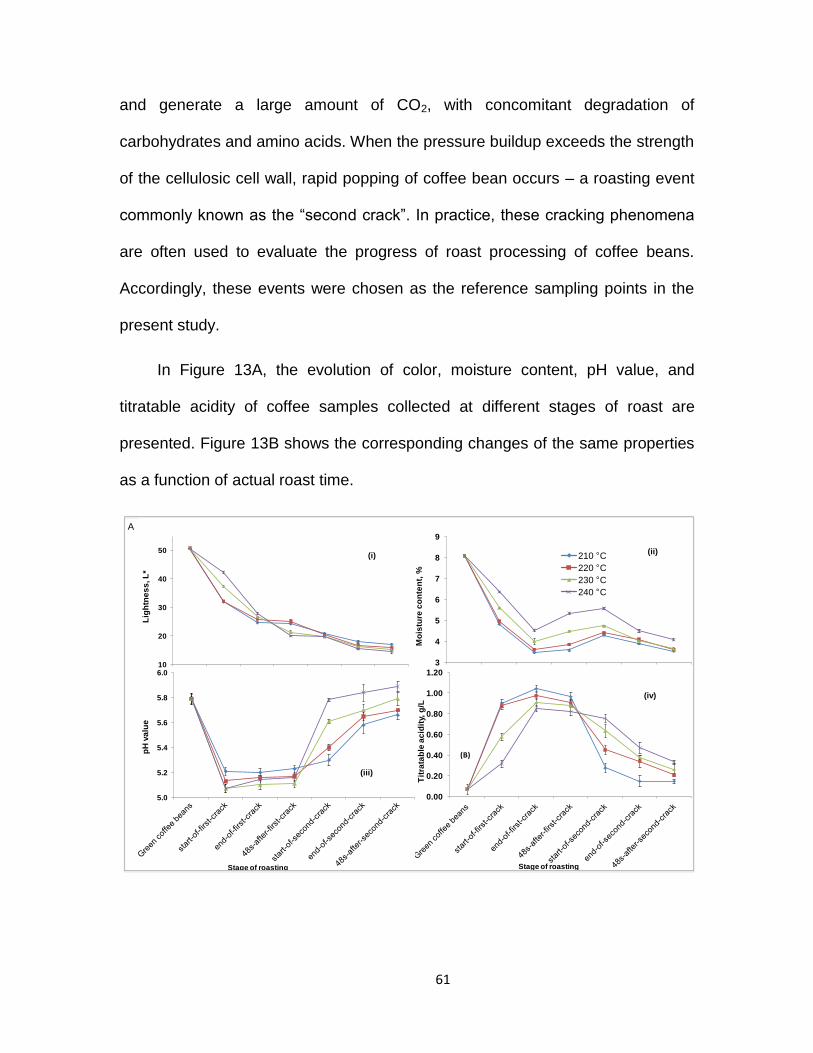
61
and generate a large amount of CO2, with concomitant degradation of
carbohydrates and amino acids. When the pressure buildup exceeds the strength
of the cellulosic cell wall, rapid popping of coffee bean occurs – a roasting event
commonly known as the “second crack”. In practice, these cracking phenomena
are often used to evaluate the progress of roast processing of coffee beans.
Accordingly, these events were chosen as the reference sampling points in the
present study.
In Figure 13A, the evolution of color, moisture content, pH value, and
titratable acidity of coffee samples collected at different stages of roast are
presented. Figure 13B shows the corresponding changes of the same properties
as a function of actual roast time.
10
20
30
40
50
Lig
htn
es
s, L
*
(i)
3
4
5
6
7
8
9
Mo
istu
re c
on
ten
t, %
(ii)
0.00
0.20
0.40
0.60
0.80
1.00
1.20
Tit
rata
ble
ac
idit
y, g
/L
Stage of roasting
(B)
(iv)
5.0
5.2
5.4
5.6
5.8
6.0
pH
va
lue
Stage of roasting
(iii)
A
10
20
30
40
50
Lig
htn
es
s, L
* (i)
3
4
5
6
7
8
9
Mo
istu
re c
on
ten
t, %
(ii)
0.00
0.20
0.40
0.60
0.80
1.00
1.20
To
tal a
cid
ity, g
/L
Stage of roasting
210 C
220 C
230 C
240 C
(B)
(iv)
5.0
5.2
5.4
5.6
5.8
6.0
pH
va
lue
Stage of roasting
(iii)
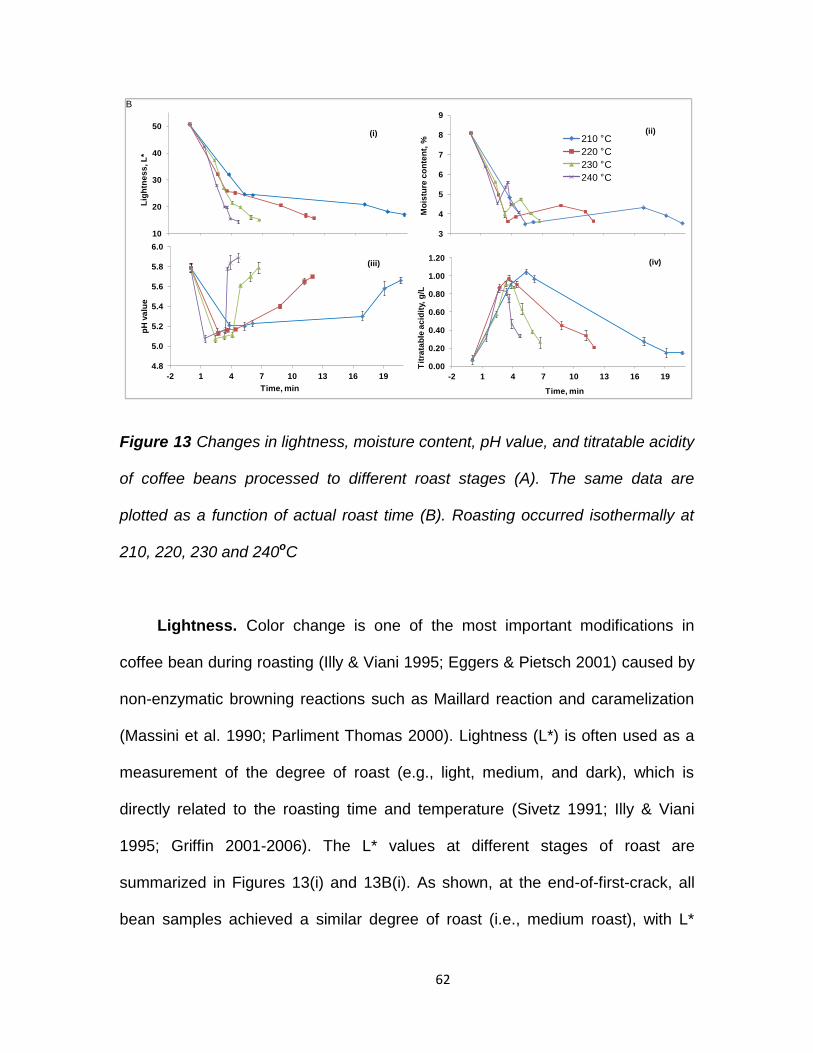
62
Figure 13 Changes in lightness, moisture content, pH value, and titratable acidity
of coffee beans processed to different roast stages (A). The same data are
plotted as a function of actual roast time (B). Roasting occurred isothermally at
210, 220, 230 and 240oC
Lightness. Color change is one of the most important modifications in
coffee bean during roasting (Illy & Viani 1995; Eggers & Pietsch 2001) caused by
non-enzymatic browning reactions such as Maillard reaction and caramelization
(Massini et al. 1990; Parliment Thomas 2000). Lightness (L*) is often used as a
measurement of the degree of roast (e.g., light, medium, and dark), which is
directly related to the roasting time and temperature (Sivetz 1991; Illy & Viani
1995; Griffin 2001-2006). The L* values at different stages of roast are
summarized in Figures 13(i) and 13B(i). As shown, at the end-of-first-crack, all
bean samples achieved a similar degree of roast (i.e., medium roast), with L*
10
20
30
40
50
-2 1 4 7 10 13 16 19
Lig
htn
es
s, L
*
Time, min
(i)
3
4
5
6
7
8
9
-2 1 4 7 10 13 16 19
Mo
istu
re c
on
ten
t, %
Time, min
(ii)
4.8
5.0
5.2
5.4
5.6
5.8
6.0
-2 1 4 7 10 13 16 19
pH
va
lue
Time, min
(iii)
0.00
0.20
0.40
0.60
0.80
1.00
1.20
-2 1 4 7 10 13 16 19
Tit
rata
ble
ac
idit
y, g
/L
Time, min
(iv)
B
10
20
30
40
50
Lig
htn
es
s, L
* (i)
3
4
5
6
7
8
9
Mo
istu
re c
on
ten
t, %
(ii)
0.00
0.20
0.40
0.60
0.80
1.00
1.20
To
tal a
cid
ity, g
/L
Stage of roasting
210 C
220 C
230 C
240 C
(B)
(iv)
5.0
5.2
5.4
5.6
5.8
6.0
pH
va
lue
Stage of roasting
(iii)
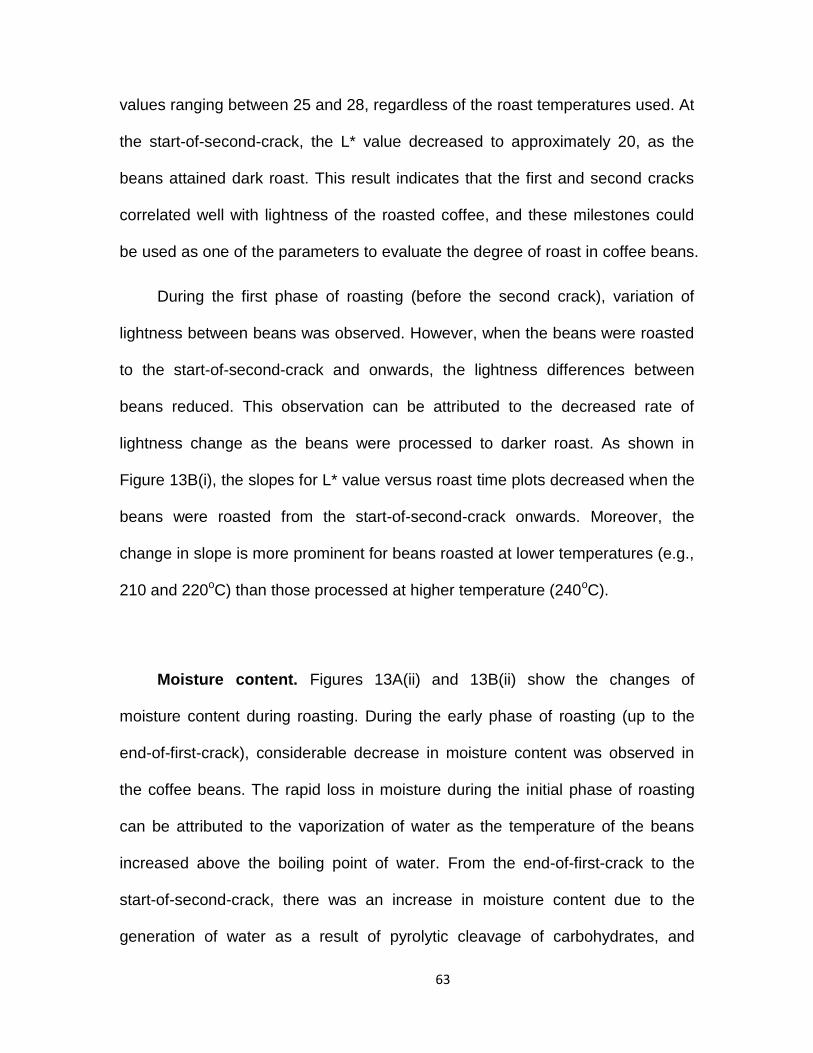
63
values ranging between 25 and 28, regardless of the roast temperatures used. At
the start-of-second-crack, the L* value decreased to approximately 20, as the
beans attained dark roast. This result indicates that the first and second cracks
correlated well with lightness of the roasted coffee, and these milestones could
be used as one of the parameters to evaluate the degree of roast in coffee beans.
During the first phase of roasting (before the second crack), variation of
lightness between beans was observed. However, when the beans were roasted
to the start-of-second-crack and onwards, the lightness differences between
beans reduced. This observation can be attributed to the decreased rate of
lightness change as the beans were processed to darker roast. As shown in
Figure 13B(i), the slopes for L* value versus roast time plots decreased when the
beans were roasted from the start-of-second-crack onwards. Moreover, the
change in slope is more prominent for beans roasted at lower temperatures (e.g.,
210 and 220oC) than those processed at higher temperature (240oC).
Moisture content. Figures 13A(ii) and 13B(ii) show the changes of
moisture content during roasting. During the early phase of roasting (up to the
end-of-first-crack), considerable decrease in moisture content was observed in
the coffee beans. The rapid loss in moisture during the initial phase of roasting
can be attributed to the vaporization of water as the temperature of the beans
increased above the boiling point of water. From the end-of-first-crack to the
start-of-second-crack, there was an increase in moisture content due to the
generation of water as a result of pyrolytic cleavage of carbohydrates, and
64
degradation of chlorogenic acids, other organic acids, and lipids (Yeretzian et al.
2002). Beyond the start-of-second-crack, the decreasing moisture content
observed could be caused by the further rupturing of cell walls, allowing the
escape of water as the roasting continued. No significant difference (P<0.05) in
final moisture content was observed for the final products regardless the roaster
temperature used, averaged at 3.53-3.66% dry basis. Samples roasted at 240oC
had higher moisture contents at various stages of roast as compared to those
roasted at lower temperatures (Figure 15A(ii)). The observed higher moisture
contents for the former may be attributed to the limited diffusion of water from the
bean to the surrounding air due to the short processing time involved.
pH value and titratable acidity. The changes in pH value and titratable
acidity at different stages of roast are presented in Figures 13A(iii), 13A(iv),
13B(iii), and 13B(iv). As shown, at all roasting temperatures investigated, a
significant decrease in pH value (P<0.05) was observed as the coffee beans
were roasted up to the start-of-first-crack. The decrease in pH was caused by the
formation of formic, acetic, glycolic, and lactic acids as the coffee beans were
processed to medium roast (Ginz et al. 2000). Beyond the start-of-first-crack,
minimal changes in pH value were detected up to 48 s-after-first-crack, thereafter,
a dramatic increase in pH was observed. The rapid increase in pH value may be
attributed to the destruction of organic acids formed and those that were present
initially (citric acid, malic acid, and chlorogenic acids), as the coffee beans were
taken to darker roasts (Ginz et al. 2000). Before the start-of-second-crack, the pH
65
value was lower for samples roasted at higher temperature as compared to those
roasted at lower temperatures. This trend is likely due to faster rate of the
formation of acids (due to degradation of glucose, fructose, and sucrose) at
higher temperatures than that at lower temperatures. However, as the roasting
process continued to the start-of-second-crack, the trend was reversed due to the
greater destruction of formic and acetic acids at higher temperatures (Ginz et al.
2000).
Acidity is one of the attributes commonly associated with high quality
coffees. The perceived acidity of coffee is a result of proton donation of acids to
receptors on the human tongue. Many researchers observed a linear correlation
between the pH value and the perceived acidity of coffee (Sivetz & Desrosier
1979; Griffin & Blauch 1999). However, some recent findings on perception
transduction mechanisms of acid taste suggested that undissociated forms of
acid molecules are important for acid perception Therefore, titratable acidity in
coffee brews could be a more reliable indicator for correlating the coffee acidity
than the pH value (Voilley et al. 1981; Brollo et al. 2008). As shown in Figures
13A(iv) and 13B(iv), a rapid increase of titratable acidity was observed as green
coffee beans were roasted to the end-of-first-crack (medium roast). This change
in titratable acidity may be due to the formation of total aliphatic acids to a
maximum level (Clarke & Macrae 1988). Consistent with the pH value, further
roasting from a medium to dark roast resulted in a decrease in titratable acidity,
due to the destruction of organic acids (e.g., citric, malic, lactic, pyruvic, and
acetic acids) (Clarke 1986). In general, medium-roast Arabica coffee brews have
66
a pH value ranging between 4.9 and 5.2, which is in agreement with the result
from the present studies (pH 5.2, 5.16, 5.1, and 5.14 for 210, 220, 230, and
240°C, respectively) (Clarke & Macrae 1988). These observations suggested that
by using different roast temperature and time profiles, the titratable acidity in
roast coffees could be manipulated. For example, the maximum titratable acidity
can be obtained by using 210oC roast temperature before second crack started,
and then using 240oC for continued roasting.
5.3.2 Changes in coffee at various stages of roast
Roasting is a complex process that results in substantial physical and
compositional changes in coffee beans. These changes are both time and
temperature dependent. In general, high-temperature-short-time roasting
produced more soluble solids, less degradation of chlorogenic acids, lower loss
of volatiles, less burnt flavour, larger volume increase, larger CO2 desorption, and
higher oil migration, as compared to low-temperature-long time roasting process
(Nagaraju et al. 1997; Schenker 2000).
In the present study, coffee beans were processed at 210, 220, 230, or
240oC to achieve a similar degree of roast (all dark roast), based on the L* value.
Bean samples were collected at six roast stages, ground into powder, extracted
in solvent, and then analyzed with FTIR spectroscopy. Typical FTIR spectra of
coffee extracts are presented in Figure 14 (column C). In order to determine
spectral variances due to the temperature treatment, PCA was employed to
reduce the dimensionality of the IR spectra to facilitate the visualization of the
67
dataset. As shown in Figure 14 (column A), for all the temperatures tested, the
score plots displayed clusters that were separated according to different stages
of roast. There is a clear trend for the clusters to move upwards along the PC-2
axis as the roasting progressed through different stages. The clusters for green
coffee were separated far from the other clusters, indicating that the chemical
compositions within the green beans were considerably different as compared to
the roasted beans, as expected.
For PC1, no separation was observed between coffees roasted to different
stages when low roast temperatures were used (e.g., 210oC). However, at higher
temperature (e.g., 240oC), the clusters had a tendency to spread along the PC1
axis as the roasting process progressed. Further analysis of PC1 loading plots
(data not shown) revealed that frequencies that contribute to the spectral
difference for beans roasted at 210 and 240oC occurred at around 2920-2850
cm-1, which is the absorbance range due to asymmetric and symmetric CH2
stretching modes. This shows that important changes in aliphatic hydrocarbon
contents had occurred during roasting, especially the lipids. This is consistent
with the observation that during the roasting experiment, spots of oil were
observed on the surface of beans that were roasted at 240oC, but not those
roasted at 210oC. The high-temperature-short-time process used at 240oC might
have increased the rate of oil diffusion from the bean core to the surface
(Puhlmann & Habel 1989).
To further investigate regions of spectra that contribute to the variance of
samples, the loading plots for PC2 were also inspected (Figure14, Column B).
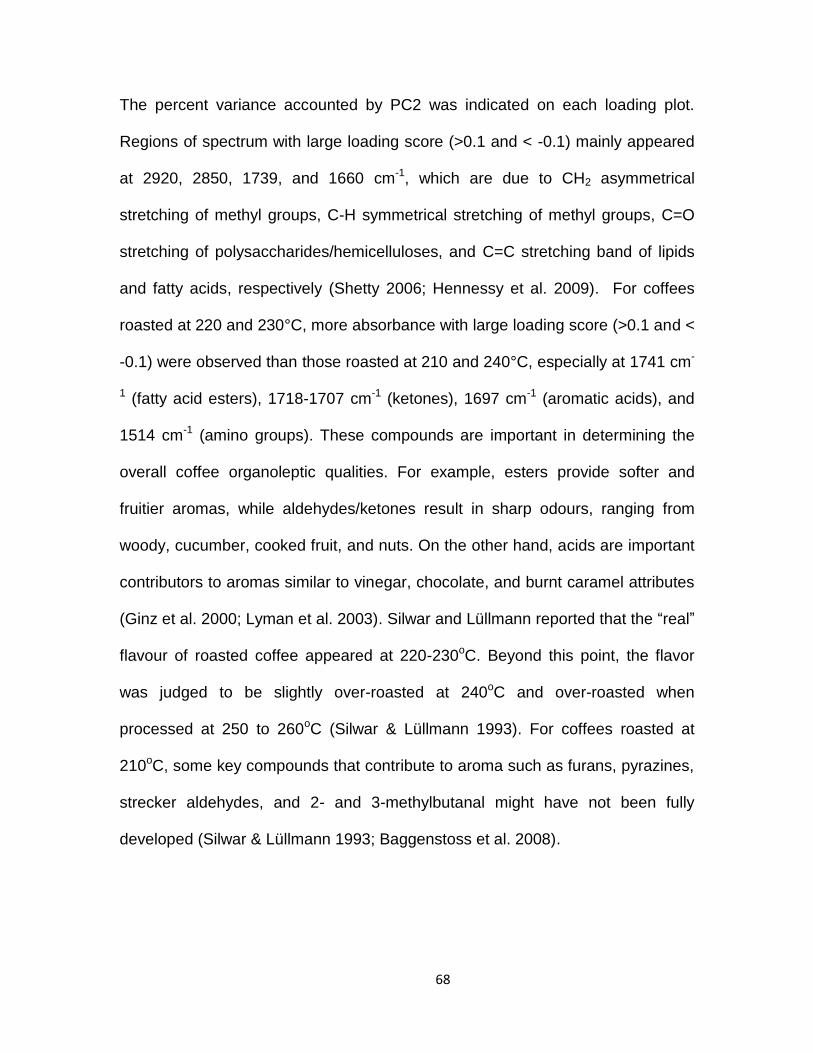
68
The percent variance accounted by PC2 was indicated on each loading plot.
Regions of spectrum with large loading score (>0.1 and < -0.1) mainly appeared
at 2920, 2850, 1739, and 1660 cm-1, which are due to CH2 asymmetrical
stretching of methyl groups, C-H symmetrical stretching of methyl groups, C=O
stretching of polysaccharides/hemicelluloses, and C=C stretching band of lipids
and fatty acids, respectively (Shetty 2006; Hennessy et al. 2009). For coffees
roasted at 220 and 230°C, more absorbance with large loading score (>0.1 and <
-0.1) were observed than those roasted at 210 and 240°C, especially at 1741 cm-
1 (fatty acid esters), 1718-1707 cm-1 (ketones), 1697 cm-1 (aromatic acids), and
1514 cm-1 (amino groups). These compounds are important in determining the
overall coffee organoleptic qualities. For example, esters provide softer and
fruitier aromas, while aldehydes/ketones result in sharp odours, ranging from
woody, cucumber, cooked fruit, and nuts. On the other hand, acids are important
contributors to aromas similar to vinegar, chocolate, and burnt caramel attributes
(Ginz et al. 2000; Lyman et al. 2003). Silwar and Lüllmann reported that the “real”
flavour of roasted coffee appeared at 220-230oC. Beyond this point, the flavor
was judged to be slightly over-roasted at 240oC and over-roasted when
processed at 250 to 260oC (Silwar & Lüllmann 1993). For coffees roasted at
210oC, some key compounds that contribute to aroma such as furans, pyrazines,
strecker aldehydes, and 2- and 3-methylbutanal might have not been fully
developed (Silwar & Lüllmann 1993; Baggenstoss et al. 2008).
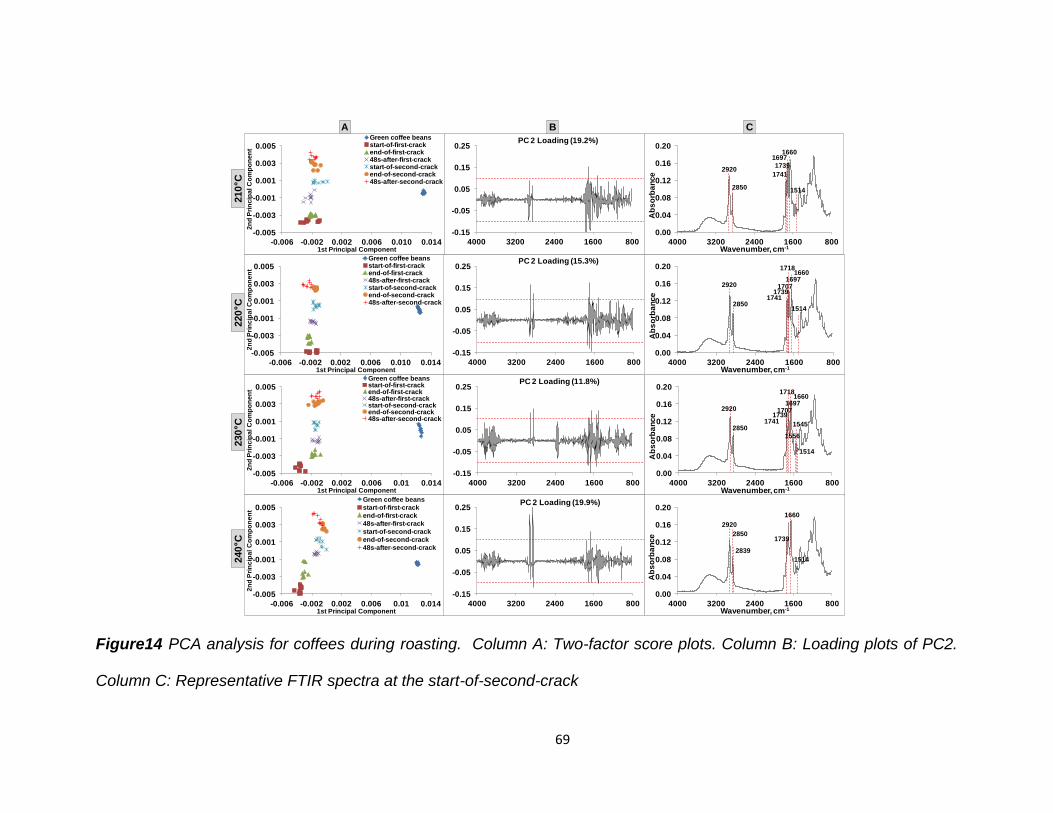
69
Figure14 PCA analysis for coffees during roasting. Column A: Two-factor score plots. Column B: Loading plots of PC2.
Column C: Representative FTIR spectra at the start-of-second-crack
-0.005
-0.003
-0.001
0.001
0.003
0.005
-0.006 -0.002 0.002 0.006 0.01 0.014
2n
d P
rin
cip
al
Co
mp
on
en
t
1st Principal Component
Green coffee beansstart-of-first-crackend-of-first-crack48s-after-first-crackstart-of-second-crackend-of-second-crack48s-after-second-crack
-0.15
-0.05
0.05
0.15
0.25
8001600240032004000
PC 2 Loading (11.8%)
0.00
0.04
0.08
0.12
0.16
0.20
8001600240032004000
Ab
so
rba
nce
Wavenumber, cm-1
2850
29201697
1660
1707
1741
1718
1514
1556
1545
1739
230 C
-0.005
-0.003
-0.001
0.001
0.003
0.005
-0.006 -0.002 0.002 0.006 0.01 0.014
2n
d P
rin
cip
al
Co
mp
on
en
t
1st Principal Component
Green coffee beans
start-of-first-crack
end-of-first-crack
48s-after-first-crack
start-of-second-crack
end-of-second-crack
48s-after-second-crack
-0.15
-0.05
0.05
0.15
0.25
8001600240032004000
PC 2 Loading (19.9%)
0.00
0.04
0.08
0.12
0.16
0.20
8001600240032004000
Ab
so
rba
nce
Wavenumber, cm-1
2920
2850
1514
1660
2839
1739
240 C
-0.005
-0.003
-0.001
0.001
0.003
0.005
-0.006 -0.002 0.002 0.006 0.010 0.014
2n
d P
rin
cip
al
Co
mp
on
en
t
1st Principal Component
Green coffee beansstart-of-first-crackend-of-first-crack48s-after-first-crackstart-of-second-crackend-of-second-crack48s-after-second-crack
-0.15
-0.05
0.05
0.15
0.25
8001600240032004000
PC 2 Loading (15.3%)
0.00
0.04
0.08
0.12
0.16
0.20
8001600240032004000
Ab
so
rba
nce
Wavenumber, cm-1
15142850
29201697
1660
1707
1741
1718
1739
220 C
210 C
-0.005
-0.003
-0.001
0.001
0.003
0.005
-0.006 -0.002 0.002 0.006 0.010 0.0142
nd
Pri
nc
ipa
l C
om
po
ne
nt
1st Principal Component
Green coffee beansstart-of-first-crackend-of-first-crack48s-after-first-crackstart-of-second-crackend-of-second-crack48s-after-second-crack
A
-0.15
-0.05
0.05
0.15
0.25
8001600240032004000
PC 2 Loading (19.2%)
B
0.00
0.04
0.08
0.12
0.16
0.20
8001600240032004000
Ab
so
rba
nce
Wavenumber, cm-1
2850
1697
1741
1514
1660
29201739
C
70
The IR spectra at 230oC were overlaid to examine the differences at
different roast stages (Figure 15). Compounds that accounted for the observed
variances include lipids (2920-2850 cm-1), unsaturated ester/lactone (1780-1762
cm-1), aliphatic esters (1755-1740 cm-1), aldehydes (1739-1724 cm-1), ketones
(1725-1705 cm-1), aliphatic acids (1714-1705 cm-1), aromatic acids (1700-1680
cm-1), and caffeine (1650-1600 cm-1) (Bellamy 1975; Keller 1986; Socrates 1994;
Briandet et al. 1996b; Hennessy et al. 2009). As shown in Figure 15, the spectral
differences were mainly related to the changes in concentration of these
compounds. For instance, the content of unsaturated ester/lactone (1780-1762
cm-1), and caffeine (1650-1600 cm-1) decreased from the start-of-first-crack to the
start-of-second-crack, and then stabilized. By contrast, aliphatic esters (1755-
1740 cm-1) and aldehydes (1739-1724 cm-1) gradually increased from the start-
of-first-crack to the start-of-second-crack, and then decreased due to thermal
degradation. Ketones (1725-1705 cm-1), aliphatic acids (1714-1705 cm-1), and
aromatic acids (1700-1680 cm-1) firstly decreased from the start-of-first-crack to
the start-of-second-crack, and then increased to the end-of-second crack.
Thereafter no detectable change was observed on further roasting. Finally, the
content of protein was stable from the start-of-first-crack to 48 s-after-first-cracks,
but significant decrease was observed from 48s-after-first-crack to the start-of-
second-crack.
71
Figure15 The expanded 2910-2850 cm-1, and 1800-1500 cm-1 regions of the spectra of coffee roasted at 230oC
0.00
0.04
0.08
0.12
0.16
0.20
2800285029002950
Ab
so
rba
nc
e 2920-2850
1500152515501575160016251650167517001725175017751800
Wavenumber, cm-1
start-of-first-crack
end-of-first-crack
48s-after-first-crack
start-of-second-crack
end-of-second-crack
48s-after-second-crack
1700-16801714-1705
1725-1705
1739-1724
1755-1740
1780-1762
1650-1600
1550
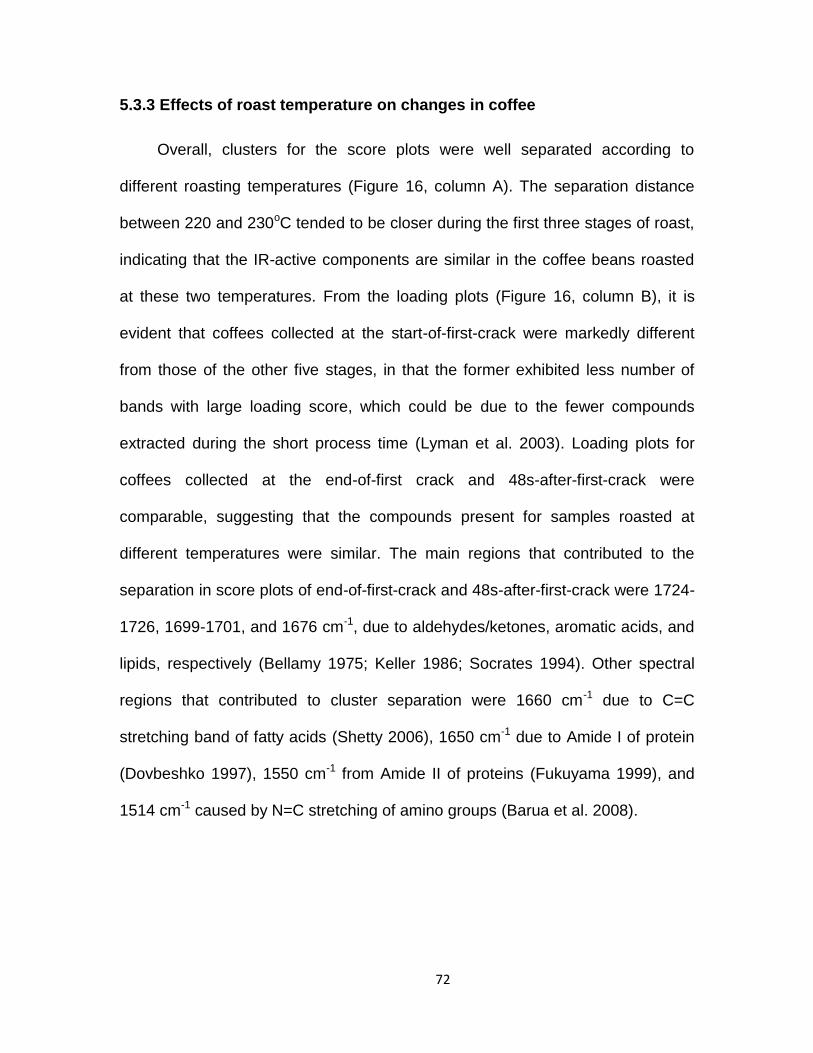
72
5.3.3 Effects of roast temperature on changes in coffee
Overall, clusters for the score plots were well separated according to
different roasting temperatures (Figure 16, column A). The separation distance
between 220 and 230oC tended to be closer during the first three stages of roast,
indicating that the IR-active components are similar in the coffee beans roasted
at these two temperatures. From the loading plots (Figure 16, column B), it is
evident that coffees collected at the start-of-first-crack were markedly different
from those of the other five stages, in that the former exhibited less number of
bands with large loading score, which could be due to the fewer compounds
extracted during the short process time (Lyman et al. 2003). Loading plots for
coffees collected at the end-of-first crack and 48s-after-first-crack were
comparable, suggesting that the compounds present for samples roasted at
different temperatures were similar. The main regions that contributed to the
separation in score plots of end-of-first-crack and 48s-after-first-crack were 1724-
1726, 1699-1701, and 1676 cm-1, due to aldehydes/ketones, aromatic acids, and
lipids, respectively (Bellamy 1975; Keller 1986; Socrates 1994). Other spectral
regions that contributed to cluster separation were 1660 cm-1 due to C=C
stretching band of fatty acids (Shetty 2006), 1650 cm-1 due to Amide I of protein
(Dovbeshko 1997), 1550 cm-1 from Amide II of proteins (Fukuyama 1999), and
1514 cm-1 caused by N=C stretching of amino groups (Barua et al. 2008).
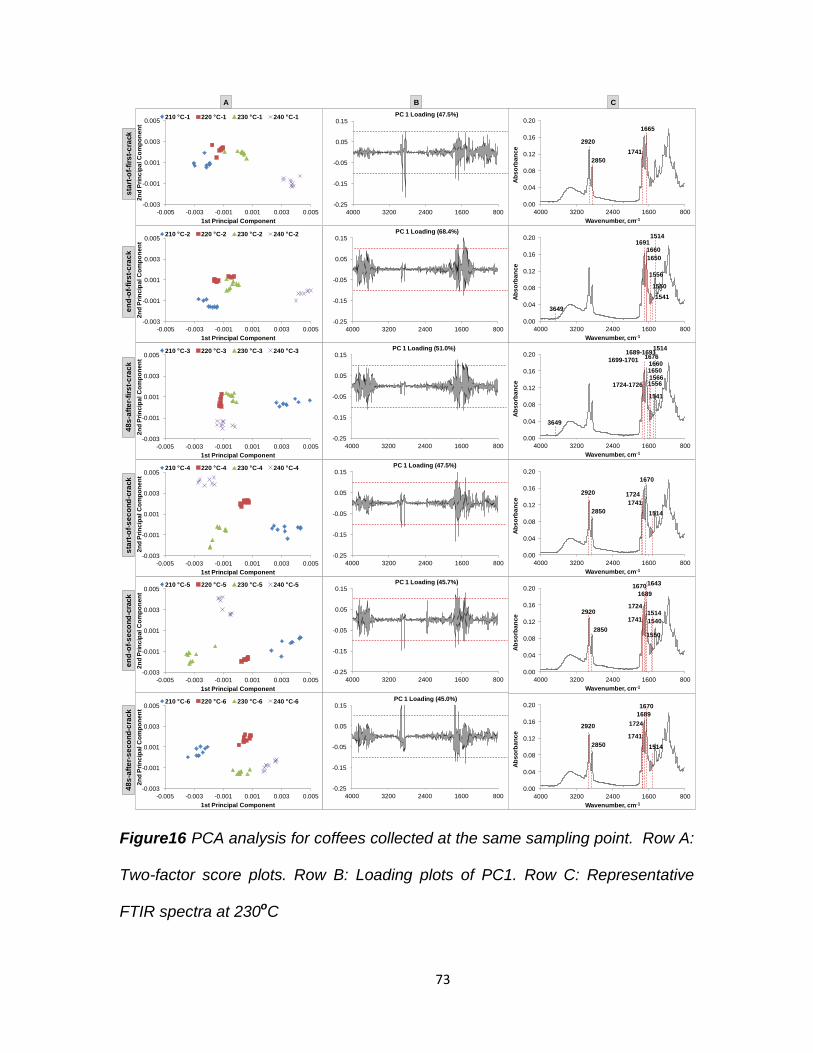
73
Figure16 PCA analysis for coffees collected at the same sampling point. Row A:
Two-factor score plots. Row B: Loading plots of PC1. Row C: Representative
FTIR spectra at 230oC
-0.25
-0.15
-0.05
0.05
0.15
8001600240032004000
PC 1 Loading (68.4%)
0.00
0.04
0.08
0.12
0.16
0.20
8001600240032004000
Ab
so
rba
nc
e
Wavenumber, cm-1
1550
1541
1650
1660
3649
1691
1556
1514
-0.003
-0.001
0.001
0.003
0.005
-0.005 -0.003 -0.001 0.001 0.003 0.005
2n
d P
rin
cip
al
Co
mp
on
en
t
1st Principal Component
210 C-2 220 C-2 230 C-2 240 C-2
en
d-o
f-fi
rst-
cra
ck
-0.25
-0.15
-0.05
0.05
0.15
8001600240032004000
PC 1 Loading (51.0%)
0.00
0.04
0.08
0.12
0.16
0.20
8001600240032004000
Ab
so
rba
nc
e
Wavenumber, cm-1
1514
1699-17011660
1724-1726
1541
3649
1676
1650
15561566
1689-1691
-0.003
-0.001
0.001
0.003
0.005
-0.005 -0.003 -0.001 0.001 0.003 0.005
2n
d P
rin
cip
al
Co
mp
on
en
t
1st Principal Component
210 C-3 220 C-3 230 C-3 240 C-3
48
s-a
fte
r-fi
rst-
cra
ck
-0.25
-0.15
-0.05
0.05
0.15
8001600240032004000
PC 1 Loading (47.5%)
0.00
0.04
0.08
0.12
0.16
0.20
8001600240032004000
Ab
so
rba
nc
e
Wavenumber, cm-1
2850
2920
1670
1741
1724
1514
-0.003
-0.001
0.001
0.003
0.005
-0.005 -0.003 -0.001 0.001 0.003 0.005
2n
d P
rin
cip
al
Co
mp
on
en
t
1st Principal Component
210 C-4 220 C-4 230 C-4 240 C-4
sta
rt-o
f-s
ec
on
d-c
rack
-0.25
-0.15
-0.05
0.05
0.15
8001600240032004000
PC 1 Loading (45.0%)
0.00
0.04
0.08
0.12
0.16
0.20
8001600240032004000
Ab
so
rba
nc
e
Wavenumber, cm-1
2850
2920
1741
1724
1514
1689
1670
-0.25
-0.15
-0.05
0.05
0.15
8001600240032004000
PC 1 Loading (45.7%)
0.00
0.04
0.08
0.12
0.16
0.20
8001600240032004000
Ab
so
rba
nc
e
Wavenumber, cm-1
1741
17241514
1689
16701643
1550
1540
2920
2850
-0.003
-0.001
0.001
0.003
0.005
-0.005 -0.003 -0.001 0.001 0.003 0.005
2n
d P
rin
cip
al
Co
mp
on
en
t
1st Principal Component
210 C-5 220 C-5 230 C-5 240 C-5
en
d-o
f-s
eco
nd
-cra
ck
-0.003
-0.001
0.001
0.003
0.005
-0.005 -0.003 -0.001 0.001 0.003 0.005
2n
d P
rin
cip
al
Co
mp
on
en
t
1st Principal Component
210 C-6 220 C-6 230 C-6 240 C-6
48
s-a
fte
r-s
eco
nd
-cra
ck
-0.003
-0.001
0.001
0.003
0.005
-0.005 -0.003 -0.001 0.001 0.003 0.005
2n
d P
rin
cip
al
Co
mp
on
en
t
1st Principal Component
210 C-1 220 C-1 230 C-1 240 C-1
sta
rt-o
f-fi
rst-
cra
ck
A
-0.25
-0.15
-0.05
0.05
0.15
8001600240032004000
PC 1 Loading (47.5%)
B
0.00
0.04
0.08
0.12
0.16
0.20
8001600240032004000
Ab
so
rba
nc
e
Wavenumber, cm-1
2850
2920
1665
1741
C
74
At the start-of-second-crack and end-of-second-crack, the separation
distances between clusters increased considerably, indicating that there is an
increased differentiation in the IR-active components for coffee samples
processed at different temperatures. However, roasting beyond the second crack
(48s-after-second-crack), the cluster separation decreased, especially between
samples processed at higher temperatures (230 and 240oC). These results imply
that the second crack is an important milestone during coffee roasting, at which
the IR-active components will differ depending on the roast temperature
employed.
5.3.4 Microstructural analysis
Scanning electron microscope (SEM) revealed considerable changes in
microstructure of coffee beans as they were processed to different stages during
roasting (Figure 17). As shown by the micrographs, the unroasted beans
displayed a relatively compact morphology as compared to the heated samples.
When the beans were heated to the start-of-first-crack, a few pores started to
form. As the roasting progressed to the end-of-first-crack, porous networks were
established in the beans. Continued roasting to 48s-after-first-crack did not
induce appreciable microstructural changes. However, when the samples were
roasted to the second crack, further expansion of the pores is evident from the
micrographs, as exemplified by the reduced thicknesses of the walls surrounding
the pores. Furthermore, the pores were more polyhedral in shape than those
appeared in earlier roast stages, suggesting that there was an increased internal
75
pore pressure that causes the pores to compress against each others, likely due
to the evolution of carbon dioxide. The carbon dioxide build up may have also
resulted in ruptured walls exhibited for some pores. Further heating to 48 s-after-
second-crack resulted in morphologies that were less uniform than the previous
stages, possibly due to the artefacts caused by the disruption of brittle cell wall
during sample preparation. Further examination of micrographs for samples
processed to the last two roasting stages revealed the presence of droplets on
the surface of the pore walls. The droplets may be attributable to the coalesced
oil that formed during the extended roasting.
In general, high-temperature-short-time roasting processes tend to produce
beans of higher porous structure in the bean cell tissues as compared to low-
temperature-long-time processes. The former processing condition is also known
to result in higher extraction yield during solvent extraction (Pittia et al. 2001).
However, at the magnification level employed during the SEM analysis and
roasting conditions used, no correlation can be made between the pore size and
roasting temperature. The lack of correlation could be due to the sample cutting
procedure involved, which does not guarantee the sectioning through the
maximum diameter of pores. Density measurement will provide a more accurate
assessment of sample porosity.
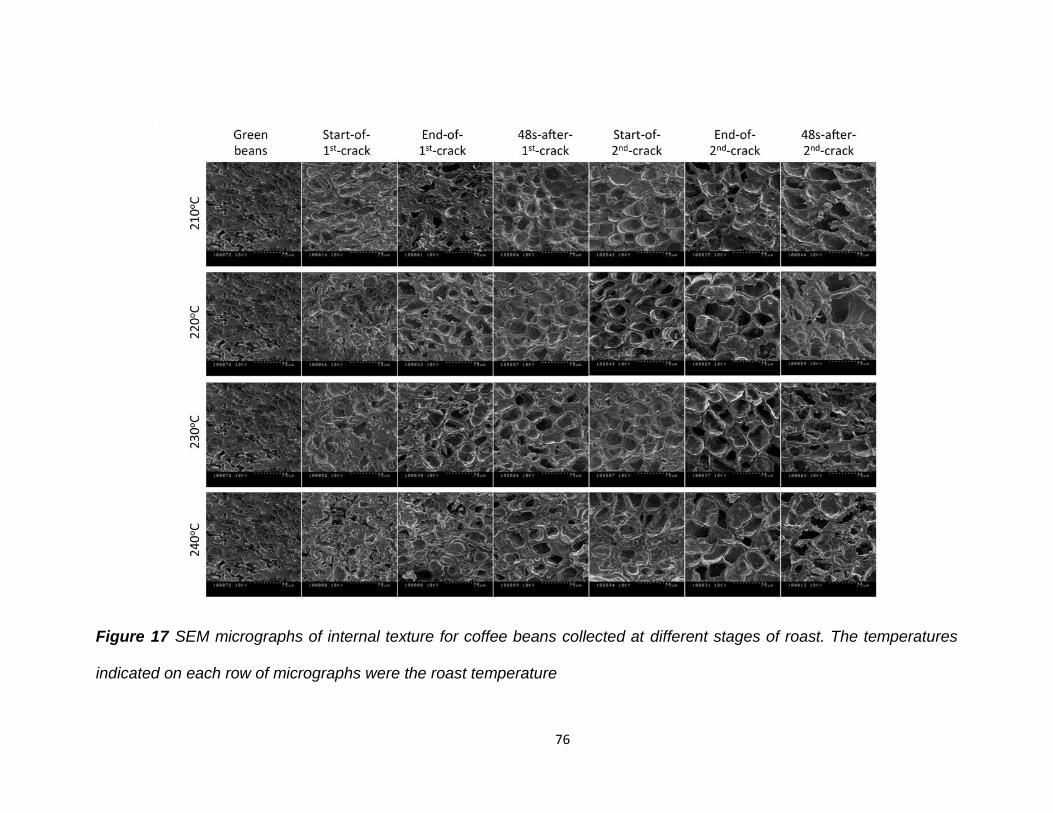
76
Figure 17 SEM micrographs of internal texture for coffee beans collected at different stages of roast. The temperatures
indicated on each row of micrographs were the roast temperature
77
In summary, this study showed that coffee beans processed to the same
extent of roast (as determined from bean lightness and roast cracking milestones)
by using different time-temperature roasting profiles does not necessarily
produce coffees of similar physical and chemical properties. FTIR-ATR spectra of
ground coffee obtained by different time-temperature combinations can be useful
for studying the effect of roasting conditions on IR-active compounds. The FTIR-
chemometric technique adopted in this study could serve as a rapid tool for
discriminating coffees with different roasting degrees, and coffees roasted by
different roasting profiles.
78
6 Conclusions and Future Works
This research studied the physicochemical changes that took place during
roast processing of coffee beans using a modified commercial fluidized bed
roaster.
An analytical method was developed for discriminating roasted coffee
samples from different geographical regions and roast degrees, using solvent
extraction and FTIR-chemometric techniques. Experimental results showed that
a mixture of equal volume of the solvent and water resulted in an optimal extract
that provided important spectral information for discriminating different samples.
PCA analysis of the FTIR spectra of extracts prepared from solvents of different
polarity (dichloromethane, ethyl acetate, hexane and acetone) allowed us to
study changes in chemical compositions between medium and dark roast
coffees. From the FTIR spectra, we observed that roasting coffee from medium
to dark causes increases in esters/lactones (1788 cm-1), aldehydes/ketones
(1739-1722 cm-1), ketones (1725-1705 cm-1), aromatic acids (1700-1680 cm-1),
and aliphatic acids (1714-1705 cm-1), but a decrease in caffeine content (1700-
1692 cm-1, and 1647-1641 cm-1), lipids (around 1736, 1740, 1745, and 1750 cm-
1), and polysaccharides and hemicelluloses (1739 cm-1). The SIMCA models
developed, based on dichloromethane and ethyl acetate extracts, allowed
accurate discrimination of coffees from different countries of origin, as well as
their roast degrees. The extraction and chemometric analysis methodologies
developed here may be useful for the coffee industry as a rapid and accurate tool
for classification of coffee according to origin and degree of roast. Also, the
79
methods may be useful for routine quality evaluation and complement
sensorial/cupping procedures.
To study the physicochemical changes in coffee bean during various stages
of roast, Brazilian beans were roasted at different temperatures (210, 220, 230,
and 240oC) until dark roast products were achieved. Coffee beans samples,
collected at different milestones during the thermal process, were analyzed for
pH value, titratable acidity, moisture content, and color lightness. When roasted
beyond the start-of-second-crack (i.e., typical milestone that reflects the
doneness of dark roast coffee), we observed that coffee beans processed at
high-temperature-short-time resulted in higher moisture content, higher pH value,
higher titratable acidity, higher porous structure in the bean cell tissues, and also
produced more aldehydes, ketones, aliphatic acids, aromatic acids, and caffeine
than those processed at low-temperature-long-time process. FTIR-chemometric
analysis of ethyl acetate extract of roasted coffees showed that for all the
temperatures tested, the score plots displayed clusters that were separated
according to different stages of roast as well as according to different roasting
temperatures. From this study, we can conclude that coffee beans processed to
the same extent of roast (as determined from bean lightness and roast cracking
milestones) but using different time-temperature roasting profiles do not
necessarily have the same physical and chemical properties. FTIR-ATR analysis
of ethyl acetate extract of coffee contains useful absorbance information for
studying the effect of roasting conditions on IR-active compounds. The FTIR-
80
chemometric technique potentially can be used for detecting process deviation in
production roasters.
Using the modified commercial fluidized bed roaster, in conjunction with
chemometric, FTIR and other analytical methodologies, the project has achieved
the objective of elucidating the effect of time-temperature on physicochemical
changes that took place in various coffee beans. While there is a significant gain
in knowledge from this project, there are still a number of unanswered questions
that are yet to be answered. The followings are several topics that are worth
further investigation:
After roasting, coffee beans are quenched to remove the residual heat
quickly. This process can trap significant amount of CO2 in the bean,
thereby lengthens the required time for CO2 degassing. This is a critical
step that must be carried out before packaging of roasted coffee to
prevent packaging failure due to pressure build up within the package.
Conceivably, depending on the method of cooling used, post-roasting
carbon dioxide degassing time may be shortened, or even eliminated. For
instance, spraying roasted coffee with a controlled amount of water under
agitation will remove the residual heat from the coffee beans rapidly due to
the latent heat of vaporization of water. The humidified air may increase
the rate of CO2 degas. Potentially, this process may be incorporated as
part of the roasting regime towards the end of the roast cycle before
ejecting the beans from the roaster. Alternatively, slower cooling at
temperatures above ambient in an enclosed space will increase the
81
diffusivity of CO2, potentially shortening the duration of the degassing step.
Further investigation involving these types of innovative process
inventions to shorten or eliminate CO2 degas will simplify the degas
storage and packaging requirements of roasted coffee.
In this project, we have demonstrated that FTIR-chemometric technique is
useful for the evaluation of coffee properties. Further investigations
involving more coffee varieties and larger sample size will improve the
robustness of the models.
Due to the time constraint, sensory studies were not conducted in this
project. By coupling the IR fingerprints with sensory feedback from expert
cuppers, it is possible to derive PLS and SIMCA models that complement
the sensory evaluation, creating quantifiable spectral data for quality
assurance, validation, product development, training and other purposes.
A good quality cup of coffee is depending on many factors, such as the
degassing methods of coffee after roasting, grind particle size, brewing
time/temperature profiles, quality of brew water, and storage/time
conditions (temperature, O2, and relative humidity). Integrated studies
involving these factors, in conjunction with sensory evaluation, will improve
the understanding on the quality attributes of brewed coffee.
82
7 REFERENCE
ANIL, K. D. DAVID, C. S. & MICHAEL, T. (2004). Applications of electronic noses and tongues in food analysis. International Journal of Food Science & Technology 39(6), 587-604.
BAGGENSTOSS, J. POISSON, L. KAEGI, R. PERREN, R. & ESCHER, F. (2008). Coffee Roasting and Aroma Formation: Application of Different Time-temperature Conditions. Journal of Agricultural and Food Chemistry 56(14), 5836-5846.
BALZER, H. H. (2001). Acids in coffee.
BANKS, M. (2002). The World Encyclopedia of Coffee. London: Anness.
BARTER, R. (2004). A short introduction to the theory and practice of profile roasting. Tea and Coffee Trade Journal 68, 34-37.
BARUA, A. G. HAZARIKA, S. HUSSAIN, M. & MISRA, A. K. (2008). Spectroscopic Investigation of the Cashew Nut Kernel (Anacardium occidentale). The Open Food Science Journal 2, 85-88.
BELITZ, H.-D. GROSCH, W. & SCHIEBERLE, P. (2009). Coffee, Tea, Cocoa. Vatican Springer Berlin Heidelberg.
BELL, L. N. WETZEL, C. R. & GRAND, A. N. (1996). Caffeine content in coffee as influenced by grinding and brewing techniques. Food Research International 29(8), 785-789.
BELLAMY, L. J. (1975). The Infrared Spectra of Complex Molecules. London, England: Chapman & Hall Ltd.
BERTRAND, B. VILLARREAL, D. LAFFARGUE, A. POSADA, H. LASHERMES, P. & DUSSERT, S. (2008). Comparison of the Effectiveness of Fatty Acids, Chlorogenic Acids, and Elements for the Chemometric Discrimination of Coffee (Coffea arabica L.) Varieties and Growing Origins. Journal of Agricultural and Food Chemistry 56(6), 2273-2280.
BETANCOURT, L. E. & FRANK, H. K. (1983). Bedingungen des mikrobiellen Verderbs von gru¨nem Kaffee. Deutsche Lebensmittel-Rundschau 79, 366-369.
BICCHI, C. P. PANERO, O. M. PELLEGRINO, G. M. & VANNI, A. C. (1997). Characterization of Roasted Coffee and Coffee Beverages by Solid Phase Microextraction-gas Chromatography and Principal Component Analysis. Journal of Agricultural and Food Chemistry 45(12), 4680-4686.
83
BRIANDET, R. KEMSLEY, E. K. & WILSON, R. H. (1996a). Approaches to Adulteration Detection in Instant Coffees using Infrared Spectroscopy and Chemometrics. Journal of the Science of Food and Agriculture 71(3), 359-366.
BRIANDET, R. KEMSLEY, E. K. & WILSON, R. H. (1996b). Discrimination of Arabica and Robusta in Instant Coffee by Fourier Transform Infrared Spectroscopy and Chemometrics. Journal of Agricultural and Food Chemistry 44(1), 170-174.
BROLLO, G. CAPPUCCI, R. & NAVARINI, L. (2008). Acidity in Coffee: Bridging the Gap Between Chemistry and Psychophysics. In 22nd Colloquium: Coffee Aroma & Flavour Chemistry Campinas, São Paulo, Brazil: Association for Science and Information on Coffee.
BUCHELI, P. MEYER, I. PASQUIER, M. & LOCHER, R. (1996). Determination of soluble sugars by high performance anion exchange chromatography (HPAE) and pulsed electrochemical detection (PED) in coffee beans upon accelerated storage. In The 10th FESPP meeting pp. L-12. Italy: Plant Physiology Biochemistry.
BUCHELI, P. MEYER, I. PITTET, A. VUATAZ, G. & VIANI, R. (1998). Industrial Storage of Green Robusta Coffee under Tropical Conditions and Its Impact on Raw Material Quality and Ochratoxin A Content. Journal of Agricultural and Food Chemistry 46(11), 4507-4511.
BUFFO, R. A. & CARDELLI-FREIRE, C. (2004). Coffee flavour: an overview. Flavour and Fragrance Journal 19(2), 99-104.
BYERS, J. A. (2003). Polarity index of solvents. Phenomenex catalog, www.Phenomenex.com.
CAGUE, R. MILLARD, M. & GIBSON, D. (2009). Beyond the Bean: Redefining Coffee Quality. pp. 1-18. Environment and Natural Resource Management and Agribusiness Practice Networks.
CANADA, C. A. O. (2003). 2003 CANADIAN COFFEE DRINKING STUDY Tonronto.
CASAL, S. ALVES, M. R. MENDES, E. OLIVEIRA, M. B. P. P. & FERREIRA, M. A. (2003). Discrimination between Arabica and Robusta Coffee Species on the Basis of Their Amino Acid Enantiomers. Journal of Agricultural and Food Chemistry 51(22), 6495-6501.
CHARLTON, A. J. FARRINGTON, W. H. H. & BRERETON, P. (2002). Application of 1H NMR and Multivariate Statistics for Screening Complex Mixtures: Quality Control and Authenticity of Instant Coffee. Journal of Agricultural and Food Chemistry 50(11), 3098-3103.
84
CLARKE, R. J. (1986). The Flavour of Coffee. Developments in Food Science 3B, 1-47.
CLARKE, R. J. & MACRAE, R. (1987). Coffee. London: Elsevier Applied Science
CLARKE, R. J. & MACRAE, R. (1988). Coffee: Physiology. London: Elsevier Applied Science.
COSTA FREITAS, A. M. & MOSCA, A. I. (1999). Coffee geographic origin -- an aid to coffee differentiation. Food Research International 32(8), 565-573.
CZERNY, M. MAYER, F. & GROSCH, W. (1999). Sensory Study on the Character Impact Odorants of Roasted Arabica Coffee. Journal of Agricultural and Food Chemistry 47(2), 695-699.
DAVIS, A. P. (2001). Two new species of Coffea L. (Rubiaceae) from northern Madagascar. ADANSONIA 23(2), 337-345.
DE MARIA, C. A. B. TRUGO, L. C. MOREIRA, R. F. A. & WERNECK, C. C. (1994). Composition of green coffee fractions and their contribution to the volatile profile formed during roasting. Food Chemistry 50(2), 141-145.
DEL CASTILLO, M. D. AMES, J. M. & GORDON, M. H. (2002). Effect of Roasting on the Antioxidant Activity of Coffee Brews. Journal of Agricultural and Food Chemistry 50(13), 3698-3703.
DEVENTER, G. KAMEMOTO, E. KUZNICKI, J. HECKERT, D. & SCHULTE, M. (1992). Lower esophageal sphincter pressure, acid secretion, and blood gastrin after coffee consumption. Digestive Diseases and Sciences 37(4), 558-569.
DOVBESHKO, G. I., GRIDINA, N.Y., KRUGLOVA, E.B., AND PASHCHUK, O.P. (1997). FTIR spectroscopy studies of nucleic acid damage. Talanta (53), 233-246.
DUSSELDORP, M. V. KATAN, M. B. & DEMACKER, P. N. M. (1990). Effect of Decaffeinated versus Regular Coffee on Serum. American journal of Epidemiology 132(1), 33-40.
EGGERS, R. & PIETSCH, A. (2001). Coffee: Recent Developments. Oxford: Blackwell Science Ltd.
ELIANE NABEDRYK, M. G., AND JACQUES BRETON (1982). Orientation of Gramicidin a Transmembrane Channel Infrared Dichroism Study of Gramicidin in Vesicles. BIOPHYSICAL JOURNAL 38, 243-249.
FALK, M. GIL, M. & IZA, N. (1990). Self-association of caffeine in aqueous solution: an FT-IR study. Canadian Journal of Chemistry 68, 1293-1299.
FLAMENT, I. (2002). Coffee flavor chemistry. Geneva: John Wiley & Sons, LTD.
85
FOBE, L. A. NERY, J. P. & TANGO, J. S. (1968). Influence of the roasting degree on the chemical composition of coffee. In Third International Colloquium on the Chemistry of Coffee pp. 389-397. Trieste: Association for science and information on coffee.
FRANCA, A. S. & OLIVEIRA, L. S. (2009). Alternative uses for coffee husks - a solid waste from green coffee production. In Chemical, Biological and Environmental Engineering (Ed L. Kai), pp. 21-24. Singapore: Word Scientific Publishing Co. Pte. Ltd.
FU, Y. (2011). INTERACTIONS OF WINE WITH PACKAGING AND PREDICTION OF QUALITY PARAMETERS. University of Guelph.
FUKUYAMA, Y., YOSHIDA, S., YANAGISAWA, S., AND SHIMIZU, M. (1999). A study on the differences between oral squamous cell carcinomas and normal oral mucosas measured by Fourier transform infrared spectroscopy. Biospectroscopy (5), 117-126.
GARRIGUES, J. M. BOUHSAIN, Z. GARRIGUES, S. & DE LA GUARDIA, M. (2000). Fourier transform infrared determination of caffeine in roasted coffee samples. Fresenius' Journal of Analytical Chemistry 366(3), 319-322.
GEIGER, R. PERREN, R. KUENZLI, R. & ESCHER, F. (2005). Carbon Dioxide Evolution and Moisture Evaporation During Roasting of Coffee Beans. Journal of Food Science 70(2), E124-E130.
GELADI, P. & KOWALSKI, B. R. (1986). Partial least-squares regression: a tutorial Analytica Chimica Acta (185), 1-17.
GERLACH, R. W. KOWALSKI, B. R. & WOLD, H. (1979). Partial Least Squares Path Modelling with Latent Variables. Analytica Chimica Acta 112, 417-421.
GIAMPIERO SACCHETTI, C. D. M., PAOLA PITTIA, DINO MASTROCOLA (2009). Effect of roasting degree, equivalent thermal effect and coffee type on the radical scavenging activity of coffee brews and their phenolic fraction. Journal of Food Engineering 90, 74-80.
GINZ, M. BALZER, H. H. BRADBURY, A. G. W. & MAIER, H. G. (2000). Formation of aliphatic acids by carbohydrate degradation during roasting of coffee. European Food Research and Technology 211(6), 404-410.
GOPALAKRISHNA RAO, N. BALACHANDRAN, A. NATARAJAN, C. P. & SANKARAN, A. N. (1971). Variations in moisture and colour in monsooned coffee. Journal of Agricultural and Food Chemistry 8, 174-176.
GRIFFIN, M. (2001-2006). Coffee Roast Colors and Characteristics. Coffee Research Institute.
86
GRIFFIN, M. J. & BLAUCH, D. N. (1999). Determination of the relationship between phosphate concentration and perceived acidity in coffee. In 18th International Scientific Colloquium on Coffee pp. 118-126. Helsinki, Finland: Association for Science and Information on Coffee.
HAGMAN, A. & JACOBSSON, S. (1990). Applications of chemometrics for characterization of macromolecules. Drug development and industrial pharmacy 16(17), 2527-2545.
HASHIM, L. & CHAVERON, H. (1995). Use of methylpyrazine ratios to monitor the coffee roasting. Food Research International 28(6), 619-623.
HENDRIKS, M. M. W. B. CRUZ-JUAREZ, L. BONT, D. D. & HALL, R. D. (2005). Preprocessing and exploratory analysis of chromatographic profiles of plant extracts. Anal. Chim. Acta. 545, 53-64.
HENNESSY, S. DOWNEY, G. & ODONNELL, C. P. (2009). Confirmation of Food Origin Claims by Fourier Transform Infrared Spectroscopy and Chemometrics: Extra Virgin Olive Oil from Liguria. Journal of Agricultural and Food Chemistry 57(5), 1735-1741.
HERNANDEZ, J. A. HEYD, B. IRLES, C. VALDOVINOS, B. & TRYSTRAM, G. (2007). Analysis of the heat and mass transfer during coffee batch roasting. Journal of Food Engineering 78(4), 1141-1148.
HOFMANN, T. & SCHIEBERLE, P. (2001). Chemical Interactions between Odor-Active Thiols and Melanoidins Involved in the Aroma Staling of Coffee Beverages. Journal of Agricultural and Food Chemistry 50(2), 319-326.
HORWITZ, W. (2000). Coffee and tea. In Official methods of Analysis of Association of Official Analytical Chemists International. Gaithersburg, MD, USA: AOAC Press.
ILLY, A. & VIANI, R. (1995). Espresso Coffee: The Chemistry of Quality Londres, UK: Academic Press.
ILLY, A. & VIANI, R. (1998). Espresso coffee. San Diego: Academic press.
ILLY, A. & VIANI, R. (2005). Espresso coffee: the science of quality. San Diego: Elsevier Academic Press.
INFOMETRIX (2010). Chemometrics.
INNAWONG, B. MALLIKARJUNAN, P. IRUDAYARAJ, J. & MARCY, J. E. (2004). The determination of frying oil quality using Fourier transform infrared attenuated total reflectance. Lebensmittel-Wissenschaft und-Technologie 37(1), 23-28.
87
K.SPEER R.TEWIS & A.MONTAG (1991). 16-O-Methylcafestol a Quality Indicator for Coffee. In 14th ASIC colloquium Francisco.
KANTOR, D. B. & FEKETE, A. (2006). Characterization and Quantification of Coffee by Using an Electronic Tongue. In The 2nd CIGR Section VI International Symposium on Future of Food Engineering pp. 26-28. Warsaw, Poland.
KELLER, R. J. (1986). The Sigma Library of FT-IR Spectra. St. Louis, MO: Sigma Chemical Co.
KEMSLEY, E. K. RUAULT, S. & WILSON, R. H. (1995). Discrimination between Coffea arabica and Coffea canephora variant robusta beans using infrared spectroscopy. Food Chemistry 54(3), 321-326.
KRIVAN, V. BARTH, P. & MORALES, A. F. (1993). Multielement analysis of green coffee and its possible use for the determination of origin. Microchimica Acta 110(4), 217-236.
KULABA, G. W. (1981). Coffee processing research: a review. Kenya Coffee 46, 351-360.
LYMAN, D. J. BENCK, R. DELL, S. MERLE, S. & MURRAY-WIJELATH, J. (2003). FTIR-ATR Analysis of Brewed Coffee: Effect of Roasting Conditions. Journal of Agricultural and Food Chemistry 51(11), 3268-3272.
MAGIDMAN, J. M. P. A. P. (1984). Analysis of the Aroma of the Intact Fruit of Coffea arabica by GC-FT-IR. Applied Spectroscopy 38(2), 181-184.
MARIA, M. J. PABLOS, F. & GONZALEZ, A. G. (1998). Discrimination between arabica and robusta green coffee varieties according to their chemical composition. Talanta 46(6), 1259-1264.
MARTIN, M. J. PABLOS, F. & GONZALEZ, A. G. (1999). Characterization of arabica and robusta roasted coffee varieties and mixture resolution according to their metal content. Food Chemistry 66(3), 365-370.
MASSINI, R. NICOLI, M. C. CASSARÀ, A. & LERICI, C. R. (1990). Physico-chemical changes of coffee beans during roasting. Italian Journal of Food Science 2, 123-130.
MAYER, F. CZERNY, M. & GROSCH, W. (2000). Sensory study of the character impact aroma compounds of a coffee beverage. European Food Research and Technology 211(4), 272-276.
MAZZAFERA, P. (1999). Chemical composition of defective coffee beans. Food Chemistry 64(4), 547-554.
88
MISHRA, G. S. & KUMAR, A. (2002). Preparation of heterogeneous vanadrum (VO2+) catalyst for selective hydroxylation of cyclohexane by molecular oxygen. Catalysis Letters 81(1-2), 113-117.
MOTTALEB, M. A. COOKSEY, B. G. & LITTLEJOHN, D. (1997). Evaluation of gel permeation chromatography to Fourier transform infrared spectrometric detection using a modified thermospray for analysis of polystyrene samples. Fresenius' Journal of Analytical Chemistry 358(4), 536-538.
MOVASAGHI, Z. REHMAN, S. & REHMAN, I. U. (2008). Fourier Transform Infrared (FTIR) Spectroscopy of Biological Tissues. Applied Spectroscopy Reviews 43(2), 134 - 179.
MURPHY, P. A. SONG, T. BUSEMAN, G. BARUA, K. BEECHER, G. R. TRAINER, D. & HOLDEN, J. (1999). Isoflavones in Retail and Institutional Soy Foods. Journal of Agricultural and Food Chemistry 47(7), 2697-2704.
NAGARAJU, V. D. MURTHY, C. T. RAMALAKSHMI, K. & SRINIVASA RAO, P. N. (1997). Studies on roasting of coffee beans in a spouted bed. Journal of Food Engineering 31(2), 263-270.
NEHRING, U. P. & MAIER, H. G. (1992). Indirect determination of the degree of roast in coffee. Zeitschrift für Lebensmitteluntersuchung und -Forschung A 195(1), 39-42.
NUNES, F. M. COIMBRA, M. A. DUARTE, A. C. & DELGADILLO, I. (1997). Foamability, Foam Stability, and Chemical Composition of Espresso Coffee As Affected by the Degree of Roast. Journal of Agricultural and Food Chemistry 45(8), 3238-3243.
OHNSMANN, J. QUINTÁS, G. GARRIGUES, S. & DE LA GUARDIA, M. (2002). Determination of caffeine in tea samples by Fourier transform infrared spectrometry. Analytical and Bioanalytical Chemistry 374(3), 561-565.
PAGNI, R. (2005). Solvents and Solvent Effects in Organic Chemistry, Third Edition (Christian Reichardt). Journal of Chemical Education 82(3), 382-null.
PARADKAR, M. M. & IRUDAYARAJ, J. (2002). A Rapid FTIR Spectroscopic Method for Estimation of Caffeine in Soft Drinks and Total Methylxanthines in Tea and Coffee. Journal of Food Science 67(7), 2507-2511.
PARLIMENT, T. H. & STAHL, H. D. (1995). What makes that coffee smell so good? Chemtech 8, 38-47.
PARLIMENT THOMAS, H. (2000). An Overview of Coffee Roasting. In Caffeinated Beverages pp. 188-201. American Chemical Society.
PAUL, G. (2006). Practical Guide To Chemometrics. Boca Raton: FL: CRC Press.
89
PITTIA, P. ROSA, M. D. & LERICI, C. R. (2001). Textural Changes of Coffee Beans as Affected by Roasting Conditions. LWT - Food Science and Technology 34(3), 168-175.
PONTE, S. (2002). The 'Latte Revolution'? Regulation, Markets and Consumption in the Global Coffee Chain. World Development 30(7), 1099-1122.
PUHLMANN, R. & HABEL, G. (1989). Examinations to test the grinding behavior of roasted coffee. Lebensmittelindustrie 36(4), 161-163.
RAHN, W. & KONIG, W. A. (1978). GC/MS Investigations of the Constituents in a Diethyl Ether Extract of an Acidified Roast Coffee Infusion. Journal of High Resolution Chromatography & Chromatography Communications, 69-71.
RAMALAKSHMI, K. & RAGHAVAN, B. (1999). Caffeine in Coffee: Its Removal. Why and How? Critical Reviews in Food Science and Nutrition 39(5), 441-456.
ROGERS, P. J. & RICHARDSON, N. J. (1993). Why do we like drinks that contain caffeine? Trends in Food Science & Technology 4(4), 108-111.
RUBAYIZA, A. B. & MEURENS, M. (2005). Chemical Discrimination of Arabica and Robusta Coffees by Fourier Transform Raman Spectroscopy. Journal of Agricultural and Food Chemistry 53(12), 4654-4659.
RUSSWURM, H. J. (1970). Fractionation and analysis of aroma precursors in green coffee. In Fourth International Colloquium on the Chemistry of Coffee pp. 103-107. Amsterdam: Association for Science and Information on Coffee.
SANZ, C. MAEZTU, L. ZAPELENA, M. J. BELLO, J. & CID, C. (2002). Profiles of volatile compounds and sensory analysis of three blends of coffee: influence of different proportions of Arabica and Robusta and influence of roasting coffee with sugar. Journal of the Science of Food and Agriculture 82(8), 840-847.
SCHENKER, S. HEINEMANN, C. HUBER, M. POMPIZZI, R. PERREN, R. & ESCHER, R. (2002). Impact of Roasting Conditions on the Formation of Aroma Compounds in Coffee Beans. Journal of Food Science 67(1), 60-66.
SCHENKER, S. R. (2000). Investigations on the Hot Air Roasting of Coffee Beans. Swiss Federal Institute of Technology.
SEMMELROCH, P. LASKAWY, G. BLANK, I. & GROSCH, W. (1995). Determination of potent odourants in roasted coffee by stable isotope dilution assays. Flavour and Fragrance Journal 10(1), 1-7.
SHETTY, G., KEDALL, C., SHEPHERD, N., STONE, N., AND BARR, H. (2006). Raman spectroscopy: evaluation of biochemical changes in carcinogenesis of oesophagus. British Journal of Cancer (94), 1460-1464.
90
SHIBAMOTO, T. (1991). An Overview of Coffee Aroma and Flavour Chemistry. In In 14th International Scientific Colloquium on Coffee pp. 107-116. San Francisco, USA: Association Scientifique Internationale pour le Café.
SILVIA, R. LAURA, M. ANTONIO, B. CONCEPCION, C. & MANUEL, A. C. (2004). Screening and distinction of coffee brews based on headspace solid phase microextraction/gas chromatography/principal component analysis. Journal of the Science of Food and Agriculture 84(1), 43-51.
SILWAR, R. & LÜLLMANN, C. (1993). Investigation of aroma formation in Robusta coffee during roasting. Cafe Cacao 2(37), 145-152.
SIVETZ, M. (1991). Growth in use of automated fluid bed roasting of coffee beans. In In 14th International Scientific Colloquium on Coffee USA.
SIVETZ, M. & DESROSIER, N. W. (1979). Coffee Technology. Westport: AVI Publishing Company.
SOCRATES, G. (1994). Infrared Characteristic Group Frequencies. New York: John Wiley.
STUART, B. H. (2003). Infrared spectroscopy: Fundamentals and applications. Hoboken, NJ ; Etobicoke, Ont. : John Wiley & Sons
VALDENEBRO, M. S. LEÓN-CAMACHO, M. PABLOS, F. GONZÁLEZA, A. G. & MARTÍN, M. J. (1999). Determination of the arabica/robusta composition of roasted coffee according to their sterolic content. Analyst 124, 999-1002.
VIGNOLI, J. A. BASSOLI, D. G. & BENASSI, M. T. (2011). Antioxidant activity, polyphenols, caffeine and melanoidins in soluble coffee: The influence of processing conditions and raw material. Food Chemistry 124(3), 863-868.
VITZTHUM, O. G. (1975). Chemie und Bearbeitung des Kaffees. Berlin Springer.
VOILLEY, A. SAUVAGEOT, F. SIMATOS, D. & WOJCIK, G. (1981). Influence of Some Processing Conditions on the Quaility of Coffee Brew. Journal of Food Processing and Preservation 5(3), 135-143.
WANG, J. SOOJIN, J. BITTENBENDER, H. C. GAUTZ, L. & LI, X. Q. (2009). Fourier Transform Infrared Spectroscopy for Kona Coffee Authentication. Journal of Food Science 74, C385-C391.
WANG, N. FU, Y. & LIM, L.-T. (2011). Feasibility Study on Chemometric Discrimination of Roasted Arabica Coffees by Solvent Extraction and Fourier Transform Infrared Spectroscopy. Journal of Agricultural and Food Chemistry 59(7), 3220-3226.
91
WOLFROM, M. L. & PATIN, D. L. (1965). Carbohydrates of the Coffee Bean. IV. An Arabinogalactan1. The Journal of Organic Chemistry 30(12), 4060-4063.
WORKMAN JR., J. J. MOBLEY, P. R. KOWALSKI, B. R. & BRO, R. (1996). Review of Chemometrics Applied to Spectroscopy: 1985-95, Part I Applied Spectroscopy Reviews 31(1&2), 73-124.
YAMAMOTO, Y. KUMAMARU, T. HAYASHI, Y. & KANKE, M. (1972). Effect of solvent extraction on the atomic-absorption spectrophotometry in determination of ppM levels of cadmium with dithizone. Talanta 19(8), 953-959.
YERETZIAN, C. JORDAN, A. BADOUD, R. & LINDINGER, W. (2002). From the green bean to the cup of coffee: investigating coffee roasting by on-line monitoring of volatiles. European Food Research and Technology 214(2), 92-104.
YOSHIDA, S. MIYAZAKI, M. SAKAI, K. TAKESHITA, M. YUASA, S. SATO, A. KOBAYASHI, T. WATANABE, S. & OKUYAMA, H. (1997). Fourier transform infrared spectroscopic analysis of rat brain microsomal membranes modified by dietary fatty acids: Possible correlation with altered learning behavior. Biospectroscopy 3(4), 281-290.
ZHANG, W. WANG, X. & FU, X. (2005). In situ FTIR Investigation of Magnetic Field Effect on Heterogeneous Photocatalytic Degradation of Benzene over Pt/TiO2. Chinese Chemical Letters 16(9), 1275-1278.