physico-chemical evaluation of the water quality in dm
TRANSCRIPT
DM
Physico-chemical evaluation of the water quality in Rocha River
A qualitative and comparative analysis including aspects of social and environmental factors
Stina Jacobson Ida Sekizovic Engineering Geology Faculty of Engineering, LTH Lund University
MSc Thesis, 30 ECTS ISRN LUTVDG/(TVTG-5160)/1-65/(2019)

Thesis work for Masters in Science 30 ECTS Engineering Geology, LTH, Lund University
Physico-chemical evaluation of the water quality in Rocha River -A qualitative and comparative analysis including aspects of social and environmental factors Stina Jacobson Ida Sekizovic Engineering Geology Faculty of Engineering Lund University Lund 2019 ISRN LUTVDG/ (TVTG-5160)/ 1-65/ (2019) Supervisor Master Thesis Gerhard Barmen, Engineering Geology Hosting University Universidad Mayor de San Simon (UMSS) Cochabamba, Bolivia Assistant Supervisor Andrés Gonzales Amaya, Laboratório de Hidráulica, UMSS Examiner Jan-Erik Rosberg, Engineering Geology
This study was performed within the framework of The Minor Field Studies (MFS) Scholarship Programme, which is funded by the Swedish International Development Cooperation Agency, Sida. The responsibility for the accuracy of the information presented in this MSc thesis rests entirely with the authors.

Acknowledgment
We are grateful for the opportunity the MFS-scholarship has given us to perform our MSc thesis abroad. We gained great experience in Bolivia and the time spent in Cochabamba will forever be cherished. We would like to express sincere gratitude to our supervisors Gerhard Barmen and Andrés Gonzales, for supervising and encouraging us to pursue this journey.
We would further like to give a special thank you to Ana María Romero Jaldín, head of C.A.S.A, and Mauricio Villazón, head of Laboratório de Hidráulic, for all the help we have gained with everything from trying to solve our modelling problems and interpreting our results to finding available cars for our fieldwork. The collaboration between the two departments has eased our work and for that we thank all people involved. To all the students from UMSS that put aside their study to help us: we could not have done the field study without you and thank you for all the joyful moments.
Warm regards, Stina Jacobson and Ida Sekizovic
Abstract
In this study, a physico-chemical analysis of the Rocha River was performed during the beginning of the rainy season 2018 in order to examine the current state of the water quality in the river at six different locations. The river, located in the Cochabamba department, Bolivia, was examined from upstream in Sacaba to downstream in Sipe Sipe. An additional aim was to determine social and environmental contributing factors for the water quality of the Rocha River. The chemical analysis was based on the following parameters: electrical conductivity, dissolved oxygen, 5-day biochemical oxygen demand, chemical oxygen demand, nitrates and fecal coliforms. To examine the state and range of usage for the water in Rocha River the results of the water quality for each parameter was compared with the regulations for drinking water, agriculture water and environmental water from WHO, EPA and FAO as well as Bolivian regulations. The stage and water flow of the river at respetive locations were measured and modelled in Hec-RAS to draw conclusions on how the physical parameters might affect the distribution of the pollution in Rocha River. The quality of the river water in this study was classified as “very”- and “highly polluted” water according to the performed organic pollution (ICO)-index. In line with previous studies, the deterioration has continued over the years since 1998 and has now reached even the outskirts of the valley from upstream in Sacaba to downstream in Sipe Sipe. From the results, the prominent parameters of the pollution were the low dissolved oxygen levels and high coliform concentrations at all locations downstream of Chiñata. The results of the high pollution is correlated with areas where the population is dense, the presence of industrial activity is high and the connection to sewage systems is poor or nonexistent. A main contributing factor of the pollution is that large volumes of untreated wastewater is directly discharged to the Rocha River along its course to the extent that it disturbs the possibilty of natural river restoration. Based on the Bolivian Environmental Law No.1333 and the analysed parameters, the water was classified as “D” at five out of the six sampling locations. This highly constrains the usage of the river water regarding health and environmental aspects. However, the water scarcity in the area enforces the farmers to use water from the Rocha River as irrigation, which may contribute to degradation of soil, pollution of the groundwater and induce health risks. Keywords: Cochabamba, Rocha River, water quality analysis, water pollution, wastewater, regulations, ICO-index, Hec-RAS, minor field study

Resumen
En el presente estudio, análisis físico-químico del Río Rocha, fue realizado durante el inicio de la estación lluviosa del 2018 con objeto de examinar el estado actual de la calidad de agua en seis diferentes lugares del Río Rocha. El río, localizado en el departamento de Cochabamba, Bolivia, fue analizado desde aguas arriba en Sacaba, hasta aguas abajo en Sipe Sipe. Un objetivo adicional de esta investigación fue la determinación de las contribuciones de los factores sociales y ambientales a la calidad de agua del Río Rocha.
El análisis químico fue basado en los siguientes parámetros: conductividad eléctrica, oxígeno disuelto, demanda bioquímica de oxigeno a 5 días, demanda química de oxigeno, nitratos, y coliformes fecales. Para la examinación del estado y alcance de uso de agua del Río Rocha, los resultados obtenidos fueron comparados con regulaciones medioambientales de agua para consumo humano, y agua para riego. Estas regulaciones son de la OMS, EPA, FAO y normas bolivianas. El caudal y altura del Río Rocha fue medido en las estaciones determinadas, y fueron modeladas en el programa Hec-RAS para bosquejar conclusiones acerca de cómo las variaciones físicas de algunos parámetros afectan la distribución de contaminación en el Río Rocha.
En este estudio la calidad de las aguas del Río Rocha fue clasificada como “Muy contaminado” y “Altamente contaminado”, según a los análisis realizados con el índice de contaminación ICO. Estos resultados están en línea con estudios previos, la deterioración de las aguas fue continua desde el año 1998, y actualmente abarca las afueras del valle central desde Sacaba hasta Sipe Sipe. De los resultados obtenidos, el parámetro de contaminación más crítico fueron los valores bajos de Oxígeno Disuelto y valores elevados de coliformes, los cuales ocurren a lo largo del río aguas debajo de Chiñata. Los resultados obtenidos de alta contaminación están directamente correlacionados con áreas donde la densidad poblacional es mayor. En estas áreas la actividad industrial es alta y las conexiones de alcantarillado son pobres o inexistentes. Un factor principal que contribuye a la contaminación del río son los grandes volúmenes de agua residual no tratada que son vertidos directamente al Río Rocha a lo lardo de todo su curso, y lo cual repercute en la posibilidad de restauración natural del río.
Basados en la Ley de Medioambiente de Bolivia No 1333, y en los análisis de los parámetros estudiados, el agua en el río fue clasificada como “D” en cinco de las seis estaciones estudiadas. Esta categorización restringe altamente el uso de las aguas para evitar daños a las salud y medioambiente. Sin embargo, la escasez de agua en el área de estudio obliga a agricultores a usar las aguas del Río Rocha, lo cual contribuye a la degradación de los suelos, a la contaminación de aguas subterráneas e induce grandes riesgos a la salud humana.
Palabras claves: Cochabamba, río Rocha, análisis de la calidad del agua, contaminación del agua, aguas residuales, regulaciones, índice de contaminación de orgánica, Hec-RAS

Table of contents
1. Introduction ................................................................................................................................. 1
1.1 Bolivia .................................................................................................................................... 1
1.2 Cochabamba and the Rocha River ......................................................................................... 1
1.3 Aim of the study ..................................................................................................................... 3
1.3.1 Specific methods ............................................................................................................................................ 3
2. Description of the Rocha River area ........................................................................................... 4
2.1 Geology, hydrology and climate ............................................................................................ 4
2.2 Rocha River ............................................................................................................................ 6
2.3 Cochabamba - water situation ................................................................................................ 8
2.3.1 History of the urban water and Rocha River .................................................................................................. 8
2.3.2 Distribution of potable water ........................................................................................................................ 10
2.3.3 Wastewater in the Department of Cochabamba ........................................................................................... 10
2.3.4 Wastewater treatment ................................................................................................................................... 12
3. Theory and literature studies ..................................................................................................... 14
3.1 River characteristics and restoration techniques .................................................................. 14
3.2 Water quality ........................................................................................................................ 16
3.2.1 Measurement of water quality variables ....................................................................................................... 17
3.3 Health aspects of polluted surface water .............................................................................. 19
3.4 Legislation and guidelines .................................................................................................... 20
3.4.1 Organic pollution index ICO ........................................................................................................................ 21
3.5 Preparatory work for sampling ............................................................................................. 22
3.5.1 Sampling locations ....................................................................................................................................... 23
3.5.2 Time and frequency of sampling .................................................................................................................. 23
3.5.3 Quality-control programs ............................................................................................................................. 24
3.5.4 Potential consequences with sample-collection devices ............................................................................... 25
3.5.5 The materials of the containers..................................................................................................................... 25
3.5.6 Sample stabilisation ...................................................................................................................................... 26
3.5.7 Hydraulic methods for measurements of a river........................................................................................... 26
3.5.8 Measuring stream flow ................................................................................................................................. 26
3.5.9 Estimation of river discharge........................................................................................................................ 27
3.6 Water quality modelling and flow analysis .......................................................................... 28
4. Methods and field work ............................................................................................................ 30
4.1 Physico-chemical water sampling ........................................................................................ 30
4.1.1 Site specifics ................................................................................................................................................. 30

1
4.1.3 Physical parameters and methods ................................................................................................................. 32
5. Results and Discussion .............................................................................................................. 34
5.1 Chemical parameters and water quality classification ......................................................... 34
5.2 ICO-index ............................................................................................................................. 39
5.3 Hec-RAS .............................................................................................................................. 41
5.3.1 Flow analysis ................................................................................................................................................ 41
5.3.2 Chemical analysis ......................................................................................................................................... 44
5.4 Social and environmental influences.................................................................................... 45
5.4.1 Visible pollution ........................................................................................................................................... 45
5.4.2 Agricultural aspects ...................................................................................................................................... 46
5.4.3 River characteristics ..................................................................................................................................... 48
5.4.4 Health aspect ................................................................................................................................................ 48
5.5 The variation of water quality along Rocha River ............................................................... 49
6. Conclusions ............................................................................................................................... 52
7. Recommendations ..................................................................................................................... 53
8. References ................................................................................................................................. 54
Appendix 1: Coordinates .............................................................................................................. 57
Appendix 2: Classification A-D.................................................................................................... 58
Appendix 3: Methods and results ................................................................................................. 59
Appendix 4: Contraloría del Estado (2017) .................................................................................. 62
Appendix 5: Documentation of Rocha River................................................................................ 64

1
1. Introduction The rapid population growth, economic development and urbanization, mainly in low income
developing countries are increasingly challenging the reach of UN Sustainable Development
Goal number six (SDG 6); to ensure clean and accessible water and sanitation for all (UN-Water,
n.d.). Due to the increased demand for water, the volume of generated wastewater increases
globally, and so does the quantity of pollution contaminating available water resources. To
prevent devastating effects on the environment as well as on health and well-being for large parts
of the global population, new approaches to water and wastewater management must be applied
where water is managed properly all the way through its cycle.
1.1 Bolivia
The Plurinational State of Bolivia is a highland country with major natural assets in the form of
natural gas, oil and minerals (Arnade and McFarren, n.d). Due to several historical events,
Bolivia suffers from uneven social and economic development within the country and is one of
the poorest countries in South America (Utrikespolitiska institutet, 2018). During the last
decades Bolivia has under the SDG 6 improved the access to drinking-water and ratified
sanitation as a fundamental human right. According to a UN-water global analysis in 2013/14,
one of the main obstacles to achieve this goal in Bolivia is related to the improvement and
expansion of sewerage systems and treatment of wastewater, which today, is discharged into
water bodies with little or no treatment. An additional issue is the lack of promotion of proper
management of solid waste and wastewater in rural areas (WHO, 2015).
1.2 Cochabamba and the Rocha River
The field study was performed in the Central Valley of Cochabamba and by its main stream,
Rocha River, that flows through the city and drains the water of the valley located in the Andes
mountain range (figure 1.1). In the Department of Cochabamba the current population is
approximately 1,900,000 inhabitants of which 69% lives in urban areas and 31% in rural areas
(INE, 2016).
Due to its relatively mild and dry climate Cochabamba is called “the city of eternal spring” and
because of its long history of agriculture and fertile soil it has also been named “the breadbasket
of Bolivia”. However, due to a moderate precipitation and high evapotranspiration rates the area
suffers from water shortage. Groundwater has since the colonial times been the most important
water resource in the Cochabamba valley but it is becoming increasingly limited due to an
unsustainable exploitation and can no longer satisfy the demand. During the dry season there is
no natural flow in parts of the Rocha River, and the small amounts of existing standing water

2
originates from the wastewater that is discharged into the river along its course (Renner &
Velasco, 2000).
Figure 1.1 The valley of Cochabamba.
Similar to many cities in Bolivia, Cochabamba has many inhabitants coming from surrounding
rural regions which settle in dense communities with little control over the housing
developments. These settlements are seldom included in the water and wastewater pipe system of
the city. An estimation given is that the population of Cochabamba will rapidly increase and
reach approximately 2,200,000 inhabitants by the year of 2025 (ADA, 2017), leading to a further
increased demand for water, mainly for domestic use and irrigation. In turn, this will also result
in an added volume of discharged wastewater polluting the Rocha River.
Previous studies have shown that the river is highly polluted (Contraloría General del Estado,
2017), but there is also a high commitment and interest from people and organizations working
for solutions to improve the situation.

3
1.3 Aim of the study
To mitigate and avert the pollution of the Rocha River more empirical data of actual condition is
needed. Therefore, in order to facilitate decisions on future measures, the overall aim of the study
is to examine the current state of the water quality in the Rocha River at different sections in the
Cochabamba valley. An additional aim is to determine social and environmental contributing
factors for the water quality of the Rocha River. An expectation is also that the study will
improve the understanding of how, and to what extent, the quality of the water from the river is
affecting the surrounding population and its environment.
1.3.1 Specific methods
The overall goal will be to target the aim with the following specific methods:
- Determination of the physico-chemical characteristics of the Rocha River water: Along
the river, sampling locations will be determined where the physico-chemical water
sampling will occur. The parameters that will be measured and analysed are pH,
temperature (T), electrical conductivity (EC), dissolved oxygen (DO), 5-day biochemical
oxygen demand (BOD5), chemical oxygen demand (COD), nitrates (NO3-) and fecal
coliforms (CF). The collected water samples will be analysed in the laboratory Centro de
Aguas y Saneamiento Ambiental (C.A.S.A.) at Universidad Mayor de San Simón
(UMSS).
- Evaluation and classification of the water quality: The physico-chemical results from the
sampling will be added into the flow analysis and water quality model Hec-RAS. The
purpose of the model is to receive an overview of how the flow and water quality varies
with time and distance. The chemical results will also be assessed according to various
international and national water quality regulations.
- Assessment on the aspects of social and environmental influences: Research on how and
to what extent, the quality of the water from the river is affecting the surrounding
population and the environment. Maps, satellite images and published articles will be
studied. On site, scrutinization of the natural and anthropogenic effects of the
contamination will be documented continuously during the field work.

4
2. Description of the Rocha River area
2.1 Geology, hydrology and climate
The valley of Cochabamba is a tectonic depression in the eastern part of the Bolivian Andes
(figure 2.1). The altitude is approximately 2500 m.a.s.l. and the valley is surrounded by
mountains that in the northern part exceed elevations of 5000 m.a.s.l (Renner & Velasco, 2000).
Figure 2.1 The location of Rocha River basin and the valley of Cochabamba.
The surrounding mountains have with time eroded and the rivers that flow towards the valley
have transported and deposited the eroded material as sediments. In areas next to the slopes,
mainly in the northern and western areas, fluvial fans are formed of coarse grained sediments and
towards the center of the valley the sediment is of finer grains. The lower part of the valley is
mainly composed of lake deposits, primarily clays and muds, as the valley for periods of time
was occupied by a lake (Renner & Velasco, 2000).
The quality and constituents of the groundwater vary in the different parts of the valley and is
correlated with the different types of sediments, this is shown in a project performed in 1993-
1995 (Renner & Velasco, 2000). One example is that the electric conductivities and ionic loads
were significantly higher in the south-west areas compared to the northern areas. This can be

5
attributed to i) the sediments in the south-west areas being developed from carbonated rocks and
dolomites, red clays and mudstone (which are more easily dissolvable compared to the more
coarse grained sediments of the northern parts), ii) the flow velocity is higher and iii) the
younger groundwater in the northern areas since it is a zone of recharge with high permeability
(Renner & Velasco, 2000).
Natural recharge of the aquifers occurs mainly through rainwater in the mountain range that
flows through rivers into the fluvial fans that act as recharge zones where the water infiltrates
and then flows towards the low areas of the valley, where the Rocha River is situated. During the
rainy season the Rocha River can recharge the aquifers whereas the river can gain water from the
aquifer during the dry season (Renner & Velasco, 2000).
The climate in the Cochabamba valley is tropical and semi-arid with no drastic temperature
changes during the year. The rainy season is mainly December to March and the driest months
are May to July. The average annual precipitation in the valley is moderate, 400-500 mm and the
average annual temperature is 17.5 °C, with a monthly average minimum of 5 °C and maximum
of 22 °C (World Weather Online, 2019). This climate results in a relatively high
evapotranspiration and water shortages in the area are common.
Regarding climate change and variability, a high inter-annual rainfall variability has been
observed and the mean precipitation has decreased in this region of the Andes. The average
temperature increase in South America from 1920 to 2006 is 0.7 °C which has led to concerns
regarding melting glaciers and snow in the mountains which would further increase the reduction
in water supplies. A future scenario of the changing climate is that the Andes will become
warmer and drier where locations at higher altitude are more affected (Gonzales Amaya, et al.,
2018).

6
2.2 Rocha River
The Rocha River Basin is located in the Department of Cochabamba and begins in the Tiraque
mountain range where the Rocha River originates from the Maylanco River. The basin ends in
the municipality of Capinota where Rocha River joins the Arque River forming the Caine River.
Further downstream the Caine River turns into the Río Grande that eventually flows into the
Amazon River (see figure 2.2) (Medrano & Derpic, 2006).
Figure 2.2 Satellite image of Bolivia and the course of Rocha River (Pictures from Google Earth Pro 2018 and
Microsoft World Atlas 2018).
The main channel of the Rocha River has a total extension of 81.2 km and in 2012,
approximately 1,320,000 people were living around the river (Gobierno Autónomo
Departamental de Cochabamba et al., 2014). The river directly involves the municipalities of
Sacaba, Cercado, Colcapirhua, Quillacollo, Vinto and Sipe Sipe (see figure 2.3). Sacaba is the
municipality with the highest growth rate, although it still has large rural areas. The most densely
populated urban areas are Cercado and Colcapirhua, whereas Quillacollo is more of a suburban
area with many industries. Vinto and Sipe Sipe are predominantly rural areas with agricultural
lands (MMAyA, 2014).

7
Figure 2.3 Satellite image of the Cochabamba valley, Rocha River and the involved municipalities (Picture from
Google Earth Pro 2018).
The main utilization of the Rocha River is for agricultural purpose, both for its irrigation water as
for the fertile sediments left by the periods of overflows (Gobierno Autónomo Departamental de
Cochabamba, et al., 2014).
A change in the rainfall regime together with increased demand for water, due to the rapid
population growth, has strongly influenced the state of the water in the basin. The amount of
water stored in the subsoil has decreased and the underground runoff of the Rocha River basin
has almost disappeared (Gobierno Autónomo Departamental de Cochabamba, et al., 2014). The
deficiency of groundwater sources has increased the usage of the river water for agricultural
purposes, especially during the dry months (Contraloría General del Estado, 2017). Furthermore,
the increased demands for water to the population leads to an increased volume of wastewater,
which reaches the Rocha River without treatment. A result of this is that during the dry months
when the flow of the river is strongly reduced, the remaining flow is merely all wastewater.
During the rainy period, the rainfalls and floods with their large amount of water and fast flows
clean the accumulated pollution in the river bed as well as the waste and transport it to the lower
areas of the basin where it is deposited. The Rocha River can then to some level regain its quality
although it no longer manages to fully recover its characteristics (Contraloría General del Estado,
2017).

8
2.3 Cochabamba - water situation
2.3.1 History of the urban water and Rocha River
Cochabamba has a history of water struggles and the most substantial is the event known as the
Water War. During the late 20th century there was an expanding division between the wealthier
and modern northern areas and the poor southern areas with large demographic growth inhabited
mostly by farmers and migrants from rural areas and highland mines (Bustamante & Médieu,
2012). In the year of 2000 the water supplies and sewage services became privatised, leading to
increasingly expensive water tariffs. This resulted in the outbreak of severe social conflicts
which eventually lead to the cancellation of the privatisation agreement (Global Water
Partnership, 2017).
This event clearly illustrates the vital importance of social and community participation when it
comes to development and policies related to water resources management. Today the water of
Cochabamba is run and controlled by a cooperation between government representatives, social
organisations, the private sector, academic institutions and the municipality (MMAyA, 2014).
However, there still exists undeniable problems regarding the policy and management, and
solutions for equal accessibility to clean water has not yet been found.
Previous studies on Rocha River
With the continuously increasing population in the Cochabamba valley the quality of the water in
Rocha River has deteriorated. Since the late 20th century studies have been performed on the
river to evaluate the extent of the contamination. In 2011 the report No. K2 / AP06 / M11 was
issued which revealed that the quality of the water along the Rocha River channel goes from
“polluted” to “very polluted” (see organic pollution index (ICO) in subchapter 3.5.1 and table
2.1) and that it is unsuitable for irrigation. The report provides 44 recommendations to the
municipal and autonomous governments in the framework of the Bolivian Environmental Law
No.1333 to work as a strategic guideline for the recovery and restoration of the river (Gobierno
Autónomo Departamental de Cochabamba, et al., 2014). At the time the only existing
wastewater treatment plant (WWTP) in the seven municipalities was the Alba Rancho WWTP in
the municipality of Cercado operated by the public company SEMAPA. After the report No. K2
/ AP06 / M11 plans were developed to implement 11 new WWTP´s around the seven
municipalities. However, up to year 2014 only one additional treatment plant, El Abra in Sacaba,
was in construction (Gobierno Autónomo Departamental de Cochabamba, et al., 2014).
A follow-up on the recommendations was presented in Contraloría General del Estado (2017),
which also presents a summary of the variation of the contamination in Rocha River between the
years 1998, 2011 and 2017, which for the organic pollution is illustrated in table 2.1.

9
Table 2.1. The organic pollution in Rocha River, classified according to ICO-index (subchapter 3.4.1), for different
municipalities for the years 1998, 2011 and 2017 (Contraloría General del Estado, 2017).
Municipality Year 1998
Upstream Downstream
Year 2011
Upstream Downstream
Year 2017
Sacaba Weakly polluted Moderately polluted Not polluted Highly polluted Highly polluted
Cercado Polluted -
Very polluted
Highly polluted Polluted -
Very polluted
Polluted -
Very polluted
Highly polluted
Colcapirhua Highly polluted Highly polluted Very polluted Highly polluted Highly polluted
Quillacollo Highly polluted Highly polluted Highly polluted Highly polluted Highly polluted
Vinto Highly polluted Very polluted Highly polluted Highly polluted Highly polluted
Sipe Sipe Very polluted -
Polluted
Moderately polluted Very polluted -
Highly polluted
Polluted -
Moderately
polluted
Highly polluted
From measurements taken at 20 points along the course of the river, from Sacaba to Sipe Sipe, it
could be concluded that the water quality has deteriorated in all parts of the river. In 2017 all
sections of the river where classified as the highest level of organic pollution (see ICO-index in
subchapter 3.4.1) whereas in 2011 and 1998 there were still some parts that could be classified as
“not polluted” or “weakly polluted” in the outskirts of Sacaba and Sipe Sipe.
The organic load in 2017 was measured to approximately 4 tons/day as BOD5 and more than 13
ton/day as COD. The amount of total dissolved solids (TDS) was estimated to between 1 and 7
tons/day and the total suspended solids (TSS) could fluctuate between 1 and 15 tons/day. The
TDS and TSS are deposited in the clay of the riverbeds mostly in the lowlands (Contraloría
General del Estado, 2017). The exact data from the measurements taken from the 20 points along
the Rocha River in 2017 is presented in Appendix 4.1 and a map with the 20 points in figure 5.1.
The reason that the water quality has worsened, despite the efforts made according to the
recommendations from 2011, is supposedly the increasing volumes of discharge as a result from
the population increase and industrial development. The extent and synergetic effect of pollution
that the river receives has cancelled the ability to naturally decompose the organic material along
its course, and thus pollution is continuously kept at the critical level (Contraloría General del
Estado, 2017).

10
2.3.2 Distribution of potable water
In the Department of Cochabamba only 54% of the households have access to tap water in their
homes and only 27% have services with safe drinking water. This percentage corresponds mainly
to the municipality of Cercado where the operator SEMAPA has surface water purification
plants and chlorination for groundwater. This means that 73% of the population consumes water
with an average or high health risk (MMAyA, 2014). Some parts of the population use private
pumps for drinking water, where, the groundwater might be recharged with polluted river water.
Values from 2012 (MMAyA, 2014) determines that there is a water deficit of 1361 L/s in the
department and this together with the low coverage of the drinking water-network has led to an
immense increase of inhabitants purchasing their potable water from water trucks providing
untreated water and by providers of bottled water (ADA, 2017).
2.3.3 Wastewater in the Department of Cochabamba
Along the banks of the Rocha River, solid waste is visible throughout its course. The private
activity, including large volumes of construction material being dumped into the river at near
sight, counts as the solid waste that has the highest pollution contributing factor to Rocha River.
This is a result from not having an official dumping site at the municipalities in the department
of Cochabamba (Gobierno Autónomo Departamental de Cochabamba, et al., 2014).
The municipalities of the Cochabamba department (shown in figure 2.3) have different quality of
wastewater that is directly discharged to the Rocha River and contributing to deterioration of the
water quality. Most of the direct discharges into the Maylanco-Rocha River are domestic
wastewater without any type of treatment (UMSS, 2018). The municipalities’ direct impact is
presented below, from upstream to downstream.
Chiñata
In the eastern outskirts of the Sacaba department is an area named Chiñata, where the population
is low and no industries are located. Untreated wastewater discharge pipes to the Maylanco-
Rocha River have been located in this area according to recent studies (UMSS, 2018).
Sacaba
Sacaba is the large industrial and slaughter area of Cochabamba with pulp industry, dairy
industry, a Pepsi factory, among others (Contraloría General del Estado, 2017). From some
slaughter areas wastewater channels have been located with untreated water and direct discharge
to the Rocha River (UMSS, 2018). It is believed that some industries discharge wastewater at
night to reduce the risk for fines due to heavily polluted wastewaters. An example of this is a
pig-farm located in Sacaba (Appendix 1, ID 18) which had humid pipes with no discharge during
the day, and the inspection from 2018 drew the conclusion that the discharge was performed
during nighttime (UMSS, 2018).

11
According to the Contraloría General del Estado report (2017), El Abra WWTP in Sacaba does
not work to its fullest capacity. A more recent study from 2018 indicated that the WWTP El
Abra and WWTP San Pedro Magister have direct discharge to the Rocha River but does not
mention to what capacity. The location of the wastewater discharge pipes can be found in
Appendix 1 (UMSS, 2018).
Cercado
Cercado, the inner city of Cochabamba, is where the population is the highest and where direct
discharges to the river are from activities such as car washes and dry laundry facilities as well as
leather industries. Also, high concentration of solid waste is being thrown along the river. During
recent years the number of large leather industries have decreased by moving to Santa Cruz,
while artisanal leather industries with lacking local treatment are increasing (Contraloría General
del Estado, 2017).
In the downtown area of Cercado, where the tributary Tamborada River flows, two industries are
located; the local slaughterhouse and the Venezuela-tannery. As the sewer treatment system is
poor in the south part of the city, the discharge from these industries is a source of direct
pollution to the Tamborada River, which, joins the Rocha River just before the Alba Rancho
WWTP. Also, domestic waste from households in this area is not connected to a sewage system,
and may hence be, directly discharged to the Tamborada River (Contraloría General del Estado,
2017).
Colcapirhua
In this area the main direct discharge to the Rocha River is from the local textile industry, which
has a local treatment system that does not work effectively (Contraloría General del Estado,
2017).
Quillacollo
Quillacollo is an area where several tributing rivers from the surrounding mountains connect
with Rocha River. The water from the tributary rivers contain outflows from tanneries and
domestic wastewater in the area. Furthermore, untreated wastewater from Cercado that is
discharged to the Valverde channel is discharged to the Rocha River in this area (Contraloría
General del Estado, 2017).
Vinto
Direct untreated wastewater discharge to Rocha River in this area come from pig farms that are
located along the river. The untreated waste that is discharged contains solids as well as remains
of animals and raw domestic waste (Contraloría General del Estado, 2017).

12
Sipe Sipe
Sipe Sipe is a slaughterhouse area. Several pig farms, as well as chicken farms, are located here
and the wastewater from farms and domestic wastewater is discharged to Rocha River without
treatment (Contraloría General del Estado, 2017).
2.3.4 Wastewater treatment
Regarding the sewage systems in the department, 70% of the homes have some form of disposal
system, 86% in the urban areas and 41% in the rural areas. The existing sewerage system collects
approximately 65 % of the wastewater generated by the population and some small industries in
the urban areas. In rural areas the collection is virtually non-existent. The wastewater from
Cochabamba city arrives at the Alba Rancho WWTP via two main sewers. Both sewers arrive at
a pumping station called Valverde, from where some of the wastewater is pumped to Alba
Rancho WWTP located in Cercado (Zabalaga et al., 2007). The rest of the wastewaters, waters
coming from the north-west part of the city, is summoned to the Valverde pumping station that
forwards it without treatment to the channel Valverde that is discharged into the Rocha River
(Contraloría General del Estado, 2017).
Alba Rancho WWTP
The Alba Rancho plant has the capacity to treat only 50% of incoming water (Zabalaga et al.,
2007). Overall, approximately 19% of the total wastewater in the department of Cochabamba is
treated (MMAyA, 2014), whereas the remaining 81% is discharged directly without any
treatment into the water courses of the region, Rocha River being the recipient to all of them
(Contraloría General del Estado, 2017). The Alba Rancho uses primary and secondary facultative
ponds operated by the water company SEMAPA. The effluent is of low quality and according to
Zabalaga et al. (2007) the effluent does not meet the requirements of the Bolivian environmental
law No.1333 regarding the BOD5, COD, TDS and fecal coliforms.
Further improvement of the effluent quality from Alba Rancho has not been published, the
effluent quality does not comply with standards proposed by world health organisation (WHO,
1989) for effluent reuse with regards to fecal coliform values (Zabalaga et al., 2007). Yet, the
treated effluent of Alba Rancho WWTP is considered an important water resource for the
agricultural irrigation of the La Mayca area (south western part of the municipality of Cercado
and south of Colcapirhua, figure 2.3), that is surrounding the Alba Rancho WWTP (Zabalaga et
al., 2007).
As mentioned, the city suffers from water shortages and consequently the population has to
reduce water consumption, which in turn leads to more concentrated wastewater. Furthermore,
the water operator SEMAPA regularly decreases the hours of water distribution during the
summer when the reservoirs in the mountains are reaching a critically low level.

13
2.3.5 Agriculture
Currently, the department with the most developed irrigation system in Bolivia is Cochabamba,
with a total irrigation area of 32% of the department (MMAyA, 2012). The low rainfall and low
surface water flows along with industrial pollution and low wastewater treatment, the irrigation
water available for the farmers is thus of low quality (Huibers et al., 2004). Most of the basins in
the central valley region of Cochabamba presents soil erosion and occasionally, during periods of
intense rainfall, short duration floods can occur in the rural areas (Reyna-Bowen et al., 2017).
In the Cochabamba valley soil degradation has forced farmers to replace vegetable crops with
more salt-tolerant fodder crops, such as maize and alfalfa. Vegetables are also grown in the area
but mostly used for private consumption (Huibers et. al, 2004). The electrical conductivity of the
irrigation water for alfalfa is 1300 - 10 000 µS/cm. The maximum salt tolerance for a 100% yield
potential is 1300 µS/cm and with higher electrical conductivity value the yield decreases. At 10
000 µS/cm the alfalfa ceases to growth. For maize the corresponding values are 1100 - 6700
µS/cm (Ayers & Wescot, 1994).
The farmers from the area, La Mayca, have made an agreement with SEMAPA about irrigation
with effluent from the facultative stabilisation pond at the Alba Rancho. This agreement was
made because the farmers from La Mayca were cut off from the supply source Angostura Dam
and partly also from the Rocha River when the airport was built in the 1980s (Huibers et. al,
2004). This has resulted in that crops are irrigated with polluted waters, which is either diluted or
partly treated at the Alba Rancho WWTP. The fodder crops are used for grazing of cows and
eventually milk production. Thus, the farmers irrigate with waters containing high concentrations
of pathogens, salts and heavy metals (Huibers et al., 2004).
In other areas of the Cochabamba department, cultivators deny using wastewater for irrigation
claiming they use groundwater from the wells nearby as their water source. However, many
wells are probably also polluted, especially the shallow ones, and do not yield enough water for
the irrigated area (Huibers et al., 2004).
In areas such as Tiquipaya, which is located north of Quillacollo, more intensive agriculture
production occurs involving dairy farming and vegetables. The crops are during dry season
irrigated with water from a series of small reservoirs which collects runoff from the mountains in
the catchment (Bustamante et al., 2004).
Very few studies show which irrigation technique farmers in Cochabamba use but one study
states that farmers in this area introduced the use of chemical fertilizers and pesticides for potato
cropping in the 1970s (Lagos, 1994).
14
3. Theory and literature studies
3.1 River characteristics and restoration techniques
The impact of the physical, chemical and biological processes in a river is affected by the whole
stream corridor which includes the land, plants, animals and network of streams within. The
corridor provides several functions in action such as stream flow, storing water, removing
harmful materials from the water and provides habitats for aquatic and terrestrial plants and
organisms. Changes within the surrounding ecosystem will impact the mentioned above. Stream
system functions within natural ranges of flow, sediment movement, temperature, and other
variables in the dynamic equilibrium. The dynamic equilibrium is lost when changes in the
mentioned variables occur beyond the natural ranges. This results in adjustments in the
ecosystem that might conflict with social needs. Increase in population and industrial activities
place heavy demands on the streams which can cause degradation of water quality, decreased
water storage, loss of habitat for fish and wildlife, and decreased recreational and aesthetic
values. For restoration in a stream to occur the dynamic equilibrium must be recovered and
function at a self-sustaining level (FISRWG, 1998). Parameters and river characteristics that
enhance or disturb the dynamic equilibrium as well as some restoration techniques are described
below.
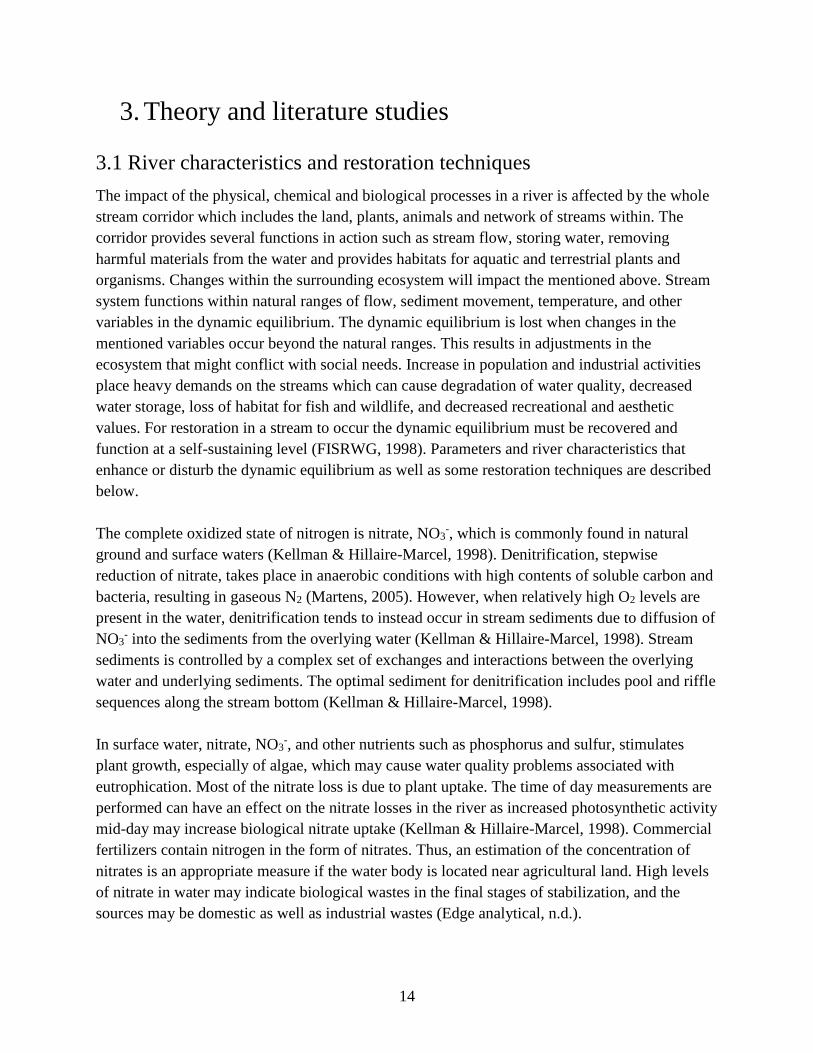
The complete oxidized state of nitrogen is nitrate, NO3-, which is commonly found in natural
ground and surface waters (Kellman & Hillaire-Marcel, 1998). Denitrification, stepwise
reduction of nitrate, takes place in anaerobic conditions with high contents of soluble carbon and
bacteria, resulting in gaseous N2 (Martens, 2005). However, when relatively high O2 levels are
present in the water, denitrification tends to instead occur in stream sediments due to diffusion of
NO3- into the sediments from the overlying water (Kellman & Hillaire-Marcel, 1998). Stream
sediments is controlled by a complex set of exchanges and interactions between the overlying
water and underlying sediments. The optimal sediment for denitrification includes pool and riffle
sequences along the stream bottom (Kellman & Hillaire-Marcel, 1998).
In surface water, nitrate, NO3-, and other nutrients such as phosphorus and sulfur, stimulates
plant growth, especially of algae, which may cause water quality problems associated with
eutrophication. Most of the nitrate loss is due to plant uptake. The time of day measurements are
performed can have an effect on the nitrate losses in the river as increased photosynthetic activity
mid-day may increase biological nitrate uptake (Kellman & Hillaire-Marcel, 1998). Commercial
fertilizers contain nitrogen in the form of nitrates. Thus, an estimation of the concentration of
nitrates is an appropriate measure if the water body is located near agricultural land. High levels
of nitrate in water may indicate biological wastes in the final stages of stabilization, and the
sources may be domestic as well as industrial wastes (Edge analytical, n.d.).

15
Changes in pH do not only affect the organisms and habitats in water bodies but is also a good
environmental indicator. Chemical reactions cause changes in pH, for example, when ammonia
(NH3) reacts with water and forms ammonium (NH4+) and hydroxyl ion (OH-) which means that
the pH of the water increases. An increase of hydroxyl ions in the water body, pushes the
ammonia equilibrium to the left and more ammonia is formed, which is the toxic form (Oram,
n.d). Thus, the pH of water determines the solubility and biological availability of chemical
constituents such as nutrients; phosphorus, nitrogen and carbon, as well as heavy metals. For
example, in addition to affecting how much and what form of phosphorus is most abundant in
the water, pH also determines whether aquatic life can use it. In the case of heavy metals, the
degree to which they are soluble determines their toxicity. Metals tend to be more toxic at lower
pH because they are then more soluble (Perlman, 2018). In waters with high amount of aquatic
vegetation, uptake of the carbon dioxide by plants during photosynthesis removes carbonic acid
from the water, which can increase pH by several units. Restoration techniques that decrease
plant growth in rivers and stabilize the variable pH due to photosynthesis is through increased
shading or reduction of nutrient loads as well as increase in reaeration (FISRWG, 1998).
In general, oxygen transfer in natural waters depend on the following; i) internal mixing and
turbulence due to velocity gradients and fluctuation, ii) temperature, iii) wind mixing, iv)
waterfalls, dams, and rapids, v) surface films and vi) water column depth (FISRWG, 1998).
However, external loads of oxygen demanding wastes or abundant plant growth caused by large
nutrient load followed by decomposition of vegetative material can lower the oxygen
concentration significantly. Dissolved oxygen measurements provides a good indication of water
quality sincr changes in the oxygen concentrations can be an early indication of changing
conditions in the water body (Bartram and Ballance, 1996). If the oxygen level drops too low,
fish will suffocate and the aqueous environment will be quite favorable for harmful bacteria
(Moretto and Kalcher, 2015). A low level of dissolved oxygen can also cause the formation of
hydrogen sulfide (which gives off a bad smell) by reactions in anoxic state. This can change the
types of aquatic organisms present in such conditions and can even cause the local extinction of
species (UMSS, 2018). Aquatic organisms such as fish can recover from short periods of low
dissolved oxygen concentration. However, if water has dissolved oxygen concentrations of 2
mg/L or less during a longer period of time it can result in “dead” water bodies. Example of
stream restoration techniques regarding the dissolved oxygen concentration is by the installation
of artificial level differences to increase reaeration as it is the primary way for introducing
oxygen into most waters (FISRWG, 1998).
Organic load may arise from a variety of land use practices and natural events such as; storm
events, erosion, and wash off. Large-scale animal operations and improper manure application,
can result in significant BOD load to the near water bodies. As mentioned, urban runoff is often
loaded with high concentrations of organic materials from variety of different anthropogenic

16
sources (FISRWG, 1998). Severe organic pollution may lead to rapid de-oxygenation of river
water, with the consequences mentioned above (EEA, 2018).
Straight rivers are a result of artificial construction for social needs. A meandering stream
consists of a series of turns and has a relatively low gradient. The positive effect of meandering
rivers is the reduced flow rate and the reduced flood risk due to the increased water storage.
Thus, the meandering form has a positive impact on sedimentation of particles and nutrients as
well as a positive effect on biodiversity (Naturvårdsverket, 2008).
The connection between groundwater and river channel are in general the strongest with gravel
river beds in well-developed alluvial floodplains. Coarse sediment particles are found in riffle
areas while small particles occur in pools (FISRWG, 1998).
3.2 Water quality
Irregular sources of pollution results in water quality variations and may be apparent over a
matter of days or months (Bartram and Ballance, 1996). Variables that give the bare minimum of
information on the water quality is a combination of temperature, electrical conductivity (EC),
pH, dissolved oxygen (DO) and total suspended solids (TSS). In several monitoring programs a
known, or suspected, water pollution condition is the reason for deciding to analyze for specific
water quality variables (Hunt and Wilson, 1986).
If organic wastes are known to be discharged into the river from domestic sewage then the
variables that should be measured are biochemical oxygen demand (BOD), chemical oxygen
demand (COD), total organic carbon (TOC), dissolved organic nitrogen, total phosphorus and
fecal coliforms (Hunt and Wilson, 1986).
The variables that should be measured if the water of interest is located in, or passing through,
agricultural land are; nitrate, nitrite, ammonia, total phosphorus (filtered and unfiltered), reactive
silica, transparency and chlorophyll a. These variables are mainly of interest after the usage of
fertilizers as well as pesticides and herbicides (Hunt and Wilson, 1986).
Industrial effluents may contain toxic chemicals, organic or inorganic or both, depending on the
industrial process. Some knowledge of industrial processes is, therefore, necessary before a
rational decision can be made on the variables for which analyses should be made. Examples of
the water quality variables that should be measured in industrial waters are total solids, BOD,
COD, benzene, cyanide, arsenic and different metals.

17
3.2.1 Measurement of water quality variables
Below are the chosen water quality variables in polluted rivers defined and described. The
presented measuring procedure is according to WHO (1989).
Temperature
Temperature is measured in situ because a water sample will gradually reach the same
temperature as the surrounding air. The common technique to measure the temperature is with a
glass thermometer (Bartram and Ballance, 1996). An increased freshwater temperature will
affect the chemical reactions and kinetics, which leads to a deterioration of the water quality and
ecological status (Whitehead et al., 2009).
pH
Determination of the pH of water should, if possible, be made in situ. If this is not possible, the
measurement should be made immediately after the sample has been obtained with an
electrochemical analysis (Bartram and Ballance, 1996). This is performed with an
electrochemical cell for pH measurements consisting of an indicating electrode, whose potential
is proportional to pH, and a reference electrode, whose potential is independent of pH. The
potential can be measured between the indicating electrode and the reference electrode, which
depends on the pH of the sample and the temperature of the sample, as pH is temperature
dependent (Bier, 2018). When the temperature increases the autoprotolysis of water increases,
which means that the pH decreases as there will be a higher concentration of hydrogen ions in
the water body.
Electrical Conductivity, EC
The ability of water to conduct an electric current is known as conductivity and depends on the
concentration of ions in a solution. The measurement should be made in situ with a measurement
meter, or immediately after a water sample has been obtained, due to the possibility that
conductivity may change with storage time. The electrical conductivity is measured with an
electrochemical probe, where the cations in the sample migrate to the negative electrode, the
anions to the positive electrode and the solution acts as an electrical conductor (Bier, 2018).
Conductivity is also temperature-dependent; it increases with temperature. Measurements will
therefore be the most accurate when made at the same temperature as that at which the cell
constant is determined. (Hunt and Wilson, 1986).
5-day Biochemical Oxygen Demand, BOD5
The biochemical oxygen demand (BOD5) estimates the relative oxygen requirements of effluents
and polluted waters with an empirical test, in which a standardised laboratory procedure is
performed as soon as possible after the sample has been collected, in this case with a five-day
incubation period. The results are used as an approximate measurement of the amount of
biochemically degradable organic matter present in the water sample. The present

18
microorganisms in the sample use the organic matter as a source of carbon (Hunt and Wilson,
1986).
BOD5 is commonly determined by the standardised Winkler dilution method. The sample is
diluted since the sample water, that is known to be polluted, will have a BOD5-value higher than
the amount of oxygen available in the bottle during the incubation period. Otherwise the
biological activity will use up the dissolved oxygen in the bottle before the five days incubation
period. Predicting the effect of pollution on a water body is straightforward with this method.
However, there are also other, possibly influencing, factors excluded in the determination of
BOD5, such as the actual temperature of the water body, water movements, sunlight, oxygen
concentrations, biological populations (including planktonic algae and rooted plants) and the
effects of bottom deposits. Furthermore, the polluting effect of an effluent on a water body may
be considerably altered by the photosynthetic action of plants and algae present, although, it is
impossible to determine this effect quantitatively in 5-day BOD experiments. A further
complication in the BOD5 test is that much of the oxygen consuming capacity of samples may be
due to ammonia and organically bound nitrogen, which will eventually be oxidized to nitrite and
nitrate if nitrifying bacteria are present (Hunt and Wilson, 1986).
BOD is the most commonly used parameter to define the intensity of the wastewater by
measuring waste loadings to treatment plants and evaluating the efficiency of the treatment
system. However, it is of limited values in measuring the actual oxygen demand of surface
waters. The tests are highly questionable for stream oxygen demands since the laboratory
environment cannot reproduce the physical, chemical and biological stream conditions (Hammer
& Hammer, 2014).
Chemical Oxygen Demand, COD
The chemical oxygen demand is commonly used to characterize the organic strength of
wastewater and pollution of natural waters (Hammer & Hammer, 2014). The COD is determined
by measuring the amount of oxygen consumed by organic matter from boiling acid potassium
dichromate solution. This reference method is named the dichromate method. The test will
indicate the amount of oxygen required for complete oxidation of the water sample (Bartram and
Ballance, 1996).
Dissolved oxygen
With the standardised Winkler titration method for determining dissolved oxygen in a water
body the water sample is collected in a glass bottle, preserving manganous sulfate is added to the
sample as well as the strongly basic mixture of sodium azide and potassium iodide. The
concentration is then determined the same day in the laboratory when a precipitate form is
acidified with sulfuric acid. Iodine is then released and titrated with phenylarsine oxide using a
starch indicator (NEMI, n.d.).

19
Nitrates
The determination of nitrate, NO3-, assesses the degree of oxidation. Nitrogen is limited in
unpolluted natural waters and contain only minute amounts of nitrate (Hammer & Hammer,
2014). To determine the concentration of nitrate the Cadmium Reduction Method is commonly
used, where nitrate is reduced to nitrite in a cadmium column and nitrite is then determined with
absorbance of a dye that is added. The absorbance of the dye is proportional to the concentration
of nitrite present. The amount of nitrite, that is reduced from nitrate, is then determined. The
determination should be made on fresh samples to prevent bacterial conversion of the nitrite to
nitrate or ammonia. The determination of nitrate in water is difficult due to interferences and the
level of difficulty increases with polluted water such as wastewater (Edge analytical, n.d.).
Coliforms
The procedure used for determining the concentrations of thermotolerant (fecal) coliforms in the
water samples is with the Membrane Filter Technique; Fecal Coliform Membrane Filter
Procedure. In the laboratory thermotolerant coliforms are grown on media containing lactose, at
a temperature of 44°C. The coliforms are then identified by the production of acid and gas from
the fermentation of lactose.
As the thermotolerant coliforms present in natural water consists of more than 95% of the
intestinal organism Escherichia coli (E.coli), a conclusion can be drawn that the water has fecal
contamination. Thus, it is often unnecessary to perform further testing to confirm the specific
presence of E. coli (Bartram and Ballance, 1996).
3.3 Health aspects of polluted surface water
Algal bloom can have health effects such as rashes, stomach or liver illness, problems with
respiratory system and disorders of the nervous system on humans that drinks, accidentally
swallows or swim in the water (EPA, 2018).
Nitrate is a nutrient that often reaches the surface water from wastewater or agricultural lands
that, if highly concentrated, can cause blue baby syndrome if the water is drunken by infants
(EPA, 2018). From the agriculture the surface water can also be contaminated by pesticides that
can contain biologically active chemicals. These can severely harm humans by various effects
including cancer, diabetes as well as disruption of the endocrine, reproductive and immune
system (Schwarzenbach et al., 2010).
Wastewater containing human excreta with pathogens and intestinal worms poses risks like
diarrhea, cholera, typhoid, hepatitis A and B and dysentery, both if water is drunken, accidentally
ingested through skin contact or swimming. If the water is used untreated for irrigation, the
farmers are in risk for eczema from handling the water and the plants can transmit the pathogens

20
to the consumers (WHO, 2006). Plants can also accumulate heavy metals and are affected with
inhibited growth when they are irrigated by water containing high salinity levels (WHO, 2006).
If wastewater is mixed with fresh water, it is also inevitably polluted by micro pollutants of large
structural variety such as pharmaceuticals and hormones. The adverse effects of these are often
subtle and not acute and therefore difficult to estimate, although they can be chronic
(Schwarzenbach et al., 2010).
3.4 Legislation and guidelines
For drinking water and certain irrigation and freshwater purposes there are general international
guidelines stated by intergovernmental and international organizations such as the World Health
Organisation (WHO) and Food and Agriculture Organization of the United Nations (FAO). For
the regulations of the water quality in freshwater and rivers there are Bolivian legal provisions
that regulates the Law of the Environment No. 1333 with regards to the prevention and control of
water pollution. The regulations and guidelines relevant for this project are seen in table 3.1,
where environmental water represents the quality regulations for freshwater and rivers. Table 3.2
is an extract from the Environmental Law No.1333 representing the maximum values in
receiving water bodies for the parameters; BOD5, COD, DO, Nitrates (NO3-), pH, TDS and
temperature.
Table 3.1. Water quality regulations for drinking water, water for agriculture and environmental water.
Parameter Drinking water Water for agriculture Environmental water
pH 6.5-8.5 (WHO, 2018) 6.5-8.5 (FAO, 1996) 6.9-8.5 (MDSMA1, 1996)
EC 2500 µS/cm (WHO, 2018)
3000 µS/cm (FAO, 1996)
~2300 µS/cm (MDSMA, 1996)
BOD5 0 (WHO, 2018) Crops for human consumption
30 mg/L O2 (EPA, 2012)
80 mg/L O2 (MDSMA, 1996)
COD 0 (WHO, 2018) - 250 mg/L O2 (MDSMA, 1996)
DO 4-8 mg/L (WHO, 2018) >3 mg/L (WHO, u.d.) Warm-water biota
>5 mg/L (WHO, u.d.)
Nitrate NO3-
<45 mg/L (WHO, 2018) 22-133 mg/L (FAO, 1996) 49 mg/L (WHO, 2016)
88 mg/L (MDSMA, 1996)
Coliforms 0 cfu/100 mL
(WHO, 2018)
Unrestricted*: Restricted**:
103-10
5 cfu/100mL 104-10
6 cfu/100mL (WHO, 2018) (WHO, 2018)
Fecal coliforms
1000 cfu/100mL (MDSMA, 1996)
*Use of treated wastewater to grow crops that are normally eaten raw. **Use of treated wastewater to grow crops
that are not eaten raw by human.
1 Ministerio de Desarrollo Sostenible y Medio Ambiente (Bolivian Ministry of Sustainable Development and
Environment) (MDSMA)
21
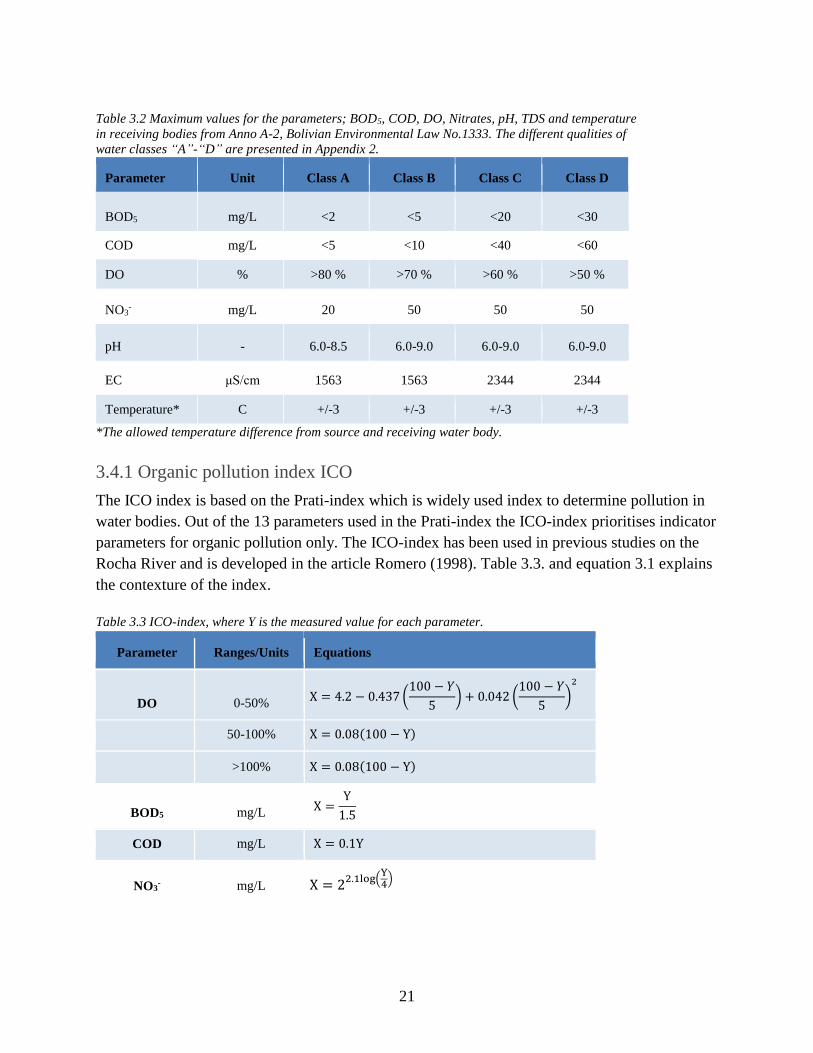
Table 3.2 Maximum values for the parameters; BOD5, COD, DO, Nitrates, pH, TDS and temperature
in receiving bodies from Anno A-2, Bolivian Environmental Law No.1333. The different qualities of
water classes “A”-“D” are presented in Appendix 2.
Parameter Unit Class A Class B Class C Class D
BOD5 mg/L <2 <5 <20 <30
COD mg/L <5 <10 <40 <60
DO % >80 % >70 % >60 % >50 %
NO3- mg/L 20 50 50 50
pH - 6.0-8.5 6.0-9.0 6.0-9.0 6.0-9.0
EC μS/cm 1563 1563 2344 2344
Temperature* C +/-3 +/-3 +/-3 +/-3
*The allowed temperature difference from source and receiving water body.
3.4.1 Organic pollution index ICO
The ICO index is based on the Prati-index which is widely used index to determine pollution in
water bodies. Out of the 13 parameters used in the Prati-index the ICO-index prioritises indicator
parameters for organic pollution only. The ICO-index has been used in previous studies on the
Rocha River and is developed in the article Romero (1998). Table 3.3. and equation 3.1 explains
the contexture of the index.
Table 3.3 ICO-index, where Y is the measured value for each parameter.
Parameter Ranges/Units Equations
DO 0-50% X = 4.2 − 0.437 (
100 − 𝑌
5) + 0.042 (
100 − 𝑌
5)
2
50-100% X = 0.08(100 − Y)
>100% X = 0.08(100 − Y)
BOD5 mg/L X =
Y
1.5
COD mg/L X = 0.1Y
NO3- mg/L X = 2
2.1log(Y4
)

22
𝐼𝐶𝑂 =1
𝑚
1
𝑛∑ ∑ 𝑋𝑖𝑗
𝑛
𝑗=1
(3.1)
𝑚
𝑖=1
Where:
ICO= The modified organic pollution index from Prati
m= Number of samples
n= Number of parameters
Xij= Pollution unit
The organic pollution index can then be interpreted by a scale of classification seen in table 3.4.
Table 3.4 Classification of pollution according to the Prati based ICO-index
Level ICO Pollution of water Colour of quality
1 0-1 Not polluted BLUE
2 1-2 Weakly polluted GREEN
3 2-4 Moderately polluted YELLOW
4 4-8 Polluted ORANGE
5 8-16 Very polluted RED
6 >16 Highly polluted BLACK
3.5 Preparatory work for sampling
There is a general need to attempt to define the minimal number of sampling positions and
occasions that will provide the desired information. The basic aims of sampling may according
to Hunt and Wilson (1989) be summarized as: i) To select the positions and times of sampling,
such that the required information on quality can be executed with adequate accuracy at minimal
cost, ii) To ensure that the concentrations of parameters in samples are identical to those in the
water of interest at the positions and times of sampling and iii) To ensure that the concentrations
of parameters in samples do not change in the period between sampling and analysis.
Before performing sampling of fresh water bodies one needs to formulate the following
information as detailed as possible: i) what are the objectives with the measurements, ii) which
parameters that are of interest, iii) where and when the samples are to be collected, iv) which
analytic methods are to be used, as well as, v) how samples are going to be performed, handled,
interpreted and reported (Hunt and Wilson, 1986).
To obtain the quality of a river that is of interest it is important to specify the following: i) the
parameters of interest and the analyses that are required, ii) the particular rivers of interest and

23
locations, iii) the required accuracy of results is stated and implied so that appropriate methods of
sampling and analysis may be used (Hunt and Wilson, 1986). In the following subchapters the
statements above will be further explained.
3.5.1 Sampling locations
Sample locations should be located at cross sections where lateral and vertical mixing of
effluents are complete. To avoid non-representative samples caused by surface films and the
bottom deposits, it is recommended that samples should not be collected closer than 30 cm to the
surface or bottom. When the aim is to assess the quality of a river, the number of potentially
relevant sampling locations is usually significantly large. It is therefore, necessary to assign
different priorities to various locations in order to achieve a practicable sampling program. One
way is to identify locations where quality problems may be most severe (Hunt and Wilson,
1986).
Various factors are involved in selecting the exact locations of sampling points. One example of
exact location can be dependent on if the location is approachable. Also, selecting sampling
positions are dependent on the variety of processes that can affect the spatial heterogeneity of the
water bodies (Hunt and Wilson, 1986). For only a single sample to be required the water needs to
be sufficiently well mixed at the sampling station. What may prevent this is for example: The
mixing of tributary water with main river water if the flow in the river is laminar and the waters
are at different temperatures. The complete mixing of tributary and main stream waters may not
take place for a significant distance, sometimes many kilometers, downstream of the junction
(Bartram and Ballance, 1996).
The most desirable sampling position is at a bridge, it is easily accessible and identifiable as well
as a bridge is often a hydraulic gauging station. The gauging station allows one to collect the
stream flow information at the time of sampling. (Bartram and Ballance, 1996).
To be sure that the sample collected is completely mixed it is necessary to take several samples
at points across the width and depth of the river. If the results do not vary significantly from one
another, a station may be established at mid-stream or at another convenient location of the river.
(Bartram and Ballance, 1996).
3.5.2 Time and frequency of sampling
The time of sampling can be of particular concern when the quality of the water that is of interest
shows more or less regular variations. Within any water body, the water quality can differ with
time and place. Water quality differences may result from either internal or external processes,
where external processes being addition of pollutants. Internal processes are usually cyclic, for
example, the diurnal (24-hour) variations, which, can result from biological cycles and
daylight/darkness cycles which usually cause changes in, e.g., dissolved oxygen and pH. Another

24
example is the cyclic nature of waste discharges from domestic and industrial sources (Bartram
and Ballance, 1996). Also, variations such as minute-to-minute and day-to-day differences
resulting from water mixing and fluctuations in inputs, usually as a result of meteorological
conditions (Hunt and Wilson, 1986).
In other situations, the frequency may be of interest; for example if the interest is a
representation of the water quality during a defined period (Hunt and Wilson, 1986). The
differences in water quality at different times of the year will be much greater for a stream than
for a large river. This means that the sampling frequency necessary to allow average water
quality to be described correctly is normally much greater for a stream than for a river (Bartram
and Ballance, 1996). Hence, problems may arise of deciding the times at which to collect
samples so that the samples represent the quality during the period of interest (Hunt and Wilson,
1986). In random sampling, the times of sampling are as stated, random. In systematic sampling,
a particular pattern of sampling times is chosen and used for example; samples are collected
daily or weekly with a constant interval between samples (Hunt and Wilson, 1986).
Natural waters such as rivers provide several examples of systematic variability. For example, an
increased use of a chemical substance in a catchment area of a river may lead to an increasing
trend in the concentration of that chemical in the river waters. Other examples are the cyclic
variations such as the daily and annual cycles that several parameters show in surface waters as a
result of daily and annual variations in temperature and sunlight, e.g., the diurnal variations of
dissolved oxygen in rivers. And, not to forget, weekly or even daily cycles may arise through
industrial activity (Hunt and Wilson, 1986).
Most water bodies are affected by events that cause significant deterioration of the water quality,
e.g., flood conditions in rivers. The possibility of such periods should be considered when
planning sampling and, even more importantly, when considering the information required on
quality. It is generally necessary to decide if, and exactly what, information on the abnormal
quality is required.
3.5.3 Quality-control programs
There are two common types of control program for water quality analysis: The threshold control
and the process control (Hunt and Wilson, 1986). In threshold control, the primary aim is to
ensure that the concentrations of one or several parameters do not exceed specified limits;
provided that this aim is achieved, the parameter concentrations are unimportant. Thus, any
water quality standard specifying that a parameter must not exceed a specified limit implies the
need for threshold control. Situations do occur where a concentration of a parameter should not
be less than a specified limit, its concentration above that limit being unimportant. An example
of this is dissolved oxygen in river waters. In process control the specific concentration of one or

25
more parameters is examined and controlled within narrow limits of specified values (Kateman
& Pijpers, 1981)
3.5.4 Potential consequences with sample-collection devices
Examples of the potential consequences from physical, chemical and biological processes that
may disturb the results of the samples when collected are described below.
Physical processes
A frequent example is the deposition of undissolved, solid materials onto the walls of a device.
Another example is the loss of dissolved gases that may occur if the pressure decreases while
samples are in the devices (Hunt and Wilson, 1986).
Chemical processes
Chemical processes may occur between different constituents of a sample e.g., the, reaction
between chlorine and organic compounds, and may lead to increases or decreases of
concentrations of the specified parameter. It seems that the more important processes are those
involving reactions between sample and the sample-collection device itself. Such processes may
lead to increased variable concentrations when the examined variables are leached from the
device e.g., organic compound from plastic materials. Decreased concentrations may result from
direct reaction of the parameters with materials of construction of the device, e.g., dissolved
oxygen can react with steel or copper. Thus, for chemical processes not to occur after sampling it
is important to use recommended collection devices (Hunt and Wilson, 1986).
Biological processes
When natural waters are sampled, various biological species may settle on the surfaces of the
sample-collection device and react with the sample. For example, large proportions of the
ammonia in a sample may be oxidised by bacterial films with simultaneous release of other
nitrogen species into the sample. The general metabolism of biota may also release various
substances into the sample, e.g., dissolved oxygen and organic substances (Hunt and Wilson,
1986).
3.5.5 The materials of the containers
Plastic materials are usually unsuitable when organic compounds are of interests in samples
since it has been reported that leaching of various organic materials occur from a range of
plastics when in contact with water. Under those circumstances, metal or glass devices seem
preferable for organic variables. Each sampling situation should be considered individually since
the choice of material for sample-collection devices is governed by the variable of interest.
Another important factor is the cleanness of internal surfaces of the containers, especially with
regards to undissolved solid materials and biological films on surfaces (Hunt and Wilson, 1986).
26
3.5.6 Sample stabilisation
Chemical, biological and physical processes may occur in samples between the time of sampling
and analysis. Such processes are a common source of instability of many variables. The rates of
the various reactions are sometimes sufficient to cause important changes in concentration within
a few hours or within a day. Precipitation processes may also occur as well as oxidation and
reduction processes during the time between collection and analysis. The most common
analysing technique is to remove samples from the water-body and then analyze in a laboratory.
Although, some of the problems can be eliminated by the use of in-situ measurement techniques
in which the analytical sensor is merged in the water body at the desired position.
3.5.7 Hydraulic methods for measurements of a river
To interpret the water quality variables in a sample taken from a river, knowledge about the
discharge of the river at the time and place of sampling is required. To be able to calculate the
mass flux of chemicals in the water, a time series of discharge measurement is essential. The
flow rate of a river is the volume of water flowing through a cross-section in a unit of time. It is
calculated as the product of average velocity and cross-sectional area but is affected by water
depth, alignment of the channel, gradient and roughness of the river bed (Bartram and Ballance,
1996).
3.5.8 Measuring stream flow
The most accurate method to measure stream flow is to measure the cross-sectional area of the
stream and then, using a current meter, determine the average velocity in the cross-section (see
figure 3.1). If a current meter is not available, a rough estimate of velocity can be made by
measuring the time required for a weighted float to travel a fixed distance along the stream and
this method is also used for shallow waters where the current meter cannot be used (Bartram and
Ballance, 1996).
The velocity varies across a channel, and measurements must therefore be made at several points
across the channel (see figure 3.1). The depth of the river varies across its width, so the usual
practice is to divide the cross-section of the stream into a number of vertical sections and to
measure velocity at each of these points. No section should include more than 10-20 % of the
total discharge. Thus, between 5 and 10 vertical sections are measured, but of course the amount
depends on the width of the stream (Bartram and Ballance, 1996).

27
Figure 3.1 Cross-section of a river divided into vertical sections for flow measurement (Ethz.ch, nd).
The cross-section of a stream at the point of measurement, should fulfil some characteristics for
the best flow measurement. For example, the velocities at all points should be parallel to one
another and at right angles to the cross-section of the stream. Also, the cross-section should be
located at a section where the stream is nominally straight for at least 50 meters upstream and
downstream of the measuring point, as well as locating a bed of the channel that is fairly regular
and stable. Other characteristics are; a depth greater than 30 cm and no overflow of the stream
bank. There are even more characteristics to be fulfilled for an optimal measurement of flow but
not all can always be fulfilled and estimations have to be made (Bartram and Ballance, 1996).
3.5.9 Estimation of river discharge
The discharge can be estimated with several methods and the most common one is the Manning
equation, see equation 3.2, which, although developed for conditions of uniform flow in open
channels, may give an adequate estimate of the non-uniform flow which is usual in natural
channels.
Q =AR2 3⁄ S1 2⁄
n (3.2)
Where;
Q = Discharge [m3/s]
A= Cross-sectional area [m2]
P= The wetted perimeter [m]
R= Hydraulic radius and equal to A/P [m]
S= The slope of the gradient of the stream bed [m/m]
n= The roughness coefficient
More accurate values for discharge can be obtained with a permanent gauging station that is
established on a stretch of a river where there is a stable relationship between water level and
discharge. In this case readings need only be taken of the recorded water level (stage) from the

28
gauge, then the discharge may be read from a stage-discharge curve. The water quality samples
do not have to be taken exactly at a gauging station. A short distance upstream or downstream is
acceptable if no inflow or outflow occurs between the sampling and gauging stations (Bartram
and Ballance, 1996).
Unstable flow can produce a loop in the stage-discharge plot for an individual storm event, and is
not usually apparent in the annual rating curve that is commonly used in hydrological survey
programs. Unstable cross-sections cause stage- discharge variability and can produce sudden and
significant shifts in the rating curve as a result of erosion or deposition of material in the river
bed (Bartram and Ballance, 1996).
3.6 Water quality modelling and flow analysis
The software used for flow analysis and water quality modelling in this project is Hec-RAS
which is a river analysis system developed by the U.S. Army Corps of Engineers. With this
software one can perform one- and two-dimensional analyses for both steady and unsteady flow
hydraulics combined with general water quality modelling (U.S. Army Corps of Engineers,
2012).
The computations are based on the one-dimensional energy equation. Manning’s equation (eq.
3.2) is applied to evaluate the frictional energy losses, whereas a function of the change in
velocity head calculates the energy losses from contraction and expansion. For calculations of
flow regimes, such as hydraulic jumps where the water surface profile shows a large variation,
the momentum equation is used (U.S. Army Corps of Engineers, 2012).
For the water quality analysis Hec-RAS solves the one-dimensional advection and dispersion
equations by explicit numerical methods. To determine whether a specific part of the river, called
a water cell, is a source or a sink pertaining to heat energy the model uses the equation for heat
transport seen in equation 3.3
𝐻𝑒𝑎𝑡𝑠𝑜𝑢𝑟𝑐𝑒 𝑠𝑖𝑛𝑘⁄ =𝑄𝑛𝑒𝑡 × 𝐴𝑠
ρ𝑤
× 𝐶𝑝𝑤 × 𝑉 (3.3)
Where;
Qnet=net heat flux at the air-water interface [W/m2]
ρw= density of water [kg/m3]
Cpw= specific heat of water [J/kg/C]
As= surface area of the water cell [m2]
V= volume of the water cell [m3]
Further requirements to model the water temperature is a time series of complete meteorological
data set of the study area for the simulated period. Hec-RAS simulates the river nutrients by

29
including the rate constants of each parameter that control the rate of the source/sinks term (S) in
the advection-dispersion equation for thermal energy (equation 3.4). The rate constants included
represents the physical and chemical reactions between biochemical oxygen demand, dissolved
oxygen, algae, nitrate, phosphorus and sediments.
𝛿
δt(VΦ) = −
δ
δx(QΦ)Δx +
δ
δx(ΓA
δΦ
δx) Δx ± S (3.4)
Where;
Q= flow [m3/s]
A= cross sectional area [m2]
V= volume of the water cell [m3]
Φ= water temperature (C) or concentration [kg/m3]
Γ= user defined dispersion coefficient [m2/s]
S= sources/sinks [C°m3/s] or [kg/s]
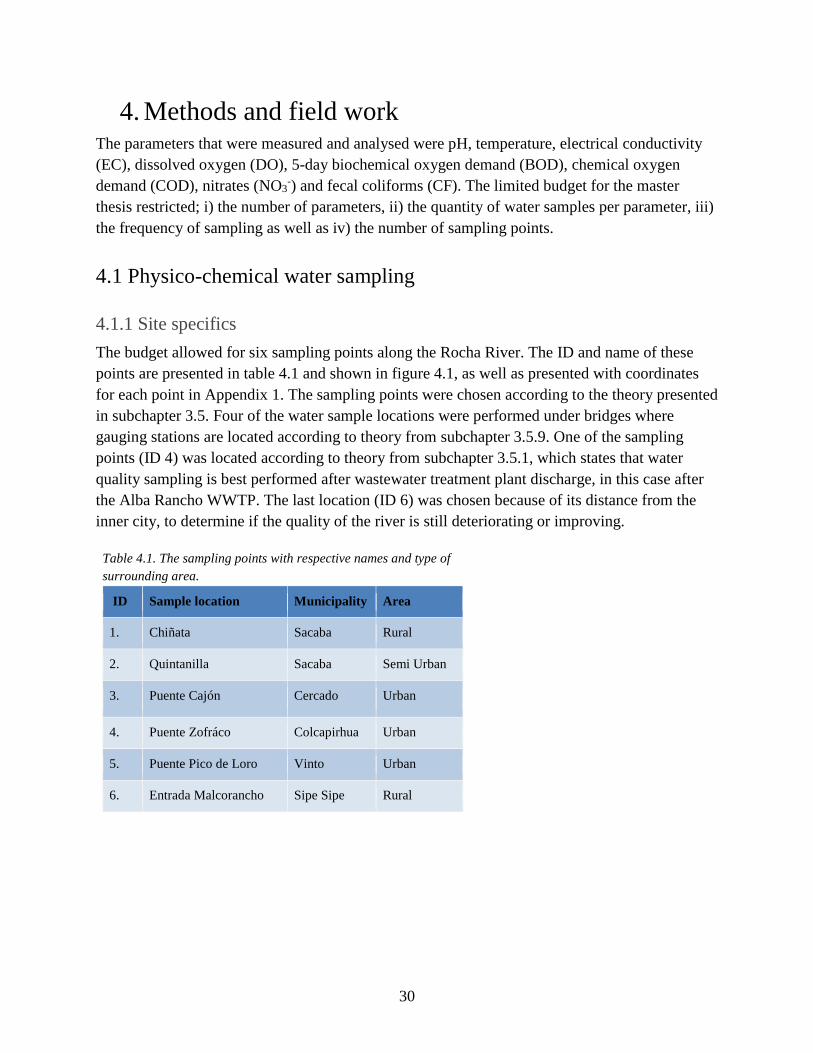
30
4. Methods and field work The parameters that were measured and analysed were pH, temperature, electrical conductivity
(EC), dissolved oxygen (DO), 5-day biochemical oxygen demand (BOD), chemical oxygen
demand (COD), nitrates (NO3-) and fecal coliforms (CF). The limited budget for the master
thesis restricted; i) the number of parameters, ii) the quantity of water samples per parameter, iii)
the frequency of sampling as well as iv) the number of sampling points.
4.1 Physico-chemical water sampling
4.1.1 Site specifics
The budget allowed for six sampling points along the Rocha River. The ID and name of these
points are presented in table 4.1 and shown in figure 4.1, as well as presented with coordinates
for each point in Appendix 1. The sampling points were chosen according to the theory presented
in subchapter 3.5. Four of the water sample locations were performed under bridges where
gauging stations are located according to theory from subchapter 3.5.9. One of the sampling
points (ID 4) was located according to theory from subchapter 3.5.1, which states that water
quality sampling is best performed after wastewater treatment plant discharge, in this case after
the Alba Rancho WWTP. The last location (ID 6) was chosen because of its distance from the
inner city, to determine if the quality of the river is still deteriorating or improving.
Table 4.1. The sampling points with respective names and type of
surrounding area.
ID Sample location Municipality Area
1. Chiñata Sacaba Rural
2. Quintanilla Sacaba Semi Urban
3. Puente Cajón Cercado Urban
4. Puente Zofráco Colcapirhua Urban
5. Puente Pico de Loro Vinto Urban
6. Entrada Malcorancho Sipe Sipe Rural

31
4.1.2 Chemical parameters and methods
Systematic sampling was performed, described in subchapter 3.5.2, once every two weeks during
the limited time in Cochabamba (22 October to 16 December), which resulted in three sampling
weeks. The technique for the chosen frequency is described in subchapter 3.5.2. The time of day
of the water sampling was during the hours between 08:00-17:00, approximately same time for
each point during the three weeks. The water sample collection and physical measurement for
the six points were divided into two days, three locations per day. The first sampling (occasion 1)
was performed 30-31 October, the second sampling occasion was performed 13-14 November
and the third sampling occasion was 27-28 November. Worth mentioning is that heavy rainfall
occurred the nights before sampling for both days during sampling occasion 3. Regarding the
first two sampling occasions there was no rainfall for several days before the sampling.
Apart from the limited economic budget, the rationale for the chosen parameters can be found in
subchapter 3.2 Water Quality. An assumption was made that the river was well mixed at mid-
stream and thus no sample collections were made beforehand as suggested in subchapter 3.5.1.
In order to minimize the chemical, biological and physical processes that may occur in samples,
different material for each container was used (table 4.2). The background for the chosen
material of sample container can be found in subchapter 3.5.5. According to subchapter 3.5.6 the
most common analyzing technique for water quality is to remove samples from the water-body
and then analyze in a laboratory. As measurements taken in situ, which is preferable, was not an
option in this study, the chosen parameters except for temperature were determined in the
laboratory at C.A.S.A within UMSS. The technique used for determination of the parameters are
presented in Appendix 3.1 and briefly described in subchapter 3.2.1.
To prevent high rate reactions preservatives were added for COD, nitrites and coliforms (table
4.2). The stabilisation processes for all the chosen parameters are also presented in table 4.2.
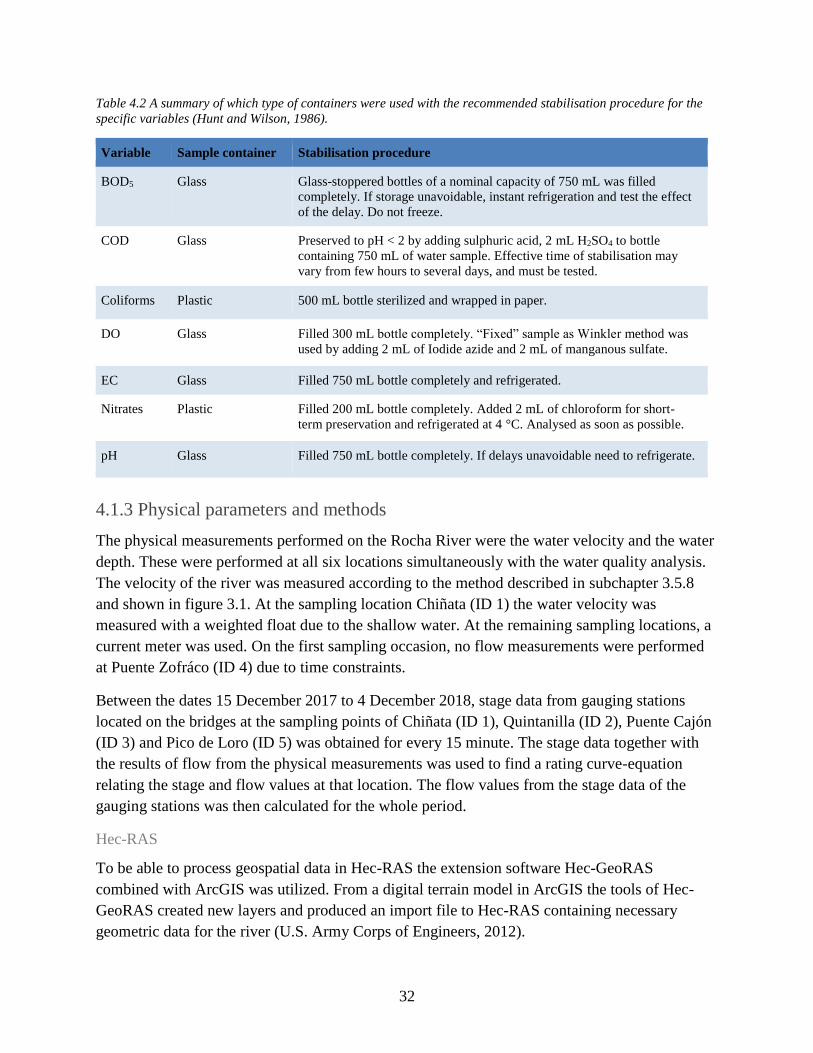
32
Table 4.2 A summary of which type of containers were used with the recommended stabilisation procedure for the
specific variables (Hunt and Wilson, 1986).
Variable Sample container Stabilisation procedure
BOD5 Glass Glass-stoppered bottles of a nominal capacity of 750 mL was filled
completely. If storage unavoidable, instant refrigeration and test the effect
of the delay. Do not freeze.
COD Glass Preserved to pH < 2 by adding sulphuric acid, 2 mL H2SO4 to bottle
containing 750 mL of water sample. Effective time of stabilisation may
vary from few hours to several days, and must be tested.
Coliforms Plastic 500 mL bottle sterilized and wrapped in paper.
DO Glass Filled 300 mL bottle completely. “Fixed” sample as Winkler method was
used by adding 2 mL of Iodide azide and 2 mL of manganous sulfate.
EC Glass Filled 750 mL bottle completely and refrigerated.
Nitrates Plastic Filled 200 mL bottle completely. Added 2 mL of chloroform for short-
term preservation and refrigerated at 4 °C. Analysed as soon as possible.
pH Glass Filled 750 mL bottle completely. If delays unavoidable need to refrigerate.
4.1.3 Physical parameters and methods
The physical measurements performed on the Rocha River were the water velocity and the water
depth. These were performed at all six locations simultaneously with the water quality analysis.
The velocity of the river was measured according to the method described in subchapter 3.5.8
and shown in figure 3.1. At the sampling location Chiñata (ID 1) the water velocity was
measured with a weighted float due to the shallow water. At the remaining sampling locations, a
current meter was used. On the first sampling occasion, no flow measurements were performed
at Puente Zofráco (ID 4) due to time constraints.
Between the dates 15 December 2017 to 4 December 2018, stage data from gauging stations
located on the bridges at the sampling points of Chiñata (ID 1), Quintanilla (ID 2), Puente Cajón
(ID 3) and Pico de Loro (ID 5) was obtained for every 15 minute. The stage data together with
the results of flow from the physical measurements was used to find a rating curve-equation
relating the stage and flow values at that location. The flow values from the stage data of the
gauging stations was then calculated for the whole period.
Hec-RAS
To be able to process geospatial data in Hec-RAS the extension software Hec-GeoRAS
combined with ArcGIS was utilized. From a digital terrain model in ArcGIS the tools of Hec-
GeoRAS created new layers and produced an import file to Hec-RAS containing necessary
geometric data for the river (U.S. Army Corps of Engineers, 2012).

33
The calculated flow data from the gauging stations was used as input boundary conditions for the
respective locations in the model for unsteady flow simulations. In Hec-RAS an unsteady flow
and a 1-dimensional mixed flow regime was assumed. The variation of Manning’s n-value (eq.
3.2) was estimated to 0.074 between ID 1-2, 0.087 between ID 2-4, 0.055 between ID 4-5 and
0.03 between ID 5-6.
The simulated flow was then used in the Hec-RAS water quality model, which was run for the
period of sampling, 30 October 2018 to 29 November 2018. The results of the measured
chemical parameters was used as input boundary conditions. Meteorological data sets for
Cochabamba including short wave radiation, wind speed, atmospheric pressure, air temperature,
relative humidity and cloudiness was found from (Nasa, 2019) and entered into the model. The
water quality model computes the dispersion coefficient based on the hydraulic variables at each
position. The lower and upper limits for the computed values was calibrated to receive the best
output. and no consideration was taken to the influence and existence of algae, phosphorous,
nitrogen in the form of nitrite, ammonium and organically bound nitrogen. Further, all nutrient
modelling parameters was put as the default values of the Hec-RAS software (U.S. Army Corps
of Engineers, 2012).
4.2 Evaluation and classification of water quality
The threshold control described in subchapter 3.5.3 is the method chosen for the control of the
results from the water quality analysis. The results from the chemical water analysis was
compared with the recommended values given in tables in subchapter 3.4. The chosen
parameters for water quality regulations; drinking water, irrigation water and environmental
waters are presented in table 3.1.The threshold values for the examined parameters from the
Bolivian Environmental Law No. 1333 are presented in table 3.2.
The ICO-index was calculated according to equation 3.1 and table 3.3, where number of
parameters n=4 and the number of samples are for the three occasions m=3.
The results from the chemical analysis and the ICO values was compared with the results from
Contraloría General del Estado (2017). The values from the 2017-study are presented in
Appendix 4.1 and 4.2.
4.3 Aspects of the social and environmental influence
The social and environmental influences are documented with; i) photographs from site during
field work, ii) localisation of near industries and other pollution factors/contributors and iii)
detection of direct pipe discharge to the Rocha River, registered during field work as well as
from previous studies.

34
5. Results and Discussion The results for all the parameters from the chemical analysis are presented in Appendix 3.2. In
subchapter 5.1 the parameters are discussed separately for each location and compared to the
regulation values given in subchapter 3.4 Legislation and guidelines. In subchapter 5.2 the water
samples from each sampling point was classified according to the ICO-index and compared to
the classification results from previous studies. The measured and modelled flow velocity of
Rocha River is presented subchapter 5.3. In subchapter 5.4 the social and environmental
influences are discussed. In the last subchapter (5.5) the variation of the water quality along
Rocha River is presented.
5.1 Chemical parameters and water quality classification
The results of the chemical analysis are presented in separate tables for each parameter, table
5.1-5.7. The six sampling points presented in table 4.1 and figure 4.1 are in the following tables
listed from upstream to downstream, ID 1-6.
As can be seen in table 5.1 two water samples from the quality water analysis resulted in pH
above recommended values. The rest of the results for all three sampling occasions and six
locations are in the quality regulation range for; drinking water, water for agriculture and
environmental waters (table 3.1). However, according to UMSS (2018) the desired level of pH
for irrigation waters in the region is between 5 and 7.5. As the pH exceeds the value of 8.5
during two occasions, the waters at those two points do not fulfill the requirements for
classification “A” from the Bolivian Environmental law No.1333.
Table 5.1 pH results from the water quality analysis at the six sampling points. Values exceeding the regulations
given in table 3.1 are presented as bold. The water classification according to the Bolivian Environmental law No.
1333 (table 3.2 and Appendix 2) are presented in the last column.
ID Sample occasion 1 Sample occasion 2 Sample occasion 3 Water classification
1 8.18 8.67 8.27 A-D
2 7.49 8.24 6.72 A
3 7.68 8.32 7.58 A
4 8.08 8.22 7.51 A
5 7.56 7.71 7.29 A
6 8.54 7.29 6.98 A-D
The high pH may be the cause of several chemical reactions. For example the high nitrogen load
in Rocha River can be the cause of high pH as mentioned in subchapter 3.2.1 or the reaction of

35
photosynthesis mentioned in subchapter 3.1. However, no conclusions can be made as no tests
were performed on the amount of ammonium in the water. But if so, the high pH and the high
amount of hydroxyl ions could lead to the formation of ammonia which is the toxic form. Also
worth mentioning is that the high pH shown in table 5.1 is favorable if heavy metals are present
as they are less toxic at higher pH.
Although the pH-values were not below the lower threshold, the pH decreases were significant
for ID 2 and ID 6 during sampling occasion 3, and showing values deviating from the other
points. This could be an indication that the water at these locations was largely affected by the
heavy rainfall.
The electrical conductivity values from table 5.2 are all below the regulation limits for; drinking
water, water for irrigation and environmental waters (table 3.1) and according to table 3.2 the
water could be classified as “A”-”B” for ID (1, 3, 5), while the values for ID (2, 4, 6) was
classified as “C”-”D”.
The low amounts of salts facilitates the buffering of the pH in the water, which (according to
table 5.1) tended to be alkaline.
Table 5.2 Electrical conductivity results given in μS/cm from the water quality analysis for the six points.
The water classification according to the Bolivian Environmental law No. 1333 (table 3.2 and Appendix 2) are
presented in the last column.
ID Sample Occasion 1 Sample Occasion 2 Sample Occasion 3 Water classification
1 427 400.5 384 A-B
2 1452.5 1817 1497 C-D
3 1055 1151 790 A-B
4 624.5 1650 959 C-D
5 689 676 452.5 A-B
6 1636 463 437 C-D
The overall results for ID 2-6 of the BOD5 concentrations (table 5.3), indicated that the water is
not suitable for any of the regulations given in table 3.1. However, in Chiñata (ID 1), the Rocha
River may be used for irrigation. Also, the results indicated that the concentration of BOD5 for
(ID 1) were satisfactory regarding environmental factors. The results of the water quality
analysis from Puente Cajón (ID 3) were below the threshold for environmental waters according
to the Bolivian Ministry of Sustainable Development and Environment (MDSMA, 1996).

36
The water in Chiñata may be classified as “A”-”B” according to the environmental law No.1333.
The rest of the samples exceeded the threshold for classification “D”, except for ID 4 and 5
during occasion 3 where they can be classified as “C” and “D” respectively.
Table 5.3 BOD5 results from the water quality analysis at the six sampling points given in mg O2/L. Values
exceeding the regulations given in table 3.1 are presented as bold. The water classification according to the
Bolivian Environmental law No. 1333 (table 3.2 and Appendix 2) are presented in the last column.
ID Sample Occasion 1 Sample Occasion 2 Sample Occasion 3 Water classification
1 2 <2 <2 A-B
2 261 506 620 −
3 54 69 38 −
4 91 84 17 C/ −
5 74 108 24 D/ −
6 93 72 60 −
Just as the values for BOD5, none of the values for COD (table 5.4) were below the limit for
drinking purposes. All the locations showed values that were below the limit for environmental
waters, except for ID 2. The results exceeded the limitation for Bolivian environmental law
No.1333 classification, except for the sample at Chiñata (ID 1) that could be classified as “C”-
”D”.
Table 5.4 COD results given in mg O2 /L from the water quality analysis at the six sampling points. Values
exceeding the regulations for environmental waters given in table 3.1 are presented as bold. The water
classification according to the Bolivian Environmental law No. 1333 (table 3.2 and Appendix 2) are presented in the
last column.
ID Sample occasion 1 Sample occasion 2 Sample occasion 3 Water classification
1 21 45 18 C-D
2 555 713 854 −
3 111 219 85 −
4 156 259 123 −
5 117 171 103 −
6 237 190 167 −
According to the water sample analysis of the dissolved oxygen, the values were very low and
below all threshold values (table 3.1) at all locations except at Chiñata (ID 1). The results (table

37
5.5) that do not have exact values is due to the concentration of the dissolved oxygen was below
the detection limit. Noticeable from table 5.5 was that the oxygen levels were increased and
detectable at (ID 3) and decreased again at (ID 4). The dissolved oxygen thresholds from the
Bolivian environmental law are given in percent saturation (table 3.2). The results from the water
analysis were converted from mg O2/L to percent and presented in Appendix 3.3. The result
indicates that the water located at Chiñata (ID 1) should be classified as “A”. Remaining samples
resulted in dissolved oxygen between 0.66 -34%, where values above 50% are classified as “D”.
These values were therefore too low to be classified according to table 3.2.
Table 5.5 Results of dissolved oxygen from the water quality analysis at the six sampling points given in mg O2/L.
Values in bold represent values that are below the regulation thresholds for environmental waters, drinking water
and water for irrigation, from table 3.1. The water classification according to the Bolivian Environmental law No.
1333 (table 3.2 and Appendix 2) are presented in the last column.
ID Sample occasion 1 Sample occasion 2 Sample occasion 3 Water classification
1 7.25 7.32 7.54 A
2 <0.05 <0.05 <0.05 −
3 0.2 0.2 2.34 −
4 <0.05 <0.05 <0.05 −
5 <0.05 <0.05 2.04 −
6 <0.05 1.11 2.14 −

38
The values of nitrates (table 5.6) were at all sampling points passing the regulation limits for
drinking water, irrigation waters and environmental waters. Further, the water could at all
locations be classified as “A” with the respect of nitrate. The low values can be explained by the
denitrification process in the almost anoxic state of the river water as well as algal metabolism
where nitrate is consumed.
Table 5.6 Results of nitrates mg NO3- /L from the water quality analysis at the six sampling locations.
The water classification according to the Bolivian Environmental law No. 1333 (table 3.2 and Appendix 2)
are presented in the last column.
ID Sample occasion 1 Sample occasion 2 Sample occasion 3 Water classification
1 0.13 0.27 0.13 A
2 <0.03 0.31 0.4 A
3 0.13 0.22 4.51 A
4 0.13 0.27 0.04 A
5 0.04 0.22 9.39 A
6 0.04 0.13 6.25 A
The water from Rocha River in Chiñata (ID 1) can with regards of coliforms be used for
irrigation of crops according to unrestricted and restricted limits given in table 3.1. The rest of
the analyses of coliforms showed values that exceeded all thresholds. The highest values were
seen at Quintanilla (ID 2).
Table 5.7 Results of coliforms cfu/100 mL from the six sampling locations.
The values in bold indicates that the concentration exceeds the regulation values for
drinking water, irrigation and environmental water in table 3.1.
ID Sample occasion 1 Sample occasion 2 Sample occasion 3
1 655 694 580
2 7.5*107 5.3*107 1*108
3 6.4*106 1.2*107 1.2*107
4 1*107 1.7*107 6.5*106
5 8.9*106 7.7*106 3.3*106
6 1.2*107 2.9*106 9.5*106
39
A general observation from all the chemical parameters was that the results from sample
occasion 3 was significantly affected by the rainfalls that occurred the days before sampling,
most evidently shown for BOD5, COD, DO and NO-3 (table 5.3-6). The increased volume of
water (seen in figure 5.2) diluted the amount of organic matter in the river which led to increased
oxygen values. The rainfall could also have led to an increased turbulence in the stream,
transporting more oxygen to the waterbody. The somewhat increased concentrations of NO-3 at
occasion 3 could further be explained by NO-3 leaching from soils to the river water during heavy
rain, or, the higher levels of oxygen which inhibit the process of denitrification. The correlation
of increased oxygen and NO-3 -values during sampling occasion 3 is seen for ID 3, 5, and 6
(table 5.6). Regarding ID 5 and 6, the NO-3 increase is likely mainly due to leaching from the
soils of the agricultural lands in those areas. Another explanation note regarding the rainfall is
the potential effect it had on the pH values (table 5.1). The rain, which was likely acid due to air
pollution, could be the explanation to the lower pH values seen at ID 2 and 6.
An aspect worth mentioning concerning the method of the chemical analysis is that it entails a
few uncertainties and estimations. In light of what is written in subchapter 3.2.1, regarding that
realistic stream conditions are difficult to produce in a laboratory during the Winkler dilution
method, it is implied that the BOD5 results in table 5.3 should be interpreted more as an
indication. One possibility is for example that the BOD5 concentrations in reality could be higher
than the results received, taking the risk that the oxygen in the bottle of incubation could be
consumed within the five days into account.
Moreover, the reliability of the results could be improved by following the sampling method in
subchapter 3.5.1, stressing the importance of taking replicate samples at each location. This
would diminish the factor of uncertainty regarding the possibility that the water is not
sufficiently mixed. A further factor of uncertainty regarding the chemical analysis method,
mentioned in subchapter 3.2.1, is the amount of time between the sampling at the river and the
analysis performed at the lab. As several parameters are temperature dependent and the sampling
lasted during long days of sun and high temperatures, there is a possibility that the samples were
not sufficiently incubated in the styrofoam transport box used (seen in Appendix 5, figure A),
which could have affected the results.
5.2 ICO-index
The estimated organic pollution obtained in this study, was classified according to ICO-index
described in subchapter 3.5.1 and presented in table 5.8 for the six sampling locations (ID 1-6).
The ICO-index for Contraloría General del Estado (2017) was calculated with the values from
Appendix 4.1 for the corresponding locations. No corresponding locations existed for ID 1 and 2.
The calculations are presented in Appendix 3.3 and Appendix 4.2 and a map of the distribution
of sampling points is seen in figure 5.1.

40
Figure 5.1 The sampling points of this project and Contraloría General del Estado (2017).
Table 5.8 The organic pollution, classified according to the ICO-index
Zone ID ICO Pollution of water
Colour of
quality
ICO
(2017)
Colour of quality
(2017)
Chiñata 1 1.38 Weakly polluted GREEN - -
Quintanilla 2 97.79 Highly polluted BLACK - -
Puente Cajón 3 14.90 Very polluted RED 60.18 BLACK
Puente Zofráco 4 18.19 Highly polluted BLACK 61.83 BLACK
Puente Pico de
Loro 5 17.40 Highly polluted BLACK 48.69 BLACK
Entrada
Mallcorancho 6 19.85 Highly polluted BLACK 105.27 BLACK
According to the ICO index, the water sample in Chiñata (ID 1) is classified as “weakly
polluted”, turning to “highly polluted” at the location of Quintanilla (ID 2). After passing
through Cercado the water quality increases and improves the classification from black to red at
Puente Cajón (ID 3). The organic pollution becomes “highly polluted” again at ID 4-6 after
passing the Alba Rancho WWTP and the agricultural areas downstream.
The “highly polluted” waters are all waters with an ICO index above 16. The ICO-index values
for the water samples from Contraloría General del Estado (2017) are considerably higher, much
depending on that the nitrate results seen in Appendix 4.1 are very high compared to the results

41
from table 5.6. However, the director of C.A.S.A stated that when taking photosynthesis and
denitrification into perspective, the low ICO-results from this project (table 5.6) are to be
considered as more reasonable (A.M Romero Jaldín 2019, personal communication, 31 January).
The water sampling of the compared study was performed during the same season, October 2017
indicating that the values should not deviate as much as found in this comparison.
5.3 Hec-RAS
The results of the measured flow from the six sampling points is displayed in table 5.9 where one
can see how the river flow is increasing downstream in the river course. On sample occasion 3
the flow increased distinctly at all downstream points which is due to the heavy rainfall that
occurred the nights before sampling. As mentioned, no flow measurements was performed at ID
4 on the first sampling occasion.
Table 5.9 Measured river flow (m3/s) from the three sample occasions at the
six sampling points.
ID Sample occasion 1 Sample occasion 2 Sample occasion 3
1 0.00062 0.000434 0.000611
2 0.09 0.058 0.068
3 0.19 0.177 0.406
4 − 0.439 1.163
5 4.01 1.953 7.333
6 4.57 2.353 9.681
5.3.1 Flow analysis
The flow results from the performed Hec-RAS modelling correlates well with the continuous
measured flow at the gauging stations at Puente Cajón (ID 3) and Pico de Loro (ID 5) (figure
5.2). The modelled flow at Quintanilla has the same trend as the calculated flow values but the
amount of flow deviates with an average of 0.28 m3/s.

42
In figure 5.3 and 5.4 the seasonal variations can be seen and flow peaks are concentrated during
the rainy season December –March. During April-October the river flows are relatively constant.
The two figures illustrate how the flow increases downstream in the river. The flow
characteristics in Chiñata (ID1) is more of a small stream, during the dry season the flow varies
between 0.001-0.003 m3/s and during rainy season the flow reached values up to 0.07 m3 /s. The
0
0.2
0.4
0.6
0.8
1
1.2
1.4
01
-ok
t-18
11
-ok
t-18
21
-ok
t-18
31
-ok
t-18
10
-no
v-18
20
-no
v-18
30
-no
v-18
Flo
w (
m3
/s)
Quintanilla, ID 2 Q model Q real
0123456789
10
01
-ok
t-18
11
-ok
t-18
21
-ok
t-18
31
-ok
t-18
10
-no
v-18
20
-no
v-18
30
-no
v-18
Flo
w (
m3
/s)
Puente Cajón, ID 3
02468
101214161820
01
-ok
t-18
11
-ok
t-18
21
-ok
t-18
31
-ok
t-18
10
-no
v-18
20
-no
v-18
30
-no
v-18
Flo
w (
m3
/s)
Pico de Loro, ID 5
Figure 5.2. Shows the flow variations (m3/s) in Rocha River at the locations (ID 2, 3 and 5) for October and November 2018. The dotted
line represents the modelled flow in Hec-RAS (Q model) and the full line represents the calculated flow from the gauging stations and
field measurements (Q real).

43
flow characteristics in Entrada Mallcorancho (ID 6) varies during the dry season around 1.0 m3/s
and during the rainy season it can reach values up to 80 m3/s.
Figure 5.3 Seasonal flow variations (m3/s) at location Chiñata (ID 1) from 15 Dec 2017 to 4 Dec 2018.
Figure 5.4 Seasonal flow variations (m3/s) at Entrada Mallcorancho (ID 6) from 15 Dec 2017 to 4 Dec 2018.
The large flows and increased stage at Entrada Mallcorancho (figure 5.4) has required the
building of levees to prevent flooding (seen in figure E, Appendix 5). The results from the Hec-
Ras modell (figure 5.2) and measured river flows in table 5.9 indicates that the rainfall event
before sampling occasion 3 (27-28 October) was more intense downstream which also can be
seen in the increased dissolved oxygen values at location Puente Pico de Loro and Entrada
Mallcorancho (ID 5 and 6). From figure 5.2 it can further be assumed that the Hec-RAS model is
performing well. However, with more time, further calibration of the model could have been
done to enhance the different trends by adjusting parameters such as boundary conditions,
geometry of river cross-sections as well as the Manning´s coefficients.

44
5.3.2 Chemical analysis
Time for this part of the modelling was limited and the results were obtained on the very end of
the project period. No conclusive results was accessed for dissolved oxygen, temperature and
nitrate. Hence, more time for calibration of the water quality model was needed. In this report,
only the results for BOD5 is presented from the Hec-RAS water quality model, since the focus in
this study was mainly on organic pollution.
The total mass of BOD5 passing through Quintanilla (ID 2) during 30 October to 29 November
could with the Hec-RAS water quality model be calculated to 104 tons.
Figure 5.5 illustrates the modelled result of the BOD5 variations at Quintanilla (ID 2). In the
graph it can be seen that there are relatively large deviations between the model and the observed
values from the measured water quality sampling, although they follow the same increasing
pattern. The results from the water quality model can therefore be questioned. However, as
mentioned in subchapter 5.1, neither the BOD5 results obtained from the Winkler dilution
method can be seen as exact.
To improve the model output for all parameters at all points in the river, more calibration and
time series data are needed. As seen in figure 5.3 and 5.4 the flow varies significantly during the
year at the up- and downstream sections of the river and thus, the water quality at different times
of the year will have a great variation along the river course. For further studies, it is therefore
highly recommended to include water quality samples taken at more locations along the river and
at more time points distributed over the whole year.
0
100
200
300
400
500
600
700
800
900
1000
BO
D5
mg/
L
BOD5 Quintanilla ID 2
Modeled values
Observed values
Figure 5.5 Changes in concentration of BOD5 mg/L at Quintanilla ID 2 during the sample period. The line
represents the modelled variation in BOD5 concentration and the dots represents the measured values from
the water quality sampling (table 5.3).

45
5.4 Social and environmental influences
5.4.1 Visible pollution
The amount of solid waste in Rocha River could
not be ignored during the fieldwork (figure 5.6).
Large amounts of solid waste thrown directly into
the river by individuals passing the bridges were
frequently observed (ID 1-6). The behavior can be
explained by the few, or none, existing official
dumping sites for waste, as well as a lack of public
interest and awareness. Both investments,
engagements and time is needed to improve the
state of Rocha River. The beneficial factors for the
local individual is the improved water supply,
esthetic surrounding and healthy environment
which on all levels increases the quality of life.
However, for this to occur, the opportunity and
public desire is required to change the customary
habits into a more holistic approach.
Visible urban water has many recreational benefits.
However, the appearance of the river in the inner city
(figure 5.7) leaves little room for these values as it has
high turbidity (especially after heavy rainfall), litter
content and an unpleasant scent. Good intentions for
the river restoration can also be seen in this picture, as
different elevation steps have been created for an
increased aeration.
As mentioned in subchapter 2.3.4 there are several
domestic and industrial untreated wastewater pipes
directly discharging into the Rocha River. Denoted
pipes with highly polluted discharge in Sacaba from
the previous study UMSS (2018) is from a
slaughterhouse (ID 18, Appendix 1) and from a
WWTP (ID 14, 15, Appendix 1). With knowledge of
the lacking sewer connections in Sacaba and the level
of contamination, more pipes and channels of polluted
wastewater are assumed to be existing in this area.
Figure 5.6 Solid waste in Rocha River under Puente
Cajón (ID 3).
Figure 5.7 Rocha River passing through
Cercado, aeration occurring.

46
During the fieldwork a direct untreated wastewater
channel was encountered at (ID 2) (figure 5.8). From the
figure one might understand the difficulty in locating
these types of discharges into the river as the amount of
vegetation in the river bank is large and the discharge
may be irregular.
Anoxic environment was observed after the WWTP
Alba Rancho (ID 4) as the water of the shallow Rocha
River in this area had a distinct black colour (seen in
figure 5.9) which is an indication of high levels of
oxidized organic matter.
5.4.2 Agricultural aspects
Several farmers with agricultural
land located next to the Rocha River
have implemented direct irrigation
pipes from the Rocha River to the
fields, located and documented
(figure 5.10) during fieldwork. Seen
in figure 5.10 is diverted water from
Rocha River and used for irrigation
of maize without any treatment at
location (ID 2).
Figure 5.8 Untreated wastewater discharge to
Rocha River at ID 2.
Figure 5.9 Rocha River at Puente Zofráco
(ID 4)
Figure 5.10 Pipe with untreated Rocha River as irrigation water for
maize at Quintanilla (ID 2)

47
All the electrical conductivity results from table 5.2 pass the recommended limits for irrigation
water. However, as mentioned in subchapter 2.3.5, specific crops have different yield potential at
different electrical conductivity values for irrigation water. As stated above, the irrigation water
in figure 5.10 is diverted direct from the Rocha River and thus the electrical conductivity for the
irrigation occurring are the values for (ID 2) in table 5.2. The fields at Quintanilla were irrigated
with an electrical conductivity value of 1453-1817 µS/cm during the field work. A conclusion
based solely on the electrical conductivity values of the irrigation water is that the high salt
content in the water reduces the potential yield which means that the farmer could produce more
maize (at electrical conductivity value of 1100 µS/cm or less) if the irrigation water was less
polluted. Also, none of the water samples exceeded the maximum electrical conductivity values
for alfalfa and maize which means that these two crops will grow if irrigated with water from the
Rocha River, but the higher the electrical conductivity value the lower the yield potential. Worth
mentioning is that farmers in the La Mayca area south of Alba Rancho WWTP irrigate with
wastewater from the treatment plant, which means that the water from these ponds needs to be
analysed before a conclusion could be made about the salt content of the irrigation water in that
area. Known is however that the WWTP does not have a disinfection step in the treatment
process.
According to Huibers et al. (2004) the agricultural soil in the valley of Cochabamba is
deteriorating and farmers grow mostly crops that are more salt-tolerant. A physicochemical
analysis of the soil would have been required in this study to be able to investigate how the
polluted irrigation water is affecting the cultivation accumulation of pollution in the soil. To
irrigate with wastewater or heavily polluted river water is often a prerequisite in water scarce
areas. Nevertheless, when irrigating with heavily polluted water precaution measures must be
considered as it may affect the human health and soil degradation in the long term as well as
possible percolation contaminating groundwater. Thus, beneficial for irrigation and health in
rural areas would be to increase the restriction of local industrial wastewater treatment, improve
the sewer systems and expand the municipal WWTP. A suitable measure in the La Mayca area
would for example be to implement improved simple low-cost treatment techniques in order to
reduce coliform and electrical conductivity concentrations in the ponds at Alba Rancho, reducing
the risks both in the actual area and downstream.
A common observation during fieldwork was that farmers also grow vegetables which are more
sensitive to high electrical conductivity concentrations. No knowledge was gained during
fieldwork of how the vegetables were irrigated. In this study the overall classification of the
Rocha River water in the farmland area near the Alba Rancho WWTP and sample location
Puente Zofráco (ID 4) is “D” according to Bolivian environmental law (disregarding pH and
nitrate). As stated in this law (Appendix 2) vegetables cannot be eaten raw if irrigated with
quality of water class “D”. If the Rocha River water in this area is used as irrigation of
vegetables, the growth and safety of consumption would be improved for example by dilution as

48
an improvement of the quality could be seen after the rainfall on sample occasion 3 (subchapter
5.1).
5.4.3 River characteristics
Regarding the river bed observations, coarse grained sediment was solely observed in Chiñata
(ID 1, figure B, Appendix 5). The rest of the river sediment was similar to the sediment in
figure C, Appendix 5, which might be described as consolidating alluvial deposits with a thick
layer of organic matter that has sedimented in anoxic environment. According to Renner &
Velasco (2000), coarse grained sediments are found in the northern parts of the valley which
leads to higher permeability and higher recharge to groundwater. As the water quality in the
northern parts at ID 1 is classified as “weakly polluted” according to ICO-index and passes all
regulation limits for environmental waters, the risk of the river contaminating the groundwater is
considered as low even though percolation may occur. At the remaining points ID 2-6 the
consolidating sediment is of advantage as it prevents the groundwater in those areas to be
affected. However, as the polluted water travels far downstream, where the type of sediments is
not explored in this project, the risk of groundwater being contaminated by the water in the
Rocha River stream cannot be excluded. In subchapter 5.1 no indications could be found
regarding the impact of electrical conductivity from the groundwater into the river. The previous
study (Renner & Velasco, 2000) indicated that the groundwater in the south-western part of the
valley (involving ID 5 and 6) had a higher ionic concentration due to the sediments but this could
not be seen in the data from our project (table 5.2).
A character of the river also indicated by the low oxygen levels (table 5.5), was that no aquatic
life was encountered during the sampling. According to the Federal Interagency Stream
Restoration Working Group (1998), mentioned in subchapter 3.1, oxygen concentration at 2
mg/L or lower during a longer period of time indicates that the water bodies are “dead” and that
larger organisms cannot be present.
Taking the theory in subchapter 3.1 River Restoration into consideration, the river has optimal
characteristics for sedimentation and self-recreation as it is well meandering and contains high
amounts of vegetation, stones and cobbles (Appendix 5, figure D), elevation differences and a
large variation in flow (subchapter 5.3). Unfortunately, the extent of the continuous pollution is
preventing the recreation to occur.
5.4.4 Health aspect
As the river passes through a densely populated area and is surrounded by 1,323,000 inhabitants
(subchapter 2.2) it is, as observed, inevitable that people are residing and working in very close
vicinity to the river. Accidental ingestion through skin contact with the water is therefore the
prominent possibility for getting deceased by the pollution. Many severe health risks can be
excluded if it is assumed that the river water is not directly used as drinking resource. However,

49
even though the water in the river channel is consolidated, the water used as irrigation may
percolate down and contaminate the groundwater. This puts people using private pumps as
drinking water source under high health risks as they indirectly can consume the pollutants
including heavy metals from the industries.
From the results from the chemical parameters in subchapter 5.1 it can be concluded that the
main health risks can be correlated with the high concentrations of thermotolerant coliforms
(table 5.7) in the river water. Of the existing coliforms in freshwater 95% is estimated to be
E.coli (Bartram and Ballance, 1996) which determines a fecal content in the water. According to
subchapter 3.3 these pathogens therefore expose the population of a risk for diseases including
diarrhea, cholera, typhoid, hepatitis A and B and dysentery. In addition to this, the farmers and
other workers having direct contact with the river water are in risk for eczema. Depending on the
crop irrigated with the polluted water, the plants can also transmit the pathogens to the
consumers, which dramatically increases the zone where and amount of people that can possibly
be affected. Furthermore, the inhabitants without connected sewer services using in situ
sanitation systems such as septic tanks and latrines are in a situation of high risk of the same
mentioned diseases.
More parameters including heavy metals, algae, helminth eggs and other pathogens need to be
measured in the river to be able to perform a more thorough risk analysis. To reduce health risks
related to the Rocha River along its course, large improvements needs to occur early on upstream
in the Sacaba area. This proposal is based on the fact that the results of the water quality
parameters related to health issues from this area and further on downstream was classified as
“D” according to Bolivian Environmental law (Appendix 2), which states that the river is
harmful to be in contact with. Further, the concentration of coliforms in the mentioned parts of
the river distinctly exceed the national regulations (table 3.1) for healthy environmental waters.
5.5 The variation of water quality along Rocha River
According to the chemical analysis Chiñata (ID 1) had the best quality out of the six sampling
points and was classified as “weakly polluted” according to the ICO-index. Even though there
are direct discharge pipes located in Chiñata (e.g. ID 7, Appendix 1) according to UMSS (2018),
this did not result in any tangible impact on the river quality. The combination of low population
in this area and no industrial activities is probably the major explanation to the low organic
pollution. As the river flow at this location is low (subchapter 5.3) it becomes more sensitive to
variation and changes of the volume of wastewater that is discharged into the river. To preserve
the water quality status in Chiñata it is therefore critical to implement a secure and complete
connection of sewer systems presuming that the estimated population increase also develops in
the Chiñata area.

50
The population becomes denser as the river flows through Sacaba where the sewer system
connection is poor and several industries and slaughterhouses are located. Out of the six
sampling points the results from this area (Quintanilla, ID 2) reached the highest organic
pollution index (ICO index, table 5.8).
The results clearly indicated that untreated domestic and industrial wastewater in this area is
directly discharged into the river as described in UMSS (2018) where several discharge pipes
were located. An interesting supplement to this study would be to perform water sampling during
the night, since previous study UMSS (2018) indicated that untreated wastewater from industries
is most likely discharged during night hours.
Further downstream, at the inner city of Cercado, the public sewer network is more developed
which can be seen in the slightly lower organic content and higher oxygen levels in the sample
from Puente Cajón (ID 3). This is likely an effect of the avoided direct domestic discharge to the
river. The slight water quality improvement is also seen in the calculated ICO-index as the
pollution classification improved from “highly polluted” (black classification) to “very polluted”
(red classification). Studying the results for BOD5 at Puente Cajón (table 5.3) that passes the
Bolivian regulation value of 80 mg/L for environmental waters. An interesting comparison
between the regulation value for BOD5 of 80 mg/L and 10 mg/L, which is the discharge
regulation for environmental waters according to Swedish law, illustrating that state regulations
for approved water quality can vary significantly between countries.
The improved water quality downstream of Cercado does not proceed which might be caused by
insufficiently treated wastewater discharge from the Alba Rancho WWTP as well as the
connection with the tributary Tamborada River. The contribution of polluted water to Rocha
River from the Tamborada River is untreated domestic wastewater from the southern parts of the
department that is not connected to the public sewer system, and with big fluctuation in volume
between the seasons. In subchapter 2.3.4 it is mentioned that approximately 65% of the
wastewater from the city is collected in sewers and only a small percentage is treated at the Alba
Rancho WWTP. Hence, the majority of the wastewater is directly discharged untreated and
eventually ending up in Rocha River. This information gave a presumption that the water quality
at Puente Zofráco (ID 4) would result in the lowest water quality of the six points. This was
visually confirmed at the site (figure 5.9), where the river seemed to have a high content of
oxidized organic matter, revealed by the black colour of the water. However, the chemical
analysis results of BOD5 and coliforms (table 5.3 and 5.7) did not clearly show this. Instead,
equally high values could be seen at all sampling points (disregarding ID 1). This could possibly
be explained by the fact that the wastewater from a high percentage of the population is directly
discharged into the river along its course.

51
In the urban areas of Sacaba, Cercado and Colcapirhua there are as described in subchapter 2.3.3
many different industries and facilities producing wastewater. As mentioned in UMSS (2018); to
be able to differentiate between the different types of wastewaters from the different industries
including leather industries, car washes and laundry facilities, common in these urban areas,
samples need to be taken directly from the industry effluents. This, as well as knowledge of the
industrial processes, is needed to be able to determine exactly what parameters that should be
examined (subchapter 3.2).
Results from samples obtained at Puente Pico de Loro (ID 5) and Entrada Mallcorancho (ID 6)
were from water passing lands of more rural and agricultural characteristics and low population
near the river. The flow analysis showed large volumes of river water and high flow velocities
(subchapter 5.3.1). All this combined with the observed potential for self-restoration, indicated
that the river could have an improved water quality in the samples obtained from these areas.
The results contradicted this theory as the ICO-index classified the water at point ID 5 and 6 as
“Highly polluted”. The input discharges from slaughterhouses in these areas combined with the
extent and synergetic effects of the pollution upstream is likely preventing the ability of
restoration to occur.

52
6. Conclusions The state of the water quality in the Rocha River is according to the ICO-index ranging from
“very” to “highly polluted” water along the river from Sacaba to Sipe Sipe (ID 2-6). Only the
results from rural Chiñata (ID 1) high upstream show a water quality passing WHO-, EPA- and
FAO-regulations as well as Bolivian regulations and is classified as “weakly polluted”.
According to the Bolivian Environmental law No.1333, the water from Sacaba to Sipe Sipe (ID
2-6) can at best be classified as “D” with the parameters measured in this study. This restricts the
recommended use of the river for drinking, agricultural and environmental purposes. The
prominent parameter that restricts the water usage is however the content of coliforms at all
locations below Chiñata. An overall conclusion of the organic pollution of Rocha River is that
the deterioration has continued over the years since 1998 and has now reached even the outskirts
of the valley upstream in Sacaba and downstream in Sipe Sipe. This conclusion is in accordance
with previous studies on the river. Subchapter 5.3.1
Comparing the results of water quality in areas with sewer system connection (Cercado ID 3)
and suburban areas without, proves that the domestic and industrial discharge with high organic
content that is directly discharged in the suburban areas without public network connections is a
factor of high consequence for the pollution and oxygen depletion of the river. Taking the
estimated population growth in the department into account, the untreated wastewater discharge
will likely increase and worsen the state of the river, assuming that the development and
distribution of public sewer systems, as well as WWTP, is not increasing to the same extent.
Furthermore, large amounts of solid waste in Rocha River contributes to the water pollution. A
plausible reason for this practice might be the lack of official dumping sites for the inhabitants in
the Cochabamba department.
Of the parameters measured, the high amount of coliforms along the river is the factor most
critical to the health of the population, mainly for people residing in close contact with the water.
A conclusion in this study, regarding the restricted use of untreated river water as irrigation in
the agricultural areas is based on the coliform and electrical conductivity results from the water
chemical analysis. The high amount of coliforms may spread to the consumers if crops and
vegetables are irrigated with the river water. The high electrical conductivity values indicates
that the crop selection is restricted to highly salt tolerant crops and thus preventing cultivation of
a variety of crops and vegetables. It may also contribute to soil degradation leading to a possible
prevention of future cultivation. Although a recirculation of nutrients and water is favourable, the
polluted waters on the farmlands can potentially percolate and badly affect the groundwater.
There is currently a water deficit in the department, and future scenarios predict a dryer and
warmer climate. These conditions, together with the fact that the pollution in Rocha River
prevents an available water source to be safely utilized, and with the potential of contaminating
other existing sources puts the community of Cochabamba under an even harder water stress
affecting the whole society.

53
7. Recommendations In this study several contributing and resulting factors of the pollution in Rocha River is
discussed. To receive more profound explanations to the problems stated in the aim of the study,
more analyses are required on the river and its surroundings. Below are recommendations for
further studies.
- The conclusions made in this study are solely based on the parameters measured. A wider
range of parameters measured would result in a more complete overview of the pollution.
Moreover, parameters such as heavy metals, algae, helminth eggs and other pathogens
are required to perform a more thorough risk analysis on the effects of the pollution.
- The parameters investigated in this study give no information on the specific effects on
the Rocha River from the industrial effluents. To be able to differentiate between the
different types of wastewaters from the different industries; samples need to be taken
directly from the industry effluents. Furthermore, to be able to determine exactly what
parameters that are linked to the industrial discharges more information of the industrial
processes is required.
- It is recommended to obtain water samples directly at the effluents of the Alba Rancho
WWTP to be able to determine whether the increase in pollution seen after ID 4 is due to
the connection with the Tamborada River or due to the WWTP discharge.
- To be able to see how the irrigation with the polluted water from Rocha River might
affect the cultivation and accumulation of pollution in the soils of the agricultural lands, a
physicochemical analysis of the soil is recommended.
- To support the conclusions drawn on the health risks and environmental impacts, it is
recommended to perform a more thorough analysis on the possibility of the Rocha River
contaminating the groundwater. Preferably, water quality sampling should be performed
at wells in close vicinity to agricultural fields that are irrigated with the river water. It has
been assumed that the river bed is preventing the water in the channel to percolate.
However, more detailed studies on the sediments are required to conclude this.
- The Hec-RAS flow analysis, shows how the river flow varies between seasons. To get an
overview of how the pollution in Rocha River is affected by this, quality samples are
needed from more time points distributed over the whole year. Furthermore, as
calibration of the water quality model is needed to validate the output, more measured
data at each location is required. The data and the developed Hec-RAS model from this
study can be used as an initiation for near future simulations.

54
8. References ADA, 2017. Agenda del Agua Cochabamba 2025, u.o.: u.n.
Arnade, C. and McFarren, P. (n.d.). Bolivia | History, Geography, People, & Language. [online]. Available at:
https://www.britannica.com/place/Bolivia [Accessed 13 Sep. 2018].
Ayers, R.S. and Wescot, D.W. (1994). Water quality for agriculture. [online] fao.org. Available at:
http://www.fao.org/docrep/003/T0234E/T0234E00.htm [Accessed 12 Feb. 2019].
Bartram, J. and Ballance, R. (1996). Water quality monitoring - A Practical Guide to the Design and
Implementation of Freshwater Quality Studies and Monitoring Programmes. London: Published on behalf of United
Nations Environment Programme and the World Health Organization, E & FN Spon, p.1-293.
Bier, A. (2018). Electrochemistry - Theory and Practice. [pdf] Available at: https://www.hach.com/asset-
get.download.jsa?id=7672493965 [Accessed 10 Feb. 2019]. Bustamante, R.; Butterworth, J.; del Callejo, I.; Duran, A.; Herbas, D.; Hillion, B.; Reynaga, M.; Zurita, G., 2004.
Multiple sources for multiple uses: Household case studies of water use around Cochabamba, Bolivia,11 pp.
Bustamante, R. & Médieu, A., 2012. Struggling at the Borders of the City:Environmental Justice and Water Access
in the Southern Zone of Cochabamba, Bolivia. Environmental Justice, 5(2), pp. 89-92.
Congreso Nacional de Bolivia (1992). Law No. 1333 - Environmental Law.[online]. Available at:
https://digitalrepository.unm.edu/la_energy_policies/271 [Accessed 18 Jan. 2018].
Contraloría General del Estado , 2017. Seguimento a las recommendaciones del informe de auditoría K2/AP06/M11
sobre el desempeno ambiental respecto de los impactos negativos generados en el Río Rocha, u.o.: u.n.
DIAZ, J., RAMIREZ, I., ZAEPKE, M.: Hidrogeoquímica del Valle Central de Cochabamba, IT CABAS No33,
Nov. 1995.
Edge analytical (n.d.). 4500-NO3 NITROGEN (NITRATE). [pdf] Edgeanalytical.com. Available at:
https://www.edgeanalytical.com/wp-content/uploads/Waste_SM4500-NO3-.pdf [Accessed 1 Dec. 2018]. EEA (2018). Water quality and pollution by oxygen consuming substances. [online] European Environment Agency.
Available at: https://www.eea.europa.eu/archived/archived-content-water-topic/status-and-monitoring/state-of-
surface-waters/water-quality-and-pollution-by-oxygen [Accessed 8 Dec. 2018].
EPA, 2012. Guidelines for Water Reuse, Washington: u.n.
EPA, 2018. Nutrient Pollution- The Effects: Human Health. [Online]
Available at: https://www.epa.gov/nutrientpollution/effects-human-health [Accessed 24 02 2018].
Ethz.ch. (n.d.). Measuring discharge;Climatological and hydrological field work.[online] Available at:
https://www.ethz.ch/content/dam/ethz/special-interest/usys/iac/iac-
dam/documents/edu/courses/climatological_and_hydrological_field_work/Discharge.pdf [Accessed 28 Jan. 2019].
FAO, 1996. Wastewater treatment and use in agriculture Chapter 2 - Wastewater quality guidelines for agricultural
use, Rome: u.n.
Fetter, C. W., 1980. Applied Hydrogeology. u.o.:C. E. Merrill.
FISRWG (1998). Stream Corridor Restoration: Principles, Processes and Practices. By the Federal Interagency
Stream Restoration Working Group (FISRWG)(15 Federal agencies of the US gov´t). GPO Item No. 0120-A;
SuDoes No.A 57.6/2:EN3/PT.653. ISBN-0-934213-59-3.

55
Global Water Partnership, 2017. Bolivia: The water war to resist privatisation of water in Cochabamba. [Online]
Available at: https://www.gwp.org/en/learn/KNOWLEDGE_RESOURCES/Case_Studies/Americas--
Caribbean/bolivia-the-water-war-to-resist-privatisation-of-water-in-cochabamba-157/ [Accessed 28 10 2018].
Gobierno Autónomo Departamental de Cochabamba , SDMT & SDC, 2014. PLAN DIRECTOR DE LA CUENCA
DEL RÍO ROCHA:“Estado de situación y Propuesta de Lineamientos Estratégicos”, u.o.: u.n.
Gonzales Amaya, A., Villazon, M. F. & Willems, P., 2018. Assessment of Rainfall Variability and Its Relationship
to ENSO in a Sub-Andean Watershed in Central Bolivia. MDPI Water, 10(710).
Hammer, M. and Hammer, M. (2014). Water and Wastewater Technology. Harlow: Pearson.
Huibers FP, Moscoso O, Duran A, van Lier JB. The use of wastewater in Cochabamba, Bolivia: A degrading
environment. In: Scott CA, Faruqui NI, Raschid-Sally L, editors. Wastewater Use in Irrigated Agriculture. CABI
Publishing, Wallingford, UK; 2004. p. 135–44.
Hunt, D. and Wilson, A. (1986). The chemical analysis of water: General Principles and Techniques. 2nd ed.
Cambridge: The Royal Society of Chemistry, pp.8-126.
INE, 2016. Instituto Nacional de Estadística- Población de Cochabamba llega a 1.916.000 habitantes al 2016.
[Online] Available at: https://www.ine.gob.bo/index.php/component/k2/item/416-poblacion-de-cochabamba-llega-a-
1-916-000-habitantes-al-2016?highlight=WyJjb2NoYWJhbWJhIl0= [Accessed 24 01 2018].
Kateman, G. and Pijpers, F.W. (1981). Quality control in analytical chemistry. [online] Catalogue.nla.gov.au.
Available at: https://catalogue.nla.gov.au/Record/4196532 [Accessed 10 Jan. 2019].
Kellman, L. and Hillaire-Marcel, C. (1998). Nitrate cycling in streams: using natural abundances of NO− 3 -δ15N
to measure in-situ denitrification. [pdf] Kluwer Academic Publishers, pp.1-4. Available at:
https://link.springer.com/content/pdf/10.1023%2FA%3A1006036706522.pdf [Accessed 5 Feb. 2019].
Lagos, M. (1994). Autonomy and Power: The Dynamics of Class and Culture in Rural Bolivia. University of
Pennsylvania Press, p.67.
Martens, D. (2005). Denitrification. [online] Sciencedirect.com. Available at:
https://www.sciencedirect.com/topics/agricultural-and-biological-sciences/denitrification [Accessed 7 Feb. 2019].
MDSMA, 1996. Reglamentacion de la ley Nº 1333 del medio ambiente. Bolivia, u.n.
Medrano, R. T. & Derpic, D. A., 2006. Evaluación de la calidad de las aguas del río Rocha en la jurisdicción de
SEMAPA en la provincia Cercado de Cochabamba-Bolivia, Av. General Galindo s/n, Cochabamba, Bolivia:
Departamento de Ciencias Exactas e Ingeniería, Universidad Católica Boliviana.
MMAyA, 2012, Inventario Nacional de Sistemas de Riego [online].Available at:
http://www.bivica.org/upload/sistemas-riego-inventario.pdf [Accessed 25 Jan 2018]
MMAyA, 2014. Plan maestro metropolitano de agua y saneamiento de Cochabamba Bolivia, Cochabamba: u.n.
Moretto, L. and Kurt Kalcher, K. (2015). Environmental Analysis by Electrochemical Sensors and Biosensors. 1st
ed. [ebook] New York: Springer, pp.735-736. Available at: https://link-springer-
com.ludwig.lub.lu.se/content/pdf/10.1007%2F978-1-4939-1301-5.pdf [Accessed 8 Dec. 2018].
Nasa, 2019. POWER Data Access Viewer, Washington D.C: NASA Prediction Of Worldwide Energy Resources.
NEMI (n.d.). NEMI Method Summary - 4500-O C. [online] Nemi.gov. Available at:
https://www.nemi.gov/methods/method_summary/7389/ [Accessed 4 Dec. 2018].
Oram, B. (n.d.). Ammonia in Groundwater, Runoff, Surface Water, Lakes and Streams. [online] Water-research.net.
Available at: https://www.water-research.net/index.php/ammonia-in-groundwater-runoff-and-streams [Accessed 5
Feb. 2019].

56
Perlman, H. (2018). pH: Water properties, from the USGS Water-Science School. [online] Water.usgs.gov.
Available at: https://water.usgs.gov/edu/ph.html [Accessed 8 Dec. 2018].
Renner, S. & Velasco, C., 2000. Geology and hydrology of the central valley of Cochabamba, u.o.: German
Bolivian Agreement on Groundwater (CABAS).
Reyna-Bowen, L., Reyna-Bowen, M., Reina-Castro, J. and Hurtado, E. (2017). Zoning of landscape units in the
Khora Tiquipaya watershed (Quillacollo, Bolivia) based on the landscape ecology approach. [online] Available at:
https://www.researchgate.net/publication/321849634_Zoning_of_landscape_units_in_the_Khora_Tiquipaya_waters
hed_Quillacollo_Bolivia_based_on_the_landscape_ecology_approach [Accessed 9 Jan. 2019].
Romero, A. M., Van Damme, P. & Goita, E., 1998. Contaminación Orgánica del río Rocha. Revista Boliviana de
Ecología y Conservación Ambiental, Volym Nº3, p. pp.14.
Schwarzenbach, R. P. o.a., 2010 . Global Water Pollution and Human Health. Annual Review of Environment and
Resources, 35(1), pp. 109-136.
UMSS. (2018). Estudio del estado de uso real del agua en la cuenca del Rio Maylanco.
UN-Water. (n.d.). Quality and Wastewater | UN-Water. [online] Available at: http://www.unwater.org/water-
facts/quality-and-wastewater/ [Accessed 8 Feb. 2019].
U.S. Army Corps of Engineers, 2012. HEC-GEORAS GIS Tools for Support of Hec-RAS using ArcGIS10 - User's
Manual, u.o.: u.n.
U.S. Army Corps of Engineers, 2016. HEC-RAS River analysis system - User's Manual, u.o.: u.n.
Utrikespolitiska institutet, 2018. Bolivia, Landguiden [online] Available at: https://www.ui.se/landguiden/lander-
och-omraden/sydamerika/bolivia/ [Accessed 12 Sep. 2018].
Whitehead, P.G, Wilby, R.L, Battarabee, R.W, Kernan, M. and Wade, A. (2009). A review of the potential impacts
of climate change on surface water quality. Hydrological Sciences Journal, [online] 54:1, pp.101-123. DOI:
10.1623/hysj.54.1.101
WHO. (1989). Guidelines for the safe use of wastewater and excreta in agriculture and aquaculture: measures for
public health protection. Prepared by Duncan Mara & Sandy Cairncross. Geneva: World Health Organization.
Available at: http://www.who.int/iris/handle/10665/41681 [Accessed 10 Oct. 2018]
WHO, 2006. WHO Guidelines for the safe use of wastewater, excreta and greywater Volume 4 Wastewater use in
agriculture, Geneva : u.n.
WHO, 2015. Bolivia, Sanitation drinking-water and hygiene status overview. [online] Available at:
http://www.who.int/water_sanitation_health/monitoring/investments/bolivia-6-jan-16.pdf [Accessed 12 Sep. 2018].
WHO, 2016. Protecting Surface Water for Health- October Version, u.o.: u.n.
WHO, 2018. A global overview of national regulations and standards for drinking-water quality, u.o.: u.n.
WHO, u.d. Water sanitation and health Chapter 2 - Water Quality Requirements, u.o.: u.n.
World Weather Online, 2019. World Weather Online. [online] Available at:
https://www.worldweatheronline.com/cochabamba-weather-averages/cochabamba/bo.aspx [Accessed 03 Mar. 2019]
Zabalaga, J., Amy, G. and von Münch, E. (2007). Evaluation of agricultural reuse practices and relevant guidelines
for the Alba Rancho WWTP (primary and secondary facultative ponds) in Cochabamba, Bolivia. Water Sci Technol
(2007) 55 (1-2): 469-475. [online] IWA. Available at: https://doi.org/10.2166/wst.2007.045 [Accessed 2 Oct. 2018].

57
Appendix 1: Coordinates Table A1. Coordinates for the sample locations (ID 1-6) and other significant locations are given in Universal
Transverse Mercator coordinate system (UTM).
ID Municipality Sampling point x (UTM) y (UTM) Zone
1 Sacaba Chiñata
183414 8073210 20S
2 Sacaba Quintanilla
806799 8074278 19S
3 Cercado Puente Cajón 799287 8072403 19S
4 Colcapirhua Puente Zofráco 794863 8072068 19S
5 Vinto Puente Pico de Loro 784674 8073597 19S
6 Sipe Sipe Entrada Mallcorancho
784935 8070502 19S
7 Chiñata WW discharge pipe to the Mayalanco-Rocha River 183434 8073165 20S
8 Sacaba Wastewater discharge channel to the Maylanco-Rocha river
813020 8073100 19S
9 Sacaba Wastewater discharge pipe to the Maylanco-Rocha river 815002 8074387 19S
10 Sacaba Wastewater discharge pipe to the Maylanco-Rocha River 812880 8073887 19S
11 South
Quintanilla
Wastewater discharge channel to the Maylanco-Rocha river 807862 8074062 19S
12 South
Quintanilla Wastewater discharge pipe connected to sewer system
807861 8074055 19S
13 South
Quintanilla
Wastewater discharge channel towards Maylanco/ Rocha 806363 8074449 19S
14 Sacaba Wastewater Treatment Plant EL ABRA- EMAPAS 806244 8074495 19S
15 Sacaba Wastewater Treatment Plant San Pedro Magisterio, Discharge
Pipe
805933 8075307 19S
16 Sacaba Slaughter Area 813020 8073100 19S
17 Sacaba Slaughter Area :Wastewater discharge channel to the Maylanco-
Rocha river without flow
813065 8073218 19S
18 Sacaba Wastewater discharge channel to Maylanco-Rocha river: There is
discharge, during the inspection it was humid, it is believed that
the discharges are made at night (pig farm)
809846 8074417 19S

58
Appendix 2: Classification A-D Table A2. Classification of water bodies (A-D) according to their suitability from Bolivian Environmental Law
No.1333.
Order Use/Application Class A Class B Class C Class D
1 For domestic drinking water supply after:
a) Only one disinfection and no treatment. Yes No No No
b) Only physical treatment and disinfection
Not
Necessary
Yes No No
c) Physical - chemical treatment, complete
coagulation flocculation, filtration and
disinfection.
Not
Necessary
d) Prolonged storage or presedimentation,
followed by treatment, like in c).
Not
Necessary
Not
Necessary
Not
Necessary
Yes
2 For primary contact recreation: swimming,
diving.
Yes Yes Yes No
3 For the protection of hydrobiological
resources
Yes Yes No No
4 For irrigation of raw consumed vegetables
and fruits which are ingested raw without
removal of peel.
Yes Yes No No
5 For industrial purposes Yes Yes Yes Yes
6 For the natural and /or intensive breeding
(aquaculture) of species intended for human
consumption
Yes Yes Yes No
7 Water adapted for animals No Yes Yes No
8 For navigation No Yes Yes Yes

59
Appendix 3: Methods and results Water quality analysis methods and water quality results
A3.1 Water quality analysis method Table A3.1. Techniques used at the C.A.S.A lab for determining the values of the parameters.
Parameter Technique / method Detection limit units
pH Electrochemical 0.10 -
EC Electrochemical 0.10 μ S/cm
DO Winkler Titration 0.10 mg O2/L
BOD5 Dilution-Winkler method 2 mg O2/L
COD Oxidation with dichromate 2 mg O2/L
Nitrates Reduction with Cadmium 0.03 mg NO3/L
Coliforms Membrane filtration 0 UFC/100 mL
A3.2 Water quality results
Table A3.2. Results from the chemical water analysis.

60
A3.3 ICO-index calculation Table A3.3. Calculated ICO-index (equation 3.1) for each location with the sum of the three sampling occasions,
where, n=4 and m=3. The measured dissolved oxygen value was converted to percent saturation regarding
elevation and temperature with the converter from University of MN, Natural Resources Research Institute.
Chiñata (ID 1) Parameter Y 1 X1 Y2 X2 Y3 X3
DO % 116.32 1.31 115.07 1.21 116.10 1.29
BOD5 (mg/L) 2.00 1.33 2.00 1.33 2.00 1.33
COD (mg/L) 21.00 2.10 45.00 4.50 18.00 1.80
Nitrates (mg/L) 0.13 0.11 0.27 0.18 0.13 0.11
Sum 4.85 7.22 4.54
Total sum 16.6
ICO Chiñata: 1.38
Quintanilla (ID 2) Parameter Y 1 X1 Y2 X2 Y3 X3
DO % 0.81 12.06 0.81 12.06 0.78 12.07
BOD5 (mg/L) 261.00 174.00 506.00 337.33 620.00 413.33
COD (mg/L) 555.00 55.50 713.00 71.30 854.00 85.40
Nitrates (mg/L) 0.03 0.05 0.31 0.20 0.40 0.23
Sum 241.61 420.89 511.03
Total sum 1173.53
ICO Quintanilla: 97.79
Puente Cajon (ID 3) Parameter Y 1 X1 Y2 X2 Y3 X3
DO % 3.35 11.45 3.28 11.46 34.04 5.74
BOD5 (mg/L) 54.00 36.00 69.00 46.00 38.00 25.33
COD (mg/L) 111.00 11.10 219.00 21.90 85.00 8.50
Nitrates (mg/L) 0.13 0,.11 0.22 0.16 4.51 1.08
Sum 58.66 79.52 40.66
Total sum 178.84
ICO Punte Cajón: 14.90

61
Puente Zofraco (ID 4) Parameter Y 1 X1 Y2 X2 Y3 X3
DO % 0.87 12.04 0.84 12.05 0.76 12.07
BOD5 (mg/L) 91.00 60.67 84.00 56.00 17.00 11.33
COD (mg/L) 156.00 15.60 259.00 25.90 123.00 12.30
Nitrates (mg/L) 0.13 0.11 0.27 0.18 0.04 0.05
Sum 88.43 94.13 35.76
Total sum 218.32
ICO Puente Zofráco: 18.19
Puente Pico de Loro (ID 5) Parameter Y 1 X1 Y2 X2 Y3 X3
DO % 0.74 12.08 0.70 12.09 30.24 6.28
BOD5 (mg/L) 74 49.33 108.00 72.00 24.00 16.00
COD (mg/L) 117 11.7 171.00 17.10 103.00 10.30
Nitrates (mg/L) 0.04 0.05 0.22 0.16 9.39 1.72
Sum 73.16 101.35 34.29
Total sum 208.81
ICO Puente Pico de Loro: 17.40
Entrada Mallcorancho (ID 6) Parameter Y 1 X1 Y2 X2 Y3 X3
DO (%) 0.66 12.10 15.75 8.76 29.07 6.45
BOD5 (mg/L) 93.00 62.00 72.00 48.00 60.00 40.00
COD (mg/L) 237.00 23.70 190.00 19.00 167.00 16.70
Nitrates (mg/L) 0.04 0.05 0.13 0.11 6.25 1.33
Sum 97.85 75.88 64.48
Total sum 238.21
ICO Entrada
Mallcorancho:
19.85

62
Appendix 4: Contraloría del Estado (2017) Water quality results from the previous study of Contraloría del Estado (2017).
A4.1 Water quality results
Table A4.1. Measured values from 20 points along Rocha River in 2017 (Contraloría General del Estado, 2017).
Point
Municipality East North UTM EC
µS/cm
OD
%
pH T °C NO3-
mg/L
BOD5
mg/L
COD mg
O2/L
Fecal
coliform
cfu/100mL
Flow
m3/s
1 Sacaba 811951 8074208 19K 630.4 0.25 6.85 19.6 83.83 196 326 920000 0.02
2 Sacaba 804826 8076707 19K 740.25 0.2 7.85 20.7 43.6 168 280 420000 0.03
3 Cercado 801288 8075379 19K 1677 58.56 8.18 22.1 15 399 665 590000 0.015
4 Cercado 800222 8072961 19K 1937 2.72 7.8 27.6 17 272 453 170000 0.046
5 Cercado 795259 8071488 19K 2740 2.4 7.54 24.9 39 324 539 300000 0.029
6 Colcapirhua 794834 8072088 19K 2.95 235.6 8.23 23.1 20.6 199 649 130000 -
7 Colcapirhua 793269 8072545 19K 3.11 100.1 8.28 27.6 56.9 324 821 100000 -
8 Colcapirhua 793031 8072719 19K 3.65 85 8.31 19.9 23.3 283 695 390000 -
9 Colcapirhua 791870 8072887 19K 1.96 4 7.79 29.8 22.3 295 492 110000 -
10 Quillacollo 791412 8072969 19K 4070 3 8.03 21.7 187 139 307 510000 -
11 Quillacollo 788598 8071965 19K 1600 2 7.65 27 49.1 373 791 260000 -
12 Quillacollo 786675 8072760 19K 1550 2 7.39 20.4 91 232 204 580000 -
13 Vinto 786303 8072953 19K 1583 3.1 6.8 20.7 62.3 80 200 1000000 0.1
14 Vinto 785318 8073316 19K 1638 41 7.57 25.6 72.1 217 690 2800000 0
15 Vinto 784556 8073463 19K 1649 5.4 7.46 25.4 95 104 770 1000000 0.2
16 Vinto 784332 8072961 19K 848 6.6 6.7 28.7 121 429 920 4400000 0.1
17 Sipe Sipe 784917 8070483 19K 255 3 7.6 24.8 263 442 1008 580000 0.1
18 Sipe Sipe 783630 8066036 19K 14 52 7.5 25 160 90 124 4000 -
19 Sipe Sipe 782886 8064657 19K 1426 96 7.6 21.7 116 210 389 18000 -
20 Sipe Sipe 783421 8055459 19K 166 110 8.1 22.4 83.8 70 117 9000 -
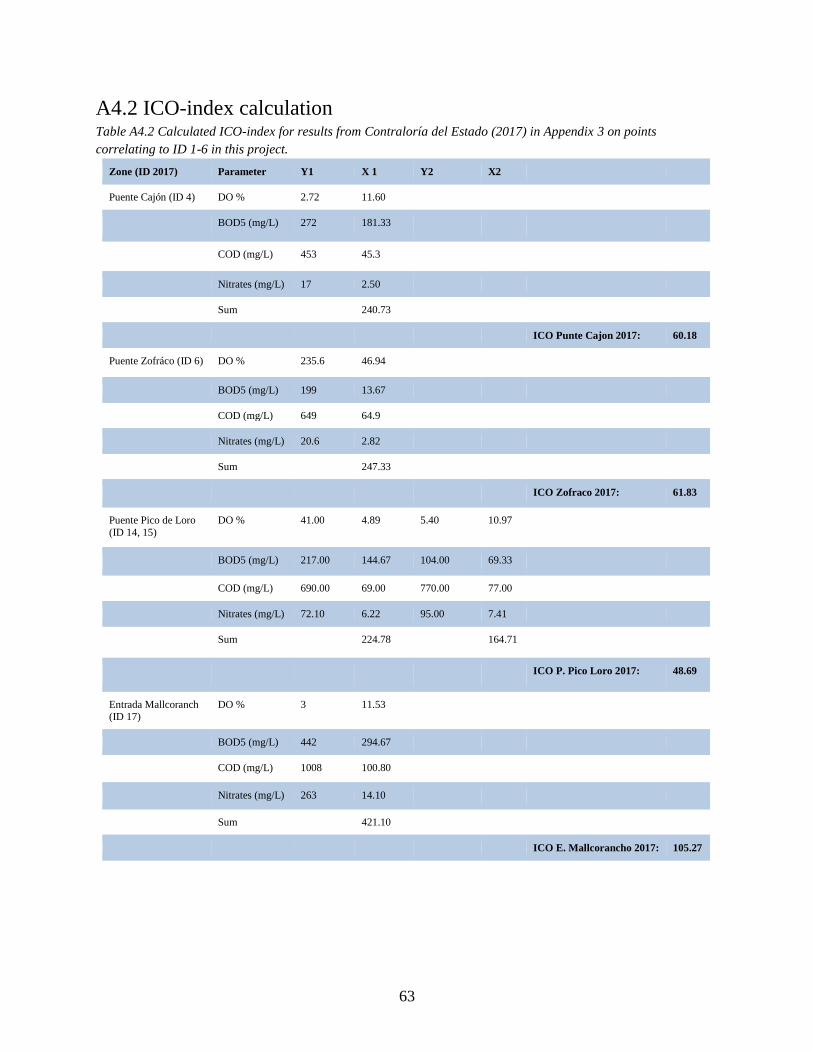
63
A4.2 ICO-index calculation Table A4.2 Calculated ICO-index for results from Contraloría del Estado (2017) in Appendix 3 on points
correlating to ID 1-6 in this project.
Zone (ID 2017) Parameter Y1 X 1 Y2 X2
Puente Cajón (ID 4) DO % 2.72 11.60
BOD5 (mg/L) 272 181.33
COD (mg/L) 453 45.3
Nitrates (mg/L) 17 2.50
Sum 240.73
ICO Punte Cajon 2017: 60.18
Puente Zofráco (ID 6) DO % 235.6 46.94
BOD5 (mg/L) 199 13.67
COD (mg/L) 649 64.9
Nitrates (mg/L) 20.6 2.82
Sum 247.33
ICO Zofraco 2017: 61.83
Puente Pico de Loro
(ID 14, 15)
DO % 41.00 4.89 5.40 10.97
BOD5 (mg/L) 217.00 144.67 104.00 69.33
COD (mg/L) 690.00 69.00 770.00 77.00
Nitrates (mg/L) 72.10 6.22 95.00 7.41
Sum 224.78 164.71
ICO P. Pico Loro 2017: 48.69
Entrada Mallcoranch (ID 17)
DO % 3 11.53
BOD5 (mg/L) 442 294.67
COD (mg/L) 1008 100.80
Nitrates (mg/L) 263 14.10
Sum 421.10
ICO E. Mallcorancho 2017: 105.27

64
Appendix 5: Documentation of Rocha River Documentation of river characteristics and field material.
Figure A. Storage for water samples during Figure B. River sediment at sampling point ID 1
fieldwork.
Figure C. River sediment at location ID 2 Figure D. River Restoration potential at ID 3

65
Figure E. The Rocha River at ID 6, showing banks that prevent flooding and solid waste deteriorating
Figure F, Sample containers (ID 1-4) for evaluation of pH and EC at C.A.S.A.