physical water treatment-cho - personal websites - office of
TRANSCRIPT

Drexel UniversityProf. Young I. Cho
April [email protected]
Physical water treatmentsin recirculating open cooling water system

2
The objective was to investigate
the efficiency of PWT technologies in preventing and controlling fouling
on heat transfer surfaces
in circulating open cooling-tower water systems.

3
Fouling Costs for Several Countries
0.154364New Zealand
0.15309463Australia
0.251,0002,500United Kingdom
0.251,9504,875Germany
0.254,00010,000Japan
0.255,67014,175United States
Fouling as % of
GNP
1992 GNP(billions U.S.
dollars)
Fouling in costs(million U.S.
dollars)
Country
Data from www.cpe.surrey.ac.uk/dptri/hms/fouling.htm

4
Objectives of the ASHARE research
To investigate the efficiency of physicalwater treatments (PWT)
1. To increase the cycle of concentration– water saving
2. To reduce fouling resistance – energy saving

5
Physical water treatment
• Permanent magnets• Solenoid coils • Electrostatic device• Catalytic alloys• Others
– (sudden pressure drop, vortex flows)

6
Permanent magnets
(Side view)
Flow
N S S N N S
(Cut view)

7
Solenoid-coils
Flow
Control Unit
Pulsating current
Solenoid coil

8
Electrostatic device
9
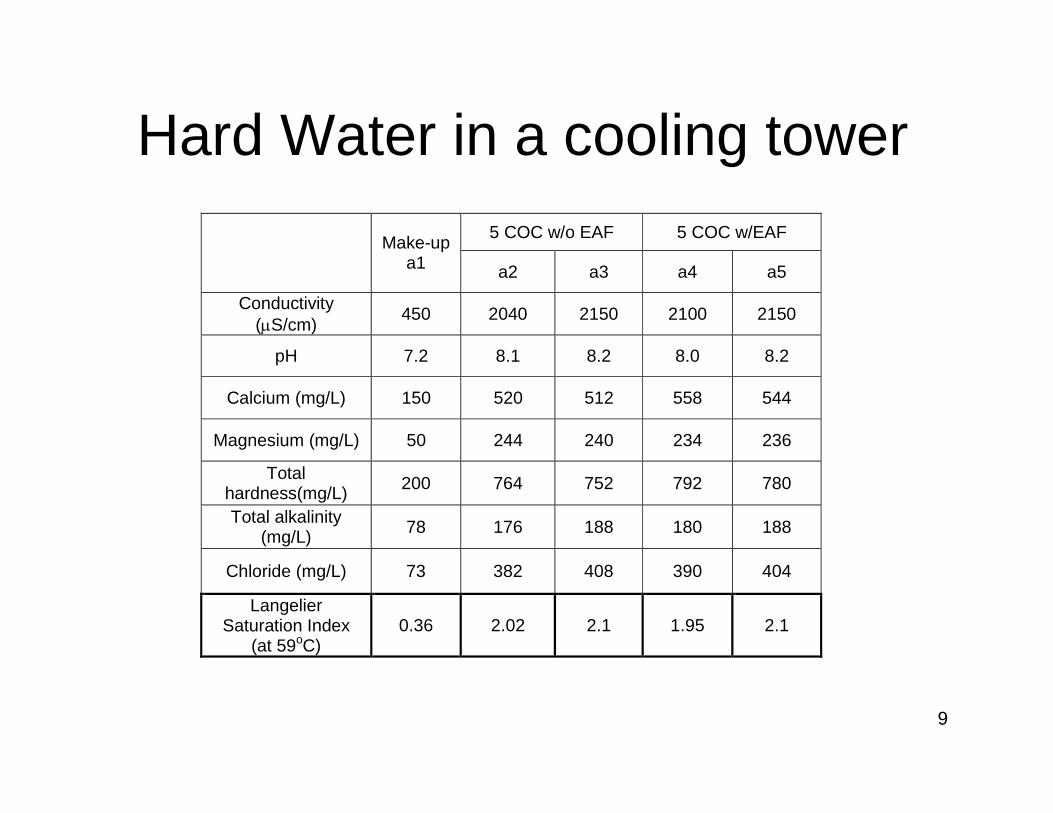
5 COC w/o EAF 5 COC w/EAF Make-up
a1 a2 a3 a4 a5
Conductivity (µS/cm) 450 2040 2150 2100 2150
pH 7.2 8.1 8.2 8.0 8.2
Calcium (mg/L) 150 520 512 558 544
Magnesium (mg/L) 50 244 240 234 236
Total hardness(mg/L) 200 764 752 792 780
Total alkalinity (mg/L) 78 176 188 180 188
Chloride (mg/L) 73 382 408 390 404
Langelier Saturation Index
(at 59oC) 0.36 2.02 2.1 1.95 2.1
Hard Water in a cooling tower
10
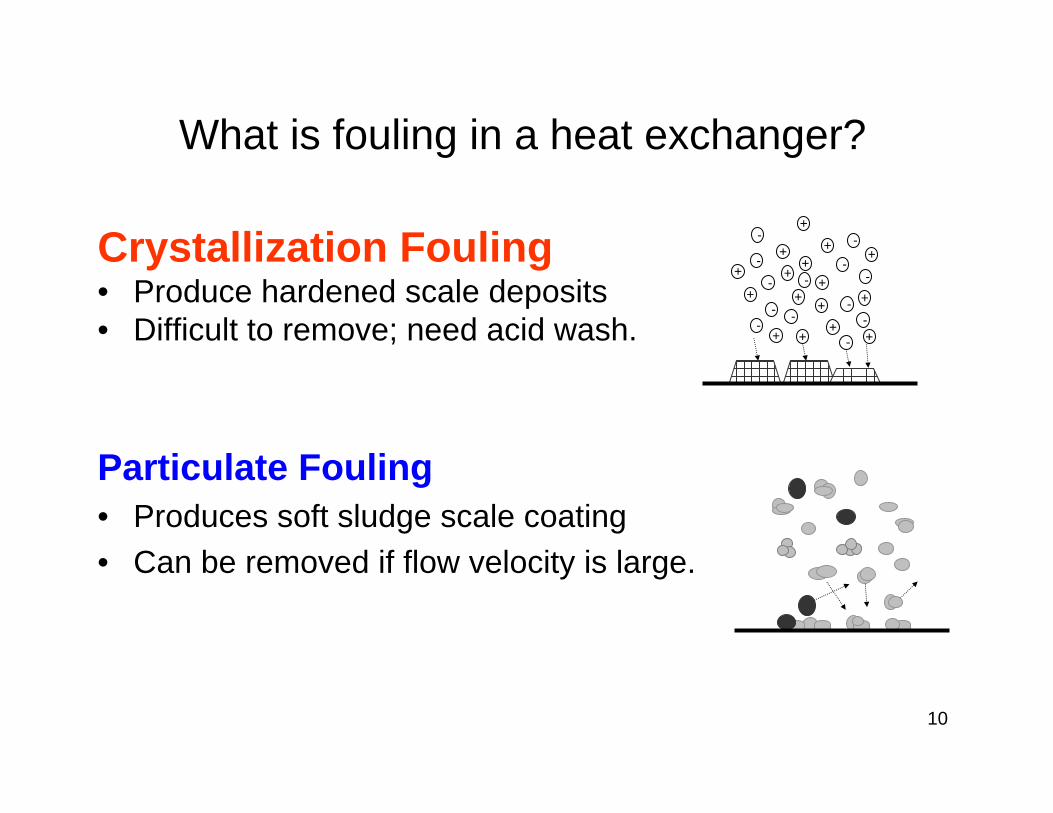
What is fouling in a heat exchanger?
Crystallization Fouling• Produce hardened scale deposits • Difficult to remove; need acid wash.
Particulate Fouling• Produces soft sludge scale coating • Can be removed if flow velocity is large.
+
-
+ -
+
-
+
-+
-+
-
+-
+
-
+
-
+-
++
+
-
++ -
+
-

11
Physics LawFouling in
Heat Exchanger
WaterChemistry
Challenges in physical water treatment

12
Proposed Mechanism of PWT for the Mitigation of Mineral Fouling
Bulk precipitation

13
Physical Laws behind PWT
• Permanent magnet - Lorentz force. E = V x B
• Solenoid coil - Faraday’s law:
E ds B dAt∂
⋅ = − ⋅∂∫ ∫
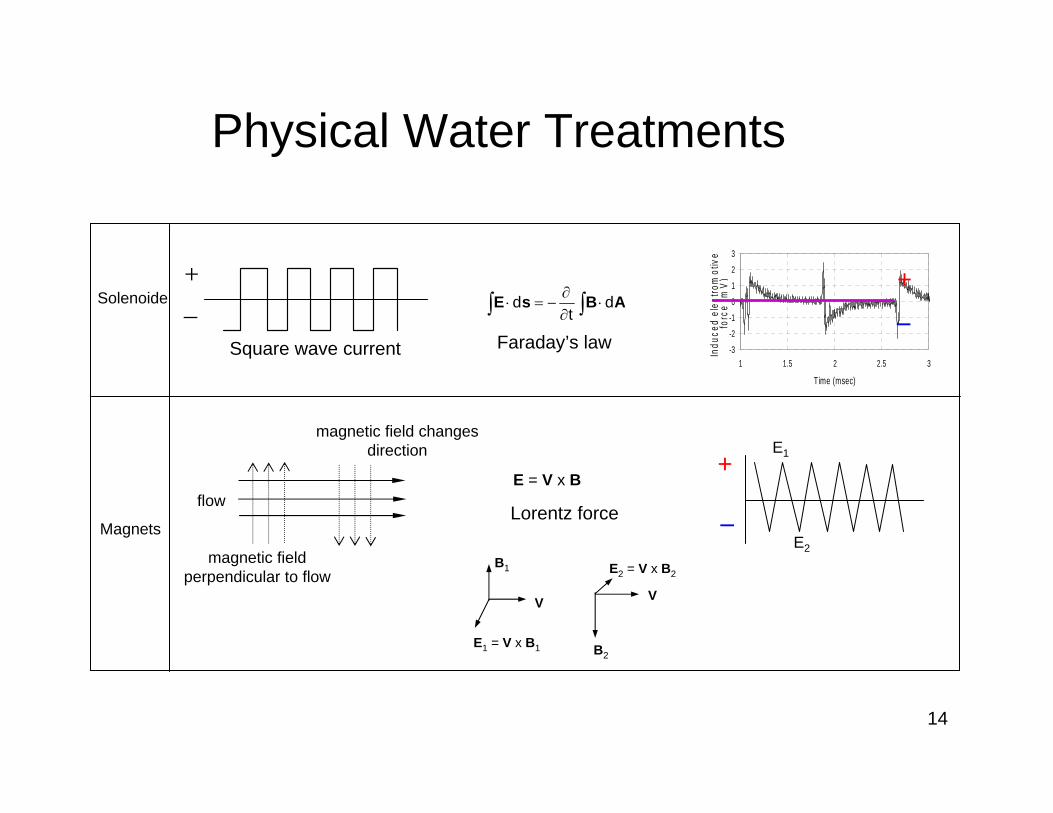
14
+–
Square wave current
∫∫ ⋅∂∂
−=⋅ ABsE dt
d
Faraday’s law
E = V x B
Lorentz force
-3
-2
-1
0
1
2
3
1 1.5 2 2.5 3
Time (msec)
Indu
ced
elec
trom
otiv
e fo
rce
(mV
)
B1
V
E1 = V x B1 B2
V
E2 = V x B2
flow
magnetic field perpendicular to flow
magnetic field changes direction E1
E2
+
–
Solenoide
Magnets
Physical Water Treatments
+–
15
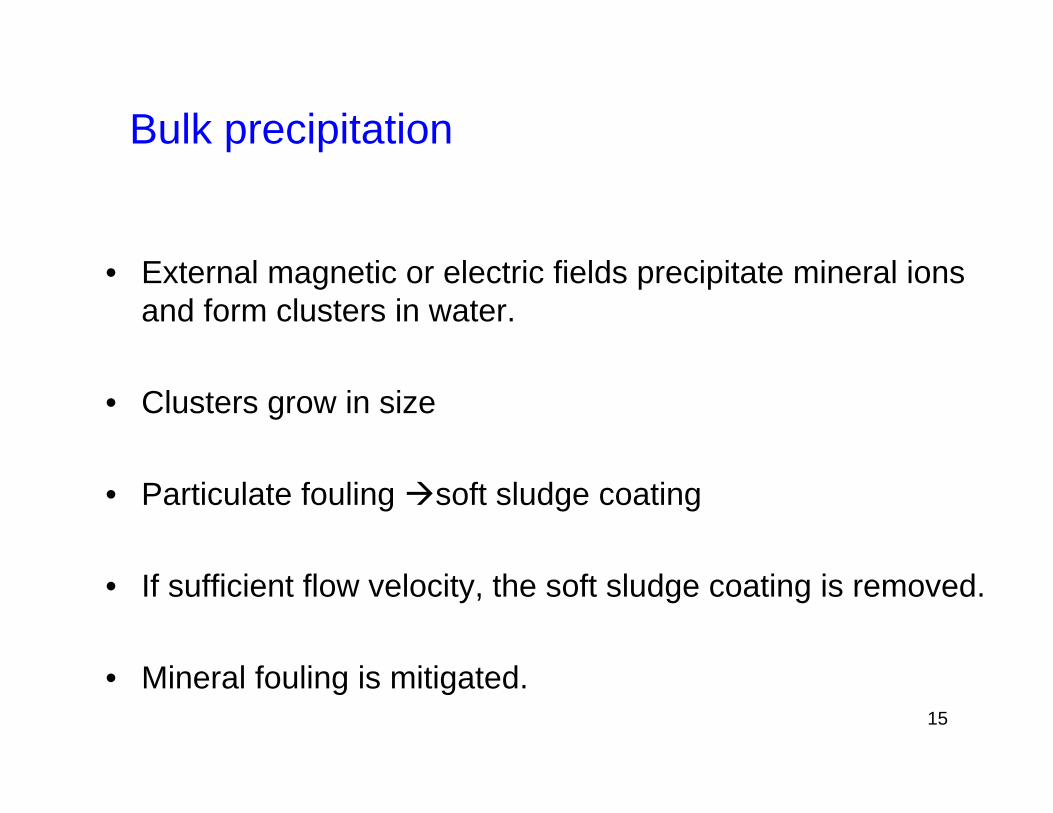
Bulk precipitation
• External magnetic or electric fields precipitate mineral ions and form clusters in water.
• Clusters grow in size
• Particulate fouling soft sludge coating
• If sufficient flow velocity, the soft sludge coating is removed.
• Mineral fouling is mitigated.

16
The scope of the research
All tests were conducted with a biocide.
Determination of fouling resistance
Investigation of scale characteristics
Water Analysis
time-dependent images
SEM
X-ray diffraction
historical behaviors
scale characteristics
LSITitration
Heat transfertest
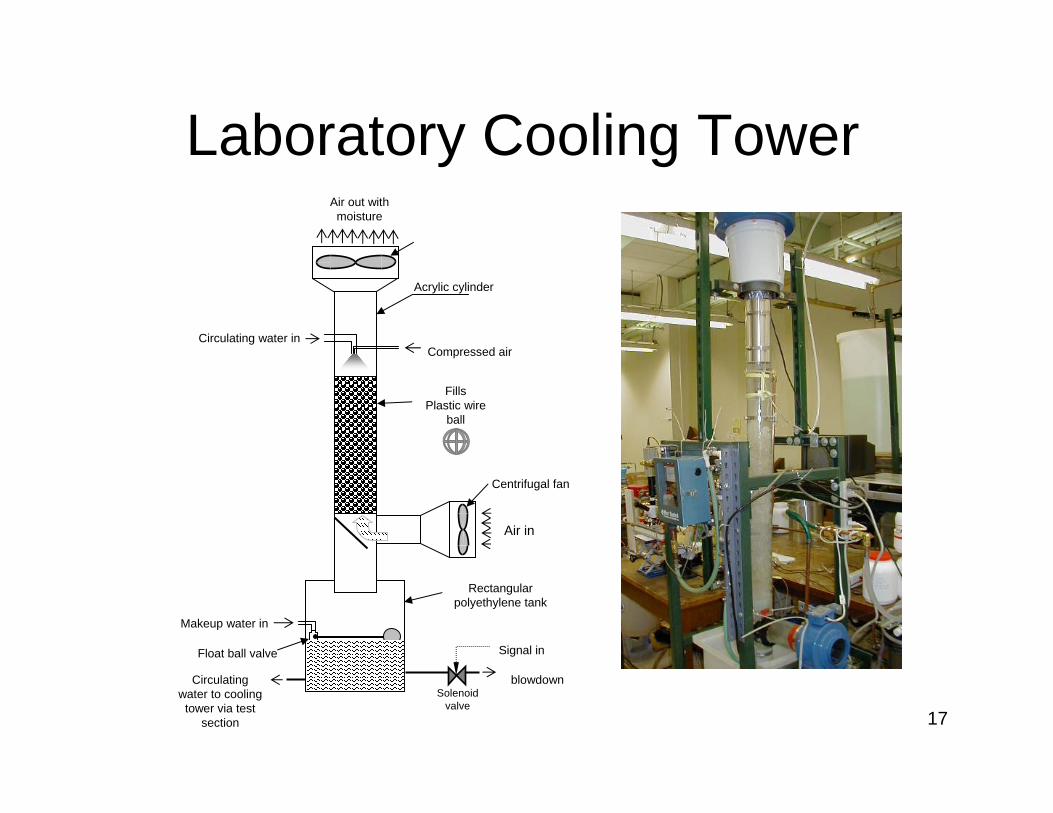
17
Acrylic cylinder
Compressed airCirculating water in
Circulating water to cooling tower via test
section
FillsPlastic wire
ball
Makeup water in
Air out with moisture
Solenoid valve
Float ball valve Signal in
Rectangular polyethylene tank
blowdown
Centrifugal fan
Air in
Laboratory Cooling Tower

18
Fouling Test Facility
Blowdown
Solenoid
Cooling tower
Make-up water
Microscope
Monitor & VCR
Hot side channel
24 kW water heater
Hot water to drain Hot water
Insulation
Copper plate
Circulating cooling water
Flow controller
Conductivitymeter
valve
Pump
flow
Air
Fan
Cold side channel
Floating valve
CCDcamera PumpPWT
device
Flow controller
HT test section: velocity = 1.2 - 1.5 m/s

19
Conductivity control and test procedure
Conductivity (µS/cm)
w/o PWT w/ PWTbefore test
410
1990
a1
a2 a3 a4 a5
Time
2990b2 b3 b4 b5
3990 c2 c3 c4 c5
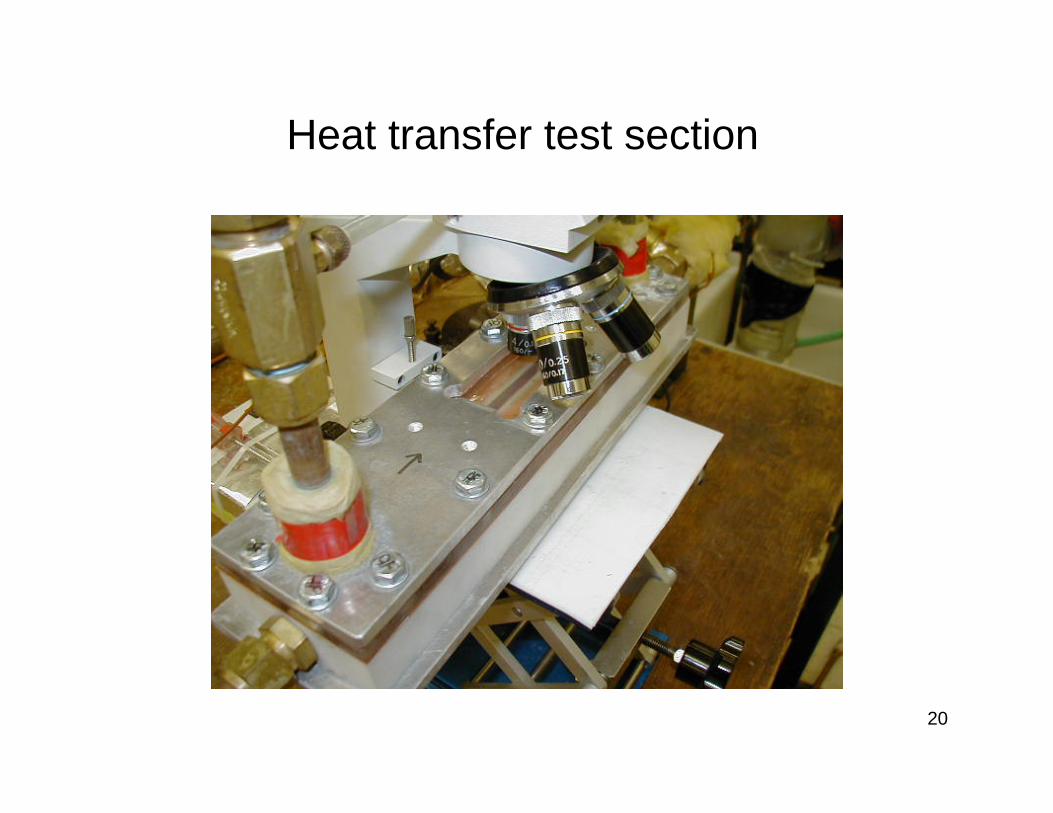
20
Heat transfer test section
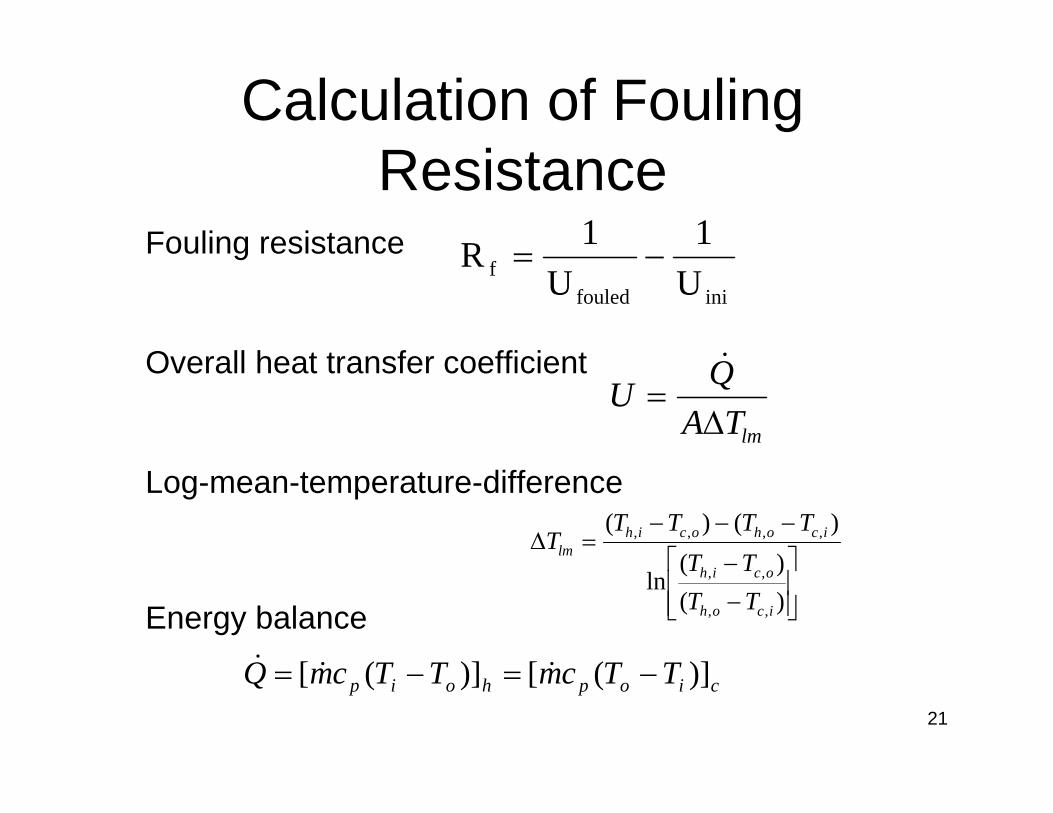
21
inifouledf U
1U
1R −=
ciophoip TTcmTTcmQ )]([)]([ −=−= &&&
⎥⎥⎦
⎤
⎢⎢⎣
⎡
−−
−−−=∆
)()(
ln
)()(
,,
,,
,,,,
icoh
ocih
icohocihlm
TTTT
TTTTT
lmTAQU∆
=&
Fouling resistance
Overall heat transfer coefficient
Log-mean-temperature-difference
Energy balance
Calculation of Fouling Resistance

Test Results with Permanent Magnets
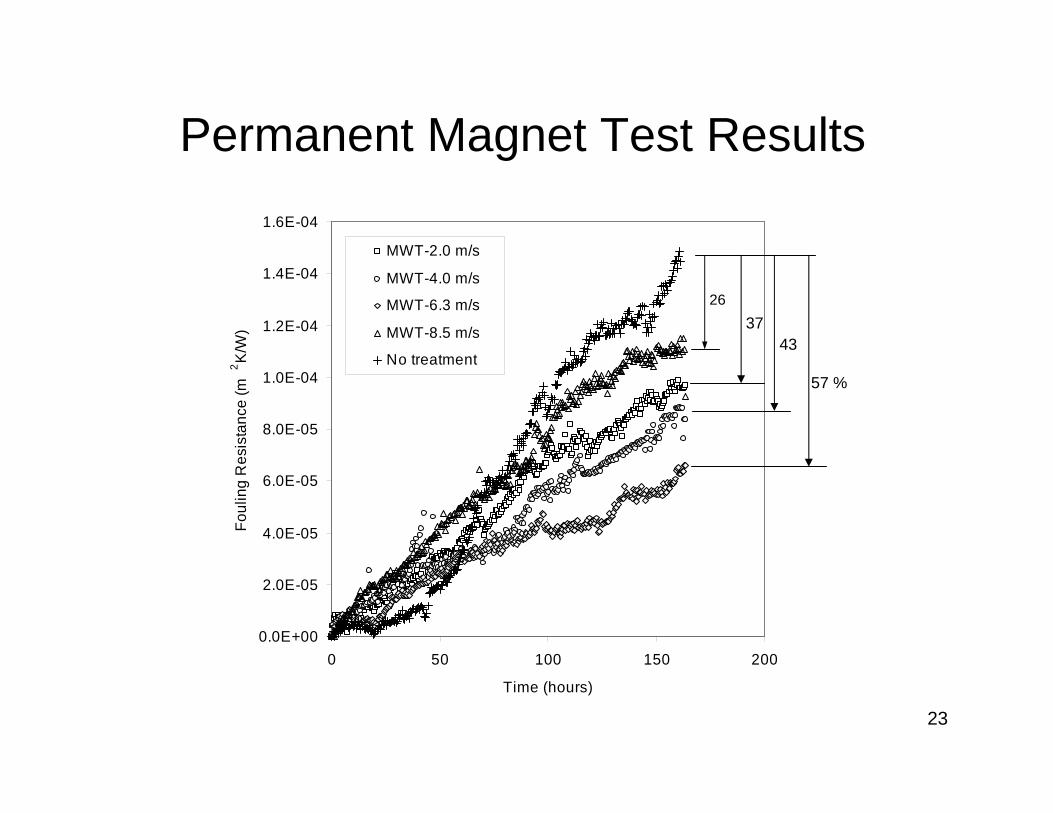
23
0.0E+00
2.0E-05
4.0E-05
6.0E-05
8.0E-05
1.0E-04
1.2E-04
1.4E-04
1.6E-04
0 50 100 150 200
Time (hours)
Foul
ing
Res
ista
nce
(m2 K
/W)
MWT-2.0 m/s
MWT-4.0 m/s
MWT-6.3 m/s
MWT-8.5 m/s
No treatment
2637
43
57 %
Permanent Magnet Test Results

24
Fouling resistance Rf (permanent magnet-1)
-2.0E-05
-1.0E-05
0.0E+00
1.0E-05
2.0E-05
3.0E-05
4.0E-05
5.0E-05
6.0E-05
0 50 100 150 200 250 300
Time (hour)
R f (m
2 K/W
)
No-treatmentPWT_V=2.3 m/sPWT_V=1.1 m/sPWT_V=1.7 m/sPWT_V=3.0 m/s
25
33
42
80%
(Side view)
Flow
N S S N N S
(Cut view)

25
Water quality data
2313.92015.15.7Silica, Total, as SiO2, ppm
0.60.90.90.61.2PO4, Ortho, as PO4
12213412612939Sodium, as Na, ppm
<0.05<0.05<0.05<0.05<0.05Iron, Total, as Fe, ppm
0.330.260.240.28<0.05Copper, Total, as Cu, ppm
24827128425858Magnesium, Total, as CaCO3, ppm
508581560565126Calcium, Total, as CaCO3, ppm
757853845824185Hardness, Total, as CaCO3, ppm
36941035638581Chloride, as Cl, ppm
23118431419554Sulfur, as SO4, ppm
19422918922870Alk, “M” as CaCO3, ppm
08.33.600Alk, “P” as CaCO3, ppm
1970203020101990525Sp Cond @ 25C, µmhos
8.48.38.48.37.7pH
PMSM V=3.0m/s
PMSM V=2.3m/s
PMSM V=1.7m/s
PMSM V=1.1m/s
MakeupBefore filtration

26
Percentage variations of Rf vs. flow velocity (through PM)
202530354045505560
0 2 4 6 8 10
Flow velocity (m/s)
Red
uctio
n of
foul
ing
resis
tanc
e (%
)
20
30
40
50
60
70
80
90
0 1 2 3 4
Flow velocity (m/s)
Red
uctio
n of
foul
ing
resis
tanc
e (%
)

27
Fouled surfaces after tests
No- treatment
Flow
Water Channel
PM-2.3 m/s PM-3.0 m/s
PM-1.7 m/s

28
SEM photographs: 3000x
No Treatment

29
SEM photographs: 3000x
PM-2.3 m/s

30
X-ray diffraction measurements of scale deposits
0
1000
2000
3000
4000
10 20 30 40 50 60 70 80 90Diffraction Angle, 2θ (deg.)
Inte
nsity
(cps
)
No treatment_2000No-treatment
0
1000
2000
3000
4000
10 20 30 40 50 60 70 80 90Diffraction Angle, 2θ (deg.)
Inte
nsity
(cps
)
PMD treatment_2000PWT – 2.3 m/s
0
1000
2000
3000
4000
10 20 30 40 50 60 70 80 90Diffraction Angle, 2 θ (deg.)
Inte
nsity
cps
)
Aragonite
Baseline
0
1000
2000
3000
4000
10 20 30 40 50 60 70 80 90
Inte
nsity
(cps
)
Calcite
Baseline
Diffraction Angle, 2θ (deg.)

31
COC effect (permanent magnets-2)
-2.0E-05
-1.0E-05
0.0E+00
1.0E-05
2.0E-05
3.0E-05
4.0E-05
5.0E-05
6.0E-05
7.0E-05
0 50 100 150 200 250 300
Time (hour)
Rf(
m2
K/W
)
84 %
2,000 µS/cm
-1.5E-05
-5.0E-06
5.0E-06
1.5E-05
2.5E-05
3.5E-05
4.5E-05
5.5E-05
6.5E-05
0 50 100 150 200 250
Time (hour)
Rf(
m2
K/W
) 57 %
3,000 µS/cm
40 %
-2.0E-05
-1.0E-05
0.0E+00
1.0E-05
2.0E-05
3.0E-05
4.0E-05
5.0E-05
6.0E-05
0 50 100 150 200 250
Time (hour)
Rf(
m2
K/W
)4,000 µS/cm
Flow
N S S N
N S S N

32
Need for multiple magnets: Rf vs. time
-2.0E-05
-1.0E-05
0.0E+00
1.0E-05
2.0E-05
3.0E-05
4.0E-05
5.0E-05
6.0E-05
7.0E-05
0 50 100 150 200 250 300
Time (hour)
Rf (
m2 K
/W)
No treatmentType II-AType II-B
84%
5%
2,000 µS/cm
(a) Type II-A
(b) Type II-B
N S
N S
N NS SN NS S
N NS SN NS S
Ring magnet
Permanent magnet-3

33
Effects of strength and frequency
-5.0E-05
0.0E+00
5.0E-05
1.0E-04
1.5E-04
2.0E-04
2.5E-04
3.0E-04
3.5E-04
4.0E-04
4.5E-04
0 50 100 150 200
Time (hour)
R f (m
2 K/W
)
SCED-0.7A,3.5 kHzSCED-7.0A,3.5 kHzSCED-0.7A,0.5 kHzNo-treatmentSCED-7.0A,0.5 kHz 33
20
53%
No-treatmentSCI-0.7A, 0.5kHzSCI-0.7A, 3.5kHzSCI-7.0A, 0.5kHzSCI-7.0A, 3.5kHz×
3,000 µS/cm
• Solenoid-coil device
Flow
Control Unit
Pulsating current
Solenoid coil

34
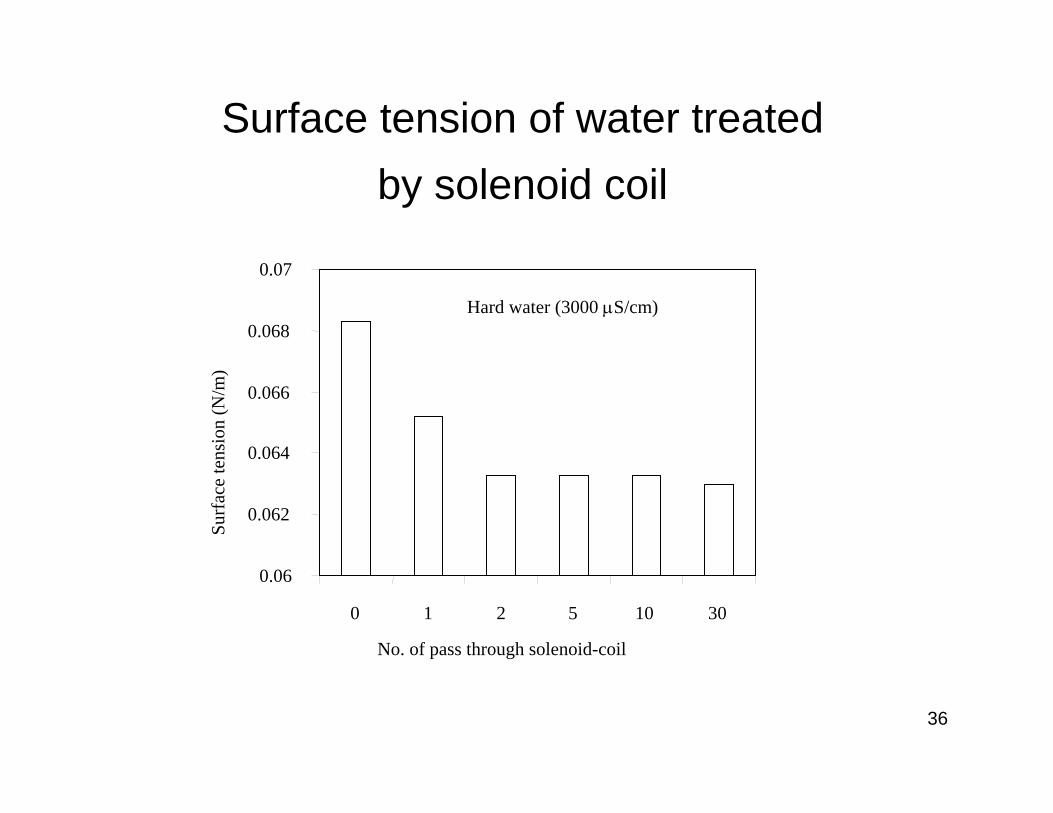
Why measure surface tension of water?
If PWT produces bulk precipitation, surface tension should decrease.
Results can be used as indirect support for the bulk precipitation hypothesis

35
Surface tension measurement method
Ruler
Water sample
Capillary tube
Positioning lift
36
Surface tension of water treated by solenoid coil
Hard water (3000 µS/cm)
0.06
0.062
0.064
0.066
0.068
0.07
0 1 2 5 10 30
No. of pass through solenoid-coil
Surf
ace
tens
ion
(N/m
)

37
Computer-controlledMicro-syringe pump
Water sample
Needle
Dye
Camera
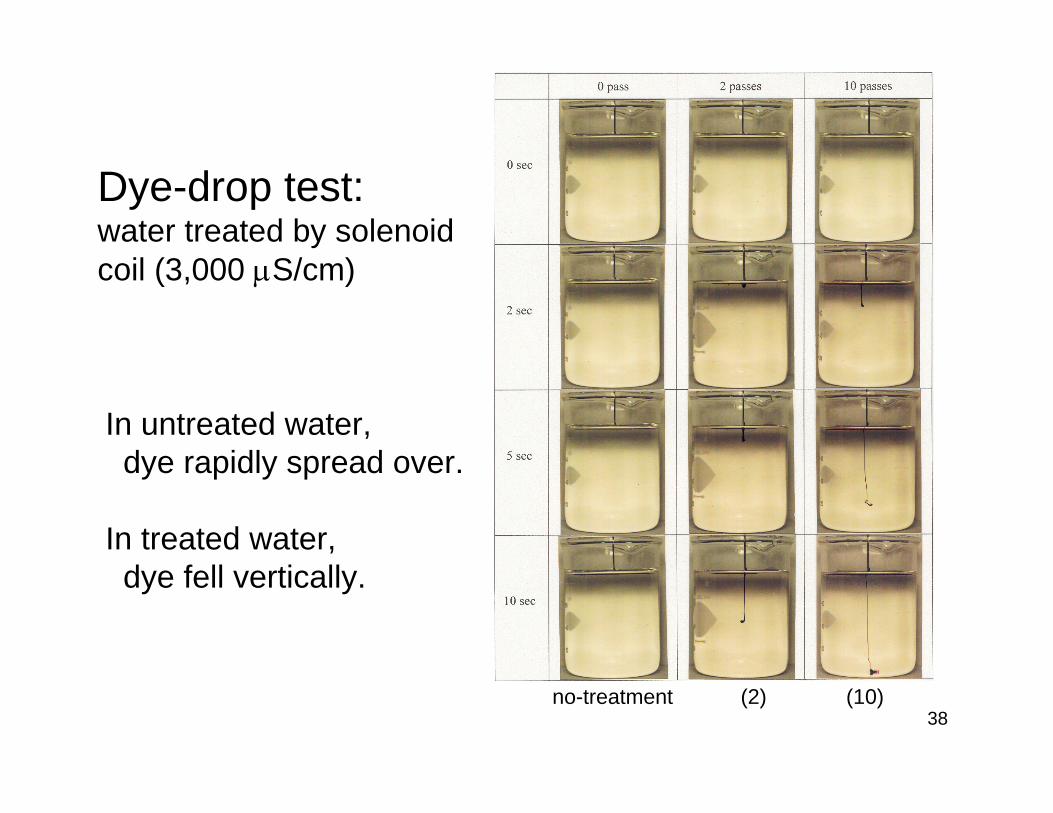
Dye-drop tests for surface tension effect
syringe
38
Dye-drop test: water treated by solenoid coil (3,000 µS/cm)
no-treatment (2) (10)
In untreated water, dye rapidly spread over.
In treated water,dye fell vertically.

39
Using Filtration Together With PWT
Using filtration together with descaling generates a synergetic effect.

40
Using Filtration Together With Descaling
100
200
300
400
500
600
700
Pre
ssur
e D
rop
(Pa)
0 4 8 12 16 20 24 28 32 36 40
Time (hr.)
No treatmentFilter only
EAFT+FilterEAFT only
Scientific validation was published in the International Journal of Heat and Mass Transfer.
No Treatment
Filtration Alone
Filtration Plus Descaling
Descaling Alone

41
Comprehensive Cooling Water Treatment Program
Chiller
Pump
Sump
Cooling Tower
PWT Unit
Biocontrol Unit
High Efficiency Filtration Unit
Side-stream Loop

42
Filtration for Particulate
Control
Mineral Fouling Control Bio-Control
System Monitoring &
Control
Water Treatment Program Areas

43
Conclusions
• Mechanism of physical water treatment (PWT).
– The PWT produces a bulk precipitation in water.
– As the solubility of treated water decreases inside HT equipment, the small seed particles grow in size, resulting in particulate fouling.
– If water flow can remove the soft sludge coating from HT equipment, then, the PWT can mitigate mineral fouling.

44
Remarks
Validation of your PWT device
The validating test service is available.