physical setting earth science - regents examinations · 2018-05-10 · ps/earth science ps/earth...
TRANSCRIPT

PS/EARTH SCIENCEPS/EARTH SCIENCE
The University of the State of New York
REGENTS HIGH SCHOOL EXAMINATION
PHYSICAL SETTING
EARTH SCIENCE
Wednesday, June 17, 2009 — 1:15 to 4:15 p.m., only
This is a test of your knowledge of Earth science. Use that knowledge to answerall questions in this examination. Some questions may require the use of the EarthScience Reference Tables. The Earth Science Reference Tables are supplied separately.Be certain you have a copy of the 2001 Edition (Revised November 2006) of thesereference tables before you begin the examination.
Your answer sheet for Part A and Part B–1 is the last page of this examinationbooklet. Turn to the last page and fold it along the perforations. Then, slowly andcarefully, tear off your answer sheet and fill in the heading.
The answers to the questions in Part B–2 and Part C are to be written in yourseparate answer booklet. Be sure to fill in the heading on the front of your answerbooklet.
You are to answer all questions in all parts of this examination according to thedirections provided in the examination booklet. Record your answers to the Part Aand Part B–1 multiple-choice questions on your separate answer sheet. Write youranswers to the Part B–2 and Part C questions in your answer booklet. All work shouldbe written in pen, except for graphs and drawings, which should be done in pencil.You may use scrap paper to work out the answers to the questions, but be sure torecord all your answers on your separate answer sheet and in your answer booklet.
When you have completed the examination, you must sign the statement printedat the end of your separate answer sheet, indicating that you had no unlawfulknowledge of the questions or answers prior to the examination and that you haveneither given nor received assistance in answering any of the questions during theexamination. Your answer sheet and answer booklet cannot be accepted if you fail tosign this declaration.
Notice. . .
A four-function or scientific calculator and a copy of the 2001 Earth Science Reference Tables(Revised November 2006) must be available for you to use while taking this examination.
The use of any communications device is strictly prohibited when taking thisexamination. If you use any communications device, no matter how briefly, yourexamination will be invalidated and no score will be calculated for you.
DO NOT OPEN THIS EXAMINATION BOOKLET UNTIL THE SIGNAL IS GIVEN.

Part A
Answer all questions in this part.
Directions (1–35): For each statement or question, write on your separate answer sheet the number of theword or expression that, of those given, best completes the statement or answers the question. Some questionsmay require the use of the Earth Science Reference Tables.
1 Evidence that the universe is expanding is bestprovided by the(1) red shift in the light from distant galaxies(2) change in the swing direction of a Foucault
pendulum on Earth(3) parallelism of Earth’s axis in orbit(4) spiral shape of the Milky Way Galaxy
2 Which object forms by the contraction of a largesphere of gases causing the nuclear fusion oflighter elements into heavier elements?(1) comet (3) star(2) planet (4) moon
3 In New York State, summer is warmer than winter because in summer New York State has(1) fewer hours of daylight and receives low-
angle insolation(2) fewer hours of daylight and receives high-
angle insolation(3) more hours of daylight and receives low-angle
insolation(4) more hours of daylight and receives high-
angle insolation
4 The diagram below shows an observer on Earthviewing the star Polaris.
What is this observer’s latitude?(1) 38° N (3) 52° N(2) 38° S (4) 52° S
5 The arrows in the diagram below represent themovement of water in the water cycle.
Which arrow represents the process of trans piration?(1) A (3) C(2) B (4) D
6 Which statement best describes the position ofthe Sun at sunrise and sunset as seen by anobserver in New York State on June 21?(1) The Sun rises north of due east and sets north
of due west.(2) The Sun rises south of due east and sets south
of due west.(3) The Sun rises north of due east and sets south
of due west.(4) The Sun rises south of due east and sets north
of due west.
7 On a cold winter day, the air temperature is 2°Cand the wet-bulb temperature is –1°C. What isthe relative humidity at this location?(1) 6% (3) 51%(2) 37% (4) 83%
A
C
D
B
Polaris
Horizon
Altitudeof 52°
P.S./E. Sci.–June ’09 [2]

P.S./E. Sci.–June ’09 [3] [OVER]
8 The bar graph below shows one planetary characteristic, identified as X, plotted for the planets of our solarsystem.
Which characteristic of the planets in our solar system is represented by X?(1) mass (3) eccentricity of orbit(2) density (4) period of rotation
9 Which graph best represents the general relationship between latitude and average surface temperature?
Planet Characteristic
0.30
0.25
0.20
0.15
0.10
0.05
0.00
Mer
cury
Earth
Venu
s
Mar
sJu
pite
r
Satur
nUra
nus
Neptu
ne
Planet
Ch
ara
cte
ris
tic
X
Avera
ge S
urf
ace
Tem
pera
ture
Latitude
( 1 ) ( 2 ) ( 3 ) ( 4 )
0° 90° N
Avera
ge S
urf
ace
Tem
pera
ture
Latitude0° 90° N
Avera
ge S
urf
ace
Tem
pera
ture
Latitude0° 90° N
Avera
ge S
urf
ace
Tem
pera
ture
Latitude0° 90° N

10 The diagram below shows a laboratory setup. The rubber band holds filter paper across the base of the opentube to hold the soil sample. The tube was placed in the water as shown. The upward movement of wateris represented by arrows. The height of the water that moved upward within the soil was measured.Students repeated this procedure using soils with different particle sizes. Results of the experiment areshown in the data table.
Data Table
Results of this experiment lead to the conclusion that(1) capillarity is greater in soils with larger particles (2) capillarity is greater in soils with smaller particles(3) permeability is greater in soils with larger particles(4) permeability is greater in soils with smaller particles
Rubber bandand filter paper
Soil
Water
Average Soil
Particle Diameter
(cm)
Height of Water
in Column
(cm)
0.006 30.0
0.2 8.0
1.0 0.5
P.S./E. Sci.–June ’09 [4]
11 When two tectonic plates collide, oceanic crustusually subducts beneath continental crustbecause oceanic crust is primarily composed ofigneous rock that has(1) low density and is mafic(2) low density and is felsic(3) high density and is mafic(4) high density and is felsic
12 New York State’s generalized landscape regionsare identified primarily on the basis of elevationand(1) bedrock structure (3) geologic age(2) climate zones (4) latitude

13 The data table below shows the origin depths ofall large-magnitude earthquakes over a 20-yearperiod.
Data Table
According to these data, most of these earthquakes occurred within Earth’s(1) lithosphere (3) stiffer mantle(2) asthenosphere (4) outer core
14 What is the largest sediment that can be transported by a stream that has a velocity of 125 cm/sec?(1) cobbles (3) sand(2) pebbles (4) clay
15 The photograph below shows a valley.
Which agent of erosion most likely produced thisvalley’s shape?(1) wave action (3) blowing wind(2) moving ice (4) flowing water
16 Deposition within a meandering stream usuallyoccurs on the inside of the curves because the(1) water velocity decreases(2) stream gradient increases(3) water is deeper(4) stream is narrower
17 The diagram below shows an outcrop of differentlayers of sandstone in a region receiving heavyrainfall.
Which sandstone layer appears to be the leastresistant to weathering?(1) A (3) C(2) B (4) D
18 Which process led to the formation of thick saltdeposits found in the bedrock at some locationsin New York State?(1) melting (3) condensation(2) runoff (4) evaporation
19 Oxygen is the most abundant element by volumein Earth’s(1) inner core (3) hydrosphere(2) troposphere (4) crust
20 Most insolation striking a smooth, light-colored,solid surface is(1) refracted (3) reflected(2) transmitted (4) absorbed
Sandstone A (quartz cement)
Sandstone B (calcite cement)
Sandstone C (hematite cement)
Sandstone D (quartz cement)
Depth Below
Surface
(km)
Number of
Earthquakes
0–330 27,788
34–100 17,585
101–300 7,329
301–700 3,167
P.S./E. Sci.–June ’09 [5] [OVER]
P.S./E. Sci.–June ’09 [6]
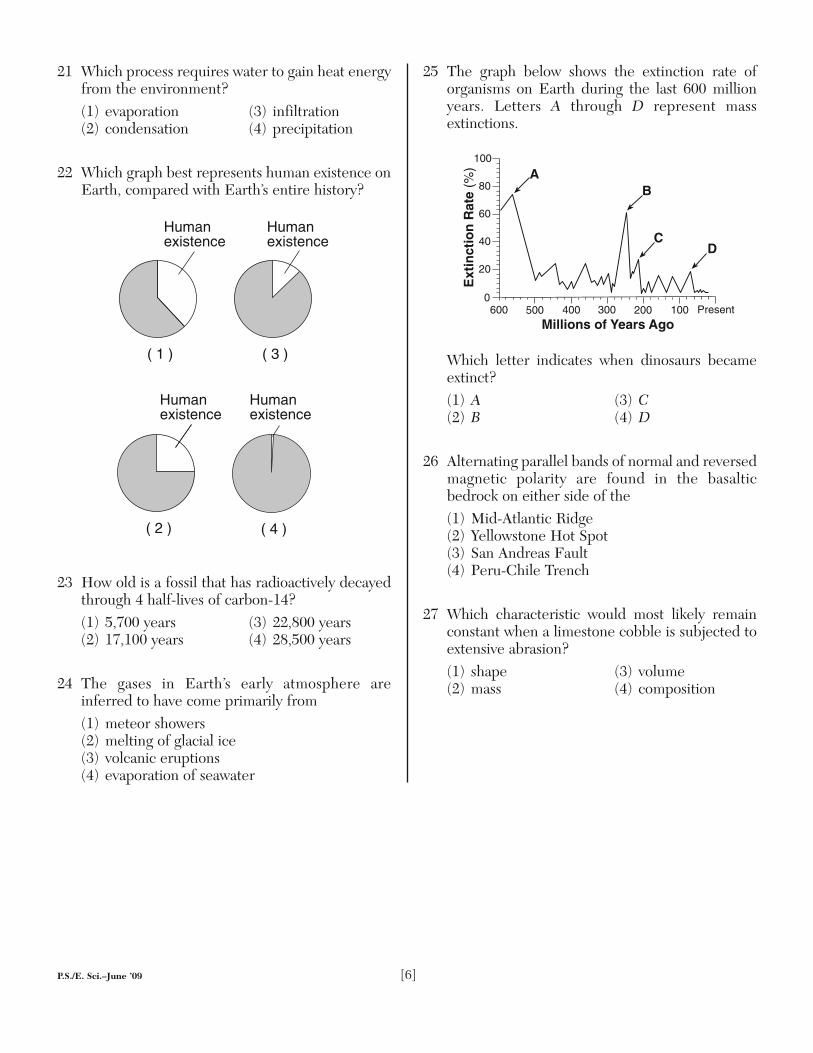
21 Which process requires water to gain heat energyfrom the environment?(1) evaporation (3) infiltration(2) condensation (4) precipitation
22 Which graph best represents human existence onEarth, compared with Earth’s entire history?
23 How old is a fossil that has radioactively decayedthrough 4 half-lives of carbon-14?(1) 5,700 years (3) 22,800 years(2) 17,100 years (4) 28,500 years
24 The gases in Earth’s early atmosphere areinferred to have come primarily from(1) meteor showers(2) melting of glacial ice(3) volcanic eruptions(4) evaporation of seawater
25 The graph below shows the extinction rate oforganisms on Earth during the last 600 millionyears. Letters A through D represent mass extinctions.
Which letter indicates when dinosaurs becameextinct?(1) A (3) C(2) B (4) D
26 Alternating parallel bands of normal and reversedmagnetic polarity are found in the basalticbedrock on either side of the (1) Mid-Atlantic Ridge(2) Yellowstone Hot Spot(3) San Andreas Fault(4) Peru-Chile Trench
27 Which characteristic would most likely remainconstant when a limestone cobble is subjected toextensive abrasion?(1) shape (3) volume(2) mass (4) composition
Millions of Years Ago
0
20
40
60
80
100
Present600 500 400 300 200 100
Ex
tin
cti
on
Ra
te (
%)
A
B
CD
( 3 )
Humanexistence
( 2 )
Humanexistence
( 1 )
Humanexistence
( 4 )
Humanexistence

Base your answers to questions 28 and 29 on the diagrams below. Diagram 1 is a drawing of a seafloor environment during the Carboniferous Period. Diagram 2 is a drawing of a Carboniferous swamp-forest environment. Two organisms are labeled A and B.
28 If the fish labeled A in diagram 1 are placoderms, the diagram represents conditionsduring which geologic epoch? (1) Early Mississippian (3) Early Pennsylvanian(2) Late Mississippian (4) Late Pennsylvanian
29 In which type of rock would fossils of organisms A and B most likely be found?(1) felsic igneous (3) clastic sedimentary(2) vesicular igneous (4) nonfoliated metamorphic
Diagram 1:Carboniferous Seafloor
Diagram 2:Carboniferous Swamp-Forest
A
B
Adapted from: Chet Raymo and Maureen Raymo,Written in Stone: A Geological History of the Northeastern United States,
Second Edition, Black Dome Press Corp., 2001
P.S./E. Sci.–June ’09 [7] [OVER]

30 According to the fossil record, which sequence correctly represents the evolution oflife on Earth?(1) fish → amphibians → mammals → soft-bodied organisms(2) fish → soft-bodied organisms → mammals → amphibians(3) soft-bodied organisms → amphibians → fish → mammals(4) soft-bodied organisms → fish → amphibians → mammals
31 The data table below compares the climates of two United States cities located atapproximately 43° north latitude. The data are based on a 30-year period.
Data Table
Which statement best explains the climate variation between these two cities?(1) City A and city B are located at the same longitude.(2) City A is located at a high elevation, and city B is located at sea level.(3) City A is located far inland, and city B is located near a large body of water.(4) City A is located on the east coast, and city B is located on the west coast.
32 The air above a burning candle is heated and rises. Which table correctly identifiesthe type of heat transfer within the rising air and the change in air density above theburning candle?
Location
Maximum
Temperature
(°F)
Minimum
Temperature
(°F)
Mean Annual
Precipitation
(in)
Mean Annual
Snowfall
(in)
city A 110 –36 23.8 31.9
city B 98 –19 38.2 92.9
P.S./E. Sci.–June ’09 [8]
Type of
Heat Transfer
Change in
Air Density
conduction density increases
Type of
Heat Transfer
Change in
Air Density
convection density increases
Type of
Heat Transfer
Change in
Air Density
conduction density decreases
Type of
Heat Transfer
Change in
Air Density
convection density decreases
( 1 ) ( 3 )
( 2 ) ( 4 )

33 The diagram below represents geological processes that act continuously on Earth to form different rocktypes.
Which table correctly classifies each rock type?
Rock type 1
Rock type 2 Rock type 3
A
BA
B
C
A Weathering and erosion,deposition and compaction
B Melting, followed by coolingand solidification
C Heat and pressure accompaniedby chemical activity
CProcesses
P.S./E. Sci.–June ’09 [9] [OVER]
Rock Type Classification
1 sedimentary
2 metamorphic
3 igneous
Rock Type Classification
1 metamorphic
2 igneous
3 sedimentary
Rock Type Classification
1 sedimentary
2 igneous
3 metamorphic
Rock Type Classification
1 igneous
2 metamorphic
3 sedimentary
( 1 ) ( 3 )
( 2 ) ( 4 )

34 The table below shows some properties of four different minerals.
The minerals listed in the table are varieties of which mineral?(1) garnet (3) quartz(2) magnetite (4) olivine
35 Adjacent water and landmasses are heated by the morning Sun on a clear, calm day.After a few hours, a surface wind develops. Which map best represents this wind’sdirection?
WaterLand
( 1 )
WaterLand
( 4 )
WaterLand
( 2 )
WaterLand
( 3 )
Mineral Variety Color Hardness Luster Composition
flint black 7 nonmetallic SiO2
chert gray, brown, or yellow 7 nonmetallic SiO2
jasper red 7 nonmetallic SiO2
chalcedony white or light color 7 nonmetallic SiO2
P.S./E. Sci.–June ’09 [10]

Part B–1
Answer all questions in this part.
Directions (36–50): For each statement or question, write on your separate answer sheet the number of theword or expression that, of those given, best completes the statement or answers the question. Some questionsmay require the use of the Earth Science Reference Tables.
Base your answers to questions 36 through 38 on the weather map below, which shows a low-pressure system over the eastern United States. Letters A through D represent weather stations.
36 Which station model correctly represents the barometric pressure at station A?
37 Which weather instrument was used to measure wind speed at station D?(1) barometer (3) psychrometer(2) thermometer (4) anemometer
38 Surface winds within this low-pressure system most likely are flowing(1) toward the center in a clockwise pattern(2) toward the center in a counterclockwise pattern(3) away from the center in a clockwise pattern(4) away from the center in a counterclockwise pattern
15091 17091 1015.0 mb91 1017.0 mb91
80
( 1 )
80
( 2 )
80
( 3 )
80
( 4 )
N
Low
A
B
C
D
1008
4565
80
7870
7565
1012
1016 91
1020
P.S./E. Sci.–June ’09 [11] [OVER]

Base your answers to questions 39 through 42 on the diagram below, which represents Earth in its orbitaround the Sun. The position of Earth on the first day of each season is labeled A, B, C, and D.
39 Which diagram correctly shows the directions of Earth’s revolution and rotation?
40 At which location are the Sun’s noontime rays perpendicular to Earth’s surface at theTropic of Cancer (23.5° N)?(1) A (3) C(2) B (4) D
( 1 ) ( 3 )
( 2 ) ( 4 )
N
N
N
N
A C
B
D
Sun
N
N
N
N
SunA C
B
D
N
N
N
N
SunA C
B
D
N
N
N
N
SunA C
B
D
N
N
N
N
A
D
(Not drawn to scale)
Sun C
B
P.S./E. Sci.–June ’09 [12]

41 What is the approximate rate of Earth’s revolution around the Sun?(1) 1° per day (3) 15° per day(2) 1° per year (4) 15° per year
42 Which event is caused by Earth’s revolution?(1) the apparent shift in the path of a Foucault pendulum(2) deflection of planetary winds to the right in the Northern Hemisphere(3) the apparent rising and setting of the Sun(4) different constellations observed in the night sky throughout the year
Base your answers to questions 43 and 44 on the map below, which shows locations A and B on Earth’s surface at the same distance from the ocean, at the same elevation above sea level, and at the same latitude.
43 Which statement best explains why location A has a cooler climate than location B?(1) Location A has a longer duration of insolation each day.(2) Location A is influenced by a cold ocean current.(3) Location B is farther from the equator.(4) Location B has less intense insolation each day.
44 There is a four-hour solar time difference between locations A and B. What is thedifference in longitude between locations A and B?(1) 15° (3) 45°(2) 23.5° (4) 60°
B
NorthAmerica
SouthAmerica
Africa
EuropeA
P.S./E. Sci.–June ’09 [13] [OVER]

Base your answers to questions 45 through 48 on the diagram below. The arrows show the direction inwhich sediment is being transported along the shoreline. A barrier beach has formed, creating a lagoon(a shallow body of water in which sediments are being deposited). The eroded headlands are composed of diorite bedrock. A groin has recently been constructed. Groins are wall-like structures built into the water perpendicular to the shoreline to trap beach sand.
45 The groin structure will change the pattern of deposition along the shoreline, initially causing the beach to become(1) wider on the western side of the groin (3) narrower on both sides of the groin(2) wider on the eastern side of the groin (4) wider on both sides of the groin
46 Which two minerals are most likely found in the beach sand that was eroded from the headlands?(1) quartz and olivine (3) potassium feldspar and biotite(2) plagioclase feldspar and amphibole (4) pyroxene and calcite
47 The sediments that have been deposited by streams flowing into the lagoon are mostlikely(1) sorted and layered (3) unsorted and layered(2) sorted and not layered (4) unsorted and not layered
48 Which event will most likely occur during a heavy rainfall?(1) Less sediment will be carried by the streams.(2) An increase in sea level will cause more sediments to be deposited along the
shoreline.(3) The shoreline will experience a greater range in tides.(4) The discharge from the streams into the lagoon will increase.
N
Wetlands
Lagoon
Ocean
Streams carryingsediments
Sedimentsdeposited inquiet water
Barrier beach
Sand depositedon beach and onseafloor
Groin
Beach
Erodedheadland
E
SW
P.S./E. Sci.–June ’09 [14]

Base your answers to questions 49 and 50 on the cross section below, which shows the paths of seismic wavestraveling from an earthquake epicenter through the different layers of Earth’s interior.
49 No P-waves or S-waves are received in the shadow zone because(1) P-waves are absorbed and S-waves are refracted by Earth’s outer core(2) P-waves are refracted and S-waves are absorbed by Earth’s outer core(3) both the P-waves and S-waves are refracted by Earth’s outer core(4) both the P-waves and S-waves are absorbed by Earth’s outer core
50 The distance from Albany, New York, to the epicenter of this earthquake is 5600 km. Approximately how much longer did it take for the S-wave to arrive at Albany thanthe P-wave?(1) 4 minutes and 20 seconds (3) 9 minutes and 0 seconds(2) 7 minutes and 10 seconds (4) 16 minutes and 10 seconds
Earthquake epicenter
P-waves and S -wavesreceived here
P-waves and S -wavesreceived here
Shadow zone —no waves received
P-waves, only,received here
Shadow zone —no waves received
P.S./E. Sci.–June ’09 [15] [OVER]

Part B–2
Answer all questions in this part.
Directions (51–65): Record your answers in the spaces provided in your answer booklet. Some questionsmay require the use of the Earth Science Reference Tables.
Base your answers to questions 51 through 53 on the passage below.
Is Earth Gaining Weight?
Scientists believe that Earth may gain more than 100 tons of dust from space everyday. The dust comes from thawing comets as they orbit the Sun and from pieces ofasteroids that collided with other asteroids. Most asteroids orbit the Sun between Marsand Jupiter. Each dust particle dates back to the days when our solar system was created. So in a way, each tiny speck of dust holds clues to how our solar systemformed.
All the space dust produced by comets and asteroids in our solar system is drawnto the Sun by its gravitational force. However, space dust that passes within about 60 miles of Earth’s surface may be slowed enough by friction with Earth’s atmosphereto be pulled to the surface by Earth’s gravity.
51 State one reason why more space dust is attracted to the Sun than to Earth. [1]
52 In which temperature zone of Earth’s atmosphere is space dust first slowed enoughby friction to be pulled to Earth’s surface? [1]
53 Approximately how many million kilometers from the Sun are most asteroids located? [1]
P.S./E. Sci.–June ’09 [16]
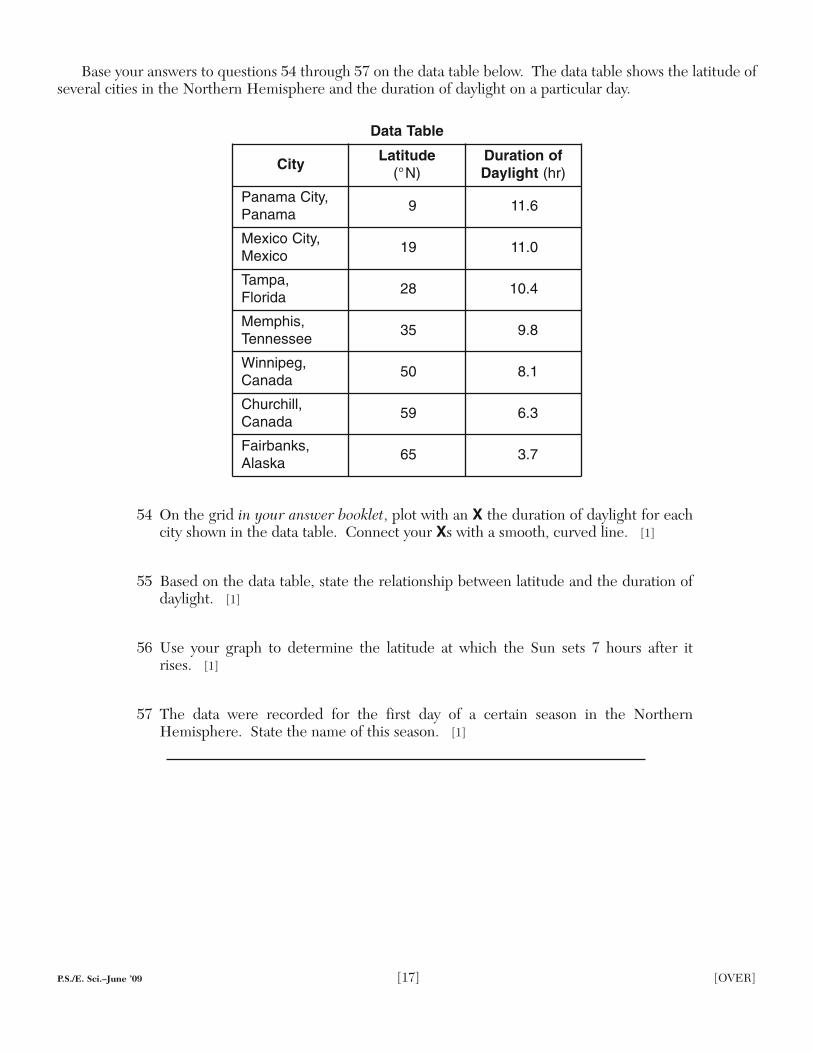
Base your answers to questions 54 through 57 on the data table below. The data table shows the latitude ofseveral cities in the Northern Hemisphere and the duration of daylight on a particular day.
Data Table
54 On the grid in your answer booklet, plot with an X the duration of daylight for eachcity shown in the data table. Connect your Xs with a smooth, curved line. [1]
55 Based on the data table, state the relationship between latitude and the duration ofdaylight. [1]
56 Use your graph to determine the latitude at which the Sun sets 7 hours after it rises. [1]
57 The data were recorded for the first day of a certain season in the NorthernHemisphere. State the name of this season. [1]
CityLatitude
(°N)Duration of
Daylight (hr)
Panama City,Panama
9 11.6
Mexico City,Mexico
19 11.0
Tampa,Florida
28 10.4
Memphis,Tennessee
35 9.8
Winnipeg,Canada
50 8.1
Churchill,Canada
59 6.3
Fairbanks,Alaska
65 3.7
P.S./E. Sci.–June ’09 [17] [OVER]

Base your answers to questions 58 through 60 on the cross sections below, which show widely separated outcrops labeled I, II, and III. Index fossils are found in some of the rock layers in the three outcrops. In outcrop III, layers A, B, C, and D are labeled. Line XY represents an unconformity. Line GH represents a fault.
58 Describe one characteristic necessary for a fossil to be classified as an index fossil. [1]
59 On outcrop II in your answer booklet, place the symbol for an unconformitybetween the two rock layers where the Silurian-age bedrock has been removed by erosion. [1]
60 List in order, from oldest to youngest, the relative age of the four rock layers, A, B, C,and D, fault GH, and unconformity XY shown in outcrop III. [1]
SurfaceOutcrop I
Outcrop IISurface
Outcrop IIISurface
A
B
C
D H
YXG
P.S./E. Sci.–June ’09 [18]

Base your answers to questions 61 through 63 on the diagram below, which shows the Moon at positions A through H in its orbit around Earth.
61 Which letters represent the two positions of the Moon when the least differencebetween the levels of high and low ocean tides occur on Earth? [1]
62 How many days does it take for the Moon to complete one cycle of phases as viewedfrom Earth? [1]
63 At which Moon position could a lunar eclipse occur? [1]
Base your answers to questions 64 and 65 on the Luminosity and Temperature of Stars graph in the EarthScience Reference Tables.
64 Describe the relationship between temperature and luminosity of main sequencestars. [1]
65 In which group of stars would a star with a temperature of 5000°C and a luminosityof approximately 100 times that of the Sun be classified? [1]
Sun’sraysE
G
C
Earth
D
F H
B
NorthPole A
(Not drawn to scale)
P.S./E. Sci.–June ’09 [19] [OVER]

Part C
Answer all questions in this part.
Directions (66–85): Record your answers in the spaces provided in your answer booklet. Some questionsmay require the use of the Earth Science Reference Tables.
Base your answers to questions 66 through 68 on the diagram below, which shows air masses, clouds, andrain associated with two fronts that are influencing weather conditions in New York State. Letters A, B, and Crepresent three air masses. The arrows show the direction of air and front movements.
66 Identify the most likely geographic source region for air mass B. [1]
67 Identify the type of front shown between air mass B and air mass C. [1]
68 Identify one process that causes clouds to form in the air rising along the frontal surface between air mass A and air mass B. [1]
Warm, moistair mass
A
Cool, dryair mass
Cold, dryair mass
Heavyrain
Lightrain
B
C
Frontmovement
Frontmovement
P.S./E. Sci.–June ’09 [20]

Base your answers to questions 69 through 72 on the topographic map below, which shows a small island inan ocean. Points A, B, C, and D represent surface locations on the island. The symbol 134 represents an elevation on the hilltop. Elevations are measured in feet and distances are measured in miles.
69 On the grid in your answer booklet, construct a profile along line AB by plotting an Xfor the elevation of each contour line that crosses line AB. Connect the Xs with asmooth, curved line to complete the profile. [1]
70 Calculate the gradient of Mud Creek between points C and D and label your answerwith the correct units. [1]
71 State the compass direction toward which Mud Creek flows. [1]
72 Explain how the contour lines on the map indicate that the north side of the islandhas the steepest slope. [1]
0 1 2 3 4 5 6 mi
Ocean
134
100
A
D
C
B
Contour interval = 20 feet
N
Mud C
reek
P.S./E. Sci.–June ’09 [21] [OVER]

Base your answers to questions 73 through 76 on the diagram below, which shows the heliocentric model ofa part of our solar system. The planets closest to the Sun are shown. Point B is a location on Earth’s equator.
73 State the name of planet A. [1]
74 Explain why location B experiences both day and night in a 24-hour period. [1]
75 On the graph in your answer booklet, draw a line to show the general relationshipbetween a planet’s distance from the Sun and the planet’s period of revolution. [1]
76 Identify one feature of the geocentric model of our solar system that differs from theheliocentric model shown. [1]
Planet A
Planet
Earth
(Not drawn to scale)
Sun
Planet
Planet
B
P.S./E. Sci.–June ’09 [22]
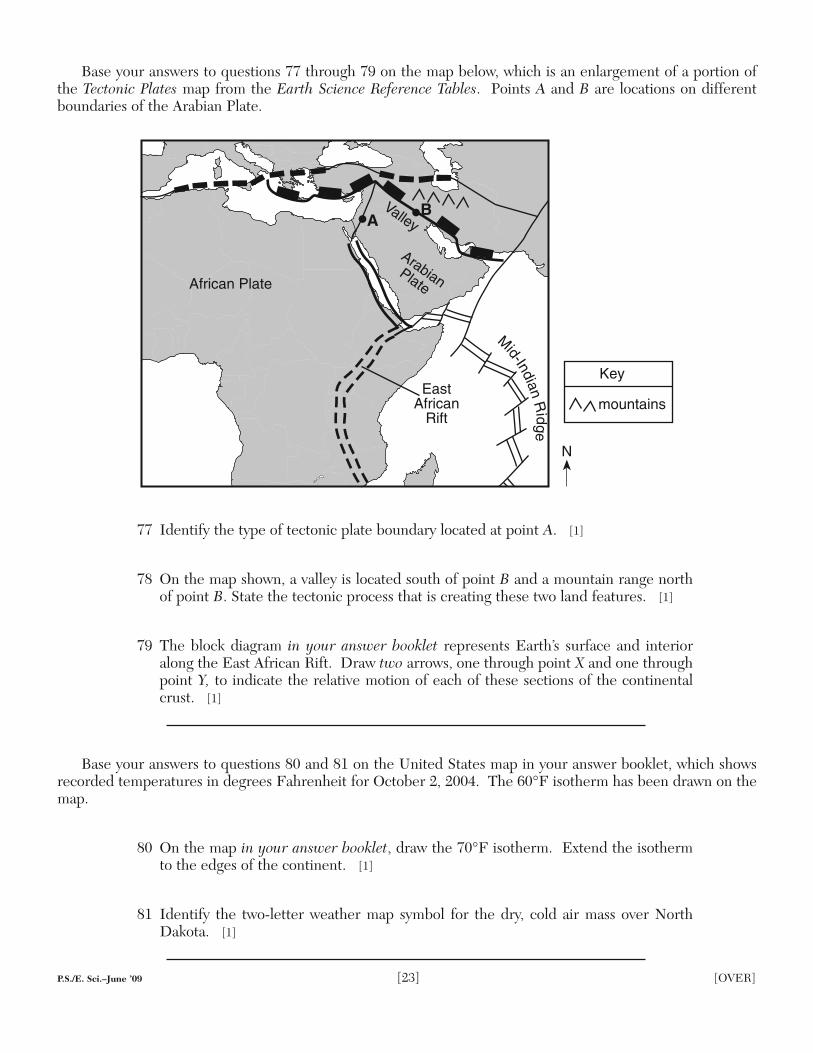
Base your answers to questions 77 through 79 on the map below, which is an enlargement of a portion ofthe Tectonic Plates map from the Earth Science Reference Tables. Points A and B are locations on differentboundaries of the Arabian Plate.
77 Identify the type of tectonic plate boundary located at point A. [1]
78 On the map shown, a valley is located south of point B and a mountain range northof point B. State the tectonic process that is creating these two land features. [1]
79 The block diagram in your answer booklet represents Earth’s surface and interioralong the East African Rift. Draw two arrows, one through point X and one throughpoint Y, to indicate the relative motion of each of these sections of the continentalcrust. [1]
Base your answers to questions 80 and 81 on the United States map in your answer booklet, which showsrecorded temperatures in degrees Fahrenheit for October 2, 2004. The 60°F isotherm has been drawn on themap.
80 On the map in your answer booklet, draw the 70°F isotherm. Extend the isothermto the edges of the continent. [1]
81 Identify the two-letter weather map symbol for the dry, cold air mass over NorthDakota. [1]
ArabianPlate
ValleyA
EastAfrican
Rift
Mid-IndianR
idge
B
African Plate
N
mountains
Key
P.S./E. Sci.–June ’09 [23] [OVER]

P.S./E. Sci.–June ’09 [24]
Base your answers to questions 82 through 85 on the passage below.
Asbestos
Asbestos is a general name given to the fibrous varieties of six naturally occurringminerals used in commercial products. Most asbestos minerals are no longer mineddue to the discovery during the 1970s that long-term exposure to high concentrationsof their long, stiff fibers leads to health problems. Workers who produce or handleasbestos products are most at risk, since inhaling high concentrations of airborne fibersallows the asbestos particles to become trapped in the workers’ lungs. Chrysotile is avariety of asbestos that is still mined because it has short, soft, flexible fibers that donot pose the same health threat.
82 State one reason for the decline in global asbestos use after 1980. [1]
83 Chrysotile is found with other minerals in New York State mines located near 44° 30' N, 74° W. In which New York State landscape region are these mines located? [1]
84 What determines the physical properties of minerals, such as the long, stiff fibers ofsome varieties of asbestos? [1]
85 The chemical formula for chrysotile is Mg3Si2O5(OH)4. State the name of themineral found on the Earth Science Reference Tables that is most similar in chemicalcomposition. [1]


The University of the State of New York
REGENTS HIGH SCHOOL EXAMINATION
PHYSICAL SETTING
EARTH SCIENCE
Wednesday, June 17, 2009 — 1:15 to 4:15 p.m., only
ANSWER SHEET
Student . . . . . . . . . . . . . . . . . . . . . . . . . . . . . . . . . . . . . . . . . . . . . . . Sex: � Male � Female Grade . . . . . . . . . . . .
Teacher . . . . . . . . . . . . . . . . . . . . . . . . . . . . . . . . . . . . . . . . . . . . . . . School . . . . . . . . . . . . . . . . . . . . . . . . . . . . . . . . . . . .
Record your answers to Part A and Part B–1 on this answer sheet.
Write your answers to Part B–2 and Part C in your answer booklet.
The declaration below must be signed when you have completed the examination.
I do hereby affirm, at the close of this examination, that I had no unlawful knowledge of the questions or answers prior tothe examination and that I have neither given nor received assistance in answering any of the questions during the examination.
Signature
Tear
Her
eTe
ar H
ere
Part A
1 . . . . . . . . . . . . 13 . . . . . . . . . . . . 25 . . . . . . . . . . .
2 . . . . . . . . . . . . 14 . . . . . . . . . . . . 26 . . . . . . . . . . .
3 . . . . . . . . . . . . 15 . . . . . . . . . . . . 27 . . . . . . . . . . .
4 . . . . . . . . . . . . 16 . . . . . . . . . . . . 28 . . . . . . . . . . .
5 . . . . . . . . . . . . 17 . . . . . . . . . . . . 29 . . . . . . . . . . .
6 . . . . . . . . . . . . 18 . . . . . . . . . . . . 30 . . . . . . . . . . .
7 . . . . . . . . . . . . 19 . . . . . . . . . . . . 31 . . . . . . . . . . .
8 . . . . . . . . . . . . 20 . . . . . . . . . . . . 32 . . . . . . . . . . .
9 . . . . . . . . . . . . 21 . . . . . . . . . . . . 33 . . . . . . . . . . .
10 . . . . . . . . . . . . 22 . . . . . . . . . . . . 34 . . . . . . . . . . .
11 . . . . . . . . . . . . 23 . . . . . . . . . . . . 35 . . . . . . . . . . .
12 . . . . . . . . . . . . 24 . . . . . . . . . . . .
Part B–1
36 . . . . . . . . . . . . 44 . . . . . . . . . . . .
37 . . . . . . . . . . . . 45 . . . . . . . . . . . .
38 . . . . . . . . . . . . 46 . . . . . . . . . . . .
39 . . . . . . . . . . . . 47 . . . . . . . . . . . .
40 . . . . . . . . . . . . 48 . . . . . . . . . . . .
41 . . . . . . . . . . . . 49 . . . . . . . . . . . .
42 . . . . . . . . . . . . 50 . . . . . . . . . . . .
43 . . . . . . . . . . . .
Part A Score
Part B–1 Score

Tear Here
Tear Here
PS/EARTH SCIENCEPS/EARTH SCIENCE