physical setting earth science - ms. kline … university of the state of new york regents high...
TRANSCRIPT
The University of the State of New York
REGENTS HIGH SCHOOL EXAMINATION
PHYSICAL SETTINGEARTH SCIENCE
Wednesday, January 29, 2014 — 1:15 to 4:15 p.m., only
Use your knowledge of Earth science to answer all questions in this examination.Before you begin this examination, you must be provided with the 2011 Edition Reference Tables for Physical Setting/Earth Science. You will need thesereference tables to answer some of the questions.
You are to answer all questions in all parts of this examination. You may use scrappaper to work out the answers to the questions, but be sure to record your answerson your answer sheet and in your answer booklet. A separate answer sheet for Part Aand Part B–1 has been provided to you. Follow the instructions from the proctor forcompleting the student information on your answer sheet. Record your answers to thePart A and Part B–1 multiple-choice questions on this separate answer sheet. Recordyour answers for the questions in Part B–2 and Part C in your separate answerbooklet. Be sure to fill in the heading on the front of your answer booklet.
All answers in your answer booklet should be written in pen, except for graphs anddrawings, which should be done in pencil.
When you have completed the examination, you must sign the declaration printedon your separate answer sheet, indicating that you had no unlawful knowledge of thequestions or answers prior to the examination and that you have neither given norreceived assistance in answering any of the questions during the examination. Youranswer sheet and answer booklet cannot be accepted if you fail to sign thisdeclaration.
DO NOT OPEN THIS EXAMINATION BOOKLET UNTIL THE SIGNAL IS GIVEN.
Notice . . .
A four-function or scientific calculator and a copy of the 2011 Edition Reference Tables forPhysical Setting/Earth Science must be available for you to use while taking this examination.
The possession or use of any communications device is strictly prohibited when taking this examination. If you have or use any communications device, no matter how briefly, your examination will be invalidated and no score will be calculated for you.
P.S./EARTH SCIENCE
P.S./EARTH SCIENCE

P.S./E. Sci.–Jan. ’14 [2]
1 At a location in the Northern Hemisphere, acamera was placed outside at night with the lenspointing straight up. The shutter was left openfor four hours, resulting in the star trails shownbelow.
At which latitude were these star trailsobserved?(1) 1° N (3) 60° N(2) 30° N (4) 90° N
2 Why are some constellations visible to New YorkState observers at midnight during April, but notvisible at midnight during October?(1) Constellations move within our galaxy.(2) Constellations have elliptical orbits.(3) Earth revolves around the Sun.(4) Earth rotates on its axis.
3 A red shift in the light from very distant galaxiessuggests that the universe is(1) fixed and stationary (3) contracting(2) moving randomly (4) expanding
4 Which motion causes the Coriolis effect onEarth?(1) revolution of Earth around the Sun(2) revolution of the Moon around Earth(3) rotation of Earth on its axis(4) rotation of the Moon on its axis
5 When water vapor condenses, how much heatenergy will be released into the atmosphere?(1) 2260 joules/gram (3) 4.18 joules/gram(2) 334 joules/gram (4) 2.11 joules/gram
6 Liquid water sometimes turns into ice when itcomes in contact with Earth’s surface. Whichpresent weather symbol on a station model represents this type of precipitation?
7 A weather station model is shown below.
Which information shown on the station modelis most closely associated with measurementsfrom an anemometer?
25
( 1 )
998
( 2 ) ( 3 ) ( 4 )
25 998
23
( 1 ) ( 2 ) ( 3 ) ( 4 )
Part A
Answer all questions in this part.
Directions (1–35): For each statement or question, choose the word or expression that, of those given, bestcompletes the statement or answers the question. Some questions may require the use of the 2011 EditionReference Tables for Physical Setting/Earth Science. Record your answers on your separate answer sheet.
P.S./E. Sci.–Jan. ’14 [3] [OVER]
8 A dry-bulb temperature of 30°C and a wet-bulbtemperature of 29°C were recorded at a weatherstation. What are the relative humidity and themost likely weather conditions?(1) Relative humidity is 29% with clear skies.(2) Relative humidity is 29% with a good chance
of snow.(3) Relative humidity is 93% with clear skies.(4) Relative humidity is 93% with a good chance
of rain.
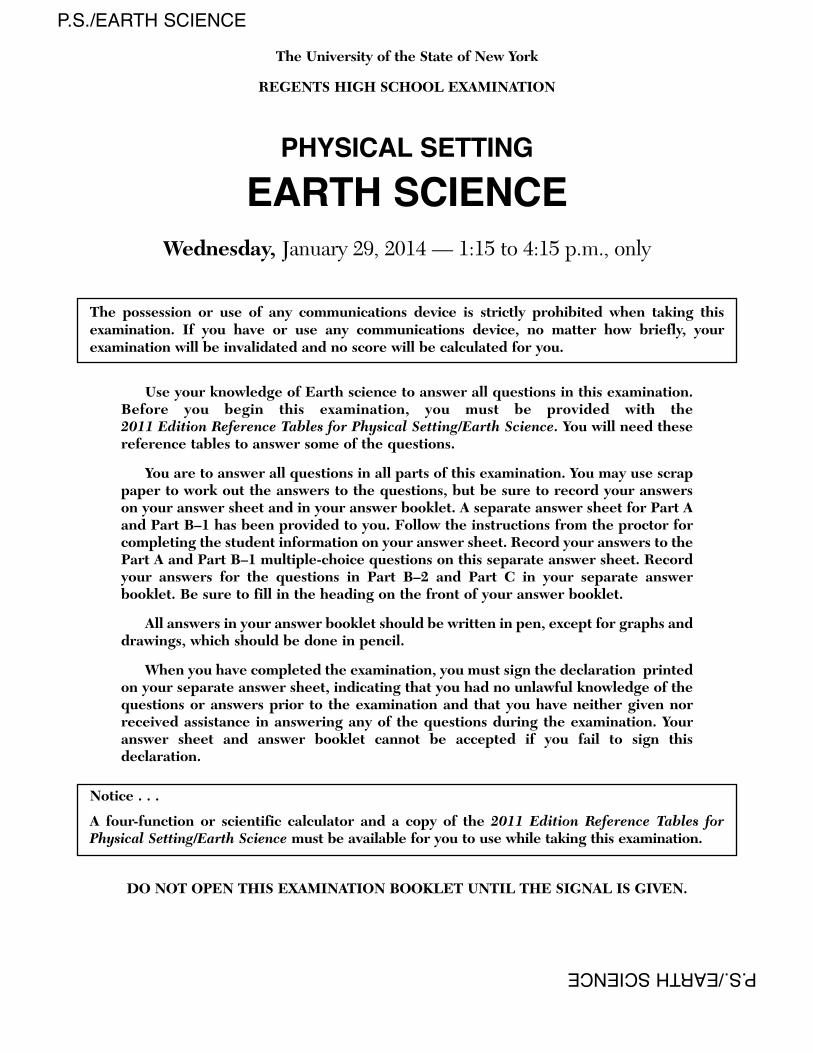
9 The arrows on the map below show the prevailing winds at a midlatitude coastal city.
This city most likely has a climate that is(1) arid, with a small difference between the
highest and lowest yearly temperatures(2) arid, with a large difference between the
highest and lowest yearly temperatures(3) humid, with a small difference between the
highest and lowest yearly temperatures(4) humid, with a large difference between the
highest and lowest yearly temperatures
10 During an El Niño event, the South EquatorialCurrent reverses direction and flows over thetop of northern portions of the Peru Current,causing(1) warmer surface ocean waters along the
northeast coast of South America(2) warmer surface ocean waters along the
northwest coast of South America(3) cooler surface ocean waters along the
northeast coast of South America(4) cooler surface ocean waters along the
northwest coast of South America
11 An air mass entering Alaska from the northernPacific Ocean would most likely be labeled on aweather map as(1) cP (3) mP(2) cT (4) mT
12 Most tornadoes in the Northern Hemisphere arebest described as violently rotating columns ofair surrounded by(1) clockwise surface winds moving toward the
columns(2) clockwise surface winds moving away from
the columns(3) counterclockwise surface winds moving
toward the columns(4) counterclockwise surface winds moving
away from the columns
13 The major source of oxygen in Earth’s EarlyProterozoic atmosphere is inferred to have beenproduced by(1) oceanic cyanobacteria(2) outgassing from volcanic eruptions(3) radioactive decay in Earth’s inner core(4) evaporation of ocean water
14 Earth has sedimentary bedrock of marine originthat is four billion years old. Which inferencecan be made from this information?(1) Earth had oceans four billion years ago.(2) Sedimentary rocks formed from magma
when Earth cooled four billion years ago.(3) Most sedimentary rocks are at least four
billion years old.(4) Life existed on Earth four billion years ago.
15 Valcouroceras is a New York State index fossil.Which mountain-building event occurred inNew York State during the time whenValcouroceras was living in oceans covering partsof New York State?(1) Alleghenian orogeny (3) Taconian orogeny(2) Acadian orogeny (4) Grenville orogeny
CityOcean Land
N
P.S./E. Sci.–Jan. ’14 [4]
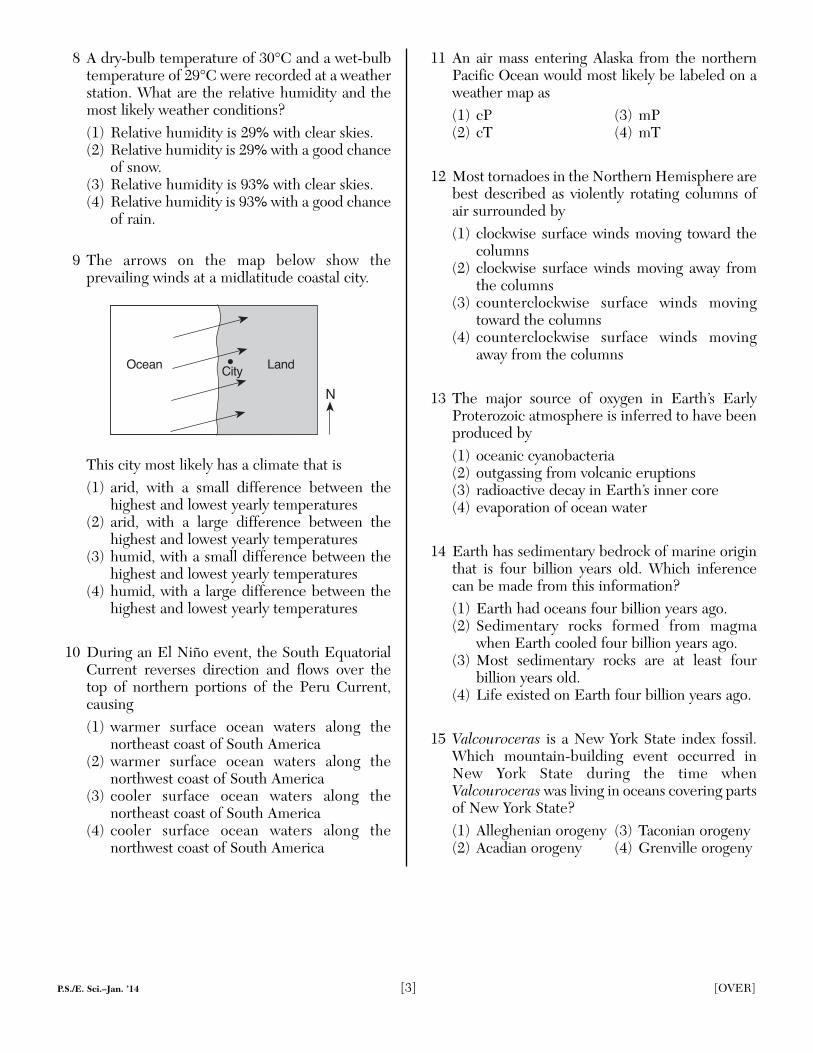
16 The diagram below represents some fauna (animals) found fossilized in Canada’s Burgessshale.
During which geologic epoch did these animalslive?(1) Middle Cambrian (3) Late Triassic(2) Early Pennsylvanian (4) Paleocene
17 A group hiking in the Catskill region of New YorkState finds several large boulders composed ofmetamorphic rock. These boulders most likelyresulted from the weathering of bedrock formedin the(1) Catskills, and were transported to their
present location by mass movement(2) Catskills, and were transported to their
present location by glaciers(3) Adirondack Mountains, and were transported
to their present location by mass movement(4) Adirondack Mountains, and were transported
to their present location by glaciers
18 The formation of the Canary Islands was primarily caused by their location near a(1) subduction zone (3) divergent boundary(2) mantle hot spot (4) transform fault
19 A P-wave takes 5 minutes to travel from the epicenter of an earthquake to a seismic station.Approximately how many minutes will it take anS-wave to travel that same distance?(1) 15 min (3) 9 min(2) 12 min (4) 4 min
20 Which two Earth layers are separated by theMoho boundary?(1) rigid mantle and plastic mantle(2) outer core and stiffer mantle(3) stiffer mantle and asthenosphere(4) crust and rigid mantle
21 During a rainstorm, when soil becomes saturated,the amount of infiltration(1) decreases and runoff decreases(2) decreases and runoff increases(3) increases and runoff decreases(4) increases and runoff increases
22 Sediment is deposited as a river enters a lakebecause the(1) velocity of the river decreases(2) force of gravity decreases(3) volume of water increases(4) slope of the river increases
23 Stream drainage patterns that develop in a landscape region are controlled mostly by(1) bedrock structure(2) precipitation amounts(3) nearness to a large body of water(4) air temperature variations
24 The most abundant metallic element by mass inEarth’s crust makes up 8.23% of the crust.Which group of minerals all normally containthis metallic element in their compositions?(1) garnet, calcite, pyrite, and galena(2) biotite mica, muscovite mica, fluorite, and
halite(3) talc, quartz, graphite, and olivine(4) plagioclase feldspar, amphibole, pyroxene,
and potassium feldspar
(Not drawn to scale)

P.S./E. Sci.–Jan. ’14 [5] [OVER]
25 Which sequence of events affecting moist air within Earth’s atmosphere causes cloud formation?(1) rising expanding cooling condensation(2) rising contracting warming evaporation(3) sinking expanding warming condensation(4) sinking contracting cooling evaporation
26 In which environment is the amount of transpiration usually the greatest?
27 Which graph best shows the general relationship between a planet’s distance from the Sun and the Sun’sgravitational attraction to the planet?
( 1 )
Planet’s Distancefrom the Sun
Sun
’s G
ravi
tatio
nal
Att
ract
ion
( 2 )
Sun
’s G
ravi
tatio
nal
Att
ract
ion
Planet’s Distancefrom the Sun
( 3 )
Sun
’s G
ravi
tatio
nal
Att
ract
ion
Planet’s Distancefrom the Sun
( 4 )
Sun
’s G
ravi
tatio
nal
Att
ract
ion
Planet’s Distancefrom the Sun
( 1 )
( 2 )
( 3 )
( 4 )
! ! !! ! !
! ! !! ! !
P.S./E. Sci.–Jan. ’14 [6]
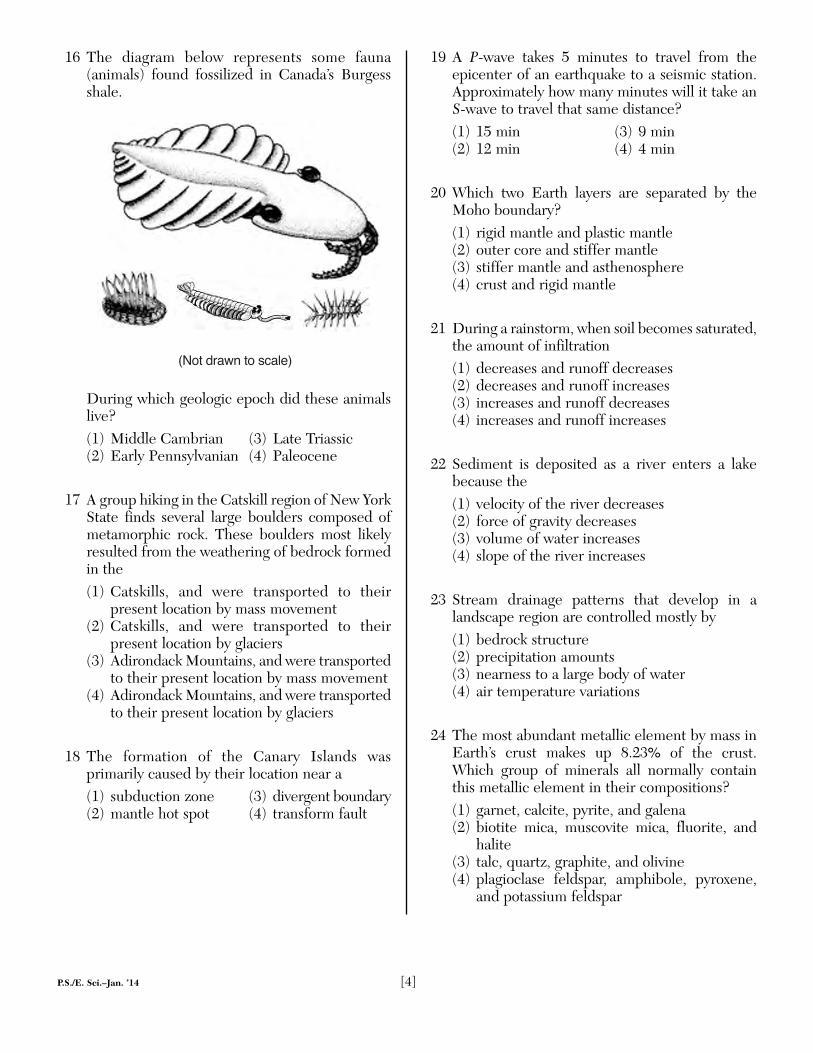
28 Which diagram best represents the tilt of Earth’s axis that causes the Northern Hemisphere seasons shown?(Diagrams are not drawn to scale.)
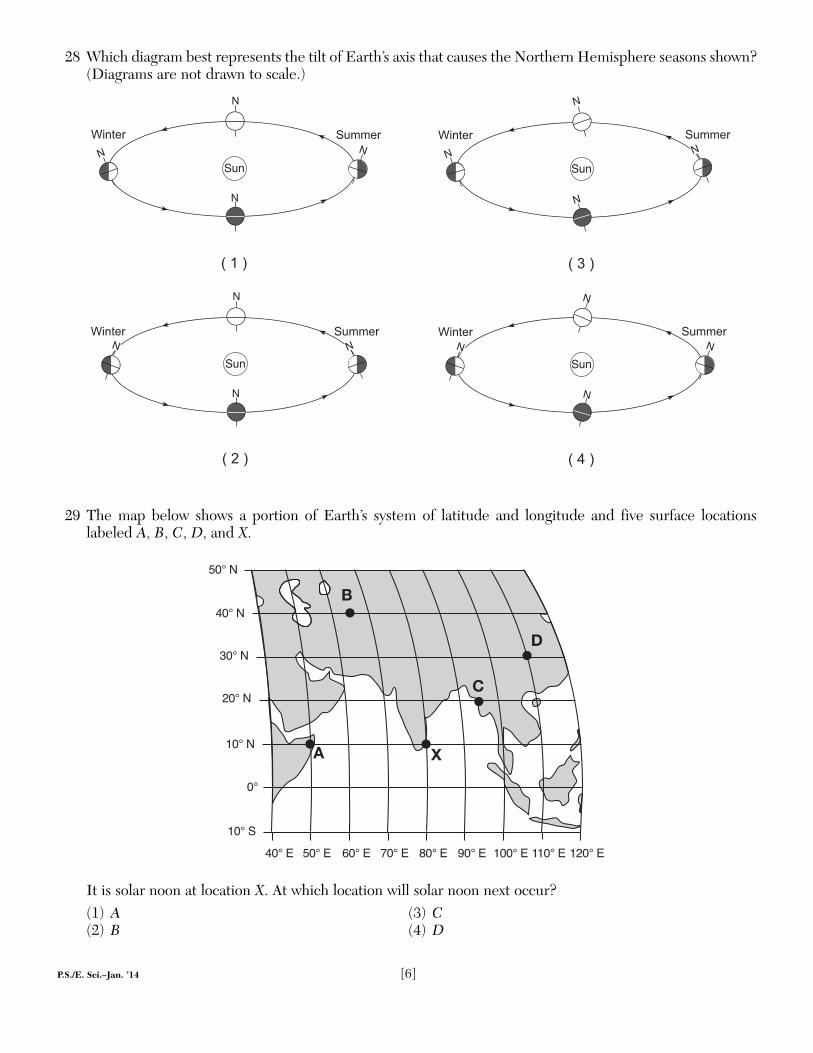
29 The map below shows a portion of Earth’s system of latitude and longitude and five surface locationslabeled A, B, C, D, and X.
It is solar noon at location X. At which location will solar noon next occur?(1) A (3) C(2) B (4) D
100° E80° E60° E40° E
0°
20° N
40° NB
D
C
XA
120° E10° S
10° N
30° N
50° N
90° E70° E50° E 110° E
!"##$%
&'(')
*+,-$%
!"#$
$
$
$
&'.')
*+,-$%
!"#
$
$
&'/')
*+,-$%
!"#$
$
$
&'0')
*+,-$%
!"#
$
$
$
!"##$%
!"##$%!"##$%$$
$
$

P.S./E. Sci.–Jan. ’14 [7] [OVER]
30 The diagram below represents the mass and volume of a mineral sample being measured. These measurements were used to determine the density of the mineral sample.
What is the density of this mineral sample?(1) 6 g/mL (3) 34 g/mL(2) 24 g/mL (4) 60 g/mL
0 1 2 3 4 5 6 7 8 9 10 g100 200 300 400 500 g10 20 30 40 50 60 70 80 90100 g
Mineral sample 50
40
30
20
10
Mineral sample
50
40
30
20
10
Mineral sample
mL mL
P.S./E. Sci.–Jan. ’14 [8]
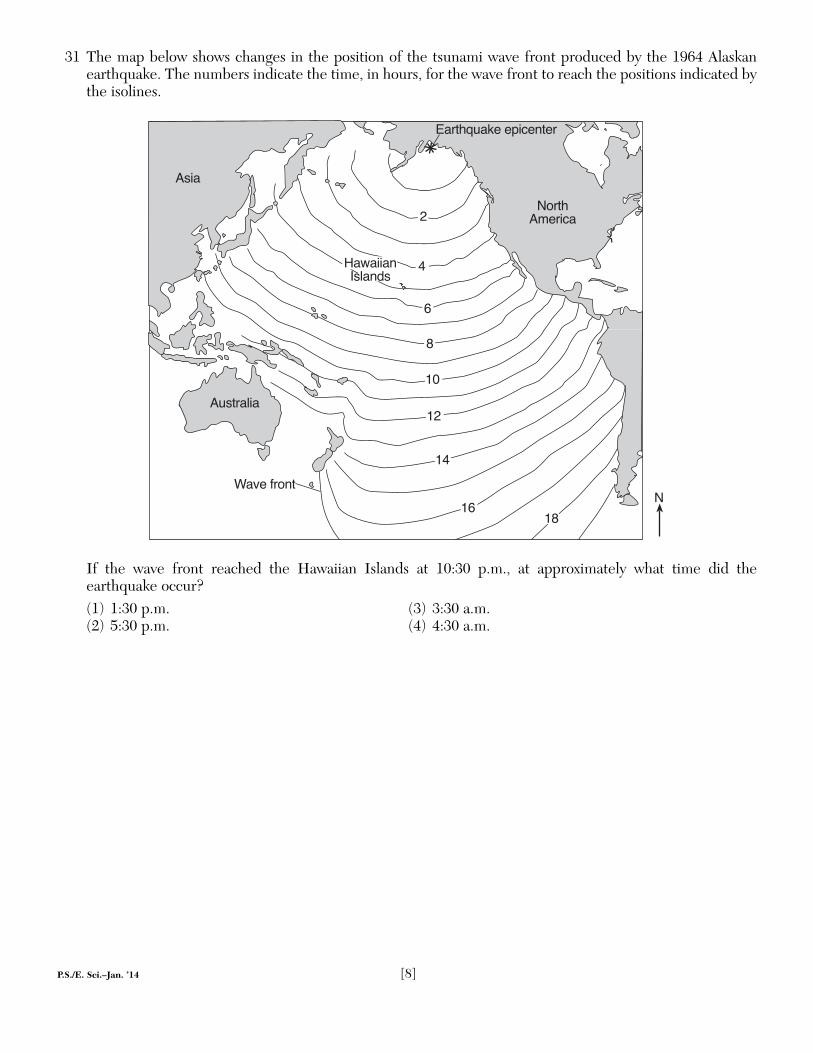
31 The map below shows changes in the position of the tsunami wave front produced by the 1964 Alaskan earthquake. The numbers indicate the time, in hours, for the wave front to reach the positions indicated bythe isolines.
If the wave front reached the Hawaiian Islands at 10:30 p.m., at approximately what time did the earthquake occur?(1) 1:30 p.m. (3) 3:30 a.m.(2) 5:30 p.m. (4) 4:30 a.m.
$%&'()*+&,-.
)/,.
0.&'(1".2+3+4,-+#'+&
)"/'&.5,.
6.7+38&%#'
9:
9;
<=.>.,,.#?/5.#@/
9A9B
B
A
;
$
9<
P.S./E. Sci.–Jan. ’14 [9] [OVER]
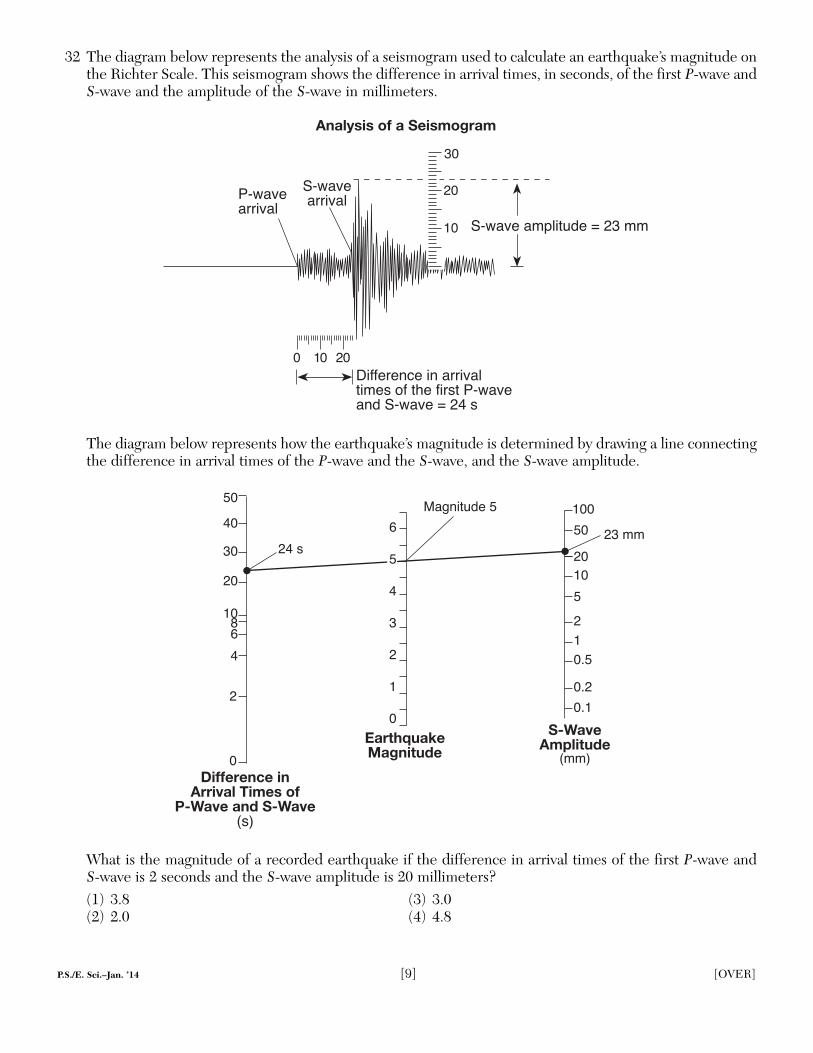
32 The diagram below represents the analysis of a seismogram used to calculate an earthquake’s magnitude onthe Richter Scale. This seismogram shows the difference in arrival times, in seconds, of the first P-wave andS-wave and the amplitude of the S-wave in millimeters.
The diagram below represents how the earthquake’s magnitude is determined by drawing a line connectingthe difference in arrival times of the P-wave and the S-wave, and the S-wave amplitude.
What is the magnitude of a recorded earthquake if the difference in arrival times of the first P-wave and S-wave is 2 seconds and the S-wave amplitude is 20 millimeters?(1) 3.8 (3) 3.0(2) 2.0 (4) 4.8
9::
!"#$%&'()*+,-.&
C**D/$0,12-$3&4$56+,-.&
E:
:
B
;
<
A9:
;:
F:
<:
7+88&0&69&:+6'00+%$*:;+(&<:=8
>"#$%&:$6.:!"#$%&C/D
A
E
<
F
;
9
::G9:G;
:GE
E:
;:9:
E
;9
;<3/;F3**
H.I#,'"@+3E
F:
;:
9: !J>.7+3.*45,'"@+3K3;F3**
LJ>.7+.&&,7.5
!J>.7+.&&,7.5
'6$*?<+<:=8:$:!&+<(=50$(
: 9: ;:M,88+&+#-+3,#3.&&,7.5',*+/3%83'(+38,&/'3LJ>.7+.#@3!J>.7+3K3;<3/
P.S./E. Sci.–Jan. ’14 [10]
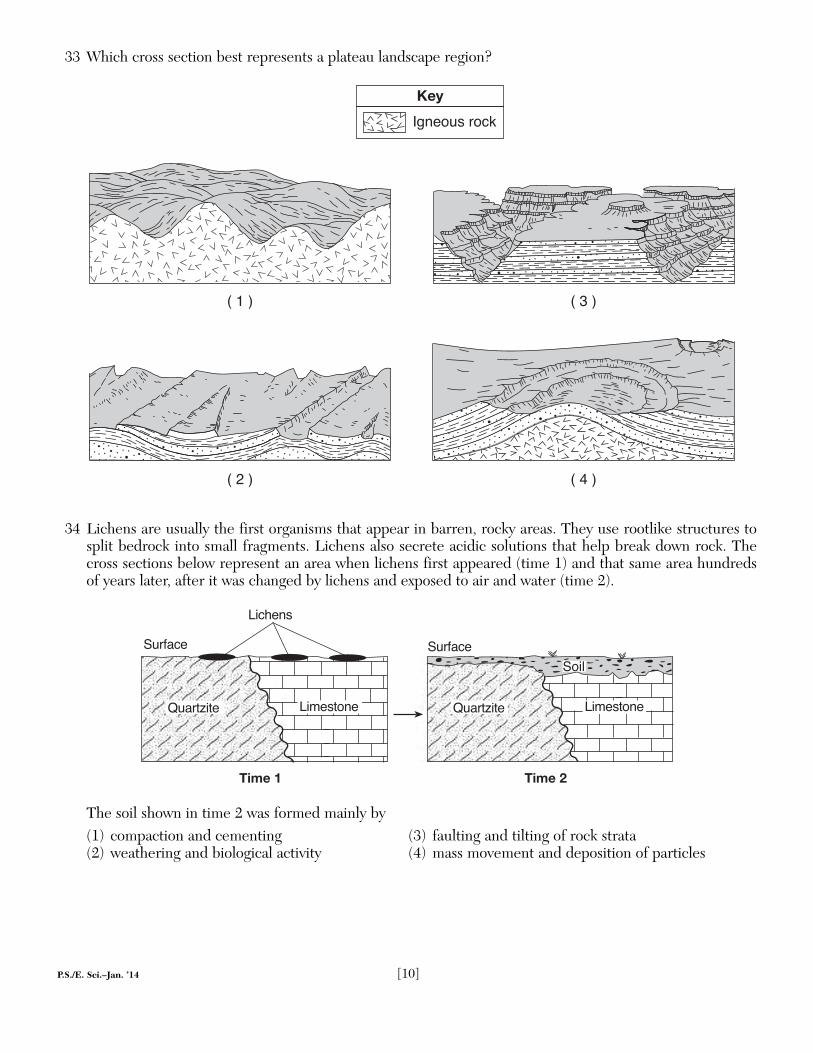
33 Which cross section best represents a plateau landscape region?
34 Lichens are usually the first organisms that appear in barren, rocky areas. They use rootlike structures tosplit bedrock into small fragments. Lichens also secrete acidic solutions that help break down rock. Thecross sections below represent an area when lichens first appeared (time 1) and that same area hundredsof years later, after it was changed by lichens and exposed to air and water (time 2).
The soil shown in time 2 was formed mainly by(1) compaction and cementing (3) faulting and tilting of rock strata(2) weathering and biological activity (4) mass movement and deposition of particles
Surface
Lichens
Time 1 Time 2
Soil
LimestoneLimestoneQuartzite Quartzite
Surface
?I#+%"/3&%-2
@&?
C3;3D C3<3D
C393D C3F3D

P.S./E. Sci.–Jan. ’14 [11] [OVER]
35 The map below shows coastal features of a portion of Long Island, New York. Point A represents a locationon a landscape feature that resulted from wave action and longshore currents.
On which landscape feature is point A located?(1) moraine (3) barrier island(2) delta (4) floodplain
)'5.#',-3N-+.#
O&+.'3!%"'(
3P.Q
R%#I3?/5.#@
3!%"#@
'
R%#I3?/5.#@

P.S./E. Sci.–Jan. ’14 [12]
Base your answers to questions 36 through 38 on the passage and map below and on your knowledge ofEarth science. The map shows the locations of the Mt. Redoubt volcano and Anchorage, Alaska.
Mt. Redoubt Volcano
In Anchorage, Alaska, scientists are monitoring sensors located on nearby Mt.Redoubt. The sensors measure seismic activity at the top of the volcano. No one livesnear the volcano itself, so there is no danger to humans from lava flows, but ash can bedangerous when breathed in, and can damage airplanes and automobiles if the ash isdrawn into their engines. When Mt. Redoubt erupted in 1989, a huge ash cloudreached an approximate height of 7.6 miles above sea level, and spread ash acrossAlaska for five months. The ash was composed largely of silica, which cooled rapidly asthe ash rose into the atmosphere. In March 2009, Mt. Redoubt erupted again.
36 Mt. Redoubt’s seismic activity is due to the interaction of which two tectonic plates?(1) Pacific Plate and Eurasian Plate (3) North American Plate and Pacific Plate(2) Eurasian Plate and North American Plate (4) Philippine Plate and Eurasian Plate
37 The height of the ash cloud from the 1989 eruption reached an altitude in Earth’s atmosphere located(1) between sea level and the lower troposphere(2) between the troposphere and the stratosphere(3) in the middle of the stratosphere(4) in the middle of the mesosphere
AE!3$
A:!3$
EE!3$
AE!3$
A:!3$
EE!3$
9S:!30 9B:! 9S:!36 9A:!36 9E:!36 9<:!36 9F:!36 9;:!36
9B:! 9S:!36 9A:!36 9E:!36 9<:!36
)5./2.
H'GT+@%"U'
)#-(%&.I+
Part B–1
Answer all questions in this part.
Directions (36–50): For each statement or question, choose the word or expression that, of those given, bestcompletes the statement or answers the question. Some questions may require the use of the 2011 EditionReference Tables for Physical Setting/Earth Science. Record your answers on your separate answer sheet.

P.S./E. Sci.–Jan. ’14 [13] [OVER]
38 How did the huge ash cloud that covered Alaska in 1989 affect the amount of insolation reaching Earth’ssurface and the air temperatures near Earth’s surface?(1) Insolation decreased and temperatures increased.(2) Insolation increased and temperatures decreased.(3) Both insolation and temperatures increased.(4) Both insolation and temperatures decreased.
39 The diagram below represents three bedrock outcrops. The layers have not been overturned. Letters Athrough E identify different rock layers. Fossils found in the rock layers are shown.
Which fossil could be classified as an index fossil?
C393D C3;3D C3F3D C3<3D
N&,I,#.5&%-235.Q+&/
0&%@+@3&%-235.Q+&/
'
A
B
7
/
P.S./E. Sci.–Jan. ’14 [14]
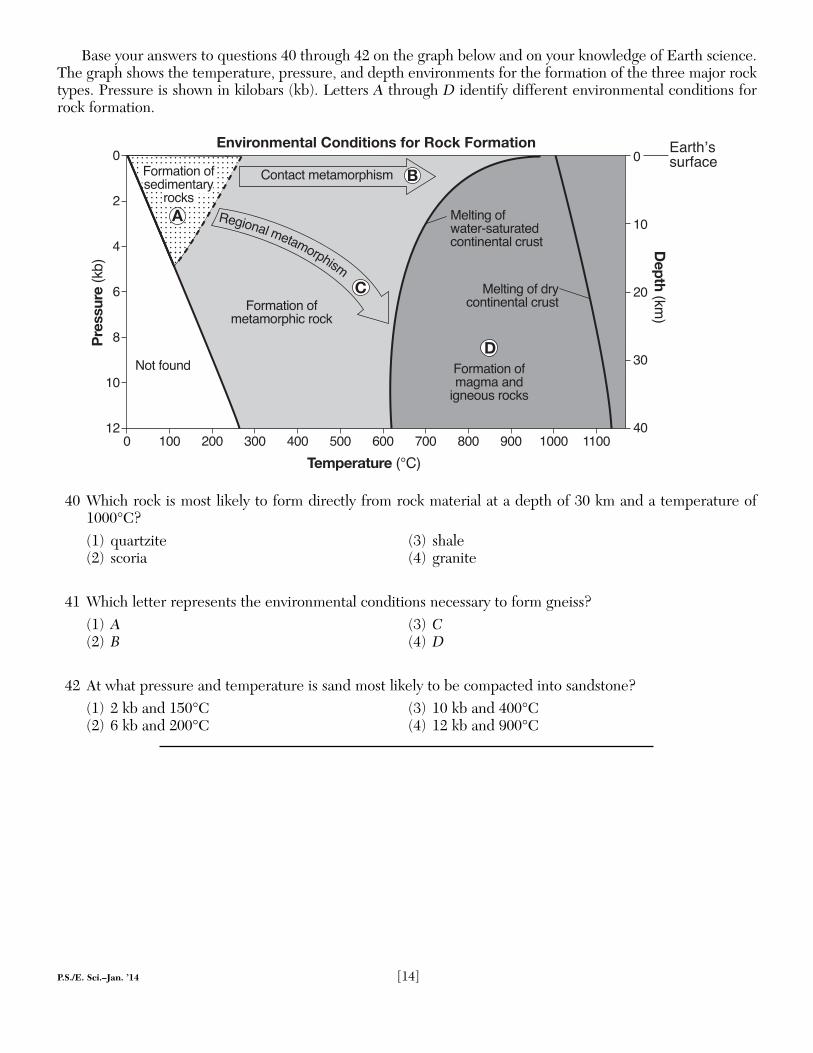
Base your answers to questions 40 through 42 on the graph below and on your knowledge of Earth science.The graph shows the temperature, pressure, and depth environments for the formation of the three major rocktypes. Pressure is shown in kilobars (kb). Letters A through D identify different environmental conditions forrock formation.
40 Which rock is most likely to form directly from rock material at a depth of 30 km and a temperature of1000°C?(1) quartzite (3) shale(2) scoria (4) granite
41 Which letter represents the environmental conditions necessary to form gneiss?(1) A (3) C(2) B (4) D
42 At what pressure and temperature is sand most likely to be compacted into sandstone?(1) 2 kb and 150°C (3) 10 kb and 400°C(2) 6 kb and 200°C (4) 12 kb and 900°C
:
;
<
A
B
9:
9;: 9:: ;:: F:: <:: E:: A:: S:: B:: V:: 9::: 99::
'
A
B
7
W%#'.-'3*+'.*%&4(,/*
T+I,%#.5 *+'.*%&4(,/*
X%&*.',%#3%8*.I*.3.#@,I#+%"/3&%-2/
H+5',#I3%8>.'+&J/.'"&.'+@-%#',#+#'.53-&"/'
H+5',#I3%83@&Q-%#',#+#'.53-&"/'
;&()&0$,-0&:C!WD
>0&
<<-0
&:C2UD
X%&*.',%#3%8*+'.*%&4(,-3&%-2
$%'38%"#@
:
9:
;:
F:
<:
7&),1:C2*
D/6%+0=6(&6,$*:B=6.+,+=6<:8=0:C=93:D=0($,+=6
X%&*.',%#3%8/+@,*+#'.&Q
&%-2/
0.&'("//"&8.-+

P.S./E. Sci.–Jan. ’14 [15] [OVER]
Base your answers to questions 43 through 45 on the diagram below and on your knowledge of Earth science. The diagram represents the inferred changes to the luminosity and color of the Sun throughout its lifecycle. The diagonal dashed line represents the main sequence stars. The numbers 1 through 5 represent stagesin the life cycle of the Sun.
43 The Sun is inferred to spend the greatest amount of time in its life cycle(1) contracting from a gas cloud (nebula)(2) as a main sequence star(3) moving away from the main sequence and becoming a giant star(4) changing from a giant star to a white dwarf star
44 The Sun is inferred to be the most luminous when it is classified as a(1) white dwarf star (3) main sequence star(2) gas cloud (nebula) (4) giant star
45 For other stars in our galaxy that go through a similar life cycle to our Sun, which star is currently in thelate stage of its life cycle?(1) Alpha Centauri (3) Barnard’s Star(2) Procyon B (4) Polaris
:G::9
:G:9
:G9
9
9:
9::
9Y:::
9:Y:::
T+@
EF!"#3U+I,#/-%#'&.-',#I38&%*I./3-5%"@C#+U"5.D
GF!"#3&+*.,#/8%&39:3U,55,%#Q+.&/3./3.3*.,#/+1"+#-+3/'.&
HF!"#3+Z4.#@/'%3I,.#'3/,[+Y5.&I+&3'(.#3'(+%&U,'3%830.&'(
IF!"#"/3%"'+&5.Q+&/3U5%>#3%883UQ7,%5+#'34"5/.',%#/
!"# -%#
'&.-'/
SE'(%"/.#@Q+.&/
JF!"#3+#@/3./.3>(,'+3@>.&83/'.&
E: *,55,%# Q+.&/
!,$0:B=*=0<
K-(
+6=<
+,?:C-%*4.&+@3'%34&+/+#'[email protected]!"#D
!"#+Z4.
#@/
E::
*,55,%#Q+.&/
K+8&:B?9*&:=8:,1&:!-6
P5"+ 6(,'+ \+55%>
P.S./E. Sci.–Jan. ’14 [16]
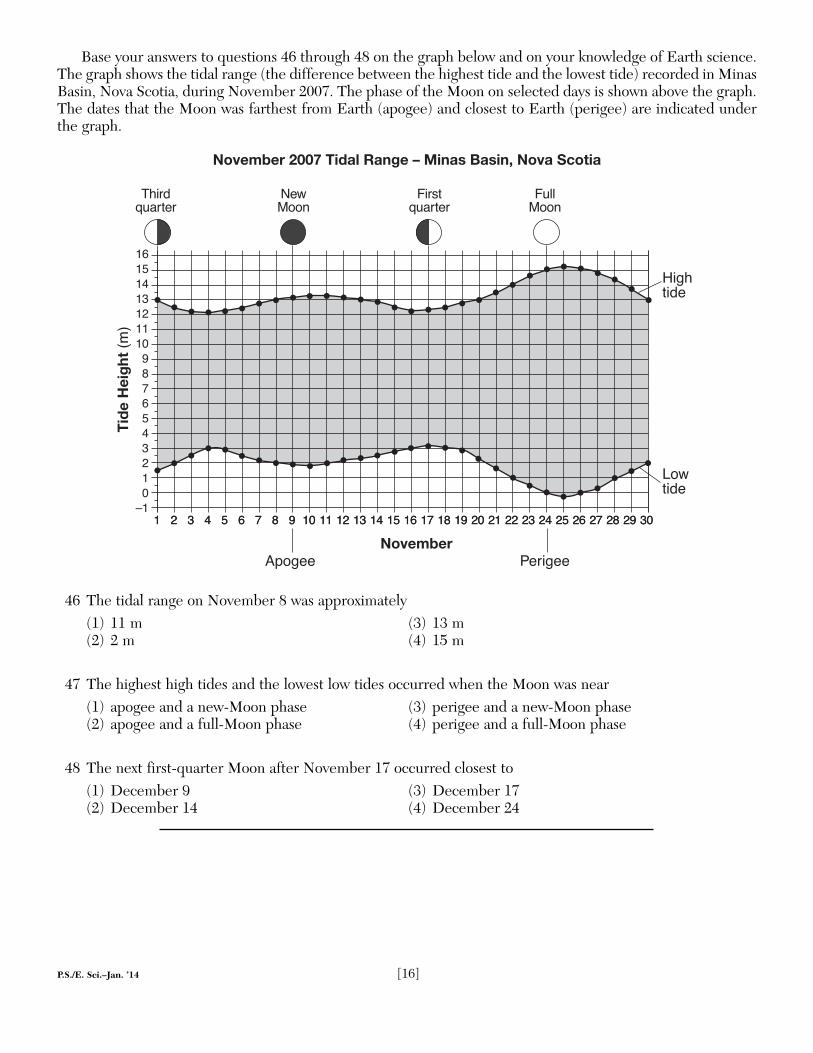
Base your answers to questions 46 through 48 on the graph below and on your knowledge of Earth science.The graph shows the tidal range (the difference between the highest tide and the lowest tide) recorded in MinasBasin, Nova Scotia, during November 2007. The phase of the Moon on selected days is shown above the graph.The dates that the Moon was farthest from Earth (apogee) and closest to Earth (perigee) are indicated underthe graph.
46 The tidal range on November 8 was approximately(1) 11 m (3) 13 m(2) 2 m (4) 15 m
47 The highest high tides and the lowest low tides occurred when the Moon was near(1) apogee and a new-Moon phase (3) perigee and a new-Moon phase(2) apogee and a full-Moon phase (4) perigee and a full-Moon phase
48 The next first-quarter Moon after November 17 occurred closest to(1) December 9 (3) December 17(2) December 14 (4) December 24
1 2 3 4 5 6 7 8 9 10 11 12 13 14 15 16 17 18 19 20 21 22 23 24 25 26 27 28 29 30
161514131211109876543210
–11 2 3 4 5 6 7 8 9 10 11 12 13 14 15 16 17 18 19 20 21 22 23 24 25 26 27 28 29 30
Thirdquarter
NewMoon
Firstquarter
FullMoon
November
Tide
Hei
ght
(m)
Apogee Perigee
Hightide
Lowtide
November 2007 Tidal Range – Minas Basin, Nova Scotia

P.S./E. Sci.–Jan. ’14 [17] [OVER]
Base your answers to questions 49 and 50 on the map below and on your knowledge of Earth science. Themap shows part of the North American coastline. The present coastline is shown as a solid line. The symbols onthe key below indicate the inferred coastline 18,000 years ago and an inferred future coastline if global warming continues.
49 Which statement best explains why 18,000 years ago the coastline was at a different location than it is today?(1) The climate of Earth was extremely hot and dry.(2) A large amount of Earth’s water was stored in large continental ice sheets. (3) The east coast of North America was being subducted under the Eurasian Plate.(4) North America had just separated from Africa, and the Atlantic Ocean was forming.
50 The inferred position of the future coastline is based on the assumption that the(1) total amount of global precipitation will decrease(2) thickness of the ozone layer will decrease(3) concentration of carbon dioxide in Earth’s atmosphere will increase(4) rate of uplift of the North American continent will increase
Key
Coastline 18,000 years agoFuture coastline if globalwarming continues
Atlantic Ocean

P.S./E. Sci.–Jan. ’14 [18]
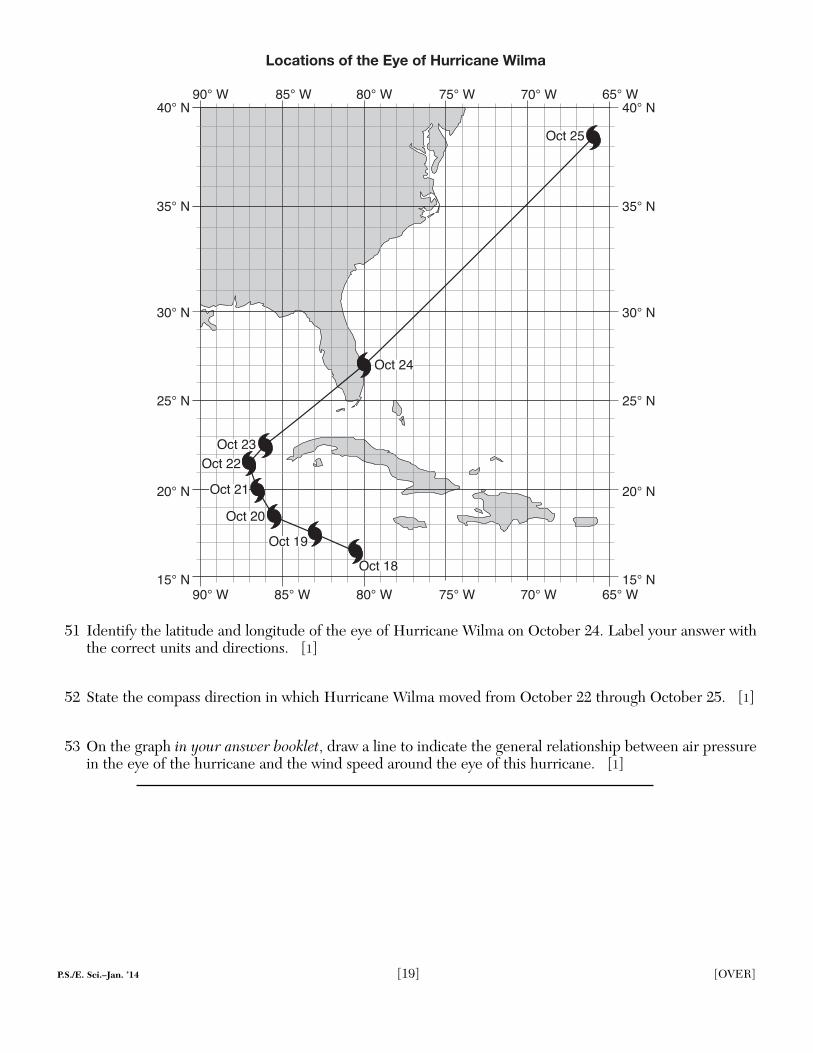
Base your answers to questions 51 through 53 on the data table below, the map on the following page, andon your knowledge of Earth science. The data table shows the air pressure in the eye (center) and the maximum sustained wind speed around the eye of Hurricane Wilma from October 18 through October 25, 2005. The datawere collected at the same time each day. The map shows the geographic locations of the eye of HurricaneWilma from October 18 to October 25.
Data of Hurricane Wilma
DateAir Pressure
(mb)Wind Speed
(mph)
Oct. 18 977 75
Oct. 19 882 173
Oct. 20 915 144
Oct. 21 930 143
Oct. 22 946 115
Oct. 23 961 98
Oct. 24 956 104
Oct. 25 970 103
Part B–2
Answer all questions in this part.
Directions (51–65): Record your answers in the spaces provided in your answer booklet. Some questionsmay require the use of the 2011 Edition Reference Tables for Physical Setting/Earth Science.
P.S./E. Sci.–Jan. ’14 [19] [OVER]
51 Identify the latitude and longitude of the eye of Hurricane Wilma on October 24. Label your answer withthe correct units and directions. [1]
52 State the compass direction in which Hurricane Wilma moved from October 22 through October 25. [1]
53 On the graph in your answer booklet, draw a line to indicate the general relationship between air pressurein the eye of the hurricane and the wind speed around the eye of this hurricane. [1]
9E!3$
;:!3$
;E!3$
F:!3$
FE!3$
<:!3$
BE!36 B:!36 SE!36 S:!36 AE!36V:!36
BE!36 B:!36 SE!36 AE!36V:!36
9E!3$
;:!3$
;E!3$
F:!3$
FE!3$
<:!3$S:!36
K=9$,+=6<:=8:,1&:/?&:=8:L-00+9$6&:#+*($
N-'3;E
N-'3;<
N-'3;F
N-'3;9
N-'3;:
N-'39B
N-'39V
N-'3;;
P.S./E. Sci.–Jan. ’14 [20]
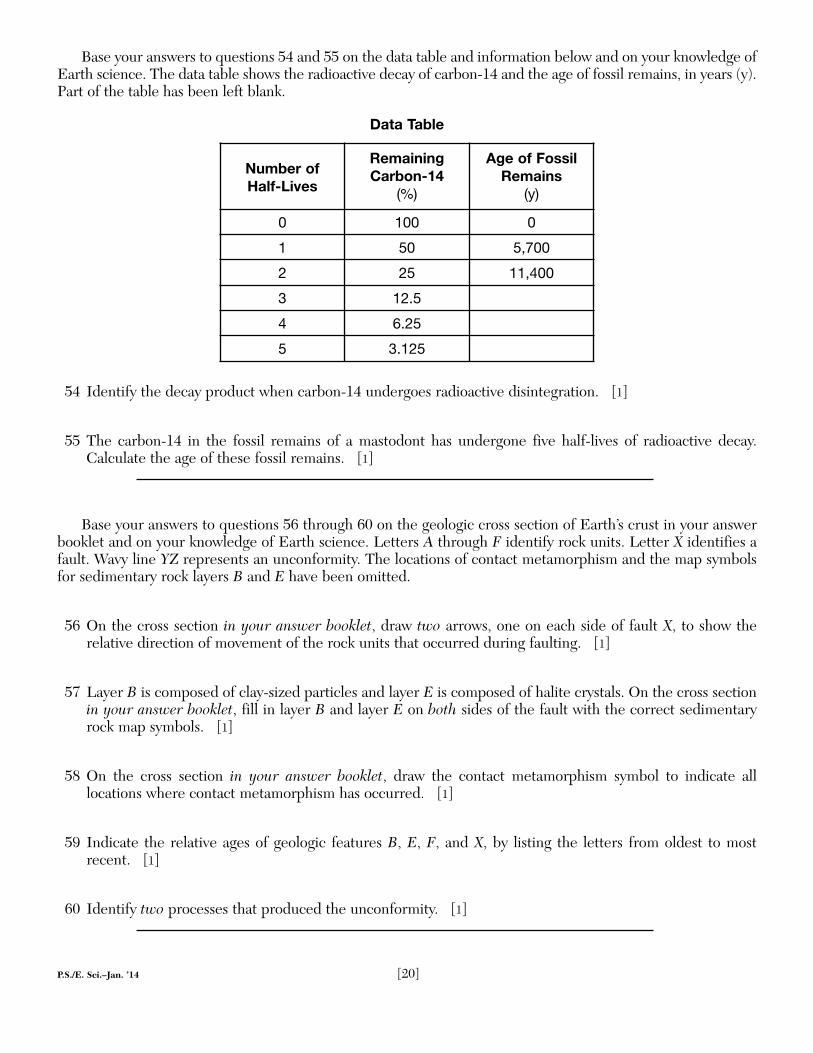
Base your answers to questions 54 and 55 on the data table and information below and on your knowledge ofEarth science. The data table shows the radioactive decay of carbon-14 and the age of fossil remains, in years (y).Part of the table has been left blank.
Data Table
54 Identify the decay product when carbon-14 undergoes radioactive disintegration. [1]
55 The carbon-14 in the fossil remains of a mastodont has undergone five half-lives of radioactive decay.Calculate the age of these fossil remains. [1]
Base your answers to questions 56 through 60 on the geologic cross section of Earth’s crust in your answerbooklet and on your knowledge of Earth science. Letters A through F identify rock units. Letter X identifies afault. Wavy line YZ represents an unconformity. The locations of contact metamorphism and the map symbolsfor sedimentary rock layers B and E have been omitted.
56 On the cross section in your answer booklet, draw two arrows, one on each side of fault X, to show the relative direction of movement of the rock units that occurred during faulting. [1]
57 Layer B is composed of clay-sized particles and layer E is composed of halite crystals. On the cross sectionin your answer booklet, fill in layer B and layer E on both sides of the fault with the correct sedimentaryrock map symbols. [1]
58 On the cross section in your answer booklet, draw the contact metamorphism symbol to indicate all locations where contact metamorphism has occurred. [1]
59 Indicate the relative ages of geologic features B, E, F, and X, by listing the letters from oldest to mostrecent. [1]
60 Identify two processes that produced the unconformity. [1]
Number of Half-Lives
Remaining Carbon-14
(%)
Age of FossilRemains
(y)
0 100 0
1 50 5,700
2 25 11,400
3 12.5
4 6.25
5 3.125

P.S./E. Sci.–Jan. ’14 [21] [OVER]
Base your answers to questions 61 through 63 on the block diagram below and on your knowledge of Earth science. The diagram represents a meandering stream. Point A represents a location within the meandering stream. Arrows represent the direction of stream flow.
61 Identify the name of the largest sediment particles that can be transported at point A when the stream’svelocity is 100 cm/s. [1]
62 Describe the relative changes in the stream velocity and the rate of erosion that will occur after 2 days ofheavy rainfall. [1]
63 Explain why rock particles transported by the stream often become more rounded. [1]
Base your answers to questions 64 and 65 on the block diagram in your answer booklet and on your knowledge of Earth science. The diagram represents the pattern of normal and reversed magnetic polarity ofthe seafloor bedrock on the east side of a mid-ocean ridge center. The magnetic polarity of the bedrock on thewest side of the ridge has been omitted. Arrows represent the direction of seafloor movement on either side ofthe ridge.
64 Complete the diagram in your answer booklet by shading the pattern of normal polarity on the west sideof the ridge center. Assume the rate of plate movement was constant on both sides of the ridge center. Youranswer must show the correct width and placement of each normal polarity section. [1]
65 Describe the general relationship between the distance from the ridge center and the age of the seafloorbedrock. [1]
'

P.S./E. Sci.–Jan. ’14 [22]
Base your answers to questions 66 through 71 on the topographic map in your answer booklet and on yourknowledge of Earth science. Dashed lines separate the map into sections I, II, III, and IV. Letters A through Erepresent locations on Earth’s surface. The points in section I represent elevations in feet.
66 On the map in your answer booklet, complete the 600-ft, 700-ft, and 800-ft contour lines in section I.Extend the lines to the edge of the map. [1]
67 On the map in your answer booklet, draw a line showing the most likely path of a second creek that beginsat location E and flows into Spruce Creek. [1]
68 Describe how the topography within section II is different from the topography within section IV. [1]
69 What is a possible elevation of location E? [1]
70 Calculate the gradient between locations A and B. [1]
71 On the grid in your answer booklet, construct a topographic profile along line CD by plotting the elevationof each contour line that crosses line CD. Connect all the plots with a line to complete the profile. [1]
Base your answers to questions 72 through 74 on the diagram in your answer booklet and on your knowledge of Earth science. The diagram is a model of the sky (celestial sphere) for an observer at 50° N latitude. The Sun’s apparent path on June 21 is shown. Point A is a position along the Sun’s apparent path.Angular distances above the horizon are indicated.
72 On the celestial sphere diagram in your answer booklet, place an X on the Sun’s apparent path on June 21to show the Sun’s position when the observer’s shadow would be the longest. [1]
73 The Sun travels 45° in its apparent path between the noon position and point A. Identify the time when theSun is at point A. Include a.m. or p.m. with your answer. [1]
74 Describe the general relationship between the length of the Sun’s apparent path and the duration of daylight. [1]
Part C
Answer all questions in this part.
Directions (66–85): Record your answers in the spaces provided in your answer booklet. Some questionsmay require the use of the 2011 Edition Reference Tables for Physical Setting/Earth Science.

P.S./E. Sci.–Jan. ’14 [23] [OVER]
Base your answers to questions 75 through 77 on the diagram in your answer booklet and on your knowledge of Earth science. The diagram represents the orbits of Earth, Venus, and Mercury. Earth, Venus, andMercury are shown with a dot on each of their orbital paths. The numbers on each orbital path indicate the planet’s positions on successive days in its revolution. Point M is a position on Earth’s orbit. Each season in theNorthern Hemisphere on Earth is labeled.
75 On the diagram in your answer booklet, place an X on each planet’s orbital path to show the positions ofEarth, Venus, and Mercury on the 55th day of each planet’s orbit. [1]
76 Approximately how many revolutions does Mercury make around the Sun during one Earth year? [1]
77 What latitude on Earth receives the vertical rays from the Sun when Earth is at position M? [1]
Base your answers to questions 78 through 80 on the diagram below and on your knowledge of Earth science. The diagram represents the present position of our solar system in a side view of the Milky Way Galaxy.The distance across the Milky Way Galaxy is measured in light-years.
78 What is the distance, in light-years, from the center of the Milky Way Galaxy to our solar system? [1]
79 Galaxies are classified based on their shape. What is the shape of the Milky Way Galaxy when viewed fromdirectly above? [1]
80 List the following astronomical features, in order of relative size, from smallest to largest. [1]
SunJupiterMilky Way GalaxyUniverseOur solar system
Side View of the Milky Way Galaxy
Axis of rotation at center of galaxy
Galaxy’s plane
Present position ofour solar system
0 50,000 100,000light-years

P.S./E. Sci.–Jan. ’14 [24]
Base your answers to questions 81 through 83 on the passage, diagram of an ophiolite drill-core sample, andmap below and on your knowledge of Earth science. The dot on the map represents the location where the ophiolite drill-core sample was taken.
Ophiolites
In some places, segments of oceanic crust, sediment, upper mantle, and rock havebeen heaved up by tectonic movements onto the edges of continents, where they oftenbecome part of mountains. These displaced oceanic lithosphere segments are calledophiolites. They provide an opportunity to study the composition of oceanic lithosphere and are a key feature in recognizing past tectonic plate convergence alongsubduction zones. Drill-core samples of ophiolites typically have the layering patternshown in the drill-core sample below.
81 What are the approximate crystal sizes in basalt and gabbro found in the Oregon drill-core sample? [1]
82 Describe how the mineral composition of dunite is different from the mineral composition of peridotite. [1]
83 Which layer in the ophiolite drill-core sample is composed of sediments? [1]
M0&5=6:M)1+=*+,&70+**"B=0&:!$()*&
W5.Q3>,'(*,-&%/-%4,-38%//,5/
P./.5'
O.UU&%
!+&4+#',#,'+M"#,'+
L+&,@%','+M"#,'+
LQ&%Z+#,'+
$
C$%'3@&.>#3'%3/-.5+D
W.#.@.
L.-,8,-N-+.#
6./(,#I'%#
N&+I%#
4$)

P.S./E. Sci.–Jan. ’14 [25]
Base your answers to questions 84 and 85 on the passage and diagram below and on your knowledge ofEarth science. The diagram represents a house located in New York State.
Solar Heating
Solar collectors in solar heating systems harness the power of the Sun to providethermal energy for heating hot water and house interiors. There are several types ofsolar heating systems. The best system will depend on the geographic location and theintensity of the Sun. A solar heating system saves energy, reduces utility costs, and produces clean energy. The efficiency and reliability of solar heating systems haveincreased dramatically in recent years.
84 Explain why solar energy can still be collected on cloudy days. [1]
85 State one advantage of using solar energy instead of burning fossil fuels to produce thermal energy for yourhome. [1]
!%5.&3-%55+-'%&!"#


P.S./EARTH SCIENCEP.S./EARTH SCIENCE
Printed on Recycled Paper