phylogeny and biogeography of the freshwater cray sh euastacus
TRANSCRIPT
Molecular Phylogenetics and Evolution 37 (2005) 249–263
www.elsevier.com/locate/ympev
Phylogeny and biogeography of the freshwater crayWsh Euastacus (Decapoda: Parastacidae) based on nuclear and mitochondrial DNA
Heather C. Shull a, Marcos Pérez-Losada a, David Blair b, Kim Sewell b,c, Elizabeth A. Sinclair a, Susan Lawler d, Mark Ponniah e, Keith A. Crandall a,¤
a Department of Integrative Biology, Brigham Young University, Provo, UT 84602-5181, USAb School of Tropical Biology, James Cook University, Townsville, Qld, Australia
c Centre for Microscopy and Microanalysis, University of Queensland, Qld 4072, Australiad Department of Environmental Management and Ecology, La Trobe University, Wodonga, Vic. 3689, Australia
e Australian School of Environmental Studies, GriYth University, Nathan, Qld 4111, Australia
Received 17 November 2004; revised 7 April 2005; accepted 29 April 2005Available online 18 July 2005
Abstract
Euastacus crayWsh are endemic to freshwater ecosystems of the eastern coast of Australia. While recent evolutionary studies havefocused on a few of these species, here we provide a comprehensive phylogenetic estimate of relationships among the species withinthe genus. We sequenced three mitochondrial gene regions (COI, 16S, and 12S) and one nuclear region (28S) from 40 species of thegenus Euastacus, as well as one undescribed species. Using these data, we estimated the phylogenetic relationships within the genususing maximum-likelihood, parsimony, and Bayesian Markov Chain Monte Carlo analyses. Using Bayes factors to test diVerentmodel hypotheses, we found that the best phylogeny supports monophyletic groupings of all but two recognized species and suggestsa widespread ancestor that diverged by vicariance. We also show that Euastacus and Astacopsis are most likely monophyletic sistergenera. We use the resulting phylogeny as a framework to test biogeographic hypotheses relating to the diversiWcation of the genus. 2005 Elsevier Inc. All rights reserved.
Keywords: CrayWsh; Phylogeny; Biogeography; Evolution; Australia
1. Introduction Crandall et al., 1999, 2000a,b; Lawler and Crandall,
1.1. CrayWsh phylogenetics
Freshwater crayWsh are thought to have a monophy-letic origin sometime between 185 and 225 million yearsago (Crandall et al., 2000b; Scholtz and Richter, 1995).The Southern Hemisphere crayWsh family Parastacidaeforms a monophyletic sister group to the NorthernHemisphere crayWsh (Crandall et al., 2000b). Phyloge-netic analyses have successfully estimated relationshipsin the family Parastacidae at the generic level (e.g.,
* Corresponding author. Fax: +1 801 422 0090.E-mail address: [email protected] (K.A. Crandall).
1055-7903/$ - see front matter 2005 Elsevier Inc. All rights reserved.doi:10.1016/j.ympev.2005.04.034
1998). Maximum-likelihood, minimum evolution, andparsimony analyses have all shown strong support formonophyletic groupings of most of the recognized gen-era in the family (Crandall et al., 1999, 2000b). However,phylogenetic analyses have not been performed as exten-sively below the genus level, such as for species of thegenus Euastacus Clark (Decapoda: Parastacidae).
One of the outstanding issues within the Parastacidaeis the grouping of the spiny crayWsh, Euastacus andAstacopsis Huxley (Decapoda: Parastacidae), as sepa-rate genera. Euastacus inhabits only mainland Australia,while Astacopsis is endemic to Tasmania. Morgan (1997)classiWed Euastacus as the sister genus to Astacopsis andsuggested that a host of morphological characters(podobranchial and telson structure, abdominal
250 H.C. Shull et al. / Molecular Phylogenetics and Evolution 37 (2005) 249–263
spination, genital papilla shape, abdominal width, and alongitudinal rostral carina) presented enough diVerencesto justify the classiWcation of Euastacus and Astacopsisas separate genera. However, Austin (1996) found thatthe allozyme electrophoretic variation was much greaterbetween species of Cherax than the variation betweenEuastacus and Astacopsis, suggesting that they are notgenetically unique enough to warrant separate genera.Lawler and Crandall (1998) suggested that Astacopsiswas not monophyletic, but in a later study concludedthat Euastacus and Astacopsis were probably distinct sis-ter taxa (from minimum evolution and parsimony analy-ses), or that Astacopsis was derived from Euastacus(from maximum-likelihood analysis) (Crandall et al.,1999). Both studies used only the 16S rRNA mitochon-drial gene region.
Results of phylogenetic analyses within and amongcrayWsh genera often have depended on the method ofanalysis. Attempts to uncover these relationships andbetter understand the evolutionary histories in this fam-ily are commonly confounded by conXicting relation-ships depending on the optimality criterion used, andconWdence in some of the conclusions drawn from theresulting phylogenies is low because of a lack of supportat many of the major nodes (Crandall et al., 1999,2000a,b; Ponniah and Hughes, 2004). With all phyloge-netic methods, choice of the model of evolution is impor-tant for accurate estimation of evolutionaryrelationships (Hillis et al., 1994; Huelsenbeck, 1995).Bayesian methods allow for partitioned modeling ofmolecular evolution across diVerent gene regions andtherefore should, in theory, provide more accurate esti-mates of evolutionary relationships by using a more bio-logically realistic mixed model of evolution (Ronquistand Huelsenbeck, 2003). Thus, our study will implementthis new method and compare the results of more com-plex modeling to traditional methods.
1.2. Classifying Euastacus
The amount of morphological variation betweendiVerent populations of single species has made it diY-
cult to rigorously delimit species within the genusEuastacus (see Morgan, 1997; Riek, 1969).Morphological variation between populations of thesame species is common when the species inhabits alarge range (e.g., E. spinifer, E. australasiensis, E. yanga,and E. woiwuru) or even in species with a narrow range(E. neohirsutus) (Morgan, 1997). However, on occasionthere is little morphological variation between popula-tions across a large range, as is the case with Euastacusarmatus (Morgan, 1997). In this case, measurable geneticvariation still exists (Versteegen and Lawler, 1997), sug-gesting that molecular techniques will yield greater reso-lution for delimiting species and recovering theirrelationships. Morgan (1997) suggests that many of
these populations may be semi-isolated, which couldpossibly increase speciation rates. If this is true, phyloge-netic data will aid in better understanding the evolution-ary processes occurring throughout the genus.
1.3. Biogeography of Euastacus
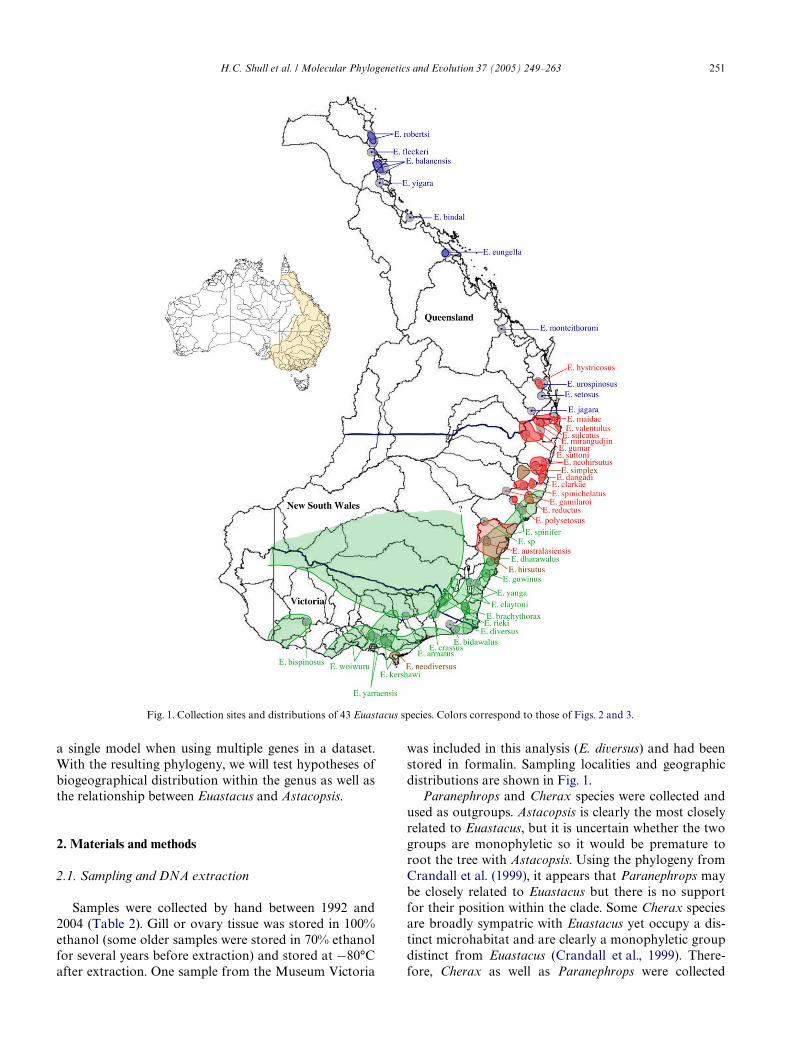
Euastacus crayWsh are endemic to the eastern andsoutheastern coast of Australia (Fig. 1). There are now43 named species distributed throughout Queensland,New South Wales, and Victoria (Table 1) (Coughran,2002; Morgan, 1986, 1988, 1989, 1997; Short and Davie,1993). Most Euastacus species live in cool streams sur-rounded by forests, often in areas where human growth,activity, and environmental modiWcation threaten, limit,or decrease their population sizes (Horwitz, 1995; Mer-rick, 1997). Euastacus are a useful group for broad bio-geographical studies because the genus is generallydistributed along a north–south axis. In northernQueensland, Euastacus species are cold-adaptedspecialists restricted to mountain refuges that rise fromthe Wet Tropics lowlands (Nix, 1991; Ponniah andHughes, 2004). Extensive biogeographical studies havebeen done of both vertebrates and invertebrates in thisnorthern area (Bell et al., 2004; Hugall et al., 2002;O’Connor and Moritz, 2003; Schneider et al., 1998),many producing similar phylogeographic patterns, mostnotably a break across the Black Mountain Corridorthat separates E. robertsi and E. Xeckeri from the rest ofthe genus. Ponniah and Hughes (2004) used the lineardistribution of Euastacus to test whether the Queenslandspecies diverged by a simultaneous vicariance event orby south to north dispersal. They concluded that therewas simultaneous vicariance of at least two ancestralQueensland lineages. An increase in temperature anddecline in moisture probably caused the ancestral lin-eages to retreat higher onto the mountains, stoppinggene Xow between populations and leading to diver-gence into modern Queensland species. In New SouthWales and Victoria, the general pattern of distribution isthat lowland Euastacus species are physically larger andalso have larger distributions, while the highland specieshave smaller bodies and generally smaller distributions(Morgan, 1997). This biogeographical study will incor-porate these southern species along with the Queenslandspecies already mentioned, to examine the geographicalhistory of the entire genus.
The aims of this study are to estimate a detailed phy-logeny of all Euastacus species using nucleotide sequencedata from the 16S rRNA, 12S rRNA, and cytochrome coxidase subunit I (COI) mitochondrial gene regions, andfrom the 28S rRNA gene region of the nuclear genome.To estimate this phylogeny as robustly as possible, wewill compare three methods of phylogenetic analysis[parsimony (MP), maximum likelihood (ML), andBayesian], and the eVects of choosing mixed models over
H.C. Shull et al. / Molecular Phylogenetics and Evolution 37 (2005) 249–263 251
a single model when using multiple genes in a dataset.With the resulting phylogeny, we will test hypotheses ofbiogeographical distribution within the genus as well asthe relationship between Euastacus and Astacopsis.
2. Materials and methods
2.1. Sampling and DNA extraction
Samples were collected by hand between 1992 and2004 (Table 2). Gill or ovary tissue was stored in 100%ethanol (some older samples were stored in 70% ethanolfor several years before extraction) and stored at ¡80°Cafter extraction. One sample from the Museum Victoria
was included in this analysis (E. diversus) and had beenstored in formalin. Sampling localities and geographicdistributions are shown in Fig. 1.
Paranephrops and Cherax species were collected andused as outgroups. Astacopsis is clearly the most closelyrelated to Euastacus, but it is uncertain whether the twogroups are monophyletic so it would be premature toroot the tree with Astacopsis. Using the phylogeny fromCrandall et al. (1999), it appears that Paranephrops maybe closely related to Euastacus but there is no supportfor their position within the clade. Some Cherax speciesare broadly sympatric with Euastacus yet occupy a dis-tinct microhabitat and are clearly a monophyletic groupdistinct from Euastacus (Crandall et al., 1999). There-fore, Cherax as well as Paranephrops were collected
Fig. 1. Collection sites and distributions of 43 Euastacus species. Colors correspond to those of Figs. 2 and 3.
252 H.C. Shull et al. / Molecular Phylogenetics and Evolution 37 (2005) 249–263
along with Euastacus samples and used as outgroups,while Astacopsis was analyzed as part of the ingroup.
DNA was extracted using a cell-lysis protocol asdescribed in Crandall et al. (1999). Approximately, 5–15mg of tissue was placed in 800 �l of cell-lysis solution(10mM Tris base, 100 mM EDTA, 2% SDS, pH 8.0), to
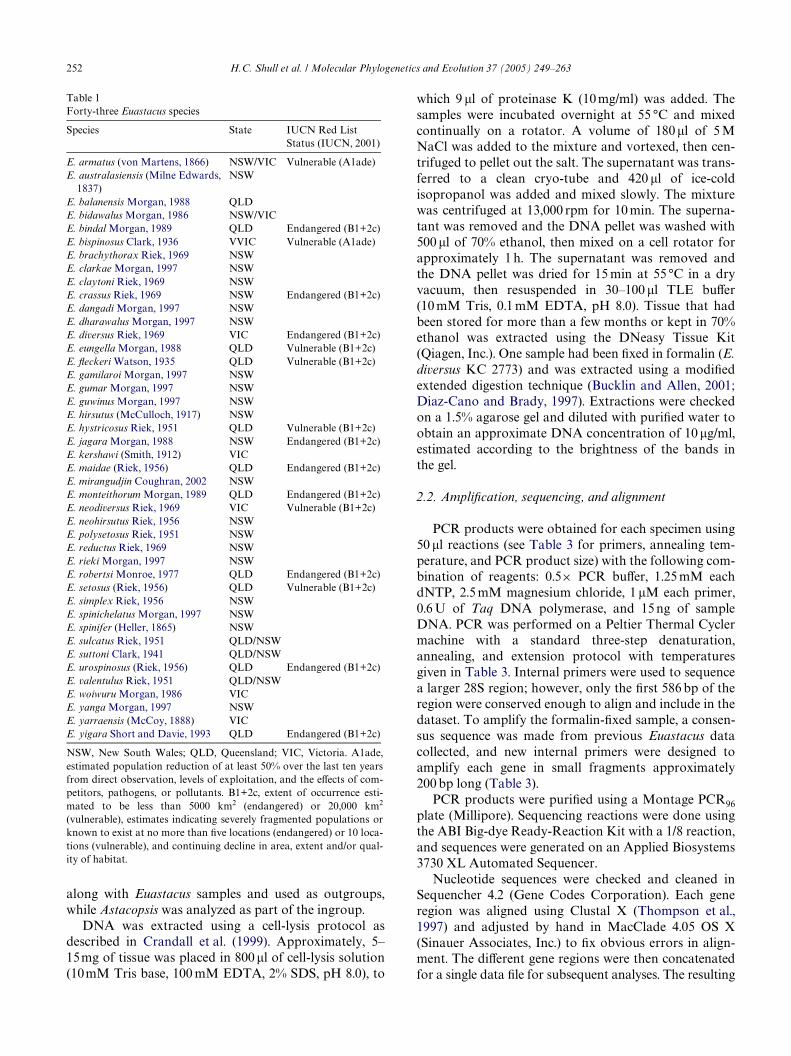
Table 1Forty-three Euastacus species
NSW, New South Wales; QLD, Queensland; VIC, Victoria. A1ade,estimated population reduction of at least 50% over the last ten yearsfrom direct observation, levels of exploitation, and the eVects of com-petitors, pathogens, or pollutants. B1+2c, extent of occurrence esti-mated to be less than 5000 km2 (endangered) or 20,000 km2
(vulnerable), estimates indicating severely fragmented populations orknown to exist at no more than Wve locations (endangered) or 10 loca-tions (vulnerable), and continuing decline in area, extent and/or qual-ity of habitat.
Species State IUCN Red List Status (IUCN, 2001)
E. armatus (von Martens, 1866) NSW/VIC Vulnerable (A1ade)E. australasiensis (Milne Edwards,
1837)NSW
E. balanensis Morgan, 1988 QLDE. bidawalus Morgan, 1986 NSW/VICE. bindal Morgan, 1989 QLD Endangered (B1+2c)E. bispinosus Clark, 1936 VVIC Vulnerable (A1ade)E. brachythorax Riek, 1969 NSWE. clarkae Morgan, 1997 NSWE. claytoni Riek, 1969 NSWE. crassus Riek, 1969 NSW Endangered (B1+2c)E. dangadi Morgan, 1997 NSWE. dharawalus Morgan, 1997 NSWE. diversus Riek, 1969 VIC Endangered (B1+2c)E. eungella Morgan, 1988 QLD Vulnerable (B1+2c)E. Xeckeri Watson, 1935 QLD Vulnerable (B1+2c)E. gamilaroi Morgan, 1997 NSWE. gumar Morgan, 1997 NSWE. guwinus Morgan, 1997 NSWE. hirsutus (McCulloch, 1917) NSWE. hystricosus Riek, 1951 QLD Vulnerable (B1+2c)E. jagara Morgan, 1988 NSW Endangered (B1+2c)E. kershawi (Smith, 1912) VICE. maidae (Riek, 1956) QLD Endangered (B1+2c)E. mirangudjin Coughran, 2002 NSWE. monteithorum Morgan, 1989 QLD Endangered (B1+2c)E. neodiversus Riek, 1969 VIC Vulnerable (B1+2c)E. neohirsutus Riek, 1956 NSWE. polysetosus Riek, 1951 NSWE. reductus Riek, 1969 NSWE. rieki Morgan, 1997 NSWE. robertsi Monroe, 1977 QLD Endangered (B1+2c)E. setosus (Riek, 1956) QLD Vulnerable (B1+2c)E. simplex Riek, 1956 NSWE. spinichelatus Morgan, 1997 NSWE. spinifer (Heller, 1865) NSWE. sulcatus Riek, 1951 QLD/NSWE. suttoni Clark, 1941 QLD/NSWE. urospinosus (Riek, 1956) QLD Endangered (B1+2c)E. valentulus Riek, 1951 QLD/NSWE. woiwuru Morgan, 1986 VICE. yanga Morgan, 1997 NSWE. yarraensis (McCoy, 1888) VICE. yigara Short and Davie, 1993 QLD Endangered (B1+2c)
which 9 �l of proteinase K (10 mg/ml) was added. Thesamples were incubated overnight at 55 °C and mixedcontinually on a rotator. A volume of 180�l of 5 MNaCl was added to the mixture and vortexed, then cen-trifuged to pellet out the salt. The supernatant was trans-ferred to a clean cryo-tube and 420 �l of ice-coldisopropanol was added and mixed slowly. The mixturewas centrifuged at 13,000 rpm for 10 min. The superna-tant was removed and the DNA pellet was washed with500 �l of 70% ethanol, then mixed on a cell rotator forapproximately 1 h. The supernatant was removed andthe DNA pellet was dried for 15 min at 55 °C in a dryvacuum, then resuspended in 30–100 �l TLE buVer(10 mM Tris, 0.1 mM EDTA, pH 8.0). Tissue that hadbeen stored for more than a few months or kept in 70%ethanol was extracted using the DNeasy Tissue Kit(Qiagen, Inc.). One sample had been Wxed in formalin (E.diversus KC 2773) and was extracted using a modiWedextended digestion technique (Bucklin and Allen, 2001;Diaz-Cano and Brady, 1997). Extractions were checkedon a 1.5% agarose gel and diluted with puriWed water toobtain an approximate DNA concentration of 10 �g/ml,estimated according to the brightness of the bands inthe gel.
2.2. AmpliWcation, sequencing, and alignment
PCR products were obtained for each specimen using50 �l reactions (see Table 3 for primers, annealing tem-perature, and PCR product size) with the following com-bination of reagents: 0.5£ PCR buVer, 1.25 mM eachdNTP, 2.5 mM magnesium chloride, 1 �M each primer,0.6 U of Taq DNA polymerase, and 15 ng of sampleDNA. PCR was performed on a Peltier Thermal Cyclermachine with a standard three-step denaturation,annealing, and extension protocol with temperaturesgiven in Table 3. Internal primers were used to sequencea larger 28S region; however, only the Wrst 586 bp of theregion were conserved enough to align and include in thedataset. To amplify the formalin-Wxed sample, a consen-sus sequence was made from previous Euastacus datacollected, and new internal primers were designed toamplify each gene in small fragments approximately200 bp long (Table 3).
PCR products were puriWed using a Montage PCR96plate (Millipore). Sequencing reactions were done usingthe ABI Big-dye Ready-Reaction Kit with a 1/8 reaction,and sequences were generated on an Applied Biosystems3730 XL Automated Sequencer.
Nucleotide sequences were checked and cleaned inSequencher 4.2 (Gene Codes Corporation). Each generegion was aligned using Clustal X (Thompson et al.,1997) and adjusted by hand in MacClade 4.05 OS X(Sinauer Associates, Inc.) to Wx obvious errors in align-ment. The diVerent gene regions were then concatenatedfor a single data Wle for subsequent analyses. The resulting
H.C. Shull et al. / Molecular Phylogenetics and Evolution 37 (2005) 249–263 253
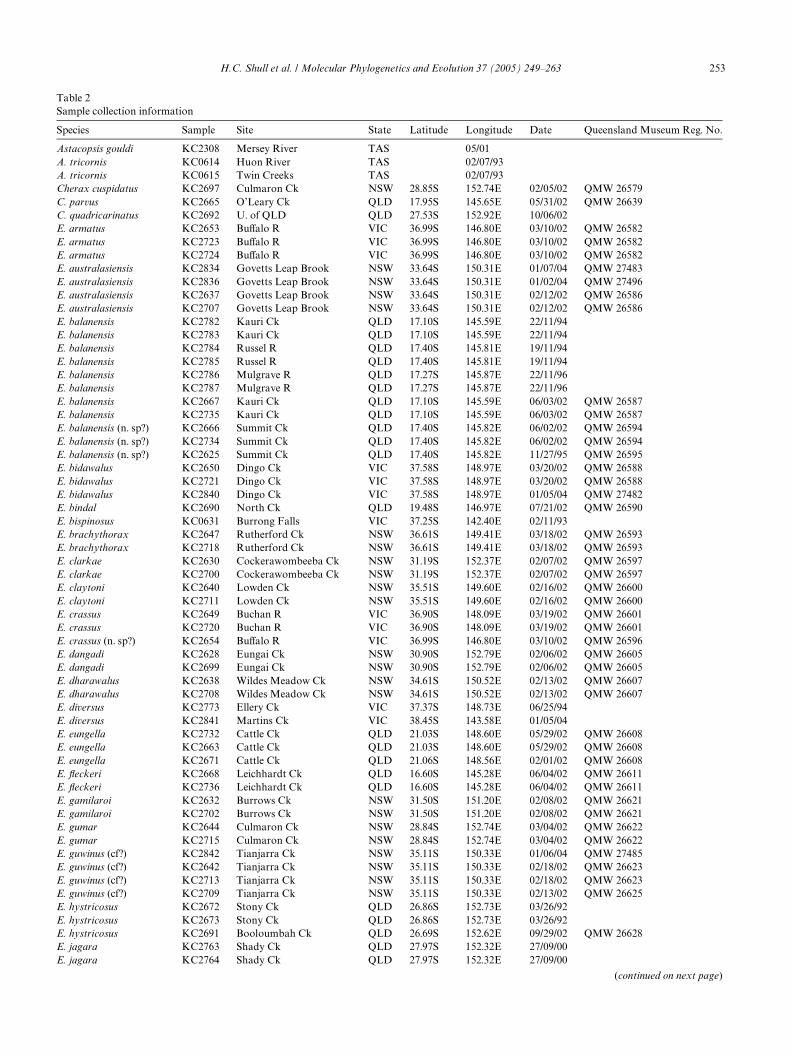
Table 2Sample collection information
Species Sample Site State Latitude Longitude Date Queensland Museum Reg. No.
Astacopsis gouldi KC2308 Mersey River TAS 05/01A. tricornis KC0614 Huon River TAS 02/07/93A. tricornis KC0615 Twin Creeks TAS 02/07/93Cherax cuspidatus KC2697 Culmaron Ck NSW 28.85S 152.74E 02/05/02 QMW 26579C. parvus KC2665 O’Leary Ck QLD 17.95S 145.65E 05/31/02 QMW 26639C. quadricarinatus KC2692 U. of QLD QLD 27.53S 152.92E 10/06/02E. armatus KC2653 BuValo R VIC 36.99S 146.80E 03/10/02 QMW 26582E. armatus KC2723 BuValo R VIC 36.99S 146.80E 03/10/02 QMW 26582E. armatus KC2724 BuValo R VIC 36.99S 146.80E 03/10/02 QMW 26582E. australasiensis KC2834 Govetts Leap Brook NSW 33.64S 150.31E 01/07/04 QMW 27483E. australasiensis KC2836 Govetts Leap Brook NSW 33.64S 150.31E 01/02/04 QMW 27496E. australasiensis KC2637 Govetts Leap Brook NSW 33.64S 150.31E 02/12/02 QMW 26586E. australasiensis KC2707 Govetts Leap Brook NSW 33.64S 150.31E 02/12/02 QMW 26586E. balanensis KC2782 Kauri Ck QLD 17.10S 145.59E 22/11/94E. balanensis KC2783 Kauri Ck QLD 17.10S 145.59E 22/11/94E. balanensis KC2784 Russel R QLD 17.40S 145.81E 19/11/94E. balanensis KC2785 Russel R QLD 17.40S 145.81E 19/11/94E. balanensis KC2786 Mulgrave R QLD 17.27S 145.87E 22/11/96E. balanensis KC2787 Mulgrave R QLD 17.27S 145.87E 22/11/96E. balanensis KC2667 Kauri Ck QLD 17.10S 145.59E 06/03/02 QMW 26587E. balanensis KC2735 Kauri Ck QLD 17.10S 145.59E 06/03/02 QMW 26587E. balanensis (n. sp?) KC2666 Summit Ck QLD 17.40S 145.82E 06/02/02 QMW 26594E. balanensis (n. sp?) KC2734 Summit Ck QLD 17.40S 145.82E 06/02/02 QMW 26594E. balanensis (n. sp?) KC2625 Summit Ck QLD 17.40S 145.82E 11/27/95 QMW 26595E. bidawalus KC2650 Dingo Ck VIC 37.58S 148.97E 03/20/02 QMW 26588E. bidawalus KC2721 Dingo Ck VIC 37.58S 148.97E 03/20/02 QMW 26588E. bidawalus KC2840 Dingo Ck VIC 37.58S 148.97E 01/05/04 QMW 27482E. bindal KC2690 North Ck QLD 19.48S 146.97E 07/21/02 QMW 26590E. bispinosus KC0631 Burrong Falls VIC 37.25S 142.40E 02/11/93E. brachythorax KC2647 Rutherford Ck NSW 36.61S 149.41E 03/18/02 QMW 26593E. brachythorax KC2718 Rutherford Ck NSW 36.61S 149.41E 03/18/02 QMW 26593E. clarkae KC2630 Cockerawombeeba Ck NSW 31.19S 152.37E 02/07/02 QMW 26597E. clarkae KC2700 Cockerawombeeba Ck NSW 31.19S 152.37E 02/07/02 QMW 26597E. claytoni KC2640 Lowden Ck NSW 35.51S 149.60E 02/16/02 QMW 26600E. claytoni KC2711 Lowden Ck NSW 35.51S 149.60E 02/16/02 QMW 26600E. crassus KC2649 Buchan R VIC 36.90S 148.09E 03/19/02 QMW 26601E. crassus KC2720 Buchan R VIC 36.90S 148.09E 03/19/02 QMW 26601E. crassus (n. sp?) KC2654 BuValo R VIC 36.99S 146.80E 03/10/02 QMW 26596E. dangadi KC2628 Eungai Ck NSW 30.90S 152.79E 02/06/02 QMW 26605E. dangadi KC2699 Eungai Ck NSW 30.90S 152.79E 02/06/02 QMW 26605E. dharawalus KC2638 Wildes Meadow Ck NSW 34.61S 150.52E 02/13/02 QMW 26607E. dharawalus KC2708 Wildes Meadow Ck NSW 34.61S 150.52E 02/13/02 QMW 26607E. diversus KC2773 Ellery Ck VIC 37.37S 148.73E 06/25/94E. diversus KC2841 Martins Ck VIC 38.45S 143.58E 01/05/04E. eungella KC2732 Cattle Ck QLD 21.03S 148.60E 05/29/02 QMW 26608E. eungella KC2663 Cattle Ck QLD 21.03S 148.60E 05/29/02 QMW 26608E. eungella KC2671 Cattle Ck QLD 21.06S 148.56E 02/01/02 QMW 26608E. Xeckeri KC2668 Leichhardt Ck QLD 16.60S 145.28E 06/04/02 QMW 26611E. Xeckeri KC2736 Leichhardt Ck QLD 16.60S 145.28E 06/04/02 QMW 26611E. gamilaroi KC2632 Burrows Ck NSW 31.50S 151.20E 02/08/02 QMW 26621E. gamilaroi KC2702 Burrows Ck NSW 31.50S 151.20E 02/08/02 QMW 26621E. gumar KC2644 Culmaron Ck NSW 28.84S 152.74E 03/04/02 QMW 26622E. gumar KC2715 Culmaron Ck NSW 28.84S 152.74E 03/04/02 QMW 26622E. guwinus (cf?) KC2842 Tianjarra Ck NSW 35.11S 150.33E 01/06/04 QMW 27485E. guwinus (cf?) KC2642 Tianjarra Ck NSW 35.11S 150.33E 02/18/02 QMW 26623E. guwinus (cf?) KC2713 Tianjarra Ck NSW 35.11S 150.33E 02/18/02 QMW 26623E. guwinus (cf?) KC2709 Tianjarra Ck NSW 35.11S 150.33E 02/13/02 QMW 26625E. hystricosus KC2672 Stony Ck QLD 26.86S 152.73E 03/26/92E. hystricosus KC2673 Stony Ck QLD 26.86S 152.73E 03/26/92E. hystricosus KC2691 Booloumbah Ck QLD 26.69S 152.62E 09/29/02 QMW 26628E. jagara KC2763 Shady Ck QLD 27.97S 152.32E 27/09/00E. jagara KC2764 Shady Ck QLD 27.97S 152.32E 27/09/00
(continued on next page)
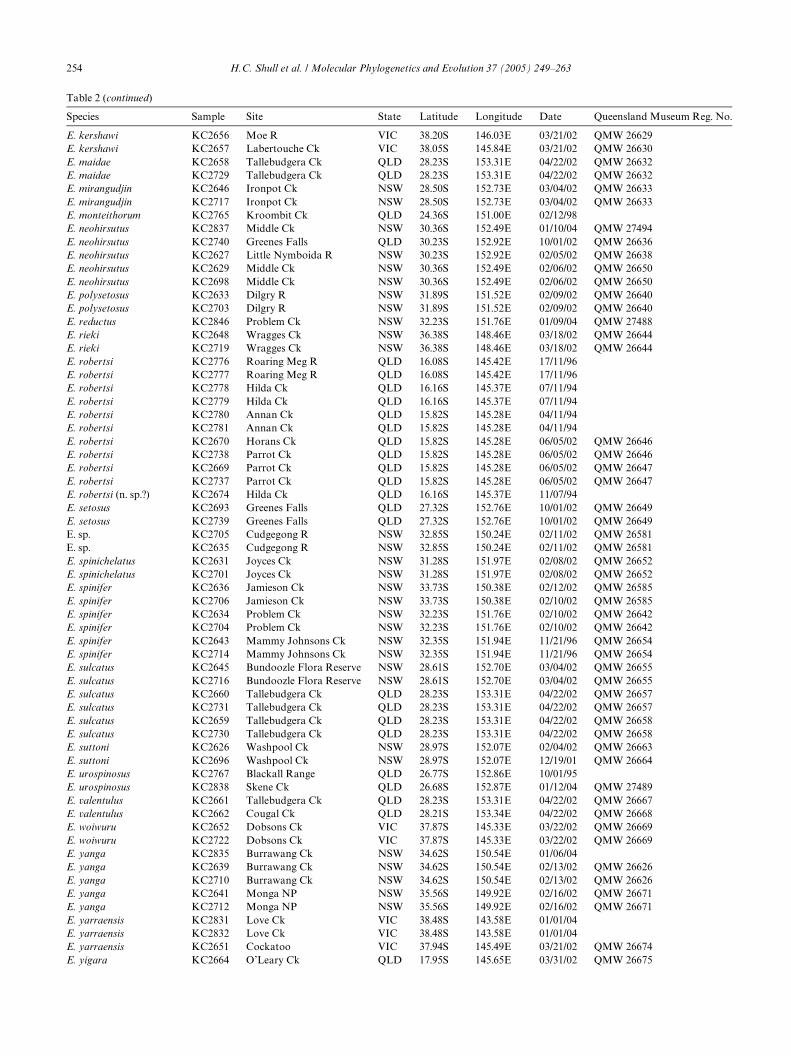
254 H.C. Shull et al. / Molecular Phylogenetics and Evolution 37 (2005) 249–263
Table 2 (continued)
Species Sample Site State Latitude Longitude Date Queensland Museum Reg. No.
E. kershawi KC2656 Moe R VIC 38.20S 146.03E 03/21/02 QMW 26629E. kershawi KC2657 Labertouche Ck VIC 38.05S 145.84E 03/21/02 QMW 26630E. maidae KC2658 Tallebudgera Ck QLD 28.23S 153.31E 04/22/02 QMW 26632E. maidae KC2729 Tallebudgera Ck QLD 28.23S 153.31E 04/22/02 QMW 26632E. mirangudjin KC2646 Ironpot Ck NSW 28.50S 152.73E 03/04/02 QMW 26633E. mirangudjin KC2717 Ironpot Ck NSW 28.50S 152.73E 03/04/02 QMW 26633E. monteithorum KC2765 Kroombit Ck QLD 24.36S 151.00E 02/12/98E. neohirsutus KC2837 Middle Ck NSW 30.36S 152.49E 01/10/04 QMW 27494E. neohirsutus KC2740 Greenes Falls QLD 30.23S 152.92E 10/01/02 QMW 26636E. neohirsutus KC2627 Little Nymboida R NSW 30.23S 152.92E 02/05/02 QMW 26638E. neohirsutus KC2629 Middle Ck NSW 30.36S 152.49E 02/06/02 QMW 26650E. neohirsutus KC2698 Middle Ck NSW 30.36S 152.49E 02/06/02 QMW 26650E. polysetosus KC2633 Dilgry R NSW 31.89S 151.52E 02/09/02 QMW 26640E. polysetosus KC2703 Dilgry R NSW 31.89S 151.52E 02/09/02 QMW 26640E. reductus KC2846 Problem Ck NSW 32.23S 151.76E 01/09/04 QMW 27488E. rieki KC2648 Wragges Ck NSW 36.38S 148.46E 03/18/02 QMW 26644E. rieki KC2719 Wragges Ck NSW 36.38S 148.46E 03/18/02 QMW 26644E. robertsi KC2776 Roaring Meg R QLD 16.08S 145.42E 17/11/96E. robertsi KC2777 Roaring Meg R QLD 16.08S 145.42E 17/11/96E. robertsi KC2778 Hilda Ck QLD 16.16S 145.37E 07/11/94E. robertsi KC2779 Hilda Ck QLD 16.16S 145.37E 07/11/94E. robertsi KC2780 Annan Ck QLD 15.82S 145.28E 04/11/94E. robertsi KC2781 Annan Ck QLD 15.82S 145.28E 04/11/94E. robertsi KC2670 Horans Ck QLD 15.82S 145.28E 06/05/02 QMW 26646E. robertsi KC2738 Parrot Ck QLD 15.82S 145.28E 06/05/02 QMW 26646E. robertsi KC2669 Parrot Ck QLD 15.82S 145.28E 06/05/02 QMW 26647E. robertsi KC2737 Parrot Ck QLD 15.82S 145.28E 06/05/02 QMW 26647E. robertsi (n. sp.?) KC2674 Hilda Ck QLD 16.16S 145.37E 11/07/94E. setosus KC2693 Greenes Falls QLD 27.32S 152.76E 10/01/02 QMW 26649E. setosus KC2739 Greenes Falls QLD 27.32S 152.76E 10/01/02 QMW 26649E. sp. KC2705 Cudgegong R NSW 32.85S 150.24E 02/11/02 QMW 26581E. sp. KC2635 Cudgegong R NSW 32.85S 150.24E 02/11/02 QMW 26581E. spinichelatus KC2631 Joyces Ck NSW 31.28S 151.97E 02/08/02 QMW 26652E. spinichelatus KC2701 Joyces Ck NSW 31.28S 151.97E 02/08/02 QMW 26652E. spinifer KC2636 Jamieson Ck NSW 33.73S 150.38E 02/12/02 QMW 26585E. spinifer KC2706 Jamieson Ck NSW 33.73S 150.38E 02/10/02 QMW 26585E. spinifer KC2634 Problem Ck NSW 32.23S 151.76E 02/10/02 QMW 26642E. spinifer KC2704 Problem Ck NSW 32.23S 151.76E 02/10/02 QMW 26642E. spinifer KC2643 Mammy Johnsons Ck NSW 32.35S 151.94E 11/21/96 QMW 26654E. spinifer KC2714 Mammy Johnsons Ck NSW 32.35S 151.94E 11/21/96 QMW 26654E. sulcatus KC2645 Bundoozle Flora Reserve NSW 28.61S 152.70E 03/04/02 QMW 26655E. sulcatus KC2716 Bundoozle Flora Reserve NSW 28.61S 152.70E 03/04/02 QMW 26655E. sulcatus KC2660 Tallebudgera Ck QLD 28.23S 153.31E 04/22/02 QMW 26657E. sulcatus KC2731 Tallebudgera Ck QLD 28.23S 153.31E 04/22/02 QMW 26657E. sulcatus KC2659 Tallebudgera Ck QLD 28.23S 153.31E 04/22/02 QMW 26658E. sulcatus KC2730 Tallebudgera Ck QLD 28.23S 153.31E 04/22/02 QMW 26658E. suttoni KC2626 Washpool Ck NSW 28.97S 152.07E 02/04/02 QMW 26663E. suttoni KC2696 Washpool Ck NSW 28.97S 152.07E 12/19/01 QMW 26664E. urospinosus KC2767 Blackall Range QLD 26.77S 152.86E 10/01/95E. urospinosus KC2838 Skene Ck QLD 26.68S 152.87E 01/12/04 QMW 27489E. valentulus KC2661 Tallebudgera Ck QLD 28.23S 153.31E 04/22/02 QMW 26667E. valentulus KC2662 Cougal Ck QLD 28.21S 153.34E 04/22/02 QMW 26668E. woiwuru KC2652 Dobsons Ck VIC 37.87S 145.33E 03/22/02 QMW 26669E. woiwuru KC2722 Dobsons Ck VIC 37.87S 145.33E 03/22/02 QMW 26669E. yanga KC2835 Burrawang Ck NSW 34.62S 150.54E 01/06/04E. yanga KC2639 Burrawang Ck NSW 34.62S 150.54E 02/13/02 QMW 26626E. yanga KC2710 Burrawang Ck NSW 34.62S 150.54E 02/13/02 QMW 26626E. yanga KC2641 Monga NP NSW 35.56S 149.92E 02/16/02 QMW 26671E. yanga KC2712 Monga NP NSW 35.56S 149.92E 02/16/02 QMW 26671E. yarraensis KC2831 Love Ck VIC 38.48S 143.58E 01/01/04E. yarraensis KC2832 Love Ck VIC 38.48S 143.58E 01/01/04E. yarraensis KC2651 Cockatoo VIC 37.94S 145.49E 03/21/02 QMW 26674E. yigara KC2664 O’Leary Ck QLD 17.95S 145.65E 03/31/02 QMW 26675
H.C. Shull et al. / Molecular Phylogenetics and Evolution 37 (2005) 249–263 255
alignment is available at the MPE website and the corre-sponding author’s website (http://inbio.byu.edu/Faculty/kac/crandall_lab/pubs.html) and resulting sequenceswere individually deposited into GenBank.
2.3. Testing models of evolution
Each gene region as well as the combined dataset wasrun through Modeltest 3.06 PPC (Posada and Crandall,1998) to Wnd the best model of evolution for the data.The model with the best maximum-likelihood scoreusing the Akaike Information Criterion (AIC) was cho-sen (Akaike, 1973). Theoretically, AIC reduces the num-ber of unnecessary parameters that contribute little todescribing the data by penalizing more complex models(Burnham and Anderson, 2002; Nylander et al., 2004).The combined model was used in the ML and singlemodel Bayesian approaches; individual gene regionmodels were used in the mixed model Bayesian analyses.
2.4. Evaluating congruence of datasets
The incongruence length diVerence (ILD) test (Farriset al., 1994) is a poor test for the combinability of datapartitions into a single dataset (Hipp et al., 2004; Yoderet al., 2001). Therefore, we follow Wiens’ (1998) sugges-tion to estimate a Bayesian phylogeny for each regionand determine if there were any strongly supported con-Xicting clades between gene regions. Here, we considerthat bootstrap support (BS) higher than 70% and a pos-terior probability (pP) 70.95 are considered strong sup-port for a clade (Wilcox et al., 2002; Wong et al., 2004).
2.5. Phylogenetic inference
MrBayes v3.0b4 (Ronquist and Huelsenbeck, 2003)was used to obtain a Bayesian phylogeny for the com-bined dataset of all four genes. We ran diVerent types ofBayesian Markov Chain Monte Carlo (MCMC)
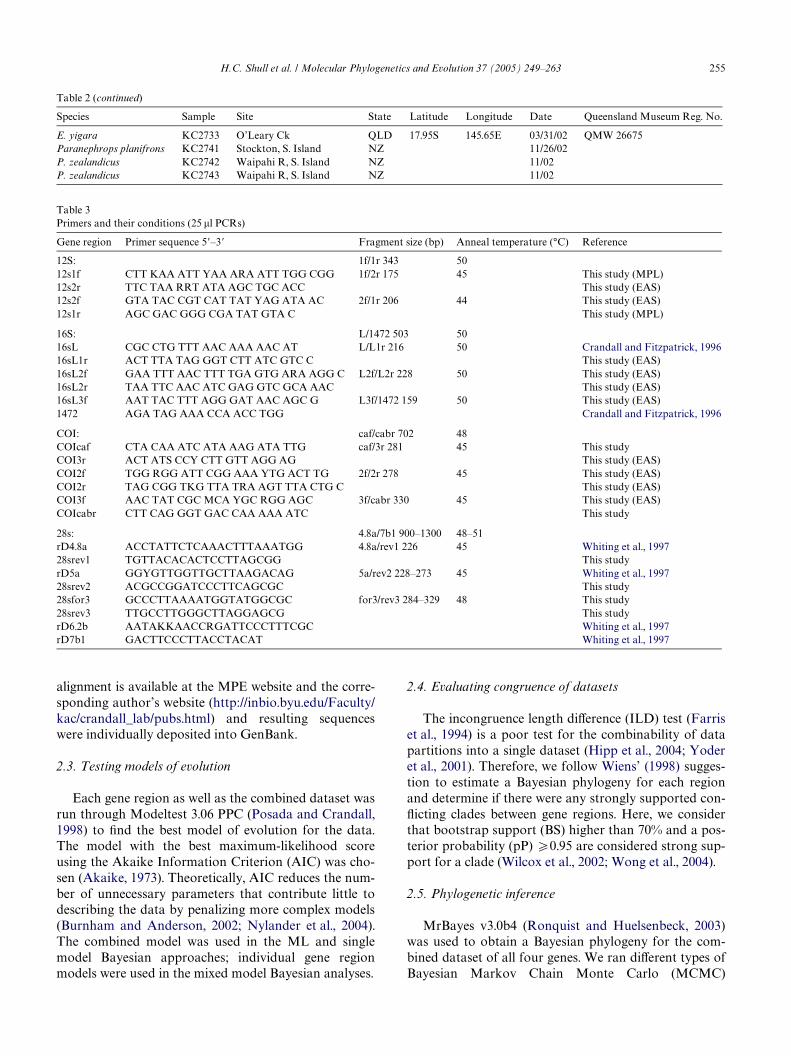
Table 2 (continued)
Species Sample Site State Latitude Longitude Date Queensland Museum Reg. No.
E. yigara KC2733 O’Leary Ck QLD 17.95S 145.65E 03/31/02 QMW 26675Paranephrops planifrons KC2741 Stockton, S. Island NZ 11/26/02P. zealandicus KC2742 Waipahi R, S. Island NZ 11/02P. zealandicus KC2743 Waipahi R, S. Island NZ 11/02
Table 3Primers and their conditions (25 �l PCRs)
Gene region Primer sequence 5�–3� Fragment size (bp) Anneal temperature (°C) Reference
12S: 1f/1r 343 5012s1f CTT KAA ATT YAA ARA ATT TGG CGG 1f/2r 175 45 This study (MPL)12s2r TTC TAA RRT ATA AGC TGC ACC This study (EAS)12s2f GTA TAC CGT CAT TAT YAG ATA AC 2f/1r 206 44 This study (EAS)12s1r AGC GAC GGG CGA TAT GTA C This study (MPL)
16S: L/1472 503 5016sL CGC CTG TTT AAC AAA AAC AT L/L1r 216 50 Crandall and Fitzpatrick, 199616sL1r ACT TTA TAG GGT CTT ATC GTC C This study (EAS)16sL2f GAA TTT AAC TTT TGA GTG ARA AGG C L2f/L2r 228 50 This study (EAS)16sL2r TAA TTC AAC ATC GAG GTC GCA AAC This study (EAS)16sL3f AAT TAC TTT AGG GAT AAC AGC G L3f/1472 159 50 This study (EAS)1472 AGA TAG AAA CCA ACC TGG Crandall and Fitzpatrick, 1996
COI: caf/cabr 702 48COIcaf CTA CAA ATC ATA AAG ATA TTG caf/3r 281 45 This studyCOI3r ACT ATS CCY CTT GTT AGG AG This study (EAS)COI2f TGG RGG ATT CGG AAA YTG ACT TG 2f/2r 278 45 This study (EAS)COI2r TAG CGG TKG TTA TRA AGT TTA CTG C This study (EAS)COI3f AAC TAT CGC MCA YGC RGG AGC 3f/cabr 330 45 This study (EAS)COIcabr CTT CAG GGT GAC CAA AAA ATC This study
28s: 4.8a/7b1 900–1300 48–51rD4.8a ACCTATTCTCAAACTTTAAATGG 4.8a/rev1 226 45 Whiting et al., 199728srev1 TGTTACACACTCCTTAGCGG This studyrD5a GGYGTTGGTTGCTTAAGACAG 5a/rev2 228–273 45 Whiting et al., 199728srev2 ACGCCGGATCCCTTCAGCGC This study28sfor3 GCCCTTAAAATGGTATGGCGC for3/rev3 284–329 48 This study28srev3 TTGCCTTGGGCTTAGGAGCG This studyrD6.2b AATAKKAACCRGATTCCCTTTCGC Whiting et al., 1997rD7b1 GACTTCCCTTACCTACAT Whiting et al., 1997
256 H.C. Shull et al. / Molecular Phylogenetics and Evolution 37 (2005) 249–263
analyses to examine the eVect of model choice and start-ing tree on the resulting parameters and likelihoodscores. For each analysis we ran four Markov chainssimultaneously, starting each chain from a random treefor three million generations, sampling from the chainevery 5000th tree; this produced 601 total trees for eachrun. The prior for each of these analyses was of equalprobability for each tree topology, since no other priorinformation was available.
The Wrst analysis was run with all four genes con-strained under a single model. This analysis was per-formed twice and is referred to as the single modelanalysis. The mixed model version of MrBayes allowsdiVerent likelihood model parameters to be set for eachpartition of the data, so we also performed a mixedmodel analysis (four runs each), with each run startedfrom a random tree, and refer to this as our mixed modelanalysis.
The mixed model analysis was performed under twoconditions, the Wrst with all parameters linked exceptbranch lengths (unlinked branch lengths are consideredproportional), and the second with substitution rates,character state frequencies, gamma shape parameter,and proportion of invariable sites unlinked across thefour partitioned regions. These analyses are referred toas the linked and unlinked mixed model analyses. Eachof these analyses started with a random tree, but we ranthe latter analysis a second time using the maximum-likelihood tree as the initial tree (see below) in anattempt to improve the MCMC search.
Convergence and mixing were checked for eachmodel analysis before combining independent runs asindicated by Huelsenbeck et al. (2001, 2002) andNylander et al. (2004). To monitor convergence, wechecked the plateau phase of all parameter plots and dis-carded the generations from the burn-in phase. We thencompared the 95% credibility interval of each parameterfor signiWcant diVerences as indicated by non-overlap-ping intervals. Finally, we examined the resulting 50%majority rule consensus tree topology from each run bygraphing a bivariate plot of clade probabilities from twoanalyses to calculate their correlation coeYcient. Wethen combined the trees generated from the independentanalyses into one 50% majority rule consensus tree. Tocompare model analyses, we calculated Bayes factors(2 loge (B10)), which is the ratio of the harmonic means ofthe likelihoods of two models (M1 vs. M0) (Nylanderet al., 2004).
Phylogenies were also estimated using the maximum-likelihood approach as implemented in PAUP* v4.0b10(SwoVord, 2002). Heuristic searches were performedwith 10 random sequence additions and tree bisection–reconnection (TBR) branch swapping (Allen and Steel,2001). Nodal support was assessed using the non-para-metric bootstrap procedure (Felsenstein, 1985) with 100bootstrap replicates, TBR branch swapping, and 10 ran-
dom addition replicates. Each replicate took approxi-mately 2 days to run on a Mac OSX G5, so bootstrapvalues were estimated on a reduced dataset with onlyone to two members of each species included.
A parsimony tree was estimated using heuristicsearches in PAUP* v4.0b10 (SwoVord, 2002) under thesame conditions as above, with gaps considered missingdata. Bootstrap values were estimated using the samemethod as above but with 1000 bootstrap replicates.
2.6. Alternative hypothesis testing
Alternative biogeographical hypotheses were tested inan ML framework using the Shimodaira–Hasegawa(SH) test (Shimodaira and Hasegawa, 1999) in PAUP*(using a RELL distribution and 1000 replicates) and in aBayesian framework using posterior probabilities.
3. Results
3.1. Collection and sequencing
This study is based on 40 Euastacus species collectedfrom the wild. Only E. simplex, E. hirsutus, and E. neo-diversus are missing because they were not found in theirarea of occurrence, although E. neodiversus has recentlybeen collected by other researchers (Andrew Murray,personal communication). More extensive Weldworkmust be done to determine if there are still wild popula-tions of the other two species in existence. The totaldataset for this study includes 129 specimens (Table 2),with each taxon having all four gene regions sequenced;the combined dataset contained 2109 characters. All newdata (512 sequences) have been deposited in GenBankunder Accession Numbers DQ006289–DQ006800. Inaddition, four previously published Euastacus sequenceswere also used in our data analyses (AY324335,AY324337, AY324340, and AY324341).
3.2. Congruence and models of evolution
The Bayesian trees based on the four distinct generegions recovered similar topologies; there were twoconXicting clades among all four trees (pP 7 0.95),regarding the monophyly of E. balanensis (possiblyparaphyletic with E. yigara) and the monophyly ofE. robertsi (possibly polyphyletic with E. Xeckeri), butsince these are small topological diVerences compared tothe overall topology of the tree, we combined the fourdatasets into one. The individual gene trees had only7–14 nodes supported by a pP 7 0.95, while those recov-ered from the combined data had 20–27 nodes sup-ported by a pP 7 0.95; this shows promise for the use ofmultiple gene regions, including nuclear loci, in the esti-mation of crayWsh relationships.
H.C. Shull et al. / Molecular Phylogenetics and Evolution 37 (2005) 249–263 257
Our combined dataset resulted in a best likelihoodscore for the transversional model with invariable sitesand rate heterogeneity (TVM + I + �), a subset of theGeneral Time Reversible model (Rodríguez et al., 1990).The estimated nucleotide frequencies were as follows:�A D 0.3128, �C D 0.1897, �G D 0.1819, and �T D 0.3155.The substitution model incorporated the following ratematrix: [A–C] D 1.7312, [A–G] D 7.9981, [A–T] D 1.0407,[C–G] D 0.6953, [C–T] D 7.9981, and [G–T] D 1.0000. Theshape parameter of the discrete gamma distribution wasestimated to be 0.6467 with the proportion of invariablesites equal to 0.5803. The models of evolution for theindividual gene regions were 12S: GTR + I + �, 16S:K81uf + I + �, CO1: TrN + I + �, and 28S: GTR + I + �.These were used to determine the number of substitutiontypes and the inclusion of a gamma rate distributionand/or proportion of invariable sites in the Bayesiananalyses. For a more speciWc description of the modelssee Posada and Crandall (2001).
3.3. Phylogeny estimation
All parameters and likelihoods of the 14 Bayesianruns converged, with non-signiWcant diVerences basedon the 95% credible interval. The correlation between pPfrom independent runs was very high (r > 0.997). There-fore, trees resulting from independent runs (excludingthe burn-in phase) were combined.
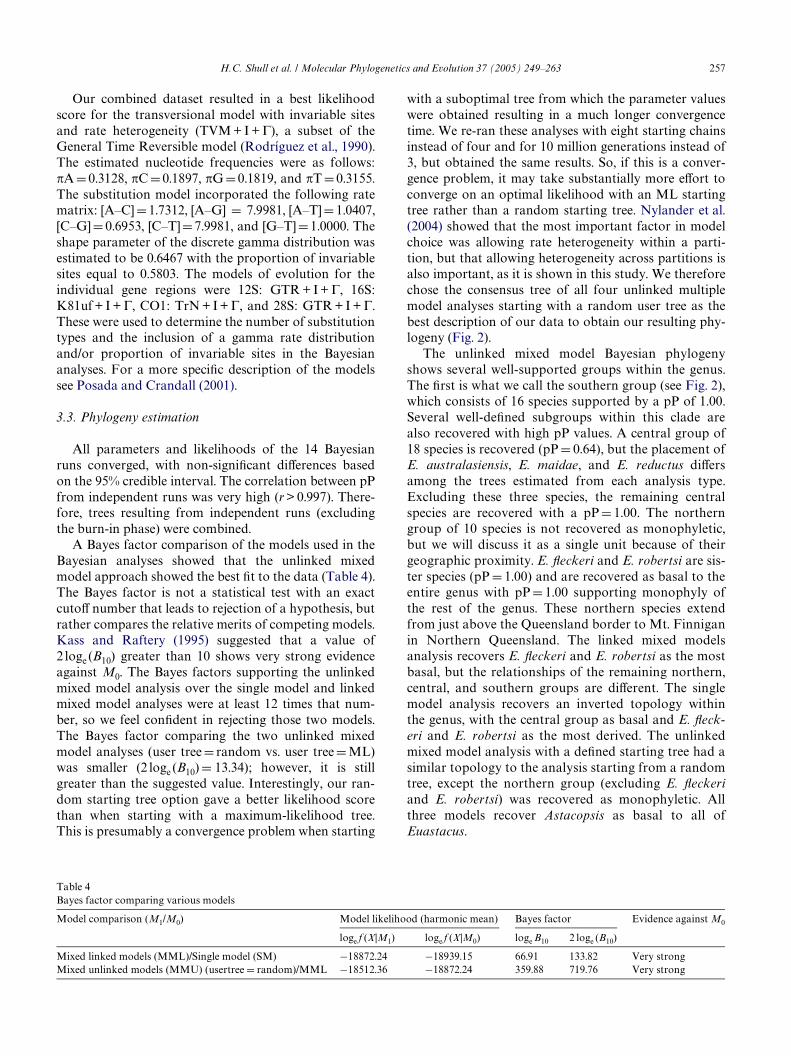
A Bayes factor comparison of the models used in theBayesian analyses showed that the unlinked mixedmodel approach showed the best Wt to the data (Table 4).The Bayes factor is not a statistical test with an exactcutoV number that leads to rejection of a hypothesis, butrather compares the relative merits of competing models.Kass and Raftery (1995) suggested that a value of2 loge (B10) greater than 10 shows very strong evidenceagainst M0. The Bayes factors supporting the unlinkedmixed model analysis over the single model and linkedmixed model analyses were at least 12 times that num-ber, so we feel conWdent in rejecting those two models.The Bayes factor comparing the two unlinked mixedmodel analyses (user tree D random vs. user tree D ML)was smaller (2 loge (B10) D 13.34); however, it is stillgreater than the suggested value. Interestingly, our ran-dom starting tree option gave a better likelihood scorethan when starting with a maximum-likelihood tree.This is presumably a convergence problem when starting
with a suboptimal tree from which the parameter valueswere obtained resulting in a much longer convergencetime. We re-ran these analyses with eight starting chainsinstead of four and for 10 million generations instead of3, but obtained the same results. So, if this is a conver-gence problem, it may take substantially more eVort toconverge on an optimal likelihood with an ML startingtree rather than a random starting tree. Nylander et al.(2004) showed that the most important factor in modelchoice was allowing rate heterogeneity within a parti-tion, but that allowing heterogeneity across partitions isalso important, as it is shown in this study. We thereforechose the consensus tree of all four unlinked multiplemodel analyses starting with a random user tree as thebest description of our data to obtain our resulting phy-logeny (Fig. 2).
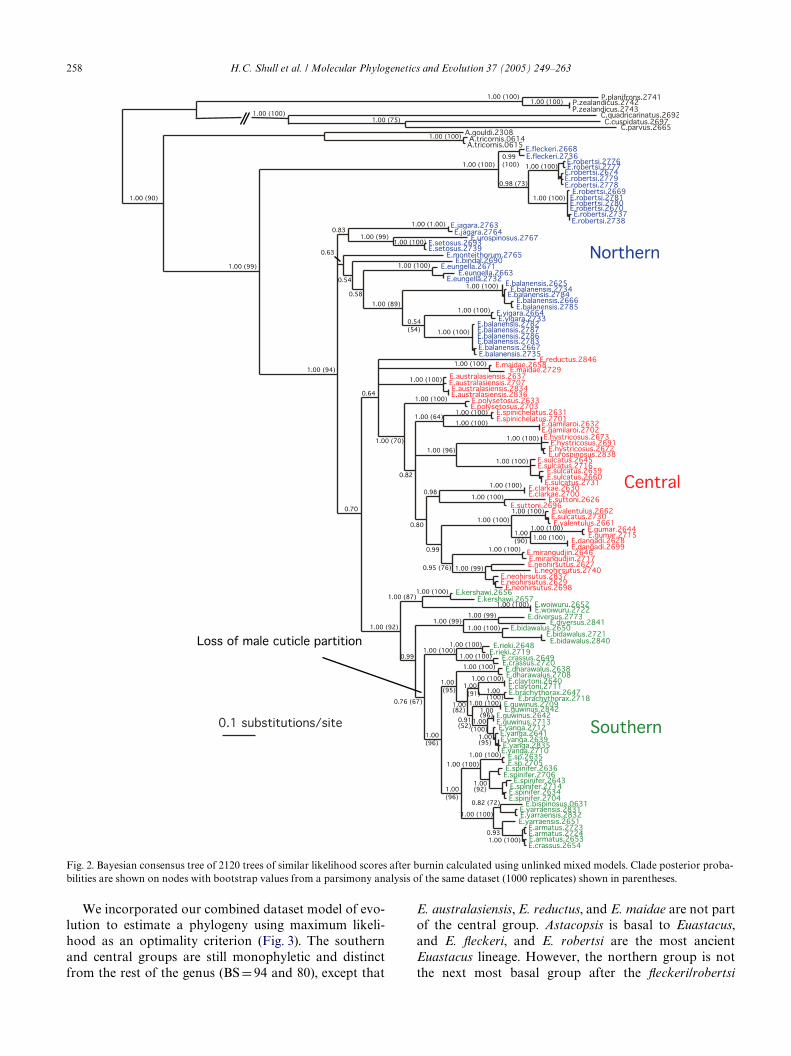
The unlinked mixed model Bayesian phylogenyshows several well-supported groups within the genus.The Wrst is what we call the southern group (see Fig. 2),which consists of 16 species supported by a pP of 1.00.Several well-deWned subgroups within this clade arealso recovered with high pP values. A central group of18 species is recovered (pP D 0.64), but the placement ofE. australasiensis, E. maidae, and E. reductus diVersamong the trees estimated from each analysis type.Excluding these three species, the remaining centralspecies are recovered with a pP D 1.00. The northerngroup of 10 species is not recovered as monophyletic,but we will discuss it as a single unit because of theirgeographic proximity. E. Xeckeri and E. robertsi are sis-ter species (pP D 1.00) and are recovered as basal to theentire genus with pP D 1.00 supporting monophyly ofthe rest of the genus. These northern species extendfrom just above the Queensland border to Mt. Finniganin Northern Queensland. The linked mixed modelsanalysis recovers E. Xeckeri and E. robertsi as the mostbasal, but the relationships of the remaining northern,central, and southern groups are diVerent. The singlemodel analysis recovers an inverted topology withinthe genus, with the central group as basal and E. Xeck-eri and E. robertsi as the most derived. The unlinkedmixed model analysis with a deWned starting tree had asimilar topology to the analysis starting from a randomtree, except the northern group (excluding E. Xeckeriand E. robertsi) was recovered as monophyletic. Allthree models recover Astacopsis as basal to all ofEuastacus.
Table 4Bayes factor comparing various models
Model comparison (M1/M0) Model likelihood (harmonic mean) Bayes factor Evidence against M0
loge f (X|M1) loge f (X|M0) loge B10 2 loge (B10)
Mixed linked models (MML)/Single model (SM) ¡18872.24 ¡18939.15 66.91 133.82 Very strongMixed unlinked models (MMU) (usertree D random)/MML ¡18512.36 ¡18872.24 359.88 719.76 Very strong
258 H.C. Shull et al. / Molecular Phylogenetics and Evolution 37 (2005) 249–263
We incorporated our combined dataset model of evo-lution to estimate a phylogeny using maximum likeli-hood as an optimality criterion (Fig. 3). The southernand central groups are still monophyletic and distinctfrom the rest of the genus (BS D 94 and 80), except that
E. australasiensis, E. reductus, and E. maidae are not partof the central group. Astacopsis is basal to Euastacus,and E. Xeckeri, and E. robertsi are the most ancientEuastacus lineage. However, the northern group is notthe next most basal group after the Xeckeri/robertsi
Fig. 2. Bayesian consensus tree of 2120 trees of similar likelihood scores after burnin calculated using unlinked mixed models. Clade posterior proba-bilities are shown on nodes with bootstrap values from a parsimony analysis of the same dataset (1000 replicates) shown in parentheses.

H.C. Shull et al. / Molecular Phylogenetics and Evolution 37 (2005) 249–263 259
group. The ML tree is nearly identical to the linkedmixed models Bayesian tree. There are two importantconsiderations when comparing the ML and Bayesiananalyses: Wrst, the Bayes factor rejected a topology
nearly identical to the ML tree (the linked mixed modelsanalysis) when compared to the unlinked mixed modelsanalysis; second, the computational time of running fourBayesian runs was less than the time needed for one ML
Fig. 3. Maximum-likelihood phylogeny estimated using the model of evolution TVM + I + G with bootstrap values estimated from a reduced datasetanalysis (100 replicates).
260 H.C. Shull et al. / Molecular Phylogenetics and Evolution 37 (2005) 249–263
heuristic analysis of a dataset of this size. In both ofthese, the analysis using Bayesian unlinked mixed mod-els is superior to the ML analysis.
Our dataset consisted of 639 parsimony-informativecharacters out of 2109 bp. Our MP analysis recovered613 equally parsimonious trees. All nodes deeper thanthe species level were present in a strict consensus tree.All nodes supported with BS > 70 above the species levelwere identical to those in the Bayesian tree (Fig. 2). TheMP tree recovers the southern and central groups(although the central group is supported with only amoderate bootstrap value of 70). The Xeckeri/robertsigroup is recovered with strong support (BS D 100), andalso with strong support (BS D 94) for its position as thesister clade of all other Euastacus. The next most basalgroup is the northern group, which again is recovered asparaphyletic.
3.4. Biogeographical hypothesis testing
The tests described above were used to test hypothe-ses of relationships between speciWc groups. This wouldallow us to clarify the position of these groups to betterinfer the historical processes that occurred in Euastacusand Astacopsis. One hundred percent of the Bayesiantrees in the post-burn-in distribution from the unlinkedmixed model analysis show Astacopsis as the sistergroup to the genus Euastacus. The hypothesis of Astac-opsis being derived from within Euastacus was found tobe signiWcantly worse than Astacopsis as sister to Euasta-cus using the SH test (P D 0.007). All of the Bayesiantrees also show E. Xeckeri and E. robertsi basal to therest of the genus as opposed to derived from within thegenus (P < 0.04 for SH test testing the two alternativehypotheses). Only 70% of the trees show the central andsouthern groups as a clade with all of the northern spe-cies basal. Excluding E. Xeckeri and E. robertsi, an insig-niWcant number of trees show the southern group asbasal to the genus (pP < 0.001) but 29% of the trees showa basal central group. Excluding the Xeckeri/robertsiclade again, the SH test score of a basal southern groupis signiWcantly worse (P < 0.03), but the scores of the cen-tral or the northern group being basal are not signiW-
cantly diVerent. We cannot deWnitively say then whetherthe northern or central group is basal, but we can rejectthe southern clade as being the center of origin of thegenus.
Although the sampling was not extensive for everyspecies, it appears that most species are monophyletic,with the possible exception of E. balanensis and E. guwi-nus. Euastacus balanensis is paraphyletic on theparsimony and Bayesian trees, with E. yigara includedwithin the clade. Monophyly of E. balanensis is notrejected by the SH test (P > 0.3) and has a pPD 0.2. In alltrees, however, it appears that E. balanensis has as much,if not more, genetic diVerentiation between the two main
populations tested (Mt. Bartle Frere vs. LambRange) as is found between other sister speciesgroups (e.g., E. brachythorax/E. claytoni, E. crassus/E. rieki, E. hystricosus/E. sulcatus). Two specimens ofE. guwinus appear in all trees to be basal to a monophy-letic clade of E. guwinus and E. yanga. Euastacus guwinusis sympatric at its single locality with E. yanga, andalthough morphologically it is most similar to E. dharaw-alus (Morgan, 1997), there is very little genetic diVerentia-tion between E. guwinus and E. yanga as seen by the shortbranch lengths connecting them. Three other samples [E.urospinosus (KC2838), E. sulcatus (KC2730), and E. cras-sus (KC2654)] do not group with their own species butgroup quite well with other species (pP D 1.00 in separategene trees and all combined phylogenies); there could beseveral explanations for this, including possible misiden-tiWcations (Crandall and Fitzpatrick, 1996). However,these samples were re-extracted and resequenced toguard against contamination problems and identicalsequences were obtained from the new extractions.
4. Discussion
4.1. Taxonomic classiWcations
This discussion will be restricted to the unlinkedmixed model Bayesian phylogeny except where there arealternative relationships supported by other optimalitycriteria. In these cases, we will refer explicitly to the opti-mality criterion which estimated the relationship inquestion. Monophyly of each species was established inall but a few cases. These few cases warrant furtherexamination through additional collecting and molecu-lar work to accurately delimit species boundaries.
Nearly all previous attempts to estimate relationshipsbetween species of Euastacus have been based on mor-phological characters alone. Riek (1969) divided thegenus into four groups according to the number ofspines on the carpus and estimated relationshipsbetween the groups. His groupings are not consistentwith the central and southern groups; carpal spination isprobably a relatively divergent characteristic. Morgan(1997) believed the presence of a male cuticle partitionwas a more conservative character and divided the genusinto two groups: those with and those without thepartition. He suggested that the presence of a cuticle par-tition was plesiomorphic, but a loss of the characteroccurred early, before the genus had radiatedthroughout eastern Australia. It appears that his group-ing based on the loss of the male cuticle partition is accu-rate, and that the partition was lost only once. All of thespecies without a partition, with the possible exceptionof E. rieki and E. crassus, form a monophyletic groupwith a posterior probability of 1.00 and bootstrap valuesof 95 (MP) and 92 (ML) (E. dharawalus to E. spinifer).
H.C. Shull et al. / Molecular Phylogenetics and Evolution 37 (2005) 249–263 261
The two excluded species can also be included as basal tothe rest of that monophyletic group, but with a pP ofonly 0.76 (MP bootstrap D 67, ML bootstrap D 66).Therefore, we can be fairly conWdent in saying the malecuticle partition was lost only once. Morgan thendivided the groups into species complexes based on mor-phological characters and geographical proximity.Within the northern and central groups, many of Mor-gan’s (1997) groupings based on morphological similar-ity and geographical proximity are concordant with ourWndings. This is less the case in the southern clade, inwhich species are much more widespread and morpho-logical variation is greater.
The Bayesian, ML, and MP trees strongly show thatAstacopsis and Euastacus are sister genera and are diVer-ent enough that each warrants generic status. Mono-phyly of Astacopsis, however, must be cautiouslyinterpreted because only two of the three Astacopsis spe-cies were included in the study. The most intriguing partof this conclusion is that Astacopsis is restricted to theisland of Tasmania, while the most basal Euastacus line-age appears in northeast Australia.
4.2. Biogeographical history of Euastacus
There are two hypotheses concerning the formationof the current species distributions in this genus:vicariance or dispersal. Testing the diVerent biogeo-graphical hypotheses supports the placement of E. Xeck-eri and E. robertsi basal to the rest of the genus. Thedeep split between the Xeckeri/robertsi group and the restof the genus is consistent with the phylogenies of severalother vertebrate and invertebrate species separated bythe Black Mountain Corridor (Hugall et al., 2002), andthe strong morphological divergence between these twospecies and the remainder of the genus, suggestive of anancient vicariant split, has been discussed by Morgan(1988, 1997). This suggests that for some faunal groups,like the freshwater crayWsh, the Black Mountain Corri-dor is a much older barrier to the gene Xow than thePleistocene as suggested in some faunal groups. There isno signiWcant support for the placement of the remain-ing three major lineages in relation to each other, exceptthat the southern group is certainly not basal. The Bayesfactor supports the acceptance of the unlinked mixedmodel topology (which is quite similar to the MP topol-ogy) over the other hypotheses. These trees recover atopology consistent with a north to south dispersal ofthe genus, while the ML tree lacks nodal support for thedeep nodes.
The relatively short internal branch lengths and longertips suggest that there was a rapid historical radiationwithin the four lineages, especially inside the central andsouthern groups, followed by isolated divergence. If this isthe case, it may be diYcult to fully resolve the Euastacusphylogeny even with increasing amounts of data (see Poe
and Chubb, 2004). However, rapid diversiWcation leadingto an unresolved phylogeny could be indicative of vicari-ance (Hoelzer and Melnick, 1994). Ponniah and Hughes(2004) concluded that for the Queensland taxa there wasprobably a vicariant event of at least two ancestral lin-eages that gave rise to current Queensland taxonomicdiversity. Similarly, our phylogeny suggests that therewere four ancestral lineages in Australia that may havediversiWed into the current 44 taxa by simultaneous vicari-ance. Future studies may want to investigate further thesehypotheses regarding the evolution of the four ancestrallineages and the evolution of the current taxa, especiallywith respect to other freshwater organisms that may ormay not show similar patterns of divergence.
5. Conclusions
This is the Wrst attempt to reconstruct a robust phy-logeny of the entire Euastacus genus. When comparingmethods of phylogenetic reconstruction, partitioningand modeling the data by individual gene regions pro-duced superior results to analyses with a single modelapplied to the entire dataset and these results were verysimilar to those using parsimony, although with reducednodal support in the parsimony analysis. With this morecomplex modeling that better reXects the underlyingbiology of the genes used to estimate evolutionary histo-ries, we better resolve the relationship of Euastacus andAstacopsis as monophyletic sister genera. The Wnal Euas-tacus phylogeny supports the monophyletic groupings ofa central and a southern clade along with a more ancientnorthern clade. Our resulting tree now sets the stage forfuture investigations dealing with phylogeography, tax-onomy, conservation, and coevolution within this mostinteresting group of spiny crayWsh.
Acknowledgments
We thank Harry Hines for collecting samples of E. jag-ara and E. montiethorium. We thank Peter Davie, SeniorCurator of Crustacea at the Queensland Museum (QM),for assistance with the identiWcation of crayWsh. The col-lecting for this work was supported by the US NationalScience Foundation (INT-9418425, KAC) and the Aus-tralian Research Council (DP0209237, DB, KS, SL). Thesequencing eVorts were supported by the US NSF (DEB-9702338, KAC), Brigham Young University, and Brook-Weld Zoological Society, Chicago (EAS, KAC). Salarysupport for MPL and HCS was partially provided by USNSF (DEB-0236135). We gratefully acknowledge supportfrom the Brigham Young University OYce of Researchand Creative Activities and the BYU Honor’s Program(HCS). We thank two anonymous reviewers for helpfulcomments to improve our paper.
262 H.C. Shull et al. / Molecular Phylogenetics and Evolution 37 (2005) 249–263
References
Akaike, H., 1973. Information theory as an extension of the maximum-likelihood principle. In: Petrov, B., Csake, F. (Eds.), Second Inter-national Symposium on Information Theory. Akademiai Kiado,Budapest, pp. 267–281.
Allen, B.L., Steel, M., 2001. Subtree transfer operations and theirinduced metrics on evolutionary trees. Annals of Combinatorics 5,1–15.
Austin, C.M., 1996. Systematics of the freshwater crayWsh genus Che-rax Erichson (Decapoda: Parastacidae) in Northern and EasternAustralia: electrophoretic and morphological variation. AustralianJournal of Zoology 44, 259–296.
Bell, K., Yeates, D., Moritz, C., Monteith, G., 2004. Molecular phylog-eny and biogeography of the dung beetle genus TemnoplectronWestwood (Scarabaeidae: Scarabaeinae) from Australia’s wet tro-pics. Molecular Phylogenetics and Evolution 31, 741–753.
Bucklin, A. Allen, L., 2001. MtDNA sequences from formalin-pre-served samples of the euphausiid, Meganyctiphanes norvegica.Unpublished.
Burnham, K., Anderson, D., 2002. Model Selection and MultimodelInference, a Practical Information-Theoretic Approach. Springer,New York.
Clark, E., 1936. The freshwater and land crayWshes of Australia. Mem-oirs of the National Museum of Victoria 10, 5–58.
Clark, E., 1941. Revision of the genus Euastacus (CrayWshes, FamilyParastacidae), with notes on the distribution of certain species.Mem. Nat. Mus. Vict. 12, 7–30.
Coughran, J., 2002. A new species of the freshwater crayWsh genusEuastacus (Decapoda: Parastacidae) from northeastern New SouthWales. Records of the Australian Museum 54, 25–30.
Crandall, K.A., Fetzner Jr, J.W., Jara, C.G., Buckup, L., 2000a. On thephylogenetic positioning of the South American freshwater crayWshgenera (Decapoda: Parastacidae). Journal of Crustacean Biology20, 530–540.
Crandall, K.A., Fetzner Jr, J.W., Lawler, S.H., Kinnersley, M., Austin,C.M., 1999. Phylogenetic relationships among the Australian andNew Zealand genera of freshwater crayWshes (Decapoda: Parastac-idae). Australian Journal of Zoology 47, 199–214.
Crandall, K.A., Fitzpatrick Jr, J.F., 1996. CrayWsh molecular systemat-ics: using a combination of procedures to estimate phylogeny. Sys-tematic Biology 45, 1–26.
Crandall, K.A., Harris, D.J., Fetzner, J.W., 2000b. The monophyleticorigin of freshwater crayWshes estimated from nuclear and mito-chondrial DNA sequences. Proceedings of the Royal Society ofLondon. Series B 267, 1679–1686.
Diaz-Cano, S., Brady, S., 1997. DNA extraction from formalin-Wxed,paraYn-embedded tissues: protein digestion as a limiting step forretrieval of high-quality DNA. Diagnostic Molecular Pathology 6,342–345.
Farris, J.S., Kallersjo, M., Kluge, A.G., Bult, C., 1994. Testing signiW-cance of incongruence. Cladistics 10, 315–320.
Felsenstein, J., 1985. ConWdence limits on phylogenies: an approachusing the bootstrap. Evolution 39, 783–791.
Heller, C., 1865. Crustaceen. In: Reise der osterreichischen FregatteNovara um die Erde in den Jahren 1857, 1858, 1859 unter denBefehlen des Commodore B. von Wullerstorf-Urbair, vol. Zoologi-scher Theil 2(3), pp. 1–280. Wien: Kaiserlichkoniglichen Hof-undStaatsdruckerei.
Hillis, D.M., Huelsenbeck, J.P., Cunningham, C.W., 1994. Applicationand accuracy of molecular phylogenies. Science 264, 671–677.
Hipp, A., Hall, J., Sytsma, K., 2004. Congruence versus phylogeneticaccuracy: revisiting the incongruence length diVerence test. System-atic Biology 53, 81–89.
Hoelzer, G.A., Melnick, D.J., 1994. Patterns of speciation and limits tophylogenetic resolution. Trends in Ecology and Evolution 9,104–107.
Horwitz, P., 1995. The conservation status of Australian freshwatercrayWsh: review and update. Freshwater CrayWsh 10, 70–80.
Huelsenbeck, J.P., 1995. Performance of phylogenetic methods in simu-lation. Systematic Biology 44, 17–48.
Huelsenbeck, J.P., Larget, B., Miller, R., Ronquist, F., 2002. Potentialapplications and pitfalls of Bayesian inference of phylogeny. Sys-tematic Biology 51, 673–688.
Huelsenbeck, J.P., Ronquist, F., Nielsen, R., Bollback, J.P., 2001.Bayesian inference of phylogeny and its impact on evolutionarybiology. Science 294, 2310–2314.
Hugall, A., Moritz, C., Moussali, A., Stanisic, J., 2002. Reconcilingpaleodistribution models and comparative phylogeography in theWet Tropics rainforest land snail Gnarosophia bellendenkerensis(Brazier 1875). Proceedings of the National Academy of Sciences ofthe United States of America 99, 6112–6117.
IUCN, 2001. IUCN Red List Categories: Version 3.1 IUCN SpeciesSurvival Commission, Gland, Switzerland.
Kass, R., Raftery, A., 1995. Bayes factors. Journal of American Statisti-cal Association 90, 773–795.
Lawler, S.H., Crandall, K.A., 1998. The relationship of the Australianfreshwater crayWsh genera Euastacus and Astacopsis. Proceedingsof the Linnean Society of New South Wales 119, 1–8.
McCoy, F., 1888. Astacoides serratus (Shaw sp.) var. yarraensis. Proro-mus Zool 2, 225–227.
McCulloch, A., 1917. Studies in Australian crustacea, part 4. Recordsof the Australian Museum 11.
Merrick, J.R., 1997. Conservation and Weld management of the fresh-water crayWsh, Euastacus spinifer (Decapoda: Parastacidae), in theSydney Region, Australia. Proceedings of the Linnean Society ofNew South Wales 118, 217–225.
Milne Edwards, H., 1837. Histoire naturelle des crustaces, comprenantl’anatomie, la physiologie et la classiWcation de cex animaux. Libra-irie Encyclopedique de Roret 2, 1–532.
Monroe, R., 1977. A new species of Euastacus (Decapoda: Parastaci-dae) from north Queensland. Memoirs of the Queensland Museum18, 65–67.
Morgan, G.J., 1986. Freshwater crayWsh of the genus Euastacus Clark(Decapoda, Parastacidae) from Victoria. Memoirs of the Museumof Victoria 47, 1–57.
Morgan, G.J., 1988. Freshwater crayWsh of the genus Euastacus Clark(Decapoda: Parastacidae) from Queensland. Memoirs of theMuseum of Victoria 49, 1–49.
Morgan, G.J., 1989. Two new species of the freshwater crayWshEuastacus Clark (Decapoda: Parastacidae) from isolated highcountry of Queensland. Memoirs of the Queensland Museum27, 555–562.
Morgan, G.J., 1997. Freshwater crayWsh of the genus EuastacusClark (Decapoda: Parastacidae) from New South Wales, with akey to all species in the genus. Records of the AustralianMuseum 23, 1–110.
Nix, H., 1991. Biogeography: patterns and processes. In: Nix, H., Swit-zer, M. (Eds.), Rainforest animals: atlas of vertebrates endemic toAustralia’s wet tropics. Australian National Parks and WildlifeService, Canberra, pp. 11–39.
Nylander, J., Ronquist, F., Huelsenbeck, J.P., Nieves-Aldrey, J., 2004.Bayesian phylogenetic analysis of combined data. Systematic Biol-ogy, 53.
O’Connor, D., Moritz, C., 2003. A molecular phylogeny of the Austra-lian skink genera Eulamprus, Gnypetoscincus and Nangura. Austra-lian Journal of Zoology 51, 317–330.
Poe, S., Chubb, A., 2004. Birds in a bush: Wve genes indicate explosiveevolution of avian orders. Evolution 58, 404–415.
Ponniah, M., Hughes, J., 2004. The evolution of Queensland spinymountain crayWsh of the genus Euastacus: I. Testing vicariance anddispersal with interspeciWc mtDNA. Evolution 58, 1073–1085.
Posada, D., Crandall, K.A., 1998. Modeltest: testing the model of DNAsubstitution. Bioinformatics 14, 817–818.
H.C. Shull et al. / Molecular Phylogenetics and Evolution 37 (2005) 249–263 263
Posada, D., Crandall, K.A., 2001. Selecting models of nucleotide substi-tution: an application to human immunodeWciency virus 1( HIV-1).Molecular Biology and Evolution 18, 897–906.
Riek, E., 1956. Additions to the Australian freshwater crayWsh.Records of the Australian Museum 24, 1–6.
Riek, E.F., 1951. The freshwater crayWsh (Family Parastacidae) ofQueensland. Record of the Australian Museum 22, 368–388.
Riek, E.F., 1969. The Australian freshwater crayWsh (Crustacea: Deca-poda: Parastacidae), with descriptions of new species. AustralianJournal of Zoology 17, 855–918.
Rodríguez, F., Oliver, J.L., Marin, A., Medina, J.R., 1990. The generalstochastic model of nucleotide substitution. Journal of TheoreticalBiology 142, 485–501.
Ronquist, F., Huelsenbeck, J.P., 2003. MrBayes3: Bayesian phyloge-netic inference under mixed models. Bioinformatics 19, 1572–1574.
Schneider, C., Cunningham, M., Moritz, C., 1998. Comparative phylo-geography and the history of endemic vertebrates in the Wet Tro-pics rainforests of Australia. Molecular Ecology 7, 487–498.
Scholtz, G., Richter, S., 1995. Phylogenetic systematics of the reptan-tian Decapoda (Crustacea, Malacostraca). Zoological Journal ofthe Linnean Society 113, 289–328.
Shimodaira, H., Hasegawa, M., 1999. Multiple comparisons of log-like-lihoods with applications to phylogenetic inference. MolecularBiology and Evolution 16, 1114–1116.
Short, J.W., Davie, P.J.F., 1993. Two new species of freshwater crayWsh(Crustacea: Decapoda: Parastacidae) from Northeastern Queens-land rainforest. Memoirs of the Queensland Museum 34, 69–80.
Smith, G.W., 1912. The freshwater crayWshes of Western Australia.Proceedings of the Zoological Society of London, Series B 1912,144–170.
SwoVord, D.L., 2002. PAUP*: Phylogenetic Analysis Using Parsimony(* and Other Methods). Sinauer, Sunderland, MA.
Thompson, J.D., Gibson, T.J., Plewniak, F., Jeanmougin, F., Higgins,D.G., 1997. The clustalX windows interface: Xexible strategies formultiple sequence alignment aided by quality analysis tools.Nucleic Acids Research 24, 4876–4882.
Versteegen, M., Lawler, S., 1997. Population genetics of the MurrayRiver crayWsh, Euastacus armatus. Freshwater CrayWsh 11, 146–157.
von Martens, E., 1866. On an new species of Astacus. Annals of theMagazine of Natural History. Series 3 17, 359–360.
Watson, K., 1935. A new Astacopsis from north Queensland. Memoirsof the Queensland Museum 10, 232–235.
Whiting, M.F., Carpenter, J.C., Wheeler, Q.D., Wheeler, W.C., 1997.The Strepsiptera problem: phylogeny of the Holometabolous insectorders inferred from 18S and 28S ribosomal DNA sequences andmorphology. Systematic Biology 46, 1–68.
Wiens, J., 1998. Combining data sets with diVerent phylogenetic histo-ries. Systematic Biology 47, 568–581.
Wilcox, T., Zwickl, D., Heath, T., Hillis, D.M., 2002. Phylogenetic rela-tionships of the dwarf boas and a comparison of Bayesian andbootstrap measures of phylogenetic support. Molecular Phyloge-netics and Evolution 25, 361–371.
Wong, B., Keogh, J., McGlashan, D., 2004. Current and historical pat-terns of drainage connectivity in eastern Australia inferred frompopulation genetic structuring in a widespread freshwater WshPseudomugil signifer (Pseudomugilidae). Molecular Ecology 13,391–401.
Yoder, A., Irwin, J., Payseur, B., 2001. Failure of the ILD to determinedata combinability for slow loris phylogeny. Systematic Biology 50,408–424.