phylogeny- and abundance-based metrics allow for the
TRANSCRIPT

fmicb-12-659918 May 5, 2021 Time: 18:17 # 1
ORIGINAL RESEARCHpublished: 11 May 2021
doi: 10.3389/fmicb.2021.659918
Edited by:Alfonso Benítez-Páez,
Principe Felipe Research Center(CIPF), Spain
Reviewed by:Justine W. Debelius,
Karolinska Institutet (KI), SwedenAchim Quaiser,
University of Rennes 1, France
*Correspondence:Alice Risely
Specialty section:This article was submitted to
Microbial Symbioses,a section of the journal
Frontiers in Microbiology
Received: 28 January 2021Accepted: 16 April 2021Published: 11 May 2021
Citation:Risely A, Gillingham MAF,
Béchet A, Brändel S, Heni AC,Heurich M, Menke S, Manser MB,
Tschapka M, Wasimuddin andSommer S (2021) Phylogeny-
and Abundance-Based Metrics Allowfor the Consistent Comparison
of Core Gut Microbiome DiversityIndices Across Host Species.Front. Microbiol. 12:659918.
doi: 10.3389/fmicb.2021.659918
Phylogeny- and Abundance-BasedMetrics Allow for the ConsistentComparison of Core Gut MicrobiomeDiversity Indices Across HostSpeciesAlice Risely1* , Mark A. F. Gillingham1, Arnaud Béchet2, Stefan Brändel1,3,Alexander C. Heni1,3, Marco Heurich4,5,6, Sebastian Menke1, Marta B. Manser7,Marco Tschapka1,3, Wasimuddin1 and Simone Sommer1
1 Institute of Evolutionary Ecology and Conservation Genomics, University of Ulm, Ulm, Germany, 2 Institut de Recherchede la Tour du Valat, Le Sambuc, Arles, France, 3 Smithsonian Tropical Research Institute, Ancon, Panama, 4 Departmentof Visitor Management and National Park Monitoring, Bavarian Forest National Park, Grafenau, Germany, 5 Chair of WildlifeEcology and Management, University of Freiburg, Freiburg, Germany, 6 Institute for Forest and Wildlife Management, InlandNorway University of Applied Sciences, Koppang, Norway, 7 Department of Evolutionary Biology and Environmental Studies,University of Zurich, Zurich, Switzerland
The filtering of gut microbial datasets to retain high prevalence taxa is often performedto identify a common core gut microbiome that may be important for host biologicalfunctions. However, prevalence thresholds used to identify a common core are highlyvariable, and it remains unclear how they affect diversity estimates and whether insightsstemming from core microbiomes are comparable across studies. We hypothesizedthat if macroecological patterns in gut microbiome prevalence and abundance aresimilar across host species, then we would expect that increasing prevalence thresholdswould yield similar changes to alpha diversity and beta dissimilarity scores across hostspecies datasets. We analyzed eight gut microbiome datasets based on 16S rRNAgene amplicon sequencing and collected from different host species to (1) comparemacroecological patterns across datasets, including amplicon sequence variant (ASV)detection rate with sequencing depth and sample size, occupancy-abundance curves,and rank-abundance curves; (2) test whether increasing prevalence thresholds generateuniversal or host-species specific effects on alpha and beta diversity scores; and(3) test whether diversity scores from prevalence-filtered core communities correlatewith unfiltered data. We found that gut microbiomes collected from diverse hostsdemonstrated similar ASV detection rates with sequencing depth, yet required differentsample sizes to sufficiently capture rare ASVs across the host population. This suggeststhat sample size rather than sequencing depth tends to limit the ability of studies todetect rare ASVs across the host population. Despite differences in the distributionand detection of rare ASVs, microbiomes exhibited similar occupancy-abundance andrank-abundance curves. Consequently, increasing prevalence thresholds generatedremarkably similar trends in standardized alpha diversity and beta dissimilarity acrossspecies datasets until high thresholds above 70%. At this point, diversity scores tendedto become unpredictable for some diversity measures. Moreover, high prevalence
Frontiers in Microbiology | www.frontiersin.org 1 May 2021 | Volume 12 | Article 659918
fmicb-12-659918 May 5, 2021 Time: 18:17 # 2
Risely et al. Filtering Effects on Core Microbiome
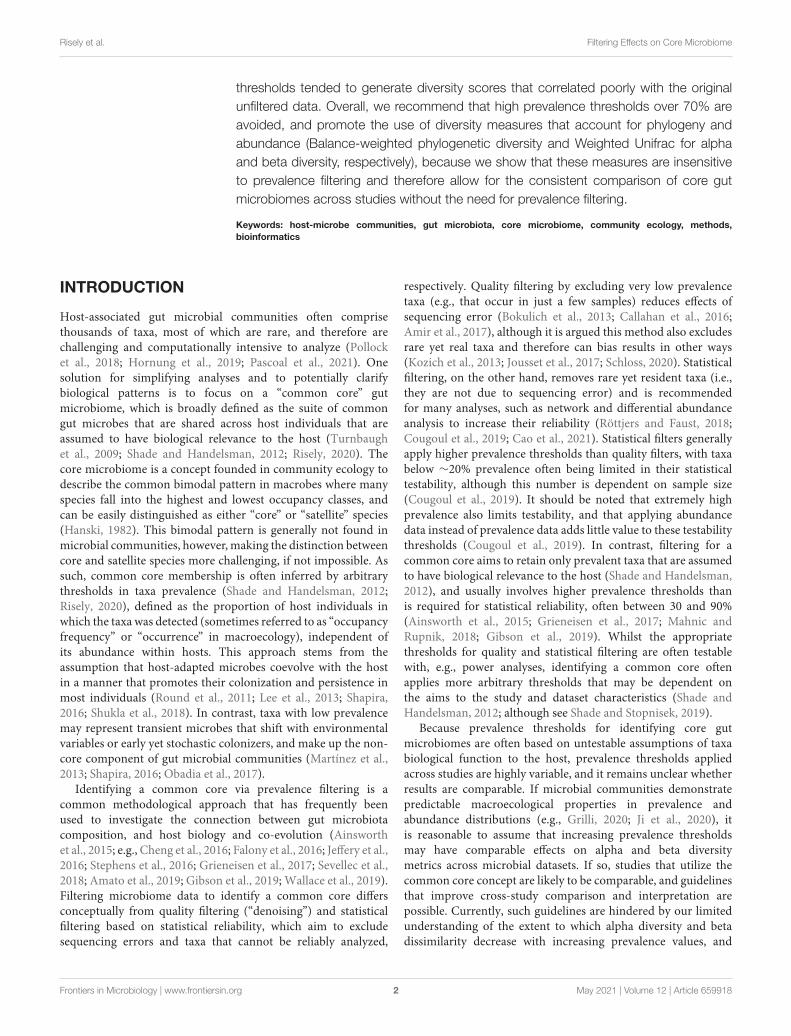
thresholds tended to generate diversity scores that correlated poorly with the originalunfiltered data. Overall, we recommend that high prevalence thresholds over 70% areavoided, and promote the use of diversity measures that account for phylogeny andabundance (Balance-weighted phylogenetic diversity and Weighted Unifrac for alphaand beta diversity, respectively), because we show that these measures are insensitiveto prevalence filtering and therefore allow for the consistent comparison of core gutmicrobiomes across studies without the need for prevalence filtering.
Keywords: host-microbe communities, gut microbiota, core microbiome, community ecology, methods,bioinformatics
INTRODUCTION
Host-associated gut microbial communities often comprisethousands of taxa, most of which are rare, and therefore arechallenging and computationally intensive to analyze (Pollocket al., 2018; Hornung et al., 2019; Pascoal et al., 2021). Onesolution for simplifying analyses and to potentially clarifybiological patterns is to focus on a “common core” gutmicrobiome, which is broadly defined as the suite of commongut microbes that are shared across host individuals that areassumed to have biological relevance to the host (Turnbaughet al., 2009; Shade and Handelsman, 2012; Risely, 2020). Thecore microbiome is a concept founded in community ecology todescribe the common bimodal pattern in macrobes where manyspecies fall into the highest and lowest occupancy classes, andcan be easily distinguished as either “core” or “satellite” species(Hanski, 1982). This bimodal pattern is generally not found inmicrobial communities, however, making the distinction betweencore and satellite species more challenging, if not impossible. Assuch, common core membership is often inferred by arbitrarythresholds in taxa prevalence (Shade and Handelsman, 2012;Risely, 2020), defined as the proportion of host individuals inwhich the taxa was detected (sometimes referred to as “occupancyfrequency” or “occurrence” in macroecology), independent ofits abundance within hosts. This approach stems from theassumption that host-adapted microbes coevolve with the hostin a manner that promotes their colonization and persistence inmost individuals (Round et al., 2011; Lee et al., 2013; Shapira,2016; Shukla et al., 2018). In contrast, taxa with low prevalencemay represent transient microbes that shift with environmentalvariables or early yet stochastic colonizers, and make up the non-core component of gut microbial communities (Martínez et al.,2013; Shapira, 2016; Obadia et al., 2017).
Identifying a common core via prevalence filtering is acommon methodological approach that has frequently beenused to investigate the connection between gut microbiotacomposition, and host biology and co-evolution (Ainsworthet al., 2015; e.g., Cheng et al., 2016; Falony et al., 2016; Jeffery et al.,2016; Stephens et al., 2016; Grieneisen et al., 2017; Sevellec et al.,2018; Amato et al., 2019; Gibson et al., 2019; Wallace et al., 2019).Filtering microbiome data to identify a common core differsconceptually from quality filtering (“denoising”) and statisticalfiltering based on statistical reliability, which aim to excludesequencing errors and taxa that cannot be reliably analyzed,
respectively. Quality filtering by excluding very low prevalencetaxa (e.g., that occur in just a few samples) reduces effects ofsequencing error (Bokulich et al., 2013; Callahan et al., 2016;Amir et al., 2017), although it is argued this method also excludesrare yet real taxa and therefore can bias results in other ways(Kozich et al., 2013; Jousset et al., 2017; Schloss, 2020). Statisticalfiltering, on the other hand, removes rare yet resident taxa (i.e.,they are not due to sequencing error) and is recommendedfor many analyses, such as network and differential abundanceanalysis to increase their reliability (Röttjers and Faust, 2018;Cougoul et al., 2019; Cao et al., 2021). Statistical filters generallyapply higher prevalence thresholds than quality filters, with taxabelow ∼20% prevalence often being limited in their statisticaltestability, although this number is dependent on sample size(Cougoul et al., 2019). It should be noted that extremely highprevalence also limits testability, and that applying abundancedata instead of prevalence data adds little value to these testabilitythresholds (Cougoul et al., 2019). In contrast, filtering for acommon core aims to retain only prevalent taxa that are assumedto have biological relevance to the host (Shade and Handelsman,2012), and usually involves higher prevalence thresholds thanis required for statistical reliability, often between 30 and 90%(Ainsworth et al., 2015; Grieneisen et al., 2017; Mahnic andRupnik, 2018; Gibson et al., 2019). Whilst the appropriatethresholds for quality and statistical filtering are often testablewith, e.g., power analyses, identifying a common core oftenapplies more arbitrary thresholds that may be dependent onthe aims to the study and dataset characteristics (Shade andHandelsman, 2012; although see Shade and Stopnisek, 2019).
Because prevalence thresholds for identifying core gutmicrobiomes are often based on untestable assumptions of taxabiological function to the host, prevalence thresholds appliedacross studies are highly variable, and it remains unclear whetherresults are comparable. If microbial communities demonstratepredictable macroecological properties in prevalence andabundance distributions (e.g., Grilli, 2020; Ji et al., 2020), itis reasonable to assume that increasing prevalence thresholdsmay have comparable effects on alpha and beta diversitymetrics across microbial datasets. If so, studies that utilize thecommon core concept are likely to be comparable, and guidelinesthat improve cross-study comparison and interpretation arepossible. Currently, such guidelines are hindered by our limitedunderstanding of the extent to which alpha diversity and betadissimilarity decrease with increasing prevalence values, and
Frontiers in Microbiology | www.frontiersin.org 2 May 2021 | Volume 12 | Article 659918

fmicb-12-659918 May 5, 2021 Time: 18:17 # 3
Risely et al. Filtering Effects on Core Microbiome
whether such affects are consistent across datasets and diversityindices. Understanding these patterns has implications for thechoice of prevalence threshold and community metrics used incommunity-level analyses across different host species, as wellas cross-study standardization. However, prevalence estimatesrequire numerous host individuals sampled per population, andgut microbial datasets consisting of such sample sizes for wildpopulations are relatively rare, therefore this question has notbeen formally tested across datasets.
To examine the effect of increasing prevalence thresholds onalpha diversity and beta dissimilarity across gut microbialdatasets, we analyzed 16S rRNA gene amplicon-basedmicrobiome data of 1,970 individuals from humans and sevenspecies of wild mammals and birds. These datasets vary in theirsampling protocol and host species ecology, yet are characterizedby reasonably high frequency sampling of individuals (between98 and 552), therefore allowing us to estimate reasonablyprecise prevalence and abundance distributions. Our studyhas three aims: (1) to compare macroecological patterns ofgut microbiomes collected from diverse host species, includingexamining differences in amplicon sequence variant (ASV)detection rate with sequencing depth and sample size, anddifferences in occupancy-abundance and rank-abundancecurves; (2) to test whether increasing prevalence thresholds toidentify a core microbiome generates universal or host-speciesspecific effects on eight measures of alpha and beta diversitythat vary in how they weight ASV abundance and phylogeny(Table 1); and (3) to test whether diversity scores from filteredcore communities correlate with the original unfiltered data.Together, these results facilitate the analysis of common coregut microbiomes by providing baseline information on ASVdistributions and the downstream effects of prevalence filteringacross a broad range of host species.
MATERIALS AND METHODS
DatasetsGut microbiota 16S rRNA gene amplicon data from humansand seven wildlife species were analyzed from raw sequencedata and metadata per species dataset are outlined in Table 2.These datasets include publicly available human gut microbiomesamples from the American Gut Project study (n = 500) and datacollected by authors as part of various ecological studies, suchas meerkats Suricata suricatta from South Africa (n = 137), reddeer from Germany Cervus elaphus (n = 136), Seba’s short-tailedbat Carollia perspicillata from Panama (n = 169), Tome’s spinyrat Proechimys semispinosus from Panama (n = 196), gray-brownmouse lemur Microcebus grisorufus from Madagascar (n = 182),greater flamingo Phoenicopterus roseus juveniles (2–4 monthsold) from three breeding sites in France and Spain (n = 552),and red-necked stint Calidris ruficollis from Australia (n = 98).Samples collected from meerkats, red deer, Carollia bats, andspiny rats were collected from sites within small geographic areasspanning approximately 20 km or under. Flamingo juvenileswere sampled at three separate breeding areas in southernFrance and Spain. Stint were sampled over a large geographic
range on the northern-western and southern coasts of Australia.Temporally, red deer samples were collected within 1 week,but meerkats, Carollia bats, spiny rats, mouse lemurs and stintsamples were collected over approximately 2 years or more.Details on each dataset, including site of collection, sampletype and preservation, 16S rRNA gene hypervariable regionsamplified, read counts, associated publications, and data storageon public repositories from where sequences can be downloadedare outlined in Table 2.
DNA Extraction, PCR Amplification, and16S rRNA SequencingDNA was extracted from fecal samples for all species exceptfor flamingos and red-necked stint, for which cloacal swabswere used. Detailed DNA extraction and PCR protocols forhumans, flamingos, red deer, mouse lemur, and red-neckedstint can be found in their associated publications (McDonaldet al., 2018; Risely et al., 2018; Gillingham et al., 2019;Menke et al., 2019; Wasimuddin et al., 2019). Samples frommeerkats, red deer, spiny rats, mouse lemur, and flamingoswere processed at University of Ulm using the followingprotocol: DNA was extracted from fecal samples using eitherthe Qiagen Cador Pathogen extraction kit (Qiagen, Hilden,Germany; flamingo samples), or the NucleoSpin Soil Kit(Macherey-Nagel, Germany; samples from all other species)following the manufacturer’s instructions. This protocol includesa bead-beating step to mechanically lyse bacterial cells usingceramic beads that was carried out using the SpeedMill PLUS(Analytik Jena, Germany) following manufacturer’s instructions.Polymerase chain reaction (PCR) amplification and barcodingwere conducted in two steps (two-step PCR). In the firststep, the 291 bp fragment of the hypervariable V4 regionlocated in the 16S rRNA gene was targeted using the universalbacterial primers 515F (5’-GTGCCAGCMGCCGCGGTAA-3’)and 806R (5’-GGACTACHVGGGTWTCTAAT-3’), appendedwith forward-primer CS1 adapters (CS1-515F) and reverse-primer CS2 adapters (CS2-806R) in order to use Fluidigmchemistry (Access Array System for Illumina SequencingSystems, Fluidigm Corporation). PCR reactions of 10 µLconsisted of 200 nM primers (pooled forward and reverseprimers), 5 µL AmpliTaq Gold 360 Master Mix, 1 µL extractedDNA sample, 1 µL DNA template (5–10 ng), and dH20. PCRconditions were as follows: initial denaturation at 95◦C for10 min, 30 cycles at 95◦C for 30 s for denaturation, 60◦Cfor 30 s for annealing, and 72◦C for 45 s for elongation,followed by a final elongation at 72◦C for 10 min. In thesecond PCR step, the CS adapters were attached to sample-specific primer pairs that contained 10 bp barcodes andadapter sequences used for Illumina sequencing. PCR reactionsof 20 µL consisted of 4 µL (400 nM) barcode primers(pooled forward and reverse primers), 10 µL AmpliTaq Gold360 Master Mix, 3 µL amplified DNA from PCR step one,and dH20. PCR conditions were as above, but included 10cycles instead of 30. For red-necked stint samples, DNA wasextracted from swabs using the phenol-chloroform method(Risely et al., 2018), and the V1-V3 region was amplified with
Frontiers in Microbiology | www.frontiersin.org 3 May 2021 | Volume 12 | Article 659918

fmicb-12-659918 May 5, 2021 Time: 18:17 # 4
Risely et al. Filtering Effects on Core Microbiome
TABLE 1 | Definitions and descriptions for alpha and beta diversity measures applied in this study.
Diversity measure Index Weighting Description References
Alpha Observed richness Not weighted Number of ASVs detected per sample NA
Faith’s PD Phylogeny-weighted Sum of the branch lengths of the phylogenetic tree connecting allmicrobial taxa present within a sample
Daniel, 1992; Chao et al.,2015
Shannon Abundance-weighted A diversity index based on the number of ASVs present and theirabundance distribution (evenness)
Shannon, 1948
BWPD Phylogeny- andabundance-weighted
Abundance-weighted extension of phylogenetic diversity McCoy and Matsen, 2013
Beta Jaccard Not weighted Variability in microbial composition among sampled communities, withcomposition measured by which ASVs are present or absent
Jaccard, 1912
Unweighted Unifrac Phylogeny-weighted Variability in microbial composition among sampled communities basedon the lineages they contain
Lozupone and Knight, 2005
Morisita Abundance-weighted Variability in microbial composition among sampled communities basedon ASV presence and abundance. Sensitive to the most abundantspecies
Morisita, 1959; Chao et al.,2006
Weighted Unifrac Phylogeny- andabundance-weighted
Abundance-weighted extension of Unweighted Unifrac Lozupone et al., 2007
TABLE 2 | Metadata associated with each dataset.
Species Latin name Country No. ofsamples
Sampletype
Samplebuffer
16S Primers Mean readcount per
sample
Associatedpublication
Data availability
Humans Homo sapiens United States 500 Feces None 515F/806R(V4)
33,454 American GutProject
NCBI BioProjectPRJEB11419
Meerkat Suricatasuricatta
South Africa 137 Feces None/RNAlater
515F/806R(V4)
129,011 NA NCBI BioProjectPRJNA715730
Red deer Cervus elaphus Germany 136 Feces RNAlater 515F/806R(V4)
48,667 Menke et al.,2019
https://doi.org/10.5061/
dryad.7r22vb1
Seba’s short-tailedbat
Carolliaperspicillata
Panama 169 Feces RNAlater 515F/806R(V4)
36,549 NA NCBI BioProjectPRJNA715730
Tome’s spiny rat Proechimyssemispinosus
Panama 196 Feces RNAlater 515F/806R(V4)
25,045 Fackelmannet al., 2021
NCBI BioProjectPRJNA715350
Gray-brown mouselemur
Microcebusgrisorufus
Madagascar 182 Feces RNAlater 515F/806R(V4)
49,910 Wasimuddinet al., 2019
NCBI BioProjectPRJNA715730
Greater flamingo Phoenicopterusroseus
France 552 Cloacalswab
RNAlater 515RF/806R(V4)
27,970 Gillinghamet al., 2019
NCBI BioProjectPRJNA485732
Red-necked stint Calidris ruficollis Australia 98 Cloacalswab
None 27F/519R(V1-3)
42,573 Risely et al.,2018
NCBI BioProjectPRJNA385545
the primer pair 27F (5′-AGAGTTTGATCMTGGCTCAG-3′)and 519R (5′-GWATTACCGCGGCKGCTG-3′; Table 2). DNAwas amplified and sequenced at the Ramaciotti Centre forGenomics, Sydney, following Earth Microbiome Project 16Sprotocol (Thompson et al., 2017). Samples for humans werecollected and processes as part of the American Gut Project, andDNA extraction and PCR amplification of the V4 region followedstandard EMP protocols (McDonald et al., 2018). For all datasets,amplicons were sequenced with Illumina MiSeq technology over2× 250 cycles.
BioinformaticsAll sequence reads were processed using QIIME2 (Bolyen et al.,2019). For all datasets except for humans, sequences were merged,quality filtered, and chimera filtered using the DADA2 pipeline(Callahan et al., 2016) to generate ASVs (amplicon sequence
variants that differ by one nucleotide; Callahan et al., 2017).For the human dataset, merged sequences were downloaded.Human sequences were therefore treated as single end readsand processed with DADA2 for quality and chimera filtering,for consistency with paired-end reads. ASVs were assigned ataxonomy using SILVA (release 132). A tree was built usingFastTree 2.1.8 (Price et al., 2010) for phylogenetic analyses. Anarchaeal sequence (accession number: KU656649) was used toroot the tree and was removed prior to analysis. ASVs werefiltered if they were not bacteria, not assigned to a phylum (asthese are assumed to be spurious), or if they were classifiedas mitochondria or chloroplasts at the family and class level,respectively. DADA2 automatically discards singletons, but noother ASVs were excluded. Only samples that had over 10,000reads post filtering were retained and presented here, in order tominimize the effect of low read counts on results.
Frontiers in Microbiology | www.frontiersin.org 4 May 2021 | Volume 12 | Article 659918

fmicb-12-659918 May 5, 2021 Time: 18:17 # 5
Risely et al. Filtering Effects on Core Microbiome
Data AnalysisWe first aimed to test whether the species datasets demonstratedsimilar macroecological patterns, including ASV detection rateswith sequencing depth and sample size. Measuring ASVdetection rates allows us to assess how reliable ASV prevalenceand abundance distributions are. To this end, we generatedASV accumulation curves with sequencing depth per sampleand accumulation curves with sample size per dataset to assesshow well rare (both in terms of prevalence and abundance)ASVs were represented. We used the vegan:specaccum function(Jari Oksanen et al., 2018) with 999 permutations and theranacapa:ggrare function to generate accumulation curves onunnormalized data. We next wanted to predict the total numberof ASVs harbored by the sampled individuals of a species,in order to estimate the proportion of ASVs that remainedundetected. To do this we used the vegan:specpool function,applying the “Jackknife 1” method. Because accumulation curvesof percent ASVs detected (out of predicted total number of ASVs)seemed to differ markedly between datasets, we investigated thisfurther by testing how sample size affects estimates of the overallASV pool of a species, using the vegan:poolaccum function, andlinked this to the proportion of ASVs that only occur in oneindividual. Lastly, we compared occupancy-abundance curvesand rank abundance curves between species datasets.
Our second aim was to examine the effect of increasingprevalence thresholds on within-individual alpha diversity andbeta dissimilarity scores. We first rarefied each dataset to 10,000to control for differences in sequencing depth between datasets,and rarefying is proposed to be an appropriate normalizationmethod for alpha and beta diversity analyses (Weiss et al.,2017; McKnight et al., 2019). We repeated analyses withoutnormalizing, which generated similar results. In addition,core microbiomes are usually identified from rarefied datasets(Grieneisen et al., 2017; Russell et al., 2019), and therefore thismethod reflects common practice. We next subsetted the rarefieddataset by prevalence at 10% intervals (all ASVs, 10, 20, 90%). Wecalculated four alpha diversity metrics (Table 1) that accountedfor observed diversity (number of ASVs), phylogenetic-weighteddiversity (Faith’s phylogenetic diversity), abundance-weighteddiversity (Shannon index), and abundance- and phylogenetic-weighted diversity (balance-weighted phylogenetic diversity(BWPD); McCoy and Matsen, 2013). Alpha diversity scores weremean centered and scaled per species, using the scale function,in order to account for natural differences in alpha diversitybetween species, because our aim is to understand relativeeffects of prevalence thresholds on gut microbiomes rather thanabsolute effects.
We next calculated mean beta-diversity dissimilarity scores foreach individual applying four different measures of beta diversity(Table 1; Anderson et al., 2011). As with our choice of alphadiversity indices, we applied a metric that does not account foreither abundance or phylogeny (i.e., only presence/absence oftaxa, Jaccard), one that just account for abundance (Morisita),one that just accounts for phylogeny (Unweighted Unifrac),and one that accounts for both abundance and phylogeny(Weighted Unifrac). We chose the Morisita index over the more
commonly applied Bray-Curtis index because Bray-Curtis wasalmost perfectly correlated with Jaccard, and Morisita is moresensitive to abundant species (Barwell et al., 2015) and thereforeis more appropriate for detecting the effects of abundant taxaon community structure within large, diverse communities. Betadissimilarity scores vary between zero (highly similar) and one(highly dissimilar). We tested whether increasing prevalencethresholds affected variation in alpha and beta diversity acrosssamples with Bartlett’s test, which tests whether measuresacross groups have equal variation. We also tested whether thenumber of reads remaining after prevalence filtering correlatedwith diversity measures using Spearman’s correlation, becausevariation in read depth post prevalence filtering may biasweighted diversity scores.
Our third aim was to test whether diversity scores of gutcore microbiomes correlated with the original unfiltered datasets.We correlated alpha and beta diversity scores at each prevalencethreshold with scores from the original, unfiltered dataset usingSpearmans correlation. We extracted Spearman’s rho (effect size)and p-values and plotted effect sizes by species dataset.
All diversity analyses were carried out using the packagesphyloseq (McMurdie and Holmes, 2013) vegan (Jari Oksanenet al., 2018), metagMisc1, btools2, picante (Kembel et al., 2010),and microbiome (Lahti et al., 2017). All analyses were carriedout in R version 3.5.3. R code and processed data are available todownload at https://github.com/Riselya/Prevalence-Thresholds-Metaanalysis, and an R markdown document outlining theanalysis is available as Supplementary Data Table 1.
RESULTS
ASV Detection Rate andMacroecological CurvesWe first compared species datasets to test whether sequencingdepth per sample and sampling depth per dataset adequatelycaptured within-sample and population-level ASV pools,respectively. For all datasets, ASV accumulation curves showedthat ASV detection leveled off at a sequencing depth of 10,000,indicating that sequence depth is not a limiting factor for ASVdetection beyond 10,000 reads (Figure 1A). Comparisons ofASV accumulation curves according to sample size revealeda large divergence between datasets, with some showing veryshallow curves (e.g., mouse lemurs and spiny rats) and othersshowing very steep curves with no indication of leveling off (e.g.,Carollia bats and red-necked stint; Figure 1B). We estimated thetotal ASV pool for each dataset (dashed lined and final point inFigure 1B) which suggested that approximately 50–60% of ASVspredicted to be present in the sampled population were detectedacross datasets (Figure 1C). However, these predictions assumea closed system where no new ASVs are introduced, thereforeare likely to be an underestimate. Further investigation revealedthat estimates of total ASV diversity at the host population level
1https://github.com/vmikk/metagMisc2https://github.com/twbattaglia/btools
Frontiers in Microbiology | www.frontiersin.org 5 May 2021 | Volume 12 | Article 659918

fmicb-12-659918 May 5, 2021 Time: 18:17 # 6
Risely et al. Filtering Effects on Core Microbiome
FIGURE 1 | Comparison of ASV detection rates and macroecological patterns across species datasets. (A) Rarefaction curves per species dataset, showing ASVdetection with increasing sequencing depth per sample. To facilitate comparison, the 200 ASV mark is represented by a dashed line, and 10,000 reads is indicatedwith a solid line. X-axis ticks mark every 10,000. (B) ASV accumulation curves with sample size, showing the extent to which each additional sample increases totalnumber of ASVs detected per species dataset. Dashed lines represent extrapolations to the total number of ASVs predicted to be within the overall ASV pool,represented by end points. (C) Percent of total (predicted) ASVs detected with increasing sample size per species dataset. The dashed horizonal line marks 50% ofASVs detected, whilst the vertical dashed lines represent the sample size required to detect 50% of predicted ASVs. (D) The relationship between sample size andpredictions of the overall ASV pool. Dashed lines represent the final ASV pool prediction per dataset, which match those shown in Figure 1A. (E) ASV prevalencedistribution per dataset, showing the proportion of ASVs found in just one sample (dark blue) to the proportion found in over eight samples (yellow). (F) ASVprevalence distribution per sample, showing mean proportion of ASVs per sample found in just that sample (dark blue) to proportion found in at least eight othersamples (yellow). (G) Abundance-occupancy curves per dataset. (H) Rank-abundance curves per species dataset.
are strongly dependent on sample size (Figure 1D), suggestingthat each new sample adds a unique suite of ASVs and affectspredictions of total ASV diversity. This bias was most severefor Carollia bats and red-necked stint datasets, with samplesize having very large effects on predictions. We examined thesource of this variation and found that whilst most datasetswere characterized by a high proportion of ASVs occurring injust one individual (mean 60% of ASVs; Figure 1E), samplesfrom Carollia and red-necked stint tended to be much moreindividualized that those from other species. On average, 39and 26% of ASVs per sample were unique to each samplefor Carollia and red-necked stint, respectively, compared toapproximately 8% in other datasets (Figure 1F). Therefore,species datasets diverged in their distribution and detection ofrare taxa. Despite this divergence, we found that occupancy-abundance (Figure 1G) and rank-abundance (Figure 1H) curvestended to follow similar patterns across species datasets, with
the most abundant ASVs making up between 4 and 10% relativeabundance, and being detected in 50–90% of samples.
Effect of Prevalence Threshold on AlphaDiversity and Beta Dissimilarity ScoresGiven similar occupancy-abundance and rank-abundance curvesacross species datasets, we predicted that increasing prevalencethresholds when filtering for a common core would have similareffects on standardized alpha diversity and beta dissimilarityestimates. We first looked at the effect of increasing prevalencethresholds on variation in alpha and beta diversity acrosssamples (Figure 2), since maintaining variation may bea priority for subsequent analyses. Variation across samplesdecreased with increasing prevalence thresholds for observedand phylogenetic alpha diversity (Figures 2A,B), and to a lesserextent Shannon diversity and BWPD (Figures 2C,D; Barlett’s
Frontiers in Microbiology | www.frontiersin.org 6 May 2021 | Volume 12 | Article 659918

fmicb-12-659918 May 5, 2021 Time: 18:17 # 7
Risely et al. Filtering Effects on Core Microbiome
FIGURE 2 | Effects of increasing prevalence threshold on standardized alpha diversity and beta dissimilarity measures, colored by species dataset: (A) observedASV richness; (B) faiths phylogenetic diversity; (C) shannon index; (D) balance-weighted phylogenetic diversity (BWPD); (E) jaccard index; (F) unweighted Unifrac;(G) morisita; (H) weighted Unifrac.
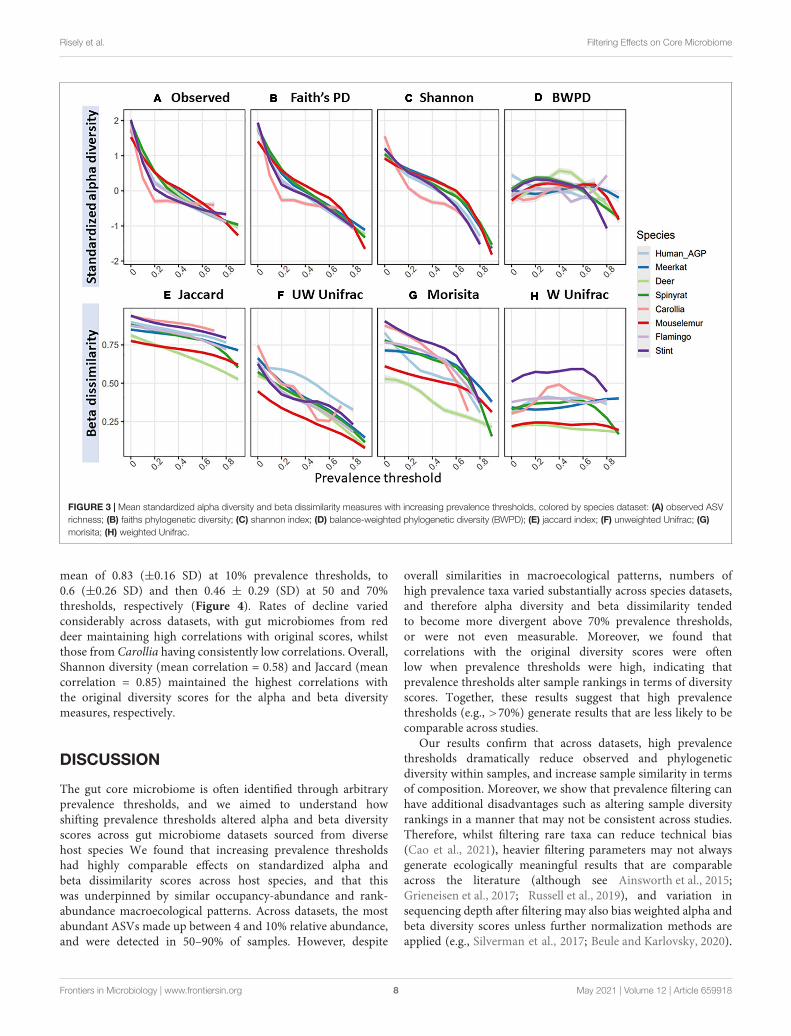
K-squared: Observed = 23,583; Faiths = 14,616; Shannon = 1,240;BWPD = 2,031, p < 2.2e-16). In contrast, variation in betadissimilarity tended to increase with increasing prevalencethresholds for most measures of beta diversity, with thesmallest and largest changes in variance across thresholdsobserved in Morisita and Unweighted Unifrac, respectively(Figures 2E–H; Barlett’s K-squared: Jaccard = 1,827; UnweightedUnifrac = 2,405; Morisita = 352; Weighted Unifrac = 874,p < 2.2e-16). This increase in variance was because a subsetof samples became increasingly dissimilar to the mean withincreasing prevalence thresholds. To test whether variationin read depth post-prevalence filtering had a consistent biason abundance-weighted diversity scores, we correlated alphaand beta diversity scores with sample read depth and foundno consistent pattern across species datasets (SupplementaryFigure 1). Higher read depth per sample after filtering wasassociated with higher weighted alpha diversity scores in somehost species (e.g., mouse lemurs), and lower weighted alphadiversity scores in others (e.g., meerkats), and this was also thecase for weighted beta diversity measures (Morisita and WeightedUnifrac). For presence/absence diversity measures, higher readdepth was associated with higher alpha diversity scores, butlower beta diversity scores (i.e., higher read samples tended to
lie close to the group centroid whilst low-read samples tendedto be outliers).
Across species datasets, patterns in standardized alphadiversity and beta dissimilarity in response to increasingprevalence thresholds were remarkably similar (Figure 3).Overall, most alpha diversity metrics were highly sensitive toincreasing prevalence thresholds, with the exception of BWPD,which was the least sensitive to increasing prevalence thresholds.BWPD responses to prevalence thresholds tended to diverge atapproximately 70% (Figure 3D). Species datasets demonstratedvariation in their mean beta diversity (i.e., how similarsampled individuals are to each other), but followed similarpatterns in their response to increasing prevalence thresholds(Figures 3E–H). Unweighted Unifrac and Morisita values werethe most sensitive to increasing prevalence thresholds, withsamples becoming more similar to one another (Figures 3F,G),whilst Weighted Unifrac was the least sensitive, with samplesremaining relatively similar to one another irrelevant ofprevalence threshold (Figure 3D).
Lastly, we examined the extent to which diversity scores fromgut core microbiomes correlated with original, unfiltered scores.Spearman’s correlation between core and original diversity scoresdecreased with prevalence thresholds, declining from an overall
Frontiers in Microbiology | www.frontiersin.org 7 May 2021 | Volume 12 | Article 659918
fmicb-12-659918 May 5, 2021 Time: 18:17 # 8
Risely et al. Filtering Effects on Core Microbiome
FIGURE 3 | Mean standardized alpha diversity and beta dissimilarity measures with increasing prevalence thresholds, colored by species dataset: (A) observed ASVrichness; (B) faiths phylogenetic diversity; (C) shannon index; (D) balance-weighted phylogenetic diversity (BWPD); (E) jaccard index; (F) unweighted Unifrac; (G)morisita; (H) weighted Unifrac.
mean of 0.83 (±0.16 SD) at 10% prevalence thresholds, to0.6 (±0.26 SD) and then 0.46 ± 0.29 (SD) at 50 and 70%thresholds, respectively (Figure 4). Rates of decline variedconsiderably across datasets, with gut microbiomes from reddeer maintaining high correlations with original scores, whilstthose from Carollia having consistently low correlations. Overall,Shannon diversity (mean correlation = 0.58) and Jaccard (meancorrelation = 0.85) maintained the highest correlations withthe original diversity scores for the alpha and beta diversitymeasures, respectively.
DISCUSSION
The gut core microbiome is often identified through arbitraryprevalence thresholds, and we aimed to understand howshifting prevalence thresholds altered alpha and beta diversityscores across gut microbiome datasets sourced from diversehost species We found that increasing prevalence thresholdshad highly comparable effects on standardized alpha andbeta dissimilarity scores across host species, and that thiswas underpinned by similar occupancy-abundance and rank-abundance macroecological patterns. Across datasets, the mostabundant ASVs made up between 4 and 10% relative abundance,and were detected in 50–90% of samples. However, despite
overall similarities in macroecological patterns, numbers ofhigh prevalence taxa varied substantially across species datasets,and therefore alpha diversity and beta dissimilarity tendedto become more divergent above 70% prevalence thresholds,or were not even measurable. Moreover, we found thatcorrelations with the original diversity scores were oftenlow when prevalence thresholds were high, indicating thatprevalence thresholds alter sample rankings in terms of diversityscores. Together, these results suggest that high prevalencethresholds (e.g., >70%) generate results that are less likely to becomparable across studies.
Our results confirm that across datasets, high prevalencethresholds dramatically reduce observed and phylogeneticdiversity within samples, and increase sample similarity in termsof composition. Moreover, we show that prevalence filtering canhave additional disadvantages such as altering sample diversityrankings in a manner that may not be consistent across studies.Therefore, whilst filtering rare taxa can reduce technical bias(Cao et al., 2021), heavier filtering parameters may not alwaysgenerate ecologically meaningful results that are comparableacross the literature (although see Ainsworth et al., 2015;Grieneisen et al., 2017; Russell et al., 2019), and variation insequencing depth after filtering may also bias weighted alpha andbeta diversity scores unless further normalization methods areapplied (e.g., Silverman et al., 2017; Beule and Karlovsky, 2020).
Frontiers in Microbiology | www.frontiersin.org 8 May 2021 | Volume 12 | Article 659918

fmicb-12-659918 May 5, 2021 Time: 18:17 # 9
Risely et al. Filtering Effects on Core Microbiome
FIGURE 4 | Spearman’s correlation (rho) between diversity scores from core microbiomes and scores from original unfiltered data, colored by species dataset: (A)observed ASV richness; (B) faiths phylogenetic diversity; (C) shannon index; (D) balance-weighted phylogenetic diversity (BWPD); (E) jaccard index; (F) unweightedUnifrac; (G) morisita; (H) weighted Unifrac. Negative values represent negative correlations, and for ease of interpretation a dashed line represents a correlation of0.6. Circles represent significant correlations (p < 0.05), whilst squares represent non-significant correlations.
Our results indicate that diversity measures that account forboth abundance and phylogeny (BWPD and Weighted Unifrac,for alpha and beta diversity, respectively) are insensitive toprevalence thresholds, and therefore represent the commoncore microbiome without the need for filtering. As such, werecommend that where possible these metrics are applied in lieuof prevalence filtering. Alternatively, a core microbiome couldbe identified by using occupancy-abundance curves (Shade andStopnisek, 2019), or by using temporal persistence or ecologicalinteractions as a basis for determining taxa importance (Björket al., 2017; Toju et al., 2018; Risely, 2020).
Applying prevalence thresholds assumes that measures of ASVprevalence distributions are relatively accurate and that rareASVs are detectable. We tested limitations of ASV detectionrates, and found that ASV detection was more likely to belimited by sample size than sequencing depth. For all datasetsincluded here, rarefaction curves with sequencing depth leveledoff rapidly, with sequencing depths of over 10,000 reads persample (after mitochondria and chloroplast filtering) in mostcases not improving ASV detection rates, which is line withother studies of 16S rRNA gut data (Zaheer et al., 2018; Gweonet al., 2019). Nevertheless, it should be noted that rare taxa willcontinue to be discovered at lower detection rates with increasingsequencing depth, and may even then remain undetected to duetechnical reasons such as extraction and primer bias (Brookset al., 2015). In contrast, we found that ASV accumulationrates with sample size differed substantially between speciesdatasets, with ASV detection rates with sample size remaining
high in most cases (i.e., many ASVs were still being detectedwith every sample added, even at the point when the finalsample was added). Sampled populations characterized by highlyindividualized microbiomes (i.e., a high proportion of ASVsthat only occurred in one sample; in this study Carollia batsand migratory red-necked stint), demonstrated particularly steepaccumulation curves that did not level off, suggesting furthersampling is required to more fully capture the population-level ASV pool of these populations. The extent to which thesedifferences in ASV detection rates reflect sampling protocol orhost ecology is unclear, yet individualized microbiomes in somebird and bat species may be underpinned by a lack of strongevolutionary symbioses with gut microbes in these lineages (Songet al., 2020), and therefore may require higher sampling effort tomeasure population-level ASV diversity.
Whilst ASV accumulation rates with sample size differedamong species datasets, our predictions of the total ASV poolhosted by the host population suggested that all datasets detectedapproximately 50–60% of ASV diversity. The interpretation ofthis figure is subject to debate, since predicting species diversityin highly diverse microbial communities is extremely challenging,and generally underestimated (Hong et al., 2006). Since we foundthat predictions for the total ASV pool hosted by the widerpopulation are highly sensitive to sample size (Figure 1D), andthat predictions assume a closed system (i.e., no new ASVsare introduced to the microbial community), we interpret thisfigure as the number of ASVs likely to be harbored in the gutmicrobiomes of the sampled animals, and also likely represent
Frontiers in Microbiology | www.frontiersin.org 9 May 2021 | Volume 12 | Article 659918

fmicb-12-659918 May 5, 2021 Time: 18:17 # 10
Risely et al. Filtering Effects on Core Microbiome
the majority of non-unique ASVs harbored by the wider hostpopulation. Under the assumption that each host harbors atleast some unique strains in their gut microbiome as a result ofstochastic colonization (Obadia et al., 2017), the total ASV poolof the host population—including strains unique to individuals—is impossible to estimate with any degree of certainty. Forexample, our knowledge of human gut microbiome diversityis continually increasing: previous research on the human gutmicrobiome using shotgun sequencing has identified over 60,000prokaryotic genomes (bacterial and archaeal) from 3,810 samplessourced from people across the globe (Nayfach et al., 2019),whilst another comprehensive global study identified almost160,000 unique genomes from 9,428 samples (Pasolli et al.,2019), indicating that increasing sampling frequency is stillrevealing considerable increases in global human gut diversity.For comparison, our analysis of a subsample of 500 samplesdownloaded from the American Gut Project dataset detected over10,000 ASVs, with on average 10% of ASVs detected in eachsample occurring uniquely. Therefore, our results suggest thatwhilst increasing sample sizes will increase the accuracy of ASVprevalence distributions, even very large sample sizes can oftennot sufficiently represent the large suite of rare, low prevalencetaxa harbored by the host population, and that the proportion oftaxa that only occur in one sample can differ markedly betweenhost populations.
CONCLUSION
Our results show that macroecological patterns in occupancy-abundance and rank-abundance curves, and their downstreameffects on standardized alpha diversity and beta dissimilarity,are similar across gut microbiome datasets, and thereforestudies that apply similar thresholds are likely to be comparableassuming sufficient sampling frequency. However, trends inalpha and beta diversity scores tended to diverge above 70%prevalence thresholds, and diversity scores at high prevalencethresholds tended to correlate poorly with original data.Therefore, setting high prevalence thresholds when filteringmicrobiome datasets may hinder cross-study comparisons. Toreduce downstream effects of prevalence filtering, we recommendthe use of diversity metrics that account for both phylogenyand abundance (such as BWPD and Weighted UniFrac), whichwe show represent the common core microbiome without theneed for filtering.
DATA AVAILABILITY STATEMENT
Sequence data is available at the project numbers andDOIs outlined in Table 2. R code and processed data toreplicate study are available to download at https://github.com/Riselya/Prevalence-Thresholds-Metaanalysis. An R markdowndocument is available as Supplementary Data Sheet 1.
ETHICS STATEMENT
Ethical review and approval were not required for the studyon human participants in accordance with the local legislationand institutional requirements. Data are publicly available. Alldata from other species were collected under the appropriatepermits, details of which can be found in the associatedpublications (Table 2). For data reported for the first timehere: Meerkat samples were collected with the permission ofthe ethical committee of Pretoria University and the NorthernCape Conservation Service, South Africa (Permit number:EC031-13). Spiny rat samples were collected with full ethicalapproval (Smithsonian Institutional Animal Care and UseCommittee protocols 2013-0401-2016-A1-A7 and 2016-0627-2019-A2). Carollia samples were ethically approved by theSmithsonian Tropical Research Institute 144 (IACUC protocols:2014-0101-2016 and 2016-0627-2019).
AUTHOR CONTRIBUTIONS
AR led on conceptualization, performed analyses, and wrotemanuscript. MG supported on conceptualization and manuscriptediting. SS led on supervision, data management, and supportedmanuscript editing. AB, SB, MG, AH, MH, SM, MM, MT, andWM contributed to data acquisition and editing manuscript.All authors contributed to the article and approved thesubmitted version.
FUNDING
MG was supported by a grant of the German Science Foundation(DFG Gi 1065/2-1). The microbiome research on flamingos wasalso supported by the TOTAL Foundation. The microbiomeinvestigations of mammals were funded by the DFG grant toSS (SO 428/10-1) and the DFG Priority Program SPP 1596/2Ecology and Species Barriers in Emerging Infectious Diseases(SO 428/9-1, 9-2 and TS 81/7-1, 7-2). Collection of Red-neckedstint data was supported by funding from the Australian ResearchCouncil (DP1301041935).
ACKNOWLEDGMENTS
We would like to thank the two reviewers that helpedimprove the manuscript.
SUPPLEMENTARY MATERIAL
The Supplementary Material for this article can be foundonline at: https://www.frontiersin.org/articles/10.3389/fmicb.2021.659918/full#supplementary-material
Frontiers in Microbiology | www.frontiersin.org 10 May 2021 | Volume 12 | Article 659918

fmicb-12-659918 May 5, 2021 Time: 18:17 # 11
Risely et al. Filtering Effects on Core Microbiome
REFERENCESAinsworth, T. D., Krause, L., Bridge, T., Torda, G., Raina, J.-B., Zakrzewski,
M., et al. (2015). The coral core microbiome identifies rare bacterial taxaas ubiquitous endosymbionts. ISME J. 9, 2261–2274. doi: 10.1038/ismej.2015.39
Amato, K. R., Sanders, J. G., Song, S. J., Nute, M., Metcalf, J. L., Thompson, L. R.,et al. (2019). Evolutionary trends in host physiology outweigh dietary nichein structuring primate gut microbiomes. ISME J. 13, 576–587. doi: 10.1038/s41396-018-0175-0
Amir, A., McDonald, D., Navas-Molina, J. A., Kopylova, E., Morton, J. T., Xu, Z. Z.,et al. (2017). Deblur rapidly resolves single-nucleotide community sequencepatterns. mSystems 2:e00191-16. doi: 10.1128/mSystems.00191-16
Anderson, M. J., Crist, T. O., Chase, J. M., Vellend, M., Inouye, B. D., Freestone,A. L., et al. (2011). Navigating the multiple meanings of β diversity: a roadmapfor the practicing ecologist. Ecol. Lett. 14, 19–28. doi: 10.1111/j.1461-0248.2010.01552.x
Barwell, L. J., Isaac, N. J. B., and Kunin, W. E. (2015). Measuring β-diversity withspecies abundance data. J. Anim. Ecol. 84, 1112–1122. doi: 10.1111/1365-2656.12362
Beule, L., and Karlovsky, P. (2020). Improved normalization of species count datain ecology by scaling with ranked subsampling (SRS): application to microbialcommunities. PeerJ. 8, e9593. doi: 10.7717/peerj.9593
Björk, J. R., O’Hara, R. B., Ribes, M., Coma, R., and Montoya, J. M. (2017). Thedynamic core microbiome: structure, stability and resistance. bioRxiv [Preprint]137885,
Bokulich, N. A., Subramanian, S., Faith, J. J., Gevers, D., Gordon, J. I., Knight, R.,et al. (2013). Quality-filtering vastly improves diversity estimates from Illuminaamplicon sequencing. Nat. Methods 10, 57–59. doi: 10.1038/nmeth.2276
Bolyen, E., Rideout, J. R., Dillon, M. R., Bokulich, N. A., Abnet, C. C., Al-Ghalith, G. A., et al. (2019). Reproducible, interactive, scalable and extensiblemicrobiome data science using QIIME 2. Nat. Biotechnol. 37, 852–857. doi:10.1038/s41587-019-0209-9
Brooks, J. P., Edwards, D. J., Harwich, M. D., Rivera, M. C., Fettweis, J. M.,Serrano, M. G., et al. (2015). The truth about metagenomics: quantifying andcounteracting bias in 16S rRNA studies. BMC Microbiol. 15:66. doi: 10.1186/s12866-015-0351-6
Callahan, B. J., McMurdie, P. J., and Holmes, S. P. (2017). Exact sequence variantsshould replace operational taxonomic units in marker-gene data analysis. ISMEJ. 11, 2639–2643. doi: 10.1038/ismej.2017.119
Callahan, B. J., McMurdie, P. J., Rosen, M. J., Han, A. W., Johnson, A. J. A., andHolmes, S. P. (2016). DADA2: High-resolution sample inference from Illuminaamplicon data. Nat. Methods 13, 581–583. doi: 10.1038/nmeth.3869
Cao, Q., Sun, X., Rajesh, K., Chalasani, N., Gelow, K., Katz, B., et al. (2021).Effects of rare microbiome taxa filtering on statistical analysis. Front. Microbiol.11:607325. doi: 10.3389/fmicb.2020.607325
Chao, A., Chazdon, R. L., Colwell, R. K., and Shen, T. J. (2006). Abundance-basedsimilarity indices and their estimation when there are unseen species in samples.Biometrics 62, 361–371. doi: 10.1111/j.1541-0420.2005.00489.x
Chao, A., Chiu, C. -H., Hsieh, T. C., Davis, T., Nipperess, D., and Faith, D. (2015).Rarefaction and extrapolation of phylogenetic diversity. Methods Ecol. Evol. 6,380–388.
Cheng, J., Ringel-Kulka, T., Heikamp-de Jong, I., Ringel, Y., Carroll, I., de Vos,W. M., et al. (2016). Discordant temporal development of bacterial phyla andthe emergence of core in the fecal microbiota of young children.ISME J. 10,1002–1014. doi: 10.1038/ismej.2015.177
Cougoul, A., Bailly, X., Vourc’h, G., and Gasqui, P. (2019). Rarity of microbialspecies: In search of reliable associations. PLoS One 14:e0200458. doi: 10.1371/journal.pone.0200458
Daniel, P. F. (1992). Conservation evaluation and phylogenetic diversity. Biol.Conserv. 61, 1–10. doi: 10.1016/0006-3207(92)91201-3
Fackelmann, F., Gillingham, M. A. F., Schmid, J., Heni, A. C., Wilhelm, K.,and Sommer, S. (2021). Human encroachment into wildlife gut microbiomes.Commun. Biol. In press.
Falony, G., Joossens, M., Vieira-Silva, S., Wang, J., Darzi, Y., Faust, K., et al. (2016).Population-level analysis of gut microbiome variation. Science 352, 560–564.doi: 10.1126/science.aad3503
Gibson, K. M., Nguyen, B. N., Neumann, L. M., Miller, M., Buss, P., Daniels,S., et al. (2019). Gut microbiome differences between wild and captive blackrhinoceros – implications for rhino health. Sci. Rep. 9:7570. doi: 10.1038/s41598-019-43875-3
Gillingham, M. A. F., Béchet, A., Cézilly, F., Wilhelm, K., Rendón-Martos, M.,Borghesi, F., et al. (2019). Offspring microbiomes differ across breeding sitesin a panmictic species. Front. Microbiol. 10:35. doi: 10.3389/fmicb.2019.00035
Grieneisen, L. E., Livermore, J., Alberts, S., Tung, J., and Archie, E. A. (2017). Groupliving and male dispersal predict the core gut microbiome in wild baboons.Integr. Comp. Biol. 57, 770–785. doi: 10.1093/icb/icx046
Grilli, J. (2020). Macroecological laws describe variation and diversity in microbialcommunities. Nat. Commun. 11:4743. doi: 10.1038/s41467-020-18529-y
Gweon, H. S., Shaw, L. P., Swann, J., De Maio, N., AbuOun, M., Niehus, R., et al.(2019). The impact of sequencing depth on the inferred taxonomic compositionand AMR gene content of metagenomic samples. Environ. Microb. 14,1–15.
Hanski, I. (1982). Dynamics of regional distribution: the core and satellite specieshypothesis. Oikos 38, 210–221. doi: 10.2307/3544021
Hong, S.-H., Bunge, J., Jeon, S.-O., and Epstein, S. S. (2006). Predicting microbialspecies richness. Proc. Natl. Acad. Sci.U.S.A. 103, 117–122. doi: 10.1073/pnas.0507245102
Hornung, B. V. H., Zwittink, R. D., and Kuijper, E. J. (2019). Issues and currentstandards of controls in microbiome research. FEMS Microbiol. Ecol. 95:fiz045.doi: 10.1093/femsec/fiz045
Jaccard, P. (1912). The distribution of the flora in the alpine zone. N. Phytol. 11,37–50. doi: 10.1111/j.1469-8137.1912.tb05611.x
Jari Oksanen, F. G. B., Friendly, M., Kindt, R., Legendre, P., McGlinn, D.,Minchin, P. R., et al. (2018). Vegan: Community Ecology Package. R PackageVersion 2.
Jeffery, I. B., Lynch, D. B., and O’Toole, P. W. (2016). Composition and temporalstability of the gut microbiota in older persons. ISME J. 10, 170–182. doi:10.1038/ismej.2015.88
Ji, B. W., Sheth, R. U., Dixit, P. D., Tchourine, K., and Vitkup, D. (2020).Macroecological dynamics of gut microbiota. Nat. Microbiol. 5, 768–775. doi:10.1038/s41564-020-0685-1
Jousset, A., Bienhold, C., Chatzinotas, A., Gallien, L., Gobet, A., Kurm, V., et al.(2017). Where less may be more: how the rare biosphere pulls ecosystemsstrings. ISME J. 11, 853–862. doi: 10.1038/ismej.2016.174
Kembel, S. W., Cowan, P. D., Helmus, M. R., Cornwell, W. K., Morlon, H., Ackerly,D. D., et al. (2010). Picante: R tools for integrating phylogenies and ecology.Bioinformatics 26, 1463–1464. doi: 10.1093/bioinformatics/btq166
Kozich, J. J., Westcott, S. L., Baxter, N. T., Highlander, S. K., and Schloss, P. D.(2013). Development of a dual-index sequencing strategy and curation pipelinefor analyzing amplicon sequence data on the miseq illumina sequencingplatform. Appl. Environ. Microbiol. 79, 5112–5120. doi: 10.1128/AEM.01043-13
Lahti, L., Shetty, S., Blake, T., and Salojarvi, J. (2017). Microbiome r Package. ToolsMicrobiome Anal R.
Lee, S. M., Donaldson, G. P., Mikulski, Z., Boyajian, S., Ley, K., and Mazmanian,S. K. (2013). Bacterial colonization factors control specificity and stability of thegut microbiota. Nature 501, 426–429. doi: 10.1038/nature12447
Lozupone, C., and Knight, R. (2005). UniFrac: a new phylogenetic method forcomparing microbial communities. Appl. Environ. Microbiol. 71, 8228–8235.doi: 10.1128/aem.71.12.8228-8235.2005
Lozupone, C. A., Hamady, M., Kelley, S. T., and Knight, R. (2007). Quantitativeand qualitative β diversity measures lead to different insights into factors thatstructure microbial communities. Appl. Environ. Microbiol. 73, 1576–1585. doi:10.1128/aem.01996-06
Mahnic, A., and Rupnik, M. (2018). Different host factors are associated withpatterns in bacterial and fungal gut microbiota in Slovenian healthy cohort.PLoS One 13:e0209209. doi: 10.1371/journal.pone.0209209
Martínez, I., Muller, C. E., and Walter, J. (2013). Long-term temporal analysis ofthe human fecal microbiota revealed a stable core of dominant bacterial species.PLoS One 8:e69621. doi: 10.1371/journal.pone.0069621
McCoy, C. O., and Matsen, F. A. (2013). Abundance-weighted phylogeneticdiversity measures distinguish microbial community states and are robust tosampling depth. PeerJ. 1:e157. doi: 10.7717/peerj.157
Frontiers in Microbiology | www.frontiersin.org 11 May 2021 | Volume 12 | Article 659918

fmicb-12-659918 May 5, 2021 Time: 18:17 # 12
Risely et al. Filtering Effects on Core Microbiome
McDonald, D., Hyde, E., Debelius, J. W., Morton, J. T., Gonzalez, A., Ackermann,G., et al. (2018). American gut: an open platform for citizen science microbiomeresearch. Msystems 3, e00031-18.
McKnight, D. T., Huerlimann, R., Bower, D. S., Schwarzkopf, L., Alford, R. A., andZenger, K. R. (2019). Methods for normalizing microbiome data: an ecologicalperspective. Methods Ecol. Evol. 10, 389–400. doi: 10.1111/2041-210x.13115
McMurdie, P. J., and Holmes, S. (2013). phyloseq: an R package for reproducibleinteractive analysis and graphics of microbiome census data. PLoS One8:e61217. doi: 10.1371/journal.pone.0061217
Menke, S., Heurich, M., Henrich, M., Wilhelm, K., and Sommer, S. (2019). Impactof winter enclosures on the gut bacterial microbiota of red deer in the BavarianForest National Park. wbio 2019, 1–10. doi: 10.2981/wlb.00503
Morisita, M. (1959). Measuring of interspecific association and similarity betweencommunities. Mem. Fac. Sci. Kyushu Univ. Ser. E (Biol.) 3, 65–80.
Nayfach, S., Shi, Z. J., Seshadri, R., Pollard, K. S., and Kyrpides, N. C. (2019).New insights from uncultivated genomes of the global human gut microbiome.Nature 568, 505–510. doi: 10.1038/s41586-019-1058-x
Obadia, B., Güvener, Z. T., Zhang, V., Ceja-Navarro, J. A., Brodie, E. L., Ja, W. W.,et al. (2017). Probabilistic invasion underlies natural gut microbiome stability.Curr. Biol. 27, 1999–2006.e8. doi: 10.1016/j.cub.2017.05.034
Pascoal, F., Costa, R., and Magalhães, C. (2021). The microbial rare biosphere:current concepts, methods and ecological principles. FEMS Microbiol. Ecol.97:fiaa227. doi: 10.1093/femsec/fiaa227
Pasolli, E., Asnicar, F., Manara, S., Zolfo, M., Karcher, N., Armanini, F., et al. (2019).Extensive unexplored human microbiome diversity revealed by over 150,000genomes from metagenomes spanning age, geography, and lifestyle. Cell 176,649–662.e20.
Pollock, J., Glendinning, L., Wisedchanwet, T., and Watson, M. (2018). Themadness of microbiome: attempting to find consensus “best practice” for16s microbiome studies. Appl. Environ. Microbiol. 84:e02627-17. doi: 10.1128/AEM.02627-17
Price, M. N., Dehal, P. S., and Arkin, A. P. (2010). FastTree 2 – approximatelymaximum-likelihood trees for large alignments. PLoS One 5:e9490. doi: 10.1371/journal.pone.0009490
Risely, A. (2020). Applying the core microbiome to understand host–microbesystems. J. Anim. Ecol. 89, 1549–1558. doi: 10.1111/1365-2656.13229
Risely, A., Waite, D. W., Ujvari, B., Hoye, B. J., and Klaassen, M. (2018).Active migration is associated with specific and consistent changes to gutmicrobiota in Calidris shorebirds. J. Anim. Ecol. 87, 428–437. doi: 10.1111/1365-2656.12784
Röttjers, L., and Faust, K. (2018). From hairballs to hypotheses–biological insightsfrom microbial networks. FEMS Microbiol. Rev. 42, 761–780. doi: 10.1093/femsre/fuy030
Round, J. L., Lee, S. M., Li, J., Tran, G., Jabri, B., Chatila, T. A., et al. (2011). The toll-like receptor 2 pathway establishes colonization by a commensal of the humanmicrobiota. Science 332, 974–977. doi: 10.1126/science.1206095
Russell, J. T., Roesch, L. F. W., Ördberg, M., Ilonen, J., Atkinson, M. A., Schatz,D. A., et al. (2019). Genetic risk for autoimmunity is associated with distinctchanges in the human gut microbiome. Nat. Commun. 10:3621. doi: 10.1038/s41467-019-11460-x
Schloss, P. D. (2020). Removal of rare amplicon sequence variants from 16S rRNAgene sequence surveys biases the interpretation of community structure data.bioRxiv [Preprint] doi: 10.1101/2020.12.11.422279 2020.12.11.422279,
Sevellec, M., Derome, N., and Bernatchez, L. (2018). Holobionts and ecologicalspeciation: the intestinal microbiota of lake whitefish species pairs. Microbiome6:47. doi: 10.1186/s40168-018-0427-2
Shade, A., and Handelsman, J. (2012). Beyond the Venn diagram: the hunt for acore microbiome. Environ. Microbiol. 14, 4–12. doi: 10.1111/j.1462-2920.2011.02585.x
Shade, A., and Stopnisek, N. (2019). Abundance-occupancy distributions toprioritize plant core microbiome membership. Curr. Opin. Microbiol. 49, 50–58.doi: 10.1016/j.mib.2019.09.008
Shannon, C. E. (1948). A mathematical theory of communication. Bell Syst. Tech.J. 27, 379–423.
Shapira, M. (2016). Gut microbiotas and host evolution: scaling up symbiosis.Trends Ecol. Evol. 31, 539–549. doi: 10.1016/j.tree.2016.03.006
Shukla, S. P., Vogel, H., Heckel, D. G., Vilcinskas, A., and Kaltenpoth, M. (2018).Burying beetles regulate the microbiome of carcasses and use it to transmit acore microbiota to their offspring. Mol. Ecol. 27, 1980–1991. doi: 10.1111/mec.14269
Silverman, J. D., Washburne, A. D., Mukherjee, S., and David, L. A. (2017). Aphylogenetic transform enhances analysis of compositional microbiota data.eLife 6:e21887.
Song, S. J., Sanders, J. G., Delsuc, F., Metcalf, J., Amato, K., Taylor, M. W., et al.(2020). Comparative analyses of vertebrate gut microbiomes reveal convergencebetween birds and bats. MBio 11:e02901-19.
Stephens, W. Z., Burns, A. R., Stagaman, K., Wong, S., Rawls, J. F., Guillemin, K.,et al. (2016). The composition of the zebrafish intestinal microbial communityvaries across development. ISME J. 10, 644–654. doi: 10.1038/ismej.2015.140
Thompson, L. R., Sanders, J. G., McDonald, D., Amir, A., Ladau, J., Locey,K. J., et al. (2017). A communal catalogue reveals Earth’s multiscale microbialdiversity. Nature 551, 457–463.
Toju, H., Peay, K. G., Yamamichi, M., Narisawa, K., Hiruma, K., Naito, K.,et al. (2018). Core microbiomes for sustainable agroecosystems. Nat. Plants 4,247–257. doi: 10.1038/s41477-018-0139-4
Turnbaugh, P. J., Hamady, M., Yatsunenko, T., Cantarel, B. L., Duncan, A., Ley,R. E., et al. (2009). A core gut microbiome in obese and lean twins. Nature 457,480–484. doi: 10.1038/nature07540
Wasimuddin, V. M., Ganzhorn, J. U., Rakotondranary, J., Ratovonamana, Y. R.,Drosten, C., et al. (2019). Adenovirus infection is associated with altered gutmicrobial communities in a non-human primate. Scie. Rep. 9, 1–12.
Wallace, R. J., Sasson, G., Garnsworthy, P. C., Tapio, I., Gregson, E., Bani, P., et al.(2019). A heritable subset of the core rumen microbiome dictates dairy cowproductivity and emissions. Sci. Adv. 5:eaav8391. doi: 10.1126/sciadv.aav8391
Weiss, S., Xu, Z. Z., Peddada, S., Amir, A., Bittinger, K., Gonzalez, A., et al. (2017).Normalization and microbial differential abundance strategies depend upondata characteristics. Microbiome 5:27. doi: 10.1186/s40168-017-0237-y
Zaheer, R., Noyes, N., Polo, R. O., Cook, S. R., Marinier, E., Van Domselaar, G., et al.(2018). Impact of sequencing depth on the characterization of the microbiomeand resistome. Sci. Rep. 8, 1–11.
Conflict of Interest: The authors declare that the research was conducted in theabsence of any commercial or financial relationships that could be construed as apotential conflict of interest.
Copyright © 2021 Risely, Gillingham, Béchet, Brändel, Heni, Heurich, Menke,Manser, Tschapka, Wasimuddin and Sommer. This is an open-access articledistributed under the terms of the Creative Commons Attribution License (CC BY).The use, distribution or reproduction in other forums is permitted, provided theoriginal author(s) and the copyright owner(s) are credited and that the originalpublication in this journal is cited, in accordance with accepted academic practice. Nouse, distribution or reproduction is permitted which does not comply with these terms.
Frontiers in Microbiology | www.frontiersin.org 12 May 2021 | Volume 12 | Article 659918