photosynte
TRANSCRIPT

8/10/2019 photosynte
http://slidepdf.com/reader/full/photosynte 1/14
8/10/2019 photosynte
http://slidepdf.com/reader/full/photosynte 2/14
8/10/2019 photosynte
http://slidepdf.com/reader/full/photosynte 3/14

8/10/2019 photosynte
http://slidepdf.com/reader/full/photosynte 4/14
294
Mar. Ecol. Prog. Ser. 55: 291-304. 1989
Table 2.
Thalassiosira rotula
Chemical (pg cell-') composition when grown at different irradiances ( ~ E ~ n s t .-'
S-
of whte , red
and blue light. Values in paren theses ar e standard deviations
(n 4)
Irrad. Chl
a
Carbon Protein Polysaccharide hp id
Whi t e
12 0.91 (0.046) 129 (8.41 ) 296 (11.6) 600 (98.6) 516 (87. 0)
4 0 0.64 (0.033) 147 (8.62) 191 (20.8) 336 (72.0) 518 (83.5)
120 0.52 (0.026) 163 (6.22) 182 (34.7) 230 (17.9) 297 (37.7)
200 0.52 (0.033) 171 (6.56) 141 (10.5) 174 (13.1) 216 (29.3)
ed
12 0.63 (0.031) 153 (9.67) 471 (78.8) 561 (51. 8) 583 (82. 1)
40 0.44 (0.029) 156 (25.1) 411 (43.5) 472 (11.1) 433 (67.7)
120 0.37 (0.023) 198 (10.9 ) 250 (23. 6) 375 (39.9) 387 (37.8)
200 0.33 (0.019) 221 (14.4) 194 (35.7) 165 (16.2) 212 (34.8)
Blue
12 0.81 (0.066) 195 (12.2) 335 (60.2) 664 (69.1) 388 (47.5)
40 0.58 (0.042) 223 (17.0) 429 (69.3) 388 (52.6) 309 (78.2)
120 0.47 (0.0 29) 182 (24. 5) 253 (20.1) 234 (32.4) 266 (34.6)
200 0.49 (0.027) 205 (12.9) 188 (28.7) 277 (31.4) 177 (28.9)
Table 3.
unaliella ertiolecta
and Thalasslosira rotula Results of a 2-way Analysis of Variance
by
growth i rraba nce (Irr.) and
spectral quality (Col.) for the changes in chemical composition
Dunaliella tertiolecta Thalassiosira rotula
F
p b
r 2
F
a
pb
r 2
Chlorophyll a
Irr
Col.
Irr. Col.
Carbon
Irr.
Col.
Irr. Col.
Protein
Irr.
Col.
Irr. Col.
Polysaccharide
Irr
Col.
Irr. Col.
Lipid
Irr.
Col.
Irr. Col.
Critical F-ratio
Probability: p > 0.05, not significant; p5 0. 05, significant: p50 .0 1, highly significant; p50 .00 1, very highly significant
Correlation coefficient
released during the dark period was measured during
were corrected for quench by the external standards
experiments by acidifying and bubbling subsamples of method and for background radiation. Separate
the filtrate with filtered air (Sharp 1977). D O ' ~ Cwas
quench corrections were used for each solvent.
negligible for all conditions (Rivkin unpubl.).
Statistical treatm ent of data. The significance
of
the
Radiation counting. Radioactivity was counted using
different treatments (e.g. irradiance, color and incuba-
a Packard Tri-Carb (Model 46 C) liquid scintillation
tlon time) was evaluated by an NOV F-test. An a
spectrometer with Biofluor as a scintillant. All counts priori test, such as an ANOVA, tests for significance

8/10/2019 photosynte
http://slidepdf.com/reader/full/photosynte 5/14
8/10/2019 photosynte
http://slidepdf.com/reader/full/photosynte 6/14
296
Mar Ecol. Prog. Ser. 55: 291-304, 1989
greater in blue and red than white light of equal
PUR
(Tables 1, 2 nd 4).Polysacchandes and LIP were usually
higher in red than blue or white light in D
ertiolecfa
(Tables
1
and 4 , whereas they were not influenced by
spectral quality in
T.
rotula (Tables 2 and
4).
Photosynthesis, respiration
and
growth
Carbon uptake rates were influenced by both
irradiance and spec tral quality (Fig. 2, Table
5).
For
both species, photosynthetic performance (i.e. the rate
of photosynthesis at the gro wth irradiance) was signifi-
cantly greater
p
0.05) in blue tha n red or whit e light
(Table
5).
An insufficient number of lrradiances were
test ed to dete rmine if 200 pEinst, m- 2
S-'
saturated
14c
uptake or to calculate photosynthetic parameters.
Daily respiration was estimated
by
doubling the rate
of loss of particu late
4c
measured during the 12 h dark
period. For both speci es, respiration expressed a s a rate
(p g carbon cell-' d-l ) an d as a percent of daily carbon
production (i.e. [carbon respired in 24 h/carbo n incor-
porated during the 12 h light period]
X
100)
( -P)
was
significantly greater (ANOVA,p 0.05)at hg h than at
low irradiances (Table 6) and in blue than red or white
light (Table
6).
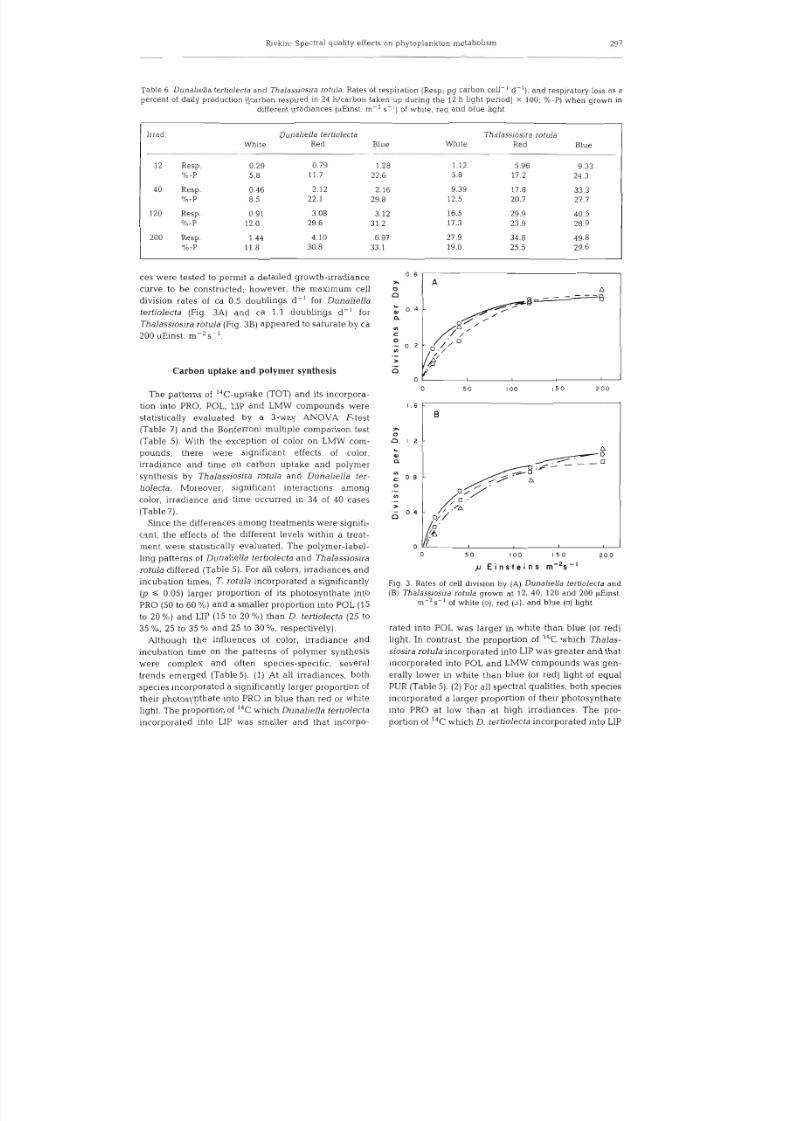
Rates of cell division were in dep end ent of the spec -
tral quality (Fig.3). An insufficient numb er of irradian-
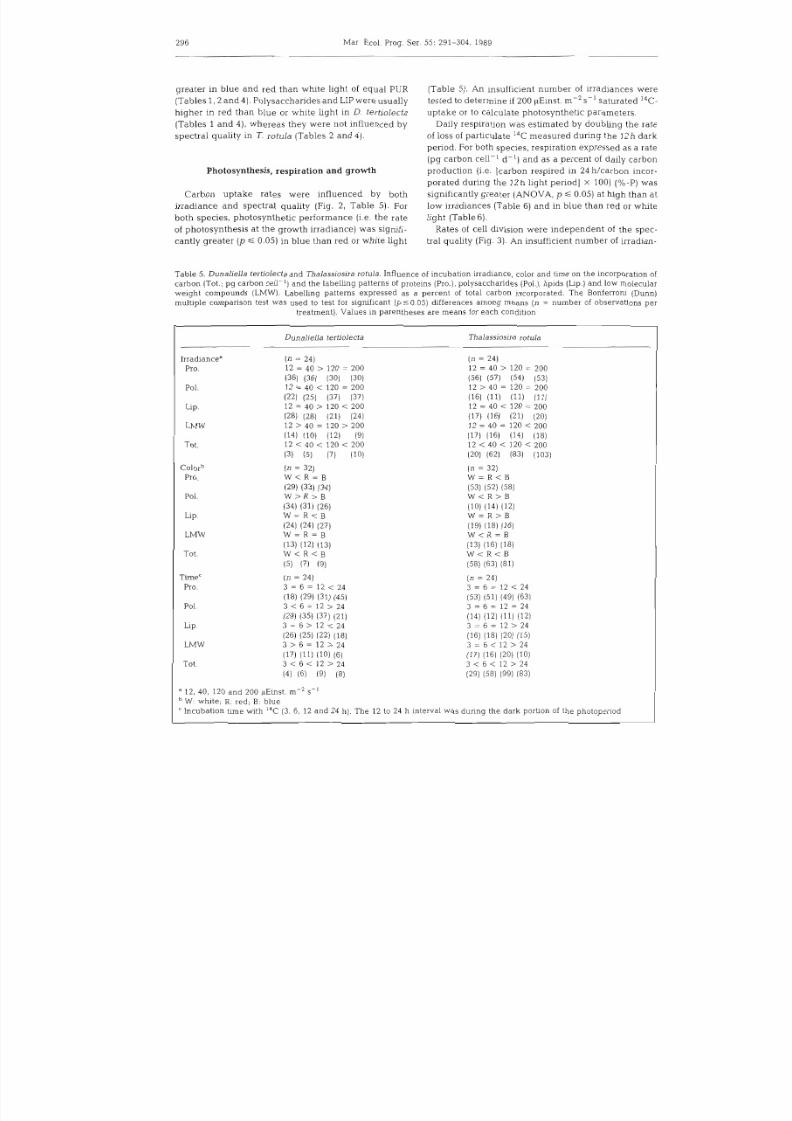
Table 5. Dunaliella tertiolecta and Thalassiosira rotula. Influence of incubation ir radian ce, color and time on the incorpor ation of
carbon (Tot.; pg carbon cell-') and the labelling patterns of proteins (Pro.), polysaccharides (Pol.), ~ pid sLIP.) and low molecular
weight compounds (LMW). Labelling patterns expressed as a percent of total carbon incorporated. The Bonferroni (Dunn)
multiple comparison test was used to test for significant
p50 . 0 5 )
differences among means n = number of observations per
treatment). Values in parenthe ses are m eans for each condition
Irradiancea
Pro.
Pol.
Lip.
LMW
Tot.
Colorb
Pro.
Pol.
Lip.
LMW
Tot.
Timec
Pro.
Pol.
Lip.
LMW
Tot.
Dunaliella tertiolecta Thalassiosira rotula
12, 40, 120 and 200 ~Ei nst .m-'
S-'
W: white; R: red; B: blue
Incubation tlme with 14C 3 ,6 , 12 and 24 h) . The 12 to 24 h interval was during the da rk porhon of the photoperiod
8/10/2019 photosynte
http://slidepdf.com/reader/full/photosynte 7/14

8/10/2019 photosynte
http://slidepdf.com/reader/full/photosynte 8/14

8/10/2019 photosynte
http://slidepdf.com/reader/full/photosynte 9/14
Rivkin: Spectral quality effects on phytoplankton metabolism
299
Thalassiosira rotula 1 0 to 5 %). For both algae , more
CAR
was reallocated into PRO in blue t han white or red
light of equ al PUR (Figs, 4 and 5). n
D.
tertiolecta the
reallocation of ' C into PRO during the dark interval
was generally greater at high than low growth irradian-
ces (Fig. 4 . The increase of 14C in PRO was accom-
o[ , ,
1
12 4 1 2 0 2 0 0
p
E i n s t e i n s
r n ^ ~ ~
Fig.
4
Dunaliella tertiolecta. Chang e in total particulate I4C
(TOT) and I4C -activity in the prote in (PRO ), polysaccharide
POL),
low molecular weight
LMW)
and lipid
LIP)
pools
during the 12 h dark interval for cells grown at 1 2 , 40, 120 and
200 pEinst. m^ s- ' of (A) whi te, B) red and (C)blue light. See
text for detai ls of calc ulati on
panied by concomitant decreases in the POL and LMW
fractions (Fig. 4 . In addition, there was a small but
consistent increase in LIP during the dark period when
grown in the blue and white (Figs. 4A,
C)
but not red
light regimes (Fig.
4B) .
In
T.
rotula
the irr adiance did
not app ear to influence the reallocation of 14C nto PRO
100
12 40
120 2
j
E i n s t e i
ns
m 2 s '
Fig. 5, Thalassiosira rotula. Change in total particulate 14C
(TOT ) and 'C-activity in the protein (P RO), polysaccharide
(POL), low molecular weight
LMW)
and lipid
LIP)
pools
during the 1 2 h dark interval for cells grown at 12, 40, 120 and
200 pEinst. m-2 s- ' of (A) whi te, B) red and
(C)
blue light. See
text for detail s of calculation
8/10/2019 photosynte
http://slidepdf.com/reader/full/photosynte 10/14

8/10/2019 photosynte
http://slidepdf.com/reader/full/photosynte 11/14

8/10/2019 photosynte
http://slidepdf.com/reader/full/photosynte 12/14

8/10/2019 photosynte
http://slidepdf.com/reader/full/photosynte 13/14

8/10/2019 photosynte
http://slidepdf.com/reader/full/photosynte 14/14