photon inverter test - zonnepanelen tips inverter test more than 90 inverters from multiple...
TRANSCRIPT
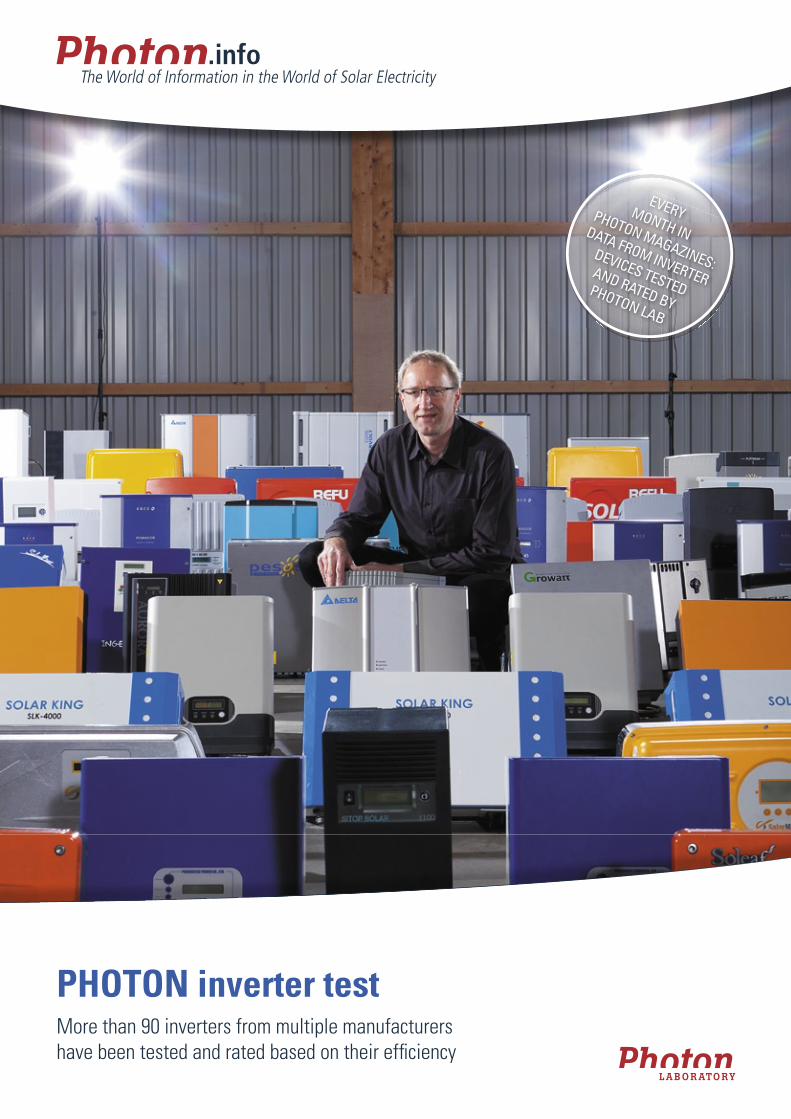
PHOTON inverter test More than 90 inverters from multiple manufacturers have been tested and rated based on their effi ciency
EVERY MONTH IN PHOTON MAGAZINES:
DATA FROM INVERTER
DEVICES TESTED AND RATED BY PHOTON LAB

2
PHOTON Laboratory
Laboratory
At PHOTON Lab, we have been
carrying out inverter tests
successfully since 2007, informing
PHOTON readers whether or not
a device is up to snuff. Grades
ranging from A++ to F, which corres-
pond to an overall effi ciency defi ned
by PHOTON, are assigned to enable
better comparison of the multitude
of devices.
About us
Heinz Neuenstein
Head of laboratory (inverters & system components)
Rolf
Schu
lten
/ pho
ton-
pict
ures
.com
Since the beginning of 2007, we at PHOTON Lab have employed our own inverter test methodology. In agreement with our test
partners, the test results are regularly published in PHOTON magazines. To make these results easier to comprehend, the editorial staff, drawing its inspirati-
Check the monthly test results in:
PHOTON – Das Solarstrom-Magazin (German)• PHOTON Profi – Photovoltaik-Fachwissen für die Praxis (German)• PHOTON – Le Magazine du Photovoltaïque (French)• PHOTON – Il Mensile del Fotovoltaico (Italian) • PHOTON – La Revista de Fotovoltaica (Spanish)• PHOTON International – The Solar Power Magazine (English)• PHOTON International – • 太阳能产业专业杂志 (Chinese) PHOTON – The Photovoltaic Magazine (English)•
Every month in PHOTON magazines: Data from inverters tested and rated by PHOTON Lab.
on from school report cards, launched a grading sys-tem with its own testing certifi cates: grades range from A++ to F.
Each month, far over 200,000 planners, decision makers and operators of PV systems trust in the re-sults of our lab tests. Our experts are working conti-nuously on better test methods for even more signifi -cant results. Our lab is respected for its independent and reliable tests. Benefi t from our expertise and let us test your inverter.
To assign a grade, we fi rst need to determine the effi ciency to which the grade refers. Both peak effi -ciency and European effi ciency aren‘t well-suited for this purpose. That is why we decided to defi ne our own effi ciency value, the value of which far exceeds conventional effi ciency data (see box, p. 5).
In our lab, we test serial and pre-serial grid-tied inverters as well as microinverters, for both the US and international market. Naturally, releasing test results in PHOTON magazines is an effi cient – and editorial-based – measure for manufacturers to build trust among customers.

3 Laboratory
How PHOTON conducts its test
Our goal: Helping system operators
select the right inverters. Since the beginning of 2007, we at PHOTON Lab have employed our own inverter test methodology. In agreement with our test
partners, the test results are regularly published in PHOTON magazines. To make these results ea-sier to comprehend, the editorial staff, drawing its inspiration from school report cards, launched a grading system with its own testing certifi cates: grades range from A to F. The highest grade (»A«) has three different levels: an A grade, an A+ or an A++. An F grade is assigned to an inverter with an effi ciency so poor that it‘s essentially not worth the money paid for it. In this sense, devices like
these are too expensive to even give away. To assign a grade, we fi rst need to determine the effi ciency to which the grade refers. Both peak ef-fi ciency and European effi ciency aren‘t well-suited for this purpose. That is why PHOTON decided to defi ne its own effi ciency value, the value of which far exceeds conventional effi ciency data (see box p. 5). Furthermore, the goal of this grading sys-tem is to enable better comparisons of individual devices.
The grades provided in the survey can essen-tially be associated with the devices‘ overall utility, which is often diffi cult to determine for
Stec
a El
ektr
onik
Gm
bH
Inverters in serial production: PHOTON Lab selects test devices randomly from a list of a hundred consecutive
serial numbers.

4
PHOTON Laboratory
Laboratory
potential separation, is exclusively designed for use indoors or outdoors, or has a broad voltage range. In the meantime, there are now suitable transformerless inverter topologies for all known module types. Only the conversion efficiency‘s temperature interdependency has a relevant in-fluence on the grade. Furthermore, we provide information on the inverter‘s efficiency at 25 °C and the maximum temperature before any power reduction is detected. Both values are subtracted from one another. If the resulting efficiency red-uction reaches or exceeds the difference from the next, lower grade (for example, there‘s a 1.5 gap between »B« and »C«), the device receives the lo-wer grade (i.e. »C«).
The question of whether an inverter is well-suited for use with a particular module type is best answered by the manufacturer, but our tests should provide some guidance. For instance, the connections of some thin-film module types can-not be charged with negative potential against the ground. A few crystalline high-power modules require a high-impedance ground at the DC con-nection to avoid polarization effects. We request approval from the manufacturers of these modu-le types for the inverter under examination. As a matter of principle, the inverter input‘s potential in relation to the ground has to be known.
Naturally, our lab also measures the efficiency and the MPPT adjustment efficiency, both based on the specified PMPP power – the product of which is the overall efficiency. This is then applied across all the measured input voltages to establish the
average at each power level. This average is then weighted according to European and Californian efficiencies, and included in the evaluation. The overall efficiency is based on Heinrich Häberlin‘s definition of »total efficiency,« which is described in his book on the efficiency of PV inverters publis-hed in 2005.
The PHOTON efficiency for medium and high irradiation levels is an artificial value that repre-sents an image of the voltage and power inter-dependencies of an inverter‘s efficiency. The Eu-ropean and Californian weighting system reveals the dependence of the average overall efficiency on the geographic latitude at which the PV sys-tem is installed. This dependency is expressed with different weighting factors that result from the inclusion of meteorological data. This data al-lows the testers to make frequency distributions for certain solar irradiation values, which in turn provide weighting factors for particular power le-vels. The innovative part of the calculations used to establish the PHOTON efficiency parameters is that it includes all measured input voltages as specified in the manufacturer‘s description of the device‘s input voltage range – even if the device cannot perform as required in all parts of this ran-ge, in which case the efficiency is then listed as 0 percent. This reflects the conditions of a real PV system: after all, if an inverter had to face these conditions, it would cease operating properly.
The graphical representation shows these are-as. For instance, the color diagram included in our inverter tests shows the inverter‘s efficiency,
hatching marks. The diagonal upward lines repre-sent an MPP range in which the VMPPmax is generally absent for PV systems with crystalline modules.
The hatching marks in the other direction (i.e. sloping diagonally downward) represent the MPP range in which the VMPPmax is generally absent for PV systems with thin-film modules. The exact de-finition of these limits can be established when designing a system with actual modules. Hatching can also be seen in the lower portion of the MPP range. This highlights the area in which the acti-vation of the DC current limitations prevents the inverter from feeding 100 percent of available DC power into the grid. A PV system‘s VMPP shouldn‘t be located in this range either, since that would result in a yield loss.
The result of all of this is an efficiency number that is generally lower than the European effici-ency, since this is usually measured at the »best« voltage levels, and does not take mismatching and unreliable operating ranges into account. That means that PHOTON‘s efficiency can make an inverter look like it will fair worse than its true performance in a real PV system, since it takes the entire input voltage range specified by the manuf-acturer into consideration – regardless of whether that range will actually be exploited by a particular PV system. Hence, PHOTON‘s efficiency tells us something about the least you can expect from an inverter – and provides information about all sys-tem configurations that operate within the input voltage range specified by the manufacturer. Heinz Neuenstein, Ines Rutschmann
installers, wholesalers, system operators, insurance companies and banks. To give readers of our inverter test an immediate sense of a device‘s value, we assign a single grade for both medium and high irradiation to each inverter that takes into account all relevant factors such as an inverter's effici-ency dependence on input voltage, the suggested MPP operating point, information on the input current li-mitation on the operating point, and the relation between temperature and conversion efficiency. No other individual scores have an influence on the grade. The parameters re-flected in the grade are reviewed on an annual basis and are discussed with manufacturers in advance.
The total grade is based on two criteria: the assessment of the effi-ciency determined by PHOTON and the temperature-related reduction of efficiency. The grade for this ef-ficiency is assigned without any dif-ferentiation based on the suitability of the inverters' use with a particular solar generator. The best device is the one with the highest efficiency independent of whether or not it has
the MPPT adjustment efficiency and the overall efficiency. The diagram is colored black if the maximum MPP voltage isn‘t adequately distanced from the inverter‘s maximum DC voltage, and if it doesn‘t have an active overload limit according to the manufacturer, which means no measurements can be conducted in this range, since the MPP tracker won‘t ope-rate properly. The diagram also reflects the DC current limitation range. These black areas, which reflect a value of zero, are used to calculate an average based on the PHOTON grading system and, therefore, have a strong influence on the grade. The resulting effect is desired and a consequence of considerations about the inverter‘s actual, useable MPP range: an inverter will only get a good grade in the test if it actually can operate without limitations in the voltage range specified by the manufacturer. Finally, manufactu-rers who change their product data to reflect a more sensible MPP range will receive an improvement in their grade.
The color diagram also includes white hatched areas. These represent areas in the MPP voltage range that are consi-dered critical when designing a PV sys-tem. They are located at the upper end of the MPP range. There are two types of
A thermographic image shows temperature hotspots within an inverter. Naturally,
these hotspots can be critical for the long-term performance of a device.

5 Laboratory
The table showing the results achieved by the inverters tested in our lab looks slightly different due to a new grading system as of 2011. All of the inverters tested before 2011 have two grades: one based on the old sys-tem and one related to the new method.
The grades are based on the PHOTON efficiency at medium and high irradiation. More detailed information about the invert-ers can be found in the corresponding test
reports (the issue in which each report was published is noted in the last column of the table). The rankings are also based on the PHOTON efficiency.
The changes to the grading system were made to reflect the current status in the sec-tor and the system will be updated again in the future to reflect technical advancements. Now, inverters have to get a higher PHOTON efficiency to secure a better grade: what
would have gotten an A in 2010 with 96.4 percent, would now get a B. Should manu-facturers further improve their devices, these inverters could even get downgraded to a C as our grading system changes to reflect the current times.
New grades in PHOTON Lab’s inverter test as of 2011
GradinG system for inverter tests as of 2011A++ A+ A B C D F*1
PHOTON efficiency ≥ 99 ≥ 98 - < 99 ≥ 96.5 - < 98 ≥ 95 - < 96.5 ≥ 93.5 - < 95 ≥ 92 - < 93.5 < 92
Deviation from next grade 1 1 1.5 1.5 1.5 1.5 –
*1 to align grades with our US sister publication, we have changed the letter »E« to »F«
The diagrams for MPPT efficiency, conversion efficiency and overall efficiency demonstrate the dependence of these values on input volt-age VMPP and input power PDC. The MPP voltage range is divided into 20 steps and the DC pow-er range into 24 steps. The result is 480 differ-ent solar generator curves and every curve has a fill factor of 75 percent.
The 480 individual measurements form the basis of the three-dimensional diagrams. The third dimension in the diagrams is color, which shows all efficiencies achieved at different VMPP and PDC levels. The color spectrum and its correlation to measurements are pictured next to the diagram. While the input voltage VMPP (in the range specified by the manufacturer) is provided in absolute numbers on the y-axis, the specified power PMPP is shown on the x-axis in relative values. This is standardized accord-ing to the inverter’s nominal input power PDCNom and given in percent of PMPP nominal power. Just how far this range stretches beyond the 100-percent mark depends on manufacturer specifications.
If the maximum MPP voltage specified by the manufacturer is close to the maximum DC voltage, hatched areas show limitations on the inverter when it’s used with crystalline mod-ules, and below that another area with hatch-ing in the opposite direction that shows limita-tions when used with thin-film modules.
MPPT adjustment efficiency is calcu-lated comparing the available DC power (PMPP) with the DC power absorbed by the inverter. It provides insight into the inverter’s static MPP tracking – so how well the solar generator ab-sorbs the inverter’s predefined PMPP power.
Conversion efficiency is the relationship between the AC power PAC supplied by the inverter and the power absorbed on the invert-er’s DC side PDC. Both above and to the right of the diagram are cross-sections that are pic-tured in the three-dimensional color diagram. These show the dependency of efficiency on standardized power, and efficiency on voltage VMPP. At the top right, the inverter’s operating range is shown in relation to the MPP voltage range and the MPP power.
The overall efficiency is calculated as a product of the conversion efficiency and the MPPT adjustment efficiency for all 480 mea-surements. The diagram is arranged in a man-ner similar to that of conversion efficiency.
The diagram showing weighted conver-sion efficiency shows the measured effi-ciency level for medium irradiation (European efficiency) and for high irradiation (Californian efficiency), based on the California Energy Commission’s (CEC) definition, over the entire MPP voltage range.
The graph displaying efficiencies at dif-ferent VMPP voltages shows the course of efficiency at nominal power PMPP for minimum and maximum MPP voltage (VMPPmin and VMPP-
max), as well as for the lowest and highest MPP voltage value at which the inverter’s maximum efficiency is achieved (VMPPηSumMaxMin and VMPPηSumMaxMax). The maximum values (ηSumMax) for each of these levels are noted in the diagram. In the event that the courses of the VMPPηSumMaxMin and VMPPmin or VMPPηSumMaxMax and VMPPmax are identical, only one plot will be shown in the graph with the corresponding values (VMPPmin and VMPPmax).
The average overall efficiency gradient is shown in the same diagram and its highest value is noted, too (ηAvgSumMax). Average overall efficiency is attained by averaging all overall efficiencies at every level of the MPP nomi-nal power range over the entire MPP volt-age range outlined by the manufacturer. The average gradient is formed for power levels between 5 and 100 percent of nominal power. If the figures for medium (ηPmed) and high ir-radiation (ηPmax) are weighted, the PHOTON efficiency is determined. This value is also stated in the diagram.
Efficiency: Explanations of measurements and diagrams

6
PHOTON Laboratory
Laboratory
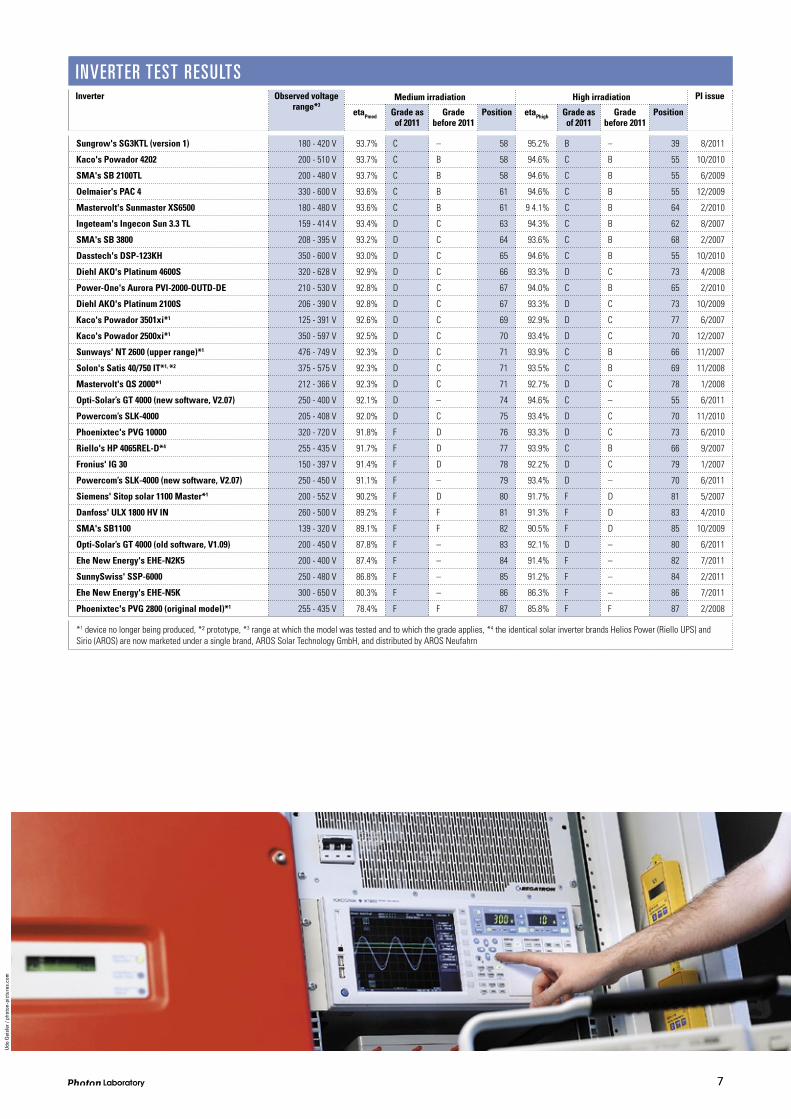
inverter test resultsInverter Observed voltage
range*3Medium irradiation High irradiation PI issue
etaPmed Grade as of 2011
Grade before 2011
Position etaPhigh Grade as of 2011
Grade before 2011
Position
SMA's STP 20000TLHE-10 580 - 800 V 98.5% A+ – 1 98.6% A+ – 1 12/2011
Steca's StecaGrid 3600 350 - 600 V 97.7% A – 2 97.8% A – 2 12/2011
Siemens’ Sinvert PVM20 480 - 850 V 97.5% A – 3 97.7% A – 3 4/2011
Siemens’ Sinvert PVM17 460 - 850 V 97.4% A – 4 97.7% A – 3 4/2011
Refusol's 17 K 460 - 850 V 97.4% A A+ 4 97.6% A A+ 5 12/2010
Refusol's 13 K 420 - 850 V 97.3% A A+ 6 97.6% A A+ 5 12/2010
Siemens' Sinvert PVM13 420 - 850 V 97.3% A – 6 97.6% A – 5 4/2011
SMA's STP 17000TL 400 - 800 V 97.3% A A+ 6 97.5% A A+ 8 12/2010
SMA's STP 10000TL-10 320 - 800 V 97.1% A – 9 97.5% A – 8 10/2011
Chint Power's CPS SC20KTL-O 500 - 800 V 97.1% A – 9 97.4% A – 10 11/2011
Siemens' Sinvert PVM10 380 - 850 V 97.0% A – 11 97.4% A – 10 1/2011
Mastervolt's Sunmaster CS20TL 350 - 800 V 96.9% A – 12 97.2% A – 12 5/2011
Refusol's 11 K*1 380 - 800 V 96.9% A A+ 12 97.2% A A+ 12 9/2008
SMA's SMC 8000 TL 335 - 487 V 96.9% A A+ 12 97.0% A A+ 15 10/2007
SMA's SMC 11000TL 333 - 500 V 96.9% A A+ 12 96.8% A A+ 22 7/2010
Sputnik's Solarmax 13MT 250 - 750 V 96.8% A – 16 97.1% A – 14 9/2011
Diehl AKO's Platinum 6300 TL 350 - 710 V 96.8% A A+ 16 96.9% A A+ 20 2/2009
Danfoss' TLX 15 k 430 - 800 V 96.7% A A+ 18 97.0% A A+ 15 6/2010
Eversolar New Energy's Eversol-TL 4600 290 - 500 V 96.7% A – 18 97.0% A – 15 9/2011
Sunways' NT 4200 340 - 750 V 96.7% A A+ 18 96.8% A A+ 22 3/2010
Conergy's IPG 15T 450 - 800 V 96.6% A A+ 21 97.0% A A+ 15 8/2010
SMA's SMC 700TL 333 - 500 V 96.6% A A+ 21 96.8% A A+ 22 5/2010
Danfoss' TLX 10 k 430 - 800 V 96.5% A A+ 23 97.0% A A+ 15 8/2010
Samil Power's Solarriver SR4K4TLA1 200 - 500 V 96.5% A – 23 96.8% A – 22 8/2011
Eltek Valere's Theia 4.4HE-t 230 - 480 V 96.5% A – 23 96.7% A – 27 11/2011
Power-One's Aurora PVI-12.5-OUTD-FS 360 - 750 V 96.4% B A 26 96.9% A A+ 20 4/2010
Kaco's Powador 4000 supreme DCS (9 kHz) 350 - 510 V 96.2% B A 27 96.7% A A+ 27 1/2010
Growatt's 5000 TL 280 - 500 V 96.0% B – 28 96.8% A – 22 2/2011
Fronius' IG TL 5 0 350 - 700 V 95.9% B A 29 96.2% B A 30 9/2010
Kaco's Powador 4000 supreme DCS (18 kHz) 350 - 510 V 95.7% B A 30 96.1% B A 31 1/2010
SMA's SB 5000TL-20 175 - 440 V 95.7% B A 30 96.0% B A 32 5/2009
Sungrow's SG4KTL 210 - 420 V 95.6% B – 32 96.3% B – 29 1/2011
Power-One's Aurora PVI-6000-OUTD-S 180 - 530 V 95.4% B A 33 95.9% B A 33 3/2009
Omnik New Energy’s Omniksol-2k-TL 120 - 450 V 95.2% B – 34 95.9% B – 33 1/2012
Aros' Sirio 4000 250 - 450 V 95.1% B A 35 95.7% B A 36 12/2008
Dasstech's DSP-123K2 200 - 450 V 95.1% B – 35 95.7% B – 36 3/2011
Conergy's IPG 5 S 275 - 750 V 95.0% B A 37 95.8% B A 35 9/2009
Fronius' IG Plus 100 230 - 500 V 94.8% C B 38 95.0% B A 42 11/2010
Sunways' AT 4500 250 - 600 V 94.6% C B 39 94.8% C B 46 7/2008
Sungrow's SG3KTL (version 2) 180 - 420 V 94.5% C – 40 95.7% B – 36 8/2011
Fronius' IG Plus 50 230 - 500 V 94.5% C B 40 94.8% C B 46 8/2008
Phoenixtec's PVG 2800 (updated model) 250 - 450 V 94.4% C B 42 95.1% B A 40 5/2008
Kaco's Powador 8000xi (new software; since Jan. 2010)*1 350 - 600 V 94.4% C B 42 94.7% C B 49 3/2010
Kaco's Powador 2500xi DCS 350 - 600 V 94.3% C B 44 95.0% B A 42 1/2010
Sunways' AT 2700 181 - 600 V 94.3% C B 44 94.8% C B 46 8/2009
Sputnik's SolarMax 6000S 220 - 550 V 94.3% C B 44 94.7% C B 49 11/2009
Carlo Gavazzi's ISMG150DE 200 - 450 V 94.1% C B 47 95.0% B A 42 5/2010
Xantrex's GT5.0SP 240 - 550 V 94.1% C B 47 94.7% C B 49 1/2009
Conergy's IPG 5000 vision*1 301 - 706 V 94.0% C B 49 94.7% C B 49 7/2007
Kaco's Powador 8000xi (old firmware; till Jan. 2010)*1 350 - 600 V 94.0% C B 49 94.7% C B 49 3/2010
Kostal's Piko 10.1 400 - 850 V 94.0% C B 49 94.4% C B 61 7/2009
Delta Energy Systems' SI 3300*1 150 - 435 V 93.9% C B 52 94.7% C B 49 5/2008
Mitsubishi's PV-PNS06ATL-GER 260 - 650 V 93.9% C B 52 94.6% C B 55 6/2008
SMA's SMC 7000HV 335 - 560V 93.9% C B 52 94.2% C B 63 9/2009
Sunways' NT 2600 (lower range)*1 350 - 623 V 93.8% C B 55 95.1% B A 40 11/2007
Steca’s Stecagrid 9000 3ph*1 350 - 680 V 93.8% C B 55 95.0% B A 42 7/2010
Sputnik's SolarMax 2000C*1 165 - 515 V 93.8% C B 55 93.1% D C 76 4/2007
7 Laboratory
inverter test resultsInverter Observed voltage
range*3Medium irradiation High irradiation PI issue
etaPmed Grade as of 2011
Grade before 2011
Position etaPhigh Grade as of 2011
Grade before 2011
Position
Udo
Gei
sler
/ ph
oton
-pic
ture
s.co
m
Sungrow's SG3KTL (version 1) 180 - 420 V 93.7% C – 58 95.2% B – 39 8/2011
Kaco's Powador 4202 200 - 510 V 93.7% C B 58 94.6% C B 55 10/2010
SMA's SB 2100TL 200 - 480 V 93.7% C B 58 94.6% C B 55 6/2009
Oelmaier's PAC 4 330 - 600 V 93.6% C B 61 94.6% C B 55 12/2009
Mastervolt's Sunmaster XS6500 180 - 480 V 93.6% C B 61 9 4.1% C B 64 2/2010
Ingeteam's Ingecon Sun 3.3 TL 159 - 414 V 93.4% D C 63 94.3% C B 62 8/2007
SMA's SB 3800 208 - 395 V 93.2% D C 64 93.6% C B 68 2/2007
Dasstech's DSP-123KH 350 - 600 V 93.0% D C 65 94.6% C B 55 10/2010
Diehl AKO's Platinum 4600S 320 - 628 V 92.9% D C 66 93.3% D C 73 4/2008
Power-One's Aurora PVI-2000-OUTD-DE 210 - 530 V 92.8% D C 67 94.0% C B 65 2/2010
Diehl AKO's Platinum 2100S 206 - 390 V 92.8% D C 67 93.3% D C 73 10/2009
Kaco's Powador 3501xi*1 125 - 391 V 92.6% D C 69 92.9% D C 77 6/2007
Kaco's Powador 2500xi*1 350 - 597 V 92.5% D C 70 93.4% D C 70 12/2007
Sunways' NT 2600 (upper range)*1 476 - 749 V 92.3% D C 71 93.9% C B 66 11/2007
Solon's Satis 40/750 IT*1, *2 375 - 575 V 92.3% D C 71 93.5% C B 69 11/2008
Mastervolt's QS 2000*1 212 - 366 V 92.3% D C 71 92.7% D C 78 1/2008
Opti-Solar’s GT 4000 (new software, V2.07) 250 - 400 V 92.1% D – 74 94.6% C – 55 6/2011
Powercom’s SLK-4000 205 - 408 V 92.0% D C 75 93.4% D C 70 11/2010
Phoenixtec's PVG 10000 320 - 720 V 91.8% F D 76 93.3% D C 73 6/2010
Riello's HP 4065REL-D*4 255 - 435 V 91.7% F D 77 93.9% C B 66 9/2007
Fronius' IG 30 150 - 397 V 91.4% F D 78 92.2% D C 79 1/2007
Powercom’s SLK-4000 (new software, V2.07) 250 - 450 V 91.1% F – 79 93.4% D – 70 6/2011
Siemens' Sitop solar 1100 Master*1 200 - 552 V 90.2% F D 80 91.7% F D 81 5/2007
Danfoss' ULX 1800 HV IN 260 - 500 V 89.2% F F 81 91.3% F D 83 4/2010
SMA's SB1100 139 - 320 V 89.1% F F 82 90.5% F D 85 10/2009
Opti-Solar’s GT 4000 (old software, V1.09) 200 - 450 V 87.8% F – 83 92.1% D – 80 6/2011
Ehe New Energy's EHE-N2K5 200 - 400 V 87.4% F – 84 91.4% F – 82 7/2011
SunnySwiss' SSP-6000 250 - 480 V 86.8% F – 85 91.2% F – 84 2/2011
Ehe New Energy's EHE-N5K 300 - 650 V 80.3% F – 86 86.3% F – 86 7/2011
Phoenixtec's PVG 2800 (original model)*1 255 - 435 V 78.4% F F 87 85.8% F F 87 2/2008
*1 device no longer being produced, *² prototype, *3 range at which the model was tested and to which the grade applies, *4 the identical solar inverter brands Helios Power (Riello UPS) and Sirio (AROS) are now marketed under a single brand, AROS Solar Technology GmbH, and distributed by AROS Neufahrn

Simply download our test agreement and order form online at: www.photon.info laboratory inverter test Download: test agreement
For a personal assessment, please contact us. Our consultants, Wiebke Gottschalk and Min Ge, are looking forward to assisting you.
PHOTON Laboratory GmbHJuelicher Strasse 37652070 AachenGermany
Phone 00 49 / 241 / 40 03 - 53 00 Fax 00 49 / 241 / 40 03 - 57 00
www.photon.info/laboratory
Contacts:Ms. Wiebke [email protected]
Mr. Min Ge [email protected]