photogate timers - khu.ac.krweb.khu.ac.kr/~khyoo/gphyexp/photogate timer (me-9206a).pdf · and...
TRANSCRIPT
012-06379A3/99
Instruction Manual andExperiment Guide forthe PASCO scientificModel ME-9206A andME-9215A
© 1988 PASCO scientific $15.00
PHOTOGATE TIMERS
IncludesTeacher's Notes
andTypical
Experiment Results

012-06379A Photogate Timers
® i
Table of Contents
Page
Copyright and Warranty .................................................................................. ii
Equipment Return............................................................................................ ii
Introduction .....................................................................................................1
Operation .........................................................................................................2
Accessories for the Photogate Timer ...............................................................4
10 Copy-Ready Experiments: ..........................................................................4
Experiment 1: Instantaneous vs Average Velocity ...................................5
Experiment 2: Kinematics on an Inclined Plane ......................................7
Experiment 3: Speed of a Projectile .........................................................9
Experiment 4: Newton's Second Law......................................................11
Experiment 5: The Force of Gravity ........................................................13
Experiment 6: Conservation of Momentum ............................................15
Experiment 7: Kinetic Energy .................................................................17
Experiment 8: Conservation of Mechanical Energy................................19
Experiment 9: Elastic-Kinetic Energy .....................................................21
Experiment 10: Pendulum Motion ..........................................................23
Schematic ME-9206A ....................................................................................26
Schematic ME-9215A ....................................................................................27
Teachers Guide...............................................................................................28
Technical Support .................................................................................. Back Cover
Photogate Timers 012-06379A
®
Equipment Return
Should the product have to be returned to PASCOscientific for any reason, notify PASCO scientific byletter, phone, or fax BEFORE returning the product. Uponnotification, the return authorization and shipping instruc-tions will be promptly issued.
ä NOTE: NO EQUIPMENT WILL BEACCEPTED FOR RETURN WITHOUT ANAUTHORIZATION FROM PASCO.
When returning equipment for repair, the units must bepacked properly. Carriers will not accept responsibility fordamage caused by improper packing. To be certain theunit will not be damaged in shipment, observe the follow-ing rules:
➀ The packing carton must be strong enough for the itemshipped.
➁ Make certain there are at least two inches of packingmaterial between any point on the apparatus and theinside walls of the carton.
➂ Make certain that the packing material cannot shift inthe box or become compressed, allowing theinstrument come in contact with the packing carton.
Address: PASCO scientific
10101 Foothills Blvd.
Roseville, CA 95747-7100
Phone: (916) 786-3800
FAX: (916) 786-3292
email: [email protected]
web: www.pasco.com
ii
Copyright Notice
The PASCO scientific 012-06379A Photogate Timersmanual is copyrighted and all rights reserved. However,permission is granted to non-profit educational institutionsfor reproduction of any part of the manual providing thereproductions are used only for their laboratories and arenot sold for profit. Reproduction under any other circum-stances, without the written consent of PASCO scientific,is prohibited.
Limited Warranty
PASCO scientific warrants the product to be free fromdefects in materials and workmanship for a period of oneyear from the date of shipment to the customer. PASCOwill repair or replace at its option any part of the productwhich is deemed to be defective in material or workman-ship. The warranty does not cover damage to the productcaused by abuse or improper use. Determination ofwhether a product failure is the result of a manufacturingdefect or improper use by the customer shall be madesolely by PASCO scientific. Responsibility for the returnof equipment for warranty repair belongs to the customer.Equipment must be properly packed to prevent damageand shipped postage or freight prepaid. (Damage causedby improper packing of the equipment for return shipmentwill not be covered by the warranty.) Shipping costs forreturning the equipment after repair will be paid byPASCO scientific.
Copyright, Warranty, and Equipment Return
Please—Feel free to duplicate this manualsubject to the copyright restrictions below.
:
012-06379A Photogate Timers
1®
Introduction
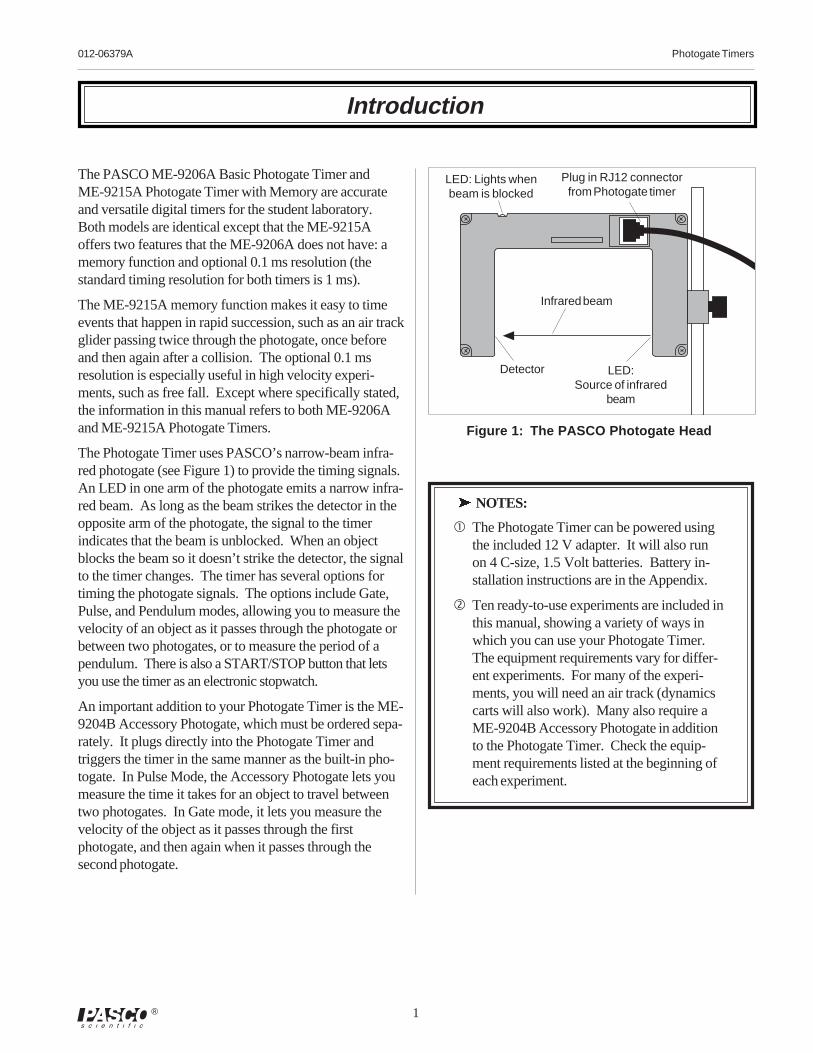
Detector
LED: Lights whenbeam is blocked
Infrared beam
The PASCO ME-9206A Basic Photogate Timer andME-9215A Photogate Timer with Memory are accurateand versatile digital timers for the student laboratory.Both models are identical except that the ME-9215Aoffers two features that the ME-9206A does not have: amemory function and optional 0.1 ms resolution (thestandard timing resolution for both timers is 1 ms).
The ME-9215A memory function makes it easy to timeevents that happen in rapid succession, such as an air trackglider passing twice through the photogate, once beforeand then again after a collision. The optional 0.1 msresolution is especially useful in high velocity experi-ments, such as free fall. Except where specifically stated,the information in this manual refers to both ME-9206Aand ME-9215A Photogate Timers.
The Photogate Timer uses PASCO’s narrow-beam infra-red photogate (see Figure 1) to provide the timing signals.An LED in one arm of the photogate emits a narrow infra-red beam. As long as the beam strikes the detector in theopposite arm of the photogate, the signal to the timerindicates that the beam is unblocked. When an objectblocks the beam so it doesn’t strike the detector, the signalto the timer changes. The timer has several options fortiming the photogate signals. The options include Gate,Pulse, and Pendulum modes, allowing you to measure thevelocity of an object as it passes through the photogate orbetween two photogates, or to measure the period of apendulum. There is also a START/STOP button that letsyou use the timer as an electronic stopwatch.
An important addition to your Photogate Timer is the ME-9204B Accessory Photogate, which must be ordered sepa-rately. It plugs directly into the Photogate Timer andtriggers the timer in the same manner as the built-in pho-togate. In Pulse Mode, the Accessory Photogate lets youmeasure the time it takes for an object to travel betweentwo photogates. In Gate mode, it lets you measure thevelocity of the object as it passes through the firstphotogate, and then again when it passes through thesecond photogate.
LED:Source of infrared
beam
ä NOTES:
� The Photogate Timer can be powered usingthe included 12 V adapter. It will also runon 4 C-size, 1.5 Volt batteries. Battery in-stallation instructions are in the Appendix.
� Ten ready-to-use experiments are included inthis manual, showing a variety of ways inwhich you can use your Photogate Timer.The equipment requirements vary for differ-ent experiments. For many of the experi-ments, you will need an air track (dynamicscarts will also work). Many also require aME-9204B Accessory Photogate in additionto the Photogate Timer. Check the equip-ment requirements listed at the beginning ofeach experiment.
Figure 1: The PASCO Photogate Head
Plug in RJ12 connectorfrom Photogate timer
2
Photogate Timers 012-06379A
®
To Operate the Photogate Timer:
� Plug the RJ12 phone connector from the timer into theRJ12 phone jack on the Photogate Head.
� Plug the 9/12 volt power adapter into the small recep-tacle on the side of the timer and into a standard 110VAC, 60 Hz (or 220/240 VAC, 50 Hz) wall outlet.
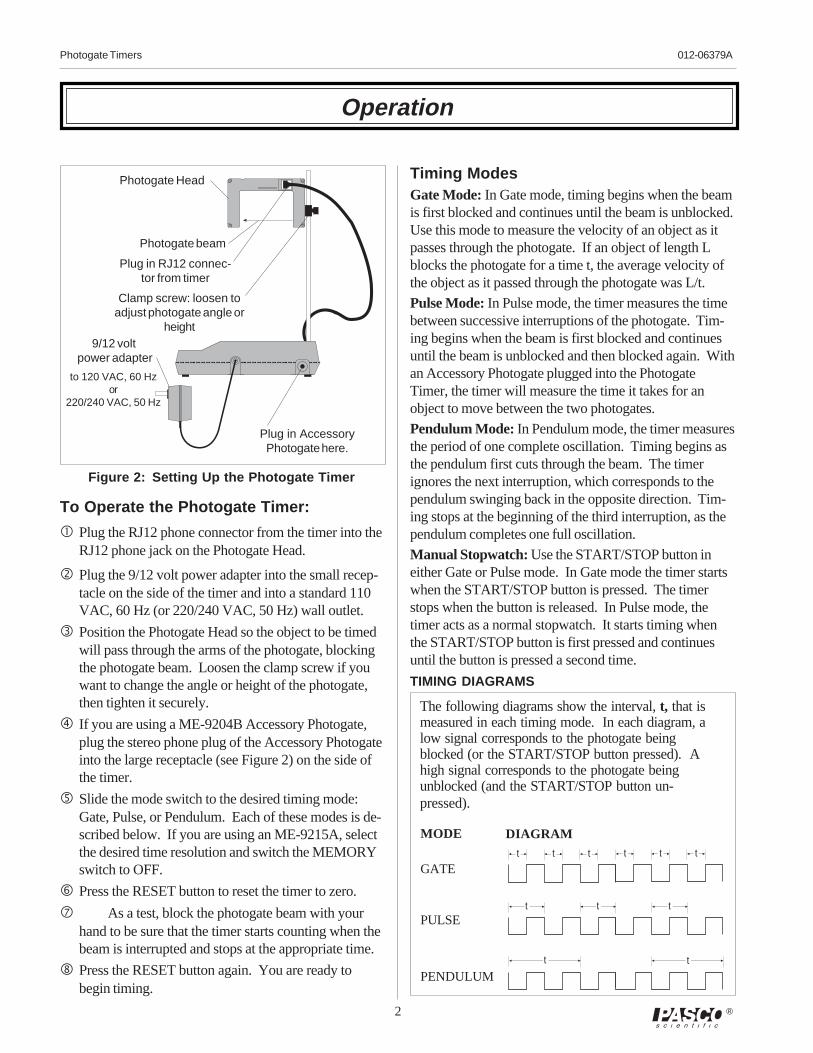
� Position the Photogate Head so the object to be timedwill pass through the arms of the photogate, blockingthe photogate beam. Loosen the clamp screw if youwant to change the angle or height of the photogate,then tighten it securely.
� If you are using a ME-9204B Accessory Photogate,plug the stereo phone plug of the Accessory Photogateinto the large receptacle (see Figure 2) on the side ofthe timer.
� Slide the mode switch to the desired timing mode:Gate, Pulse, or Pendulum. Each of these modes is de-scribed below. If you are using an ME-9215A, selectthe desired time resolution and switch the MEMORYswitch to OFF.
� Press the RESET button to reset the timer to zero.
� As a test, block the photogate beam with yourhand to be sure that the timer starts counting when thebeam is interrupted and stops at the appropriate time.
� Press the RESET button again. You are ready tobegin timing.
Timing ModesGate Mode: In Gate mode, timing begins when the beamis first blocked and continues until the beam is unblocked.Use this mode to measure the velocity of an object as itpasses through the photogate. If an object of length Lblocks the photogate for a time t, the average velocity ofthe object as it passed through the photogate was L/t.
Pulse Mode: In Pulse mode, the timer measures the timebetween successive interruptions of the photogate. Tim-ing begins when the beam is first blocked and continuesuntil the beam is unblocked and then blocked again. Withan Accessory Photogate plugged into the PhotogateTimer, the timer will measure the time it takes for anobject to move between the two photogates.
Pendulum Mode: In Pendulum mode, the timer measuresthe period of one complete oscillation. Timing begins asthe pendulum first cuts through the beam. The timerignores the next interruption, which corresponds to thependulum swinging back in the opposite direction. Tim-ing stops at the beginning of the third interruption, as thependulum completes one full oscillation.
Manual Stopwatch: Use the START/STOP button ineither Gate or Pulse mode. In Gate mode the timer startswhen the START/STOP button is pressed. The timerstops when the button is released. In Pulse mode, thetimer acts as a normal stopwatch. It starts timing whenthe START/STOP button is first pressed and continuesuntil the button is pressed a second time.
TIMING DIAGRAMS
Operation
The following diagrams show the interval, t, that ismeasured in each timing mode. In each diagram, alow signal corresponds to the photogate beingblocked (or the START/STOP button pressed). Ahigh signal corresponds to the photogate beingunblocked (and the START/STOP button un-pressed).
Photogate beam
Plug in AccessoryPhotogate here.
9/12 volt power adapter
to 120 VAC, 60 Hzor
220/240 VAC, 50 Hz
Clamp screw: loosen toadjust photogate angle or
height
MODE DIAGRAM
GATE
PULSE
PENDULUM
Figure 2: Setting Up the Photogate Timer
Photogate Head
Plug in RJ12 connec-tor from timer
t t t t t t
t t t
t t
012-06379A Photogate Timers
3®
SPECIFICATIONS
Detector rise time: 200 ns max.
Fall Time: 200 ns max.
Parallax error: For an object passing through the photo-gate, within 1 cm of the detector, with a velocity of lessthan 10 m/s, the difference between the true and effectivelength of the object will be less than 1 millimeter.
Infrared source: Peak output at 880 nm; 10,000 hour life.
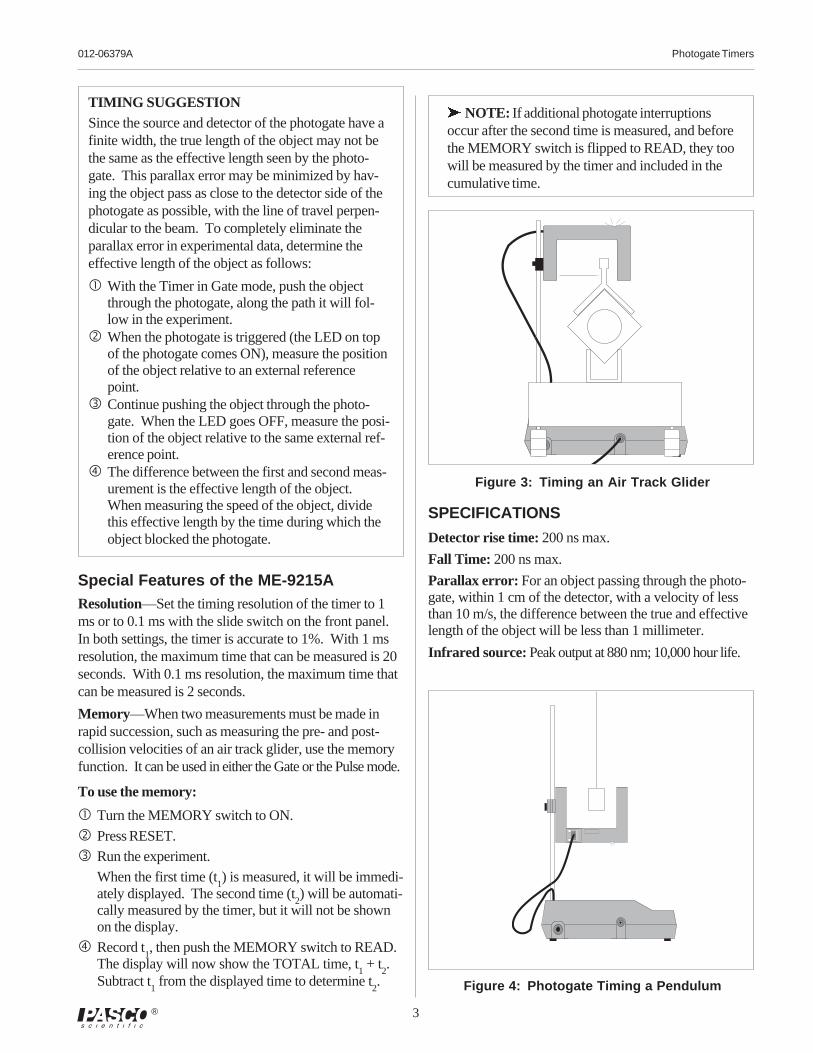
Figure 3 : Timing an Air Track Glider
ä NOTE: If additional photogate interruptionsoccur after the second time is measured, and beforethe MEMORY switch is flipped to READ, they toowill be measured by the timer and included in thecumulative time.
TIMING SUGGESTIONSince the source and detector of the photogate have afinite width, the true length of the object may not bethe same as the effective length seen by the photo-gate. This parallax error may be minimized by hav-ing the object pass as close to the detector side of thephotogate as possible, with the line of travel perpen-dicular to the beam. To completely eliminate theparallax error in experimental data, determine theeffective length of the object as follows:
� With the Timer in Gate mode, push the objectthrough the photogate, along the path it will fol-low in the experiment.
� When the photogate is triggered (the LED on topof the photogate comes ON), measure the positionof the object relative to an external referencepoint.
� Continue pushing the object through the photo-gate. When the LED goes OFF, measure the posi-tion of the object relative to the same external ref-erence point.
� The difference between the first and second meas-urement is the effective length of the object.When measuring the speed of the object, dividethis effective length by the time during which theobject blocked the photogate.
Special Features of the ME-9215AResolution—Set the timing resolution of the timer to 1ms or to 0.1 ms with the slide switch on the front panel.In both settings, the timer is accurate to 1%. With 1 msresolution, the maximum time that can be measured is 20seconds. With 0.1 ms resolution, the maximum time thatcan be measured is 2 seconds.
Memory—When two measurements must be made inrapid succession, such as measuring the pre- and post-collision velocities of an air track glider, use the memoryfunction. It can be used in either the Gate or the Pulse mode.
To use the memory:
� Turn the MEMORY switch to ON.
� Press RESET.
� Run the experiment.
When the first time (t1) is measured, it will be immedi-
ately displayed. The second time (t2) will be automati-
cally measured by the timer, but it will not be shownon the display.
� Record t1, then push the MEMORY switch to READ.
The display will now show the TOTAL time, t1 + t
2.
Subtract t1 from the displayed time to determine t
2. Figure 4 : Photogate Timing a Pendulum
4
Photogate Timers 012-06379A
®
The following accessories are available to help extend theutility of your model ME-9206A or ME-9215A PhotogateTimer. All the accessories work equally well with eithermodel. See the current PASCO catalog for more infor-mation.
ME-9204B Accessory Photogate
The stereo phone plug of the ME-9204B AccessoryPhotogate plugs into the phone jack on the side of thePhotogate Timer, giving you two identical photogatesoperating from a single timer. With the timer in Gatemode, you can measure the velocity of an object as itpasses through one photogate, then again as it passesthrough the second photogate. With the timer in Pulsemode, you can measure the time it takes for an object topass between the two photogates. (Many of the experi-ments in this manual are most easily performed using aPhotogate Timer with an Accessory Photogate.)
ME-9207B Free Fall Adapter
For easy and accurate measurements of the accelerationof gravity, the ME-9207B Free Fall Adapter is hard tobeat. The Free Fall Adapter plugs directly into the phoneplug on the side of the Photogate Timer. It comes witheverything you need, including two steel balls (of differ-ent size and mass), a release mechanism, and a receptorpad. The release mechanism and the receptor pad auto-matically trigger the timer, so you get remarkably accu-rate measurements of the free fall time of the steel ball.
ME-9259A Laser Switch
This highly collimated photodetector is identical to aphotogate, except that you use a laser (not included) asthe light source. You can now time the motion of objectsthat are far too big to fit through a standard photogate.Measure the period of a bowling ball pendulum or thevelocity of a car. The Laser Switch operates in all threetiming modes (Gate, Pulse, and Pendulum).
Accessories for the Photogate Timer
The following 10 experiments are written in worksheet form. Feel freeto photocopy them for use in your lab.
NOTE: In each experiment, the first paragraph is a list of equipmentneeded. Be sure to read this paragraph first, as the equipment needsvary from experiment to experiment.
This manual emphasizes the use of an air track, but the air track experi-ments can also be performed with dynamics carts. Many also require aME-9204B Accessory Photogate in addition to a Photogate Timer.Collision experiments, such as experiments 6 and 7, require four timesto be measured in rapid succession and are therefore most easily per-formed using two Photogate Timers.
10 Copy-Ready Experiments
012-06379A Photogate Timers
5®
Experiment 1: Instantaneous Versus Average Velocity
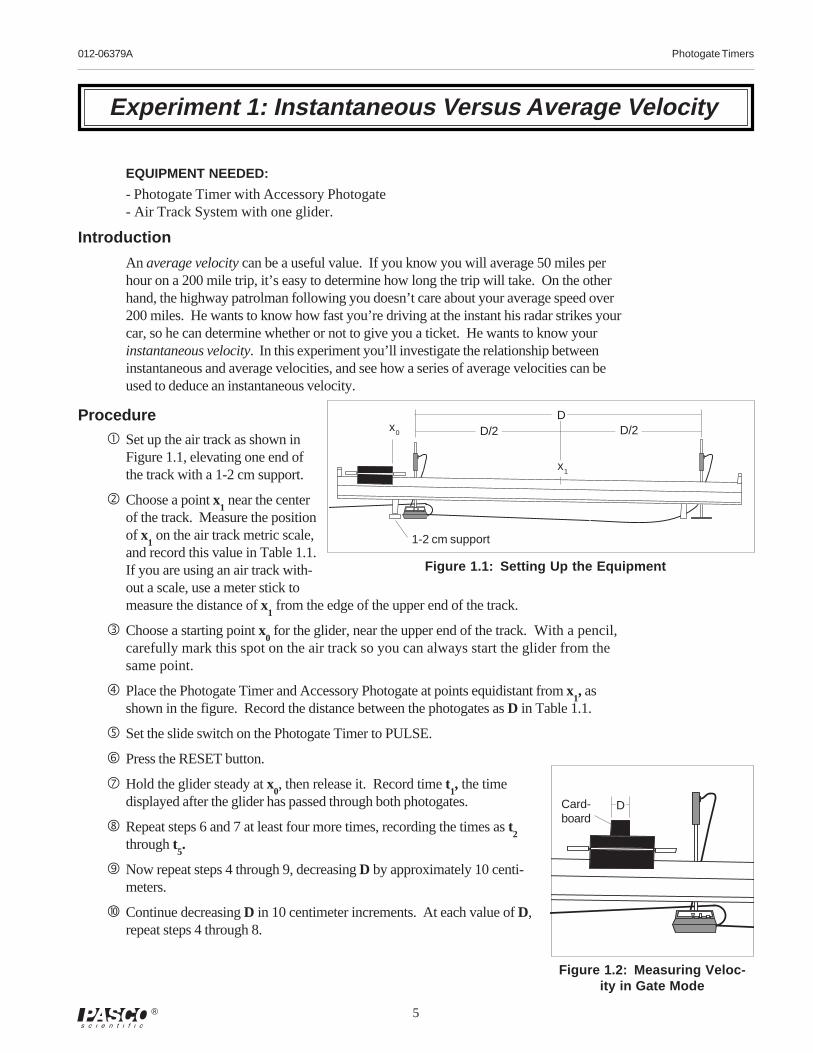
x0
1-2 cm support
x1
Figure 1.1: Setting Up the Equipment
DD/2 D/2
Card-board
D
Figure 1.2: Measuring Veloc-ity in Gate Mode
EQUIPMENT NEEDED:
- Photogate Timer with Accessory Photogate- Air Track System with one glider.
Introduction
An average velocity can be a useful value. If you know you will average 50 miles perhour on a 200 mile trip, it’s easy to determine how long the trip will take. On the otherhand, the highway patrolman following you doesn’t care about your average speed over200 miles. He wants to know how fast you’re driving at the instant his radar strikes yourcar, so he can determine whether or not to give you a ticket. He wants to know yourinstantaneous velocity. In this experiment you’ll investigate the relationship betweeninstantaneous and average velocities, and see how a series of average velocities can beused to deduce an instantaneous velocity.
Procedure
� Set up the air track as shown inFigure 1.1, elevating one end ofthe track with a 1-2 cm support.
� Choose a point x1 near the center
of the track. Measure the positionof x
1 on the air track metric scale,
and record this value in Table 1.1.If you are using an air track with-out a scale, use a meter stick tomeasure the distance of x
1 from the edge of the upper end of the track.
� Choose a starting point x0 for the glider, near the upper end of the track. With a pencil,
carefully mark this spot on the air track so you can always start the glider from thesame point.
� Place the Photogate Timer and Accessory Photogate at points equidistant from x1, as
shown in the figure. Record the distance between the photogates as D in Table 1.1.
� Set the slide switch on the Photogate Timer to PULSE.
� Press the RESET button.
� Hold the glider steady at x0, then release it. Record time t
1, the time
displayed after the glider has passed through both photogates.
� Repeat steps 6 and 7 at least four more times, recording the times as t2
through t5.
� Now repeat steps 4 through 9, decreasing D by approximately 10 centi-meters.
� Continue decreasing D in 10 centimeter increments. At each value of D,repeat steps 4 through 8.
6
Photogate Timers 012-06379A
®
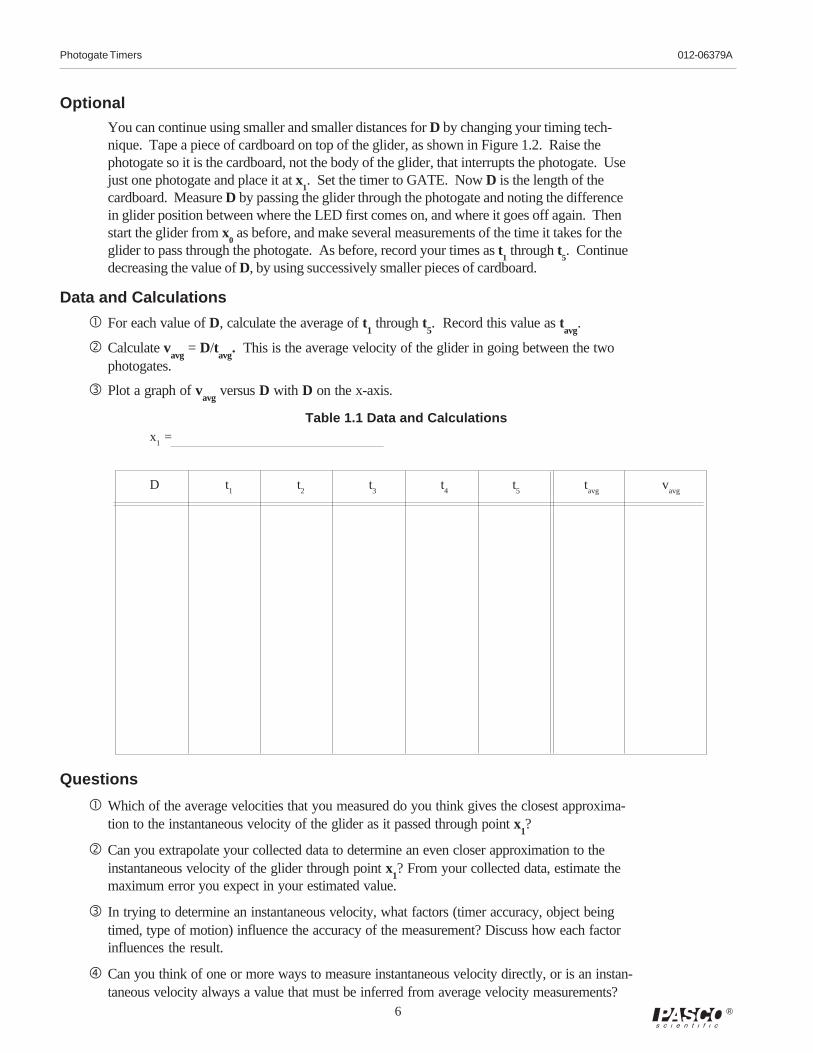
Optional
You can continue using smaller and smaller distances for D by changing your timing tech-nique. Tape a piece of cardboard on top of the glider, as shown in Figure 1.2. Raise thephotogate so it is the cardboard, not the body of the glider, that interrupts the photogate. Usejust one photogate and place it at x
1. Set the timer to GATE. Now D is the length of the
cardboard. Measure D by passing the glider through the photogate and noting the differencein glider position between where the LED first comes on, and where it goes off again. Thenstart the glider from x
0 as before, and make several measurements of the time it takes for the
glider to pass through the photogate. As before, record your times as t1 through t
5. Continue
decreasing the value of D, by using successively smaller pieces of cardboard.
Data and Calculations
� For each value of D, calculate the average of t1 through t
5. Record this value as t
avg.
� Calculate vavg
= D/tavg
. This is the average velocity of the glider in going between the twophotogates.
� Plot a graph of vavg
versus D with D on the x-axis.
x1 =
D t1
t2
t3
t4
t5
tavg
vavg
Questions
� Which of the average velocities that you measured do you think gives the closest approxima-tion to the instantaneous velocity of the glider as it passed through point x
1?
� Can you extrapolate your collected data to determine an even closer approximation to theinstantaneous velocity of the glider through point x
1? From your collected data, estimate the
maximum error you expect in your estimated value.
� In trying to determine an instantaneous velocity, what factors (timer accuracy, object beingtimed, type of motion) influence the accuracy of the measurement? Discuss how each factorinfluences the result.
� Can you think of one or more ways to measure instantaneous velocity directly, or is an instan-taneous velocity always a value that must be inferred from average velocity measurements?
Table 1.1 Data and Calculations
012-06379A Photogate Timers
7®
Experiment 2: Kinematics on an Inclined Plane
EQUIPMENT NEEDED:
-Photogate Timer -Meter stick-Ball and ramp, [A ball bearing (approximately 1.8 cm diameter) and a U-channelramp (approximately 50 cm long with an inside width of approximately 1 cm) willwork well, but the exact dimensions are not important].
Introduction
In this lab you will investigate how the velocityof an object varies as it undergoes a constantacceleration. The object is a ball rolling downan inclined ramp. Instead of the usual investi-gation of velocity as a function of time, you willmeasure its velocity as a function of the dis-tance it has travelled from its starting point.(ä Note: This experiment is just as easily per-formed with a glider on an inclined airtrack.)
Procedure
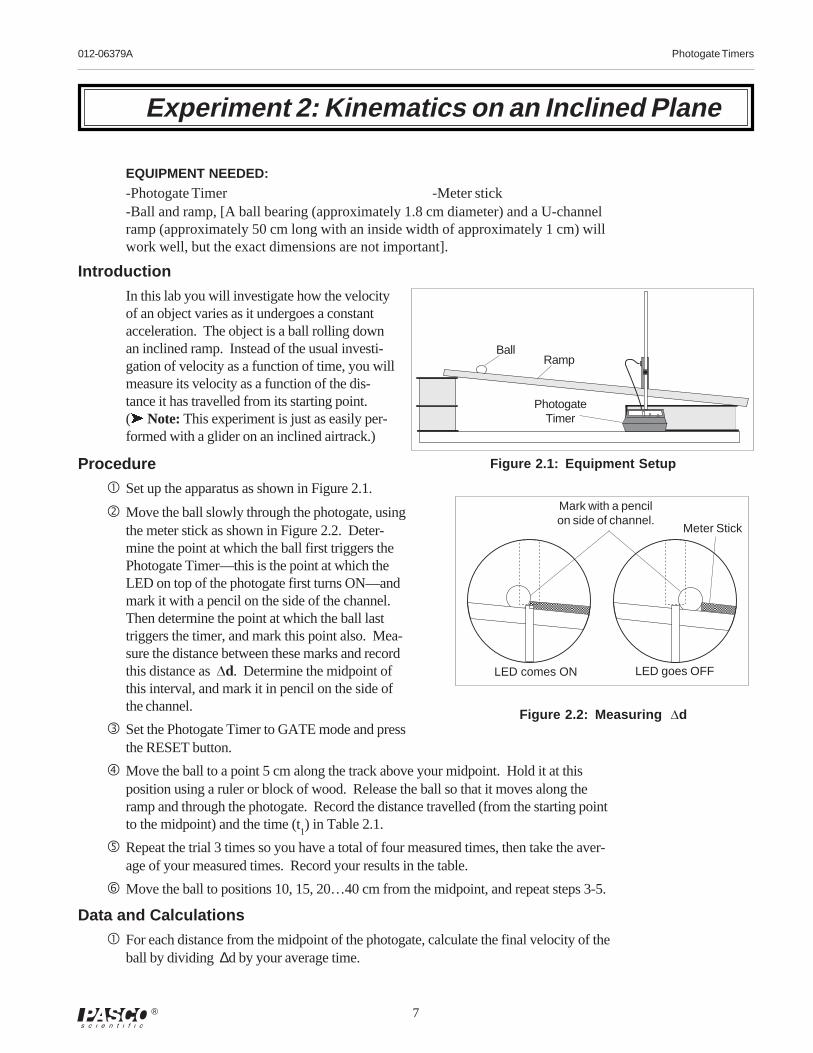
� Set up the apparatus as shown in Figure 2.1.
� Move the ball slowly through the photogate, usingthe meter stick as shown in Figure 2.2. Deter-mine the point at which the ball first triggers thePhotogate Timer—this is the point at which theLED on top of the photogate first turns ON—andmark it with a pencil on the side of the channel.Then determine the point at which the ball lasttriggers the timer, and mark this point also. Mea-sure the distance between these marks and recordthis distance as Dd. Determine the midpoint ofthis interval, and mark it in pencil on the side ofthe channel.
� Set the Photogate Timer to GATE mode and pressthe RESET button.
� Move the ball to a point 5 cm along the track above your midpoint. Hold it at thisposition using a ruler or block of wood. Release the ball so that it moves along theramp and through the photogate. Record the distance travelled (from the starting pointto the midpoint) and the time (t
1) in Table 2.1.
� Repeat the trial 3 times so you have a total of four measured times, then take the aver-age of your measured times. Record your results in the table.
� Move the ball to positions 10, 15, 20…40 cm from the midpoint, and repeat steps 3-5.
Data and Calculations
� For each distance from the midpoint of the photogate, calculate the final velocity of theball by dividing ∆d by your average time.
BallRamp
Figure 2.1: Equipment Setup
PhotogateTimer
Mark with a pencilon side of channel.
Meter Stick
Figure 2.2: Measuring Dd
LED goes OFFLED comes ON
8
Photogate Timers 012-06379A
®
Distancet
1t 2
t 3
FinalAveraget4
Table 2.1 Data and Calculations
Distance inside photogate = Dd:
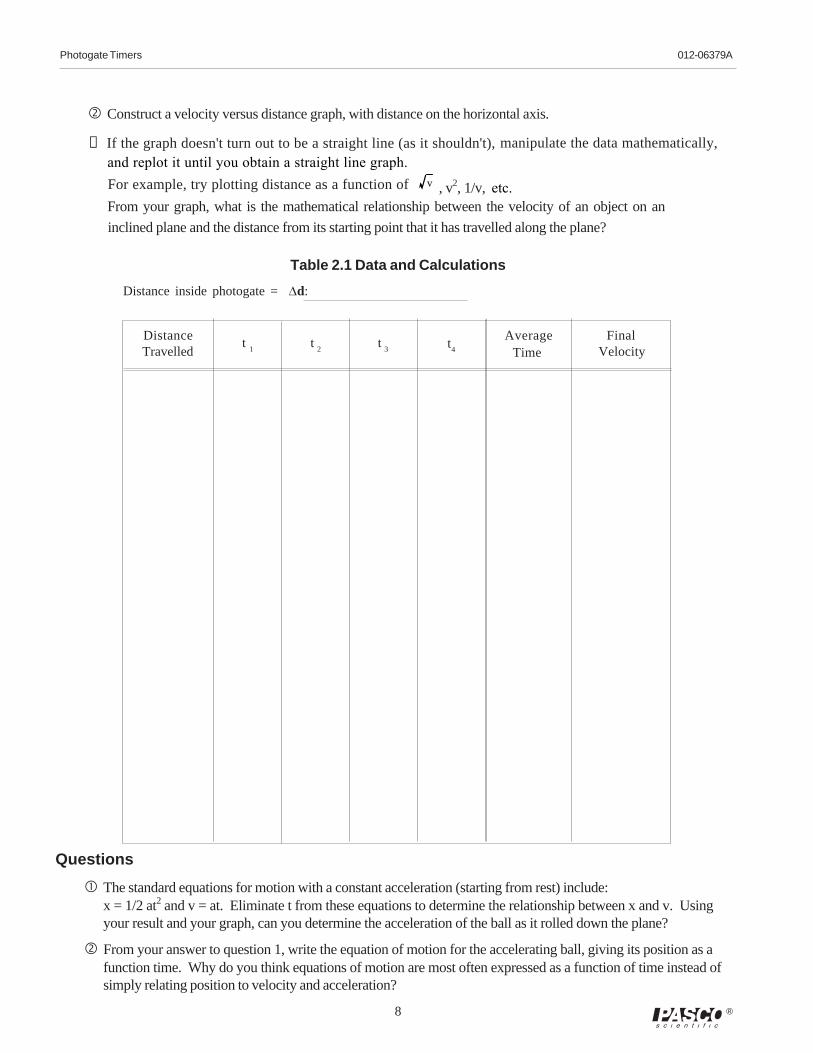
� Construct a velocity versus distance graph, with distance on the horizontal axis.
➂ If the graph doesn't turn out to be a straight line (as it shouldn't), manipulate the data mathematically,
For example, try plotting distance as a function of v , v2, 1/v,From your graph, what is the mathematical relationship between the velocity of an object on an
inclined plane and the distance from its starting point that it has travelled along the plane?
Questions
� The standard equations for motion with a constant acceleration (starting from rest) include:x = 1/2 at2 and v = at. Eliminate t from these equations to determine the relationship between x and v. Usingyour result and your graph, can you determine the acceleration of the ball as it rolled down the plane?
� From your answer to question 1, write the equation of motion for the accelerating ball, giving its position as afunction time. Why do you think equations of motion are most often expressed as a function of time instead ofsimply relating position to velocity and acceleration?
Travelled Time Velocity
and replot it until you obtain a straight line graph.
etc.
012-06379A Photogate Timers
9®
Experiment 3: Speed of a Projectile
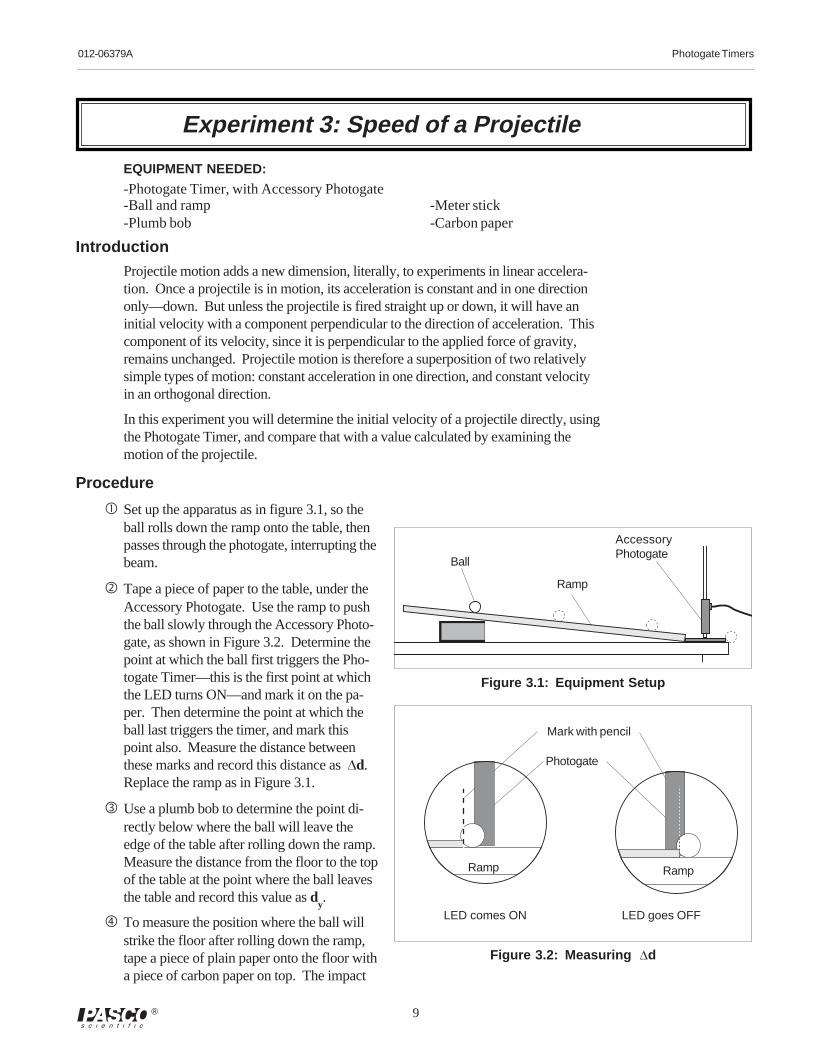
Figure 3.1: Equipment Setup
Ramp
Mark with pencil
Photogate
LED comes ON LED goes OFF
Figure 3.2: Measuring Dd
AccessoryPhotogate
Ramp
Ball
EQUIPMENT NEEDED:
-Photogate Timer, with Accessory Photogate-Ball and ramp -Meter stick-Plumb bob -Carbon paper
Introduction
Projectile motion adds a new dimension, literally, to experiments in linear accelera-tion. Once a projectile is in motion, its acceleration is constant and in one directiononly—down. But unless the projectile is fired straight up or down, it will have aninitial velocity with a component perpendicular to the direction of acceleration. Thiscomponent of its velocity, since it is perpendicular to the applied force of gravity,remains unchanged. Projectile motion is therefore a superposition of two relativelysimple types of motion: constant acceleration in one direction, and constant velocityin an orthogonal direction.
In this experiment you will determine the initial velocity of a projectile directly, usingthe Photogate Timer, and compare that with a value calculated by examining themotion of the projectile.
Procedure
� Set up the apparatus as in figure 3.1, so theball rolls down the ramp onto the table, thenpasses through the photogate, interrupting thebeam.
� Tape a piece of paper to the table, under theAccessory Photogate. Use the ramp to pushthe ball slowly through the Accessory Photo-gate, as shown in Figure 3.2. Determine thepoint at which the ball first triggers the Pho-togate Timer—this is the first point at whichthe LED turns ON—and mark it on the pa-per. Then determine the point at which theball last triggers the timer, and mark thispoint also. Measure the distance betweenthese marks and record this distance as Dd.Replace the ramp as in Figure 3.1.
� Use a plumb bob to determine the point di-rectly below where the ball will leave theedge of the table after rolling down the ramp.Measure the distance from the floor to the topof the table at the point where the ball leavesthe table and record this value as d
y.
� To measure the position where the ball willstrike the floor after rolling down the ramp,tape a piece of plain paper onto the floor witha piece of carbon paper on top. The impact
Ramp
10
Photogate Timers 012-06379A
®
of the ball will leave a clear mark for measuring purposes.
� Set the Photogate Timer to GATE mode. Now move the ball to a starting point somewhereon the ramp. Mark this starting position with a pencil so you will be able to repeat the run,starting the ball each time from the same point. Hold the ball at this position using a ruler orblock of wood. Press the RESET button. Release the ball so that it moves along the rampand through the photogate. Record the time in Table 3.1.
� Repeat the trial at least four more times with the same starting point, and record your times inthe table.
� Measure the distance from the point directly below the ramp to each of the landing spots ofyour ball. Record these distances in the data table.
Data and Calculations
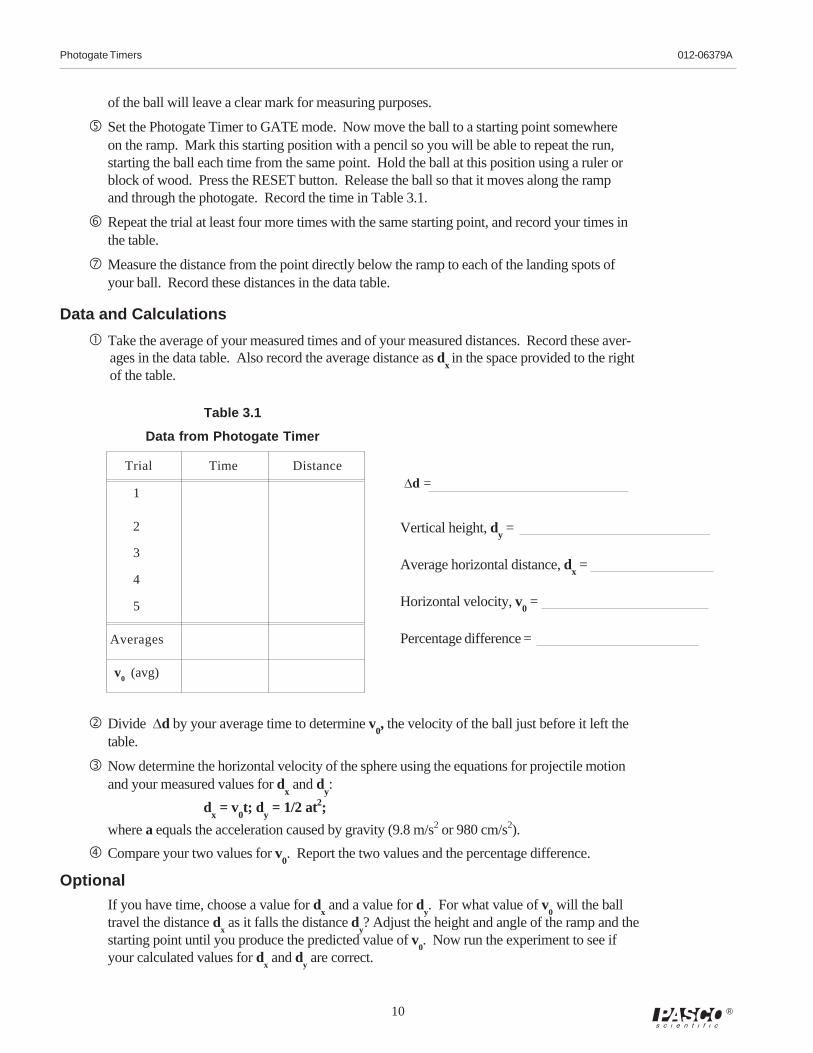
� Take the average of your measured times and of your measured distances. Record these aver-
Table 3.1
Data from Photogate Timer
Trial Time Distance
1
2
3
4
5
Averages
v0 (avg)
Dd =
Vertical height, dy =
Average horizontal distance, dx =
Horizontal velocity, v0 =
Percentage difference =
ages in the data table. Also record the average distance as dxin the space provided to the right
of the table.
� Divide Dd by your average time to determine v0, the velocity of the ball just before it left the
table.
� Now determine the horizontal velocity of the sphere using the equations for projectile motionand your measured values for d
x and d
y:
dx = v
0t; d
y = 1/2 at2;
where a equals the acceleration caused by gravity (9.8 m/s2 or 980 cm/s2).
� Compare your two values for v0. Report the two values and the percentage difference.
Optional
If you have time, choose a value for dx and a value for d
y. For what value of v
0 will the ball
travel the distance dx as it falls the distance d
y? Adjust the height and angle of the ramp and the
starting point until you produce the predicted value of v0. Now run the experiment to see if
your calculated values for dx and d
y are correct.
012-06379A Photogate Timers
11®
Experiment 4: Newton’s Second Law
EQUIPMENT NEEDED:-Photogate timer with Accessory Photogate (or two Photogate Timers)-Air Track System with one glider -Masses-Pulley -Pulley Mounting Clamp-Universal Table Clamp
Introduction
There’s nothing obvious about the relationships governing the motions of objects. Infact, it took around 4,000 years of civilization and the genius of Isaac Newton to figureout the basic laws. Fortunately for the rest of us, hindsight is a powerful research tool.In this experiment you will experimentally determine Newton’s second law by examin-ing the motion of an air track glider under the influence of a constant force. The con-stant force will be supplied by the weight of a hanging mass that will be used to pull theglider. By varying the mass of the hanging weight and of the glider, and measuring theacceleration of the glider, you’ll be able to determine Newton’s second law.
Procedure
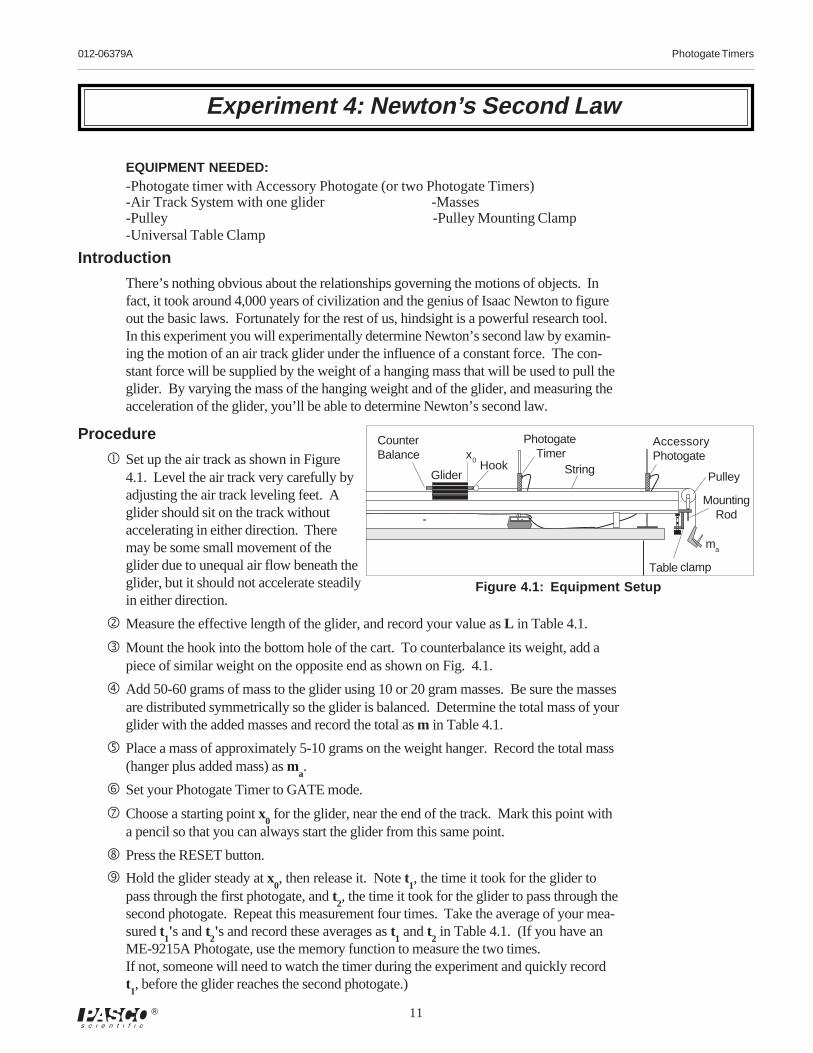
� Set up the air track as shown in Figure4.1. Level the air track very carefully byadjusting the air track leveling feet. Aglider should sit on the track withoutaccelerating in either direction. Theremay be some small movement of theglider due to unequal air flow beneath theglider, but it should not accelerate steadilyin either direction.
� Measure the effective length of the glider, and record your value as L in Table 4.1.
� Mount the hook into the bottom hole of the cart. To counterbalance its weight, add apiece of similar weight on the opposite end as shown on Fig. 4.1.
� Add 50-60 grams of mass to the glider using 10 or 20 gram masses. Be sure the massesare distributed symmetrically so the glider is balanced. Determine the total mass of yourglider with the added masses and record the total as m in Table 4.1.
� Place a mass of approximately 5-10 grams on the weight hanger. Record the total mass(hanger plus added mass) as m
a.
� Set your Photogate Timer to GATE mode.
� Choose a starting point x0 for the glider, near the end of the track. Mark this point with
a pencil so that you can always start the glider from this same point.
� Press the RESET button.
� Hold the glider steady at x0, then release it. Note t
1, the time it took for the glider to
pass through the first photogate, and t2, the time it took for the glider to pass through the
second photogate. Repeat this measurement four times. Take the average of your mea-sured t
1's and t
2's and record these averages as t
1 and t
2 in Table 4.1. (If you have an
ME-9215A Photogate, use the memory function to measure the two times.If not, someone will need to watch the timer during the experiment and quickly recordt1, before the glider reaches the second photogate.)
AccessoryPhotogate
Hook
PhotogateTimer
ma
StringPulley
MountingRod
CounterBalance
Glider
x0
Figure 4.1: Equipment SetupTable clamp
12
Photogate Timers 012-06379A
®
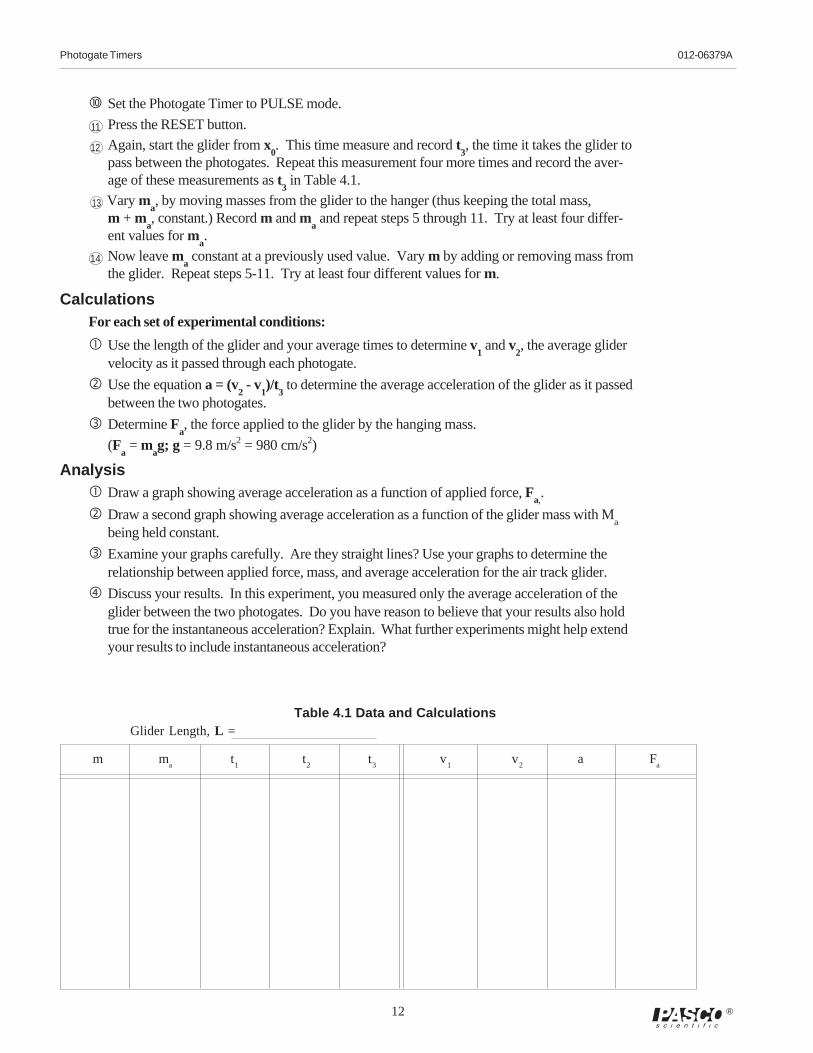
m ma
t1
t2
t3
v1
v2
a Fa
Glider Length, L =Table 4.1 Data and Calculations
� Set the Photogate Timer to PULSE mode.
11 Press the RESET button.
12 Again, start the glider from x0. This time measure and record t
3, the time it takes the glider to
pass between the photogates. Repeat this measurement four more times and record the aver-age of these measurements as t
3 in Table 4.1.
13 Vary ma, by moving masses from the glider to the hanger (thus keeping the total mass,
m + ma, constant.) Record m and m
a and repeat steps 5 through 11. Try at least four differ-
ent values for ma.
14 Now leave ma constant at a previously used value. Vary m by adding or removing mass from
the glider. Repeat steps 5-11. Try at least four different values for m.
CalculationsFor each set of experimental conditions:
� Use the length of the glider and your average times to determine v1 and v
2, the average glider
velocity as it passed through each photogate.
� Use the equation a = (v2 - v
1)/t
3 to determine the average acceleration of the glider as it passed
between the two photogates.
� Determine Fa, the force applied to the glider by the hanging mass.
(Fa = m
ag; g = 9.8 m/s2 = 980 cm/s2)
Analysis� Draw a graph showing average acceleration as a function of applied force, F
a,.
� Draw a second graph showing average acceleration as a function of the glider mass with Ma
being held constant.
� Examine your graphs carefully. Are they straight lines? Use your graphs to determine therelationship between applied force, mass, and average acceleration for the air track glider.
� Discuss your results. In this experiment, you measured only the average acceleration of theglider between the two photogates. Do you have reason to believe that your results also holdtrue for the instantaneous acceleration? Explain. What further experiments might help extendyour results to include instantaneous acceleration?
012-06379A Photogate Timers
13®
EQUIPMENT NEEDED:-Photogate timer with Accessory Photogate -Air Track System with one glider.
Introduction
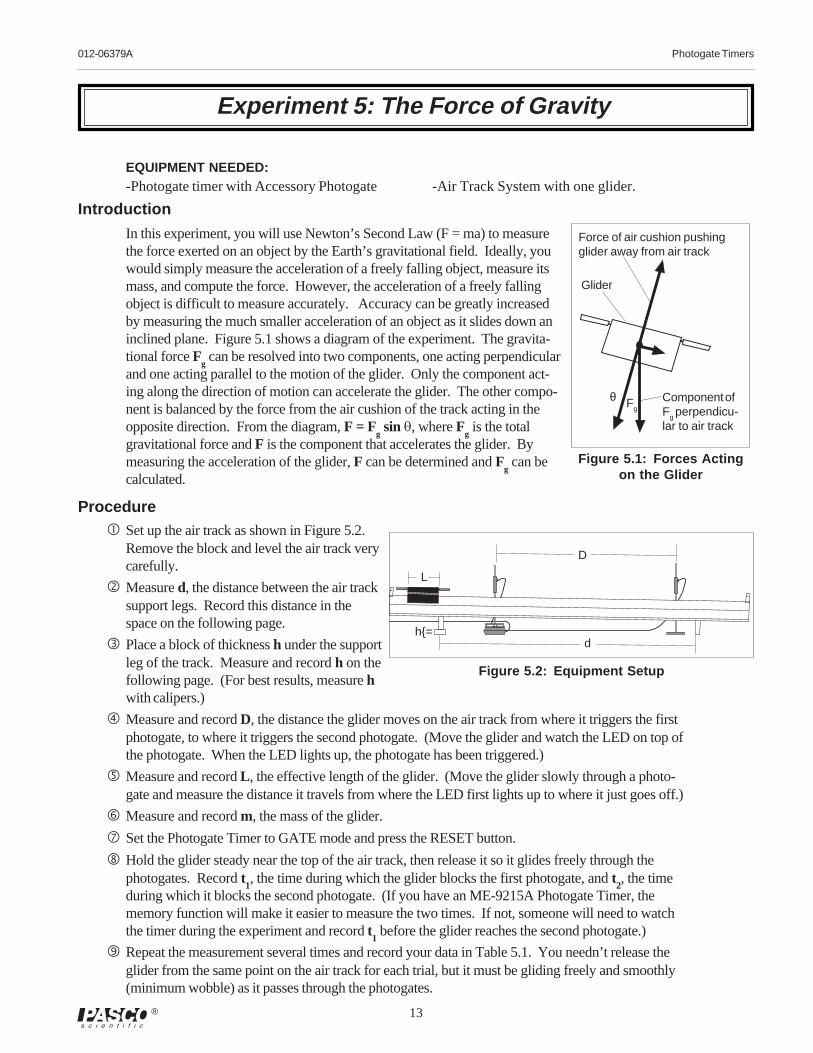
In this experiment, you will use Newton’s Second Law (F = ma) to measurethe force exerted on an object by the Earth’s gravitational field. Ideally, youwould simply measure the acceleration of a freely falling object, measure itsmass, and compute the force. However, the acceleration of a freely fallingobject is difficult to measure accurately. Accuracy can be greatly increasedby measuring the much smaller acceleration of an object as it slides down aninclined plane. Figure 5.1 shows a diagram of the experiment. The gravita-tional force F
g can be resolved into two components, one acting perpendicular
and one acting parallel to the motion of the glider. Only the component act-ing along the direction of motion can accelerate the glider. The other compo-nent is balanced by the force from the air cushion of the track acting in theopposite direction. From the diagram, F = F
g sin q, where F
g is the total
gravitational force and F is the component that accelerates the glider. Bymeasuring the acceleration of the glider, F can be determined and F
g can be
calculated.
Procedure� Set up the air track as shown in Figure 5.2.
Remove the block and level the air track verycarefully.
� Measure d, the distance between the air tracksupport legs. Record this distance in thespace on the following page.
� Place a block of thickness h under the supportleg of the track. Measure and record h on thefollowing page. (For best results, measure hwith calipers.)
� Measure and record D, the distance the glider moves on the air track from where it triggers the firstphotogate, to where it triggers the second photogate. (Move the glider and watch the LED on top ofthe photogate. When the LED lights up, the photogate has been triggered.)
� Measure and record L, the effective length of the glider. (Move the glider slowly through a photo-gate and measure the distance it travels from where the LED first lights up to where it just goes off.)
� Measure and record m, the mass of the glider.
� Set the Photogate Timer to GATE mode and press the RESET button.
� Hold the glider steady near the top of the air track, then release it so it glides freely through thephotogates. Record t
1, the time during which the glider blocks the first photogate, and t
2, the time
during which it blocks the second photogate. (If you have an ME-9215A Photogate Timer, thememory function will make it easier to measure the two times. If not, someone will need to watchthe timer during the experiment and record t
1 before the glider reaches the second photogate.)
� Repeat the measurement several times and record your data in Table 5.1. You needn’t release theglider from the same point on the air track for each trial, but it must be gliding freely and smoothly(minimum wobble) as it passes through the photogates.
Component ofFg perpendicu-lar to air track
Force of air cushion pushingglider away from air track
Glider
Figure 5.1: Forces Actingon the Glider
L
dh{=
Figure 5.2: Equipment Setup
Experiment 5: The Force of Gravity
D
Fg
θ
14
Photogate Timers 012-06379A
®
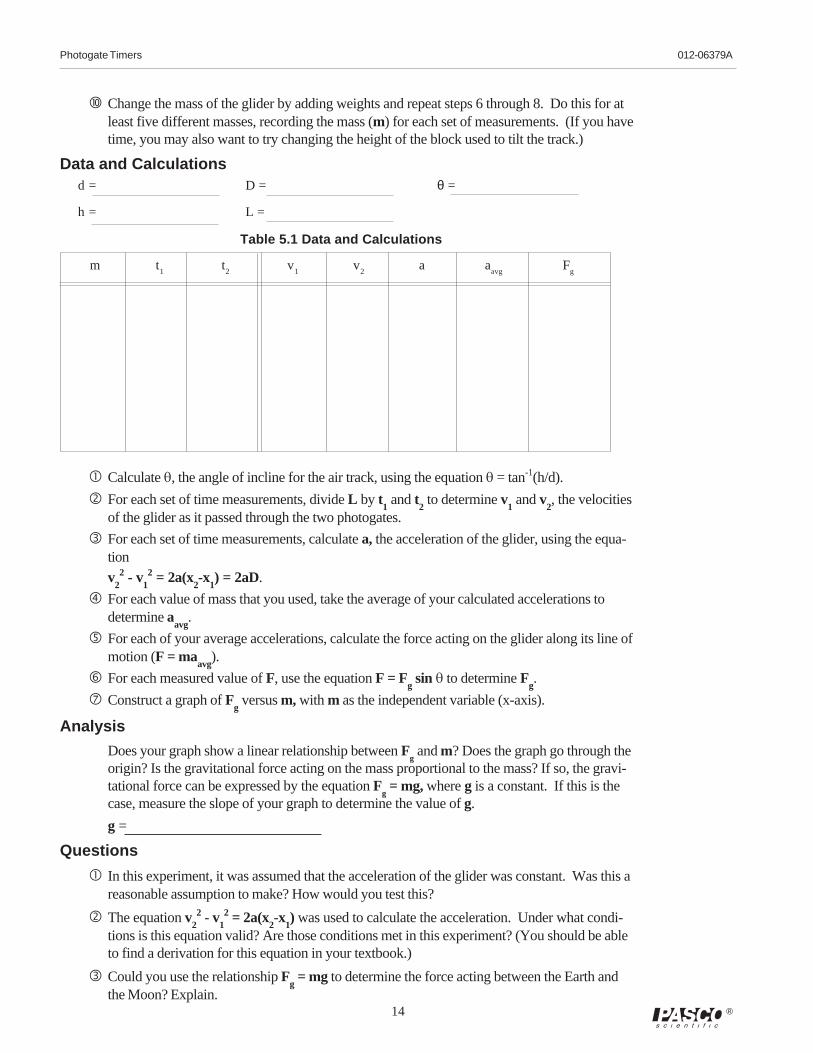
� Change the mass of the glider by adding weights and repeat steps 6 through 8. Do this for atleast five different masses, recording the mass (m) for each set of measurements. (If you havetime, you may also want to try changing the height of the block used to tilt the track.)
Data and Calculations
Table 5.1 Data and Calculations
m t1
t2
v1
v2
a aavg
Fg
d = D = θ =
h = L =
� Calculate q, the angle of incline for the air track, using the equation q = tan-1(h/d).
� For each set of time measurements, divide L by t1 and t
2 to determine v
1 and v
2, the velocities
of the glider as it passed through the two photogates.
� For each set of time measurements, calculate a, the acceleration of the glider, using the equa-tion
v22 - v
12 = 2a(x
2-x
1) = 2aD.
� For each value of mass that you used, take the average of your calculated accelerations todetermine a
avg.
� For each of your average accelerations, calculate the force acting on the glider along its line ofmotion (F = ma
avg).
� For each measured value of F, use the equation F = Fg sin q to determine F
g.
� Construct a graph of Fg versus m, with m as the independent variable (x-axis).
Analysis
Does your graph show a linear relationship between Fg and m? Does the graph go through the
origin? Is the gravitational force acting on the mass proportional to the mass? If so, the gravi-tational force can be expressed by the equation F
g = mg, where g is a constant. If this is the
case, measure the slope of your graph to determine the value of g.
g =
Questions
� In this experiment, it was assumed that the acceleration of the glider was constant. Was this areasonable assumption to make? How would you test this?
� The equation v22 - v
12 = 2a(x
2-x
1) was used to calculate the acceleration. Under what condi-
tions is this equation valid? Are those conditions met in this experiment? (You should be ableto find a derivation for this equation in your textbook.)
� Could you use the relationship Fg = mg to determine the force acting between the Earth and
the Moon? Explain.
012-06379A Photogate Timers
15®
Experiment 6: Conservation of Momentum
EQUIPMENT NEEDED:
-Air track system with two gliders -Two Photogate Timers.
IntroductionWhen objects collide, whether locomotives, shopping carts, or your foot and the sidewalk, theresults can be complicated. Yet even in the most chaotic of collisions, as long as there are no ex-ternal forces acting on the colliding objects, one principle always holds and provides an excellenttool for understanding the dynamics of the collision. That principle is called the conservation ofmomentum. For a two-object collision, momentum conservation is easily stated mathematically bythe equation:
pi = m
1v
1i + m
2v
2i = m
1v
1f + m
2v
2f = p
f ;
where m1 and m
2 are the masses of the two objects, v
1i and v
2i are the initial velocities of the ob-
jects (before the collision), v1f and v
2f are the final velocities of the objects, and p
i and p
f are the
combined momentums of the objects, before and after the collision. In this experiment, you willverify the conservation of momentum in a collision of two airtrack gliders.
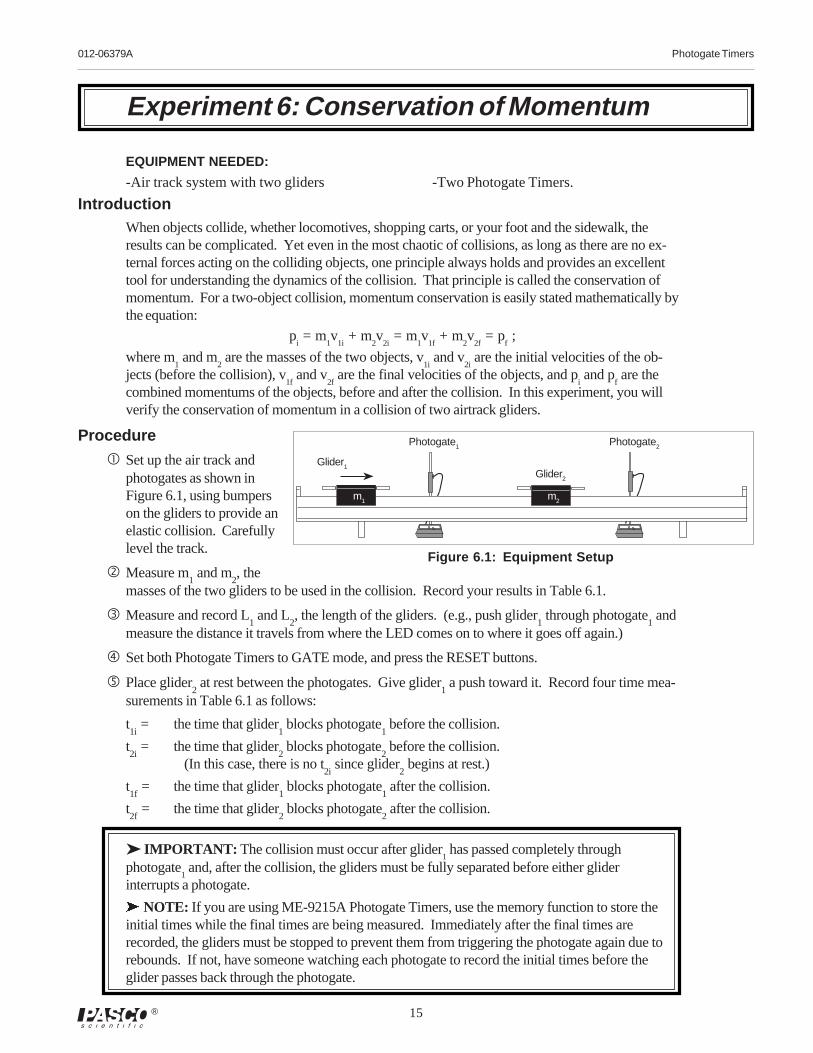
Procedure
� Set up the air track andphotogates as shown inFigure 6.1, using bumperson the gliders to provide anelastic collision. Carefullylevel the track.
� Measure m1 and m
2, the
masses of the two gliders to be used in the collision. Record your results in Table 6.1.
� Measure and record L1 and L
2, the length of the gliders. (e.g., push glider
1 through photogate
1 and
measure the distance it travels from where the LED comes on to where it goes off again.)
� Set both Photogate Timers to GATE mode, and press the RESET buttons.
� Place glider2 at rest between the photogates. Give glider
1 a push toward it. Record four time mea-
surements in Table 6.1 as follows:
t1i = the time that glider
1 blocks photogate
1 before the collision.
t2i = the time that glider
2 blocks photogate
2 before the collision.
(In this case, there is no t2i since glider
2 begins at rest.)
t1f = the time that glider
1 blocks photogate
1 after the collision.
t2f = the time that glider
2 blocks photogate
2 after the collision.
➤ IMPORTANT: The collision must occur after glider1 has passed completely through
photogate1 and, after the collision, the gliders must be fully separated before either glider
interrupts a photogate.
ä NOTE: If you are using ME-9215A Photogate Timers, use the memory function to store theinitial times while the final times are being measured. Immediately after the final times arerecorded, the gliders must be stopped to prevent them from triggering the photogate again due torebounds. If not, have someone watching each photogate to record the initial times before theglider passes back through the photogate.
Photogate1
Glider2
Glider1
Photogate2
m2m1
Figure 6.1: Equipment Setup
16
Photogate Timers 012-06379A
®
� Repeat the experiment several times, varying the mass of one or both gliders and varying theinitial velocity of glider
1.
� Try collisions in which the initial velocity of glider2 is not zero. You may need to practice a
bit to coordinate the gliders so the collision takes place completely between the photogates.
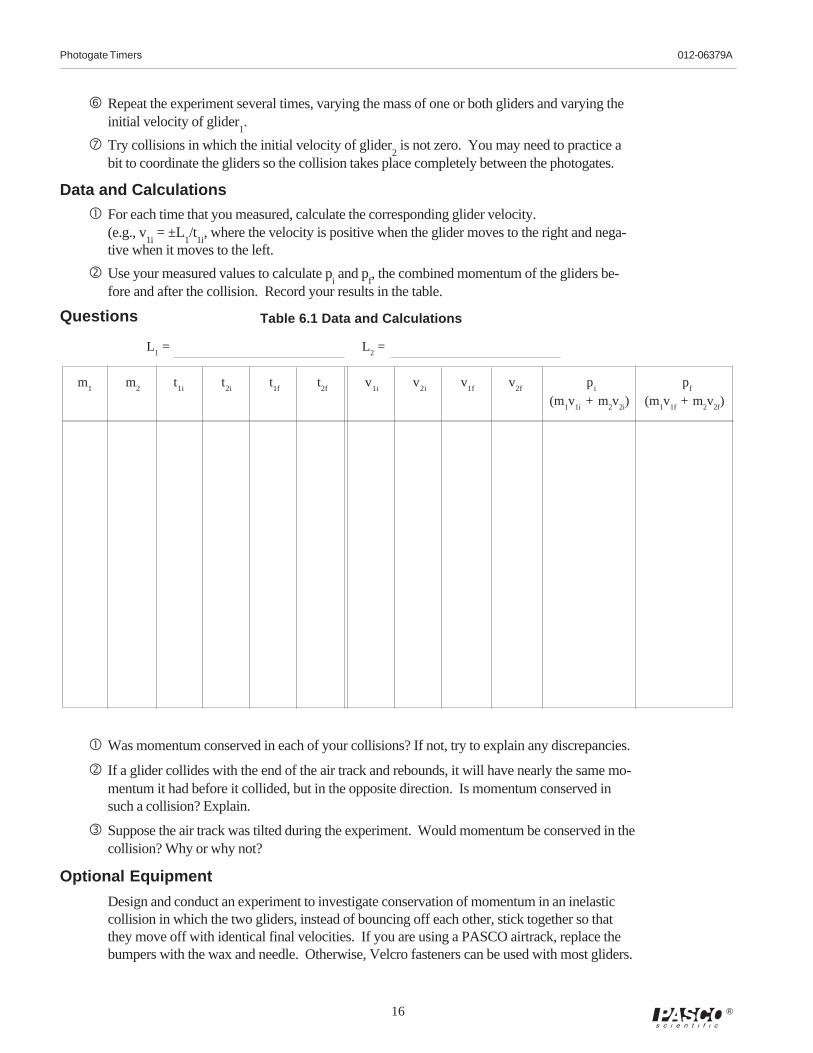
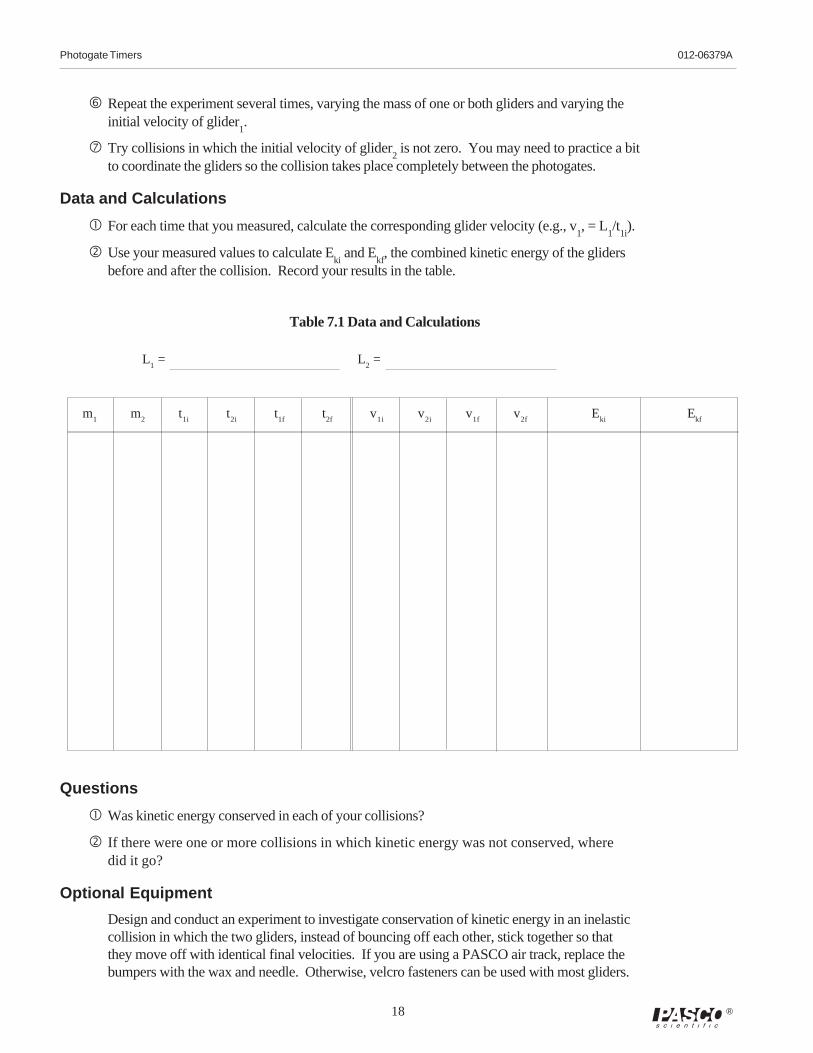
Data and Calculations
� For each time that you measured, calculate the corresponding glider velocity.(e.g., v
1i = ±L
1/t
1i, where the velocity is positive when the glider moves to the right and nega-
tive when it moves to the left.
� Use your measured values to calculate pi and p
f, the combined momentum of the gliders be-
fore and after the collision. Record your results in the table.
Questions
L1 = L
2 =
Table 6.1 Data and Calculations
� Was momentum conserved in each of your collisions? If not, try to explain any discrepancies.
� If a glider collides with the end of the air track and rebounds, it will have nearly the same mo-mentum it had before it collided, but in the opposite direction. Is momentum conserved insuch a collision? Explain.
� Suppose the air track was tilted during the experiment. Would momentum be conserved in thecollision? Why or why not?
Optional Equipment
Design and conduct an experiment to investigate conservation of momentum in an inelasticcollision in which the two gliders, instead of bouncing off each other, stick together so thatthey move off with identical final velocities. If you are using a PASCO airtrack, replace thebumpers with the wax and needle. Otherwise, Velcro fasteners can be used with most gliders.
m1
m2
t1i
t2i
t1f
t2f
v1i
v2i
v1f
v2f
pi
pf
(m1v
1i + m
2v
2i) (m
1v
1f + m
2v
2f)
012-06379A Photogate Timers
17®
Experiment 7: Conservation of Kinetic Energy
EQUIPMENT NEEDED:
-Two Photogate Timers -Air Track System with two gliders.
Introduction
Momentum is always conserved in collisions that are isolated from external forces. Energy is alsoalways conserved, but energy conservation is much harder to demonstrate since the energy canchange forms: energy of motion (kinetic energy) may be changed into heat energy, gravitationalpotential energy, or even chemical potential energy. In the air track glider collisions you’ll be in-vestigating, the total energy before the collision is simply the kinetic energy of the gliders:
Ek = (1/2)mv
12 + (1/2)mv
22.
In this experiment you’ll examine the kinetic energy before and after a collision to determine ifkinetic energy is conserved in air track collisions.
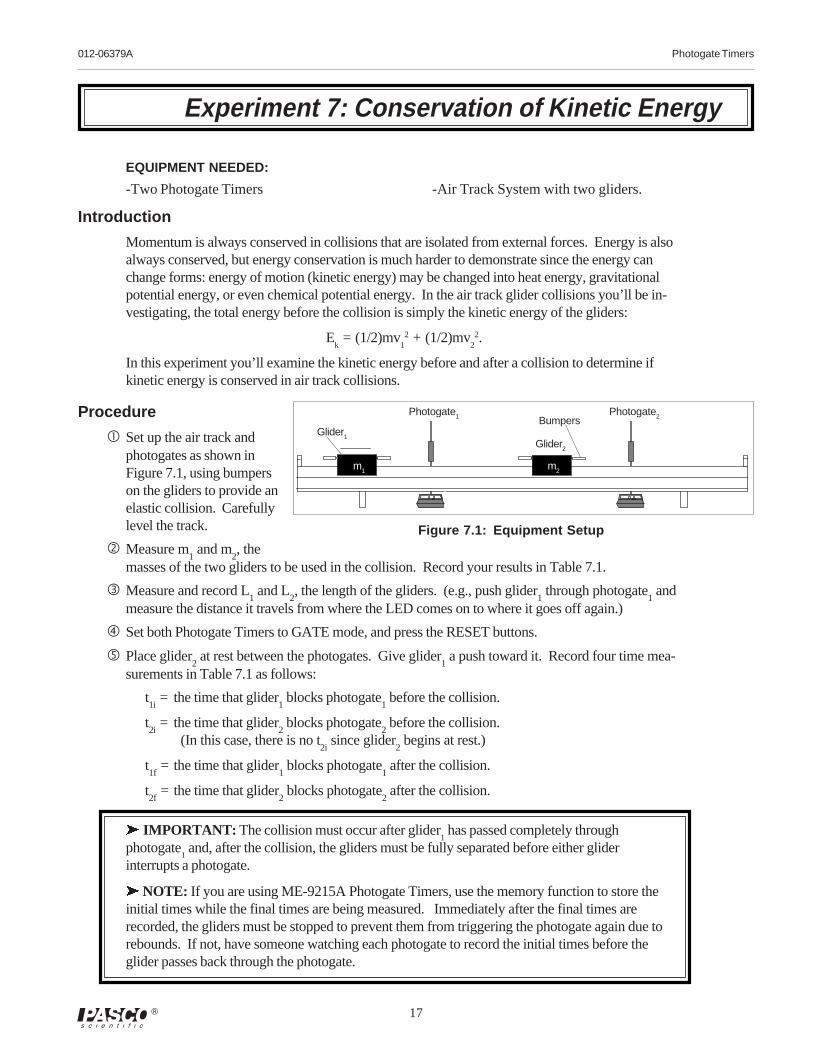
Procedure
� Set up the air track andphotogates as shown inFigure 7.1, using bumperson the gliders to provide anelastic collision. Carefullylevel the track.
� Measure m1 and m
2, the
masses of the two gliders to be used in the collision. Record your results in Table 7.1.
� Measure and record L1 and L
2, the length of the gliders. (e.g., push glider
1 through photogate
1 and
measure the distance it travels from where the LED comes on to where it goes off again.)
� Set both Photogate Timers to GATE mode, and press the RESET buttons.
� Place glider2 at rest between the photogates. Give glider
1 a push toward it. Record four time mea-
surements in Table 7.1 as follows:
t1i = the time that glider
1 blocks photogate
1 before the collision.
t2i = the time that glider
2 blocks photogate
2 before the collision.
(In this case, there is no t2i since glider
2 begins at rest.)
t1f = the time that glider
1 blocks photogate
1 after the collision.
t2f = the time that glider
2 blocks photogate
2 after the collision.
ä IMPORTANT: The collision must occur after glider1 has passed completely through
photogate1 and, after the collision, the gliders must be fully separated before either glider
interrupts a photogate.
ä NOTE: If you are using ME-9215A Photogate Timers, use the memory function to store theinitial times while the final times are being measured. Immediately after the final times arerecorded, the gliders must be stopped to prevent them from triggering the photogate again due torebounds. If not, have someone watching each photogate to record the initial times before theglider passes back through the photogate.
Photogate1
Glider2
Glider1
Photogate2
m2m1
Bumpers
Figure 7.1: Equipment Setup
18
Photogate Timers 012-06379A
®
Table 7.1 Data and Calculations
L1 = L
2 =
m1
m2
t1i
t2i
t1f
t2f
v1i
v2i
v1f
v2f
Eki
Ekf
Questions
� Was kinetic energy conserved in each of your collisions?
� If there were one or more collisions in which kinetic energy was not conserved, wheredid it go?
Optional Equipment
Design and conduct an experiment to investigate conservation of kinetic energy in an inelasticcollision in which the two gliders, instead of bouncing off each other, stick together so thatthey move off with identical final velocities. If you are using a PASCO air track, replace thebumpers with the wax and needle. Otherwise, velcro fasteners can be used with most gliders.
� Repeat the experiment several times, varying the mass of one or both gliders and varying theinitial velocity of glider
1.
� Try collisions in which the initial velocity of glider2 is not zero. You may need to practice a bit
to coordinate the gliders so the collision takes place completely between the photogates.
Data and Calculations
� For each time that you measured, calculate the corresponding glider velocity (e.g., v1, = L
1/t
1i).
� Use your measured values to calculate Eki and E
kf, the combined kinetic energy of the gliders
before and after the collision. Record your results in the table.
012-06379A Photogate Timers
19®
Experiment 8: Conservation of Mechanical Energy
D
L
dh{=
Table 8.1: Data and Calcula-
EQUIPMENT NEEDED:
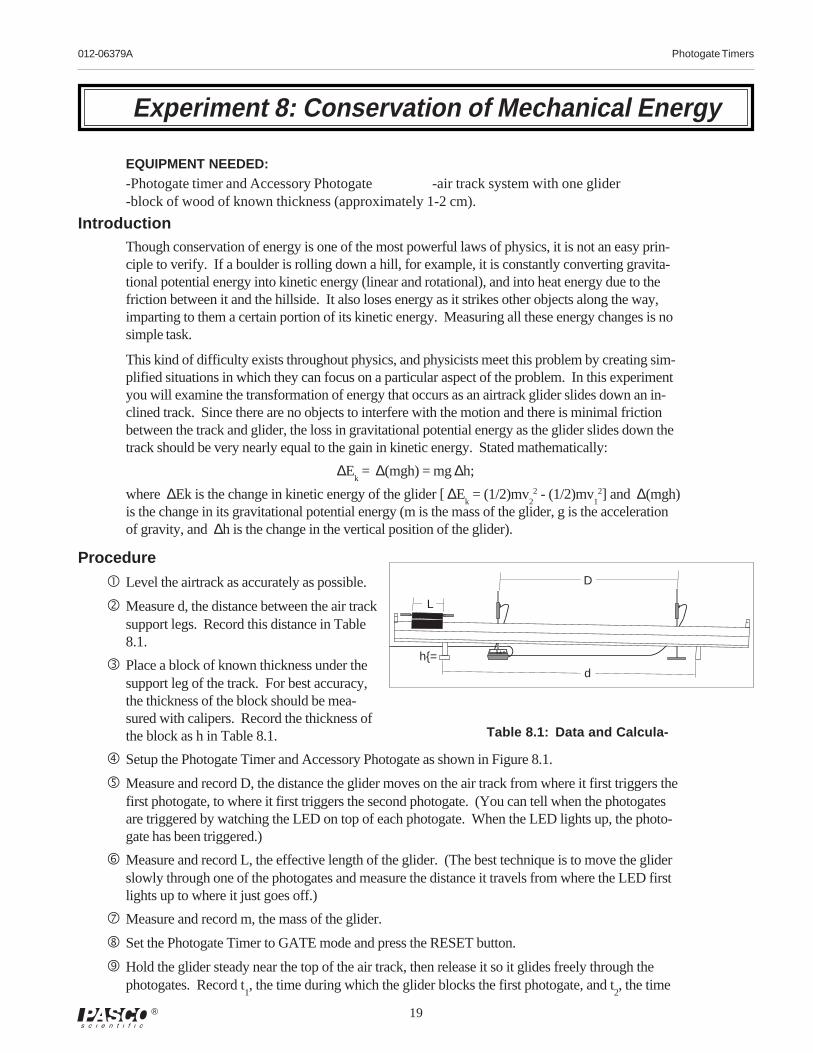
-Photogate timer and Accessory Photogate -air track system with one glider-block of wood of known thickness (approximately 1-2 cm).
IntroductionThough conservation of energy is one of the most powerful laws of physics, it is not an easy prin-ciple to verify. If a boulder is rolling down a hill, for example, it is constantly converting gravita-tional potential energy into kinetic energy (linear and rotational), and into heat energy due to thefriction between it and the hillside. It also loses energy as it strikes other objects along the way,imparting to them a certain portion of its kinetic energy. Measuring all these energy changes is nosimple task.
This kind of difficulty exists throughout physics, and physicists meet this problem by creating sim-plified situations in which they can focus on a particular aspect of the problem. In this experimentyou will examine the transformation of energy that occurs as an airtrack glider slides down an in-clined track. Since there are no objects to interfere with the motion and there is minimal frictionbetween the track and glider, the loss in gravitational potential energy as the glider slides down thetrack should be very nearly equal to the gain in kinetic energy. Stated mathematically:
∆Ek = ∆(mgh) = mg ∆h;
where ∆Ek is the change in kinetic energy of the glider [ ∆Ek = (1/2)mv
22 - (1/2)mv
12] and ∆(mgh)
is the change in its gravitational potential energy (m is the mass of the glider, g is the accelerationof gravity, and ∆h is the change in the vertical position of the glider).
Procedure
� Level the airtrack as accurately as possible.
� Measure d, the distance between the air tracksupport legs. Record this distance in Table8.1.
� Place a block of known thickness under thesupport leg of the track. For best accuracy,the thickness of the block should be mea-sured with calipers. Record the thickness ofthe block as h in Table 8.1.
� Setup the Photogate Timer and Accessory Photogate as shown in Figure 8.1.
� Measure and record D, the distance the glider moves on the air track from where it first triggers thefirst photogate, to where it first triggers the second photogate. (You can tell when the photogatesare triggered by watching the LED on top of each photogate. When the LED lights up, the photo-gate has been triggered.)
� Measure and record L, the effective length of the glider. (The best technique is to move the gliderslowly through one of the photogates and measure the distance it travels from where the LED firstlights up to where it just goes off.)
� Measure and record m, the mass of the glider.
� Set the Photogate Timer to GATE mode and press the RESET button.
� Hold the glider steady near the top of the air track, then release it so it glides freely through thephotogates. Record t
1, the time during which the glider blocks the first photogate, and t
2, the time
20
Photogate Timers 012-06379A
®
during which it blocks the second photogate. (If you have an ME-9215A Photogate Timer,the memory function will make it easier to measure the two times. If not, someone will needto watch the timer during the experiment and quickly record t1 before the glider reaches thesecond photogate.)
� Repeat the measurement several times and record your data in Table 8.1. You needn’t releasethe glider from the same point on the air track for each trial, but it must be gliding freely andsmoothly (minimum wobble) as it passes through the photogates.
11 Change the mass of the glider by adding weights and repeat steps 7 through 10. Do this for atleast five different masses, recording the mass (m) for each set of measurements. (If you havetime, you may also want to try changing the height of the block used to tilt the track or thedistance between the photogates.)
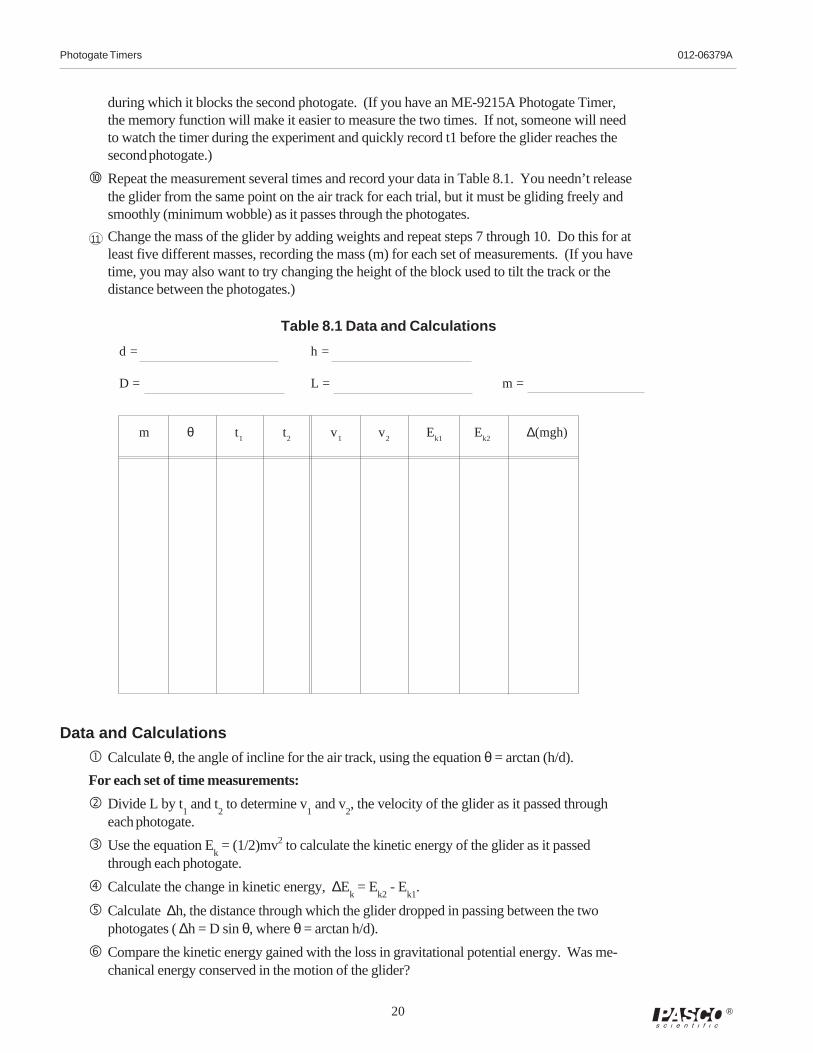
d = h =
D = L = m =
Table 8.1 Data and Calculations
m θ t1
t2
v1
v2
Ek1
Ek2
∆(mgh)
Data and Calculations
� Calculate θ, the angle of incline for the air track, using the equation θ = arctan (h/d).
For each set of time measurements:
� Divide L by t1 and t
2 to determine v
1 and v
2, the velocity of the glider as it passed through
each photogate.
� Use the equation Ek = (1/2)mv2 to calculate the kinetic energy of the glider as it passed
through each photogate.
� Calculate the change in kinetic energy, ∆Ek = E
k2 - E
k1.
� Calculate ∆h, the distance through which the glider dropped in passing between the twophotogates ( ∆h = D sin θ, where θ = arctan h/d).
� Compare the kinetic energy gained with the loss in gravitational potential energy. Was me-chanical energy conserved in the motion of the glider?
012-06379A Photogate Timers
21®
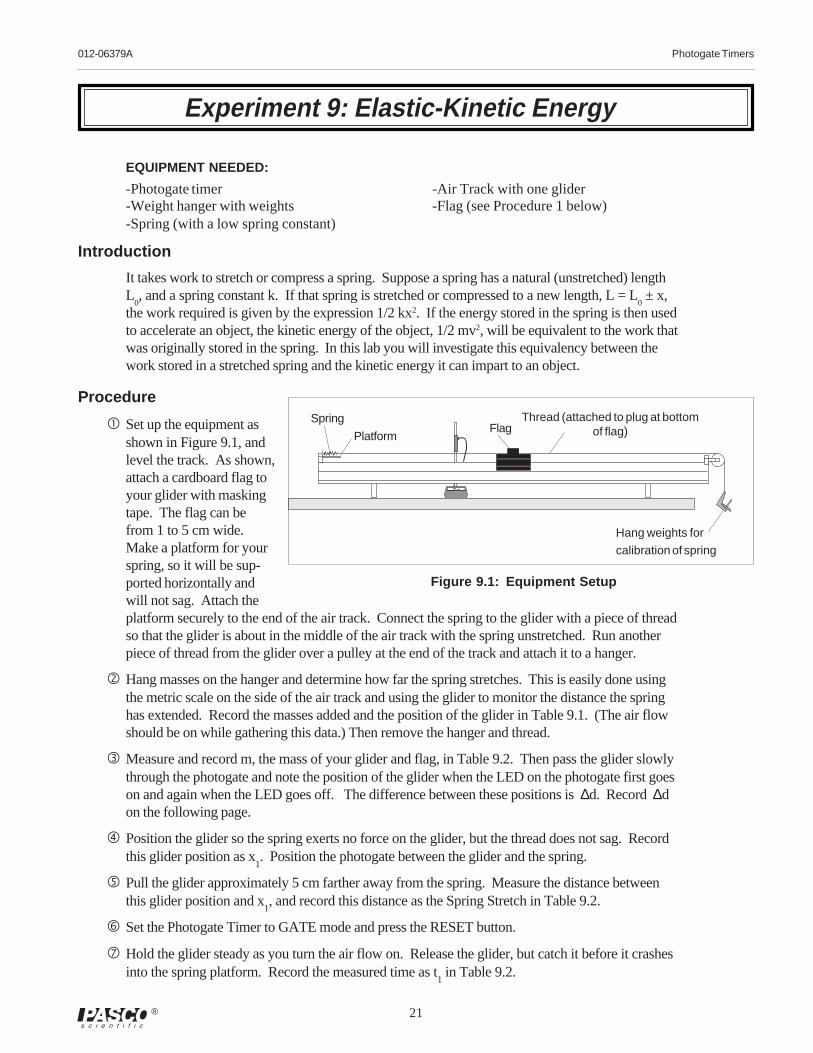
EQUIPMENT NEEDED:
-Photogate timer -Air Track with one glider-Weight hanger with weights -Flag (see Procedure 1 below)-Spring (with a low spring constant)
Introduction
It takes work to stretch or compress a spring. Suppose a spring has a natural (unstretched) lengthL
0, and a spring constant k. If that spring is stretched or compressed to a new length, L = L
0 ± x,
the work required is given by the expression 1/2 kx2. If the energy stored in the spring is then usedto accelerate an object, the kinetic energy of the object, 1/2 mv2, will be equivalent to the work thatwas originally stored in the spring. In this lab you will investigate this equivalency between thework stored in a stretched spring and the kinetic energy it can impart to an object.
Procedure
� Set up the equipment asshown in Figure 9.1, andlevel the track. As shown,attach a cardboard flag toyour glider with maskingtape. The flag can befrom 1 to 5 cm wide.Make a platform for yourspring, so it will be sup-ported horizontally andwill not sag. Attach theplatform securely to the end of the air track. Connect the spring to the glider with a piece of threadso that the glider is about in the middle of the air track with the spring unstretched. Run anotherpiece of thread from the glider over a pulley at the end of the track and attach it to a hanger.
� Hang masses on the hanger and determine how far the spring stretches. This is easily done usingthe metric scale on the side of the air track and using the glider to monitor the distance the springhas extended. Record the masses added and the position of the glider in Table 9.1. (The air flowshould be on while gathering this data.) Then remove the hanger and thread.
� Measure and record m, the mass of your glider and flag, in Table 9.2. Then pass the glider slowlythrough the photogate and note the position of the glider when the LED on the photogate first goeson and again when the LED goes off. The difference between these positions is ∆d. Record ∆don the following page.
� Position the glider so the spring exerts no force on the glider, but the thread does not sag. Recordthis glider position as x
1. Position the photogate between the glider and the spring.
� Pull the glider approximately 5 cm farther away from the spring. Measure the distance betweenthis glider position and x
1, and record this distance as the Spring Stretch in Table 9.2.
� Set the Photogate Timer to GATE mode and press the RESET button.
� Hold the glider steady as you turn the air flow on. Release the glider, but catch it before it crashesinto the spring platform. Record the measured time as t
1 in Table 9.2.
Experiment 9: Elastic-Kinetic Energy
Hang weights for
calibration of spring
FlagSpring
Platform
Thread (attached to plug at bottomof flag)
Figure 9.1: Equipment Setup
22
Photogate Timers 012-06379A
®
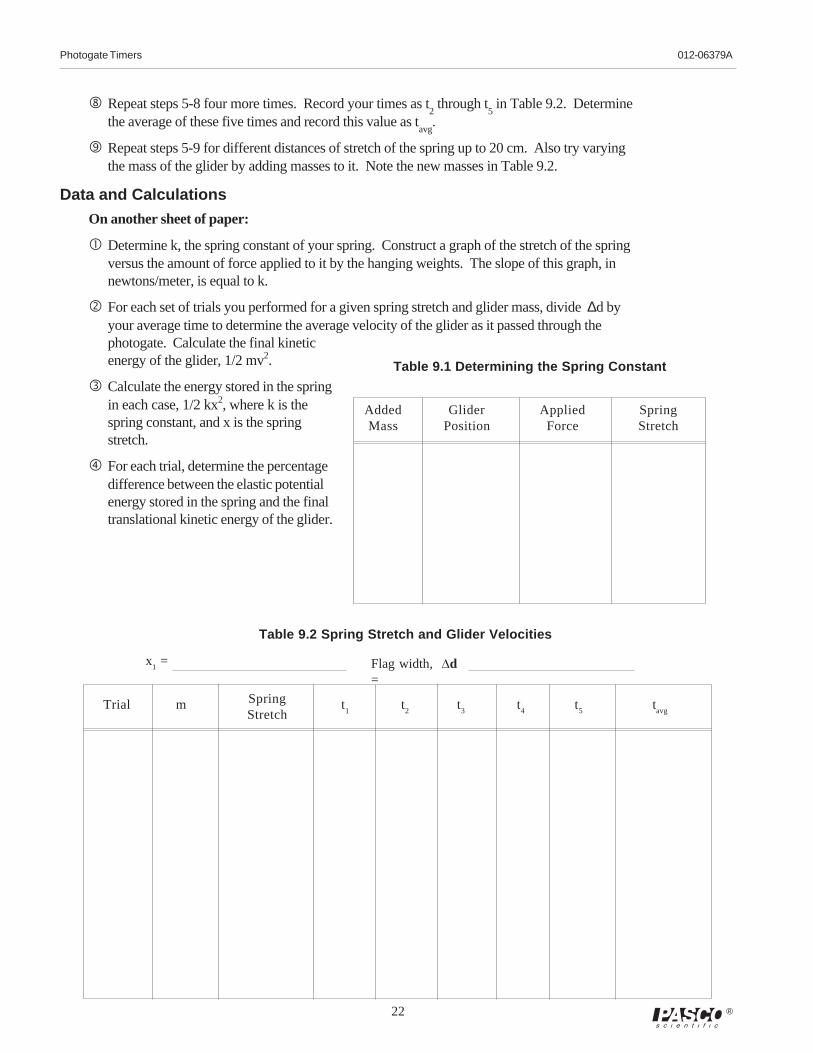
� Repeat steps 5-8 four more times. Record your times as t2 through t
5 in Table 9.2. Determine
the average of these five times and record this value as tavg
.
� Repeat steps 5-9 for different distances of stretch of the spring up to 20 cm. Also try varyingthe mass of the glider by adding masses to it. Note the new masses in Table 9.2.
Data and Calculations
On another sheet of paper:
� Determine k, the spring constant of your spring. Construct a graph of the stretch of the springversus the amount of force applied to it by the hanging weights. The slope of this graph, innewtons/meter, is equal to k.
� For each set of trials you performed for a given spring stretch and glider mass, divide ∆d byyour average time to determine the average velocity of the glider as it passed through thephotogate. Calculate the final kineticenergy of the glider, 1/2 mv2.
� Calculate the energy stored in the springin each case, 1/2 kx2, where k is thespring constant, and x is the springstretch.
� For each trial, determine the percentagedifference between the elastic potentialenergy stored in the spring and the finaltranslational kinetic energy of the glider.
Trial m SpringStretch
t1
t2
t3
t4
t5
tavg
x1 = Flag width, Dd
=
Table 9.2 Spring Stretch and Glider Velocities
Added Glider Applied SpringMass Position Force Stretch
Table 9.1 Determining the Spring Constant
012-06379A Photogate Timers
23®
EQUIPMENT NEEDED:-Photogate timer -Meter stick.-Pendulums of various masses and lengths (the pendulum bob should be no more than 3 cm in diameter)
IntroductionIn this experiment, you will investigate two aspects of pendulum motion.First you will investigate the relationship between pendulum length, pendu-lum mass, and the period of oscillation. Then you will determine whethermechanical energy is conserved as the pendulum swings.
ProcedurePart 1: Period of Oscillation versus Mass and Length
� Measure the mass of the pendulum bob. Record this value as m in Table10.1.
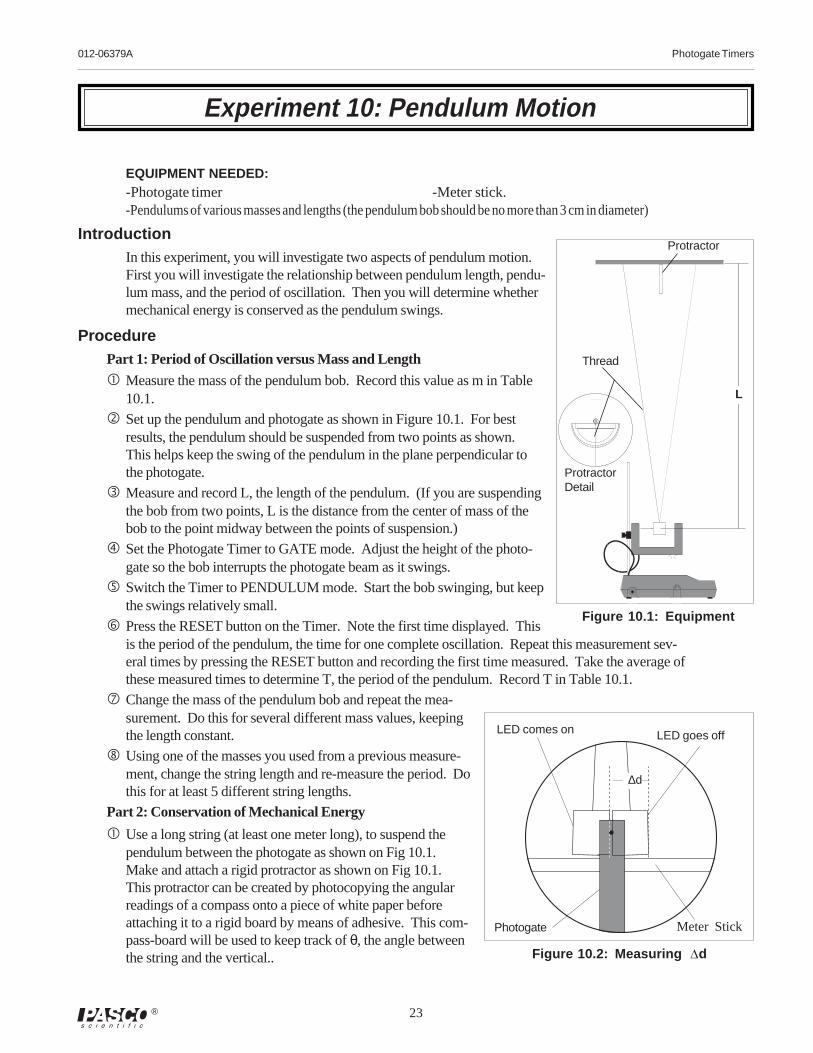
� Set up the pendulum and photogate as shown in Figure 10.1. For bestresults, the pendulum should be suspended from two points as shown.This helps keep the swing of the pendulum in the plane perpendicular tothe photogate.
� Measure and record L, the length of the pendulum. (If you are suspendingthe bob from two points, L is the distance from the center of mass of thebob to the point midway between the points of suspension.)
� Set the Photogate Timer to GATE mode. Adjust the height of the photo-gate so the bob interrupts the photogate beam as it swings.
� Switch the Timer to PENDULUM mode. Start the bob swinging, but keepthe swings relatively small.
� Press the RESET button on the Timer. Note the first time displayed. Thisis the period of the pendulum, the time for one complete oscillation. Repeat this measurement sev-eral times by pressing the RESET button and recording the first time measured. Take the average ofthese measured times to determine T, the period of the pendulum. Record T in Table 10.1.
� Change the mass of the pendulum bob and repeat the mea-surement. Do this for several different mass values, keepingthe length constant.
� Using one of the masses you used from a previous measure-ment, change the string length and re-measure the period. Dothis for at least 5 different string lengths.
Part 2: Conservation of Mechanical Energy
� Use a long string (at least one meter long), to suspend thependulum between the photogate as shown on Fig 10.1.Make and attach a rigid protractor as shown on Fig 10.1.This protractor can be created by photocopying the angularreadings of a compass onto a piece of white paper beforeattaching it to a rigid board by means of adhesive. This com-pass-board will be used to keep track of θ, the angle betweenthe string and the vertical..
LED comes on
Photogate
LED goes off
Meter Stick
Experiment 10: Pendulum Motion
Figure 10.2: Measuring Dd
∆d
L
Protractor
ProtractorDetail
Thread
Figure 10.1: Equipment
24
Photogate Timers 012-06379A
®
� Now adjust the position of the photogate as accurately as you can so that the photogate beamstrikes the center of the pendulum bob.
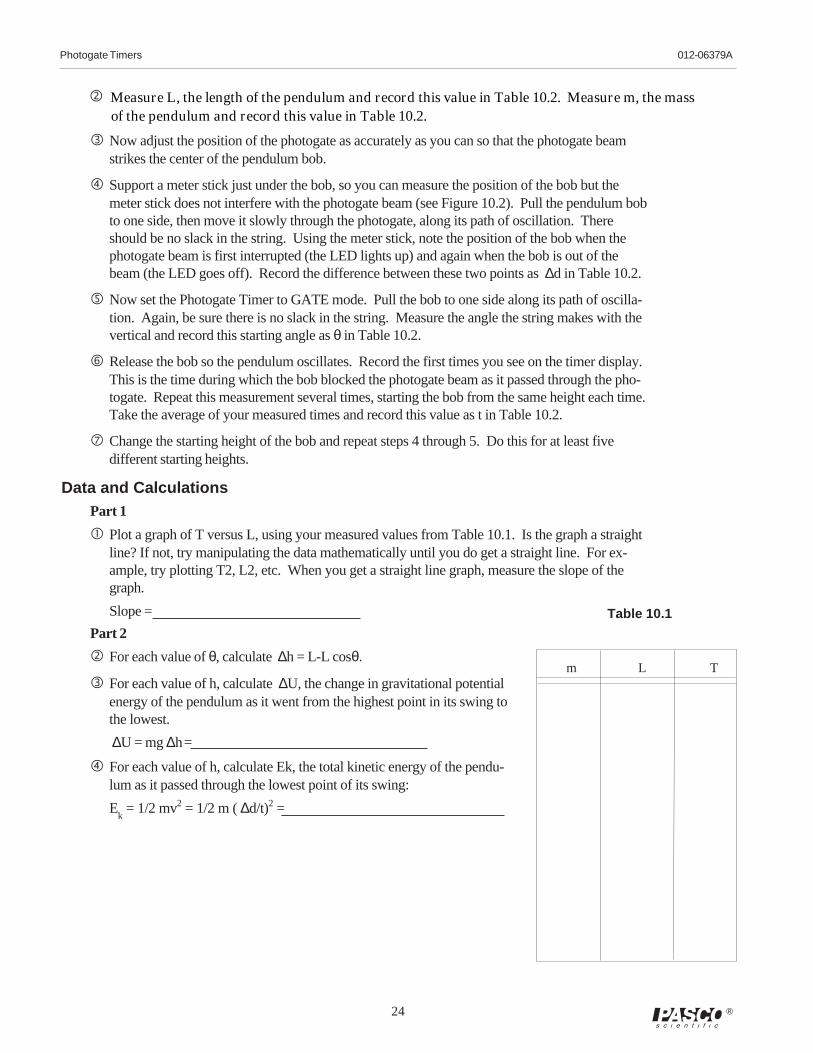
� Support a meter stick just under the bob, so you can measure the position of the bob but themeter stick does not interfere with the photogate beam (see Figure 10.2). Pull the pendulum bobto one side, then move it slowly through the photogate, along its path of oscillation. Thereshould be no slack in the string. Using the meter stick, note the position of the bob when thephotogate beam is first interrupted (the LED lights up) and again when the bob is out of thebeam (the LED goes off). Record the difference between these two points as ∆d in Table 10.2.
� Now set the Photogate Timer to GATE mode. Pull the bob to one side along its path of oscilla-tion. Again, be sure there is no slack in the string. Measure the angle the string makes with thevertical and record this starting angle as θ in Table 10.2.
� Release the bob so the pendulum oscillates. Record the first times you see on the timer display.This is the time during which the bob blocked the photogate beam as it passed through the pho-togate. Repeat this measurement several times, starting the bob from the same height each time.Take the average of your measured times and record this value as t in Table 10.2.
� Change the starting height of the bob and repeat steps 4 through 5. Do this for at least fivedifferent starting heights.
Data and CalculationsPart 1
� Plot a graph of T versus L, using your measured values from Table 10.1. Is the graph a straightline? If not, try manipulating the data mathematically until you do get a straight line. For ex-ample, try plotting T2, L2, etc. When you get a straight line graph, measure the slope of thegraph.
Slope =
Part 2
� For each value of θ, calculate ∆h = L-L cosθ.
� For each value of h, calculate ∆U, the change in gravitational potentialenergy of the pendulum as it went from the highest point in its swing tothe lowest.
∆U = mg ∆h=
� For each value of h, calculate Ek, the total kinetic energy of the pendu-lum as it passed through the lowest point of its swing:
Ek = 1/2 mv2 = 1/2 m ( ∆d/t)2 =
Table 10.1
m L T
� Measure L, the length of the pendulum and record this value in Table 10.2. Measure m, the massof the pendulum and record this value in Table 10.2.
012-06379A Photogate Timers
25®
Questions
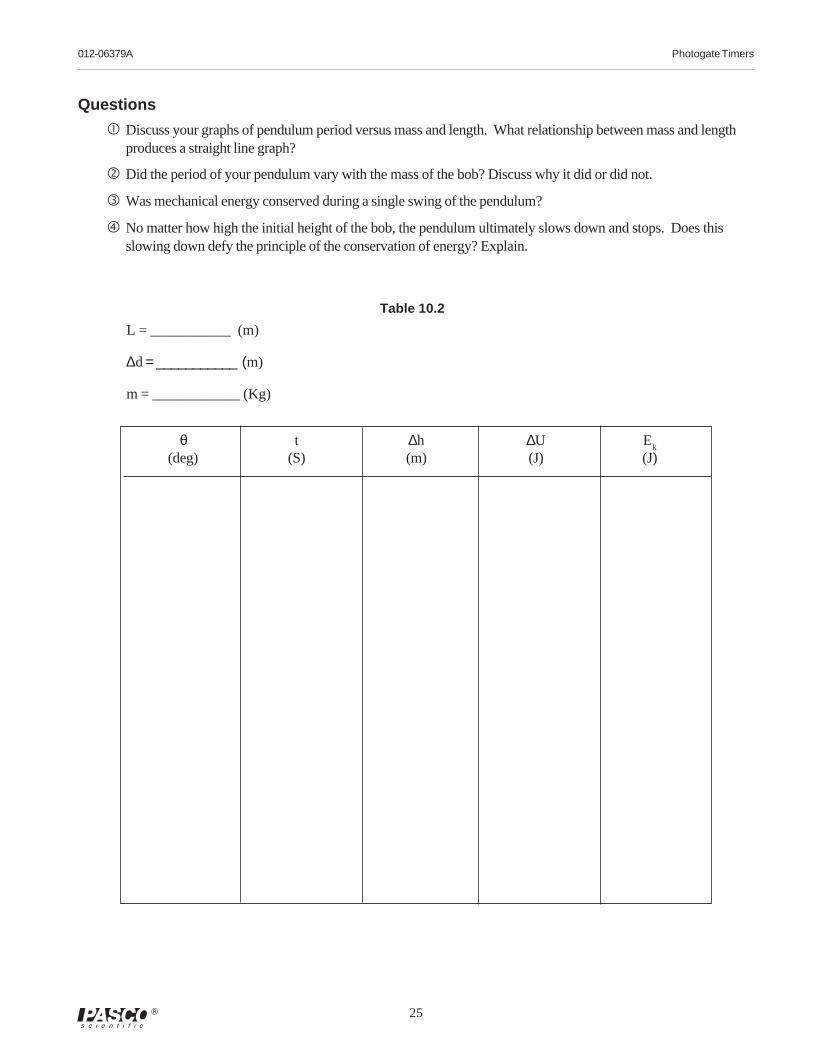
� Discuss your graphs of pendulum period versus mass and length. What relationship between mass and lengthproduces a straight line graph?
� Did the period of your pendulum vary with the mass of the bob? Discuss why it did or did not.
� Was mechanical energy conserved during a single swing of the pendulum?
� No matter how high the initial height of the bob, the pendulum ultimately slows down and stops. Does thisslowing down defy the principle of the conservation of energy? Explain.
θ t ∆h ∆U Ek
(deg) (S) (m) (J) (J)
Table 10.2
L = ___________ (m)
∆d = ___________ (m)
m = ____________ (Kg)
26
Photogate Timers 012-06379A
®
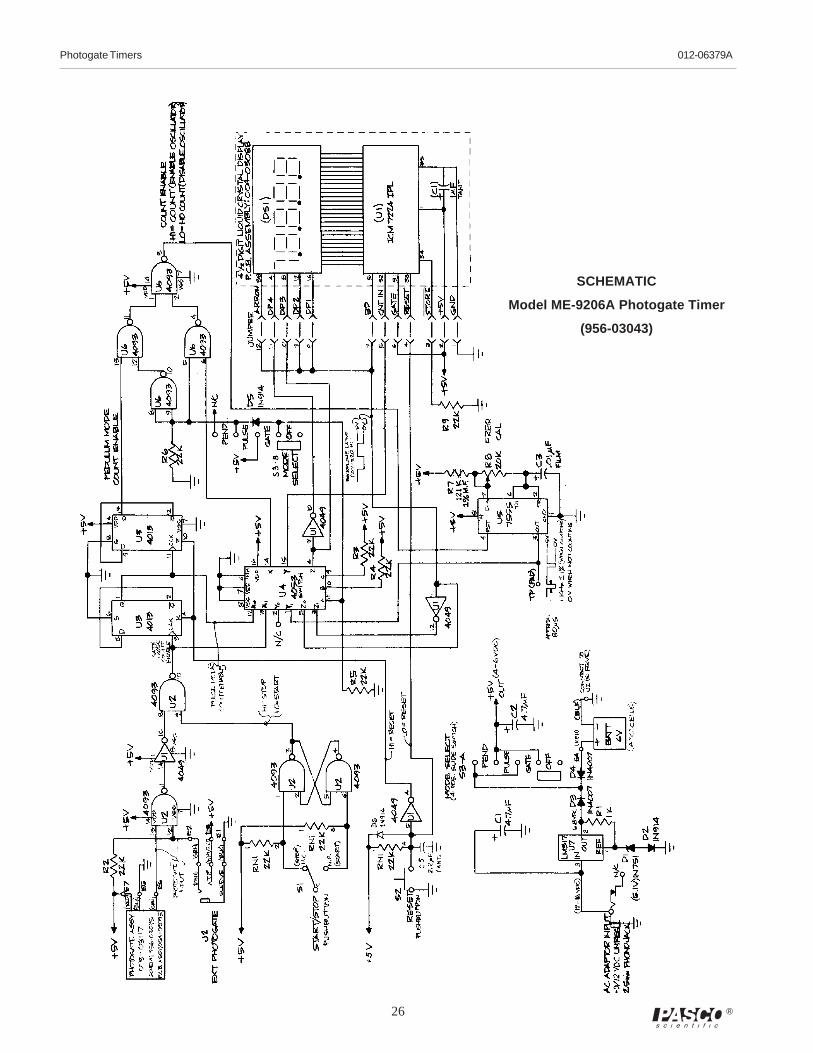
SCHEMATIC
Model ME-9206A Photogate Timer
(956-03043)
012-06379A Photogate Timers
27®
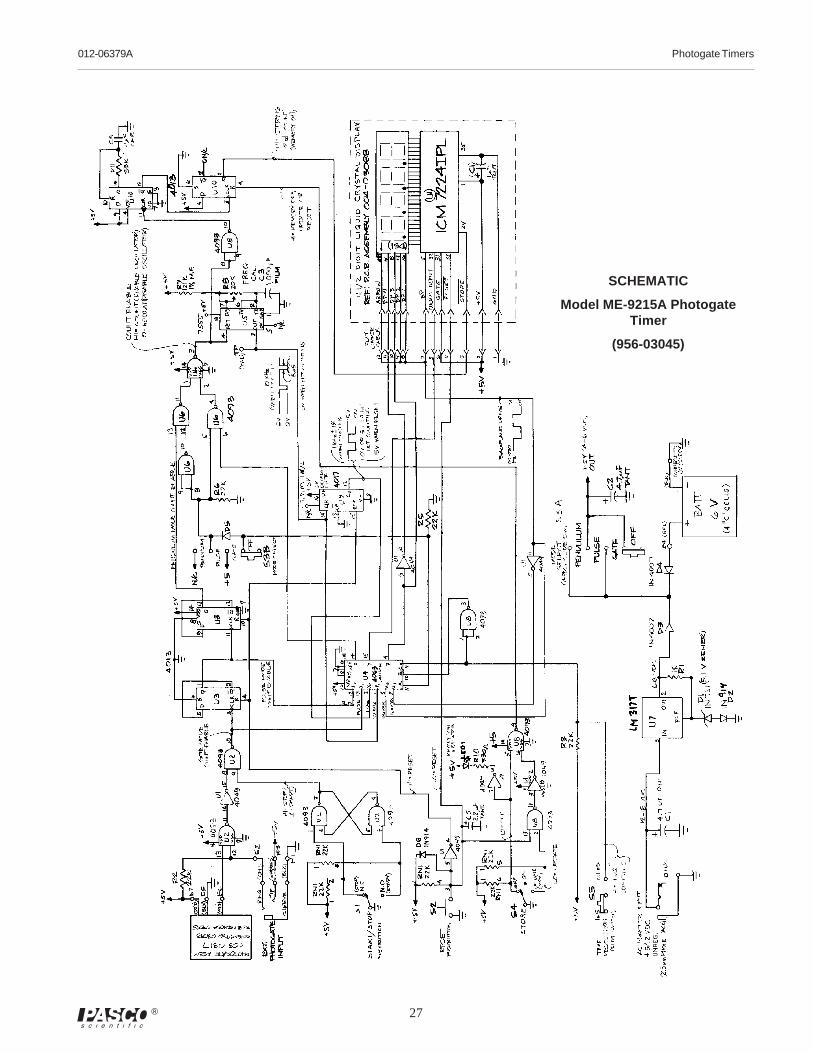
SCHEMATIC
Model ME-9215A PhotogateTimer
(956-03045)
28
Photogate Timers 012-06379A
®
Teachers Guide
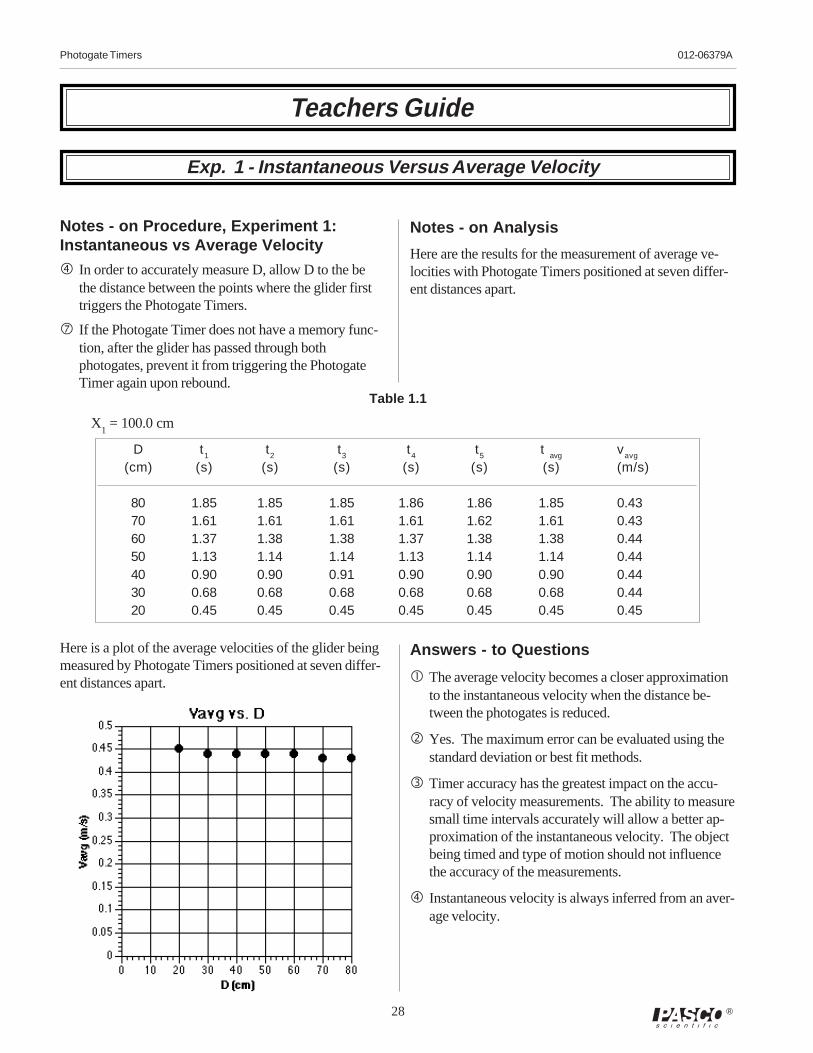
Notes - on Procedure, Experiment 1:Instantaneous vs Average Velocity
� In order to accurately measure D, allow D to the bethe distance between the points where the glider firsttriggers the Photogate Timers.
� If the Photogate Timer does not have a memory func-tion, after the glider has passed through bothphotogates, prevent it from triggering the PhotogateTimer again upon rebound.
Notes - on Analysis
Here are the results for the measurement of average ve-locities with Photogate Timers positioned at seven differ-ent distances apart.
Here is a plot of the average velocities of the glider beingmeasured by Photogate Timers positioned at seven differ-ent distances apart.
Answers - to Questions
� The average velocity becomes a closer approximationto the instantaneous velocity when the distance be-tween the photogates is reduced.
� Yes. The maximum error can be evaluated using thestandard deviation or best fit methods.
� Timer accuracy has the greatest impact on the accu-racy of velocity measurements. The ability to measuresmall time intervals accurately will allow a better ap-proximation of the instantaneous velocity. The objectbeing timed and type of motion should not influencethe accuracy of the measurements.
� Instantaneous velocity is always inferred from an aver-age velocity.
D t1
t2
t3
t4
t5
t avg
vavg
(cm) (s) (s) (s) (s) (s) (s) (m/s)
80 1.85 1.85 1.85 1.86 1.86 1.85 0.4370 1.61 1.61 1.61 1.61 1.62 1.61 0.4360 1.37 1.38 1.38 1.37 1.38 1.38 0.4450 1.13 1.14 1.14 1.13 1.14 1.14 0.4440 0.90 0.90 0.91 0.90 0.90 0.90 0.4430 0.68 0.68 0.68 0.68 0.68 0.68 0.4420 0.45 0.45 0.45 0.45 0.45 0.45 0.45
Exp. 1 - Instantaneous Versus Average Velocity
Table 1.1
X1 = 100.0 cm
012-06379A Photogate Timers
29®
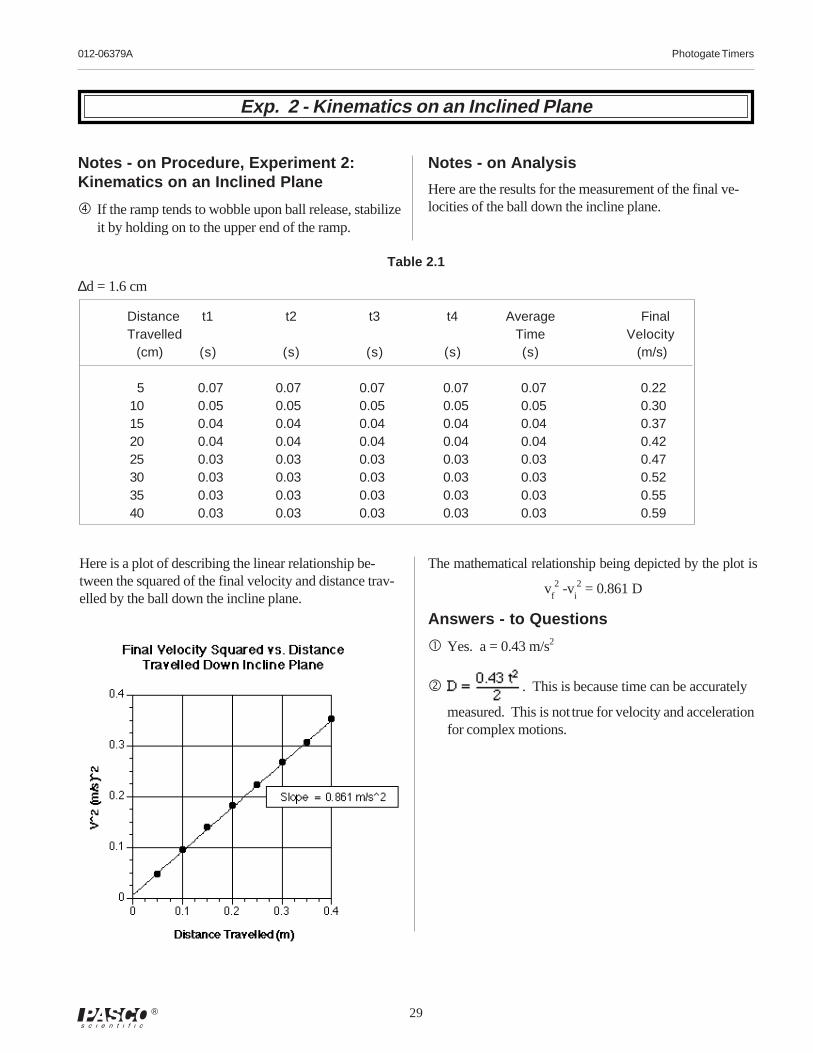
Notes - on Procedure, Experiment 2:Kinematics on an Inclined Plane
� If the ramp tends to wobble upon ball release, stabilizeit by holding on to the upper end of the ramp.
Notes - on Analysis
Here are the results for the measurement of the final ve-locities of the ball down the incline plane.
Table 2.1
∆d = 1.6 cm
Here is a plot of describing the linear relationship be-tween the squared of the final velocity and distance trav-elled by the ball down the incline plane.
The mathematical relationship being depicted by the plot is
vf2 -v
i2 = 0.861 D
Answers - to Questions
� Yes. a = 0.43 m/s2
� . This is because time can be accurately
measured. This is not true for velocity and accelerationfor complex motions.
Distance t1 t2 t3 t4 Average FinalTravelled Time Velocity (cm) (s) (s) (s) (s) (s) (m/s)
5 0.07 0.07 0.07 0.07 0.07 0.2210 0.05 0.05 0.05 0.05 0.05 0.3015 0.04 0.04 0.04 0.04 0.04 0.3720 0.04 0.04 0.04 0.04 0.04 0.4225 0.03 0.03 0.03 0.03 0.03 0.4730 0.03 0.03 0.03 0.03 0.03 0.5235 0.03 0.03 0.03 0.03 0.03 0.5540 0.03 0.03 0.03 0.03 0.03 0.59
Exp. 2 - Kinematics on an Inclined Plane
30
Photogate Timers 012-06379A
®
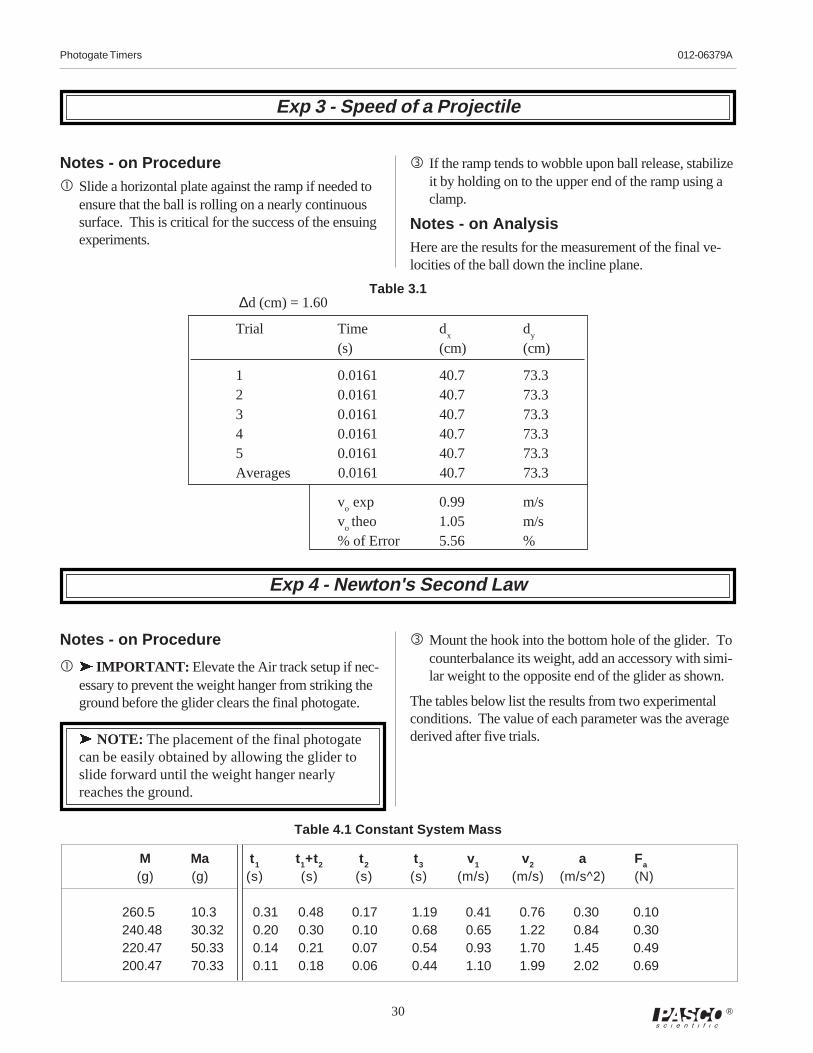
Notes - on Procedure� Slide a horizontal plate against the ramp if needed to
ensure that the ball is rolling on a nearly continuoussurface. This is critical for the success of the ensuingexperiments.
� If the ramp tends to wobble upon ball release, stabilizeit by holding on to the upper end of the ramp using aclamp.
Notes - on AnalysisHere are the results for the measurement of the final ve-locities of the ball down the incline plane.
Notes - on Procedure
� ä IMPORTANT: Elevate the Air track setup if nec-essary to prevent the weight hanger from striking theground before the glider clears the final photogate.
ä NOTE: The placement of the final photogatecan be easily obtained by allowing the glider toslide forward until the weight hanger nearlyreaches the ground.
� Mount the hook into the bottom hole of the glider. Tocounterbalance its weight, add an accessory with simi-lar weight to the opposite end of the glider as shown.
The tables below list the results from two experimentalconditions. The value of each parameter was the averagederived after five trials.
∆d (cm) = 1.60
Trial Time dx
dy
(s) (cm) (cm)
1 0.0161 40.7 73.32 0.0161 40.7 73.33 0.0161 40.7 73.34 0.0161 40.7 73.35 0.0161 40.7 73.3Averages 0.0161 40.7 73.3
vo exp 0.99 m/s
vo theo 1.05 m/s
% of Error 5.56 %
Exp 3 - Speed of a Projectile
M Ma t 1 t1+t2 t 2 t 3 v1 v2 a Fa
(g) (g) (s) (s) (s) (s) (m/s) (m/s) (m/s^2) (N)
260.5 10.3 0.31 0.48 0.17 1.19 0.41 0.76 0.30 0.10240.48 30.32 0.20 0.30 0.10 0.68 0.65 1.22 0.84 0.30220.47 50.33 0.14 0.21 0.07 0.54 0.93 1.70 1.45 0.49200.47 70.33 0.11 0.18 0.06 0.44 1.10 1.99 2.02 0.69
Table 4.1 Constant System Mass
Exp 4 - Newton's Second Law
Table 3.1
012-06379A Photogate Timers
31®
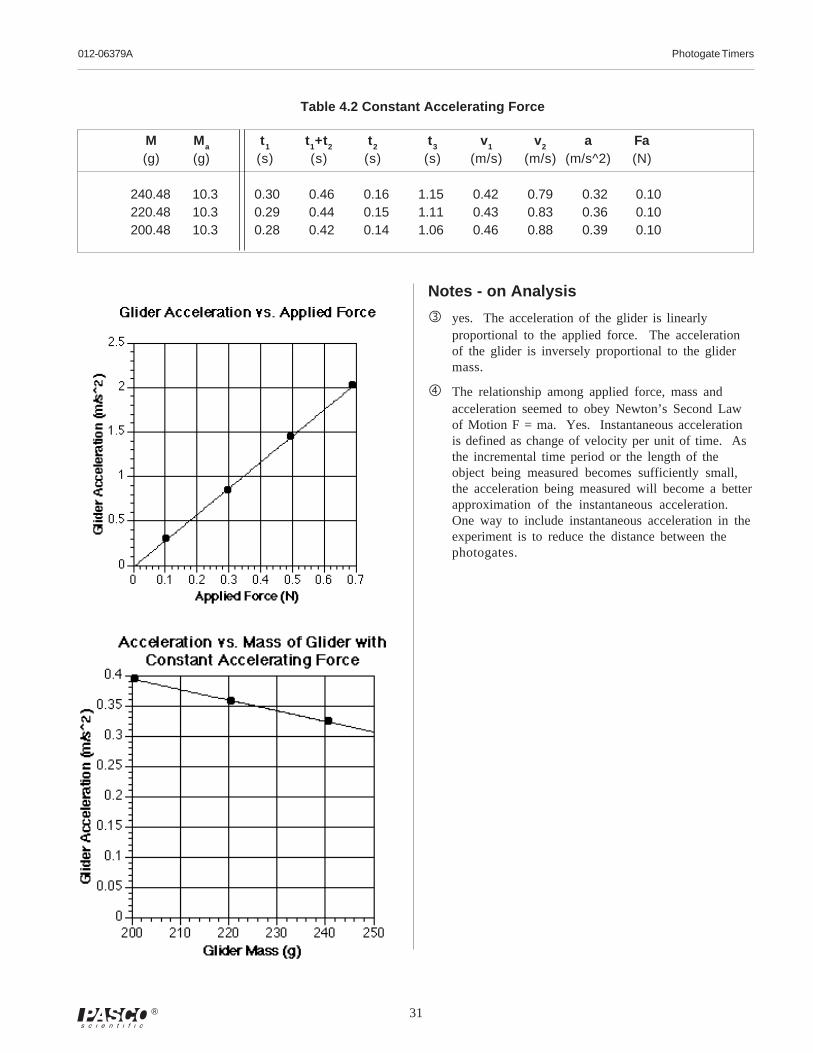
Table 4.2 Constant Accelerating Force
Notes - on Analysis
� yes. The acceleration of the glider is linearlyproportional to the applied force. The accelerationof the glider is inversely proportional to the glidermass.
� The relationship among applied force, mass andacceleration seemed to obey Newton’s Second Lawof Motion F = ma. Yes. Instantaneous accelerationis defined as change of velocity per unit of time. Asthe incremental time period or the length of theobject being measured becomes sufficiently small,the acceleration being measured will become a betterapproximation of the instantaneous acceleration.One way to include instantaneous acceleration in theexperiment is to reduce the distance between thephotogates.
M Ma t 1 t1+t2 t 2 t 3 v1 v2 a Fa(g) (g) (s) (s) (s) (s) (m/s) (m/s) (m/s^2) (N)
240.48 10.3 0.30 0.46 0.16 1.15 0.42 0.79 0.32 0.10220.48 10.3 0.29 0.44 0.15 1.11 0.43 0.83 0.36 0.10200.48 10.3 0.28 0.42 0.14 1.06 0.46 0.88 0.39 0.10
32
Photogate Timers 012-06379A
®
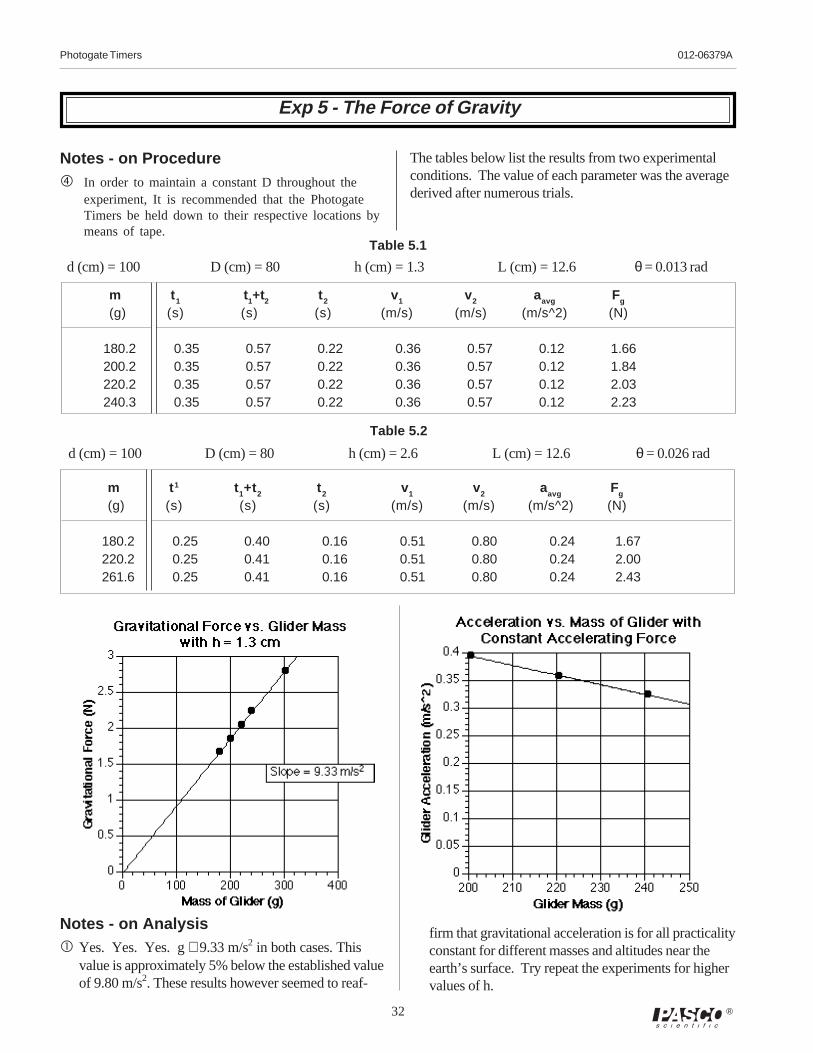
Notes - on Procedure� In order to maintain a constant D throughout the
experiment, It is recommended that the PhotogateTimers be held down to their respective locations bymeans of tape.
The tables below list the results from two experimentalconditions. The value of each parameter was the averagederived after numerous trials.
Table 5.1
d (cm) = 100 D (cm) = 80 h (cm) = 1.3 L (cm) = 12.6 θ = 0.013 rad
m t 1 t1+t2 t 2 v1 v2 aavg Fg
(g) (s) (s) (s) (m/s) (m/s) (m/s^2) (N)
180.2 0.35 0.57 0.22 0.36 0.57 0.12 1.66200.2 0.35 0.57 0.22 0.36 0.57 0.12 1.84220.2 0.35 0.57 0.22 0.36 0.57 0.12 2.03240.3 0.35 0.57 0.22 0.36 0.57 0.12 2.23
Table 5.2
d (cm) = 100 D (cm) = 80 h (cm) = 2.6 L (cm) = 12.6 θ = 0.026 rad
m t 1 t1+t2 t 2 v1 v2 aavg Fg
(g) (s) (s) (s) (m/s) (m/s) (m/s^2) (N)
180.2 0.25 0.40 0.16 0.51 0.80 0.24 1.67220.2 0.25 0.41 0.16 0.51 0.80 0.24 2.00261.6 0.25 0.41 0.16 0.51 0.80 0.24 2.43
Exp 5 - The Force of Gravity
Notes - on Analysis� Yes. Yes. Yes. g ≅ 9.33 m/s2 in both cases. This
value is approximately 5% below the established valueof 9.80 m/s2. These results however seemed to reaf-
firm that gravitational acceleration is for all practicalityconstant for different masses and altitudes near theearth’s surface. Try repeat the experiments for highervalues of h.
012-06379A Photogate Timers
33®
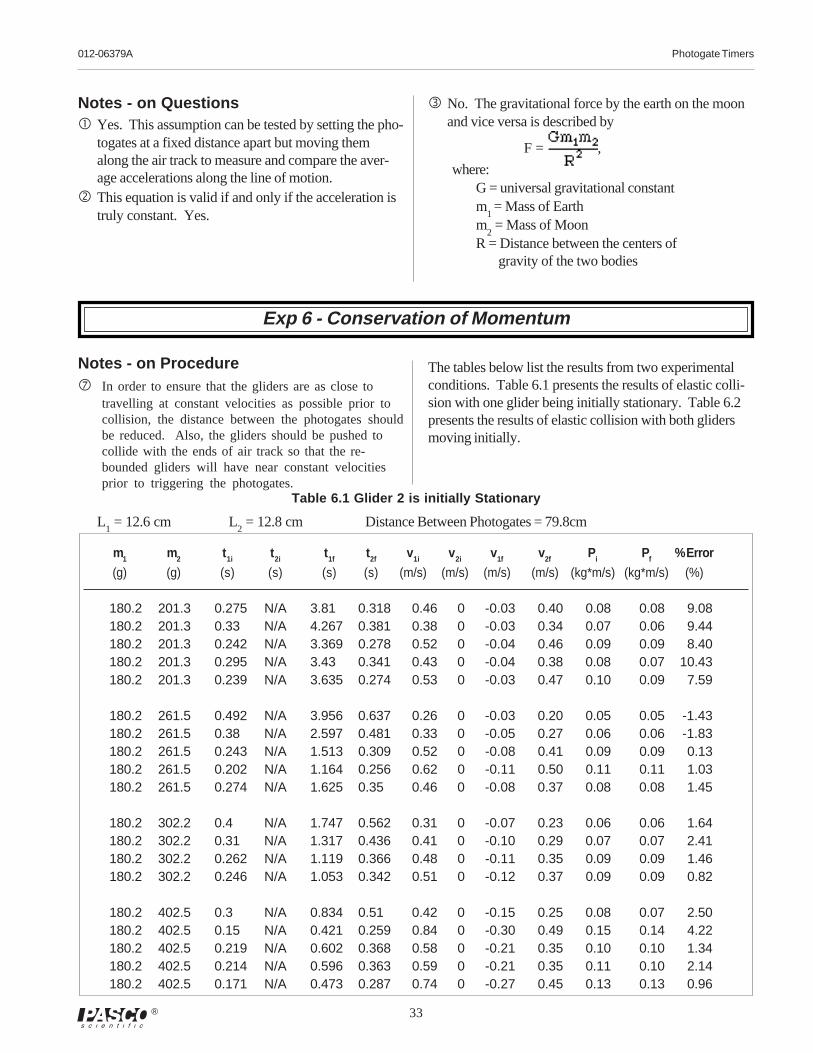
Notes - on Procedure� In order to ensure that the gliders are as close to
travelling at constant velocities as possible prior tocollision, the distance between the photogates shouldbe reduced. Also, the gliders should be pushed tocollide with the ends of air track so that the re-bounded gliders will have near constant velocitiesprior to triggering the photogates.
The tables below list the results from two experimentalconditions. Table 6.1 presents the results of elastic colli-sion with one glider being initially stationary. Table 6.2presents the results of elastic collision with both glidersmoving initially.
Notes - on Questions� Yes. This assumption can be tested by setting the pho-
togates at a fixed distance apart but moving themalong the air track to measure and compare the aver-age accelerations along the line of motion.
� This equation is valid if and only if the acceleration istruly constant. Yes.
� No. The gravitational force by the earth on the moonand vice versa is described by
F = ,
where:G = universal gravitational constantm
1 = Mass of Earth
m2 = Mass of Moon
R = Distance between the centers of gravity of the two bodies
Exp 6 - Conservation of Momentum
Table 6.1 Glider 2 is initially Stationary
L1 = 12.6 cm L
2 = 12.8 cm Distance Between Photogates = 79.8cm
m1 m2 t1i t 2i t1f t2f v1i v2i v1f v2f Pi Pf % Error
(g) (g) (s) (s) (s) (s) (m/s) (m/s) (m/s) (m/s) (kg*m/s) (kg*m/s) (%)
180.2 201.3 0.275 N/A 3.81 0.318 0.46 0 -0.03 0.40 0.08 0.08 9.08180.2 201.3 0.33 N/A 4.267 0.381 0.38 0 -0.03 0.34 0.07 0.06 9.44180.2 201.3 0.242 N/A 3.369 0.278 0.52 0 -0.04 0.46 0.09 0.09 8.40180.2 201.3 0.295 N/A 3.43 0.341 0.43 0 -0.04 0.38 0.08 0.07 10.43180.2 201.3 0.239 N/A 3.635 0.274 0.53 0 -0.03 0.47 0.10 0.09 7.59
180.2 261.5 0.492 N/A 3.956 0.637 0.26 0 -0.03 0.20 0.05 0.05 -1.43180.2 261.5 0.38 N/A 2.597 0.481 0.33 0 -0.05 0.27 0.06 0.06 -1.83180.2 261.5 0.243 N/A 1.513 0.309 0.52 0 -0.08 0.41 0.09 0.09 0.13180.2 261.5 0.202 N/A 1.164 0.256 0.62 0 -0.11 0.50 0.11 0.11 1.03180.2 261.5 0.274 N/A 1.625 0.35 0.46 0 -0.08 0.37 0.08 0.08 1.45
180.2 302.2 0.4 N/A 1.747 0.562 0.31 0 -0.07 0.23 0.06 0.06 1.64180.2 302.2 0.31 N/A 1.317 0.436 0.41 0 -0.10 0.29 0.07 0.07 2.41180.2 302.2 0.262 N/A 1.119 0.366 0.48 0 -0.11 0.35 0.09 0.09 1.46180.2 302.2 0.246 N/A 1.053 0.342 0.51 0 -0.12 0.37 0.09 0.09 0.82
180.2 402.5 0.3 N/A 0.834 0.51 0.42 0 -0.15 0.25 0.08 0.07 2.50180.2 402.5 0.15 N/A 0.421 0.259 0.84 0 -0.30 0.49 0.15 0.14 4.22180.2 402.5 0.219 N/A 0.602 0.368 0.58 0 -0.21 0.35 0.10 0.10 1.34180.2 402.5 0.214 N/A 0.596 0.363 0.59 0 -0.21 0.35 0.11 0.10 2.14180.2 402.5 0.171 N/A 0.473 0.287 0.74 0 -0.27 0.45 0.13 0.13 0.96
34
Photogate Timers 012-06379A
®
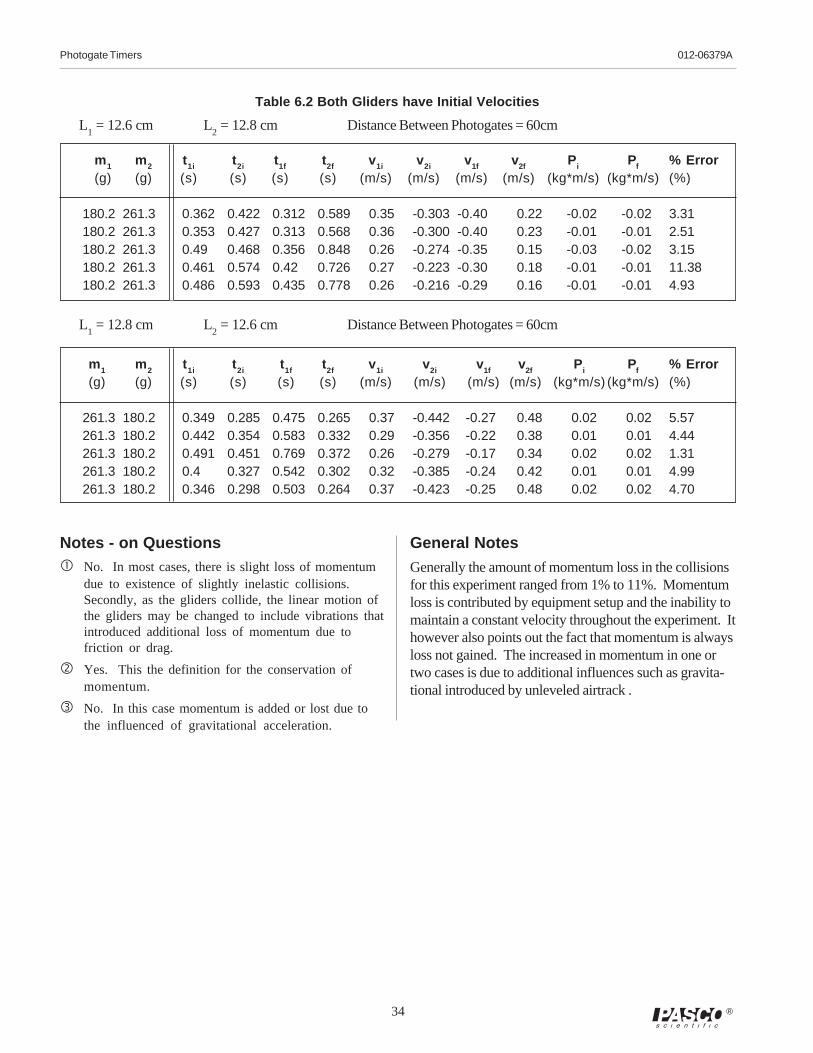
Table 6.2 Both Gliders have Initial Velocities
L1 = 12.6 cm L
2 = 12.8 cm Distance Between Photogates = 60cm
Notes - on Questions� No. In most cases, there is slight loss of momentum
due to existence of slightly inelastic collisions.Secondly, as the gliders collide, the linear motion ofthe gliders may be changed to include vibrations thatintroduced additional loss of momentum due tofriction or drag.
� Yes. This the definition for the conservation ofmomentum.
� No. In this case momentum is added or lost due tothe influenced of gravitational acceleration.
L1 = 12.8 cm L
2 = 12.6 cm Distance Between Photogates = 60cm
General Notes
Generally the amount of momentum loss in the collisionsfor this experiment ranged from 1% to 11%. Momentumloss is contributed by equipment setup and the inability tomaintain a constant velocity throughout the experiment. Ithowever also points out the fact that momentum is alwaysloss not gained. The increased in momentum in one ortwo cases is due to additional influences such as gravita-tional introduced by unleveled airtrack .
m 1 m 2 t1i t 2i t1f t2f v1i v2i v1f v2f Pi Pf % Error(g) (g) (s) (s) (s) (s) (m/s) (m/s) (m/s) (m/s) (kg*m/s) (kg*m/s) (%)
180.2 261.3 0.362 0.422 0.312 0.589 0.35 -0.303 -0.40 0.22 -0.02 -0.02 3.31180.2 261.3 0.353 0.427 0.313 0.568 0.36 -0.300 -0.40 0.23 -0.01 -0.01 2.51180.2 261.3 0.49 0.468 0.356 0.848 0.26 -0.274 -0.35 0.15 -0.03 -0.02 3.15180.2 261.3 0.461 0.574 0.42 0.726 0.27 -0.223 -0.30 0.18 -0.01 -0.01 11.38180.2 261.3 0.486 0.593 0.435 0.778 0.26 -0.216 -0.29 0.16 -0.01 -0.01 4.93
m1 m 2 t1i t 2i t 1f t2f v1i v2i v1f v2f Pi Pf % Error(g) (g) (s) (s) (s) (s) (m/s) (m/s) (m/s) (m/s) (kg*m/s) (kg*m/s) (%)
261.3 180.2 0.349 0.285 0.475 0.265 0.37 -0.442 -0.27 0.48 0.02 0.02 5.57261.3 180.2 0.442 0.354 0.583 0.332 0.29 -0.356 -0.22 0.38 0.01 0.01 4.44261.3 180.2 0.491 0.451 0.769 0.372 0.26 -0.279 -0.17 0.34 0.02 0.02 1.31261.3 180.2 0.4 0.327 0.542 0.302 0.32 -0.385 -0.24 0.42 0.01 0.01 4.99261.3 180.2 0.346 0.298 0.503 0.264 0.37 -0.423 -0.25 0.48 0.02 0.02 4.70
012-06379A Photogate Timers
35®
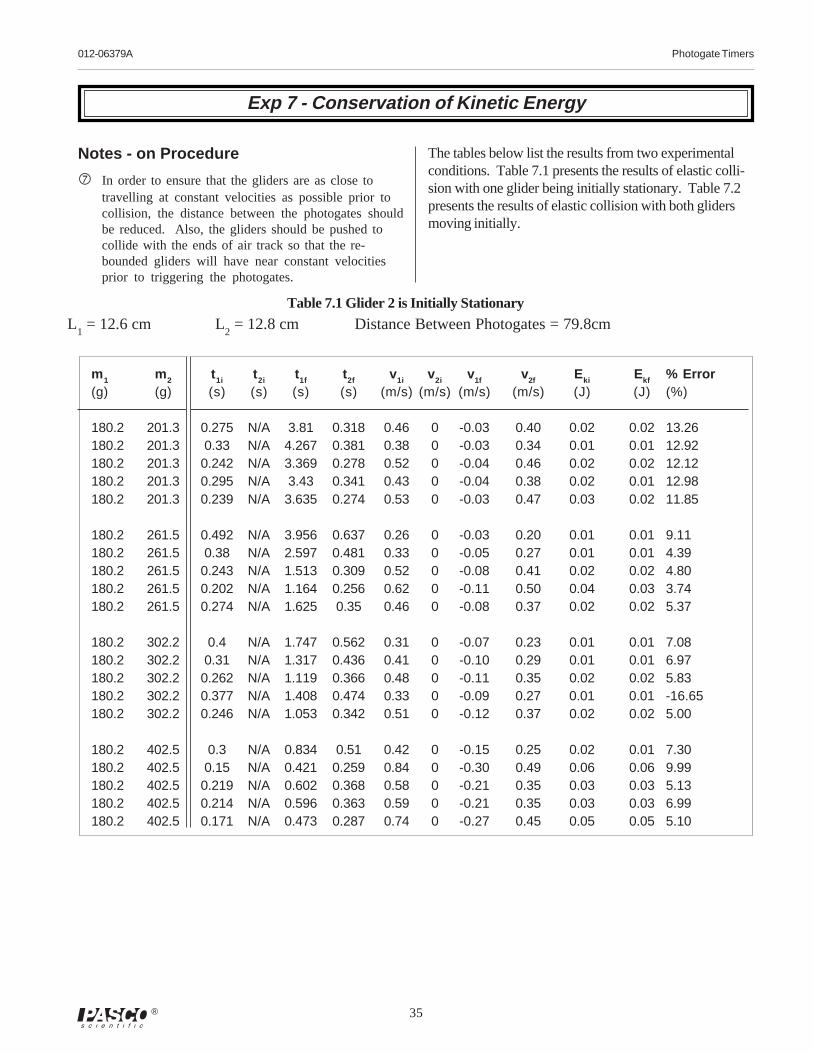
Notes - on Procedure
� In order to ensure that the gliders are as close totravelling at constant velocities as possible prior tocollision, the distance between the photogates shouldbe reduced. Also, the gliders should be pushed tocollide with the ends of air track so that the re-bounded gliders will have near constant velocitiesprior to triggering the photogates.
The tables below list the results from two experimentalconditions. Table 7.1 presents the results of elastic colli-sion with one glider being initially stationary. Table 7.2presents the results of elastic collision with both glidersmoving initially.
Exp 7 - Conservation of Kinetic Energy
Table 7.1 Glider 2 is Initially Stationary
L1 = 12.6 cm L
2 = 12.8 cm Distance Between Photogates = 79.8cm
m 1 m2 t1i t 2i t1f t2f v1i v2i v1f v2f Eki Ekf % Error(g) (g) (s) (s) (s) (s) (m/s) (m/s) (m/s) (m/s) (J) (J) (%)
180.2 201.3 0.275 N/A 3.81 0.318 0.46 0 -0.03 0.40 0.02 0.02 13.26180.2 201.3 0.33 N/A 4.267 0.381 0.38 0 -0.03 0.34 0.01 0.01 12.92180.2 201.3 0.242 N/A 3.369 0.278 0.52 0 -0.04 0.46 0.02 0.02 12.12180.2 201.3 0.295 N/A 3.43 0.341 0.43 0 -0.04 0.38 0.02 0.01 12.98180.2 201.3 0.239 N/A 3.635 0.274 0.53 0 -0.03 0.47 0.03 0.02 11.85
180.2 261.5 0.492 N/A 3.956 0.637 0.26 0 -0.03 0.20 0.01 0.01 9.11180.2 261.5 0.38 N/A 2.597 0.481 0.33 0 -0.05 0.27 0.01 0.01 4.39180.2 261.5 0.243 N/A 1.513 0.309 0.52 0 -0.08 0.41 0.02 0.02 4.80180.2 261.5 0.202 N/A 1.164 0.256 0.62 0 -0.11 0.50 0.04 0.03 3.74180.2 261.5 0.274 N/A 1.625 0.35 0.46 0 -0.08 0.37 0.02 0.02 5.37
180.2 302.2 0.4 N/A 1.747 0.562 0.31 0 -0.07 0.23 0.01 0.01 7.08180.2 302.2 0.31 N/A 1.317 0.436 0.41 0 -0.10 0.29 0.01 0.01 6.97180.2 302.2 0.262 N/A 1.119 0.366 0.48 0 -0.11 0.35 0.02 0.02 5.83180.2 302.2 0.377 N/A 1.408 0.474 0.33 0 -0.09 0.27 0.01 0.01 -16.65180.2 302.2 0.246 N/A 1.053 0.342 0.51 0 -0.12 0.37 0.02 0.02 5.00
180.2 402.5 0.3 N/A 0.834 0.51 0.42 0 -0.15 0.25 0.02 0.01 7.30180.2 402.5 0.15 N/A 0.421 0.259 0.84 0 -0.30 0.49 0.06 0.06 9.99180.2 402.5 0.219 N/A 0.602 0.368 0.58 0 -0.21 0.35 0.03 0.03 5.13180.2 402.5 0.214 N/A 0.596 0.363 0.59 0 -0.21 0.35 0.03 0.03 6.99180.2 402.5 0.171 N/A 0.473 0.287 0.74 0 -0.27 0.45 0.05 0.05 5.10
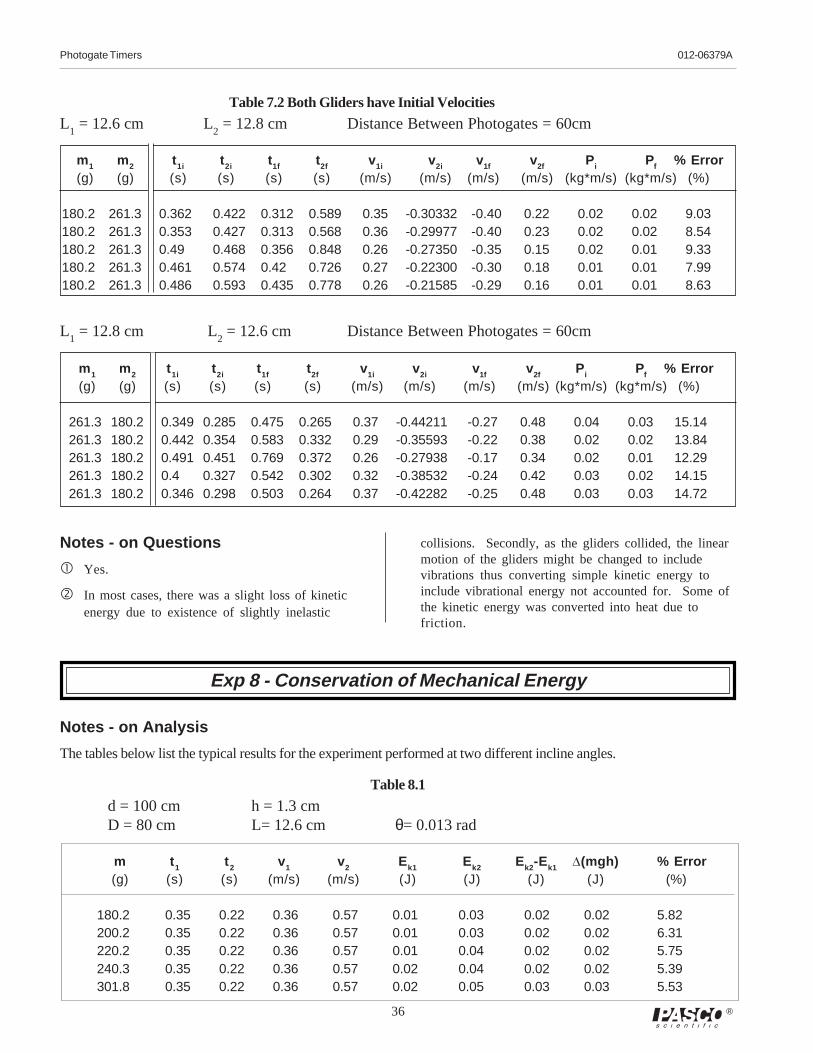
36
Photogate Timers 012-06379A
®
Table 7.2 Both Gliders have Initial Velocities
L1 = 12.6 cm L
2 = 12.8 cm Distance Between Photogates = 60cm
Table 8.1
d = 100 cm h = 1.3 cmD = 80 cm L= 12.6 cm θ= 0.013 rad
m t 1 t 2 v1 v2 Ek1 Ek2 Ek2-Ek1 D(mgh) % Error(g) (s) (s) (m/s) (m/s) (J) (J) (J) (J) (%)
180.2 0.35 0.22 0.36 0.57 0.01 0.03 0.02 0.02 5.82200.2 0.35 0.22 0.36 0.57 0.01 0.03 0.02 0.02 6.31220.2 0.35 0.22 0.36 0.57 0.01 0.04 0.02 0.02 5.75240.3 0.35 0.22 0.36 0.57 0.02 0.04 0.02 0.02 5.39301.8 0.35 0.22 0.36 0.57 0.02 0.05 0.03 0.03 5.53
m1 m2 t1i t 2i t1f t2f v1i v2i v1f v2f Pi Pf % Error(g) (g) (s) (s) (s) (s) (m/s) (m/s) (m/s) (m/s) (kg*m/s) (kg*m/s) (%)
180.2 261.3 0.362 0.422 0.312 0.589 0.35 -0.30332 -0.40 0.22 0.02 0.02 9.03 180.2 261.3 0.353 0.427 0.313 0.568 0.36 -0.29977 -0.40 0.23 0.02 0.02 8.54 180.2 261.3 0.49 0.468 0.356 0.848 0.26 -0.27350 -0.35 0.15 0.02 0.01 9.33 180.2 261.3 0.461 0.574 0.42 0.726 0.27 -0.22300 -0.30 0.18 0.01 0.01 7.99 180.2 261.3 0.486 0.593 0.435 0.778 0.26 -0.21585 -0.29 0.16 0.01 0.01 8.63
L1 = 12.8 cm L
2 = 12.6 cm Distance Between Photogates = 60cm
Exp 8 - Conservation of Mechanical Energy
Notes - on Analysis
The tables below list the typical results for the experiment performed at two different incline angles.
Notes - on Questions
� Yes.
� In most cases, there was a slight loss of kineticenergy due to existence of slightly inelastic
m 1 m2 t 1i t 2i t 1f t2f v1i v2i v1f v2f Pi Pf % Error(g) (g) (s) (s) (s) (s) (m/s) (m/s) (m/s) (m/s) (kg*m/s) (kg*m/s) (%)
261.3 180.2 0.349 0.285 0.475 0.265 0.37 -0.44211 -0.27 0.48 0.04 0.03 15.14261.3 180.2 0.442 0.354 0.583 0.332 0.29 -0.35593 -0.22 0.38 0.02 0.02 13.84261.3 180.2 0.491 0.451 0.769 0.372 0.26 -0.27938 -0.17 0.34 0.02 0.01 12.29261.3 180.2 0.4 0.327 0.542 0.302 0.32 -0.38532 -0.24 0.42 0.03 0.02 14.15261.3 180.2 0.346 0.298 0.503 0.264 0.37 -0.42282 -0.25 0.48 0.03 0.03 14.72
collisions. Secondly, as the gliders collided, the linearmotion of the gliders might be changed to includevibrations thus converting simple kinetic energy toinclude vibrational energy not accounted for. Some ofthe kinetic energy was converted into heat due tofriction.
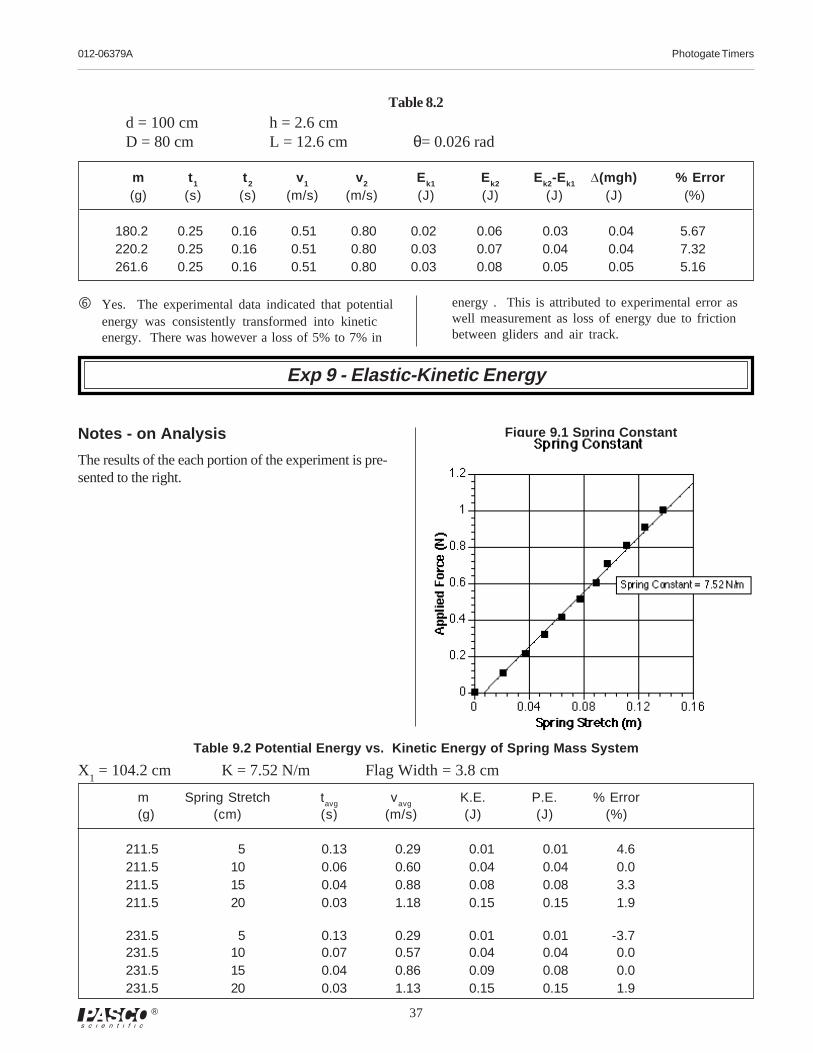
012-06379A Photogate Timers
37®
Table 8.2d = 100 cm h = 2.6 cmD = 80 cm L = 12.6 cm θ= 0.026 rad
m t 1 t 2 v1 v2 Ek1 Ek2 Ek2-Ek1 D(mgh) % Error(g) (s) (s) (m/s) (m/s) (J) (J) (J) (J) (%)
180.2 0.25 0.16 0.51 0.80 0.02 0.06 0.03 0.04 5.67220.2 0.25 0.16 0.51 0.80 0.03 0.07 0.04 0.04 7.32261.6 0.25 0.16 0.51 0.80 0.03 0.08 0.05 0.05 5.16
� Yes. The experimental data indicated that potentialenergy was consistently transformed into kineticenergy. There was however a loss of 5% to 7% in
energy . This is attributed to experimental error aswell measurement as loss of energy due to frictionbetween gliders and air track.
Figure 9.1 Spring ConstantNotes - on Analysis
The results of the each portion of the experiment is pre-sented to the right.
Table 9.2 Potential Energy vs. Kinetic Energy of Spring Mass System
X1 = 104.2 cm K = 7.52 N/m Flag Width = 3.8 cm
m Spring Stretch tavg
vavg
K.E. P.E. % Error(g) (cm) (s) (m/s) (J) (J) (%)
211.5 5 0.13 0.29 0.01 0.01 4.6211.5 10 0.06 0.60 0.04 0.04 0.0211.5 15 0.04 0.88 0.08 0.08 3.3211.5 20 0.03 1.18 0.15 0.15 1.9
231.5 5 0.13 0.29 0.01 0.01 -3.7231.5 10 0.07 0.57 0.04 0.04 0.0231.5 15 0.04 0.86 0.09 0.08 0.0231.5 20 0.03 1.13 0.15 0.15 1.9
Exp 9 - Elastic-Kinetic Energy
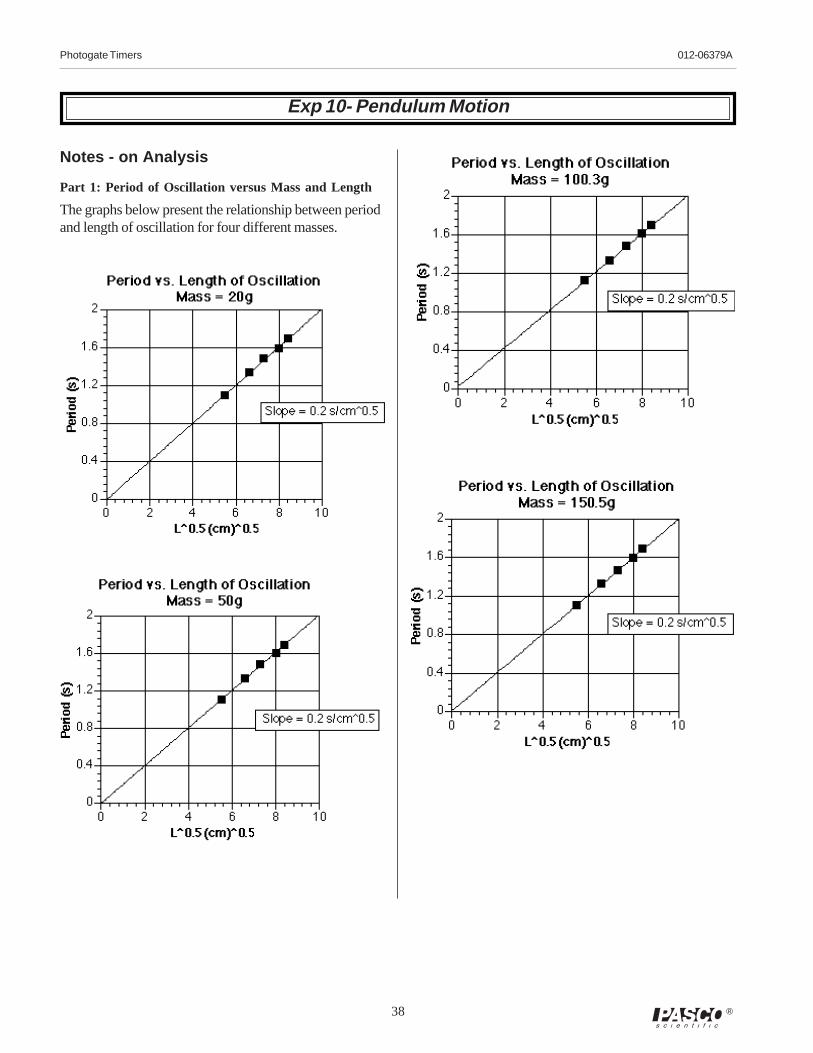
38
Photogate Timers 012-06379A
®
Exp 10- Pendulum Motion
Notes - on Analysis
Part 1: Period of Oscillation versus Mass and Length
The graphs below present the relationship between periodand length of oscillation for four different masses.
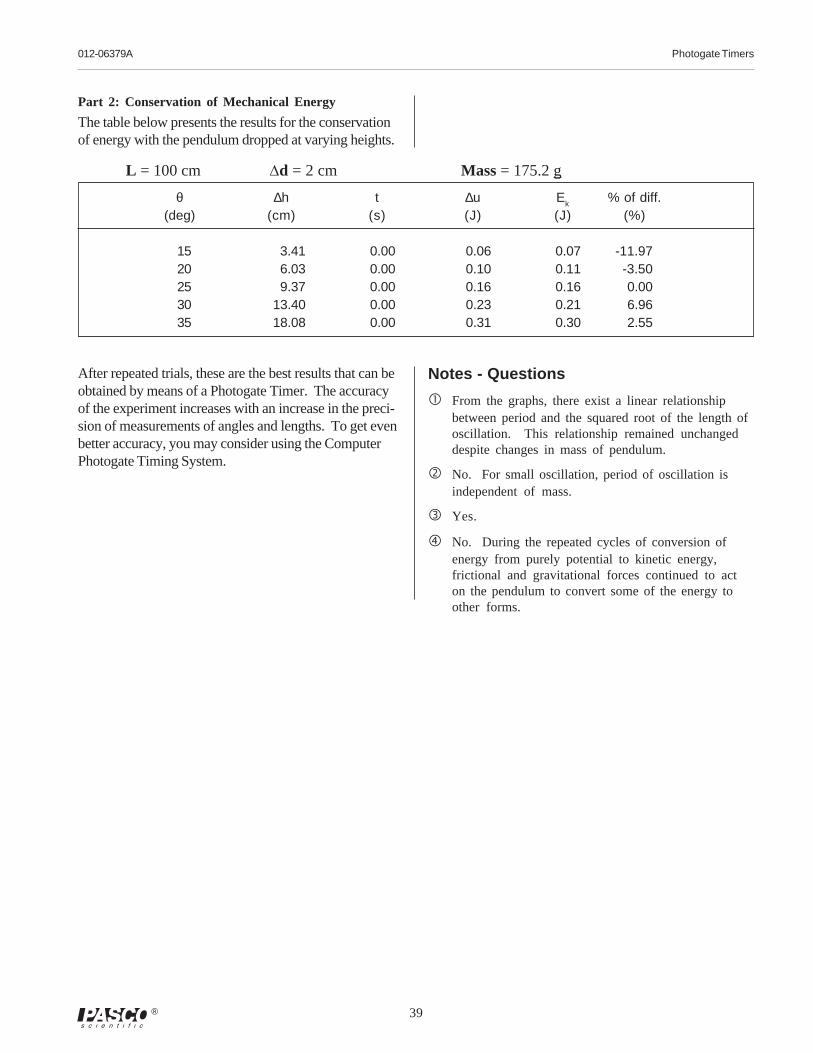
012-06379A Photogate Timers
39®
Part 2: Conservation of Mechanical Energy
The table below presents the results for the conservationof energy with the pendulum dropped at varying heights.
L = 100 cm Dd = 2 cm Mass = 175.2 g
After repeated trials, these are the best results that can beobtained by means of a Photogate Timer. The accuracyof the experiment increases with an increase in the preci-sion of measurements of angles and lengths. To get evenbetter accuracy, you may consider using the ComputerPhotogate Timing System.
θ ∆h t ∆u Ek
% of diff.(deg) (cm) (s) (J) (J) (%)
15 3.41 0.00 0.06 0.07 -11.9720 6.03 0.00 0.10 0.11 -3.5025 9.37 0.00 0.16 0.16 0.0030 13.40 0.00 0.23 0.21 6.9635 18.08 0.00 0.31 0.30 2.55
Notes - Questions
� From the graphs, there exist a linear relationshipbetween period and the squared root of the length ofoscillation. This relationship remained unchangeddespite changes in mass of pendulum.
� No. For small oscillation, period of oscillation isindependent of mass.
� Yes.
� No. During the repeated cycles of conversion ofenergy from purely potential to kinetic energy,frictional and gravitational forces continued to acton the pendulum to convert some of the energy toother forms.
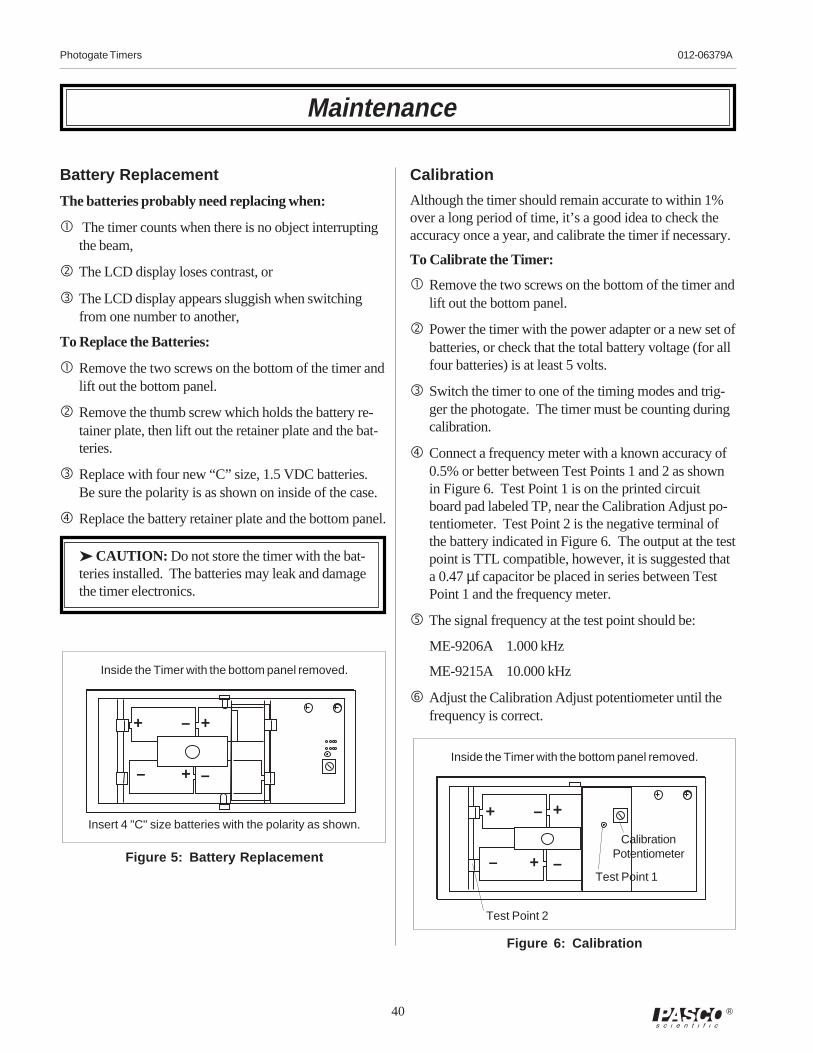
40
Photogate Timers 012-06379A
®
Battery Replacement
The batteries probably need replacing when:
� The timer counts when there is no object interruptingthe beam,
� The LCD display loses contrast, or
� The LCD display appears sluggish when switchingfrom one number to another,
To Replace the Batteries:
� Remove the two screws on the bottom of the timer andlift out the bottom panel.
� Remove the thumb screw which holds the battery re-tainer plate, then lift out the retainer plate and the bat-teries.
� Replace with four new “C” size, 1.5 VDC batteries.Be sure the polarity is as shown on inside of the case.
� Replace the battery retainer plate and the bottom panel.
➤ CAUTION: Do not store the timer with the bat-teries installed. The batteries may leak and damagethe timer electronics.
Calibration
Although the timer should remain accurate to within 1%over a long period of time, it’s a good idea to check theaccuracy once a year, and calibrate the timer if necessary.
To Calibrate the Timer:
� Remove the two screws on the bottom of the timer andlift out the bottom panel.
� Power the timer with the power adapter or a new set ofbatteries, or check that the total battery voltage (for allfour batteries) is at least 5 volts.
� Switch the timer to one of the timing modes and trig-ger the photogate. The timer must be counting duringcalibration.
� Connect a frequency meter with a known accuracy of0.5% or better between Test Points 1 and 2 as shownin Figure 6. Test Point 1 is on the printed circuitboard pad labeled TP, near the Calibration Adjust po-tentiometer. Test Point 2 is the negative terminal ofthe battery indicated in Figure 6. The output at the testpoint is TTL compatible, however, it is suggested thata 0.47 µf capacitor be placed in series between TestPoint 1 and the frequency meter.
� The signal frequency at the test point should be:
ME-9206A 1.000 kHz
ME-9215A 10.000 kHz
� Adjust the Calibration Adjust potentiometer until thefrequency is correct.
Maintenance
+ +
– –
Insert 4 "C" size batteries with the polarity as shown.
Inside the Timer with the bottom panel removed.
+
–
Inside the Timer with the bottom panel removed.
CalibrationPotentiometer
Test Point 1
Test Point 2
Figure 6: Calibration
+ –
– –+
+
Figure 5: Battery Replacement

42
Photogate Timers 012-06379A
®
Technical Support
Feedback
If you have any comments about the product or manual,please let us know. If you have any suggestions on alter-nate experiments or find a problem in the manual, pleasetell us. PASCO appreciates any customer feedback. Yourinput helps us evaluate and improve our product.
To Reach PASCO
For technical support, call us at 1-800-772-8700 (toll-freewithin the U.S.) or (916) 786-3800.
fax: (916) 786-3292
e-mail: [email protected]
web: www.pasco.com
Contacting Technical Support
Before you call the PASCO Technical Support staff, itwould be helpful to prepare the following information:
➤ If your problem is with the PASCO apparatus, note:
Title and model number (usually listed on thelabel);
Approximate age of apparatus;
A detailed description of the problem/sequence ofevents (in case you can’t call PASCO right away,you won’t lose valuable data);
If possible, have the apparatus within reach whencalling to facilitate description of individual parts.
➤ If your problem relates to the instruction manual,note:
Part number and revision (listed by month and yearon the front cover);
Have the manual at hand to discuss yourquestions.
