photocatalytic cement exposed to nitrogen oxides: effect of oxidation and binding
TRANSCRIPT

Cement and Concrete Research 60 (2014) 30–36
Contents lists available at ScienceDirect
Cement and Concrete Research
j ourna l homepage: ht tp : / /ees .e lsev ie r .com/CEMCON/defau l t .asp
Photocatalytic cement exposed to nitrogen oxides: Effect of oxidationand binding
Bo Yeon Lee b, Amal R. Jayapalan c, Michael H. Bergin d, Kimberly E. Kurtis a,⁎a School of Civil and Environmental Engineering, Georgia Institute of Technology, 790 Atlantic Dr., Atlanta, GA 30332-0355, USAb Department of Architectural Engineering, The University of Suwon, Hwaseong-si, Gyeonggi-do, Koreac Exponent Failure Analysis Associates, 149 Commonwealth Dr., Menlo Park, CA 94025, USAd School of Earth & Atmospheric Sciences, Georgia Institute of Technology, 311 Ferst Drive Atlanta, GA 30332-0340, USA
⁎ Corresponding author. Tel.: +1 404 385 0825.E-mail addresses: [email protected] (B.Y. Lee), jayapala
(A.R. Jayapalan), [email protected] (M.H. [email protected] (K.E. Kurtis).
http://dx.doi.org/10.1016/j.cemconres.2014.03.0030008-8846/© 2014 Elsevier Ltd. All rights reserved.
a b s t r a c t
a r t i c l e i n f oArticle history:Received 22 February 2013Accepted 6 March 2014Available online 31 March 2014
Keywords:Adsorption (C)Air qualityCement paste (D)Reaction (A)
The photocatalytic oxidation and binding capacity of cement containing titanium dioxide nanoparticles undernitric oxide and nitrogendioxide gas exposureswere examined experimentally both in the presence and absenceof ultraviolet (UV) light, to examine independently the contributions of photocatalysis and potential additionalmechanisms for binding of nitrogen oxides (NOx) inherent in cement-based materials. The overall, photocatalyticefficiency was similar for both gas exposures, with faster initial rates of initial NO binding for higher water-to-cement ratio pastes, due to higher surface area. In the absence of UV light, greater binding of NO2 gas was foundcompared to NO gas, perhaps due to the greater polarity of the NO2 molecule, although further examination ofthis phenomenon is warranted. Overall, these experiments show not only the fact that cementitious materialscan be tailored to decrease NOx levels through photocatalysis but also the fact that Portland cements possessthe inherent ability to bind NOx, and in particular NO2.
© 2014 Elsevier Ltd. All rights reserved.
1. Introduction
Although the adverse effects of atmospheric nitrogen oxides(or “NOx”) on human and environmental health are well-known [1],NO2 levels in many large cities exceed the World Health Organization(WHO) guideline of 40 μg/m3 (0.021 ppm) for air quality [1]. One pro-posed way of reducing the NOx concentration in the atmosphereis the use of photocatalytic titanium dioxide (TiO2) in constructionmaterials near mobile sources (e.g., photocatalytic concrete roads)[2–6]. Nano-anatase titanium dioxide (TiO2) is perhaps the most well-known photocatalytic semiconductor and onewhich possesses a strongoxidizing capability. A review of the mechanisms of photocatalyticoxidation can be found in [7,8]. Generally, the photocatalytic oxidationreactions occur in the presence of water, oxygen, and under UV andnear-UV light [9] which enable nano-TiO2 to oxidize or decomposeNOx, as well as organic and inorganic compounds [7,9]. Thus, theapplications of nano-anatase TiO2 include self-cleaning, air and waterpurification, self-sterilizing, and anti-fogging surfaces [4].
Here, the effect of nano-TiO2-containing cementitious materials onoxidation and binding of nitric oxide (NO) and nitrogen dioxide (NO2)
gases is examined,with andwithout photocatalysis. To assess photocat-alytic efficiency, tests such as the ISO standard [10] and JIS standard [11]have been established for advanced ceramics, where a photocatalystis added by coating, impregnation, and mixing. However, both ofthese standards utilize only NO gas in their experimental procedures.As a result, significantly more research effort has been put towardmeasurements of NO gas oxidation than NO2 gas oxidation byphotocatalysis. Since NO gas being emitted by combustion sources istypically converted to NO2 gas relatively quickly (i.e. within hours) itis important to also determine the extent to which NO2 is oxidized byphotocatalytic surfaces.
Yet, NO2 gas is – like NO – amajor air pollutant that threatens humanhealth and also participates in the formation of photochemical smogand ozone (O3) [1], ultimately contributing to climate change. Duringhigh-temperature combustion (e.g., power generation, engine combus-tion in vehicles), nitrogen and oxygen combine to produce NO, whichthen readily transforms into NO2 through reaction with ozone and/oroxygen. The NO2 is then photolyzed by sunlight to reform NO:
N2 þ O2 →high combustion temperature
2NONOþ O3→NO2 þ O2
and2NOþ O2→2NO2
NO2 →sunlight
NOþ O:
ð1Þ

Fig. 1. NOx reactor with UV light on.
31B.Y. Lee et al. / Cement and Concrete Research 60 (2014) 30–36
As a result, NO and NO2 coexist in equilibrium in the atmosphere.While the NO/NO2 ratio is determined by the intensity of solar radiationand the concentration of ozone, it has been reported that the annualaverage on-road NO2/NOx ratio was 28% [12], meaning that themore harmful NO2 gas [1] is as much as 39% of the NO gas overall. TheNO2/NOx ratio tends to increase with increasing distance from theemitting source, and that most NOx in the lower troposphere over theUS is in fact NO2 and not NO. The atmospheric NO2 concentrations arecommonly monitored, because of its contributions to ground levelozone formation and fine particulate formation and its adverse effectson the human respiratory systems and because its concentration isviewed as an indicator of overall NOx [13]. Taking into considerationthe severe implications of NO2 gas, its quantity fraction in the atmo-sphere, and its significance to ambient air quality standards, there isa need to investigate the photocatalytic behavior of cementitiousmaterials under NO2 as well as NO exposure.
In addition to the relative dearth of information regarding thephoto-catalytic efficiency of cementitiousmaterials under NO2 exposure, somepreliminary work has suggested that NO2 can be bound into cementi-tious materials without the benefit of photocatalysis. For example,Cassar [14] observed a decrease in NOx concentration during exposureto cement paste without a photocatalyst, suggesting that the decreasemay be due to NOx adsorption by the hydroxides present in the cementmatrix. Vallee et al. [15] performed de-polluting experiments exposingphotocatalytic surfaces to NO2 gas, and mentioned the possibility thatNO2 can be adsorbed into cementitious materials in the absence ofUV-radiation that is later oxidized in the day time. Yoshio et al. [16]also tested TiO2-coated cement on NOx removal, noting that NO2 gascan be adsorbed on the porous surface structure of cement. However,not much effort has been made in the published literature to eitherquantify and compare NOx binding capacity to photocatalysis or exam-ine the NOx binding mechanism of cementitious materials in theabsence of UV light, or photocatalysis.
The potential of cementitious materials to decrease the amount oftheNO2 in the atmosphere is potentially important for a comprehensiveassessment of the potential environmental impact of cement-based in-frastructure. For example, NOx binding in the cementitious structure inthe absence of photocatalysis (i.e., in the absence of UV-radiation) couldpotentially facilitate subsequent photocatalytic reaction by providingnitrogen oxides near the TiO2 particles. Thus, a detailed examinationof NOx binding – including examination of NO and NO2 binding – incementitious systems is warranted.
The objectives of this research are to examine and compare the photo-catalytic efficiency and NOx binding capacity of TiO2-containing cement-basedmaterials under both NO andNO2 gases. Additional studies are alsoconducted in the absence of photocatalysis, with both NO and NO2 gases.The effect of different water-to-cement ratios (w/c) of the cementitiousmaterials on the photocatalytic efficiency is also studied.
2. Materials and experimental procedure
Hardened cement pastes at varying w/c and containing varyingamounts of photocatalytic TiO2 nanoparticles were prepared. Testswere performed to assess photocatalytic binding of NO and NO2, withUV-radiation (i.e., “photocatalysis series”). Additional tests were per-formed to examine the potential for NO and NO2 binding in the absenceof UV-radiation (i.e., “NOx binding series”).
2.1. Materials
The cement used was ASTM C 150 Type I Portland cement withpotential Bogue composition of 54% C3S, 18% C2S, 7% C3A, and 10%C4AF. (The cement chemistry notations of these oxides are defined asC=CaO, S=SiO2, F= Fe2O3, andA=Al2O3.) The TiO2 usedwas select-ed as onemore commonly used in the concrete industry (Aeroxide TiO2
P25, Evonik Industries), which consisted of 80% anatase and 20% rutile
titania. The average crystal size is 21 nm, the surface area is 50 ± 15m2/g, and the sample purity is 99.5%, as stated by the manufacturer.The average agglomerate size was found to be 0.58 μm. NO and NO2
gases were obtained at 100 ppm each and were mixed with ultrapure zero air (~80% nitrogen and ~20% oxygen) to reach the desiredconcentration.
2.2. Sample preparation
Two series of cement paste samples were prepared. For thephotocatalysis series, pastes were prepared at water-to-cement ratios(w/c) of 0.40, 0.50, and 0.60, all with 5% TiO2 replacement by mass ofcement. For the NOx-binding series, samples were preparedwith a con-sistent composition atw/c of 0.60with 10% TiO2 replacement bymass ofcement.
To prepare the samples, the TiO2 particles were mixed with deion-ized water for 1 min using a hand-held mixer at a low speed. Cementwas then added to the TiO2 slurry and mixed for 1 additional minuteat a low speed and another 1 min at a medium speed. Samples werecast in plastic molds with dimension of 4.8 cm × 4.8 cm × 0.8 cm.They were allowed to cure in 100% relative humidity and at 23 ± 2 °Cfor the initial 24 h, and continued to be cured in lime water at 23 ±2 °C for complete hydration after demolding. For the photocatalysisseries, samples were cured for at least 28 days, a period sufficient tominimize any potential effects of hydration on subsequent moist expo-sures. After curing, they were progressively polished to 15 μm using600 grit wet sandpaper to ensure uniform surface roughness. Finally,samples were conditioned in a 30 °C oven until the mass change withina 24 hour time period was less than 0.5%.
For the NOx binding series, samples were prepared and cured in thesame manner, except they were cured for 28 days of age and polishedup to 5 μm, and dried for 3 days. In order to investigate the influence ofmoisture state on binding and to better understand the binding mecha-nisms, NOx binding series samples were conditioned to be either ‘wet’or ‘dry’ during NO or NO2 exposure. Wet samples were fully immersedin deionized water for 3 h under vacuum, and kept wet in plastic bagsuntil tested. Saturation was confirmed by breaking a control sample andvisually examining the broken surface. Dry samples were conditioned in40 °C oven until mass change was less than 0.1% within 24 h.
2.3. Methodology
Both series of tests utilized a UV reactor, shownwith the UV light onin Fig. 1 and schematically in Fig. 2, that largely conforms to the ISO andJIS standards [10,11] for measurements of removal of nitric oxide gasduring photocatalysis. The innerwidth of the reactor wasmanufacturedto be 8 cm compared to the standard 5 cm to accommodate larger

Fig. 2. Experimental setup showing NO/NO2 flow and UV reactor.
Fig. 3. NO test data with samples with w/c = 0.40, 0.50, and 0.60, each with 5% TiO2 bymass of cement.
32 B.Y. Lee et al. / Cement and Concrete Research 60 (2014) 30–36
samples. Also, for simplicity, a height adjusting plate was not utilized,meaning that test gas could pass not only above the sample surfacesbut also along the sides. The test setup was designed tomaintain a con-stant concentration of test gas flow into the reactor, which then flowsover the sample surfaces (which may be illuminated with UV light),and exits on the other side of the reactor where gas concentration ismeasured with time. Samples were placed in the reactor with onlyone face exposed to the UV light. Two 40 W UV fluorescent lamps(GE) with peak emission at 368 nm were used to produce the UVlight. The power density of the UV light at the sample surfacewasmain-tained at 10Wm−2 by adjusting the distance between the light sourceand the sample plane.
2.3.1. Photocatalysis series with NO and NO2 gasesFor the photocatalysis series, experimental conditions were kept
constant among tests with only the type of test gas (either NO or NO2)varying. The test gas concentration was adjusted to a targeted value of1000 ppb in the reactor with 5 cement samples already installed,which is equivalent to 115 cm2 effective surface area. Note that thestarting concentration was measured at the outlet of the experimentalreactor just before the UV light was turned on, which can be lowerthan the actual input concentration due to gas adsorption on the exper-imental setup and test samples. The gas flow rate was fixed at 500 ml/min at 23 ± 2 °C, at 50% relative humidity, and at standard pressure.Once the gas concentration was stabilized, the UV light exposure wasbegun and continued for 3 h. After the UV light was turned off, the gaswas allowed to stabilize again with measurements continuing duringthis period. Additional measurements of gas concentration were madeafter the samples were removed to confirm the air tightness and passiv-ity of the reactor itself. Photocatalytic efficiency was determined by thepercentage drop in gas concentration compared to the initial concentra-tion (~1000 ppb) using the total sample surface area exposed to the UVlight. This is a simplifiedmethodwhich does not account for flow rate orsample surface area, since all of these parameters were kept constant.
2.3.2. NO and NO2 binding seriesTo investigate the binding capabilities of the cementitious materials
in the absence of photocatalysis, a continuous concentration of test gaswas maintained using the same reactor used for the NOx oxidationseries. However, in this series, the UV light was not utilized. In thisway, the potential for NOx binding can be examined independentlyfrom the effect of photocatalytic NOx oxidation.
The input NO and NO2 concentrations were controlled to be consis-tent at ~1000 ppb at a flow rate of 500 ml/min at 23± 2 °C and at stan-dard pressure before the samples were inserted. Once the gas wasstabilized, the reactor was opened and five of either wet or dry sampleswere inserted in less than 5 min to minimize test gas loss, and weremaintained in the reactor for 5 h. Then, the samples were removedand the gas concentration in the reactor was again stabilized beforeterminating the experiment. The gas concentration was measuredwith andwithout samples throughout the experiment, again to validatethe passivity of the reactor itself.
As previously described, samples were prepared either in dry condi-tion or in wet condition to examine the mechanism of the NOx bindingin cementitious materials. That is, this variation in moisture state willallow assessment of whether the test gas is adsorbed on hardenedcement paste solids directly or may be first absorbed into the cementpore solution (i.e., it is more favorable on wet samples). The test setupwas modified from the first series by removing a humidifier so that nomoisture inflowwas allowed. The rate of gas binding can be determinedby the changes in the level of gas stabilization in the reactor before andafter the samples are inserted.
3. Results and discussion
3.1. Photocatalysis series under NO and NO2
The influence of water-to-cement ratio on photocatalytic efficiencyin the presence of NO and NO2 gases was examined. Because it is well-known that varying the w/c of the material alters the pore structure(i.e., pore volume, size distribution, interconnectivity) of cementitiousmaterials [17], the amount of effective surface area available for photo-catalytic oxidation and binding of oxidation productsmay also be affect-ed [7,18].
Figs. 3 and 4 show the influence of water-to-cement ratio duringphotocatalysis of cement pastes exposed to NO and NO2 gases, respec-tively. Photocatalytic efficiency at 1-hour intervals up to 3 h after UVirradiationwas calculated, as described in Section 2.3, and are presentedin Table 1 as percentage drop from the initial concentration and in NOxdegradation rate (mg/m2 h). The 3-hour duration of the test was deter-mined from observation of the changes in NO and NO2 concentrationsover time. For the size of cement paste samples examined, a relativestasis in gas concentration at ~700 ppb was achieved during a 3-hourexposure period.

Fig. 4. NO2 test data with samples with w/c = 0.40, 0.50, and 0.60, each with 5% TiO2 bymass of cement.
33B.Y. Lee et al. / Cement and Concrete Research 60 (2014) 30–36
As can be seen from Figs. 3 and 4, the photocatalytic cement pastesare capable of oxidizing both NO and NO2 gases instantaneously uponinitial UV illumination. This is an expected behavior because NO2 isone of the transitional products in the NO oxidation process [19,20].For both of the cases, photocatalytic activity continued throughout the3-h test period.When theUV lightwas turned off, the gas concentrationgenerally recovered back to the initial concentration of ~1000 ppb, asexpected. Overall, by the end of the test at 3 h of UV irradiation, the pho-tocatalytic efficiency values seem to converge to values in the mid-20sfor both theNOandNO2 exposure cases. This trend suggests that similaramounts of NO and NO2 gases were oxidized at 3 h when a constantconcentration (~1000 ppb) of gaswas provided, regardless of variationsin w/c in the range examined.
However, it is worth noting that some differences in photocatalyticefficiency were observed in the NO experiment for the different w/c'sexamined. While the variation in w/c in the NO2 experiment did notresult in large variations in early oxidation behavior, higher w/c in thepaste generally resulted in a greater initial drop in the case of the NO ex-periment, producing a more rapid rate of oxidation. Specifically, whilethe w/c = 0.4 samples oxidized 14.0% of the gas initially, a 31.0% dropwas measured for the w/c = 0.6 pastes. The photocatalytic efficiencyof the w/c= 0.4 and 0.5 samples increased over time, resulting in com-parable values to the w/c= 0.6 sample at 3 h. However, the w/c= 0.60was the most effective, oxidizing 28.9% of the initial NO gas at 3 h, com-pared to 23.6% and 24.4% for thew/c=0.40 and 0.50 cases respectively.
It is proposed that the variations in pore structures among the sam-ples are themain reason for the different behaviors among differentw/csamples under NO. That is, other parameters remaining the same, ahigher w/c sample has higher porosity, greater degree of pore connec-tivity, and thus higher surface area where the gas can be sorbed [7,17,18]. This increases the amount of gas that can potentially be oxidized.(In the case of the NO2 experiment, the effect of variations in w/cand pore structures is not apparent; the possible reason for which isaddressed later in this section.)
To better quantify the influence of w/c on structure, surface areaanalysis was performed using the nitrogen Brunauer–Emmett–Teller
Table 1Photocatalytic efficiency of samples at different times.
Experimental conditions
NO gas
w/c 0.4 0.5 0
% initial drop (mg/m2 h) 14.0 (0.45) 22.4 (0.72) 3% 1 h drop (mg/m2 h) 20.5 (0.66) 24.5 (0.78) 2% 2 h drop (mg/m2 h) 22.4 (0.72) 27.6 (0.88) 2% 3 h drop (mg/m2 h) 23.6 (0.76) 24.4 (0.78) 2
(BET) method on these samples using an accelerated surface area andporosimetry system (Micromeritics ASAP2020,Micromeritics, Norcross,GA). Samples were crushed to pass a #8 sieve and retained in a #16sieve. Degassing was done at 105 °C for 24 h, on ~1 g samples. TheBET surface area was measured to be 19.53 m2/g, 37.81 m2/g, and54.84m2/g for the 5% TiO2 samples atw/c=0.4, 0.5, and 0.6 respective-ly. These results show an increase in surface area asw/c increases due tohigher porosity, as expected. It is hypothesized that the photocatalyticefficiency depends to some extent on the rate of gas sorption withinthe cementitious system. Thus, at higher w/c, cementitious materialshave a greater capacity for NO binding and this facilitates oxidationupon exposure to UV light. The greater complexity of the pore structureat the lower w/c of 0.40 and 0.50 may control the rate at which NOmaybe bound, thus producing increasing photocatalytic efficiency withtime. However, further investigation is necessary to evaluate the valid-ity of this supposition.
While the variation in specific surface areawithw/cmay account forthe difference in NO sorption among the samples examined, the differ-ence in sorptivity in the NO and NO2 experiments must also be exam-ined. Specifically, no apparent differences in efficiency were observedwith varying w/c's in the case of NO2, when comparing Figs. 3 and 4.To better understand the interactions between the cement pastes ofvarying surface areas and the NO and NO2 gases, it is useful to under-stand the nature of the gases themselves. The NO molecule is smallerand has a lower molecular mass than the NO2 molecule. Both the NOand NO2 molecules are polar, meaning that the dipole–dipole intermo-lecular forces align themolecules, increasing their attraction to surfacesand reducing potential energy. The dipole moments of the NO and NO2
are 0.157 D [21] and 0.316 D [22], respectively, meaning that nitrogendioxide is the more polar molecule.
Therefore, it is hypothesized that despite its larger size, the morepolar NO2 molecule is more efficiently and more rapidly sorbed withinthe cementitious structure than the NO molecule. The rapid NO2 sorp-tion for this test setup is supported by the observation that NO2 sorptionappears to occur independently of sample water-to-cement ratio, andhence, porosity. As a result, in this case, the rate of sorption does notlimit the photocatalytic efficiency in the presence of NO2.
After the photocatalytic oxidation experiment for thew/c=0.6 casefor both theNO andNO2 gases, the sampleswere taken out of the UV re-actor and the concentration of gases in the absence of the samples wasmeasured for some time while there is constant flow of NO and NO2
gases. Fig. 5(a) and (b) shows the gas concentration of the NO andNO2 experiments respectively, before and after the samples have beenremoved. The gas concentration is shown to decrease rapidly with atime of ~10min for both cases when the reactor was opened to removethe samples. The reactor was closed immediately after removing thesamples and the gas concentration started to stabilize within severalminutes and reached plateau at ~20 min. After the samples wereremoved, the concentration of NO did not change much; that is, in theabsence of the samples, the NO concentration in the reactor quicklyrecovered to ~925 ppb, which is approximately the same level aswhen the samples were in the reactor. On the other hand, the NO2 con-centration jumped up from ~965 ppb to ~1285 ppb when the sampleswere taken out. This ~33% increase in NO2 concentration representsthe additional flux in gas flow rate necessary to compensate for NO2
NO2 gas
.6 0.4 0.5 0.6
1.0 (0.99) 27.7 (1.36) 30.6 (1.50) 30.3 (1.49)9.2 (0.93) 26.9 (1.32) 27.3 (1.34) 29.2 (1.43)9.2 (0.93) 24.2 (1.19) 24.4 (1.20) 27.2 (1.34)8.9 (0.93) 23.5 (1.15) 22.0 (1.08) 25.2 (1.24)

Fig. 5. Gas concentration after samples were taken out of the reactor in (a) the NOexperiment and (b) the NO2 experiment.
Fig. 6. (a) Change in NO gas concentration on wet cement paste samples with time;(b) change in NO gas concentration on dry cement paste samples with time.
34 B.Y. Lee et al. / Cement and Concrete Research 60 (2014) 30–36
binding within the cementitious materials while maintaining thedesired concentration of ~1000 ppb in the reactor. This clearly demon-strates that cementitious materials have a high potential to sorb (orbind) NO2 compared to NO, and the consistency in the rate of sorptionsuggests that this effect could also be used to diminish NO2 levels inthe atmosphere.
3.2. NO and NO2 binding series
The prior demonstration of NO2 binding in cementitious materialshas not been a subject tomuch research despite the known coexistenceof NO2 with NO in the atmosphere. To further examine the binding ofNO2 within cementitious materials, an additional series of experimentswas undertaken with a goal of better understanding the NOx bindingprocess. Of particular interest is an improved understanding of the po-tential binding pathways (e.g., gas adsorption to solid surfaces and gasabsorption or dissolution in pore solution) and how these may differfor NO and NO2. To this end, cement paste samples were introducedto NO or NO2 environments without UV-radiation in either dry or wetstates, as previously described.
Results from the NO binding experiment in cementitious materialswhen the samples were wet and dry are shown in Fig. 6(a) and (b) re-spectively, while Fig. 7(a) and (b) shows the corresponding results fromthe NO2 experiment. For all of the figures, both the NO and NO2 concen-trationswere plotted aswell as theNOx. This way it is visually clear thatthe test gas is stable and that the concentration changes in the test gasare not the result of transformation to other types of gas (for instanceNO to NO2 or vice versa). Rapid decreases in gas concentration nearthe start and the end of each experiment indicate when the test gaswas lost when the reactor was opened to insert and take out samples.Because UV-lights were not used in this set of experiments, interactionsbetween the gases and the cementitiousmaterials result from phenom-ena other than photocatalysis.
Comparing Figs. 6 and 7, the results suggest that NO2, in general, isbound in cementitious materials much more than NO gas. These resultsagree with those observations made from Fig. 5, described previously.The results from Figs. 6 and 7 again suggest that the NO2 gas has a greaterpotential to be bound into cementitious substrate than theNOgas, despiteits larger molecular size. These results confirm initial findings by Cassar[14], but also provide additional information about the nature of the bind-ing, considering NO and NO2 exposures and wet and dry conditions.
When comparing changes in gas concentration for wet and drysamples, the NO2 concentration was decreased by nearly the samefraction for the wet and dry samples (i.e., 38% (1.87 mg/m2 h) and36% (1.77 mg/m2 h)) after 2 h of gas exposure. The NO concentrationwas decreased more modestly, by 9% (0.29 mg/m2 h) and 2%(0.06 mg/m2 h) for the wet and dry samples respectively, after 2 h of
gas exposure. From these results, it was found that the NOx bound incement paste is slightly higher for the wet samples than for the drysamples in both of the cases. This observation shows that while thepore solution takes part in binding NO and NO2, its influence is negligi-ble compared to gas bound to the cement paste itself.
The greater role of the paste, versus the pore solution, in binding issupported by comparing Fig. 7(a) and (b). Here, for the case of the drysamples exposed to the NO2, as shown in Fig. 7(b), the rate of NO2 con-centration recovery after the samples have been inserted is lower thanthe other case. This indicates that the rate of decrease of the NO2 gasconcentration at the early exposure times occurs more rapidly thanthe wet sample case, again suggesting that the NO2 gas is bound morerapidly to hardened cement paste than into pore solution.
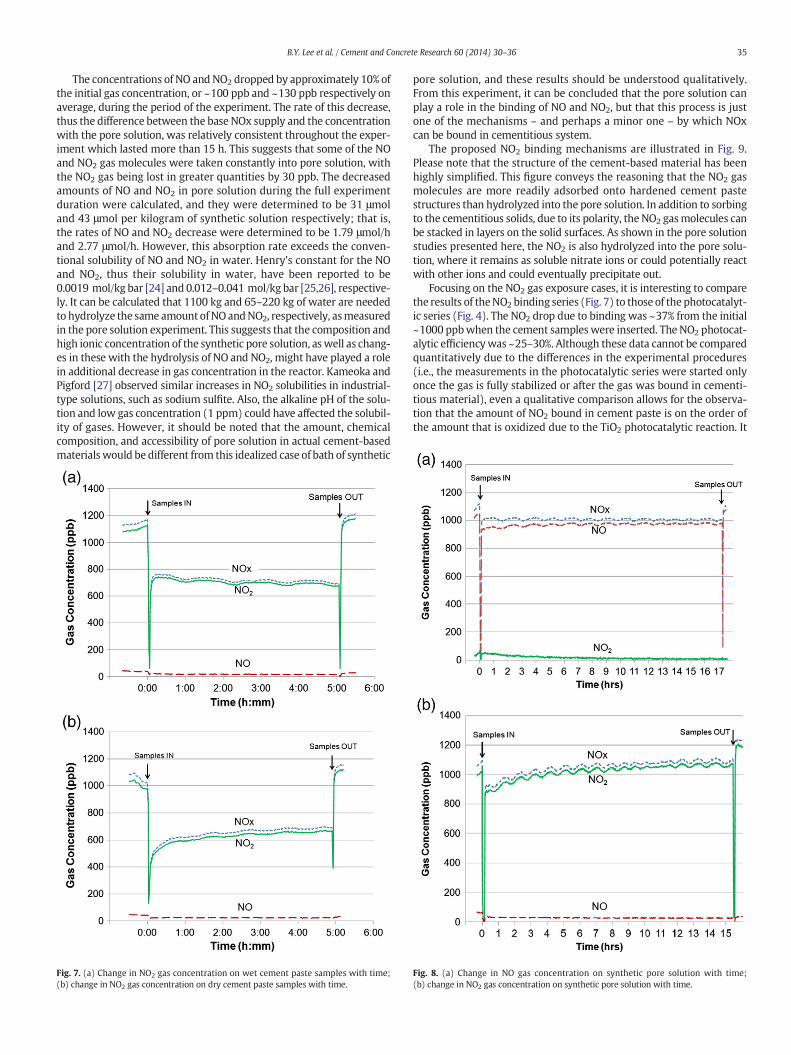
To examine the effect of pore solution alone on the binding of NOx gasinto cementitious substrate, a simple experiment was performed in thepresence of synthetic cement pore solution. The experimental setup wasidentical to the NOx binding series, except a shallow bath of synthetic ce-ment pore solution, composed of saturated calcium hydroxide solutionplus 0.7Msodiumhydroxide [23],was used inplace of cement paste sam-ples. 65 g of solution was used in a shallow plastic dish for each NO andNO2 experiment, with an effective surface area of 200 cm2. The solutionwas exposed to each gas concentration at ~1000 ppb for more than15 h. Fig. 8(a) and (b) shows the gas concentration changes when the so-lution was installed for the NO and NO2 gases respectively. Again, therapid decrease of gas concentration observed at the start and end ofeach experiment indicates when the reactor was opened while insertingand taking out the synthetic pore solution.
35B.Y. Lee et al. / Cement and Concrete Research 60 (2014) 30–36
The concentrations of NO and NO2 dropped by approximately 10% ofthe initial gas concentration, or ~100 ppb and ~130 ppb respectively onaverage, during the period of the experiment. The rate of this decrease,thus the difference between the base NOx supply and the concentrationwith the pore solution, was relatively consistent throughout the exper-iment which lasted more than 15 h. This suggests that some of the NOand NO2 gas molecules were taken constantly into pore solution, withthe NO2 gas being lost in greater quantities by 30 ppb. The decreasedamounts of NO and NO2 in pore solution during the full experimentduration were calculated, and they were determined to be 31 μmoland 43 μmol per kilogram of synthetic solution respectively; that is,the rates of NO and NO2 decrease were determined to be 1.79 μmol/hand 2.77 μmol/h. However, this absorption rate exceeds the conven-tional solubility of NO and NO2 in water. Henry's constant for the NOand NO2, thus their solubility in water, have been reported to be0.0019 mol/kg bar [24] and 0.012–0.041 mol/kg bar [25,26], respective-ly. It can be calculated that 1100 kg and 65–220 kg of water are neededto hydrolyze the same amount ofNO andNO2, respectively, asmeasuredin the pore solution experiment. This suggests that the composition andhigh ionic concentration of the synthetic pore solution, aswell as chang-es in these with the hydrolysis of NO and NO2, might have played a rolein additional decrease in gas concentration in the reactor. Kameoka andPigford [27] observed similar increases in NO2 solubilities in industrial-type solutions, such as sodium sulfite. Also, the alkaline pH of the solu-tion and low gas concentration (1 ppm) could have affected the solubil-ity of gases. However, it should be noted that the amount, chemicalcomposition, and accessibility of pore solution in actual cement-basedmaterials would be different from this idealized case of bath of synthetic
Fig. 7. (a) Change in NO2 gas concentration on wet cement paste samples with time;(b) change in NO2 gas concentration on dry cement paste samples with time.
pore solution, and these results should be understood qualitatively.From this experiment, it can be concluded that the pore solution canplay a role in the binding of NO and NO2, but that this process is justone of the mechanisms – and perhaps a minor one – by which NOxcan be bound in cementitious system.
The proposed NO2 binding mechanisms are illustrated in Fig. 9.Please note that the structure of the cement-based material has beenhighly simplified. This figure conveys the reasoning that the NO2 gasmolecules are more readily adsorbed onto hardened cement pastestructures than hydrolyzed into the pore solution. In addition to sorbingto the cementitious solids, due to its polarity, the NO2 gasmolecules canbe stacked in layers on the solid surfaces. As shown in the pore solutionstudies presented here, the NO2 is also hydrolyzed into the pore solu-tion, where it remains as soluble nitrate ions or could potentially reactwith other ions and could eventually precipitate out.
Focusing on the NO2 gas exposure cases, it is interesting to comparethe results of theNO2 binding series (Fig. 7) to those of the photocatalyt-ic series (Fig. 4). The NO2 drop due to binding was ~37% from the initial~1000 ppbwhen the cement samples were inserted. The NO2 photocat-alytic efficiencywas ~25–30%. Although these data cannot be comparedquantitatively due to the differences in the experimental procedures(i.e., the measurements in the photocatalytic series were started onlyonce the gas is fully stabilized or after the gas was bound in cementi-tious material), even a qualitative comparison allows for the observa-tion that the amount of NO2 bound in cement paste is on the order ofthe amount that is oxidized due to the TiO2 photocatalytic reaction. It
Fig. 8. (a) Change in NO gas concentration on synthetic pore solution with time;(b) change in NO2 gas concentration on synthetic pore solution with time.

Fig. 9. NO2 sorption on hardened cement paste as well as into pore solution.
36 B.Y. Lee et al. / Cement and Concrete Research 60 (2014) 30–36
should also be noted from Fig. 7 that the NO2 is bound into the cementpaste continuously throughout the 5 hour experimental period. Thissuggests that, even in the absence of photocatalysis, cement pastescan bind a significant amount of NO2 and that this binding can continueover relatively long exposure times.
4. Conclusions
In this paper, the photocatalytic efficiency and NOx binding capacityof TiO2-containing cement-based materials under NO and NO2 gaseswere experimentally examined.
In the photocatalysis series, similar amounts of NO and NO2 gaseswere oxidized at 3 h, regardless of variations in w/c, suggesting thatthe TiO2 bearing cementitious materials are capable of oxidizing bothgases efficiently. However, some variations were observed between dif-ferent w/c pastes for the NO case at early exposure, and it is proposedthat the higher surface area for the high w/c pastes increases theamount of gas that can be sorbed which can potentially be oxidized.This was not observed for the NO2 case, and it is hypothesized that themore polar NO2 is sorbed more rapidly and sample porosity, as con-trolled by w/c, does not limit the oxidation rate.
In theNO andNO2 binding series, theNO2 gas had a greater potentialto be bound into cementitious materials than the NO gas. It is proposed,again, that this is due to the higher dipole moment of NO2. It was foundthat the cement pore solution takes in part of the NO andNO2 gases, butthe amount was negligible compared to the gas bound on hardenedcement paste. It was also found that the rate of NO2 binding was fasterat early exposure in the case of dry samples than in the wet samples,suggesting that the NO2 gas is more easily bound to hardened cementpaste than into pore solution.
Comparing both series for the NO2 case, it can be concluded thatthe amount of NO2 bound into the cementitious material is comparableto the amount oxidized by photocatalytic reaction. The great potentialof the NO2 gas to bind into cement-based materials suggests, on thebasis of its contribution to reductions in atmospheric NOx, that thecontributions of cement-based materials to air quality should be re-examined.
Overall, these results demonstrate that the TiO2-containing cementi-tious materials can potentially decrease NOx levels in the air, not only
through photocatalysis, but also through binding NOx within thecementitious materials. It is suggested, from this research, that thesurface area of cement-based materials can be tailored to enhanceboth NO and NO2 gas oxidation and binding.
Acknowledgments
This material is based upon work supported by the National ScienceFoundation under Grant No. CMMI-0825373. Any opinions, findings,and conclusions or recommendations expressed in this material arethose of the authors and do not necessarily reflect the views of theNational Science Foundation.
References
[1] WHO, Air quality guidelines, Global Update 2005, World Health Organization, 2005.[2] C.S. Poon, E. Cheung, NO removal efficiency of photocatalytic paving blocks prepared
with recycled materials, Constr. Build. Mater. 21 (8) (2007) 1746–1753.[3] T. Maggos, et al., Application of photocatalytic technology for NOx removal, Appl.
Phys. A 89 (1) (2007) 81–84.[4] A. Fujishima, X.T. Zhang, D.A. Tryk, TiO2 photocatalysis and related surface phenom-
ena, Surf. Sci. Rep. 63 (12) (2008) 515–582.[5] M.M. Ballari, et al., NOx photocatalytic degradation employing concrete pavement
containing titanium dioxide, Appl. Catal. B Environ. 95 (3–4) (2010) 245–254.[6] M.M. Hassan, et al., Evaluation of the durability of titanium dioxide photocatalyst
coating for concrete pavement, Constr. Build. Mater. 24 (8) (2010) 1456–1461.[7] A.M. Ramirez, et al., Titanium dioxide coated cementitiousmaterials for air purifying
purposes: preparation, characterization and toluene removal potential, Build.Environ. 45 (4) (2010) 832–838.
[8] J.S. Dalton, et al., Photocatalytic oxidation of NOx gases using TiO2: a surfacespectroscopic approach, Environ. Pollut. 120 (2002) 415–422.
[9] O. Carp, C.L. Huisman, A. Reller, Photoinduced reactivity of titanium dioxide, Prog.Solid State Chem. 32 (1–2) (2004) 33–177.
[10] ISO, Fine ceramics (advanced ceramics, advanced technical ceramics)— test methodfor air-purification performance of semiconducting photocatalytic materials, Part 1:Removal of nitric oxide, 2007.
[11] JIS, Fine ceramics (advanced ceramics, advanced technical ceramics) — test methodfor air purification performance of photocatalytic materials, Part 1: Removal of nitricoxide, 2004.
[12] X. Yao, et al., The use of tunnel concentration profile data to determine the ratio ofNO2/NOx directly emitted from vehicles, Atmos. Chem. Phys. Discuss. 5 (6) (2005)12723–12740.
[13] USEPA, Nitrogen dioxide, [cited 2013 Jan. 03]; Available from: http://www.epa.gov/airquality/nitrogenoxides/ .
[14] L. Cassar, Photocatalysis of cementitious materials: clean buildings and clean air,MRS Bull. 29 (5) (2004) 328–331.
[15] F. Vallee, et al., Innovative self-cleaning and de-polluting facade surfaces, CIB WorldBuilding Congress, 2004, (Toronto, Canada).
[16] T. Yoshio, et al., NOx removal with titanium dioxide coating on acoustic materialcomposed of waste polystyrene foam and cement, J. Jpn. Soc. Atmos. Environ. 38(4) (2003) 227–235.
[17] T.C. Powers, Structure and physical properties of hardened Portland cement paste, J.Am. Ceram. Soc. 41 (1) (1958) 1–6.
[18] J. Chen, C.S. Poon, Photocatalytic activity of titanium dioxide modified concretematerials — influence of utilizing recycled glass cullets as aggregates, J. Environ.Manag. 90 (11) (2009) 3436–3442.
[19] S. Devahasdin, et al., TiO2 photocatalytic oxidation of nitric oxide: transient behaviorand reaction kinetics, J. Photochem. Photobiol. A Chem. 156 (1–3) (2003) 161–170.
[20] S. Laufs, et al., Conversion of nitrogen oxides on commercial photocatalytic disper-sion paints, Atmos. Environ. 44 (19) (2010) 2341–2349.
[21] A.R. Hoy, J.W.C. Johns, A.R.W. McKellar, Stark spectroscopy with the CO laser: dipolemoments, hyperfine structure, and level crossing effects in the fundamental band ofNO, Can. J. Phys. 53 (19) (1975) 2029–2039.
[22] J.A. Hodgeson, E.E. Sibert, R.F. Curl, Dipole moment of nitrogen dioxide, J. Phys.Chem. 67 (12) (1963) 2833–2835.
[23] K.E. Kurtis, et al., Imaging of ASR gel by soft X-ray microscopy, Cem. Concr. Res. 28(3) (1998) 411–421.
[24] J.N. Armor, Influence of pH and ionic strength upon solubility of nitric oxide inaqueous solution, J. Chem. Eng. Data 19 (1) (1974) 82–84.
[25] W.L. Chameides, The photochemistry of a remote marine stratiform cloud, J.Geophys. Res. 89 (D3) (1984) 4739–4755.
[26] Y.N. Lee, S.E. Schwartz, Reaction kinetics of nitrogen dioxide with liquidwater at lowpartial pressure, J. Phys. Chem. 85 (7) (1981) 840–848.
[27] Y. Kameoka, R.L. Pigford, Absorption of nitrogen dioxide into water, sulfuric acid,sodium hydroxide, and alkaline sodium sulfite aqueous solutions, Ind. Eng. Chem.Fundam. 16 (1) (1977) 163–169