phosphorus flame retardants: properties, production, environmental occurrence...
TRANSCRIPT

Chemosphere 88 (2012) 1119–1153
Contents lists available at SciVerse ScienceDirect
Chemosphere
journal homepage: www.elsevier .com/locate /chemosphere
Review
Phosphorus flame retardants: Properties, production, environmentaloccurrence, toxicity and analysis
Ike van der Veen ⇑, Jacob de BoerVU University, Institute for Environmental Studies (IVM), De Boelelaan 1087, 1081 HV, Amsterdam, The Netherlands
a r t i c l e i n f o
Article history:Received 23 December 2011Received in revised form 22 March 2012Accepted 26 March 2012Available online 25 April 2012
Keywords:PFRPhosphorus flame retardantPropertiesOccurrenceToxicityAnalysis
0045-6535/$ - see front matter � 2012 Elsevier Ltd. Ahttp://dx.doi.org/10.1016/j.chemosphere.2012.03.067
⇑ Corresponding author.E-mail addresses: [email protected] (I. va
a b s t r a c t
Since the ban on some brominated flame retardants (BFRs), phosphorus flame retardants (PFRs), whichwere responsible for 20% of the flame retardant (FR) consumption in 2006 in Europe, are often proposedas alternatives for BFRs. PFRs can be divided in three main groups, inorganic, organic and halogencontaining PFRs. Most of the PFRs have a mechanism of action in the solid phase of burning materials(char formation), but some may also be active in the gas phase. Some PFRs are reactive FRs, which meansthey are chemically bound to a polymer, whereas others are additive and mixed into the polymer. Thefocus of this report is limited to the PFRs mentioned in the literature as potential substitutes for BFRs.The physico-chemical properties, applications and production volumes of PFRs are given. Non-haloge-nated PFRs are often used as plasticisers as well. Limited information is available on the occurrence ofPFRs in the environment. For triphenyl phosphate (TPhP), tricresylphosphate (TCP), tris(2-chloro-ethyl)phosphate (TCEP), tris(chloropropyl)phosphate (TCPP), tris(1,3-dichloro-2-propyl)phosphate(TDCPP), and tetrekis(2-chlorethyl)dichloroisopentyldiphosphate (V6) a number of studies have beenperformed on their occurrence in air, water and sediment, but limited data were found on their occur-rence in biota. Concentrations found for these PFRs in air were up to 47 lg m�3, in sediment levels upto 24 mg kg�1 were found, and in surface water concentrations up to 379 ng L�1. In all these matricesTCPP was dominant. Concentrations found in dust were up to 67 mg kg�1, with TDCPP being the domi-nant PFR. PFR concentrations reported were often higher than polybrominated diphenylether (PBDE) con-centrations, and the human exposure due to PFR concentrations in indoor air appears to be higher thanexposure due to PBDE concentrations in indoor air.
Only the Cl-containing PFRs are carcinogenic. Other negative human health effects were found forCl-containing PFRs as well as for TCP, which suggest that those PFRs would not be suitable alternativesfor BFRs. TPhP, diphenylcresylphosphate (DCP) and TCP would not be suitable alternatives either, becausethey are considered to be toxic to (aquatic) organisms. Diethylphosphinic acid is, just like TCEP, consid-ered to be very persistent. From an environmental perspective, resorcinol-bis(diphenylphosphate) (RDP),bisphenol-A diphenyl phosphate (BADP) and melamine polyphosphate, may be suitable good substitutesfor BFRs.
Information on PFR analysis in air, water and sediment is limited to TCEP, TCPP, TPhP, TCP and someother organophosphate esters. For air sampling passive samplers have been used as well as solid phaseextraction (SPE) membranes, SPE cartridges, and solid phase micro-extraction (SPME).
For extraction of PFRs from water SPE is recommended, because this method gives good recoveries(67–105%) and acceptable relative standard deviations (RSDs) (<20%), and offers the option of on-linecoupling with a detection system. For the extraction of PFRs from sediment microwave-assisted extrac-tion (MAE) is recommended. The recoveries (78–105%) and RSDs (3–8%) are good and the method is fas-ter and requires less solvent compared to other methods.
For the final instrumental analysis of PFRs, gas chromatography–flame photometric detection(GC–FPD), GC-nitrogen–phosphorus detection (NPD), GC–atomic emission detection (AED), GC–mass
ll rights reserved.
n der Veen), [email protected] (J. de Boer).

1120 I. van der Veen, J. de Boer / Chemosphere 88 (2012) 1119–1153
spectrometry (MS) as well as liquid chromatography (LC)–MS/MS and GC–Inductively-coupled plasma–MS (ICP–MS) are used. GC–ICP–MS is a promising method, because it provides much less complexchromatograms while offering the same recoveries and limits of detection (LOD) (instrumental LOD is5–10 ng mL�1) compared to GC–NPD and GC–MS, which are frequently used methods for PFR analysis.GC–MS offers a higher selectivity than GC–NPD and the possibility of using isotopically labeledcompounds for quantification.
� 2012 Elsevier Ltd. All rights reserved.
Contents
1. Introduction . . . . . . . . . . . . . . . . . . . . . . . . . . . . . . . . . . . . . . . . . . . . . . . . . . . . . . . . . . . . . . . . . . . . . . . . . . . . . . . . . . . . . . . . . . . . . . . . . . . . . . . . 11212. Characteristics . . . . . . . . . . . . . . . . . . . . . . . . . . . . . . . . . . . . . . . . . . . . . . . . . . . . . . . . . . . . . . . . . . . . . . . . . . . . . . . . . . . . . . . . . . . . . . . . . . . . . . 1121
2.1. Physicochemical properties . . . . . . . . . . . . . . . . . . . . . . . . . . . . . . . . . . . . . . . . . . . . . . . . . . . . . . . . . . . . . . . . . . . . . . . . . . . . . . . . . . . . . . 11242.2. Flame retarding mechanisms . . . . . . . . . . . . . . . . . . . . . . . . . . . . . . . . . . . . . . . . . . . . . . . . . . . . . . . . . . . . . . . . . . . . . . . . . . . . . . . . . . . . . 11242.3. Potential substitutes for PBDEs? . . . . . . . . . . . . . . . . . . . . . . . . . . . . . . . . . . . . . . . . . . . . . . . . . . . . . . . . . . . . . . . . . . . . . . . . . . . . . . . . . . 1125
2.3.1. Phosphorus flame retardants . . . . . . . . . . . . . . . . . . . . . . . . . . . . . . . . . . . . . . . . . . . . . . . . . . . . . . . . . . . . . . . . . . . . . . . . . . . . . . . 11252.3.2. Halogen containing phosphorus flame retardants . . . . . . . . . . . . . . . . . . . . . . . . . . . . . . . . . . . . . . . . . . . . . . . . . . . . . . . . . . . . . . 1125
3. Production and use . . . . . . . . . . . . . . . . . . . . . . . . . . . . . . . . . . . . . . . . . . . . . . . . . . . . . . . . . . . . . . . . . . . . . . . . . . . . . . . . . . . . . . . . . . . . . . . . . . 1126
3.1. Applications . . . . . . . . . . . . . . . . . . . . . . . . . . . . . . . . . . . . . . . . . . . . . . . . . . . . . . . . . . . . . . . . . . . . . . . . . . . . . . . . . . . . . . . . . . . . . . . . . . . 11263.2. Production volumes . . . . . . . . . . . . . . . . . . . . . . . . . . . . . . . . . . . . . . . . . . . . . . . . . . . . . . . . . . . . . . . . . . . . . . . . . . . . . . . . . . . . . . . . . . . . 11274. Occurrence and behavior in the environment . . . . . . . . . . . . . . . . . . . . . . . . . . . . . . . . . . . . . . . . . . . . . . . . . . . . . . . . . . . . . . . . . . . . . . . . . . . . . 1128
4.1. Non-halogen PFRs . . . . . . . . . . . . . . . . . . . . . . . . . . . . . . . . . . . . . . . . . . . . . . . . . . . . . . . . . . . . . . . . . . . . . . . . . . . . . . . . . . . . . . . . . . . . . . 11284.1.1. Resorcinol-bis(diphenylphosphate) . . . . . . . . . . . . . . . . . . . . . . . . . . . . . . . . . . . . . . . . . . . . . . . . . . . . . . . . . . . . . . . . . . . . . . . . . . 11284.1.2. Bisphenol-A diphenyl phosphate . . . . . . . . . . . . . . . . . . . . . . . . . . . . . . . . . . . . . . . . . . . . . . . . . . . . . . . . . . . . . . . . . . . . . . . . . . . . 11284.1.3. Triphenyl phosphate. . . . . . . . . . . . . . . . . . . . . . . . . . . . . . . . . . . . . . . . . . . . . . . . . . . . . . . . . . . . . . . . . . . . . . . . . . . . . . . . . . . . . . 11284.1.4. Diphenylcresylphosphate . . . . . . . . . . . . . . . . . . . . . . . . . . . . . . . . . . . . . . . . . . . . . . . . . . . . . . . . . . . . . . . . . . . . . . . . . . . . . . . . . . 11294.1.5. Melamine polyphosphate. . . . . . . . . . . . . . . . . . . . . . . . . . . . . . . . . . . . . . . . . . . . . . . . . . . . . . . . . . . . . . . . . . . . . . . . . . . . . . . . . . 11294.1.6. Diethylphosphinic acid. . . . . . . . . . . . . . . . . . . . . . . . . . . . . . . . . . . . . . . . . . . . . . . . . . . . . . . . . . . . . . . . . . . . . . . . . . . . . . . . . . . . 11294.1.7. Tricresylphosphate . . . . . . . . . . . . . . . . . . . . . . . . . . . . . . . . . . . . . . . . . . . . . . . . . . . . . . . . . . . . . . . . . . . . . . . . . . . . . . . . . . . . . . . 1129
4.2. Halogen containing PFRs. . . . . . . . . . . . . . . . . . . . . . . . . . . . . . . . . . . . . . . . . . . . . . . . . . . . . . . . . . . . . . . . . . . . . . . . . . . . . . . . . . . . . . . . . 1130
4.2.1. Tris(chloropropyl)phosphate . . . . . . . . . . . . . . . . . . . . . . . . . . . . . . . . . . . . . . . . . . . . . . . . . . . . . . . . . . . . . . . . . . . . . . . . . . . . . . . 11304.2.2. Tris(2-chloroethyl)phosphate. . . . . . . . . . . . . . . . . . . . . . . . . . . . . . . . . . . . . . . . . . . . . . . . . . . . . . . . . . . . . . . . . . . . . . . . . . . . . . . 11314.2.3. Tris(1,3-dichloro-2-propyl)phosphate . . . . . . . . . . . . . . . . . . . . . . . . . . . . . . . . . . . . . . . . . . . . . . . . . . . . . . . . . . . . . . . . . . . . . . . . 11314.2.4. Tetrekis(2-chlorethyl)dichloroisopentyldiphosphate . . . . . . . . . . . . . . . . . . . . . . . . . . . . . . . . . . . . . . . . . . . . . . . . . . . . . . . . . . . . 11334.3. Summary of PFR levels in the environment . . . . . . . . . . . . . . . . . . . . . . . . . . . . . . . . . . . . . . . . . . . . . . . . . . . . . . . . . . . . . . . . . . . . . . . . . 1136
5. Toxicological information . . . . . . . . . . . . . . . . . . . . . . . . . . . . . . . . . . . . . . . . . . . . . . . . . . . . . . . . . . . . . . . . . . . . . . . . . . . . . . . . . . . . . . . . . . . . . 11365.1. Non-halogen PFRs . . . . . . . . . . . . . . . . . . . . . . . . . . . . . . . . . . . . . . . . . . . . . . . . . . . . . . . . . . . . . . . . . . . . . . . . . . . . . . . . . . . . . . . . . . . . . . 1136
5.1.1. Resorcinol-bis(diphenylphosphate) . . . . . . . . . . . . . . . . . . . . . . . . . . . . . . . . . . . . . . . . . . . . . . . . . . . . . . . . . . . . . . . . . . . . . . . . . . 11365.1.2. Bisphenol-A diphenyl phosphate . . . . . . . . . . . . . . . . . . . . . . . . . . . . . . . . . . . . . . . . . . . . . . . . . . . . . . . . . . . . . . . . . . . . . . . . . . . . 11365.1.3. Triphenyl phosphate. . . . . . . . . . . . . . . . . . . . . . . . . . . . . . . . . . . . . . . . . . . . . . . . . . . . . . . . . . . . . . . . . . . . . . . . . . . . . . . . . . . . . . 11375.1.4. Diphenylcresylphosphate . . . . . . . . . . . . . . . . . . . . . . . . . . . . . . . . . . . . . . . . . . . . . . . . . . . . . . . . . . . . . . . . . . . . . . . . . . . . . . . . . . 11375.1.5. Melamine polyphosphate. . . . . . . . . . . . . . . . . . . . . . . . . . . . . . . . . . . . . . . . . . . . . . . . . . . . . . . . . . . . . . . . . . . . . . . . . . . . . . . . . . 11375.1.6. Diethylphosphinic acid. . . . . . . . . . . . . . . . . . . . . . . . . . . . . . . . . . . . . . . . . . . . . . . . . . . . . . . . . . . . . . . . . . . . . . . . . . . . . . . . . . . . 11375.1.7. Tricresylphosphate . . . . . . . . . . . . . . . . . . . . . . . . . . . . . . . . . . . . . . . . . . . . . . . . . . . . . . . . . . . . . . . . . . . . . . . . . . . . . . . . . . . . . . . 11385.2. Halogen containing PFRs. . . . . . . . . . . . . . . . . . . . . . . . . . . . . . . . . . . . . . . . . . . . . . . . . . . . . . . . . . . . . . . . . . . . . . . . . . . . . . . . . . . . . . . . . 1138
5.2.1. Tris(chloropropyl)phosphate . . . . . . . . . . . . . . . . . . . . . . . . . . . . . . . . . . . . . . . . . . . . . . . . . . . . . . . . . . . . . . . . . . . . . . . . . . . . . . . 11385.2.2. Tris(2-chloroethyl)phosphate. . . . . . . . . . . . . . . . . . . . . . . . . . . . . . . . . . . . . . . . . . . . . . . . . . . . . . . . . . . . . . . . . . . . . . . . . . . . . . . 11385.2.3. Tris(1,3-dichloro-2-propyl)phosphate . . . . . . . . . . . . . . . . . . . . . . . . . . . . . . . . . . . . . . . . . . . . . . . . . . . . . . . . . . . . . . . . . . . . . . . . 11385.2.4. Tetrekis(2-chlorethyl)dichloroisopentyldiphosphate . . . . . . . . . . . . . . . . . . . . . . . . . . . . . . . . . . . . . . . . . . . . . . . . . . . . . . . . . . . . 11396. PFRs versus BFRs . . . . . . . . . . . . . . . . . . . . . . . . . . . . . . . . . . . . . . . . . . . . . . . . . . . . . . . . . . . . . . . . . . . . . . . . . . . . . . . . . . . . . . . . . . . . . . . . . . . . 11397. Environmental analytical methods . . . . . . . . . . . . . . . . . . . . . . . . . . . . . . . . . . . . . . . . . . . . . . . . . . . . . . . . . . . . . . . . . . . . . . . . . . . . . . . . . . . . . . 1139
7.1. Sampling and extraction . . . . . . . . . . . . . . . . . . . . . . . . . . . . . . . . . . . . . . . . . . . . . . . . . . . . . . . . . . . . . . . . . . . . . . . . . . . . . . . . . . . . . . . . . 1139
7.1.1. Air . . . . . . . . . . . . . . . . . . . . . . . . . . . . . . . . . . . . . . . . . . . . . . . . . . . . . . . . . . . . . . . . . . . . . . . . . . . . . . . . . . . . . . . . . . . . . . . . . . . . 11397.1.2. Water. . . . . . . . . . . . . . . . . . . . . . . . . . . . . . . . . . . . . . . . . . . . . . . . . . . . . . . . . . . . . . . . . . . . . . . . . . . . . . . . . . . . . . . . . . . . . . . . . . 11407.1.3. Sediment . . . . . . . . . . . . . . . . . . . . . . . . . . . . . . . . . . . . . . . . . . . . . . . . . . . . . . . . . . . . . . . . . . . . . . . . . . . . . . . . . . . . . . . . . . . . . . . 11407.1.4. Biota . . . . . . . . . . . . . . . . . . . . . . . . . . . . . . . . . . . . . . . . . . . . . . . . . . . . . . . . . . . . . . . . . . . . . . . . . . . . . . . . . . . . . . . . . . . . . . . . . . 11417.2. Analysis . . . . . . . . . . . . . . . . . . . . . . . . . . . . . . . . . . . . . . . . . . . . . . . . . . . . . . . . . . . . . . . . . . . . . . . . . . . . . . . . . . . . . . . . . . . . . . . . . . . . . . 1141
7.2.1. Air . . . . . . . . . . . . . . . . . . . . . . . . . . . . . . . . . . . . . . . . . . . . . . . . . . . . . . . . . . . . . . . . . . . . . . . . . . . . . . . . . . . . . . . . . . . . . . . . . . . . 11417.2.2. Water. . . . . . . . . . . . . . . . . . . . . . . . . . . . . . . . . . . . . . . . . . . . . . . . . . . . . . . . . . . . . . . . . . . . . . . . . . . . . . . . . . . . . . . . . . . . . . . . . . 11417.2.3. Sediment . . . . . . . . . . . . . . . . . . . . . . . . . . . . . . . . . . . . . . . . . . . . . . . . . . . . . . . . . . . . . . . . . . . . . . . . . . . . . . . . . . . . . . . . . . . . . . . 11427.2.4. Biota . . . . . . . . . . . . . . . . . . . . . . . . . . . . . . . . . . . . . . . . . . . . . . . . . . . . . . . . . . . . . . . . . . . . . . . . . . . . . . . . . . . . . . . . . . . . . . . . . . 11427.2.5. Motor oil . . . . . . . . . . . . . . . . . . . . . . . . . . . . . . . . . . . . . . . . . . . . . . . . . . . . . . . . . . . . . . . . . . . . . . . . . . . . . . . . . . . . . . . . . . . . . . . 11427.3. Advantages and disadvantages of PFR analysis techniques . . . . . . . . . . . . . . . . . . . . . . . . . . . . . . . . . . . . . . . . . . . . . . . . . . . . . . . . . . . . . 11427.4. Precautions . . . . . . . . . . . . . . . . . . . . . . . . . . . . . . . . . . . . . . . . . . . . . . . . . . . . . . . . . . . . . . . . . . . . . . . . . . . . . . . . . . . . . . . . . . . . . . . . . . . 11437.5. Conclusions . . . . . . . . . . . . . . . . . . . . . . . . . . . . . . . . . . . . . . . . . . . . . . . . . . . . . . . . . . . . . . . . . . . . . . . . . . . . . . . . . . . . . . . . . . . . . . . . . . . 1143
Appendix A. Physicochemical properties of PFRs . . . . . . . . . . . . . . . . . . . . . . . . . . . . . . . . . . . . . . . . . . . . . . . . . . . . . . . . . . . . . . . . . . . . . . . . . . . . . 1144Appendix B. Applications of PFRs . . . . . . . . . . . . . . . . . . . . . . . . . . . . . . . . . . . . . . . . . . . . . . . . . . . . . . . . . . . . . . . . . . . . . . . . . . . . . . . . . . . . . . . . . 1147Appendix C. Air sampling, extraction and detection methods for PFRs . . . . . . . . . . . . . . . . . . . . . . . . . . . . . . . . . . . . . . . . . . . . . . . . . . . . . . . . . . . 1148Appendix D. Water sampling, extraction and detection methods for PFRs . . . . . . . . . . . . . . . . . . . . . . . . . . . . . . . . . . . . . . . . . . . . . . . . . . . . . . . . 1149

FT
I. van der Veen, J. de Boer / Chemosphere 88 (2012) 1119–1153 1121
Appendix E. Sediment sampling, extraction and detection methods for PFRs . . . . . . . . . . . . . . . . . . . . . . . . . . . . . . . . . . . . . . . . . . . . . . . . . . . . . . 1150Appendix F. Biota sampling, extraction and detection methods for PFRs. . . . . . . . . . . . . . . . . . . . . . . . . . . . . . . . . . . . . . . . . . . . . . . . . . . . . . . . . . 1150References . . . . . . . . . . . . . . . . . . . . . . . . . . . . . . . . . . . . . . . . . . . . . . . . . . . . . . . . . . . . . . . . . . . . . . . . . . . . . . . . . . . . . . . . . . . . . . . . . . . . . . . . . . . . . . 1151
1. Introduction
Flame retardants (FRs), which are chemicals added to materialsboth to prevent combustion and to delay the spread of fire afterignition, are used in polymers since the 1960s (Kemmlein et al.,2003; EFRA, 2007). To meet fire safety standards, set up in regula-tions like the California Technical Bulletin (TB) 117 for furniture(BHFTI, 2000), and the Underwriters’ Laboratories 94, (UL94), theStandard for safety of flammability of plastic materials for partsin devices and appliances (US-EPA, 2007) FR are used more andmore. FRs may have different compositions. They may containhalogens (bromine and chlorine), phosphorus, nitrogen, metals,minerals based on aluminum and magnesium, or they may bebased on borax, antimony trioxide, molybdenum, or the FR maybe a nanocomposite (EFRA, 2007).
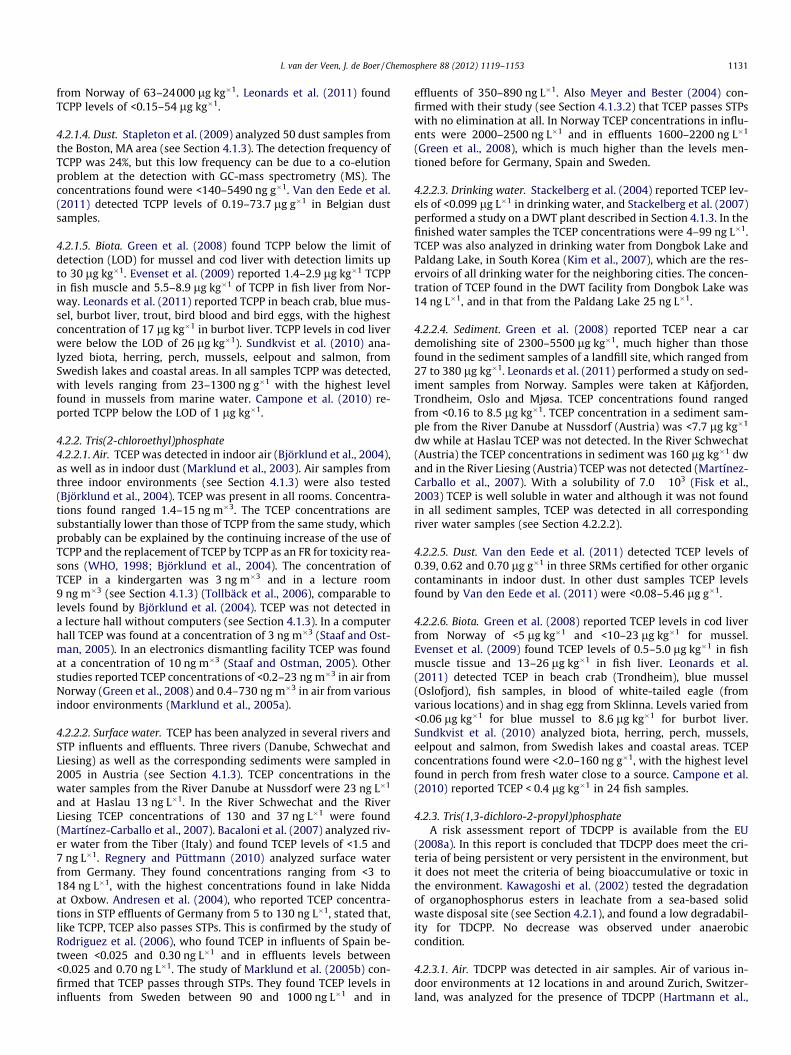
According to the European Flame Retardants Association (EFRA)(CEFIC, 2007), the total consumption of FRs in Europe in 2006 was465000 tonnes, of which 10% were brominated flame retardants(BFRs) (Fig. 1). Many halogenated chemicals, such as some BFRsand polychlorinated biphenyls (PCBs), have proven to be persis-tent, bioaccumulative, and/or toxic in the environment, and toanimals and humans. For over four decades, halogenated FRs havebeen in the focus of concern for public health, resulting in theproduction of PCBs being forbidden in 1973 (Aresta et al., 2003).Nowadays the production and use of BFRs are restricted moreand more by the European Union (EU) and they have been volun-tary phased out in the USA (BSEF, 2011). The production of penta-BDE mixtures has been forbidden in the EU in 2003 (EU, 2003), andthe use of the frequently used decabromodiphenyl ether (decaBDE)in electrical and electrical equipment has been forbidden in Europe(Betts, 2008). In 2009 the United Nations Environment Programme(UNEP) has decided in a meeting of the parties of the StockholmConvention on persistent organic pollutants (POPs) that octaBDEand pentaBDE are officially labeled as POPs (decision SC-4/14,SC-4/18 (UNEP, 2009)). These developments have urged the useof alternatives for these BFRs.
Phosphorus flame retardants (PFRs), which have already beenused for over 150 years (Andrae, 2007), are considered as suitablealternatives for BFRs. Because of the need for vapor-phase activity,a number of volatile PFRs, tributyl phosphate (TBP), triphenylphosphate (TPhP), and triphenylphosphine oxide (TPPO), havebeen identified as possible substitutes for bromine-containingformulations used in textile back-coatings (Horrocks et al., 2007).
3%3% 3%
7%Metal hydroxides Non halogen PFRs
10% Chlorinated PFRsBFRs
54% Chlorinated paraffins
11%Borates and stannatesAntimony trioxide
9%
Melamine based FRs
ig. 1. Industry estimate of total consumption of flame retardants in Europe 2006.otal = 465000 metric tonnes (CEFIC, 2007).
PFRs, in 2006 responsible for 20% of the FR consumption inEurope (Fig. 1) cannot only be applied in a wider range of fibertypes in textile (Andrae, 2007), but are also compatible with otherprocessing chemicals, and are easy to use (Andrae, 2007). Some ofthe PFRs facilitate the recyclability of printed circuit boards, as it ismore feasible, and cost effective to recover copper from halogenfree circuit boards (McPherson et al., 2004). Not only several BFRsare being replaced by PFRs, but also the halogen containing PFRsmay need to be substituted by non-halogenated PFRs. McPhersonet al. (2004) mention, as an example, the substitution of tris(2-chloroethyl)phosphate (TCEP), and tris(chloropropyl)phosphate(TCPP) with boiling points of 351 �C and 342 �C by resorcinol-bis(diphenylphosphate) (RDP) with boiling point 587 �C becauseit is less volatile, and therefore less likely to be released into theenvironment.
The human and environmental impacts differ from one phos-phorus compound to another. Red phosphorus (RP), and ammo-nium polyphosphate (APP) are the least problematic FRs to use,but some health effects of PFRs cannot be ignored (McPhersonet al., 2004).
If PFRs would be used as an alternative for PBDEs, it is importantto avoid compounds, which are more persistent, bioaccumulativeand toxic to humans and to the environment than BFRs. Pakalinet al. (2007) reported 27 potential substitutes for decaBDE, ofwhich 16 are halogenated and 11 are non-halogenated. From these27 chemicals, 6 were organo PFRs, e.g. RDP, bisphenol-A diphenylphosphate (BADP), TPhP, diphenylcresylphosphate (DCP), mela-mine polyphosphate, and diethylphosphinic acid. The first threeof these were also suggested by McPherson et al. (2004) as BFRalternatives for acrylonitrile–butadiene-styrene (ABS)/polycarbon-ate (pc) plastics. The German Federal Environmental Agencycarried out a research project on substitution of hazardous FRs.The examined FRs included the earlier mentioned RDP, but alsothe halogenated PFR TCPP (Leisewitz et al., 2000). TCPP, tris(1,3-di-chloro-2-propyl)phosphate (TDCPP) and tetrekis(2-chlorethyl)dic-hloroisopentyldiphosphate (V6) are mentioned by the ScientificCommittee on Health and Environmental Risks (SCHER, 2007a) tobe potential substitutes of BFRs.
The focus of this report is limited to the PFRs as substitutes forPBDEs, with addition of tricresylphosphate (TCP) and the halogencontaining TCEP. The physiological properties, the occurrence,environmental fate, toxicological data and analytical methods forthese PFRs are described.
2. Characteristics
PFRs can be divided in three main groups. The first groupcontains the inorganic PFRs, including frequently used RP and
P
O
O
R
R
R1 2
3
P
O
O
O R
R
R1 2
3
P
O
O
OO
R
R R1 2
3
Phosphate esterPhosphonatePhosphinate
Fig. 2. General structure of organophosphorus flame retardants (EFRA, 2007).

Table 1Names and structures of the studied PFRs.
Structure Cas number Name Abbreviation used in literature
57583-54-7 – Resorcinol-bis(diphenyl)phosphate RDP125997-21-9 – Tetraphenyl resorcinol diphosphate
– Resorcinol diphenyl-phosphate– Tetraphenyl resorcinolbisphosphate– Tetraphenyl resorcinol bis(diphenylphosphate)– (3-diphenoxyphosphoryloxyphenyl) diphenyl phosphate– Phosphoric acid, 1,3-phenylene tetraphenyl ester– m-Phenylenebis(diphenyl phosphate)
5945-33-5 – Bisphenol-A diphenyl phosphate BADP181028-79-5 – Phosphoric acid, (1-methylethylidene) di-4,1-phenylene
tetraphenyl esterBAPP
BPADPBDP
115-86-6 – Triphenyl phosphate TPhP56803-37-3 – Triphenoxyphosphine oxide TPP
– Phosphoric acid, triphenyl ester– Triphenyl phosphoric acid ester– Triaryl phosphates butylated
68937-40-6 – Tertbutylphenyl diphenyl phosphate
26444-49-5 – Diphenylcresylphosphate DCP– Cresyl diphenyl phosphate CDP– Phosphoric acid methylphenyl diphenyl ester DPK– Diphenyl cresol phosphate– Diphenyl tolyl ester phosphoric acid– Diphenyl tolyl phosphate– Cresyl phenyl phosphate– Cresol diphenyl phosphate– Methyl phenyl diphenyl phosphate– Monocresyl diphenylphosphate– Phosphoric acid cresyl diphenyl ester– Tolyl diphenyl phosphate
218768-84-4 – Melamine phosphate– Melaminepolyphosphate
225789-38-8 – Diethylphosphinic acid
1330-78-5 – Tricresylphosphate: TCP, TCrPMixture of: – tri-o-cresylphosphate
– tri-m-cresylphosphate– tri-p-cresylphosphate
– Tritolyl phosphate– Trimethylphenyl phosphate– Phosphoric acid, tritolyl ester
78-30-8 – Tri-o-cresylphosphate o-TCP, TOCP, TOTP, ToCrP– Phosphoric acid tris(2-methylphenyl) ester– Tri-o-tolyl phosphate– Tri-2-tolyl phosphate– Tri-2-methyl-phenyl phosphate– Phosphoric acid, tri-o-tolyl ester
1122 I. van der Veen, J. de Boer / Chemosphere 88 (2012) 1119–1153
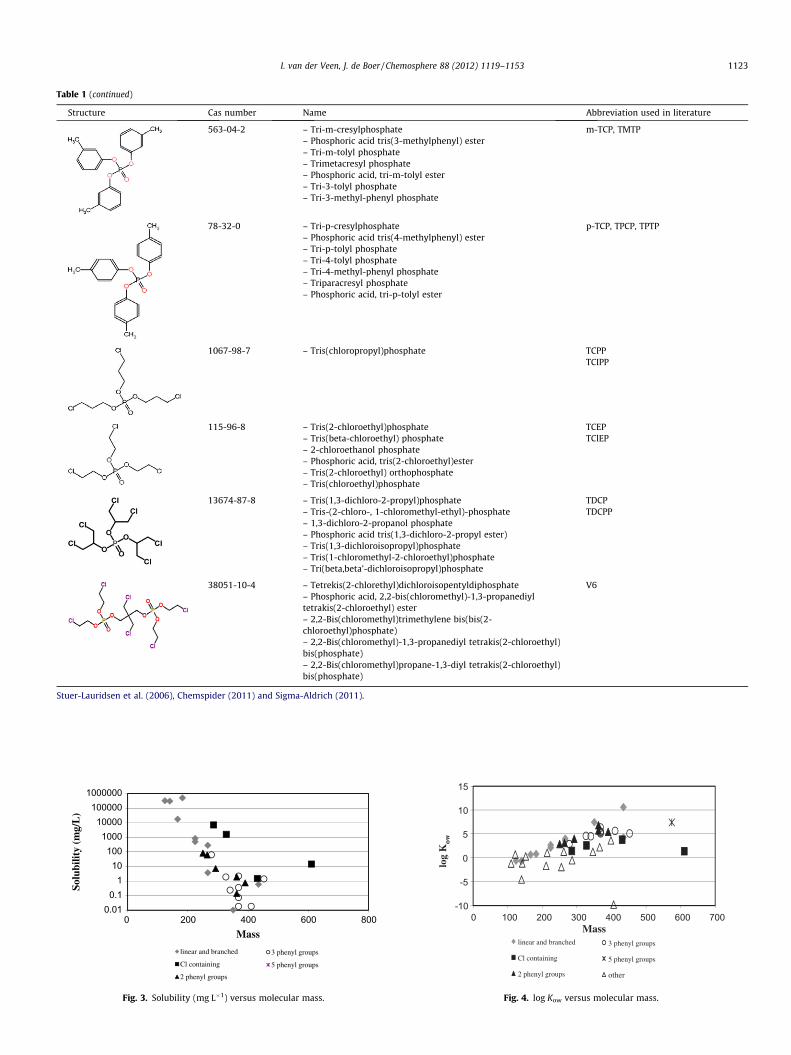
Table 1 (continued)
Structure Cas number Name Abbreviation used in literature
563-04-2 – Tri-m-cresylphosphate m-TCP, TMTP– Phosphoric acid tris(3-methylphenyl) ester– Tri-m-tolyl phosphate– Trimetacresyl phosphate– Phosphoric acid, tri-m-tolyl ester– Tri-3-tolyl phosphate– Tri-3-methyl-phenyl phosphate
78-32-0 – Tri-p-cresylphosphate p-TCP, TPCP, TPTP– Phosphoric acid tris(4-methylphenyl) ester– Tri-p-tolyl phosphate– Tri-4-tolyl phosphate– Tri-4-methyl-phenyl phosphate– Triparacresyl phosphate– Phosphoric acid, tri-p-tolyl ester
1067-98-7 – Tris(chloropropyl)phosphate TCPPTCIPP
115-96-8 – Tris(2-chloroethyl)phosphate TCEP– Tris(beta-chloroethyl) phosphate TClEP– 2-chloroethanol phosphate– Phosphoric acid, tris(2-chloroethyl)ester– Tris(2-chloroethyl) orthophosphate– Tris(chloroethyl)phosphate
13674-87-8 – Tris(1,3-dichloro-2-propyl)phosphate TDCP– Tris-(2-chloro-, 1-chloromethyl-ethyl)-phosphate TDCPP– 1,3-dichloro-2-propanol phosphate– Phosphoric acid tris(1,3-dichloro-2-propyl ester)– Tris(1,3-dichloroisopropyl)phosphate– Tris(1-chloromethyl-2-chloroethyl)phosphate– Tri(beta,beta’-dichloroisopropyl)phosphate
38051-10-4 – Tetrekis(2-chlorethyl)dichloroisopentyldiphosphate V6– Phosphoric acid, 2,2-bis(chloromethyl)-1,3-propanediyltetrakis(2-chloroethyl) ester– 2,2-Bis(chloromethyl)trimethylene bis(bis(2-chloroethyl)phosphate)– 2,2-Bis(chloromethyl)-1,3-propanediyl tetrakis(2-chloroethyl)bis(phosphate)– 2,2-Bis(chloromethyl)propane-1,3-diyl tetrakis(2-chloroethyl)bis(phosphate)
Stuer-Lauridsen et al. (2006), Chemspider (2011) and Sigma-Aldrich (2011).
0.010.1
110
1001000
10000100000
1000000
0 200 400 600 800
Solu
bilit
y (m
g/L
)
Mass
linear and branched
Cl containing
2 phenyl groups
3 phenyl groups
5 phenyl groups
Fig. 3. Solubility (mg L�1) versus molecular mass.
-10
-5
0
5
10
15
0 100 200 300 400 500 600 700
log
Kow
Masslinear and branched
Cl containing
2 phenyl groups
3 phenyl groups
5 phenyl groups
other
I. van der Veen, J. de Boer / Chemosphere 88 (2012) 1119–1153 1123
Fig. 4. log Kow versus molecular mass.

110
1001000
10000100000
100000010000000
0 100 200 300 400 500 600 700
BC
F
Masslinear and branched
Cl containing
2 phenyl groups
3 phenyl groups
5 phenyl groups
ring structures
Fig. 5. Bioconcentration factor versus molecular mass.
Table 2Properties of chlorine containing PFRs.
Name BCF M Cl(atoms)
Cl (%m m�1)
Tris(2-chloroethyl)phosphate 1.37 287 3 381-(Bis(2-chloroethoxy)phosphinyl)ethyl 2-
chloroethyl (1-(((2-chloroethoxy)(2-chloroethyl)phosphinyl)oxy)ethyl)phosphonate
6.49 613 5 29
Tris(chloroiso-propyl)phosphate 8.51 329 3 33Tris(1,3-dichloro-2-propyl)phosphate 13.5 434 6 50Tris(chloropropyl) phosphate 42.4 329 3 33Tetrekis(2-
chlorethyl)dichloroisopentyldiphosphate17.07 580 6 37
1124 I. van der Veen, J. de Boer / Chemosphere 88 (2012) 1119–1153
APP. The second group consists of the organic PFRs. Three differentgeneral structures of these PFRs can be recognized: the organo-phosphate esters (OPEs), the phosphonates, and the phosphinates(Fig. 2) (EFRA, 2007). The third group is the widely used group ofhalogenated PFRs. These combine the properties of both thehalogen and the phosphorus components. The presence of thehalogen also increases the lifetime of the FR in the end-productby decreasing its mobility in the polymer (Fisk et al., 2003). Exam-ples of halogenated PFRs are TCPP and TCEP (Table 1). Within thesethree groups two basic types of PFRs can be recognized. The firsttype being reactive FRs, which are reactive components chemicallybuilt into a polymer molecule (WHO, 1997). Due to the chemicalbinding, losses during the lifetime of the product are limited (Fisket al., 2003).
The second type encompasses the additive FRs, which are mixedinto the polymer (WHO, 1997). The additive FRs may decrease inconcentration during the lifetime of the treated product and, there-fore, the flame retardancy properties can decrease in time (Fisket al., 2003). The major groups of additive PFRs are polyols, phos-phonium derivatives, phosphonates and phosphate esters, whichinclude trialkyl derivatives such as triethyl or trioctyl phosphate,triaryl derivatives such as TPhP, and aryl–alkyl derivatives such as2-ethylhexyldiphenyl phosphate (WHO, 1997). In Table 1, an over-view of the PFRs studied is given, with their structures and names.
2.1. Physicochemical properties
There is a great variation in physiological properties of PFRs. Forexample di-ammonium phosphate (DAP) (Sigma-Aldrich, 2011),and dimethyl methyl phosphonate (DMMP) (Akzo, 2003) are highlysoluble in water, while trixylenyl phosphate (TXP) and isodecyldi-phenyl phosphate (IDPP) are immiscible with water. In AppendixA, an overview of the solubility’s of the studied PFRs is given. Fig. 3shows the solubility of PFRs versus the molecular mass. The solubil-ity decreases by increasing molecular mass. In case their hydrolysishalf life are equal the PFRs with lower masses are therefore morelikely to be found in the aquatic environment than those with highermolecular masses, which is confirmed by the log Kow values of the
PFRs as can be seen in Fig. 4. Most of the PFRs have a positive log Kow
value, which means they are more lipophilic than hydrophilic. Thelog Kow values vary considerably between the different PFR groups.The WHO (2000) gives a calculated log Kow value of �9.8 for tetra-kis(hydroxymethyl) phosphonium sulfate (THPS). In contrast withthat, a log Kow value of 10.6 was found for trioctyl phosphate(Chemspider, 2011). These two compounds mark both ends of thelog Kow range for all PFRs found in the literature for this study. Thelog Kow values of the PFRs studied are listed in Appendix A.
The wide range of log Kow values for PFRs from �9.8 till 10.6 isin contrast with the log Kow values of the BFRs of which the valuesrange from 4.3 to 9.9 (Asamoah, 2005). BFRs are, therefore, muchmore lipophilic than PFRs.
Henry’s law constants at 25 �C of the studied PFRs vary between2.8 � 10�4 atm-m3 mole�1, for tri-iso-butyl phosphate (TiBP)(Chemspider, 2011), until 1.7 � 10�23 atm-m3 mole�1, for THPS(Syrres, 2011). The wide range of Henry’s law constant values ofPFRs indicates that the distribution of PFRs over air and environ-mental waters like the oceans is highly variable. The Henry’s lawconstants of the PFRs studied are also listed in Appendix A.
There is also a great variety in vapor pressures and bioconcen-tration factors (BCF). The vapor pressure at 25 �C ranges from1.9 mm Hg for dimethyl phosphonate (DMHP) to 9.5 � 10�21 mmHg for THPS and the BCF ranges from 1.37 for TCEP to 106 fortrioctyl phosphate and tris(2-ethylhexyl)phosphate (TEHP). Thevapor pressure and BCF’s of the PFRs studied are listed in AppendixA including other physicochemical properties like boiling point,melting point and flash point. Fig. 5 shows the relation betweenthe BCFs of several PFRs and their molecular mass. The BCF gener-ally increases with increasing molecular mass, except for chlorinecontaining compounds. The non-halogen PFRs with higher molec-ular masses are therefore more likely to be found in nature thanthose with lower molecular masses. For the chlorine containingPFRs no relation can be found between the BCF, the molecular massor the amount of chlorine in the molecule (Table 2).
2.2. Flame retarding mechanisms
In case of fire the solid materials are decomposed by heat intoflammable gases, which will be on fire. There are several FRmechanisms to prevent fire, of which the most effective onesare reactions in the gas phase and reactions in the solid phase(EFRA, 2007). In the gas phase halogenated FRs remove H+ andOH� radicals from the flammable gasses, by reaction with theBr and Cl atoms. The removal of the H+ and OH� radicals resultsin a slowdown of the burning process, and reduces the spreadingof the fire. The effectiveness of the halogenated FRs is dependingon the number of halogen atoms present in the molecule (CEFIC,2007).
It is impossible to describe one single working mechanism forPFRs (Schmitt, 2007). Halogenated FRs act in the gas phase, whereasnon-halogenated PFRs mainly act in the solid phase of burningmaterials. When phosphorus is heated it will react, and form a poly-meric form of phosphoric acid. This acid causes a char layer, whichshields the material from oxygen, in that way preventing the forma-tion of flammable gasses. Another mechanism of action of PFRs isoffering a partial gas phase contribution to the flame extinguishingeffect, which is comparable to bromine- or chlorine containing FRs(CEFIC, 2007; EFRA, 2007; Schmitt, 2007; Chen et al., 2008). Whenhalogens and phosphorus are both present in polymer systems,they act independently and therefore additively (WHO, 1997).
The content of phosphorus in PFRs varies from 8.2% for bis(4-carboxyphenyl) phenylphosphine oxide (BCPPO) (Chemspider,2011) to almost 100% for RP (Schmitt, 2007). A minimum amountof PFR is needed to form a char layer. Once the layer is formedthere is no need for more FR.

I. van der Veen, J. de Boer / Chemosphere 88 (2012) 1119–1153 1125
2.3. Potential substitutes for PBDEs?
PFRs can either be inorganic or organic. Most commonly usedinorganic PFRs are RP and APP. These two flame retardants areactive in the solid phase of burning materials, based on char form-ing (see Section 2.2). The organic PFRs are discussed in the follow-ing paragraphs (Leisewitz et al., 2000; Schmitt, 2007).
2.3.1. Phosphorus flame retardants2.3.1.1. Resorcinol-bis(diphenylphosphate). RDP is an aryl phosphate,which is applied as an additive FR. It is used as a substitute for hal-ogenated FRs as well as for TPhP because it has a lower volatility, ahigher thermal stability, and a higher P-content in comparison toTPhP (Leisewitz et al., 2000; Pawlowski and Schartel, 2007). Thiswould not be of influence on the FR efficiency if RDP was only work-ing in the solid phase of burning materials. The primary mechanismof RDP is the solid phase mechanism, but in addition, a (weaker) gasphase mechanism is also assumed. The active substance contentlies between 10 and 11% of phosphorus weight, depending on theproduct (Leisewitz et al., 2000). RDP is used as a substitute for TCEPand TCPP as it is less volatile (McPherson et al., 2004), and thereforeless likely to be released into the environment.
The structure of RDP is shown in Table 1. RDP is thermally sta-ble (Leisewitz et al., 2000), has a boiling point of 587 �C (Chemspid-er, 2011), but, according to Leisewitz et al. (2000), it alreadydecomposes above 300 �C. RDP is liquid at room temperature(Leisewitz et al., 2000), and in case of fire, carbon oxides and phos-phorus oxides are formed. The phosphorus oxides transform intoacids when they are in direct contact with humid mucous mem-branes (Leisewitz et al., 2000). RDP is very poorly soluble in water(1.11 � 10�4 mg L�1 (Syrres, 2011)), has a very high log Kow of 7.41(Pakalin et al., 2007), and a vapor pressure of 2.1 � 10�8 mm Hgby 25 �C (Syrres, 2011). The log Koa is not known, however accord-ing to the vapor pressure transfer to indoor air cannot be excluded(Leisewitz et al., 2000).
2.3.1.2. Bisphenol-A diphenyl phosphate. BADP is an aryl phosphateof which the structure is shown in Table 1. BADP is active in thecondensed phase as well as in the gas phase (Pawlowski andSchartel, 2007), which is in contrast with the mechanism of mostof the PFRs, which are active in the solid phase through char forma-tion (see Section 2.2).
BADP has a log Kow of 4.5 (Pakalin et al., 2007), and according toPakalin et al. (2007) the calculated BCF of BADP is 3.16. Because ofthe high volatility of TPhP (Pawlowski and Schartel, 2007), BADP isnowadays often used as its substitute, because it is less likely to bereleased into the environment.
2.3.1.3. Triphenyl phosphate. TPhP (see Table 1), an aryl phosphate,is an additive FR (Björklund et al., 2004), which is only active inthe gas phase (Pawlowski and Schartel, 2007). It is one of the mosteffective FRs for many polymers. During thermal degradation TPhPforms phosphoric acid. This acid reacts and forms pyro phosphoricacid, which acts as heat transfer barrier in the condensed phase (Leeet al., 2002). TPhP is solid at room temperature, has a melting pointof 49 �C (Fisk et al., 2003), a boiling point of 370 �C (WHO, 1991), asolubility of 1.9 mg L�1 (Fisk et al., 2003), a vapor pressure of1.2 � 10�6 mm Hg (Chemspider, 2011), and a log Kow of 4.59 (Fisket al., 2003). Because of their high volatility, RDP and BADP are now-adays often used as a substitute (Pawlowski and Schartel, 2007),because they are less likely to be released into the environment.
2.3.1.4. Diphenylcresylphosphate. DCP is an additive FR (see Table 1)(Björklund et al., 2004), which is liquid at room temperature, has amelting point of -38 �C (Fisk et al., 2003) and a boiling point of235 �C (Stuer-Lauridsen et al., 2006). DCP has a solubility of
0.24 mg L�1 (Fisk et al., 2003), a vapor pressure 4.7 � 10�6 mmHg (Syrres, 2011), and a log Kow of 4.51 (Fisk et al., 2003). TheBCF of DCP is 1711 (Chemspider, 2011).
2.3.1.5. Melamine polyphosphate. Melamine polyphosphate (see Ta-ble 1) is a phosphorus and nitrogen containing FR, which is chem-ically built into a polymer molecule. At room temperaturemelamine polyphosphate is a white, fine crystalline powder withno odor, and a boiling- and melting point higher than 400 �C (ASCC,2006). Melamine polyphosphate has a water solubility, which islower than 0.1 g L�1 at 22 �C (PINFA, 2011), a vapor pressure of1.82 � 10�12 mm Hg at 25 �C (Chemspider, 2011), and a log Kow
of �2.3 (PINFA, 2011).
2.3.1.6. Diethylphosphinic acid. Diethylphosphinic acid (see Table 1)is a FR, which is often formed and released during the gas phase, bydecomposition of FR materials (Anonymous, 2008). Diethylphos-phinic acid has a boiling point of 320 �C (Chemspider, 2011), anda vapor pressure of 6.8 � 10�5 mm Hg at 25 �C (Chemspider, 2011).
2.3.1.7. Tricresylphosphate. TCP is a non-flammable, clear, faintlyyellow, viscous odorless liquid (WHO, 1990; Bolgar et al., 2008),which is a mixture of mainly three isomers: tri-ortho-cresylphos-phate (o-TCP) (cas no. 78-30-8), tri-meta-cresylphosphate (m-TCP) (cas no. 563-04-2), and tri-para-cresylphosphate (p-TCP)(cas no. 78–32-0). TCP has a low water solubility of 0.36 mg L�1,and a log Kow of 5.11. In an alkaline medium it can easily be hydro-lyzed to dicresylphosphate and cresol, but it is stable in neutral andacidic media (WHO, 1990). The structures of TCP and its three mainisomers are shown in Table 1. Besides the three main isomers,other isomers might also be present in the TCP mixture like theortho-ortho-meta (oom), ortho-ortho-para (oop), omm, omp, opp,mmp, and mpp isomers (De Nola et al., 2008).
2.3.2. Halogen containing phosphorus flame retardants2.3.2.1. Tris(chloropropyl)phosphate. TCPP (see Table 1) is a clear,colorless liquid (WHO, 1998), which is a halogen containing PFR,used as an additive FR (EFRA, 2007). The trade product consistsof a mixture of four halogenated phosphoric acid esters of whichthe main components are tris(chloroiso-propyl)phosphate (75%)and bis(1-chloro-2-propyl)-2-chloropropyl-phosphate (15–30%)(Leisewitz et al., 2000). TCPP represents approximately 80% ofthe chlorinated PFRs in Europe and is by volume the most impor-tant PFR (Leisewitz et al., 2000).
TCCP has a solid phase fire performance mechanism as well as agas phase, in which the phosphorus is active in the solid phase andthe chlorine in the gas phase. TCPP has a boiling point of 342 �C,but above 150 �C TCPP already decomposes. Phosphorus acid andchloropropanol are formed in the presence of acids and bases. Incase of fire, carbon monoxide, carbon dioxide, phosphorous com-pounds (phosphorous oxides such as phosphorpentoxide) andhydrochloric acid are formed. TCPP is well soluble in water(1.6 g L�1) (WHO, 1998), has a log Kow of 2.59 (WHO, 1998), anda vapor pressure of 100 Pa (=0.75 mm Hg) at 20 �C (Leisewitzet al., 2000). Moderate transmissions of TCPP from open sourcesinto indoor air can thus not be excluded.
2.3.2.2. Tris(2-chloroethyl)phosphate. TCEP (see Table 1) is an addi-tive FR (Björklund et al., 2004), of which, in case of fire, the phos-phorus is active in the solid phase. However the compound alsohas a gas phase mechanism of action through the chlorine (see Sec-tion 2.2). TCEP has a boiling point of 351 �C (WHO, 1998), and is astable compound on short-term exposure at 150 �C, but it rapidlydecomposes above 220 �C to form carbon monoxide, hydrogenchloride, 2-chloroethane and dichloroethane. Hydrolytic stabilityof TCEP decreases with increasing temperature and pressure or ex-
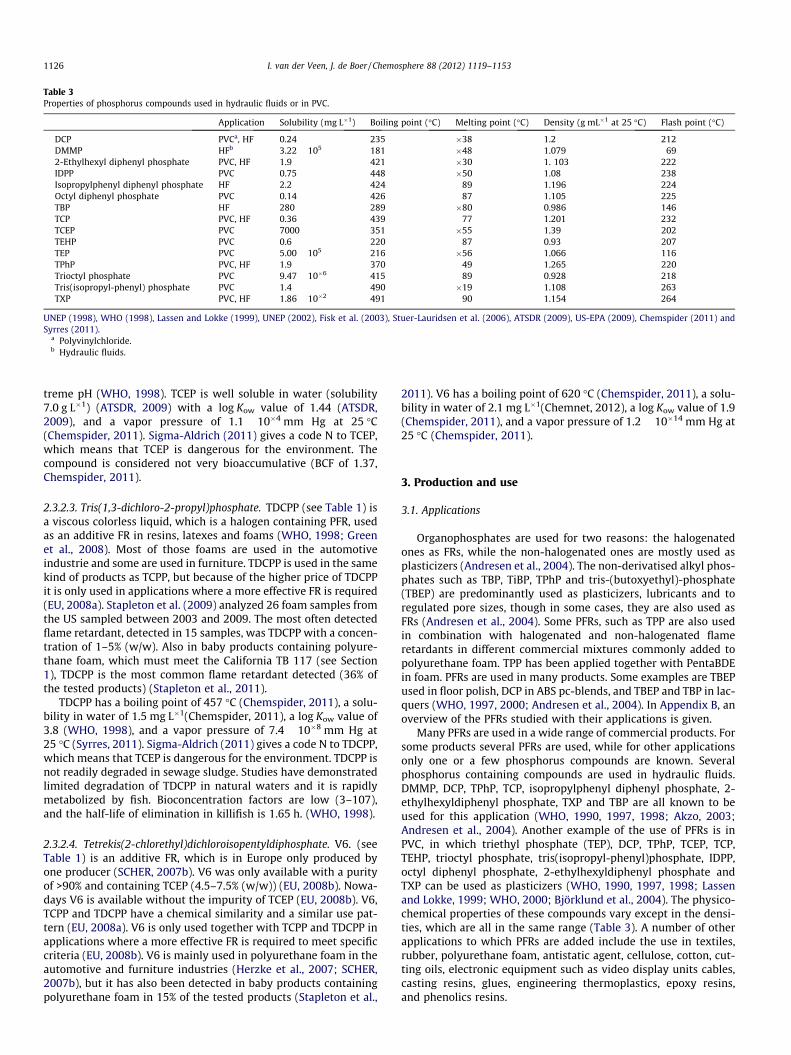
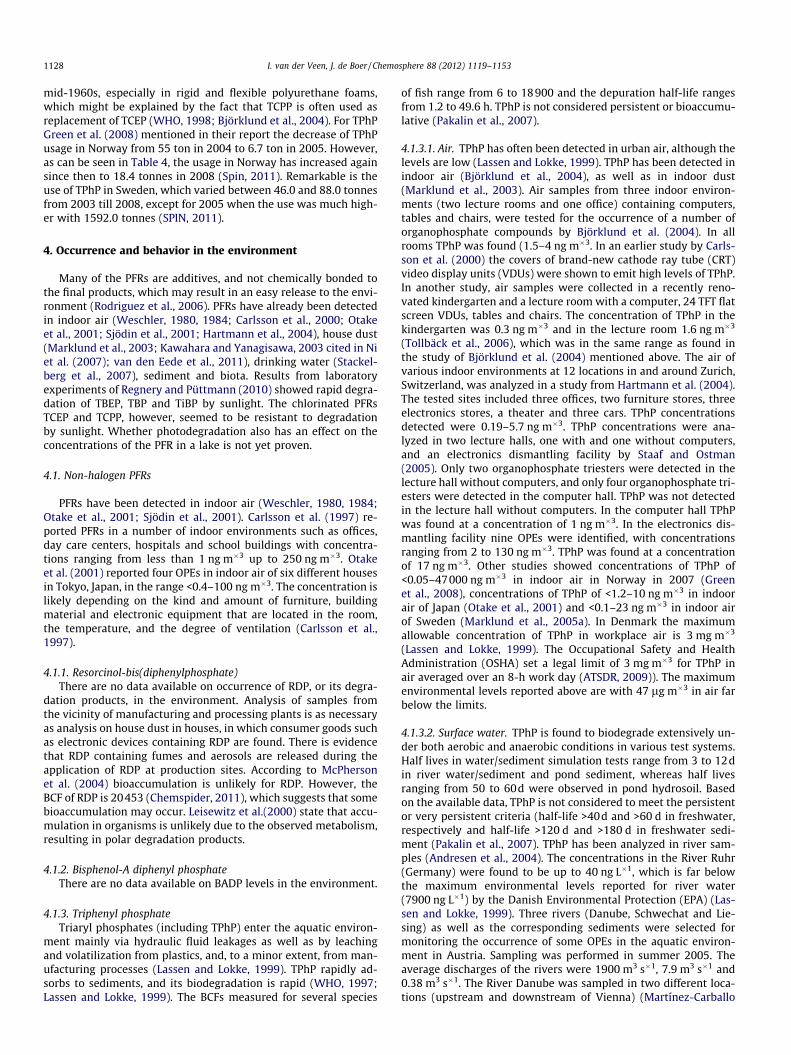
Table 3Properties of phosphorus compounds used in hydraulic fluids or in PVC.
Application Solubility (mg L�1) Boiling point (�C) Melting point (�C) Density (g mL�1 at 25 �C) Flash point (�C)
DCP PVCa, HF 0.24 235 �38 1.2 212DMMP HFb 3.22 � 105 181 �48 1.079 692-Ethylhexyl diphenyl phosphate PVC, HF 1.9 421 �30 1. 103 222IDPP PVC 0.75 448 �50 1.08 238Isopropylphenyl diphenyl phosphate HF 2.2 424 89 1.196 224Octyl diphenyl phosphate PVC 0.14 426 87 1.105 225TBP HF 280 289 �80 0.986 146TCP PVC, HF 0.36 439 77 1.201 232TCEP PVC 7000 351 �55 1.39 202TEHP PVC 0.6 220 87 0.93 207TEP PVC 5.00 � 105 216 �56 1.066 116TPhP PVC, HF 1.9 370 49 1.265 220Trioctyl phosphate PVC 9.47 � 10�6 415 89 0.928 218Tris(isopropyl-phenyl) phosphate PVC 1.4 490 �19 1.108 263TXP PVC, HF 1.86 � 10�2 491 90 1.154 264
UNEP (1998), WHO (1998), Lassen and Lokke (1999), UNEP (2002), Fisk et al. (2003), Stuer-Lauridsen et al. (2006), ATSDR (2009), US-EPA (2009), Chemspider (2011) andSyrres (2011).
a Polyvinylchloride.b Hydraulic fluids.
1126 I. van der Veen, J. de Boer / Chemosphere 88 (2012) 1119–1153
treme pH (WHO, 1998). TCEP is well soluble in water (solubility7.0 g L�1) (ATSDR, 2009) with a log Kow value of 1.44 (ATSDR,2009), and a vapor pressure of 1.1 � 10�4 mm Hg at 25 �C(Chemspider, 2011). Sigma-Aldrich (2011) gives a code N to TCEP,which means that TCEP is dangerous for the environment. Thecompound is considered not very bioaccumulative (BCF of 1.37,Chemspider, 2011).
2.3.2.3. Tris(1,3-dichloro-2-propyl)phosphate. TDCPP (see Table 1) isa viscous colorless liquid, which is a halogen containing PFR, usedas an additive FR in resins, latexes and foams (WHO, 1998; Greenet al., 2008). Most of those foams are used in the automotiveindustrie and some are used in furniture. TDCPP is used in the samekind of products as TCPP, but because of the higher price of TDCPPit is only used in applications where a more effective FR is required(EU, 2008a). Stapleton et al. (2009) analyzed 26 foam samples fromthe US sampled between 2003 and 2009. The most often detectedflame retardant, detected in 15 samples, was TDCPP with a concen-tration of 1–5% (w/w). Also in baby products containing polyure-thane foam, which must meet the California TB 117 (see Section1), TDCPP is the most common flame retardant detected (36% ofthe tested products) (Stapleton et al., 2011).
TDCPP has a boiling point of 457 �C (Chemspider, 2011), a solu-bility in water of 1.5 mg L�1(Chemspider, 2011), a log Kow value of3.8 (WHO, 1998), and a vapor pressure of 7.4 � 10�8 mm Hg at25 �C (Syrres, 2011). Sigma-Aldrich (2011) gives a code N to TDCPP,which means that TCEP is dangerous for the environment. TDCPP isnot readily degraded in sewage sludge. Studies have demonstratedlimited degradation of TDCPP in natural waters and it is rapidlymetabolized by fish. Bioconcentration factors are low (3–107),and the half-life of elimination in killifish is 1.65 h. (WHO, 1998).
2.3.2.4. Tetrekis(2-chlorethyl)dichloroisopentyldiphosphate. V6. (seeTable 1) is an additive FR, which is in Europe only produced byone producer (SCHER, 2007b). V6 was only available with a purityof >90% and containing TCEP (4.5–7.5% (w/w)) (EU, 2008b). Nowa-days V6 is available without the impurity of TCEP (EU, 2008b). V6,TCPP and TDCPP have a chemical similarity and a similar use pat-tern (EU, 2008a). V6 is only used together with TCPP and TDCPP inapplications where a more effective FR is required to meet specificcriteria (EU, 2008b). V6 is mainly used in polyurethane foam in theautomotive and furniture industries (Herzke et al., 2007; SCHER,2007b), but it has also been detected in baby products containingpolyurethane foam in 15% of the tested products (Stapleton et al.,
2011). V6 has a boiling point of 620 �C (Chemspider, 2011), a solu-bility in water of 2.1 mg L�1(Chemnet, 2012), a log Kow value of 1.9(Chemspider, 2011), and a vapor pressure of 1.2 � 10�14 mm Hg at25 �C (Chemspider, 2011).
3. Production and use
3.1. Applications
Organophosphates are used for two reasons: the halogenatedones as FRs, while the non-halogenated ones are mostly used asplasticizers (Andresen et al., 2004). The non-derivatised alkyl phos-phates such as TBP, TiBP, TPhP and tris-(butoxyethyl)-phosphate(TBEP) are predominantly used as plasticizers, lubricants and toregulated pore sizes, though in some cases, they are also used asFRs (Andresen et al., 2004). Some PFRs, such as TPP are also usedin combination with halogenated and non-halogenated flameretardants in different commercial mixtures commonly added topolyurethane foam. TPP has been applied together with PentaBDEin foam. PFRs are used in many products. Some examples are TBEPused in floor polish, DCP in ABS pc-blends, and TBEP and TBP in lac-quers (WHO, 1997, 2000; Andresen et al., 2004). In Appendix B, anoverview of the PFRs studied with their applications is given.
Many PFRs are used in a wide range of commercial products. Forsome products several PFRs are used, while for other applicationsonly one or a few phosphorus compounds are known. Severalphosphorus containing compounds are used in hydraulic fluids.DMMP, DCP, TPhP, TCP, isopropylphenyl diphenyl phosphate, 2-ethylhexyldiphenyl phosphate, TXP and TBP are all known to beused for this application (WHO, 1990, 1997, 1998; Akzo, 2003;Andresen et al., 2004). Another example of the use of PFRs is inPVC, in which triethyl phosphate (TEP), DCP, TPhP, TCEP, TCP,TEHP, trioctyl phosphate, tris(isopropyl-phenyl)phosphate, IDPP,octyl diphenyl phosphate, 2-ethylhexyldiphenyl phosphate andTXP can be used as plasticizers (WHO, 1990, 1997, 1998; Lassenand Lokke, 1999; WHO, 2000; Björklund et al., 2004). The physico-chemical properties of these compounds vary except in the densi-ties, which are all in the same range (Table 3). A number of otherapplications to which PFRs are added include the use in textiles,rubber, polyurethane foam, antistatic agent, cellulose, cotton, cut-ting oils, electronic equipment such as video display units cables,casting resins, glues, engineering thermoplastics, epoxy resins,and phenolics resins.

Table 4Production/usage volumes of the studied PFRs.
PFR Production/usage volume (tones) Location Year
RDP >1500 year�1 Europe 19950 Finland 2006–2008<227 United States 20066 Sweden 2008
BADP 0 Sweden 2004–2007454–4500 United States 2006
TPhP 4500–22700 United States 199820000–30000 Europe (excl. Eastern Europe) 20004500–22700 United States 200255 Norway 20046.7 Norway 20051592 Sweden 20054500–22700 United States 200618.4 Norway 20082.3–16.7 year�1 Denmark 2004–20089.8–57.1 year�1 Finland 2004–200846.0–88.0 year�1 Sweden 2003–2008 (excl. 2005)
DCP >1500 year�1 Europe 1995<227 United States 20060.2 Norway 20082.1 Denmark 20084.9 Finland 20082.0 Sweden 2008
Melamine polyphosphate Not applicableDiethylphospinic acid Not applicable
TCP 454–4500 United States 1998454–4500 United States 2002454–4500 United States 20060.8 Norway 20080.6 Denmark 20083.6 Finland 20085.0 Sweden 2008
TCPP 22950 year�1 Europe 19952750 year�1 UK 199540000 Worldwide 199750 Norway 200142.7 Norway 2008177 Denmark 200816429 Finland 2008132 Sweden 2008
TCEP 2040 year�1 Europe 1995400 year�1 UK 19951286 Norway 2003798.5 Norway 20041598 Finland 2004227–454 United States 2006261.3 Norway 20080.1 Denmark 2008198 Finland 20080 Sweden 2008
TDCPP 8000 Worldwide 19974500–22700 United States 1998<10000 Europe 2000132.8 Denmark 2000134.1 Denmark 2001134.1 Denmark 20024500–22700 United States 20024500–22700 United States 2006
V6 454–4500 United States 1998<5000 Europe 2000<454 United States 2002
WHO (1997), UNEP (2002), US-EPA (2002), US-EPA (2006), EU (2008a, 2008b), Green et al. (2008) and SPIN (2011).
I. van der Veen, J. de Boer / Chemosphere 88 (2012) 1119–1153 1127
3.2. Production volumes
The total consumption of FRs in Europe in 2006 was 465000tonnes (CEFIC, 2007). PFRs were responsible for 20% thereof, ofwhich 9% were non-halogen PFRs and 11% were chlorine contain-ing PFRs (CEFIC, 2007). In Table 4 an overview of the studies PFRs
is given with their production or usage volumes. Out of this tablesome observations can be made. Since 2003 the use of TCEP inNorway and Finland decreased significantly from 1598 tonnes in2004 to 198.4 in 2008, which can be explained by the fact thatTCEP is no longer produced in Europe (Green et al., 2008). On theother hand, the use of TCPP has continued to grow since the
1128 I. van der Veen, J. de Boer / Chemosphere 88 (2012) 1119–1153
mid-1960s, especially in rigid and flexible polyurethane foams,which might be explained by the fact that TCPP is often used asreplacement of TCEP (WHO, 1998; Björklund et al., 2004). For TPhPGreen et al. (2008) mentioned in their report the decrease of TPhPusage in Norway from 55 ton in 2004 to 6.7 ton in 2005. However,as can be seen in Table 4, the usage in Norway has increased againsince then to 18.4 tonnes in 2008 (Spin, 2011). Remarkable is theuse of TPhP in Sweden, which varied between 46.0 and 88.0 tonnesfrom 2003 till 2008, except for 2005 when the use was much high-er with 1592.0 tonnes (SPIN, 2011).
4. Occurrence and behavior in the environment
Many of the PFRs are additives, and not chemically bonded tothe final products, which may result in an easy release to the envi-ronment (Rodriguez et al., 2006). PFRs have already been detectedin indoor air (Weschler, 1980, 1984; Carlsson et al., 2000; Otakeet al., 2001; Sjödin et al., 2001; Hartmann et al., 2004), house dust(Marklund et al., 2003; Kawahara and Yanagisawa, 2003 cited in Niet al. (2007); van den Eede et al., 2011), drinking water (Stackel-berg et al., 2007), sediment and biota. Results from laboratoryexperiments of Regnery and Püttmann (2010) showed rapid degra-dation of TBEP, TBP and TiBP by sunlight. The chlorinated PFRsTCEP and TCPP, however, seemed to be resistant to degradationby sunlight. Whether photodegradation also has an effect on theconcentrations of the PFR in a lake is not yet proven.
4.1. Non-halogen PFRs
PFRs have been detected in indoor air (Weschler, 1980, 1984;Otake et al., 2001; Sjödin et al., 2001). Carlsson et al. (1997) re-ported PFRs in a number of indoor environments such as offices,day care centers, hospitals and school buildings with concentra-tions ranging from less than 1 ng m�3 up to 250 ng m�3. Otakeet al. (2001) reported four OPEs in indoor air of six different housesin Tokyo, Japan, in the range <0.4–100 ng m�3. The concentration islikely depending on the kind and amount of furniture, buildingmaterial and electronic equipment that are located in the room,the temperature, and the degree of ventilation (Carlsson et al.,1997).
4.1.1. Resorcinol-bis(diphenylphosphate)There are no data available on occurrence of RDP, or its degra-
dation products, in the environment. Analysis of samples fromthe vicinity of manufacturing and processing plants is as necessaryas analysis on house dust in houses, in which consumer goods suchas electronic devices containing RDP are found. There is evidencethat RDP containing fumes and aerosols are released during theapplication of RDP at production sites. According to McPhersonet al. (2004) bioaccumulation is unlikely for RDP. However, theBCF of RDP is 20453 (Chemspider, 2011), which suggests that somebioaccumulation may occur. Leisewitz et al.(2000) state that accu-mulation in organisms is unlikely due to the observed metabolism,resulting in polar degradation products.
4.1.2. Bisphenol-A diphenyl phosphateThere are no data available on BADP levels in the environment.
4.1.3. Triphenyl phosphateTriaryl phosphates (including TPhP) enter the aquatic environ-
ment mainly via hydraulic fluid leakages as well as by leachingand volatilization from plastics, and, to a minor extent, from man-ufacturing processes (Lassen and Lokke, 1999). TPhP rapidly ad-sorbs to sediments, and its biodegradation is rapid (WHO, 1997;Lassen and Lokke, 1999). The BCFs measured for several species
of fish range from 6 to 18900 and the depuration half-life rangesfrom 1.2 to 49.6 h. TPhP is not considered persistent or bioaccumu-lative (Pakalin et al., 2007).
4.1.3.1. Air. TPhP has often been detected in urban air, although thelevels are low (Lassen and Lokke, 1999). TPhP has been detected inindoor air (Björklund et al., 2004), as well as in indoor dust(Marklund et al., 2003). Air samples from three indoor environ-ments (two lecture rooms and one office) containing computers,tables and chairs, were tested for the occurrence of a number oforganophosphate compounds by Björklund et al. (2004). In allrooms TPhP was found (1.5–4 ng m�3. In an earlier study by Carls-son et al. (2000) the covers of brand-new cathode ray tube (CRT)video display units (VDUs) were shown to emit high levels of TPhP.In another study, air samples were collected in a recently reno-vated kindergarten and a lecture room with a computer, 24 TFT flatscreen VDUs, tables and chairs. The concentration of TPhP in thekindergarten was 0.3 ng m�3 and in the lecture room 1.6 ng m�3
(Tollbäck et al., 2006), which was in the same range as found inthe study of Björklund et al. (2004) mentioned above. The air ofvarious indoor environments at 12 locations in and around Zurich,Switzerland, was analyzed in a study from Hartmann et al. (2004).The tested sites included three offices, two furniture stores, threeelectronics stores, a theater and three cars. TPhP concentrationsdetected were 0.19–5.7 ng m�3. TPhP concentrations were ana-lyzed in two lecture halls, one with and one without computers,and an electronics dismantling facility by Staaf and Ostman(2005). Only two organophosphate triesters were detected in thelecture hall without computers, and only four organophosphate tri-esters were detected in the computer hall. TPhP was not detectedin the lecture hall without computers. In the computer hall TPhPwas found at a concentration of 1 ng m�3. In the electronics dis-mantling facility nine OPEs were identified, with concentrationsranging from 2 to 130 ng m�3. TPhP was found at a concentrationof 17 ng m�3. Other studies showed concentrations of TPhP of<0.05–47000 ng m�3 in indoor air in Norway in 2007 (Greenet al., 2008), concentrations of TPhP of <1.2–10 ng m�3 in indoorair of Japan (Otake et al., 2001) and <0.1–23 ng m�3 in indoor airof Sweden (Marklund et al., 2005a). In Denmark the maximumallowable concentration of TPhP in workplace air is 3 mg m�3
(Lassen and Lokke, 1999). The Occupational Safety and HealthAdministration (OSHA) set a legal limit of 3 mg m�3 for TPhP inair averaged over an 8-h work day (ATSDR, 2009)). The maximumenvironmental levels reported above are with 47 lg m�3 in air farbelow the limits.
4.1.3.2. Surface water. TPhP is found to biodegrade extensively un-der both aerobic and anaerobic conditions in various test systems.Half lives in water/sediment simulation tests range from 3 to 12din river water/sediment and pond sediment, whereas half livesranging from 50 to 60d were observed in pond hydrosoil. Basedon the available data, TPhP is not considered to meet the persistentor very persistent criteria (half-life >40d and >60 d in freshwater,respectively and half-life >120 d and >180 d in freshwater sedi-ment (Pakalin et al., 2007). TPhP has been analyzed in river sam-ples (Andresen et al., 2004). The concentrations in the River Ruhr(Germany) were found to be up to 40 ng L�1, which is far belowthe maximum environmental levels reported for river water(7900 ng L�1) by the Danish Environmental Protection (EPA) (Las-sen and Lokke, 1999). Three rivers (Danube, Schwechat and Lie-sing) as well as the corresponding sediments were selected formonitoring the occurrence of some OPEs in the aquatic environ-ment in Austria. Sampling was performed in summer 2005. Theaverage discharges of the rivers were 1900 m3 s�1, 7.9 m3 s�1 and0.38 m3 s�1. The River Danube was sampled in two different loca-tions (upstream and downstream of Vienna) (Martínez-Carballo

I. van der Veen, J. de Boer / Chemosphere 88 (2012) 1119–1153 1129
et al., 2007). TPhP concentrations in the water samples from theRiver Danube at Nussdorf were 6 ng L�1 and at Haslau <4.4 ng L�1.In the River Schwechat and the River Liesing concentrations of 7and 10 ng L�1 were detected (Martínez-Carballo et al., 2007).Bacaloni et al. (2007) analyzed river water from the Tiber (Italy)in June and November 2006 and found levels of TPhP of 11 and165 ng L�1. Levels of TPhP determined in influent and effluent sam-ples of Norway in 2007 were respectively 3100–14000 ng L�1 and1700–3500 ng L�1 (Green et al., 2008). In Sweden respectively 76–290 ng L�1 and 41–130 ng L�1 was detected (Marklund et al.,2005b), and in Spain <0.015–0.47 ng L�1 and < 0.015–0.22 ng L�1
was detected (Rodriguez et al., 2006). Meyer and Bester (2004)determined the elimination efficiency in two sewage treatmentplants (STPs) of the Ruhr/Rhine area. In the STP with a two-stagebiological treatment 57 ± 24% of TPhP was eliminated. In the otherSTP, a single stage activated sludge plant, the elimination of TPhPwas 75 ± 10%.
4.1.3.3. Drinking water. Stackelberg et al. (2007) performed a studyon a drinking water treatment (DWT) plant in a drainage basin of aheavily populated, highly urbanized area, in which more than 50STPs discharge effluents to the two streams that provide sourcewater for the DWT plant. The DWT plant treats and provides anaverage of 235 million L d�1 to about 850000 people. In the fin-ished water samples no TPhP was detected (LOD 0.5 lL).
4.1.3.4. Sediment. TPhP was not detected in the sediment samplesfrom the River Danube at Nussdorf (Austria) (see Section 4.1.3.2),although it was found in the water sample. At Haslau the TPhP con-centration in the sediment sample was <0.79 lg kg�1 dw. In theRiver Schwechat (Austria) and the River Liesing (Austria), concen-trations of 160 and 4.3 lg kg�1 dw were found in the sedimentsamples (Martínez-Carballo et al., 2007). The Danish EPA (Lassenand Lokke, 1999) performed an assessment on alternative FRs forBFRs. They reported maximum environmental levels in sedimentof 4000 ng g�1. No sample location was given. Green et al. (2008)performed a study on PFR levels in environmental samples fromNorway. They analyzed sediments of one landfill site and one cardemolishing site of Norway in 2007. TPhP concentrations detectedwere <38–5000 lg kg�1. Another study was performed in 2010 byLeonards et al. (2011) who found TPhP levels of <0.10–6.8 lg kg�1
in sediment samples of Norway.
4.1.3.5. Dust. Stapleton et al. (2009) analyzed 50 dust samples col-lected from home vacuum cleaners from the Boston, MA area be-tween 2002 and 2007 for TCPP, TDCPP and TPhP. The detectionfrequency of TPhP was >96% and the concentration range foundwas <150 ng g�1–1.8 mg g�1. Van den Eede et al. (2011) investi-gated the presence of PFRs in three SRMs certified for other organiccontaminants in indoor dust. TPhP levels found were 0.70–0.99 lg g�1. In other dust samples Van den Eede et al. (2011) de-tected TPhP levels of 0.04–34.2 lg g�1.
4.1.3.6. Biota. Only a few studies on PFRs in biota are known.Lassen and Lokke, 1999 reported maximum levels of TPhP in fishof 600 lg kg�1. No sample location was given. Green et al. (2008)analyzed mussel and cod liver from Norway, and no TPhP was de-tected. Evenset et al. (2009) reported 5.7–13 lg kg�1 in fish liver,0.3–3.2 lg.kg in fish muscle, and 0.6–3.3 seabird liver from Nor-way. Leonards et al. (2011) reported TPhP in beach crab, cod liver,trout and in bird blood and bird eggs from Norway, with the high-est concentration of 44 lg kg�1 found in trout. TPhP levels of bluemussel and of burbot liver were below the LOD of 0.05–0.23 lg kg�1 and 1.4–5.4 lg kg�1. Sundkvist et al. (2010) analyzedbiota, herring, perch, mussels, eelpout and salmon, from Swedishlakes and coastal areas. In all samples TPhP was detected, with
levels ranging from 4.2 to 810 ng g�1 and the highest level foundin carp from freshwater close to a source. Campone et al. (2010)set up a detection method for PFRs in fish tissue and analyzed 24fish samples without finding any PFRs, with a LOD of 0.8 lg kg�1
for TPhP.
4.1.4. DiphenylcresylphosphateSigma-Aldrich (2011) gives a code N to DCP, which means DCP
is dangerous for the environment. There are no data available inthe literature on DCP occurrences in the environment.
4.1.5. Melamine polyphosphateMelamine polyphosphate has a low bioaccumulation (McPher-
son et al., 2004). Although very little of the notified polymer islikely to be released to the water compartment, the relatively highaverage molecular weight (>10000 g mol�1) and charged nature ofthe polymer indicates low potential for bioaccumulation (ASCC,2006). There are no data available in the literature on melaminepolyphosphate occurrences in the environment.
4.1.6. Diethylphosphinic acidDiethylphosphinic acid is considered to be very persistent, but
is not considered to meet the criteria for bioaccumulation (Stuer-Lauridsen et al., 2006). There are no data available in the literatureon diethylphosphinic acid occurrences in the environment.
4.1.7. TricresylphosphateTCP is mainly released into the environment from end-point
use, while a little is released during production of TCP (Lassenand Lokke, 1999). With a BCF of 8.56 � 103, bioaccumulation couldbe expected. In the aquatic environment biodegradation is rapid,being almost complete in river water within 5 d. In sewage sludgethe half life of TCP is 7.5 h, and in 24 h up to 99% of TCP has de-graded. Abiotic degradation is slower with a half life of 96 d(WHO, 1990). The isomers of TCP have different degradation rates,with o-TCP degrading faster than m-TCP and p-TCP.
4.1.7.1. Air. A number of studies have been performed on the anal-ysis of TCP in air. In a study of Tollbäck et al. (2006) air sampleswere collected in a kindergarten and a lecture room in Sweden(see Section 4.1.3). The concentration of TCP detected in the lectureroom was 0.4 ng m�3, but TCP was not detected in the kindergar-ten. In another study, air of various indoor environments at 12locations in and around Zurich, Switzerland, was analyzed for thepresence of TCP (Hartmann et al., 2004) (see Section 4.1.3). At mostof the sample locations (9) TCP was found below the LOD of0.41 ng m�3. TCP was detected in the theater (2.1 ng m�3) and inone off the offices (0.37 ng m�3). In one of the electronic storesTCP was found below the LOD at night, and 0.21 ng m�3 at daytime. In Denmark the maximum allowable concentration of TCPin workplace air is 0.1 mg m�3 (Lassen and Lokke, 1999). The con-centrations observed are far below this limit.
4.1.7.2. Surface water. In 2005, three rivers (Danube, Schwechatand Liesing) as well as the corresponding sediments were sampledin Austria (see Section 4.1.3). TCP was not detected (<7.9 ng L�1) inwater samples from those rivers (Martínez-Carballo et al., 2007).Bacaloni et al. (2007) analyzed river water from the Tiber (Italy)in June and November 2006. No TCP was detected (<0.1 ng L�1).
4.1.7.3. Sediment. Due to its low water solubility and high adsorp-tion to particulates TCP rapidly adsorbs to sediment and soil(WHO, 1990). TCP concentrations in sediment from the River Dan-ube were <1.5 lg kg�1 dw. In sediment from the River Schwechat(Austria) and the River Liesing (Austria) concentrations of 39 and6.3 lg kg�1 dw were found (Martínez-Carballo et al., 2007). TCP
1130 I. van der Veen, J. de Boer / Chemosphere 88 (2012) 1119–1153
levels in Norwegian sediments ranged from <0.05–288 ng g�1 (Leo-nards et al., 2010).
4.1.7.4. Dust. Van den Eede et al. (2011) investigated the presenceof PFRs in three SRMs certified for other organic contaminants inindoor dust. TCP levels found were 0.77–1.12 lg g�1. In other dustsamples Van den Eede et al. (2011) found TCP levels of <0.04–12.5 lg g�1.
4.1.7.5. Biota. Only a few studies are known on PFRs in biota.Evenset et al. (2009) analyzed but did not find TCP In biota fromNorway. LODs were 0.2 lg kg�1 for whole fish, 0.08–0.2 lg kg�1
for fish muscle, 2 lg kg�1 for fish liver, and 0.6 for seabird liver.Leonards et al. (2011) analyzed and did not detect TCP in beachcrab, blue mussel, burbot liver, cod liver, trout, bird blood, birdeggs and sediment samples of Norway, with LODs ranging from0.04 lg kg�1 for blue mussel to 5.1 lg kg�1 for cod liver. Sundkvistet al. (2010) analyzed biota, herring, perch, mussels, eelpout andsalmon, from Swedish lakes and coastal areas. In all samples, ex-cept in the herring (<0.3–<0.4 lg kg�1) and in perch from Öresjön(<2.1 lg kg�1), TCP was detected, with levels ranging from 3.0 to137 lg kg�1 with the highest level found in perch from freshwaterclose to a source. Campone et al. (2010) analyzed 24 fish samplesand did not detect PFRs, with an LOD of 3.1 lg kg�1 for TCP.
4.2. Halogen containing PFRs
4.2.1. Tris(chloropropyl)phosphateAccording to Leisewitz et al. (2000) TCPP is difficult to degrade,
so it has to be assumed that it might accumulate in food chains(Leisewitz et al., 2000). Kawagoshi et al. (2002) tested the degrada-tion of organophosphorus esters in leachate from a sea-based solidwaste disposal site, and found that TCPP showed low degradability.No decrease was observed under anaerobic condition. TCPP hasbeen found in aquatic systems. Concentrations in surface waterrange between 0.05 and 10 lg L�1 (Leisewitz et al., 2000). Riversediments showed concentrations of up to 165 lg kg�1 dw. Thereare no data with respect to the occurrence of TCPP in sewagesludge and soil. Concentrations of 1–14 mg kg�1 TCPP in dust havebeen reported (Leisewitz et al., 2000).
4.2.1.1. Air. TCPP has been detected in indoor air (Carlsson et al.,1997), as well as in indoor dust (Marklund et al., 2003). The sourceof this contamination was electronic equipment such as computers(Carlsson et al., 2000). A number of studies have been performed todetermine TCPP in air. In Sweden, air samples from three indoorenvironments (see Section 4.1.3) were analyzed for a number oforganophosphate compounds (Björklund et al., 2004). In all threerooms the dominating compound was found to be TCPP at concen-trations of 91–850 ng m�3. Air of 12 indoor locations in and aroundZürich, Switzerland, was analyzed for the presence of TCPP(Hartmann et al., 2004) (see Section 4.1.3). TCPP was found up to260 ng m�3 in a 9-year old car, while only low levels (23 ng m�3)were found in a new car. TCPP concentration in a 1-year old carwas < 0.12 ng m�3. Furniture stores, a theater and an office hadmoderate levels of TCPP ranging from 46 to 130 ng m�3. TCPPwas not detected in any of the electronics stores or the other officesampled. TCPP in air from a kindergarten and a lecture room inSweden (see Section 4.1.3) were 77 and 1006 ng m�3, respectively.The most abundant OPE in both rooms was TCPP. All other organo-phosphate triesters ranged 0.1–9 ng m�3 in the kindergarten and0.3–15 ng m�3 in the computer room (Tollbäck et al., 2006). TCPPwas the major compound in air from two lecture halls and of anelectronics dismantling facility in Sweden, with a concentrationof 762 ng m�3 in the lecture hall without computers and a concen-tration of 1080 ng m�3 in the computer hall. In the electronics
dismantling TCPP was found at a concentration of 22 ng m�3 (Staafand Ostman, 2005) (see Section 4.1.3). Other studies showed con-centrations of TCPP in indoor air in Sweden of 10–570 ng m�3
(Marklund et al., 2005a) and in Norway of <0.2–49 ng m�3 (Greenet al., 2008). In Tokyo residences the maximum concentration ofTCPP in indoor air was >10 lg m�3 (Saito et al., 2001 cited in Niet al., 2007).
4.2.1.2. Water. TCPP concentrations of 80–100 ng L�1 were found inRiver Rhine (Germany) water and of 100 ng L�1 in the River Lippe(Germany) (Andresen et al., 2004). TCPP concentrations in the Riv-er Ruhr (Germany) varied between 20 and 200 ng L�1 (Andresenet al., 2004). Regnery and Püttmann (2010) also analyzed surfacewater from Germany. They found TCPP concentrations rangingfrom <4–379 ng L�1, with the highest concentrations found in lakeNidda at Oxbow. TCPP is supposed to be introduced into surfacewater through STPs (Fries and Püttmann, 2001; Andresen et al.,2004). TCPP has been analyzed in several rivers and STP effluents.All STPs, which were sampled by Andresen et al. (2004), contributeconsiderably to the load of TCPP in the respective rivers as typicalconcentrations of 50–400 ng L�1 in the effluents were reported.There was no relationship between the TCPP concentrations ineffluents and the amount of inhabitants served by the STPs(Andresen et al., 2004). In 2005, three rivers (Danube, Schwechatand Liesing) as well as the corresponding sediments were sampledin Austria (see Section 4.1.3). TCPP concentrations in the watersamples from the River Danube at Nussdorf were 43 ng L�1 andat Haslau 33 ng L�1. In the River Schwechat and the River Liesingconcentrations of 170 and 110 ng L�1 were found) (Martínez-Carballo et al., 2007). Bacaloni et al. (2007) analyzed river waterfrom the River Tiber (Italy) and found levels of TCPP of 117 and54 ng L�1. TCPP concentrations in STP influents from an urban sew-age plant of Spain, which receives mainly wastewater from a125000 inhabitants city, ranged 0.32–0.72 ng L�1 and in the STPeffluents from the same STP 0.31–0.91 ng L�1 (Rodriguez et al.,2006), which is far below the range of 50–400 ng L�1 reported byAndresen et al. (2004) mentioned above in effluent samples fromGermany. TCPP concentrations in STP influents and effluents froma STP near Dortmund (Germany), which processes 200000 m3
waste water per day, were 240–1000 and 230–610 ng L�1, respec-tively (Bester, 2005). This effluent concentration is comparable toconcentrations reported by Andresen et al. (2004). TCPP concentra-tions in the influent showed a high variability. The elimination rateof TCPP in STPs also exhibits a high variability but is generally low(0–41% d�1) ((Bester, 2005). Meyer and Bester (2004) showed withtheir study (See Section 4.1.3.2) that no elimination of TCPP tookplace in the two STPs studied. Other studies showed concentra-tions of TCPP of 1860–2590 ng L�1 in influent and 1700–2100 ng L�1 in effluent of Norway (Green et al., 2008), concentra-tions of TCPP of 1.1–18 lg L�1 in influent and 1.5–24 lg L�1 ineffluent of Sweden (Marklund et al., 2005b), concentrations of TCPPof 980 ng L�1 in influent and 320 ng L�1 in effluent of Japan(Ishikawa et al., 1985 cited in Green et al., 2008) and concentra-tions of TCPP of 270–1400 ng L�1 in effluent of Austria (Martínez-Carballo et al., 2007).
4.2.1.3. Sediment. In sediments from Liverpool Bay and the RiversMersey and Tees (UK), eight different PFRs have been determinedwith TCPP being the dominant PFR with concentrations up to180 lg kg�1 dw (VU-IVM, 2007). TCPP concentrations in sedimentsamples from the River Danube at Nussdorf (Austria) were<0.6 lg kg�1 dw, although TCPP was detected in the water samples,and at Haslau 20 lg kg�1 dw was found. In sediment samples fromthe River Schwechat (Austria) and the River Liesing (Austria) con-centrations of 1300 and 95 lg kg�1 dw were found (Martínez-Carballo et al., 2007). Green et al. (2008) reported TCPP in sediment
I. van der Veen, J. de Boer / Chemosphere 88 (2012) 1119–1153 1131
from Norway of 63–24000 lg kg�1. Leonards et al. (2011) foundTCPP levels of <0.15–54 lg kg�1.
4.2.1.4. Dust. Stapleton et al. (2009) analyzed 50 dust samples fromthe Boston, MA area (see Section 4.1.3). The detection frequency ofTCPP was 24%, but this low frequency can be due to a co-elutionproblem at the detection with GC-mass spectrometry (MS). Theconcentrations found were <140–5490 ng g�1. Van den Eede et al.(2011) detected TCPP levels of 0.19–73.7 lg g�1 in Belgian dustsamples.
4.2.1.5. Biota. Green et al. (2008) found TCPP below the limit ofdetection (LOD) for mussel and cod liver with detection limits upto 30 lg kg�1. Evenset et al. (2009) reported 1.4–2.9 lg kg�1 TCPPin fish muscle and 5.5–8.9 lg kg�1 of TCPP in fish liver from Nor-way. Leonards et al. (2011) reported TCPP in beach crab, blue mus-sel, burbot liver, trout, bird blood and bird eggs, with the highestconcentration of 17 lg kg�1 in burbot liver. TCPP levels in cod liverwere below the LOD of 26 lg kg�1). Sundkvist et al. (2010) ana-lyzed biota, herring, perch, mussels, eelpout and salmon, fromSwedish lakes and coastal areas. In all samples TCPP was detected,with levels ranging from 23–1300 ng g�1 with the highest levelfound in mussels from marine water. Campone et al. (2010) re-ported TCPP below the LOD of 1 lg kg�1.
4.2.2. Tris(2-chloroethyl)phosphate4.2.2.1. Air. TCEP was detected in indoor air (Björklund et al., 2004),as well as in indoor dust (Marklund et al., 2003). Air samples fromthree indoor environments (see Section 4.1.3) were also tested(Björklund et al., 2004). TCEP was present in all rooms. Concentra-tions found ranged 1.4–15 ng m�3. The TCEP concentrations aresubstantially lower than those of TCPP from the same study, whichprobably can be explained by the continuing increase of the use ofTCPP and the replacement of TCEP by TCPP as an FR for toxicity rea-sons (WHO, 1998; Björklund et al., 2004). The concentration ofTCEP in a kindergarten was 3 ng m�3 and in a lecture room9 ng m�3 (see Section 4.1.3) (Tollbäck et al., 2006), comparable tolevels found by Björklund et al. (2004). TCEP was not detected ina lecture hall without computers (see Section 4.1.3). In a computerhall TCEP was found at a concentration of 3 ng m�3 (Staaf and Ost-man, 2005). In an electronics dismantling facility TCEP was foundat a concentration of 10 ng m�3 (Staaf and Ostman, 2005). Otherstudies reported TCEP concentrations of <0.2–23 ng m�3 in air fromNorway (Green et al., 2008) and 0.4–730 ng m�3 in air from variousindoor environments (Marklund et al., 2005a).
4.2.2.2. Surface water. TCEP has been analyzed in several rivers andSTP influents and effluents. Three rivers (Danube, Schwechat andLiesing) as well as the corresponding sediments were sampled in2005 in Austria (see Section 4.1.3). TCEP concentrations in thewater samples from the River Danube at Nussdorf were 23 ng L�1
and at Haslau 13 ng L�1. In the River Schwechat and the RiverLiesing TCEP concentrations of 130 and 37 ng L�1 were found(Martínez-Carballo et al., 2007). Bacaloni et al. (2007) analyzed riv-er water from the Tiber (Italy) and found TCEP levels of <1.5 and7 ng L�1. Regnery and Püttmann (2010) analyzed surface waterfrom Germany. They found concentrations ranging from <3 to184 ng L�1, with the highest concentrations found in lake Niddaat Oxbow. Andresen et al. (2004), who reported TCEP concentra-tions in STP effluents of Germany from 5 to 130 ng L�1, stated that,like TCPP, TCEP also passes STPs. This is confirmed by the study ofRodriguez et al. (2006), who found TCEP in influents of Spain be-tween <0.025 and 0.30 ng L�1 and in effluents levels between<0.025 and 0.70 ng L�1. The study of Marklund et al. (2005b) con-firmed that TCEP passes through STPs. They found TCEP levels ininfluents from Sweden between 90 and 1000 ng L�1 and in
effluents of 350–890 ng L�1. Also Meyer and Bester (2004) con-firmed with their study (see Section 4.1.3.2) that TCEP passes STPswith no elimination at all. In Norway TCEP concentrations in influ-ents were 2000–2500 ng L�1 and in effluents 1600–2200 ng L�1
(Green et al., 2008), which is much higher than the levels men-tioned before for Germany, Spain and Sweden.
4.2.2.3. Drinking water. Stackelberg et al. (2004) reported TCEP lev-els of <0.099 lg L�1 in drinking water, and Stackelberg et al. (2007)performed a study on a DWT plant described in Section 4.1.3. In thefinished water samples the TCEP concentrations were 4–99 ng L�1.TCEP was also analyzed in drinking water from Dongbok Lake andPaldang Lake, in South Korea (Kim et al., 2007), which are the res-ervoirs of all drinking water for the neighboring cities. The concen-tration of TCEP found in the DWT facility from Dongbok Lake was14 ng L�1, and in that from the Paldang Lake 25 ng L�1.
4.2.2.4. Sediment. Green et al. (2008) reported TCEP near a cardemolishing site of 2300–5500 lg kg�1, much higher than thosefound in the sediment samples of a landfill site, which ranged from27 to 380 lg kg�1. Leonards et al. (2011) performed a study on sed-iment samples from Norway. Samples were taken at Kåfjorden,Trondheim, Oslo and Mjøsa. TCEP concentrations found rangedfrom <0.16 to 8.5 lg kg�1. TCEP concentration in a sediment sam-ple from the River Danube at Nussdorf (Austria) was <7.7 lg kg�1
dw while at Haslau TCEP was not detected. In the River Schwechat(Austria) the TCEP concentrations in sediment was 160 lg kg�1 dwand in the River Liesing (Austria) TCEP was not detected (Martínez-Carballo et al., 2007). With a solubility of 7.0 � 103 (Fisk et al.,2003) TCEP is well soluble in water and although it was not foundin all sediment samples, TCEP was detected in all correspondingriver water samples (see Section 4.2.2.2).
4.2.2.5. Dust. Van den Eede et al. (2011) detected TCEP levels of0.39, 0.62 and 0.70 lg g�1 in three SRMs certified for other organiccontaminants in indoor dust. In other dust samples TCEP levelsfound by Van den Eede et al. (2011) were <0.08–5.46 lg g�1.
4.2.2.6. Biota. Green et al. (2008) reported TCEP levels in cod liverfrom Norway of <5 lg kg�1 and <10–23 lg kg�1 for mussel.Evenset et al. (2009) found TCEP levels of 0.5–5.0 lg kg�1 in fishmuscle tissue and 13–26 lg kg�1 in fish liver. Leonards et al.(2011) detected TCEP in beach crab (Trondheim), blue mussel(Oslofjord), fish samples, in blood of white-tailed eagle (fromvarious locations) and in shag egg from Sklinna. Levels varied from<0.06 lg kg�1 for blue mussel to 8.6 lg kg�1 for burbot liver.Sundkvist et al. (2010) analyzed biota, herring, perch, mussels,eelpout and salmon, from Swedish lakes and coastal areas. TCEPconcentrations found were <2.0–160 ng g�1, with the highest levelfound in perch from fresh water close to a source. Campone et al.(2010) reported TCEP < 0.4 lg kg�1 in 24 fish samples.
4.2.3. Tris(1,3-dichloro-2-propyl)phosphateA risk assessment report of TDCPP is available from the EU
(2008a). In this report is concluded that TDCPP does meet the cri-teria of being persistent or very persistent in the environment, butit does not meet the criteria of being bioaccumulative or toxic inthe environment. Kawagoshi et al. (2002) tested the degradationof organophosphorus esters in leachate from a sea-based solidwaste disposal site (see Section 4.2.1), and found a low degradabil-ity for TDCPP. No decrease was observed under anaerobiccondition.
4.2.3.1. Air. TDCPP was detected in air samples. Air of various in-door environments at 12 locations in and around Zurich, Switzer-land, was analyzed for the presence of TDCPP (Hartmann et al.,

Table 5Levels of PFRs in the environment.
Matrix PFR Lowest levelreported
Location References Highest levelreported
Location References
Indoorair
TPhP <0.05 ng m�3 Norway Green et al. (2008) 47 lg m�3 Norway Green et al. (2008)TCP <0.41 ng m�3 Sweden Hartmann et al.
(2004)2.1 ng m�3 Theater, Sweden Hartmann et al.
(2004)TCPP <0.12 ng m�3 1-Year old car, Sweden Hartmann et al.
(2004)1080 ng m�3 Computer hall Staaf and Ostman
(2005)TCEP ND ng m�3 Lecture hall Staaf and Ostman
(2005)730 mg m�3 Office Marklund et al.
(2005a)TDCPP <0.11 ng m�3 Sweden Hartmann et al.
(2004)150 ng m�3 Hospital ward Marklund et al.
(2005a)V6 <0.2 ng m�3 Norway Green et al. (2008) 5.2 ng m�3 Norway Green et al. (2008)
Surfacewater
TPhP <4.4 ng L�1 Danube, Austria Martínez-Carballoet al. (2007)
165 ng L�1 Tiber, Italy Bacaloni et al.(2007)
TCP <0.1 ng L�1 Tiber, Italy Bacaloni et al.(2007)
<7.9 ng L�1 Austria Martínez-Carballoet al. (2007)
TCPP <4 ng L�1 Meerfelder Maar, Holzmaar, LakeWindsborn, Germany
Regnery andPüttmann (2010)
379 ng L�1 Lake Nidda atOxbow, Germany
Regnery andPüttmann (2010)
TCEP <1.5 ng L�1 Tiber, Italy Bacaloni et al.(2007)
184 ng L�1 Lake Nidda atOxbow, Germany
Regnery andPüttmann (2010)
TDCPP <0.7 ng L�1 Tiber, Italy Bacaloni et al.(2007)
50 ng L�1 River Ruhr, Germany Andresen et al.(2004)
Drinkingwater
TPhP ND ng L�1 Unknown Stackelberg et al.(2007)
<500 ng L�1 Unknown Stackelberg et al.(2004)
TCP No data found inthe literature
TCPP No data found inthe literature
TCEP 4 ng L�1 Unknown Stackelberg et al.(2007)
99 ng L�1 Unknown Stackelberg et al.(2004)
TDCPP <0.25 lg L�1 Unknown Stackelberg et al.(2004)
Influent TPhP <0.015 ng L�1 Spain Rodriguez et al.(2006
14 lg L�1 Norway Green et al. (2008
TCP No data found inthe literature
TCPP 0.32 ng L�1 Spain Rodriguez et al.(2006)
18 lg L�1 Sweden Marklund et al.(2005b)
TCEP <0.025 ng L�1 Spain Rodriguez et al.(2006)
2500 ng L�1 Norway Green et al. (2008)
TDCPP 210 ng L�1 Sweden Marklund et al.(2005b)
820 ng L�1 Norway Green et al. (2008)
V6 <500 ng L�1 Norway Green et al. (2008)
Effluent TPhP <0.015 ng L�1 Spain Rodriguez et al.(2006)
3.5 lg L�1 Norway Green et al. (2008)
TCP <13 ng L�1 Austria Martínez-Carballoet al. (2007)
55 ng L�1 Austria Martínez-Carballoet al. (2007)
TCPP 0.31 ng L�1 Spain Rodriguez et al.(2006)
24 lg L�1 Sweden Marklund et al.(2005b)
TCEP <0.025 ng L�1 Spain Rodriguez et al.(2006)
2200 ng L�1 Norway Green et al. (2008)
TDCPP 20 ng L�1 Germany Andresen et al.(2004)
740 ng L�1 Norway Green et al. (2008)
V6 <500 ng L�1 Norway Green et al. (2008)
Sediment TPhP <0.10 lg kg�1 Norway Leonards et al.(2011)
160 lg kg�1 Liesing, Austria Martínez-Carballoet al. (2007)
TCP <0.05 lg kg�1 Norway Leonards et al.(2011)
288 lg kg�1 Norway Leonards et al.(2011)
TCPP <0.15 lg kg�1 Norway Leonards et al.(2011)
24000 lg kg�1 Norway Green et al. (2008)
TCEP ND lg kg�1 Danube, Austria Martínez-Carballoet al. (2007)
5500 lg kg�1 Car demolishing site,Norway
Green et al. (2008)
TDCPP <0.09 lg kg�1 Norway Leonards et al.(2011)
8800 lg kg�1 Car demolishing site,Norway
Green et al. (2008)
V6 <27 lg kg�1 Lamdfill site, Norway Green et al. (2008) 2800 lg kg�1 Car demolishing site,Norway
Green et al. (2008)
Biota TPhP <0.05 lg kg�1 Blue mussel, Norway Leonards et al.(2011)
810 lg kg�1 Carp, Sweden Sundkvist et al.(2010)
TCP <0.04 lg kg�1 Blue mussel, Norway Leonards et al.(2011)
137 lg kg�1 Perch (close to asource), Sweden
Sundkvist et al.(2010)
TCPP <0.2 lg kg�1 Blue mussel, Norway Leonards et al.(2011)
17 lg kg�1 Burbot liver, Norway Leonards et al.(2011)
TCEP <0.06 lg kg�1 Blue mussel, Norway Leonards et al. 160 lg kg�1 Perch, Sweden Sundkvist et al.
1132 I. van der Veen, J. de Boer / Chemosphere 88 (2012) 1119–1153

Table 5 (continued)
Matrix PFR Lowest levelreported
Location References Highest levelreported
Location References
(2011) (2010)TDCPP <0.025 lg kg�1 Beach crab, Norway Leonards et al.
(2011)140 lg kg�1 Perch, Sweden Sundkvist et al.
(2010)V6 <0.01 lg kg�1 Blood, Norway Leonards et al.
(2011)<20 lg kg�1 Cod liver/mussel
NorwayGreen et al. (2008)
Dust TPhP <150 ng g�1 Boston, MA area Stapleton et al.(2009)
1.8 mg g�1 Boston, MA area Stapleton et al.(2009)
TCP <0.04 lg g�1 Van den Eede et al.(2011)
12.5 lg g�1 Van den Eede et al.(2011)
TCPP <140 ng g�1 Boston, MA area Stapleton et al.(2009)
14 mg kg�1 Unknown Leisewitz et al.(2000)
TCEP No data found inthe literature
TCEP <0.08 lg g�1 Van den Eede et al.(2011)
5.46 lg g�1 Van den Eede et al.(2011)
TDCPP <80 ng g�1 Van den Eede et al.(2011)
67 mg kg�1 Marklund et al.(2003)
I. van der Veen, J. de Boer / Chemosphere 88 (2012) 1119–1153 1133
2004) (see Section 4.1.3). At all sample locations TDCPP was foundbelow the LOD of 0.11 ng m�3. TDCPP was not detected in a lecturehall without computers (see Section 4.1.3), but in a computer hallconcentration detected were 2 ng m�3 (Staaf and Ostman, 2005). Inan electronics dismantling facility TDCPP was found at a concen-tration of 7 ng m�3 (Staaf and Ostman, 2005). Other studies re-ported TDCPP concentrations of < 0.04–18 ng m�3 in air fromNorway (Green et al., 2008) and < 0.2–150 ng m�3 in air from var-ious indoor environments (Marklund et al., 2005a).
4.2.3.2. Surface water. TDCPP has been analyzed in several riversand STP influents and effluents. Three rivers (Danube, Schwechatand Liesing) as well as the corresponding sediments were sampledin 2005 in Austria (see Section 4.1.3). TDCPP concentrations in thewater samples from the River Danube at Nussdorf were 7 ng L�1
and at Haslau < 3.0 ng L�1. In the River Schwechat and the RiverLiesing TDCPP concentrations of 15 and 19 ng L�1 were found(Martínez-Carballo et al., 2007). Bacaloni et al. (2007) analyzed riv-er water from the Tiber (Italy) in June and November 2006. NoTDCPP was detected (<0.7 ng L�1). Andresen et al. (2004) reportedTDCPP concentrations of 50 ng L�1 in water samples from the RiverRuhr (Germany) and 20–120 ng L�1 in STP effluents of Germany.Meyer and Bester (2004) show with their study (See Section4.1.3.2) that no elimination of TDCPP took place in the two STPsstudied. The study of Marklund et al. (2005b) confirmed thatTDCPP passes through STPs. They found TDCPP levels in influentsfrom Sweden between 210 and 450 ng L�1 and in effluents of130–340 ng L�1. In Norway TDCPP concentrations in influents were630–820 ng L�1 and in effluents 86–740 (Green et al., 2008), and inSpain TDCPP. In a study, performed by Stackelberg et al. (2004)TDCPP levels in drinking water reported were <0.25 lg L�1.
4.2.3.3. Sediment. Green et al. (2008) reported TDCPP levels of<250–8800 lg kg�1 in sediments from a location near a car demol-ishing site. Those levels were in the same range as levels of TDCPPfound in the sediment samples of a landfill site, which ranged from1500–4100 lg kg�1. Leonards et al. (2011) performed a study onsediment samples from Norway. Samples were taken at Kåfjorden,Trondheim, Oslo and Mjøsa. TDCPP concentrations found rangedfrom <0.09–1.0 lg kg�1. TDCPP was not detected (<0.64 lg kg�1)in sediment samples from the Rivers Danube (Austria), Schwechat(Austria), and Liesing (Austria) (Martínez-Carballo et al., 2007).
4.2.3.4. Dust. TDCPP was detected in indoor dust in higher concen-trations than TCEP and TCPP. Concentrations found by Marklund
et al. (2003) ranged 0.20–67 mg kg�1. Samples taken from a pris-on and from an office contained about 100 times higher levels ofTDCPP than those taken from a hospital office or from a textileshop. Meeker and Stapleton (2010) analyzed 50 house dust sam-ples. TDCPP concentrations found were <107 ng g�1–56 lg g�1.Van den Eede et al. (2011) investigated the presence of PFRs inthree SRMs certified for other organic contaminants in indoordust. TDCPP was the second most abundant compound in allSRMs with levels of 1.75, 1.78 and 2.02 lg g�1. In other dust sam-ples Van den Eede et al. (2011) found levels of TDCPP of <0.08–56.2 lg g�1.
4.2.3.5. Biota. Green et al. (2008) reported TDCPP levels in cod liverfrom Norway of <5 lg kg�1 and <10–30 lg kg�1 for mussel. Even-set et al. (2009) found TDCPP levels of <0.3–6.7 lg kg�1 in fishmuscle tissue and <0.3–6.7 lg kg�1 in fish liver, while TDCPP inseabird liver were <1.5 lg kg�1. Leonards et al. (2011) detectedTDCPP in bird egg (<0.72–1.9 lg kg�1) and in bird blood (<0.11–0.16 lg kg�1), TDCPP levels in other biota samples analyzed byLeonards et al. (2011) were all <LOD, with LODs varying from<0.025 lg kg�1 for beach crab to <7.8 lg kg�1 for cod liver.Sundkvist et al. (2010) analyzed biota, herring, perch, mussels,eelpout and salmon, from Swedish lakes and coastal areas. TDCPPconcentrations found were <1.1–140 lg kg�1, with the highest le-vel found in perch from fresh water close to a source. Camponeet al. (2010) analyzed 24 fish samples from Sweden. No TDCPPwas detected (LOD < 9 lg kg�1).
4.2.4. Tetrekis(2-chlorethyl)dichloroisopentyldiphosphateAccording to the SCHER V6 is not a PBT substance (SCHER,
2007b), but in a risk assessment report of V6 of the EU (2008b) itwas concluded that V6 does meet the criteria of being persistentor very persistent in the environment. Only a limited number ofstudies have been found in the literature on V6 levels in the envi-ronment. V6 concentrations detected in air from Norway were<0.2–5.2 ng m�3 and concentrations in influents and effluents were<500 ng L�1 (Green et al., 2008). No data on V6 concentrations insurface and drinking water were found in the literature studied.Green et al. (2008) reported V6 concentrations of <59–2800 lg kg�1 in sediment from a location near a car demolishingsite, which was much higher than those found in the sedimentsamples of a landfill site, which ranged from <27–<50 lg kg�1.No V6 was detected in cod liver and mussel from Norway in2008 (<20 lg kg�1) (Green et al., 2008). In none of the biota sam-ples from Norway analyzed in a study of Leonards et al. (2011)

Table 6Toxicological information of a number of PFRs.
Reproductive toxicity Developmental and birthdefect effects
Chromosomeabnormalities
Inhalation toxicity Acute toxicity Aquatic toxicity L(E)C50 Chronic toxicity LD50
RDP NOAEL = 20000 mg kg�1 d�1
2-gen. study (Pakalin et al.,2007; US-EPA, 2007)
No adverse effects found(Pakalin et al., 2007)
Not found(WashingtonState, 2006;US-EPA, 2007)
0.1 mg L�1 (Leisewitz et al., 2000) >5000 mg kg�1 (rat) (US-EPA, 2007)
BADP NOAEL = 1000 mg kg�1 d�1
(US-EPA, 2007)Not found (US-EPA, 2007)
LD50 > 2000 mg kg�1
rat (AustralianGovernment, 2000;Washington State,2006)
NOEC > 0.02 mg L�1
(daphnia)/>1000 mg kg�1
(rat) (US-EPA, 2007)
TPhP NOAEL = 690 mg kg�1 d�1
(US-EPA, 2007)Acute toxic to fish,shrimps anddaphnia’s (Lassenand Lokke, 1999)
Acutely toxic to waterorganisms (Leisewitzet al., 2000)/very toxicto aquatic ecosystems(McPherson et al., 2004)
NOEC = 0.1 mg L�1
(daphnia)/3500–10800 mg kg�1 (rat) (US-EPA, 2007)
DCP Reproductive toxin(Washington State, 2006)
Developmental toxicity(Washington State, 2006)
Not found (US-EPA, 2007)
Relatively high (WashingtonState, 2006)
LD50 > 1000 mg kg�1
(US-EPA, 2007)Moderate aquatictoxicity (WashingtonState, 2006)
Melamine poly-phosphate
LD50 > 2000 mg kg�1
(ASCC, 2006; PINFA,2011)
Diethyl-phosphinicacid
Not found (US-EPA, 2007)
LD50 > 2000 mg kg�1
(US-EPA, 2007)Toxic effects at levelsmuch higher than watersolubility (Stuer-Lauridsen et al., 2006)
NOAEL = 1000 mg kg�1 d�1
(rat) (US-EPA, 2007)
TCP Possible reproductive toxin(McPherson et al., 2004)
TCPP LD50 > 4.6 mg L�1 –>17.8 mg L�1
(Leisewitz et al., 2000)LD50 = 500–4200 mg kg�1
(Leisewitz et al.,2000)
NOEL = 36 mg kg�1 bw(Leisewitz et al., 2000)
TCEP Reproductive toxin (Chapinet al., 1997; WHO, 1998)
LD50 = 0.5–1.41 g/kgin rats (WHO, 1998)
Toxic to aquaticorganisms (Leisewitzet al., 2000; Sigma–Aldrich, 2011)
TDCPP No developmental effects(ATSDR, 2009)
Harmful (Sigma-Aldrich, 2011) LD50 > 2000 mg kg�1
rat (dermal)2000 mg kg�1 rat(oral) (WHO, 1998)
NOEL = 15.3 mg kg�1 bwper day LOEL = 62 mg kg�1
per day (WHO, 1998)
V6 Increase in thyroid weight inmales and females (EU,2008b)
NOAEL = 29 mg kg�1
bw d�1Increase in thefrequency ofcells withchromosomeaberrations
LC50 = 10–100 mg L�1 (EU,2008b)
NOEC = >3.7 mg L�1
(interverbrates) 10 mg L�1
(algae) (EU, 2008b)
1134I.van
derV
een,J.deBoer/Chem
osphere88
(2012)1119–
1153

Table 6 (continued)
Reproductive toxicity Developmental and birthdefect effects
Chromosomeabnormalities
Inhalation toxicity Acute toxicity Aquatic toxicity L(E)C50 Chronic toxicity LD50
RDP Not mutagenic (WashingtonState, 2006; US-EPA, 2007)
0.76 mg L�1
(US-EPA, 2007)12.4 mg L�1 (US-EPA, 2007) Minimal effect on
human health(McPherson et al.,2004)
BADP not mutagenic (WashingtonState, 2006; US-EPA, 2007)
Exceedssolubility (US-EPA, 2007)
Exceeds solubility Minimal irritation (US-EPA, 2007)/no irritation(AustralianGovernment, 2000)
Minimal irritation (US-EPA,2007)/no irritation(Australian Government,2000)
TPhP Not mutagenic (Lassen andLokke, 1999)
0.26–2.0 mg L�1 (US-EPA,2007)
1.0–1.2 mg L�1
(US-EPA, 2007)0.36–290 mg L�1 (US-EPA, 2007) Low impact on
human health(McPherson et al.,2004)
Moderate irritation (US-EPA, 2007)
No irritation (Lassen andLokke, 1999; US-EPA, 2007)
DCP Not mutagenic (WashingtonState, 2006; US-EPA, 2007)
1.0 mg L�1 (US-EPA, 2007) 3.7 mg L�1
(US-EPA, 2007)1.3 mg L�1 (US-EPA, 2007) Slight to moderate
irritation (US-EPA, 2007)Melamine poly-
phosphateNot mutagenic (McPhersonet al., 2004)
Low health effects(McPherson et al.,2004)
Slight irritation (ASCC,2006)/no irritation(PINFA, 2011)
No irritation (ASCC, 2006;PINFA, 2011)
Diethyl-phosphinicacid
Not mutagenic (US-EPA,2007; PINFA, 2011)
Exceeded the watersolubility (US-EPA, 2007)
Exceeds thewatersolubility (US-EPA, 2007)
Exceeds water solubility (US-EPA,2007)
Slight irritation (US-EPA, 2007)
No irritation (US-EPA,2007)
TCP Negative in SalmonellaMutagenicity test (WHO,1990)
Differ per type: 0.061–0.75 mg L�1 (Fisk et al., 2003);<1 mg L�1 (rainbow trout);8700 mg L�1 (tidewatersilverside) (Lassen and Lokke,1999).
Major hazard tohuman health(Lassen and Lokke,1999).
Harmful (Sigma–Aldrich,2011)
TCPP Potentially carcinogenic (Niet al., 2007)
51 mg L�1 (WHO, 1998) Irritating (Leisewitzet al., 2000)
Irritation (Leisewitz et al.,2000)
TCEP Carcinogenic for animals(WHO, 1998)
6.3–250 mg L�1 (Fisk et al., 2003) Negative effects onhuman health(Björklund et al.,2004)
TDCPP Carcinogenic (Andresenet al., 2004) Not genotoxic(WHO, 1998)
>2.8 mg L�1(EU, 2008a) 3.8 mg L�1,4.6 mg L�1 (Eu,2008a)
1.1 mg L�1 (Fisk et al., 2003) Irritation (Sigma-Aldrich,2011)
V6 Not mutagenic (EU, 2008b) No irritation (EU, 2008b)
I.vander
Veen,J.de
Boer/Chemosphere
88(2012)
1119–1153
1135

1136 I. van der Veen, J. de Boer / Chemosphere 88 (2012) 1119–1153
V6 was detected either, with LODs varying from <0.01 lg kg�1 forblood to <0.4 lg kg�1 for cod liver.
4.3. Summary of PFR levels in the environment
In Table 5, an overview is given of the environmental levelsof TPhP, TCP, TCPP, TCEP, TDCPP, and V6. TCPP is the most dom-inant PFR present in all of these studies, which is explained byits high production volume (see Section 3.2) and its relativelypersistent character. Environmental concentrations of the studiedPFRs in indoor air are comparable to reported concentrations(2.5–157.9 pg m�3) for PBDEs in indoor air samples from 20 ur-ban residences in the Greater Boston area (MA, USA) (Allenet al., 2007). PBDE concentrations found in computer rooms inChina in 2004 (0.7–4925 pg m�3 (Chena et al., 2008), are muchlower than concentrations found for the studied PFRs. This isalso true for PBDE 209 in computer rooms in China (80.1–13732 pg m�3, Chena et al., 2008), which is much lower thanthose reported for TCPP.
Reported concentrations ofP
PBDE in sediment from Schwe-chat (Austria), were 10.4 lg kg�1 dw (Moche et al., 2005 citedin Law et al., 2008). This is much lower than the PFR concentra-tions in sediment from in the same river. A comparison of PFRconcentrations to PBDE concentrations in water was not made,because PBDEs are more lipophilic and concentrations in waterwill be lower than those of the less lipophilic PFRs. A compari-son of PFR concentrations in biota to PBDE concentrations inbiota is not made either because of the limited data availablefor PFRs in biota. In general PFR concentrations reported werehigher than those of PBDEs, and the human exposure to PFRsby indoor air is considerably higher than due to PBDEs in indoorair.
5. Toxicological information
Fifty percent of the fire casualties are due to smoke and gases(EFRA, 2007). In all fires toxic products are formed from incompletecombustion of organic materials like plastics, wood, textiles, andpaper. Carbon monoxide (CO) is responsible for the death of 80%of those persons who die due to fire gases (Leisewitz et al.,2000). Besides CO, many other toxic components can be formedin fires, such as hydrogen cyanide, hydrogen chloride, but alsomore complex products like polycyclic aromatic hydrocarbons(PAHs) and halogenated dioxins and furans. The latter are formedin much lower quantities and are not relevant as regards acutetoxic effects, but they can have chronic health effects (Leisewitzet al., 2000). When FRs are used, the spread of fire is reduced,which can result in smaller amounts of toxic gases being released.A number of studies have been carried out on the toxic effects ofPFRs, their effects on human health and their impact on the envi-ronment. The US-EPA performed an evaluation on the toxicity ofalternatives to DecaBDE (US-EPA, 2007) and concluded thatalthough insufficient toxicity data were available on toxicity ofthe alternatives, some alternatives, like BADP and RDP, do appearto be safer than DecaBDE. According to McPherson et al. (2004) hu-man and environmental impacts of the PFRs cannot be ignored. Inthis chapter, the toxicity of a number of organic and halogen con-taining PFRs is described. In Table 6, an overview of the collectedtoxicological information is given.
5.1. Non-halogen PFRs
Most organophosphates show strong hemolytic effects (decom-position of red blood cells). Although these effects are mainlyfound in rats, adverse biological effects related to humans, such
as hemolytic and reproductive effects, have also been reported(Latendresse et al., 1994; Chapin et al., 1997).
5.1.1. Resorcinol-bis(diphenylphosphate)RDP is potentially not problematic as a substitute for decaBDE
(US-EPA, 2007), but only few health and environmental toxicitydata are available for RDP. RDP has a minimal effect on humanhealth (McPherson et al., 2004). NOEL (rat organs) was 0.1 mg L�1
(inhalative) (Leisewitz et al., 2000). Neither mutagenicity andchromosome abnormalities, nor other genotoxic effects in amouse micronucleus assay were found (Washington State,2006). To determine the reproductive toxicity a 2-generation ratstudy for RDP (Pakalin et al., 2007) was performed with concen-tration in feed of 1000, 10000, and 20000 mg kg�1. A NOEL of F1and F2 offspring of >20000 mg kg�1 were found. The study re-ported no adverse effects on reproductive performance or fertilityparameters (Pakalin et al., 2007). For the determination of terato-genicity, rabbits were exposed for a period of 6–28 d by gavage.The NOEL was determined to be higher than 1000 mg kg�1 bw.A moderate accumulation in lungs and bones was reported for acombination of RDP together with TPhP, in animal experiments.Lung weight gain, liver amplification and eye irritation werefound in rats after oral and inhalative tests (Leisewitz et al.,2000), but Leisewitz et al. (2000) also reported contradictorystatements concerning effects on the eye and irritations on themucous membranes. RDP is not mutagenic and no chromosomalabnormalities were observed (US-EPA, 2007). For the reproductiveand developmental effects a NOEL of 20000 mg kg�1 d�1 wasfound in a 2-generation rat study. This was the highest dosetested. An LD50 > 5000 mg kg�1 was reported for rat (US-EPA,2007), an LC50 of 12.4 mg L�1 for fish, and an EC50 of 0.76 mg L�1
for daphnia immobilization. Since no data could be found in theliterature on environmental levels of RDP, it is impossible to cal-culate a PEC/PNEC ratio, but concluding from the available toxicinformation, it seems not problematic to use RDP as a substitutefor BFRs.
5.1.2. Bisphenol-A diphenyl phosphateBADP is a potential substitute of decaBDE (US-EPA, 2007). It has
a low acute toxicity (>2000 mg kg�1 rat), is neither mutagenic inbacteria, nor mutagenic in the Ames test, nor mutagenic in a re-verse mutation assay (Washington State, 2006). BADP did not in-crease incidence of chromosomal aberrations in Chinese hamsterlung cells (Australian Government, 2000), it appeared to be non-clastogenic in an in vitro Chinese hamster ovary (CHO) cell assaywith and without metabolic activation, and non-clastogenic inmice bone marrow cells (at 2000 mg kg�1 at 0 and 24 h by oral ga-vage) (Washington State, 2006). For the determination of the tera-togenicity, rats were exposed for a period of 6–19 d by gavage. TheNOEL was determined to be 1000 mg kg�1 bw, which was the high-est dose tested. In another study, rats were exposed for a period of8–19 d by gavage. The NOEL was again determined to be1000 mg kg�1 bw (Pakalin et al., 2007). BADP is not mutagenicand shows no chromosomal abnormalities (US-EPA, 2007). A NOELof 1000 mg kg�1 d�1 was found for developmental effects, whichwas the highest dose tested. LD50values were higher than1000 mg kg�1 in rats. The NOECs for fish and daphnia exceededthe solubility. For the chronic toxicity a NOEC of >0.02 mg L�1
was found for daphnia reproduction. BADP shows minimal skinand eye irritation (US-EPA, 2007). Since no data could be foundin the literature on environmental levels of BADP, it is impossibleto calculate a PEC/PNEC ratio, but concluding from the availabletoxic information, it is not problematic to use BADP as a substitutefor BFRs.

I. van der Veen, J. de Boer / Chemosphere 88 (2012) 1119–1153 1137
5.1.3. Triphenyl phosphateTPhP is potentially problematic as replacement of decaBDE
(US-EPA, 2007). A number of studies have been performed onthe toxicity of TPhP, with different conclusions. Andresen et al.(2004) reported TPhP is possibly neurotoxic, and Ni et al. (2007)mention an association of TPhP with delayed neurotoxicity.Pakalin et al. (2007) on the contrary mention a low neurotoxicity.The Danish EPA (Lassen and Lokke, 1999) found no evidence ofTPhP causing neurotoxicity in animal experiments and ATSDR(2009) reported that no symptoms or physical or laboratory find-ings were detected over the years on a small group of operatorsin a TPhP production plant, compared to unexposed groups. TPhPis suspected of being a sensitizer for allergies according toHartmann et al. (2004), who concluded this from theEnvironmental Health Criteria (EHC) 111 (1991). A single caseof allergy could also have been due to TCP (Carlsen et al., 1986cited in WHO, 1991). Hence, it is not possible to conclude thatTPhP is a sensitizer for allergies. TPhP has been shown to causecontact dermatitis (Camarasa and Serra-Baldrich, 1992 cited inBjörklund et al., 2004), and it can inhibit human blood monocytecarboxylesterase, which affects the immunologic defense system(Saboori et al., 1991). The World Health Organization (WHO)(1991) concludes as water concentrations of TPhP in the environ-ment are low, toxic effects on aquatic organisms are unlikely, andsince TPhP is removed rapidly from the tissues of fish after expo-sure and BCFs are moderate, bioaccumulation is not considered tobe a hazard. Leisewitz et al. (2000) stated that TPhP is acutelytoxic to water organisms (Leisewitz et al., 2000), and Lassenand Lokke (1999) state that TPhP is the most acute toxic triarylphosphate to fish, shrimps and daphnia. The growth of algae iscompletely inhibited at TPhP concentrations of 1 mg L�1 or more,but is stimulated at lower concentrations. The acute toxicity in-dex of TPhP for fish (96 h LC50) ranges from 0.36 mg L�1 in rain-bow trout to 290 mg L�1 in bluegills (Lassen and Lokke, 1999).TPhP has a low impact on human health, but is very toxic toaquatic ecosystems (McPherson et al., 2004). Animal data indicatethe low toxicity of TPhP, and TPhP produces no irritant effects onanimal skin (Lassen and Lokke, 1999). TPhP is not mutagenic (Las-sen and Lokke, 1999; US-EPA, 2007). Meeker and Stapleton (2010)reported that TPhP in house dust may be associated with alteredhormone levels and decreased sperm concentration. For thedevelopmental and birth defect effects in rats a NOEL of690 mg kg�1 d�1, was found which was the highest dose tested(US-EPA, 2007). For the acute toxicity in rats LD50 values of3500–10800 mg kg�1 were found and for algal inhibition anEC50 of 0.26–2.0 mg L�1 was reported. The LC50 of daphnia was1.0–1.2 mg L�1, and the LC50 for fish was 0.36–290 mg L�1. Forthe chronic toxicity an estimated NOEC for daphnia of 0.1 mg L�1
was found and a NOEC of 0.0014 mg L�1 was found for survivaland growth of fish. According to the US-EPA (2007) this level isof high concern. TPhP shows no skin irritation and moderateeye irritation (US-EPA, 2007). Since the highest concentrationfound for TPhP in surface water was 40 ng L�1 (see Section4.1.3) and the estimated NOEC for daphnia was 0.1 mg L�1, thePEC/PNEC ratio for water compartments is 0.0004, which meansno adverse effects are expected.
5.1.4. DiphenylcresylphosphateAccording the US-EPA (2007) DCP is potentially problematic for
replacement of decaBDE. DCP has a low acute oral toxicity in multi-ple species. The inhalation toxicity tested with sheep(LC50 > 0.37 mg m�3 h�1), is relatively high. DCP has a reproductiveand developmental toxicity and has a moderate aquatic toxicity(Washington State, 2006). According to Sigma-Aldrich (2011)DCP is toxic to aquatic organisms and it may cause chronic adverseeffects. In contrast with this, the US-EPA (2007) reported that no
fish data are available. DCP is not mutagenic and shows no chro-mosomal abnormalities (Washington State, 2006; US-EPA, 2007).For the reproductive and developmental effects in rats, a NOELfor sperm effects was found to be 60 mg kg�1 d�1. For the acutetoxicity in rats, mice, rabbits, and guinea pigs LD50values higherthan 1000 mg kg�1 were reported and for the algal inhibition anEC50 of 1.0 mg L�1 was reported. The EC50 of daphnia immobiliza-tion was 3.7 mg L�1, and the LC50 for fish was 1.3 mg L�1. A NOECof 0.55 mg L�1 was found for algal inhibition and a NOEC of0.12 mg L�1 was found for daphnia. DCP shows slight to moderateskin irritation (US-EPA, 2007). Since no data could be found in theliterature on environmental levels of DCP, it is impossible to calcu-late a PEC/PNEC ratio, but concluding from the available toxicinformation, it is not problematic to use DCP as a substitute forBFRs.
5.1.5. Melamine polyphosphateThe acute toxicity (LD50) of melamine polyphosphate was high-
er than 2000 mg kg�1 bw for rats (ASCC, 2006; PINFA, 2011). Mel-amine polyphosphate causes no skin irritation (ASCC, 2006; PINFA,2011). Melamine polyphosphate causes no eye irritation either(PINFA, 2011), but the ASCC (2006) reported that melamine poly-phosphate was slightly irritating to the eye. All irritation effectswere completely recovered within 48 h. Melamine polyphosphatehas low health effects and there is no evidence of irritation, cancerinduction or mutagenicity (McPherson et al., 2004). The only eco-toxicity available for the melamine polyphosphate is algal toxicity(LC50 > 3 mg L�1, NOEC = 3 mg L�1). In all test concentrationsundissolved material was observed, so the polymer is not toxicto algae up to the limit of its solubility (ASCC, 2006). Since no datacould be found in the literature on environmental levels of mela-mine polyphosphate, it is impossible to calculate a PEC/PNEC ratio,but concluding from the available toxic information, it seems notproblematic to use melamine polyphosphate as a substitute forBFRs.
5.1.6. Diethylphosphinic acidAccording to the US-EPA (2007), there is insufficient data
available to decide whether diethylphosphinic acid is a propersubstitute for decaBDE. The Danish EPA stated diethylphosphinicacid does not appear to have a stronger negative impact on theenvironment, and human health than decaBDE (Stuer-Lauridsenet al., 2006). No mutagenic activity was observed for Salmonellatyphimurium and in a cytogenetic in vitro assay with and withoutmetabolic activation. Diethylphosphinic acid does not seem topose a mutagenic risk (Stuer-Lauridsen et al., 2006). The resultsof aquatic toxicity tests, performed by Stuer-Lauridsen et al.(2006), with diethylphosphinic acid, indicate that toxic effects oc-cur at levels much higher than the estimated water solubilitywith LC50 values higher than 100 mg L�1, corresponding to mea-sured concentrations between 11–33.7 mg L�1. Unfortunately,Stuer-Lauridsen et al. (2006) do not mention the tested species.However, based on these data, diethylphosphinic acid is not con-sidered to be toxic (Stuer-Lauridsen et al., 2006). Diethylphosphi-nic acid is not mutagenic and shows no chromosomalabnormalities (US-EPA, 2007). For the systemic toxicity a NOELof 1000 mg kg�1 d�1 was found for rats, which was the highestdose tested. For the acute toxicity in rats an LD50 higher than2000 mg kg�1 d�1 was reported and for daphnia and for fish theLC50 exceeds the water solubility. The NOEC for algal inhibitionexceeded the water solubility and a NOEC of 1–10 mg L�1 wasfound for daphnia. No fish NOEC is reported. Diethylphosphinicacid showed no skin irritation, and only a slight eye irritation(US-EPA, 2007). Since no data could be found in the literatureon environmental levels of diethylphosphinic acid, it is impossibleto calculate a PEC/PNEC ratio, but concluding from the available

1138 I. van der Veen, J. de Boer / Chemosphere 88 (2012) 1119–1153
toxic information, it seems not problematic to use diethylphos-phinic acid as a substitute for BFRs.
5.1.7. TricresylphosphateThe toxicity of TCP, used as an anti-wear additive in aircraft
turbine engine oil, has been of great concern. This is largely basedon the o-TCP isomer content (De Nola et al., 2008). The toxicity ofTCP differs per isomer. The o-isomer (o,o,o) was initially consid-ered to be the most toxic isomer, with a MAC value of 0.1 mg m�3
(=0.0065 ppm) for 8 h, and it has been removed as much as possi-ble from commercial products (Lassen and Lokke, 1999; Ten Bergeet al., 2005). However, the three mono-o-cresyl isomers of TCP(omm, omp, opp) and the two di-o-cresyl phosphate isomers(oom, oop) are now regarded as being 10 times and 5 times,respectively, more toxic than o-TCP. The other isomers, whichcontain only meta and para are not considered to be neurotoxic(De Nola et al., 2008). TCP is considered to pose a major hazardto human health (Lassen and Lokke, 1999). It is harmful if swal-lowed and harmful in contact with skin (Sigma-Aldrich, 2011). Itis a possible reproductive toxin (McPherson et al., 2004) and itis toxic to the central nervous system (Bolgar et al., 2008). How-ever, TCP produced from synthetic cresol, which contains lessthan 0.1% of o-cresol, is not neurotoxic (Lassen and Lokke,1999). The 50% growth inhibitory concentration of TCP to fresh-water algae ranges from 1.5 to 5.0 mg L�1. The rainbow trout isadversely affected by TCP concentrations <1 mg L�1, with sign ofchronic poisoning, but the tidewater silverside (Menidia peninsu-lae) has a LC50 value of 8700 mg L�1 (Lassen and Lokke, 1999).For daphnia a 48-h LC50 was found to be 5.6 mg L�1 and a 2-weekNOEL for daphnia (mortality, growth, reproduction) was0.1 mg L�1. The 96-h LC50 values for three fish species varied be-tween 4.0 and 8700 mg TCP L�1 (WHO, 1990). However, otherstudies showed 96-h LC50 values from 0.061 to 0.75 mg L�1, ofwhich the latest test concentrations exceed the water solubility(Fisk et al., 2003). Hence, TCP is considered to be hazardous forthe environment and toxic to aquatic organisms. (Sigma-Aldrich,2011). For food contact applications TCP is not approved by theFDA (Bolgar et al., 2008).
5.2. Halogen containing PFRs
5.2.1. Tris(chloropropyl)phosphateTCPP is considered to be potentially carcinogenic (Ni et al.,
2007). The acute oral, the inhalative and the dermal toxicity havebeen tested in rats (Leisewitz et al., 2000). The LD50 values ranged500–4200 mg kg�1 bw, higher than 4.6 mg L�1 to higher than17.8 mg L�1 and 1230–5000 mg kg�1 bw, respectively. TCPP is notacutely toxic, and for the chronic toxicity a NOEL of 36 mg kg�1
bw was found (Leisewitz et al., 2000). TCPP accumulates in the li-ver and kidneys, whereas it is metabolized in hydroxides of phos-phorous acid, which was shown in animal experiments (Leisewitzet al., 2000). TCPP decreases cell number and alters neurodifferen-tiation (Dishaw et al., 2011).
TCPP is irritating to skin and eyes of rats (Leisewitz et al., 2000).TCPP has a documented 96-h LC50 value of 51 mg L�1 for fatheadminnow (Pimephales promelas) and a NOEC of 9.8 mg L�1 (WHO,1998; Fisk et al., 2003). These concentrations are clearly abovethe concentrations measured in water (Leisewitz et al., 2000).
No hazard data are available for outdoor air (Leisewitz et al.,2000). Since the highest concentration found for TCPP in surfacewater was 200 ng L�1 (see Section 4.2.1) and a NOEC of 9.8 mg L�1
was reported, the PEC/PNEC ratio for water compartments is0.00002, which means no adverse effects are expected. Althoughthe conclusion from the PEC/PNEC ratio is that the compoundcan be used, it is not recommended to use TCPP as a substitute
for BFRs, because TCPP accumulates in the liver and kidneys andit is potentially carcinogenic.
5.2.2. Tris(2-chloroethyl)phosphateTCEP is toxic to aquatic organisms and it may cause chronic ad-
verse effects (Sigma-Aldrich, 2011). TCEP is carcinogenic for ani-mals (WHO, 1998), is a neurotoxin in rats and mice (Tilson et al.,1990; Umezu et al., 1998) and has beem shown to induce adversereproductive effects in rats (Chapin et al., 1997). Adverse biologicaleffects related to humans have also been reported, such as hemo-lytic and reproductive effects, like reduced fertility, a longer es-trous cycle length, reduced sperm motility and reduced spermdensity (Chapin et al., 1997). LC50 values reported for fish (96-h)by Fisk et al. (2003) varied from 6.3 to 250 mg L�1. Toxic effectsof TCEP in animals and people are not well-known, but Lehneret al. (2010) linked acute deaths of dogs after ingestion of car seatcushions, which contained large amounts of TCEP, but potentialinteraction among different compounds is possible. Summarizingthe toxic effects reported, it seems obvious that since the 1980sworldwide use and production of TCEP is being phased out for tox-icity reasons (WHO, 1998), which means that TCEP may not be pro-duced and used any longer. However, according to Quednow andPüttmann (2009), TCEP is not regulated by legislation, but has beenreplaced in some products under consumer pressure. In August2009 Environment Canada and Health Canada proposed a riskmanagement objective for TCEP, with the objective to reduce expo-sures to TCEP by eliminating it from furniture and electronic prod-ucts (e.g., televisions and computers); adhesives; non-appareltextiles; upholstery; the back-coating of carpets; rubber and plas-tics; and paints and varnishes in the home. The risk managementbeing considered is to prohibit the use of TCEP in these productsand materials. The final extent of this prohibition will be deter-mined upon further consultation and discussion with stakeholders(Government of Canada, 2009). Large quantities of TCEP have al-ready been used in buildings, and these may remain active sourcesfor several years (Andresen et al., 2004). According to the SCHER,the PEC/PNEC ratios are below 1 for all compartments, but mostlyabove 0.1 for both the aquatic and the terrestrial compartments(SCHER, 2006). This means no adverse effects are expected.Although the conclusion from the PEC/PNEC ratio is that the com-pound can be used, it is not recommended to use TCEP as a substi-tute for BFRs. When the concentrations in the environment willincrease, the PEC/PNEC ratio will also increase and may becomehigher than 1, implying that it is not safe to use TCEP. Beside thePEC/PNEC ratio, a lot of other toxic effects were reported, whichalso indicates that TCEP is not a proper substitute for BFRs.
5.2.3. Tris(1,3-dichloro-2-propyl)phosphateTDCPP is harmful when inhaled (Sigma-Aldrich, 2011). It can
enter the body, where it easily can enter the blood stream (ATSDR,2009). Tumors were observed in the liver, kidneys and testes ofrats which were fed with TDCPP for 2 years (ATSDR, 2009). Accord-ing to ATSDR (2009) there is no significant relation found betweenexposure to TDCPP and cancer, but Andresen et al. (2004) and theWHO (1998) report TDCPP is carcinogenic. Mutagenicity data showthat TDCPP is not genotoxic (WHO, 1998). No developmental ef-fects were observed by rats exposed to TDCPP during pregnancy(ATSDR, 2009). Dishaw et al. (2011) performed a study on theneurotoxicity of TDCPP and found that TDCPP showed concentra-tion-dependent neurotoxicity, inhibited DNA synthesis, and de-creased cell number and altered neurodifferentiation. No adverseeffect on cell viability or grow was detected, but elevated oxidativestress was shown. TDCPP showed to be more neurotoxic than TCEPand TCPP, which only promoted the cholinergic phenotype. TDCPPdata on LD50 for rats by the oral and dermal route were 2300 and>2000 mg kg�1 bw respectively (WHO, 1998). The toxicity to fish

I. van der Veen, J. de Boer / Chemosphere 88 (2012) 1119–1153 1139
was determined to 1.1 mg L�1 (96 h LC50) (Fisk et al., 2003). Acutetoxicity data determined for daphnia were 3.8 mg L�1 and4.6 mg L�1 (48 h EC50; EU, 2008a). Results of algal inhibition testgave 72 and 96 h EC50 values of >2.8 mg L�1 (EU, 2008a). A NOELof 15.3 mg kg�1 bw d�1 was determined for mice and the lowest-observed level (LOEL) for increased liver weight was 62 mg kg�1
bw d�1 (WHO, 1998). TDCPP is irritating to the skin (Sigma-Aldrich, 2011).
5.2.4. Tetrekis(2-chlorethyl)dichloroisopentyldiphosphateV6. is more toxic to fish and invertebrates than TCEP, and it may
cause long term effects in the aquatic environment. For V6 a NOELwas determined as 15 mg kg�1 d�1 (Herzke et al., 2007). NOEC val-ues for daphnia and algae are >1 mg L�1 (Green et al., 2008). Acutetoxicity LC50 values for fish, daphnia and algae are 10–100 mg L�1
(EU, 2008b). NOEC for chronic toxicity for interverbrates and algaeare >3.7 and 10 mg L�1 (EU, 2008b). There is no indication that V6is neurotoxic. V6 is not mutagenic, and no significant skin irritationwas observed (EU, 2008b). Reproductive toxicity studies show anincrease in thyroid weight in males and females, and an increasein the frequency of cells with chromosome aberrations was ob-served. No effects were detected on the male or female reproduc-tive systems. The NOAEL for developmental toxicity is29 mg kg�1 bw d�1. No data are available on inhalation and dermalrepeated dose toxicity (EU, 2008b).
6. PFRs versus BFRs
PFRs haven been used as FR because of their different or com-plementary use and function compared BFRs (see Section 2.2).However, nowadays PFRs are also used as substitutes for BFRs be-cause the use of the latter are restricted more and more. Phospho-rus compounds have some advantages compared to BFRs. During afire toxic by-products are created from BFRs. Due to the char,which is formed when using PFRs, emission of gases is reducedand in that way the release of toxic gases from phosphorus-basedcompounds is far lower than of BFRs (McPherson et al., 2004). Inaddition, when using PFRs, the combustion gases are not contam-inated with additional corrosive gases (HCl, HBr) from the FR(Lenoir et al., 1994 cited in Hörold, 1999; Hörold, 1999). Accordingto the available environmental and toxicity data (see Sections 4and 5), no problems are expected when replacing BFRs by RDP,BADP, or melamine polyphosphate. Only the Cl-containing PFRsare proven to be carcinogenic, and severe negative human healtheffects were found for Cl-containing PFRs as well as for TCP (seeSection 5), which makes those PFRs unsuitable as alternatives forBFRs. TPhP, DCP and TCEP would also not be suitable alternativesfor BFRs, because they are considered to be toxic to (aquatic)organisms and/or (potential) carcinogenic (Section 5). Diethyl-phosphinic acid is, just like TCEP, considered to be very persistent,which does not make diethylphosphinic acid a proper substitutefor BFRs either. In conclusion, based on the currently availableenvironmental and toxicity data, RDP, BADP and melamine poly-phosphate may be considered as suitable substitutes for BFRs,but TPhP, DCP, diethylphosphinic acid, TCP, TCPP and TCEP arenot recommended as alternatives for BFRs.
7. Environmental analytical methods
7.1. Sampling and extraction
7.1.1. AirSeveral techniques are used for air sampling for PFR analysis.
Ni et al. (2007) developed a passive flux sampler, and Hartmannet al. (2004) collected air samples on polyurethane foam plugs
(PUFs) at a sampling rate of 4 L min�1 taken for approximately8 h. Tripropyl phosphate was added as an internal standard priorto extraction with methylene chloride and ultrasonication (US).The extracts were transferred into hexane followed by rotary-evaporation to 100 lL, and transferred into injection vials.Tollbäck et al. (2006) collected air samples using C8 Empore solidphase extraction (SPE) membranes. The analytes trapped in themembrane are completely desorbed with methanol, using anextraction cell connected online to an HPLC gradient pump. Sam-pling with Empore SPE has some advantages. This technique en-ables the collection of analytes in both the vapor phase and inparticulate matter, and, in addition, the membranes can be cou-pled directly to an LC system for extraction and analyses, whichsimplifies sample preparation and reduces analysis time (Tollbäcket al., 2006). Staaf and Ostman (2005) used SPE cartridges for airsampling. SPE cartridges are suitable for online coupling withHPLC, with the same benefit of simplifying sample preparationand reduction of analysis time. A general advantage of usingSPE cartridges for air sampling is the possibility of fractionationof the sample during extraction/elution of the cartridge with dif-ferent portions of solvent. A disadvantage of SPE cartridges is thehigher backpressure when pumping air through a cartridge, com-pared to standard air sampling adsorbents. Thus, the method islimited to the use of small SPE cartridges, i.e. containing 10–25 mg of stationary phase/adsorbent (Staaf and Ostman, 2005).Four different SPE stationary phases, aminopropylsilica (25 mg,1 mL), 2,3-dihydroxypropoxypropylsilica (25 mg), cyanopropylsil-ica (25 mg) and ENV + (10 mg), were tested by Staaf and Ostman(2005). Elution of the SPE cartridge was performed with n-hex-ane, methyl-tertiary-butyl ether (MTBE) and/or acetone to findthe optimal SPE stationary phase and a suitable elution solvent.The aminopropyl silica phase showed the most suitable proper-ties of all stationary phases tested. Extraction and elution of theOPEs from the cartridge was done with MTBE. Recoveries of allOPEs tested were 95–116% with an RSD of 1–9% based on fivereplicates. LODs for the SPE sampling method with GC–NPDdetection were 0.1–0.3 ng m�3. Sampling with glass fiber filterswas also tested by Staaf and Ostman (2005). The OPEs were ex-tracted from the filters by US with acetone. Tripentyl phosphatewas used as a volumetric internal standard and was added justprior to analysis. When comparing concentrations measured afterSPE cartridge sampling with those obtained from a glass fiber fil-ter sampling, the results agree rather well, except for three of theanalyzed OPEs (Staaf and Ostman, 2005). TEP showed an almost5-fold higher concentration in the measurements using the SPEadsorbent. A probable explanation is that due to the low molecu-lar weight (182) and a relatively high vapor pressure (0.393 mmHg) it might evaporate from the filter during sampling. Tributoxyphosphate also showed a higher concentration after SPE. This isexplained by the more laborious handling during the extractionof the filters. This compound tends to adsorb to glass surfacesand is therefore difficult to determine with good precision andaccuracy (Staaf and Ostman, 2005). TCPP showed about half theconcentration when analyzed after SPE compared to the filter.In this case the glass fiber filter method showed a precision withan RSD of 68%, which is the reason no definite conclusions can bedrawn for this compound (Staaf and Ostman, 2005). The recoveryof TCPP was 105% in a recovery test. With air samples the use ofmore MTBE and acetone was tested, but this did not result in ahigher concentration of TCPP. A possible explanation for findingonly half of the concentration of TCPP could be the efficiency ofthe sampling itself. Therefore, SPE should rather be used than aglass fiber filter for sampling air for PFR analysis except for TCPP.While Staaf and Ostman (2005) used acetone for the extraction ofPFRs from a glass fiber filter, Carlsson et al. (1997) used dichloro-methane (DCM) to compare Soxhlet extraction to US. The

Fig. 6. Extraction efficiencies for different SPME fibers. Normalized responses to thePDMS–DVB fiber (Rodriguez et al., 2006).
1140 I. van der Veen, J. de Boer / Chemosphere 88 (2012) 1119–1153
recovery of TBEP with Soxhlet extraction was 37%, while USyielded a recovery of >95% (Carlsson et al., 1997). The low recov-ery after Soxhlet extraction was due to adsorption to the largeglass surfaces of the equipment and to the rotary evaporator flaskused (Carlsson et al., 1997). Another advantage of using US is theshort time needed compared to Soxhlet extraction (Carlsson et al.,1997). Air sampling by Björklund et al. (2004) was performedusing anodized aluminum sampler holders equipped with a25 mm binder-free A/E borosilicate glass fiber filter and a back-up cellulose AP10 filter connected to battery-operated personalsampler pumps operating with a flow of 3 L min�1 for 8 h. Asinternal standard, diphenyl methyl phosphate was added to eachfilter prior to extraction. US extraction was performed with DCM.The extracts were evaporated under a nitrogen stream. Anotherair sampling technique for PFR analysis used by Isetun et al.(2004) was solid phase micro-extraction (SPME) – time-weightedaverage (TWA) sampling. SPME is a simple sampling techniquewith several major advantages, including time-efficiency andlow solvent consumption. Analyte losses also tend to be relativelylow (Isetun et al., 2004). In quantitative SPME, measurements arenormally taken after the analyte has reached partitioning equilib-rium between the fiber and the sample matrix. However, equilib-rium settling of semi-volatile compounds in air with SPME oftentakes several h. Time-weighted average (TWA) sampling usingSPME under non-equilibrium conditions is much faster andproved to be a good alternative for normal SPME (Isetun et al.,2004). The most important variables when using TWA are the fi-ber coating and the air velocity during sampling (Isetun et al.,2004).
7.1.2. WaterAndresen et al. (2004) analyzed 7 PFRs including, TCEP, TCPP,
TDCPP, and TPhP, in surface waters. For extraction of the watersamples liquid–liquid extraction (LLE) with toluene was used.D27-TBP was added as internal standard. The final volume ofthe extract was 1 mL. For TCEP the LLE extractions gave verypoor recoveries (31% with RSD 33%), but when SPE, with extrac-tion solvents MTBE and toluene, was used recoveries increasedto 67% for TCEP with an RSD of 15%. The recoveries for theLLE extraction off all other determined compounds were 89–107% with 12–27% RSD. Using LLE for extracting PFRs from aque-ous samples has many disadvantages, such as the requirement oflarge volumes of organic solvents, foam formation, length ofextraction time, chemical background originating from glasswareand difficulties in automation (Fries and Püttmann, 2001). Anadvantage of SPME on the other hand is the absence of matrixeffects, although TEHP cannot be determined with this method.This is not only a disadvantage of SPME, but also of SPE with
OASIS HLB. Another potential shortcoming of SPME, particularlywhen using direct sampling, is the dependence of the extractionyield from the sample type. In such a case, quantification shouldbe performed using the time consuming standard addition meth-od (Rodriguez et al., 2006). Kim et al. (2007) analyzed surface,drinking and waste water. All target compounds were extractedusing hydrophilic–lipophilic balance SPE cartridges (Waters HLB),with a sample intake of 1000 mL. Methanol was used for elutionof the compounds, followed by methanol/MTBE (10/90). Therecoveries found for all the compounds ranged from 68% to112% with RSDs <20%. Rodrıguez et al. (2006) tested the feasibil-ity of SPME for the determination of several PFRs, includingTCEP, TCPP, and TPhP in water with GC–NPD. Six different typesof SPME fibers were tested: poly(dimethylsiloxane) (PDMS,100 lm film thickness); polyacrylate (PA, 85 lm film thickness);carboxen–PDMS (CAR–PDMS, 75 lm film thickness);poly(dimethylsiloxane)-divinylbenzene (PDMS–DVB, 65 lm filmthickness); carbowax–DVB (CW–DVB, 75 lm film thickness);PDMS–CAR–DVB (30/50 lm film thickness). Fig. 6 shows theextraction efficiency of the different fibers. Responses for eachcompound were normalized to those achieved with the PDMS–DVB one. Maximum efficiencies were achieved using PDMS–DVB and PDMS–CAR–DVB fibers. PDMS–DVB showed no carry-over effect, where with PDMS–CAR–DVB important memory ef-fects (ca. 40% of the peak area in the first desorption) werenoticed for TPhP. These results show that the PDMS–DVB fiberwas the best fiber for extracting PFRs from water. Results of thisSPME method were compared to an SPE method with OASIS HLBcartridges (60 mg), which were eluted with ethyl acetate. Recov-eries for the SPE method were 83–105% for all tested com-pounds, except for TEHP (not detected – 51.8%). Sorption ofTEHP on glass material used for preparing the spiked samples,and association to dissolved organic matter in the case of sewagewater, may be responsible for the losses of this compound. LOQsof the method, except for TEHP, ranged from 0.005 to0.010 ng mL�1 and the RSDs were 1.9–16.7% (Rodriguez et al.,2006). Bacaloni et al. (2007) tested three SPE sorbents for PFRanalyses (including TCEP, TCPP, TDCPP, TCP, and TPhP) of water,LC-18, Oasis HLB and Bakerbond (Hydrophilic-DVB). Bakerbondshowed the highest recovery (82–108%, 35% for TMP) for theanalytes, and in addition, this cartridge provided a faster extrac-tion procedure.
7.1.3. SedimentA number of PFR analyses in sediment have been reported.
Ishikawa et al. (1985) analyzed sediment, which was collectedwith an Ekman-Berge dredge instrument. Seven PFRs were ana-lyzed, including TCEP, TCPP, TCP and TPhP. All samples were col-lected in 3 L glass bottles that had been cleaned with acetone.Extraction of PFRs was performed with acetone and for clean upa Florisil column (10 � 1 cm) was used. For the extraction of PFRsfrom sediments from rivers in Spain and the USA, microwave-as-sisted extraction (MAE) was used by García-López et al. (2009).Ethyl acetate, DCM and acetone, were tested as extraction solvents,resulting in extraction with acetone followed by extraction withACN providing the best results for the extraction of PFRs withMAE. Silica cartridges of 50 mg were used for cleanup of the ex-tracts. An advantage of MAE is the limited time needed and thesmall amounts of solvents needed compared to other extractionmethods like Soxhlet extraction, reflux heating, ultrasound-as-sisted solvent extraction or combination of sonication and shakingwith acetone first and methanol second. Martínez-Carballo et al.(2007) analyzed PFRs in sediments from Austria. They performedextraction of PFRs from the sediment with ultrasound-assisted sol-vent extraction with ethyl acetate/acetonitrile (ACN) (30:70, v/v)after drying of the sediment samples at 30 �C and sieving below
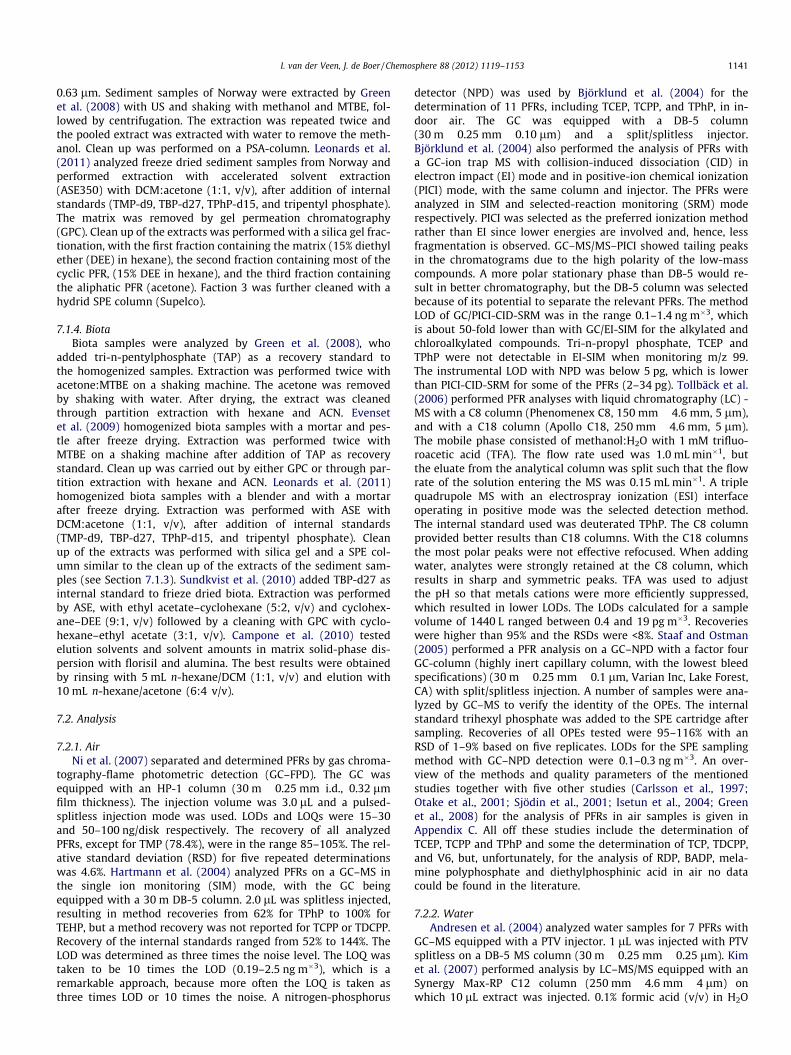
I. van der Veen, J. de Boer / Chemosphere 88 (2012) 1119–1153 1141
0.63 lm. Sediment samples of Norway were extracted by Greenet al. (2008) with US and shaking with methanol and MTBE, fol-lowed by centrifugation. The extraction was repeated twice andthe pooled extract was extracted with water to remove the meth-anol. Clean up was performed on a PSA-column. Leonards et al.(2011) analyzed freeze dried sediment samples from Norway andperformed extraction with accelerated solvent extraction(ASE350) with DCM:acetone (1:1, v/v), after addition of internalstandards (TMP-d9, TBP-d27, TPhP-d15, and tripentyl phosphate).The matrix was removed by gel permeation chromatography(GPC). Clean up of the extracts was performed with a silica gel frac-tionation, with the first fraction containing the matrix (15% diethylether (DEE) in hexane), the second fraction containing most of thecyclic PFR, (15% DEE in hexane), and the third fraction containingthe aliphatic PFR (acetone). Faction 3 was further cleaned with ahydrid SPE column (Supelco).
7.1.4. BiotaBiota samples were analyzed by Green et al. (2008), who
added tri-n-pentylphosphate (TAP) as a recovery standard tothe homogenized samples. Extraction was performed twice withacetone:MTBE on a shaking machine. The acetone was removedby shaking with water. After drying, the extract was cleanedthrough partition extraction with hexane and ACN. Evensetet al. (2009) homogenized biota samples with a mortar and pes-tle after freeze drying. Extraction was performed twice withMTBE on a shaking machine after addition of TAP as recoverystandard. Clean up was carried out by either GPC or through par-tition extraction with hexane and ACN. Leonards et al. (2011)homogenized biota samples with a blender and with a mortarafter freeze drying. Extraction was performed with ASE withDCM:acetone (1:1, v/v), after addition of internal standards(TMP-d9, TBP-d27, TPhP-d15, and tripentyl phosphate). Cleanup of the extracts was performed with silica gel and a SPE col-umn similar to the clean up of the extracts of the sediment sam-ples (see Section 7.1.3). Sundkvist et al. (2010) added TBP-d27 asinternal standard to frieze dried biota. Extraction was performedby ASE, with ethyl acetate–cyclohexane (5:2, v/v) and cyclohex-ane–DEE (9:1, v/v) followed by a cleaning with GPC with cyclo-hexane–ethyl acetate (3:1, v/v). Campone et al. (2010) testedelution solvents and solvent amounts in matrix solid-phase dis-persion with florisil and alumina. The best results were obtainedby rinsing with 5 mL n-hexane/DCM (1:1, v/v) and elution with10 mL n-hexane/acetone (6:4 v/v).
7.2. Analysis
7.2.1. AirNi et al. (2007) separated and determined PFRs by gas chroma-
tography-flame photometric detection (GC–FPD). The GC wasequipped with an HP-1 column (30 m � 0.25 mm i.d., 0.32 lmfilm thickness). The injection volume was 3.0 lL and a pulsed-splitless injection mode was used. LODs and LOQs were 15–30and 50–100 ng/disk respectively. The recovery of all analyzedPFRs, except for TMP (78.4%), were in the range 85–105%. The rel-ative standard deviation (RSD) for five repeated determinationswas 4.6%. Hartmann et al. (2004) analyzed PFRs on a GC–MS inthe single ion monitoring (SIM) mode, with the GC beingequipped with a 30 m DB-5 column. 2.0 lL was splitless injected,resulting in method recoveries from 62% for TPhP to 100% forTEHP, but a method recovery was not reported for TCPP or TDCPP.Recovery of the internal standards ranged from 52% to 144%. TheLOD was determined as three times the noise level. The LOQ wastaken to be 10 times the LOD (0.19–2.5 ng m�3), which is aremarkable approach, because more often the LOQ is taken asthree times LOD or 10 times the noise. A nitrogen-phosphorus
detector (NPD) was used by Björklund et al. (2004) for thedetermination of 11 PFRs, including TCEP, TCPP, and TPhP, in in-door air. The GC was equipped with a DB-5 column(30 m � 0.25 mm � 0.10 lm) and a split/splitless injector.Björklund et al. (2004) also performed the analysis of PFRs witha GC-ion trap MS with collision-induced dissociation (CID) inelectron impact (EI) mode and in positive-ion chemical ionization(PICI) mode, with the same column and injector. The PFRs wereanalyzed in SIM and selected-reaction monitoring (SRM) moderespectively. PICI was selected as the preferred ionization methodrather than EI since lower energies are involved and, hence, lessfragmentation is observed. GC–MS/MS–PICI showed tailing peaksin the chromatograms due to the high polarity of the low-masscompounds. A more polar stationary phase than DB-5 would re-sult in better chromatography, but the DB-5 column was selectedbecause of its potential to separate the relevant PFRs. The methodLOD of GC/PICI-CID-SRM was in the range 0.1–1.4 ng m�3, whichis about 50-fold lower than with GC/EI-SIM for the alkylated andchloroalkylated compounds. Tri-n-propyl phosphate, TCEP andTPhP were not detectable in EI-SIM when monitoring m/z 99.The instrumental LOD with NPD was below 5 pg, which is lowerthan PICI-CID-SRM for some of the PFRs (2–34 pg). Tollbäck et al.(2006) performed PFR analyses with liquid chromatography (LC) -MS with a C8 column (Phenomenex C8, 150 mm � 4.6 mm, 5 lm),and with a C18 column (Apollo C18, 250 mm � 4.6 mm, 5 lm).The mobile phase consisted of methanol:H2O with 1 mM trifluo-roacetic acid (TFA). The flow rate used was 1.0 mL min�1, butthe eluate from the analytical column was split such that the flowrate of the solution entering the MS was 0.15 mL min�1. A triplequadrupole MS with an electrospray ionization (ESI) interfaceoperating in positive mode was the selected detection method.The internal standard used was deuterated TPhP. The C8 columnprovided better results than C18 columns. With the C18 columnsthe most polar peaks were not effective refocused. When addingwater, analytes were strongly retained at the C8 column, whichresults in sharp and symmetric peaks. TFA was used to adjustthe pH so that metals cations were more efficiently suppressed,which resulted in lower LODs. The LODs calculated for a samplevolume of 1440 L ranged between 0.4 and 19 pg m�3. Recoverieswere higher than 95% and the RSDs were <8%. Staaf and Ostman(2005) performed a PFR analysis on a GC–NPD with a factor fourGC-column (highly inert capillary column, with the lowest bleedspecifications) (30 m � 0.25 mm � 0.1 lm, Varian Inc, Lake Forest,CA) with split/splitless injection. A number of samples were ana-lyzed by GC–MS to verify the identity of the OPEs. The internalstandard trihexyl phosphate was added to the SPE cartridge aftersampling. Recoveries of all OPEs tested were 95–116% with anRSD of 1–9% based on five replicates. LODs for the SPE samplingmethod with GC–NPD detection were 0.1–0.3 ng m�3. An over-view of the methods and quality parameters of the mentionedstudies together with five other studies (Carlsson et al., 1997;Otake et al., 2001; Sjödin et al., 2001; Isetun et al., 2004; Greenet al., 2008) for the analysis of PFRs in air samples is given inAppendix C. All off these studies include the determination ofTCEP, TCPP and TPhP and some the determination of TCP, TDCPP,and V6, but, unfortunately, for the analysis of RDP, BADP, mela-mine polyphosphate and diethylphosphinic acid in air no datacould be found in the literature.
7.2.2. WaterAndresen et al. (2004) analyzed water samples for 7 PFRs with
GC–MS equipped with a PTV injector. 1 lL was injected with PTVsplitless on a DB-5 MS column (30 m � 0.25 mm � 0.25 lm). Kimet al. (2007) performed analysis by LC–MS/MS equipped with anSynergy Max-RP C12 column (250 mm � 4.6 mm � 4 lm) onwhich 10 lL extract was injected. 0.1% formic acid (v/v) in H2O
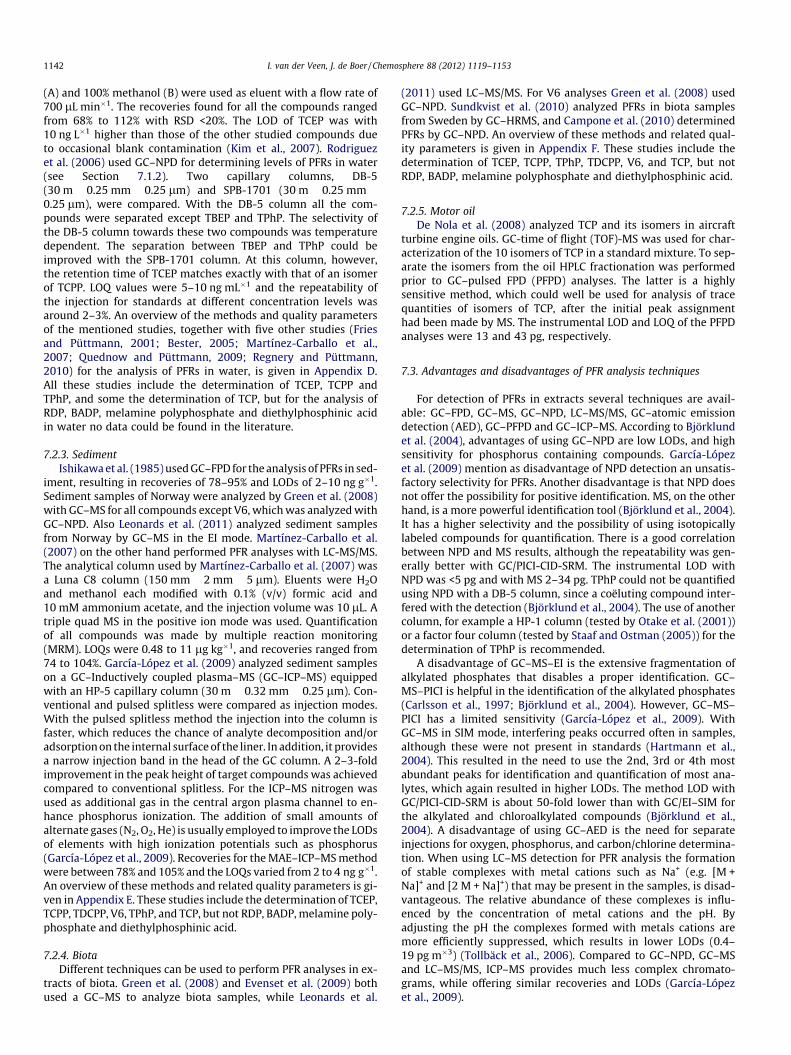
1142 I. van der Veen, J. de Boer / Chemosphere 88 (2012) 1119–1153
(A) and 100% methanol (B) were used as eluent with a flow rate of700 lL min�1. The recoveries found for all the compounds rangedfrom 68% to 112% with RSD <20%. The LOD of TCEP was with10 ng L�1 higher than those of the other studied compounds dueto occasional blank contamination (Kim et al., 2007). Rodriguezet al. (2006) used GC–NPD for determining levels of PFRs in water(see Section 7.1.2). Two capillary columns, DB-5(30 m � 0.25 mm � 0.25 lm) and SPB-1701 (30 m � 0.25 mm �0.25 lm), were compared. With the DB-5 column all the com-pounds were separated except TBEP and TPhP. The selectivity ofthe DB-5 column towards these two compounds was temperaturedependent. The separation between TBEP and TPhP could beimproved with the SPB-1701 column. At this column, however,the retention time of TCEP matches exactly with that of an isomerof TCPP. LOQ values were 5–10 ng mL�1 and the repeatability ofthe injection for standards at different concentration levels wasaround 2–3%. An overview of the methods and quality parametersof the mentioned studies, together with five other studies (Friesand Püttmann, 2001; Bester, 2005; Martínez-Carballo et al.,2007; Quednow and Püttmann, 2009; Regnery and Püttmann,2010) for the analysis of PFRs in water, is given in Appendix D.All these studies include the determination of TCEP, TCPP andTPhP, and some the determination of TCP, but for the analysis ofRDP, BADP, melamine polyphosphate and diethylphosphinic acidin water no data could be found in the literature.
7.2.3. SedimentIshikawa et al. (1985) used GC–FPD for the analysis of PFRs in sed-
iment, resulting in recoveries of 78–95% and LODs of 2–10 ng g�1.Sediment samples of Norway were analyzed by Green et al. (2008)with GC–MS for all compounds except V6, which was analyzed withGC–NPD. Also Leonards et al. (2011) analyzed sediment samplesfrom Norway by GC–MS in the EI mode. Martínez-Carballo et al.(2007) on the other hand performed PFR analyses with LC-MS/MS.The analytical column used by Martínez-Carballo et al. (2007) wasa Luna C8 column (150 mm � 2 mm � 5 lm). Eluents were H2Oand methanol each modified with 0.1% (v/v) formic acid and10 mM ammonium acetate, and the injection volume was 10 lL. Atriple quad MS in the positive ion mode was used. Quantificationof all compounds was made by multiple reaction monitoring(MRM). LOQs were 0.48 to 11 lg kg�1, and recoveries ranged from74 to 104%. García-López et al. (2009) analyzed sediment sampleson a GC–Inductively coupled plasma–MS (GC–ICP–MS) equippedwith an HP-5 capillary column (30 m � 0.32 mm � 0.25 lm). Con-ventional and pulsed splitless were compared as injection modes.With the pulsed splitless method the injection into the column isfaster, which reduces the chance of analyte decomposition and/oradsorption on the internal surface of the liner. In addition, it providesa narrow injection band in the head of the GC column. A 2–3-foldimprovement in the peak height of target compounds was achievedcompared to conventional splitless. For the ICP–MS nitrogen wasused as additional gas in the central argon plasma channel to en-hance phosphorus ionization. The addition of small amounts ofalternate gases (N2, O2, He) is usually employed to improve the LODsof elements with high ionization potentials such as phosphorus(García-López et al., 2009). Recoveries for the MAE–ICP–MS methodwere between 78% and 105% and the LOQs varied from 2 to 4 ng g�1.An overview of these methods and related quality parameters is gi-ven in Appendix E. These studies include the determination of TCEP,TCPP, TDCPP, V6, TPhP, and TCP, but not RDP, BADP, melamine poly-phosphate and diethylphosphinic acid.
7.2.4. BiotaDifferent techniques can be used to perform PFR analyses in ex-
tracts of biota. Green et al. (2008) and Evenset et al. (2009) bothused a GC–MS to analyze biota samples, while Leonards et al.
(2011) used LC–MS/MS. For V6 analyses Green et al. (2008) usedGC–NPD. Sundkvist et al. (2010) analyzed PFRs in biota samplesfrom Sweden by GC–HRMS, and Campone et al. (2010) determinedPFRs by GC–NPD. An overview of these methods and related qual-ity parameters is given in Appendix F. These studies include thedetermination of TCEP, TCPP, TPhP, TDCPP, V6, and TCP, but notRDP, BADP, melamine polyphosphate and diethylphosphinic acid.
7.2.5. Motor oilDe Nola et al. (2008) analyzed TCP and its isomers in aircraft
turbine engine oils. GC-time of flight (TOF)-MS was used for char-acterization of the 10 isomers of TCP in a standard mixture. To sep-arate the isomers from the oil HPLC fractionation was performedprior to GC–pulsed FPD (PFPD) analyses. The latter is a highlysensitive method, which could well be used for analysis of tracequantities of isomers of TCP, after the initial peak assignmenthad been made by MS. The instrumental LOD and LOQ of the PFPDanalyses were 13 and 43 pg, respectively.
7.3. Advantages and disadvantages of PFR analysis techniques
For detection of PFRs in extracts several techniques are avail-able: GC–FPD, GC–MS, GC–NPD, LC–MS/MS, GC–atomic emissiondetection (AED), GC–PFPD and GC–ICP–MS. According to Björklundet al. (2004), advantages of using GC–NPD are low LODs, and highsensitivity for phosphorus containing compounds. García-Lópezet al. (2009) mention as disadvantage of NPD detection an unsatis-factory selectivity for PFRs. Another disadvantage is that NPD doesnot offer the possibility for positive identification. MS, on the otherhand, is a more powerful identification tool (Björklund et al., 2004).It has a higher selectivity and the possibility of using isotopicallylabeled compounds for quantification. There is a good correlationbetween NPD and MS results, although the repeatability was gen-erally better with GC/PICI-CID-SRM. The instrumental LOD withNPD was <5 pg and with MS 2–34 pg. TPhP could not be quantifiedusing NPD with a DB-5 column, since a coëluting compound inter-fered with the detection (Björklund et al., 2004). The use of anothercolumn, for example a HP-1 column (tested by Otake et al. (2001))or a factor four column (tested by Staaf and Ostman (2005)) for thedetermination of TPhP is recommended.
A disadvantage of GC–MS–EI is the extensive fragmentation ofalkylated phosphates that disables a proper identification. GC–MS–PICI is helpful in the identification of the alkylated phosphates(Carlsson et al., 1997; Björklund et al., 2004). However, GC–MS–PICI has a limited sensitivity (García-López et al., 2009). WithGC–MS in SIM mode, interfering peaks occurred often in samples,although these were not present in standards (Hartmann et al.,2004). This resulted in the need to use the 2nd, 3rd or 4th mostabundant peaks for identification and quantification of most ana-lytes, which again resulted in higher LODs. The method LOD withGC/PICI-CID-SRM is about 50-fold lower than with GC/EI–SIM forthe alkylated and chloroalkylated compounds (Björklund et al.,2004). A disadvantage of using GC–AED is the need for separateinjections for oxygen, phosphorus, and carbon/chlorine determina-tion. When using LC–MS detection for PFR analysis the formationof stable complexes with metal cations such as Na+ (e.g. [M +Na]+ and [2 M + Na]+) that may be present in the samples, is disad-vantageous. The relative abundance of these complexes is influ-enced by the concentration of metal cations and the pH. Byadjusting the pH the complexes formed with metals cations aremore efficiently suppressed, which results in lower LODs (0.4–19 pg m�3) (Tollbäck et al., 2006). Compared to GC–NPD, GC–MSand LC–MS/MS, ICP–MS provides much less complex chromato-grams, while offering similar recoveries and LODs (García-Lópezet al., 2009).

I. van der Veen, J. de Boer / Chemosphere 88 (2012) 1119–1153 1143
7.4. Precautions
PFRs may be present in laboratory air, and laboratory equip-ment can be contaminated if no precautions are taken. Soakingall glassware in a solution of ethanol containing 5% (w/w) NaOHor 5% (w/v) non-ionic surfactant solvent and rinsing afterwardswith H2O, ethanol and acetone can avoid blank problems (Staafand Ostman, 2005; Bacaloni et al., 2007). To avoid blanks fromthe sampling devices, glass fiber filters can be ultrasonicated inmethanol, acetone, and DCM, cellulose support discs can be ultr-asonicated in DCM (Staaf and Ostman, 2005), PUFs can be washedwith H2O, acetone, and DCM, and finally Soxhlet-extracted for 12 hin DCM (Carlsson et al., 1997; Staaf and Ostman, 2005). Thewidespread use of TCP in plastics and hydraulic fluids can causecontamination of analytical reagents. Therefore, care must be takento avoid contamination of analytical reagents in order to obtainaccurate data in trace analysis of TCP (WHO, 1990). TBEP blankscan be found with SPME extraction when using hermetically sealedvessels, with a Teflon-layered silicone septum and an aluminumcap. Experiments of Rodriguez et al. (2006) showed that the sep-tum was responsible for the TBEP. To avoid this blank problem,aluminum foil could be used instead of a septum to cover samplevessels (Rodriguez et al., 2006). TBEP adsorption to glass surfaceswas observed by Carlsson et al. (1997). Tributoxy phosphateadsorption to glass was observed by Staaf and Ostman (2005).Therefore, the use of glassware should be avoided when extractingor cleaning samples for PFR analysis. Instead of glassware plasticmaterials may be used, but these need to be tested. Teflon houldbe avoided. An alternative would be to develop and validate a sim-ple method for extracting the PFRs from the glassware prior to GCor LC analysis.
7.5. Conclusions
For extraction of PFRs from water samples LLE, SPE and SPMEare used. SPME and SPE with Oasis HLB cartridges are not suitablefor the whole range of PFRs, because TEHP is not extracted. SPEwith other cartridges may give better results, but those have notbeen tested yet for TEHP. LLE has many disadvantages (largesolvent volumes, foam formation, long extraction times, chemicalbackground from glassware and difficulties in automation).However, it does give acceptable recoveries (63–107%) and RSDs(4–27%). Because of the mentioned disadvantageous of LLE, it isrecommended to use SPE, because this method also gives goodrecoveries (67–105%) and RSDs (<20%), but it does not have the dis-advantages of LLE, and it offers the possibility for online couplingwith a detection system, which makes the sample clean up andextraction less laborious. The SPE method should be tested withother cartridges than OASIS HLB for extraction of TEHP. For theextraction of PFRs from sediment it is recommended to use MAE.The recoveries (78–105%) and RSDs (3–8%) are good and themethod has some advantages compared to other methods, likelimited time and small amounts of solvent needed. For the finalinstrumental analysis of PFRs, several techniques, such as GC–FPD, GC–NPD, GC–AED, GC–MS, LC–MS/MS and GC–ICP–MS arebeing used. GC–ICP–MS looks like the most promising method,because it provides much less complex chromatograms whileoffering the same recoveries and LODs (instrumental LOD is 5–10 ng mL�1) as with other detection techniques, like GC–NPD andGC–MS. Advantages of using MS instead of NPD are the higherselectivity and the option of using isotopically labeled compoundsfor quantification.

Appendix A. Physicochemical properties of PFRs
Cas.number
Name Abbre-viation
Reactive/additiveFR
Boilingpoint(�C)
Meltingpoint(�C)
Flashpoint(�C)
Solubility inwater(mg L�1)at 25 �C
Vaporpressure(mm Hg)at 25 �C
Henry’s Lawconstant(atm-m3 mole�1)at 25 �C
log Kow Soiladsorptioncoefficient:log Koc
Bio-accu-mulation/bioconcen-tration factor(BCF)
10124-31-9 Ammonium orthophosphate 158 Freelysolublein water
1.4 �2.15
68333-79-9 Ammonium polyphosphate APP, AP Additive 275 1 � 104 1.4 �2.153,9-Bis-carboxyethyl-2,4,8,10-tetraoxa-3,9-diphosphaspiro[5,5]undecane-3,9-dioxide
284–286
803-19-0 Bis(4-carboxyphenyl)phenylphosphine oxide
BCPPO 643 337 343 17.8 2.1 � 10�17 2.1 � 10�19 2.22 2.60 3.16
4351-70-6 1-(Bis(2-chloroethoxy)phosphinyl)ethyl 2-chloroethyl (1-(((2-chloroethoxy)(2-chloroethyl)phosphinyl)oxy)ethyl)phosphonate
644 619 14.6 2.1 � 10�8 1.4 � 10�17 1.37 2.12 6.49
4090-51-1 Bis(5,5-dimethyl-2-thiono-1,3,2-dioxaphosphorin amyl)oxide
343 �19.83 161 0.908 1.5 � 10�4 4.2 � 10�7 4.28 3.70 1047
5945-33-5 Bisphenol A diphenylphosphate
BADP, BDP Additive 680 41–90 377 0.4151 9.0 � 10�6 4.5 4.53 3.16
Carboxyethyl-phenylphosphinic acid
CEPPA 509 157–158 262 1.13 � 104 3.5 � 10�11 4.9 � 10�15 1.06 1.00 3.16
4-Carboxyphenylphenylphosphinic acid
CPPPA 556 249–250 290 729 3.5 � 10�13 2.6 � 10�16 1.29 1.00 3.16
7783-28-0 Di-ammonium phosphate DAP 158 155 Freelysolublein water
1.4 �2.15
78-38-6 Diethyl ethyl phosphonate DEEP 198 �13 93 Miscible 0.52 2.9 � 10�6 0.66 1.42 2.462781-11-5 Diethyl N,N – bis(2-
hydroxyethyl) amino methylphosphonate
399 83 195 1.00 � 106 5.1 � 10�8 2.6 � 10�15 �1.94 2.97 3.16
813-76-3 Diethylphosphinic acid 320 �14 136 7.52 � 104 6.8 � 10�5 3.5 � 10�8 0.68 0.59 3.163,9-Dihydroxy-2,4,8,10-tetraoxa-3,9-diphosphaspiro[5,5]-undecane-3,9-dioxide
309–312
756-79-6 Dimethyl methylphosphonate
DMMP 181 �48 69 3.22 � 105 1.2 1.3 � 10�6 �0.61 0.59 3.16
868-85-9 Dimethyl phosphonate DMHP, DMP 171 �52 70 1 � 106 1.9 3.3 � 10�6 �1.2 0.42 2.6220120-33-6 3-(Dimethylphosphono)
propionic acid methyloamide419 84 207 1 � 106 8.8 � 10�9 4.0 � 10�16 �1.68 2.16 3.16
18755-43-6 Dimethyl propyl phosphonate 185 �25 80 3.40 � 104 0.97 2.2 � 106 0.29 1.53 3.1626444-49-5 Diphenylcresylphosphate DCP, CDP, DPK Additive 235 �38 212 0.24 4.7 � 10�6 4.4 � 10�8 4.51 3.93 1711
1144I.van
derV
een,J.deBoer/Chem
osphere88
(2012)1119–
1153

Physicochemical properties of PFRs (continued)
Cas.number
Name Abbre-viation
Reactive/additiveFR
Boilingpoint(�C)
Meltingpoint(�C)
Flashpoint(�C)
Solubility inwater(mg L�1)at 25 �C
Vaporpressure(mm Hg)at 25 �C
Henry’s Lawconstant(atm-m3 mole�1)at 25 �C
log Kow Soiladsorptioncoefficient:log Koc
Bio-accu-mulation/bioconcen-tration factor(BCF)
60763-39-5 Diphenyl isopropyl phosphate 348 84 178 7.13 1.0 � 10�4 6.0 � 10�8 3.98 3.54 621115-89-9 Diphenyl methyl phosphate Additive 322 88 163 61.6 5.3 � 10�4 3.4 � 10�8 3.10 3.06 133838-85-7 Diphenylphosphate DPK, DPP 378 86 182 82 2.2 � 10�6 1.1 � 10�10 2.88 2.08 5.441241-94-7 2-Ethylhexyldiphenyl
phosphateAdditive 421 �30 222 1.90 6.5 � 10�7 2.5 � 10�7 5.73 4.21 6.49 � 104
61451-78-3 Hydroxymethylphenylphosphinic acid
283 138–139 125 2 � 10�3 0.63
29761-21-5 Isodecyldiphenyl phosphate IDPP 448 �50 238 0.75 8.3 � 10�8 4.4 � 10�7 5.44 5.56 4.17 � 105
28108-99-8 Isopropylphenyl diphenylphosphate
IPPP Additive 424 89 224 2.2 5.2 � 10�7 7.7 � 10�8 5.31 4.33 7.97 � 103
218768-84-4 Melamine polyphosphate Reactive 558 >400 325 <100a 1.8 � 10�12 �2.3 0.62115-88-8 Octyl diphenyl phosphate 426 87 225 0.14 4.7 � 10�7 2.5 � 10�7 6.82 5.09 8.96 � 104
(6-Oxido-6H-dibenz[c,e][1,2]oxaphosphorin-6-yl)-methanol
451 158–159 226 6.5 � 10�9
63562-33-4 [(6-Oxido-6H-dibenz[c,e][1,2]oxaphosphorin-6-yl)-methyl]-butanedioic acid
DDP 578 189–191 304 109 3.3 � 10�14 2.0 � 10�18 1.25 2.06 3.16
1779-48-2 Phenylphosphinic acid PPA 285 85 126 7.52 � 104 1 � 10�3 9.9 � 10�10 �1.18 0.034 3.164351-70-6 Phosphonic acid, (1-(((2-
loroethoxy)(2-chloroethyl)phos-phyinyl)oxo)-ethyl|)-
644 619 14.6 9.3 � 10�16 1.4 � 10�17 1.37 2.12 6.49
41203-81-0 Phosphonic acid, methyl(5-methyl-2-methyl-1,3,2-dioxaphosphorinan-5-yl)methyl,methylester, P-oxide
369 85 191 2.47 � 104 2.6 � 10�5 3.2 � 10�10 �0.51 1.10 3.16
p-Methoxyphenylhydroxymethylphosphinic acid
HMPPA 482 161–163 246 4.1 � 10�10
53534-65-9 p-Methoxyphenyl-phosphinic acid
325 114–115 150 4.7 � 104 10.0 � 10�5 7.8 � 10�11 0.13 1.00 3.16
7723-14-0 Red phosphorus RP Additive 468 162 30 Insoluble 2.6 � 10�2 1.7 � 10�4 �0.27 1.16 3.1657583-54-7 Resorcinol-
bis(diphenyl)phosphateRDP Additive 587 322 1.11 � 10�4 2.1 � 10�8 2.9 � 10�13 7.41 4.63 2.05 � 104
55566-30-8 Tetrakis(hydroxymethyl)phosphonium sulfate
THPS Reactive 111 �35 1 � 106 9.5 � 10�21 1.7 � 10�23 �9.8
2,4,8,10-Tetraoxa-3,9-diphosphaspiro[5,5]-undecane-3,9-dioxide bis-melamine salt
320–324
38051-10-4 Tetrekis(2-chlorethyl)dichloroisopentyl-diphosphate
V6 Additive 620 90 588 2.1 1.2 � 10�14 6.5 � 10�6 1.9 2.9 17.07
126-73-8 Tributyl phosphate TBP, TnBP Additive 289 �80 146 280 1.1 � 10�3 1.5 � 10�7 4.00 3.28 1.03 � 103
(continued on next page)
I.vander
Veen,J.de
Boer/Chemosphere
88(2012)
1119–1153
1145

Physicochemical properties of PFRs (continued)
Cas.number
Name Abbre-viation
Reactive/additiveFR
Boilingpoint(�C)
Meltingpoint(�C)
Flashpoint(�C)
Solubility inwater(mg L�1)at 25 �C
Vaporpressure(mm Hg)at 25 �C
Henry’s Lawconstant(atm-m3 mole�1)at 25 �C
log Kow Soiladsorptioncoefficient:log Koc
Bio-accu-mulation/bioconcen-tration factor(BCF)
1330-78-5 Tricresyl phosphate TCP Additive 439 77 232 0.36 1.8 � 10�7 9.2 � 10�7 5.11 4.35 8.56 � 103
78-40-0 Triethyl phosphate TEP Additive 216 �56 116 5.00 � 105 0.29 3.5 � 10�6 0.8 1.68 3.882528-39-4 Trihexyl phosphate 354 86 182 1.03 � 10�2 7.0 � 10�5 1.1 � 10�4 7.45 5.43 2.72 � 105
126-71-6 Tri-iso-butyl phosphate TiBP Additive 264 16 126 3.72 1.3 � 10�2 2.8 � 10�4 3.6 3.05 391513-02-0 Tri-iso-propyl phosphate Additive 222 4 102 501 0.15 8.1 � 10�5 2.12 2.25 24.01563-04-2 Tri-m-cresylphosphate m-TCP, TMTP 442 90 234 1.84 � 10�2 1.4 � 10�7 2.9 � 10�6 6.34 4.35 8.56 � 103
512-56-1 Trimethyl phosphate TMP Additive 197 �10 84 3.00 � 105 5.6 � 10�3 2.5 � 10�7 �0.65 1.10 3.16513-08-6 Tri-n-propyl phosphate TPP Additive 254 27 121 827 2.9 � 10�2 8.2 � 10�6 2.67 2.83 63.11330-78-5 Tri-o-cresylphosphate o-TCP, TOCP, TOTP 410 11 232 1.84 � 10�2 1.8 � 10�7 9.2 � 10�7 5.48 4.36 8.56 � 103
1806-54-8 Trioctyl phosphate Additive 415 89 218 9.47 � 10�6 1.1 � 10�6 2.7 � 10�3 10.6 6.47 1.00 � 106
78-32-0 Tri-p-cresylphosphate p-TCP, TPCP, TPTP 439 77 232 7.4 � 10�2 1.8 � 10�7 9.2 � 10�7 5.48 4.36 8.56 � 103
115-86-6 Triphenyl phosphate TPhP Additive 370 49 220 1.9 1.2 � 10�6 3.3 � 10�6 4.59 3.72 113791-28-6 Triphenylphosphine oxide TPPO Additive 463 87 234 62.8 2.6 � 10�8 5.3 � 10�10 2.87 2.94 89.478-51-3 Tris(2-
butoxyethyl)phosphateTBEP, TBOP, TBXP Additive 414 �70 159 1.20 � 103 2.1 � 10�7 1.2 � 10�11 3.65 4.38 1.08 � 103
115-96-8 Tris(2-chloroethyl)phosphate TCEP, TClEP Additive 351 �55 202 7.0 � 103 1.1 � 10�4 3.3 � 10�6 1.44 2.48 1.3713674-84-5 Tris(chloroiso-
propyl)phosphateTCPP Additive 359 72 218 1.60 � 103 0.75 6.0 � 10�8 2.59 2.21 8.51
1067-98-7 Tris(chloropropyl)-phosphate
TCPP Additive 342 �40 312 1.6 � 103 1.9 � 10�6 6.0 � 10�8 2.59 2.71 42.4
13674-87-8 Tris(1,3-dichloro-2-propyl)phosphate
TDCP, TDCPP, TDIP Additive 457 88 378 1.50 7.4 � 10�8 2.6 � 10�9 3.8 2.35 13.5
78-42-2 Tris(2-ethylhexyl)phosphate TEHP Additive 220 87 207 0.6 2.0 � 10�6 9.6 � 10�5 4.22 6.87 1.00 � 106
1067-12-5 Tris(hydroxymethyl)phosphine oxide
505 68 259 1 � 106 2.6 � 10�12 1.5 � 10�12 �4.54 0.88 3.16
68937-41-7 Tris(isopropyl-phenyl)phosphate
490 �19 263 1.4 2.9 � 10�9 2.9 � 10�7 5.1 5.80 8.63 � 105
25155-23-1 Trixylenyl phosphate TXP 491 90 264 1.86 � 10�2 5.2 � 10�8 7.2 � 10�8 5.63 5.3 9.59 � 104
WHO (1990, 1991), UNEP (1996), WHO (1997), UNEP (1998), WHO (1998), Lassen and Lokke (1999), Australian Government (2000), Leisewitz et al. (2000), UNEP (2000), WHO (2000), UNEP (2001, 2002), Fisk et al. (2003),Björklund et al. (2004), UNEP (2004), Rodriguez et al. (2006), Pakalin et al. (2007), Pawlowski and Schartel (2007), Wang et al. (2007), ATSDR (2009), US-EPA (2009, 2010), Chemspider (2011), EC JRC (2011), PINFA (2011) and Syrres(2011) and Chemnet (2012).
a at 22 �C.
1146I.van
derV
een,J.deBoer/Chem
osphere88
(2012)1119–
1153
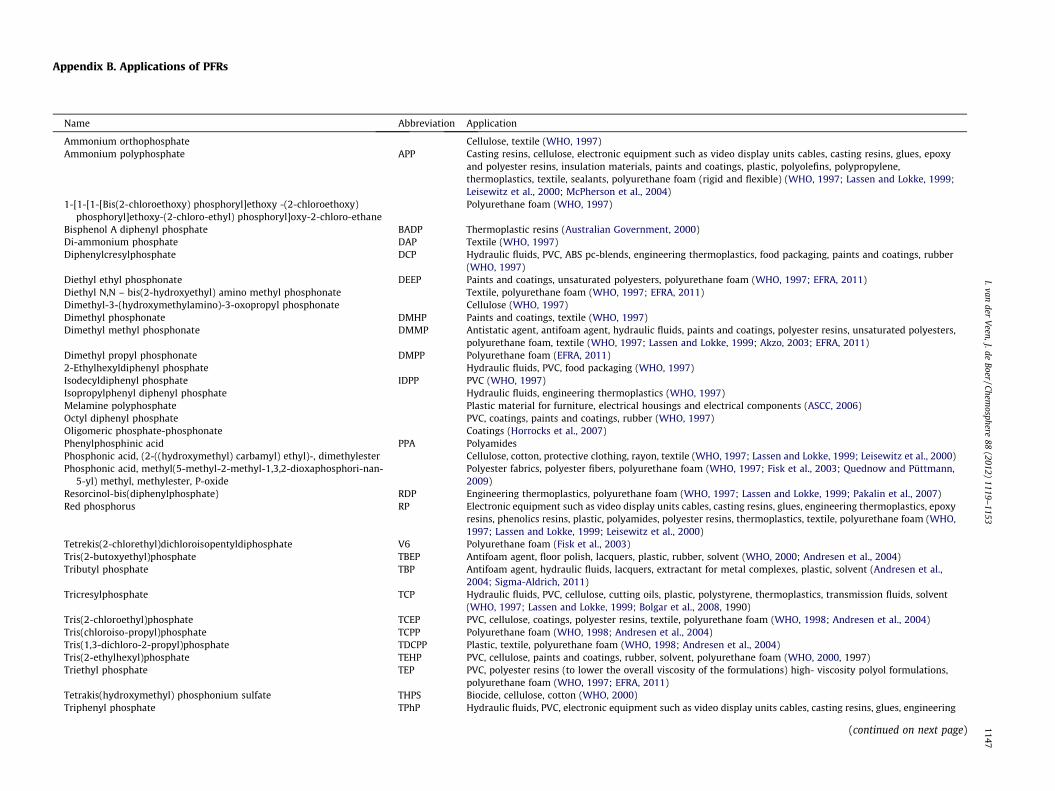
Appendix B. Applications of PFRs
Name Abbreviation Application
Ammonium orthophosphate Cellulose, textile (WHO, 1997)Ammonium polyphosphate APP Casting resins, cellulose, electronic equipment such as video display units cables, casting resins, glues, epoxy
and polyester resins, insulation materials, paints and coatings, plastic, polyolefins, polypropylene,thermoplastics, textile, sealants, polyurethane foam (rigid and flexible) (WHO, 1997; Lassen and Lokke, 1999;Leisewitz et al., 2000; McPherson et al., 2004)
1-[1-[1-[Bis(2-chloroethoxy) phosphoryl]ethoxy -(2-chloroethoxy)phosphoryl]ethoxy-(2-chloro-ethyl) phosphoryl]oxy-2-chloro-ethane
Polyurethane foam (WHO, 1997)
Bisphenol A diphenyl phosphate BADP Thermoplastic resins (Australian Government, 2000)Di-ammonium phosphate DAP Textile (WHO, 1997)Diphenylcresylphosphate DCP Hydraulic fluids, PVC, ABS pc-blends, engineering thermoplastics, food packaging, paints and coatings, rubber
(WHO, 1997)Diethyl ethyl phosphonate DEEP Paints and coatings, unsaturated polyesters, polyurethane foam (WHO, 1997; EFRA, 2011)Diethyl N,N – bis(2-hydroxyethyl) amino methyl phosphonate Textile, polyurethane foam (WHO, 1997; EFRA, 2011)Dimethyl-3-(hydroxymethylamino)-3-oxopropyl phosphonate Cellulose (WHO, 1997)Dimethyl phosphonate DMHP Paints and coatings, textile (WHO, 1997)Dimethyl methyl phosphonate DMMP Antistatic agent, antifoam agent, hydraulic fluids, paints and coatings, polyester resins, unsaturated polyesters,
polyurethane foam, textile (WHO, 1997; Lassen and Lokke, 1999; Akzo, 2003; EFRA, 2011)Dimethyl propyl phosphonate DMPP Polyurethane foam (EFRA, 2011)2-Ethylhexyldiphenyl phosphate Hydraulic fluids, PVC, food packaging (WHO, 1997)Isodecyldiphenyl phosphate IDPP PVC (WHO, 1997)Isopropylphenyl diphenyl phosphate Hydraulic fluids, engineering thermoplastics (WHO, 1997)Melamine polyphosphate Plastic material for furniture, electrical housings and electrical components (ASCC, 2006)Octyl diphenyl phosphate PVC, coatings, paints and coatings, rubber (WHO, 1997)Oligomeric phosphate-phosphonate Coatings (Horrocks et al., 2007)Phenylphosphinic acid PPA PolyamidesPhosphonic acid, (2-((hydroxymethyl) carbamyl) ethyl)-, dimethylester Cellulose, cotton, protective clothing, rayon, textile (WHO, 1997; Lassen and Lokke, 1999; Leisewitz et al., 2000)Phosphonic acid, methyl(5-methyl-2-methyl-1,3,2-dioxaphosphori-nan-
5-yl) methyl, methylester, P-oxidePolyester fabrics, polyester fibers, polyurethane foam (WHO, 1997; Fisk et al., 2003; Quednow and Püttmann,2009)
Resorcinol-bis(diphenylphosphate) RDP Engineering thermoplastics, polyurethane foam (WHO, 1997; Lassen and Lokke, 1999; Pakalin et al., 2007)Red phosphorus RP Electronic equipment such as video display units cables, casting resins, glues, engineering thermoplastics, epoxy
resins, phenolics resins, plastic, polyamides, polyester resins, thermoplastics, textile, polyurethane foam (WHO,1997; Lassen and Lokke, 1999; Leisewitz et al., 2000)
Tetrekis(2-chlorethyl)dichloroisopentyldiphosphate V6 Polyurethane foam (Fisk et al., 2003)Tris(2-butoxyethyl)phosphate TBEP Antifoam agent, floor polish, lacquers, plastic, rubber, solvent (WHO, 2000; Andresen et al., 2004)Tributyl phosphate TBP Antifoam agent, hydraulic fluids, lacquers, extractant for metal complexes, plastic, solvent (Andresen et al.,
2004; Sigma-Aldrich, 2011)Tricresylphosphate TCP Hydraulic fluids, PVC, cellulose, cutting oils, plastic, polystyrene, thermoplastics, transmission fluids, solvent
(WHO, 1997; Lassen and Lokke, 1999; Bolgar et al., 2008, 1990)Tris(2-chloroethyl)phosphate TCEP PVC, cellulose, coatings, polyester resins, textile, polyurethane foam (WHO, 1998; Andresen et al., 2004)Tris(chloroiso-propyl)phosphate TCPP Polyurethane foam (WHO, 1998; Andresen et al., 2004)Tris(1,3-dichloro-2-propyl)phosphate TDCPP Plastic, textile, polyurethane foam (WHO, 1998; Andresen et al., 2004)Tris(2-ethylhexyl)phosphate TEHP PVC, cellulose, paints and coatings, rubber, solvent, polyurethane foam (WHO, 2000, 1997)Triethyl phosphate TEP PVC, polyester resins (to lower the overall viscosity of the formulations) high- viscosity polyol formulations,
polyurethane foam (WHO, 1997; EFRA, 2011)Tetrakis(hydroxymethyl) phosphonium sulfate THPS Biocide, cellulose, cotton (WHO, 2000)Triphenyl phosphate TPhP Hydraulic fluids, PVC, electronic equipment such as video display units cables, casting resins, glues, engineering
(continued on next page)
I.vander
Veen,J.de
Boer/Chemosphere
88(2012)
1119–1153
1147

Applications of PFRs (continued)
Name Abbreviation Application
thermoplastics, phenylene-oxide-based resins, phenolics resins (WHO, 1997; Lassen and Lokke, 1999; Andresenet al., 2004; Björklund et al., 2004)
Tris(hydroxymethyl) phosphine oxide Polystyrene (WHO, 1997)Tris(isopropyl-phenyl) phosphate PVC, engineering thermoplastics (WHO, 1997)Trioctyl phosphate PVC, paints and coatings, rubber, solvent, polyurethane foam (WHO, 1997)Trixylenyl phosphate TXP Hydraulic fluids, PVC (WHO, 1997)
Appendix C. Air sampling, extraction and detection methods for PFRs
Sampling Extraction Finalvolume(lL)
Detection Column Injectionvolume(lL)
Injectionmode
Method LOD InstrumentalLOD
LOQ Recovery(%)
RSD(%)
References
Passive flux sampler GC–FPD HP-1 (30 m � 0.25 mm� 0.32 lm)
3 Pulsed-splitless
15-30 ng/disk 50-100ng/disk
4.6 Ni et al.(2007)
PUF US withmethylenechloride
100 GC–MS DB-5 (30 m) 2 Splitless 0.19-2.5 ng m�3
(calculated as10 � LOD)
62-100 Hartmann et al.(2004)
Anodized aluminumsampler holderswith a 25mmbinder-free A/Eborosilicate glassfiber filter and aback-up cellulose
US with DCM GC–NPD DB-5 (30 m � 0.25 mm� 0.10 lm)
Split/splitless
<5 pg Björklundet al. (2004)
GC–MS/MS PICI(ion-trap)
DB-5 (30 m � 0.25 mm� 0.10 lm)
Split/splitless
0.1–1.4 ng m�3 2–34 pg Björklundet al. (2004)
AP10 filter GC–MS EI (ion-trap)
DB-5 (30 m � 0.25 mm� 0.10 lm)
Split/splitless
5–70 ng m�3 Björklundet al. (2004)
C8 Empore SPEmembranes
Methanol,extraction cellconnected onlineto HPLC pump
LC-MS/MS ESI Phenomenex C8(150 mm � 4.6 mm � 5lm)
0.4–19 pg m�3 >95 <8 Tollbäcket al. (2006)
Aminopropyl silicaSPE cartridge
MTBE GC–NPD Factor four column(30 m � 0.25 mm� 0.1 lm)
splitless 0.1–0.3 ng m�3 95-116 1- 9 Staaf andOstman(2005)
Personal samplingequipment: glassfiber filter + twoPUF plugs
US with DCM 100 GC–NPD DB-5 (30 m � 0.25 mm� 0.10 lm)
Splitless >95 Sjödin et al.(2001)
Glass tube containingcharcoal granules
US with toluene GC–FPD HP-1 (30 m � 0.32 mm� 0.25 lm)
1 Pulsed-splitless
10 pg 84-100 0.7-6.4
Otake et al.(2001)
Personal samplingequipment: glassfiber filter + two
Soxhletextraction withDCM
GC–NPD DB-5 (30 m � 0.25 mm� 0.1 lm)
Split/splitless
>95TBEP-37
Carlssonet al. (1997).
1148I.van
derV
een,J.deBoer/Chem
osphere88
(2012)1119–
1153
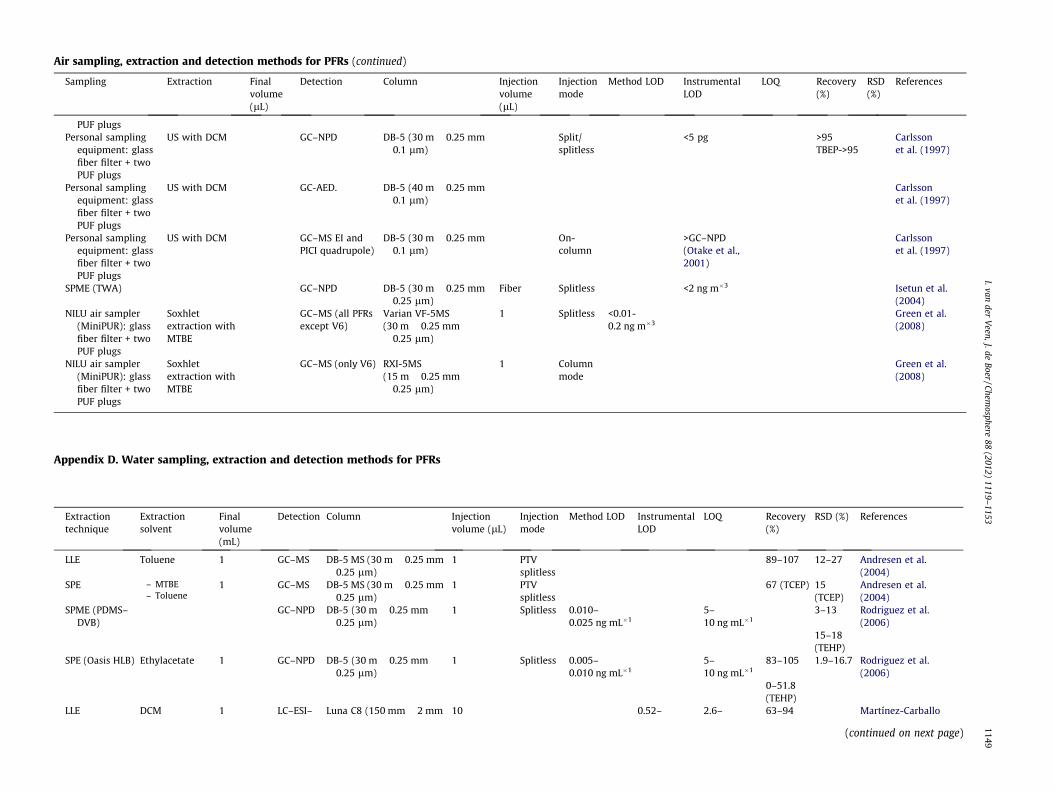
Air sampling, extraction and detection methods for PFRs (continued)
Sampling Extraction Finalvolume(lL)
Detection Column Injectionvolume(lL)
Injectionmode
Method LOD InstrumentalLOD
LOQ Recovery(%)
RSD(%)
References
PUF plugsPersonal sampling
equipment: glassfiber filter + twoPUF plugs
US with DCM GC–NPD DB-5 (30 m � 0.25 mm� 0.1 lm)
Split/splitless
<5 pg >95TBEP->95
Carlssonet al. (1997)
Personal samplingequipment: glassfiber filter + twoPUF plugs
US with DCM GC-AED. DB-5 (40 m � 0.25 mm� 0.1 lm)
Carlssonet al. (1997)
Personal samplingequipment: glassfiber filter + twoPUF plugs
US with DCM GC–MS EI andPICI quadrupole)
DB-5 (30 m � 0.25 mm� 0.1 lm)
On-column
>GC–NPD(Otake et al.,2001)
Carlssonet al. (1997)
SPME (TWA) GC–NPD DB-5 (30 m � 0.25 mm� 0.25 lm)
Fiber Splitless <2 ng m�3 Isetun et al.(2004)
NILU air sampler(MiniPUR): glassfiber filter + twoPUF plugs
Soxhletextraction withMTBE
GC–MS (all PFRsexcept V6)
Varian VF-5MS(30 m � 0.25 mm� 0.25 lm)
1 Splitless <0.01-0.2 ng m�3
Green et al.(2008)
NILU air sampler(MiniPUR): glassfiber filter + twoPUF plugs
Soxhletextraction withMTBE
GC–MS (only V6) RXI-5MS(15 m � 0.25 mm� 0.25 lm)
1 Columnmode
Green et al.(2008)
Appendix D. Water sampling, extraction and detection methods for PFRs
Extractiontechnique
Extractionsolvent
Finalvolume(mL)
Detection Column Injectionvolume (lL)
Injectionmode
Method LOD InstrumentalLOD
LOQ Recovery(%)
RSD (%) References
LLE Toluene 1 GC–MS DB-5 MS (30 m � 0.25 mm� 0.25 lm)
1 PTVsplitless
89–107 12–27 Andresen et al.(2004)
SPE – MTBE– Toluene
1 GC–MS DB-5 MS (30 m � 0.25 mm� 0.25 lm)
1 PTVsplitless
67 (TCEP) 15(TCEP)
Andresen et al.(2004)
SPME (PDMS–DVB)
GC–NPD DB-5 (30 m � 0.25 mm� 0.25 lm)
1 Splitless 0.010–0.025 ng mL�1
5–10 ng mL�1
3–13 Rodriguez et al.(2006)
15–18(TEHP)
SPE (Oasis HLB) Ethylacetate 1 GC–NPD DB-5 (30 m � 0.25 mm� 0.25 lm)
1 Splitless 0.005–0.010 ng mL�1
5–10 ng mL�1
83–105 1.9–16.7 Rodriguez et al.(2006)
0–51.8(TEHP)
LLE DCM 1 LC–ESI– Luna C8 (150 mm � 2 mm 10 0.52– 2.6– 63–94 Martínez-Carballo
(continued on next page)
I.vander
Veen,J.de
Boer/Chemosphere
88(2012)
1119–1153
1149

Water sampling, extraction and detection methods for PFRs (continued)
Extractiontechnique
Extractionsolvent
Finalvolume(mL)
Detection Column Injectionvolume (lL)
Injectionmode
Method LOD InstrumentalLOD
LOQ Recovery(%)
RSD (%) References
MS/MS � 5 lm) 1.7 lg L�1 13 ng L�1 et al. (2007)SPE (Bond Elut
PPL)ACN:methanol(1:1, v/v)
GC–MS FS-Supreme1-5(30 m � 0.25 lm)
1 Splitless 1 ng L�1 83–89 9.9–14 Fries and Püttmann(2001)
LLE Toluene 1 GC–MS(EI)
DB-5MS (30 m � 0.25 mm� 0.25 lm)
1 PTVsplitless
100 ng L�1
(TCPP)71 (TCPP) 4 (TCPP) Bester (2005)
SPE (HLB) – Methanol– Methanol/
MTBE (10/90)
1 LC–MS/MS
Synergy Max-RP C12(250 mm � 4.6 mm� 4 lm)
10 10 ng L�1 68–112(TCEP)
<20 Kim et al. (2007)
SPE (Bond Elut) ACN:methanol(1:1)
0.1 GC–MS(EI)
BP-X5 (30 m � 0.25 mm� 0.25 lm)
1 Splitless 5 ng L�1 110(TCEP)
Quednow andPüttmann (2009)
SPE(Bakerbond:hydrophilicpolymer)
Methanol 500 LC–ESI–MS/MS
Alltech: Alltima C18(250 mm � 2.1 mm� 5 lm)
50 0.5–3.9 ng L�1
>80 (TMP35)
2.7–9.9 Bacaloni et al. (2007)
SPE (Bond ElutPPL)
ACN:methanol(1:1, v/v)
GC–MS 3–30 ng L�1 72–99 Regnery andPüttmann (2010)
Appendix E. Sediment sampling, extraction and detection methods for PFRs
Extractiontechnique
Extractionsolvent
Finalvolume(mL)
Detection Column Injectionvolume(lL)
Injectionmode
MethodLOD
InstrumentalLOD
LOQ Recovery(%)
RSD(%)
References
Shaking Acetone GC–FPD 78–95 Ishikawa et al.(1985)
Ultrasound-assisted solventextraction
Ethyl acetate:ACN (30:70, v/v)
LC–MS/MS Luna C8(150 mm � 2 mm � 5 lm)
10 0.48–11 lg kg�1
74–104 Martínez-Carballo et al.(2007)
MAE – Acetone– ACN
0.2 GC–ICP–MS HP-5 capillary column(30 m � 0.32 mm � 0.25lm)
2 Splitless 5–10 ng mL�1
2–4 ng g�1 78–105 3–8 García-Lópezet al. (2009)
ASE DCM: acetone(1:1, v/v)
0.2 GC–MS EI-mode
SGE BPX-5 column(25 m � 0.22 mm � 0.25lm)
1 Splitless 0.10–0.16 ng g�1
Leonards et al.(2011)
US, shaking andcentrifugation
– Methanol– MTBE
GC–MS (allPFRs exceptV6)
Varian VF-5MS(30 m � 0.25 mm � 0.25lm)
1 Splitless 38-2000 lg kg�1
Green et al.(2008)
US, shaking andcentrifugation
– Methanol– MTBE
GC–MS (onlyV6)
RXI-5MS(15m � 0.25 mm � 0.25lm)
1 Columnmode
Green et al.(2008)
1150I.van
derV
een,J.deBoer/Chem
osphere88
(2012)1119–
1153

Appendix F. Biota sampling, extraction and detection methods for PFRs
Extraction technique Extractionsolvent
Finalvolume(mL)
Detection Column Injectionvolume(lL)
Injectionmode
Method LOD InstrumentalLOD
LOQ Recovery(%)
RSD(%)
References
Shaking – Acetone– MTBE
GC–MS(all PFRsexceptV6)
Varian VF-5MS(30 m � 0.25 mm � 0.25lm)
1 Splitless 5–40 lg kg�1 Greenet al.(2008)
Shaking – Acetone– MTBE
GC–MS(only V6)
Varian VF-5MS(30 m � 0.25 mm � 0.25lm)
1 Columnmode
Greenet al.(2008)
Shaking MTBE GC–MS Varian VF-5MS(30 m � 0.25 mm � 0.25lm)
1 Splitless Evensetet al.(2009)
ASE DCM:acetone(1:1, v/v)
0.2 LC–MS/MS
Luna C18(150 mm � 3 mm � 3lm)
1 0.04–2 ng g�1
Leonardset al.(2011)
Matrix solid-phasedispersion with florisiland alumina: gravity flowelution
Hexane:acetone(6:4, v/v).
GC–NPD Agilent: DB-5(30 m � 0.32-mm � 0.25 lm)
1 Splitless 0.2–9 lg kg�1 0.7–30 lg/kg
65–110 2–9 Camponeet al.(2010)
ASE Ethyl acetate–cyclohexane(5:2, v/v)
0.8 GC–HRMS.
J&W Scientific: DB-5(30 m � 0.25 mm � 0.25lm)
1 Splitless 0.05–11 ng g�1
(TDCPP11 ng g�1, TBEP23 ng g�1)
64–110(perch)
Sundkvistet al.(2010)
I.vander
Veen,J.de
Boer/Chemosphere
88(2012)
1119–1153
1151
1152 I. van der Veen, J. de Boer / Chemosphere 88 (2012) 1119–1153
References
Akzo (dmmp consortium), 2003. Robust Summaries & Test Plan: Phosphonic Acid,Methyl-, Dimethyl Ester. Test Plan for Dimethylphosphonate Cas No. 756–79-6,201–15083 (23 December 2003). <www.epa.gov/HPV/pubs/summaries/phsphnmd/c15083.pdf>.
Allen, J.G., McClean, M.D., Stapleton, H.M., Nelson, J.W., Webster, T.F., 2007. Personalexposure to polybrominated diphenyl ethers (PBDEs) in residential indoor air.Environ. Sci. Technol. 41, 4574–4579.
Andrae, N.J., 2007. Durable and Environmentally Friendly Flame Retardants forSynthetics. M.Sc. Thesis, North Carolina State University, Raleigh, NorthCarolina.
Andresen, J.A., Grundmann, A., Bester, K., 2004. Organophosphorus flame retardantsand plasticisers in surface waters. Sci. Total Environ. 332, 155–166.
Anonymous, 2008. Flame retardants: some recent developments. Plast, Addit.Compd. 10, 20–21.
Aresta, M., Caramuscio, P., De Stefano, L., Pastore, T., 2003. Solid state dehalogenationof PCBs in contaminated soil using NaBH4. Waste Manage. 23, 315–319.
Asamoah, R.K., 2005. Accumulation from Soil of Structurally Diverse BrominatedFlame Retardants in Earthworms. 20 Point Master Thesis, EnvironmentalChemistry, Department of Chemistry, Umea University, Sweden.
ASCC (Australian Safety and Compensation Council), 2006. Melapur 200 andPolymer in Exolit OP 1312. National Industrial Chemicals Notification andAssessment Scheme. Full Public Report.
Agency for Toxic Substances and Disease Registry (ATSDR), 2009. United StatesDepartment of Health and Human Services 2009. Draft Toxicological Profile forPhosphate Ester Flame Retardants (September).
Australian Government, 2000. National Industrial Chemicals Notification andAssessment Scheme, Full Public Report on Fyrolflex BDP. Department ofHealth and Aging.
Bacaloni, A., Cavaliere, C., Foglia, P., Nazzari, M., Samperi, R., Lagana, A., 2007. Liquidchromatography/tandem mass spectrometry determination oforganophosphorus flame retardants and plasticizers in drinking and surfacewaters. Rapid Commun. Mass Spectrom. 21, 1123–1130.
Bester, K., 2005. Comparison of TCPP concentrations in sludge and wastewater in atypical German sewage treatment plant—comparison of sewage sludge from 20plants. J. Environ. Monit. 7, 509–513.
Betts, K., 2008. Does a key PBDE break down in the environment? Environ. Sci.Technol. 42, 6781.
Bureau of Home Furnishings and Thermal Insulation (BHFTI), 2000. State ofCalifornia Department of Consumer Affairs. Bureau of Home Furnishings andThermal Insulation, March 2000. Technical Bulletin 117. Requirements, TestProcedure and Apparatus for Testing the Flame Retardance of Resilient FillingMaterials Used in Upholstered Furniture.
Björklund, J., Isetun, S., Nilsson, U., 2004. Selective determination oforganophosphate flame retardants and plasticizers in indoor air by gaschromatography, positive-ion chemical ionization and collision-inducesdissociation mass spectrometry. Rapid Commun. Mass Spectr. 18, 3079–3083.
Bolgar, M., Hubball, J., Groeger, J., Meronek, S., 2008. Handbook for the ChemicalAnalysis of Plastic and Polymer Additives. CRC Press Taylor & Francis Group,New York (2007025615).
Bromine Science and Environmental Forum (BSEF), <http://www.bsef.com/>(accessed 12.12.11).
Camarasa, J.G., Serra-Baldrich, E., 1992. Allergic contact dermatitis from triphenylphosphate. Contact Derm. 26, 264–265.
Campone, L., Piccinelli, A.L., Östman, C., Rastrelli, L., 2010. Determination oforganophosphorous flame retardants in fish tissues by matrix solid-phasedispersion and gas chromatography. Anal. Bioanal. Chem. 397, 799–806.
Carlsen, L., Andersen, K.E., Egsgaard, H., 1986. Triphenyl phosphate allergy fromspectacle frames. Contact Derm. 15, 274–277.
Carlsson, H., Nilsson, U., Becker, G., Östman, C., 1997. Organophosphate ester flameretardants and plasticisers in the indoor environment: analytical methodologyand occurrence. Environ. Sci. Technol. 31, 2931–2936.
Carlsson, H., Nilsson, U., Östman, C., 2000. Video display units: an emission sourceof the contact allergenic flame retardant triphenyl phosphate in the indoorenvironment. Environ. Sci. Technol. 34, 3885–3889.
CEFIC, 2007. European Flame Retardants Association (EFRA). What are FRs? FlameRetardant Market Statistics. <www.cefic-efra.eu> (accessed 30.03.07).
Chapin, R.E., Sloane, R.A., Haseman, J.K., 1997. The relationships among reproductiveendpoints in Swiss mice, using the reproductive assessment by continuousbreeding database. Fundam. Appl. Toxicol. 38, 129–142.
Chemnet, 2012. <http://www.chemnet.com/cas/> (accessed 11.03.12).Chemspider, 2011. <http://www.chemspider.com/Search.aspx> (accessed
31.10.11).Chen, X., Hu, Y., Song, L., 2008. Thermal behaviors of a novel UV cured flame
retardant coatings containing phosphorus, nitrogen and silicon. Polym. Eng. Sci.48, 116–123.
Chena, L., Mai, B., Xu, Z., Peng, X., Han, J., Ran, Y., Sheng, G., Fu, J., 2008. In- andoutdoor sources of polybrominated diphenyl ethers and their human inhalationexposure in Guangzhou, China. Atmos. Environ. 42, 78–86.
De Nola, G., Kibby, J., Mazurek, W., 2008. Determination of ortho-cresyl phosphateisomers of tricresyl phosphate used in aircraft turbine engine oils by gaschromatography and mass spectrometry. J. Chromatogr. A 1200, 211–216.
Dishaw, L.V., Powers, C.M., Ryde, I.T., Roberts, S.C., Seidler, F.J., Slotkin, T.A.,Stapleton, H.M., 2011. Is the PentaBDE replacement, tris (1,3-dichloropropyl)
phosphate (TDCPP), a developmental neurotoxicant? Studies in PC12 cells.Toxicol. Appl. Pharmacol. 256, 281–289.
EFRA, 2007. Frequently Asked Questions. Brussels (January 2007).EFRA, 2011. Other Phosphorus Flame Retardants. Flame Retardant Fact Sheet (20
September).EU, 2003. Directive 2003/11/EC, Official Journal of the European Union L42/45-46.European Union (EU), 2008a. Tris[2-Chloro-1-(Chloromethyl)ethyl] Phosphate
(TDCP) CAS No.: 13674-87-8. EINECS No.: 237-159-2. Risk Assessment Report.EU, 2008b. 2,2-Bis(Chloromethyl) Trimethylene Bis[bis(2-Chloroethyl) Phosphate]
(V6) CAS No.: 38051-10-4. EINECS No.: 253-760-2. Risk Assessment Report.European Commission (EC), 2011. JRC (Joint Research Centre), Institute for
Prospective Technological Studies (IPTS), 2011. Discussion on ‘‘HazardousSubstances’’ Criterion Investigation of Request for Derogation. Draft Report(1–29 September 2011).
Evenset, A., Leknes, H., Christensen, G.N., Warner, N., Remberger, M., Gabrielsen,G.W., 2009. Screening of New Contaminants in Samples from Norwegian Arctic.NIVA Report 4351-1, SPFO-Report 1049/2009. TA-2510/2009. ISBN:978-82-449-0065-2.
Fisk, P.R., Girling, A.E., Wildey, R.J., 2003. Prioritisation of Flame Retardants forEnvironmental Risk Assessment. Produced for Environment Agency, UnitedKingdom.
Fries, E., Püttmann, W., 2001. Occurrence of organophosphate esters in surfacewater and ground water in Germany. J. Environ. Monit. 3, 621–626.
García-López, M., Rodríguez, I., Cela, R., Kroening, K.K., Caruso, J.A., 2009.Determination of organophosphate flame retardants and plasticizers insediment samples using microwave-assisted extraction and gas chromatography with inductively coupled plasma mass spectrometry. Talanta 79, 824–829.
Government of Canada, 2009. Environment Canada Health Canada Proposed RiskManagement Approach for Ethanol, 2-Chloro-, Phosphate (3:1) or Tris (2-Chloroethyl) Phosphate (TCEP). Chemical Abstracts Service Registry Number(CAS RN): 115–96-8 (August 2009).
Green, N., Schlabach, M., Bakke, T., Brevik, E.M., Dye, C., Herzke, D., Huber, S., Plosz,B., Remberger, M., Schøyen, M., Uggerud, H.T., Vogelsang, C., 2008. Screening ofSelected Metals and New Organic Contaminants 2007. NIVA Report 5569-2008,SPFO-Report 1014/2008. TA-2367/2008. ISBN:978-82-577-5304-7.
Hartmann, P.C., Burgi, D., Giger, W., 2004. Organophosphate flame retardants andplasticizers in indoor air. Chemosphere 57, 781–787.
Herzke, D., Schlabach, M., Mariussen, E., Uggerud, H., Heimstad, E., 2007. ALiterature Survey on Selected Chemical Compounds. TA-2238/2007.
Hörold, S., 1999. Phosphorus flame retardants in thermoset resins. Polym. Degrad.Stab. 64, 427–431.
Horrocks, A.R., Davies, P.J., Kandola, B.K., Alderson, A., 2007. The potential forvolatile phosphorus-containing flame retardants in textile back-coatings. J. FireSci. 25, 523–540.
Isetun, S., Nilsson, U., Colmsjo, A., Johansson, R., 2004. Air sampling oforganophosphate trimesters using SPME under non-equilibrium conditions.Anal. Bioanal. Chem. 378, 1847–1853.
Ishikawa, S., Taketomi, M., Shinohara, R., 1985. Determination of trialkyl and triarylphosphates in environmental samples. Water Res. 19, 119–125.
Kawagoshi, Y., Nakamura, S., Fukunaga, I., 2002. Degradation of organophosphoricesters in leachate from a sea-based solid waste disposal site. Chemosphere 48,219–225.
Kawahara, J., Yanagisawa, Y., 2003. Organophosphorus compound in indoorenvironment. J. Soc. Indoor Environ. Jpn. 6, 180–181.
Kemmlein, S., Hahn, O., Jann, O., 2003. Emissions of organophosphate andbrominated flame retardants from selected consumer products and buildingmaterials. Atmos. Environ. 37, 5485–5493.
Kim, S.D., Cho, J.W., Kim, I.S., Vanderford, B.J., Snyder, S.A., 2007. Occurrence andremoval of pharmaceuticals and endocrine disruptors in South Korean surface,drinking, and waste waters. Water Res. 41, 1013–1021.
Lassen, C., Lokke, S., 1999. Danish Environmental Protection Agency (EPA),Brominated Flame Retardants: Substance Flow Analysis and Assessment ofAlternatives. DK EPA Report No. 494 1999.
Latendresse, J.R., Brooks, C.L., Capen, C.C., 1994. Pathologic effects of butylatedtriphenyl phosphate-based hydraulic fluid and tricresyl phosphate on the adrenalgland, ovary, and testis in the Fischer-344 rat. Toxicol. Pathol. 22, 341–352.
Law, R.J., Herzke, D., Harrad, S., Morris, S., Bersuder, P., Allchin, C.R., 2008. Levels andtrends of HBCD and BDEs in the European and Asian environments, with someinformation for other BFRs. Chemosphere 73, 223–241.
Lee, K., Kim, J., Bae, J., Yang, J., Hong, S., Kim, H.K., 2002. Studies on the thermalstabilization enhancement of ABS; synergistic effect by triphenyl phosphateand epoxy resin mixtures. Polymer 43, 2249–2253.
Lehner, A.F., Samsing, F., Rumbeiha, W.K., 2010. Organophosphate ester flameretardant-induced acute intoxications in dogs. J. Med. Toxicol. 6, 448–458.
Leisewitz, A., Kruse, H., Schramm, E., 2000. Substituting Environmentally RelevantFlame Retardants: Assessment Fundamentals. Results and Summary Overview.Environmental Research Plan of the German Federal Ministry for theEnvironment, Nature Conservation and Nuclear Safety, Research, Report 29744 542 (December).
Lenoir, D., Becker, L., Thumm, W., Kettrup, A., Hauk, A., Sklorz, M., Bergmann, G.,Hutzinger, O., 1994. Evaluation of ecotoxicological properties from incinerationof new duroplastic materials without halogen as flame retardant. In: Conferenceon Flame Retardancy of Polymeric Materials, Stamford, Connecticut, USA.
Leonards, P., Steindal, E.H., van der Veen, I., Berg, V., Bustnes, J.O., van Leeuwen, S.,2011, Screening of Organophosphor Flame Retardants 2010. SPFO-Report 1091/2011. TA-2786/2011.
I. van der Veen, J. de Boer / Chemosphere 88 (2012) 1119–1153 1153
Marklund, A., Andersson, B., Haglund, P., 2003. Screening of organophosphoruscompounds and their distribution in various indoor environments.Chemosphere 53, 1137–1146.
Marklund, A., Andersson, B., Haglund, P., 2005a. Organophosphorus flameretardants and- plasticizers in air from various indoor environments. J.Environ. Monit. 7, 814–819.
Marklund, A., Andersson, B., Haglund, P., 2005b. Organophosphorus flameretardants and plasticizers in Swedish sewage treatment plants. Environ. Sci.Technol. 39, 7423–7429.
Martínez-Carballo, E., González-Barreiro, C., Sitka, A., Scharf, S., Gans, O., 2007.Determination of selected organophosphate esters in the aquatic environmentof Austria. Sci. Total Environ. 388, 290–299.
McPherson, A., Thorpe, B., Blake, A., 2004. Brominated Flame Retardants in Dust onComputers: The Case for Safer Chemicals and Better Computer Design. CleanProduction Action Report. <http://www.computertakeback.com/problem/bfr_report_pages1-43.pdf>.
Meeker, J.D., Stapleton, H.M., 2010. House dust concentrations of organophosphateflame retardants in relation to hormone levels and semen quality parameters.Environ. Health Perspect. 118, 318–323.
Meyer, J., Bester, K., 2004. Organophosphate flame retardants and plasticisers inwastewater treatment plants. J. Environ. Monit. 6, 599–605.
Moche, W., Stephan, K., Thanner, G., 2005. Levels of PBDE in sediments along thecourse of the River Danube through Austria. Organohal. Compd. 67, 475–478.
Ni, Y., Kumagai, K., Yanagisawa, Y., 2007. Measuring emissions oforganophosphate flame retardants using a passive flux sampler. Atmos.Environ. 41, 3235–3240.
Otake, T., Yoshinaga, J., Yanagisawa, Y., 2001. Analysis of organic esters of plasticizerin indoor air by GC-MS and GC-FPD. Environ. Sci. Technol. 35, 3099–3102.
Pakalin, S., Cole, T., Steinkellner, J., Nicolas, R., Tissier, C., Munn, S., Eisenreich, S.,2007. Review on Production Processes of Decabromodiphenyl Ether (decaBDE)Used in Polymeric Applications in Electrical and Electronic Equipment, andAssessment of the Availability of Potential Alternatives to decaBDE, EuropeanReport EUR 22693 EN, Brussel, Belgium.
Pawlowski, K.H., Schartel, B., 2007. Flame retardancy mechanisms of triphenylphosphate, resorcinol bis(diphenyl phosphate) and bisphenol A bis(diphenylphosphate) in polycarbonate/acrylonitrile–butadiene–styrene blends. Polym.Int. 56, 1404–1414.
Phosphorus, Inorganic & Nitrogen Flame retardant Association (PINFA), 2011.Human Health and Environmental Fact Sheet, MELAPUR 200 70 (20September).
Quednow, K., Püttmann, W., 2009. Temporal concentration changes of DEET, TCEP,terbutryn, and nonylphenols in freshwater streams of Hesse, Germany: possibleinfluence of mandatory regulations and voluntary environmental agreements.Environ. Sci. Pollut. Res. 16, 630–640.
Regnery, J., Püttmann, W., 2010. Occurrence and fate of organophosphorus flameretardants and plasticizers in urban and remote surface waters in Germany.Water Res. 44, 4097–4104.
Rodriguez, I., Calvo, F., Quintana, J.B., Rubi, E., Rodil, R., Cela, R., 2006. Suitability ofsolid-phase microextraction for the determination of organophosphate flameretardants and plasticizers in water samples. J. Chromatogr. A 1108, 158–165.
Saboori, A.M., Lang, D.M., Newcombe, D.S., 1991. Structural requirements for theinhibition of human monocyte carboxylesterase by organophosphoruscompounds. Chem.-Biol. Interact. 80, 327–338.
Saito, I., Onuki, A., Seto, H., 2001. Determination of organic phosphate triesters inindoor and outdoor air. Aerosol Res. Jpn. 16, 209–216.
Scientific Committee on Health and Environmental Risks (SCHER), 2006. Opinion onRisk Assessment Report on Tris (2-Chloroethyl) Phosphate (TCEP)Environmental Part Cas No.: 115-96-8 (4 July).
SCHER 2007a. Risk Assessment Report on Tris[2-Chloro-1-(Chloromethyl)ethyl]phosphate (TDCP) Environmental Part Cas No.: 13674-87-8.
SCHER, 2007b. Risk Assessment Report on 2,2-Bis(chloromethyl)trimethyleneBis[bis(2-chloroethyl)phosphate] (V6) Environmental Part Cas No.: 38051-10-4.
Schmitt, E., 2007. Phosphorus-based flame retardants for thermoplastics. Plast.,Addit. Compd. 9, 26–30.
Sigma-Aldrich, Sigmaaldrich, 2011. <http://www.sigmaaldrich.com> (accessed31.10.11).
Sjödin, A., Carlsson, H., Thuresson, K., Sjölin, S., Bergman, A., Östman, C., 2001. Flameretardants in indoor air at an electronics recycling plant and at other workenvironments. Environ. Sci. Technol. 35, 448–454.
SPIN, 2011. SPIN Offline Edition v2.03. Database of the Use of Chemical Substancesin the Nordic Countries.
Staaf, T., Ostman, C., 2005. Indoor air sampling of organophosphate trimesters usingsolid phase extraction (SPE) adsorbents. J. Environ. Monit. 7, 344–348.
Stackelberg, P.E., Furlong, E.T., Meyer, M.T., Zaugg, S.D., Henderson, A.K., Reissman,D.B., 2004. Persistence of pharmaceutical compounds and other organicwastewater contaminants in a conventional drinking-water-treatment plant.Sci. Total Environ. 329, 99–113.
Stackelberg, P.E., Gibs, J., Furlong, E.T., Meyer, M.T., Zaugg, S.D., Lippincott, R.L.,2007. Efficiency of conventional drinking-water-treatment processes inremoval of pharmaceuticals and other organic compounds. Sci. Total Environ.377, 255–272.
Stapleton, H.M., Klosterhaus, S., Eagle, S., Fuh, J., Meeker, J.D., Blum, A., Webster, T.F.,2009. Detection of organophosphate flame retardants in furniture foam and UShouse dust. Environ. Sci. Technol. 43, 7490–7495.
Stapleton, H.M., Klosterhaus, S., Keller, A., Ferguson, P.L., van Bergen, S., Cooper, E.,Webster, T.F., Blum, A., 2011. Identification of flame retardants in polyurethanefoam collected from baby products. Environ. Sci. Technol. 45, 5323–5331.
Stuer-Lauridsen, F., Cohr, K.H., Thorup Andersen, T., 2006. Danish EPA, Health andEnvironmental Assessment of Alternatives to Deca-BDE in Electrical andElectronic Equipment. DK EPA Report (July).
Sundkvist, A.M., Olofsson, U., Haglund, P., 2010. Organophosphorus flameretardants and plasticizers in marine and fresh water biota and in humanmilk. J. Environ. Monit. 12, 943–951.
Syrres, 2011. <http://www.syrres.com/esc/physdemo.htm> (accessed 31.10.11).Ten Berge, W.F., Heesen, T.J., Jongeneelen, F.J., 2005. IndusTox Consult. Selectie
Publieke Grenswaarden. Ontwerp van Selectie-Variabelen en Opstellen van deLijst Publieke Grenswaarden. Eindrapport. Rapport 2005018. Nijmegen (22November).
Tilson, H.A., Veronesi, B., McLamb, R.L., Matthews, H.B., 1990. Acute exposure totris(2-chloroethyl) phosphate produces hippocampal neuronal loss and impairslearning in rats. Toxicol. Appl. Pharmacol. 106, 254–269.
Tollbäck, J., Tamburro, D., Crescenzi, C., Carlsson, H., 2006. Air sampling withEmpore solid phase extraction membranes and online single-channeldesorption/liquid chromatography/mass spectrometry analysis: determinationof volatile and semi-volatile organophosphate esters. J. Chromatogr. A 1129, 1–8.
Umezu, T., Yonemoto, J., Soma, Y., Suzuki, T., 1998. Tris(2-chloroethyl) phosphateincreases ambulatory activity in mice. pharmacological analyses of itsneurochemical mechanism. Toxicol. Appl. Pharmacol. 148, 109–116.
UNEP PUBLICATIONS, 1996. Trimethyl Phosphate Cas No.: 512-56-1. SIDS InitialAssessment Report. For SIAM 4, Organisation for Economic Co-operation andDevelopment (OECD), Tokio, Japan, pp. 1–37 (20–22 May).
UNEP PUBLICATIONS, 1998. Triethyl Phosphate Cas No.: 78-40-0. SIDS InitialAssessment Report. For SIAM 5, Organisation for Economic Co-operation andDevelopment (OECD), Geneva, Switzerland, pp. 1–18 (October).
UNEP PUBLICATIONS, 2000. Tris(1-chloro-2-propyl)phosphate Cas N�: 13674–84-5.SIDS Initial Assessment Report. For SIAM 4, Organisation for Economic Co-operation and Development (OECD), Arlington, USA, pp. 117–163.
UNEP PUBLICATIONS, 2001. Tributyl Phosphate Cas No.: 126-73-8. SIDS InitialAssessment Report. For 12th SIAM, Organisation for Economic Co-operation andDevelopment (OECD), Paris, France, pp. 1–132 (June).
UNEP PUBLICATIONS, 2002. Triphenyl Phosphate Cas No.: 115-86-6. SIDS InitialAssessment Report. For SIAM 15, Organisation for Economic Co-operation andDevelopment (OECD), Boston, Massachussetts, pp. 1–151 (22–25 October).
UNEP PUBLICATIONS, 2004. Dimethyl Phosphonate Cas No.: 868-85-9. SIDS InitialAssessment Report. For SIAM 18, Organisation for Economic Co-operation andDevelopment (OECD), Paris, France, pp. 1–131 (20–23 April).
UNEP, 2009. Outcome of the Fourth Meeting of the Conference of the PartiesRelevant to the Work of the Persistent Organic Pollutants Review Committee.Stockholm Convention on Persistent Organic Pollutants, UNEP/POPS/POPRC.5/INF/3 (29 July).
US-EPA (United States–EPA), 2002. 1998–2002 Inventory Update Reporting (IUR)Production Volume Ranges, Downloadable 1998–2002 IUR Public Database.<http://www.epa.gov/oppt/iur/tools/data/2002>.
US-EPA, 2006. IUR, Downloadable 2006 IUR Public Database. <http://www.epa.gov/oppt/iur/tools/data/2006archive>.
US-EPA, 2007. Report on Alternatives to the Flame Retardant DecaBDE: Evaluationof Toxicity, Availability, Affordability, and Fire Safety Issues. A Report to theGovernor and the General Assembly, Illinois.
US-EPA, 2009. Screening-Level Hazard Characterization. Hazard CharacterizationDocument (September).
US-EPA, 2010. Screening-Level Hazard Characterization Trixylenyl PhosphateCASRN 251555-23-1. Hazard Characterization Document (June).
van den Eede, N., Dirtu, A.C., Neels, H., Covaci, A., 2011. Analytical developments andpreliminary assessment of human exposure to organophosphate flameretardants from indoor dust. Environ. Int. 37, 454–461.
VU-IVM. Amsterdam, The Netherlands, 2007. Minutes of the Quasimeme Workshopon Brominated Flame Retardants (23–24 April). <www.quasimeme.org>.
Wang, L.S., Kang, H.B.W.S.B., Wang, R., 2007. Solubilities, thermostabilities andflame retardance behaviour of phosphorus-containing flame retardants andcopolymers. Fluid Phase Equilib. 258, 99–107.
Washington State, 2006. Polybrominated Diphenyl Ether (PBDE) Chemical ActionPlan: Department of Ecology Publication No. 05-07-048, Department of Health,Publication No. 334-079 (January).
Weschler, C.J., 1980. Characterization of selected organics in size-fractionatedindoor aerosols. Environ. Sci. Technol. 14, 428–431.
Weschler, C.J., 1984. Indoor–outdoor relationships for nonpolar organicconstituents of aerosol particles. Environ. Sci. Technol. 18, 648–652.
World Health Organization (WHO), 1990. EHC 110: Tricresyl Phosphate, Geneva,Switzerland.
WHO, 1991. EHC 111: Triphenyl Phosphate, Geneva, Switzerland.WHO, 1997. EHC 192: Flame Retardants: A General Introduction. Geneva,
Switzerland.WHO, 1998. EHC 209: Flame Retardants: Tris-(Chloropropyl)Phosphate and Tris-(2-
Chloroethyl)phosphate, Geneva, Switzerland.WHO, 2000. EHC 218: Flame Retardants: Tris(2-butoxyethyl) phosphate, Tris(2-
Ethylhexyl) Phosphate and Tetrakis (Hydroxymethyl) Phosphonium Salts,Geneva, Switzerland.