phoenix convention center-economic and fiscal impact ... · july 2, 2018 . 2910 north 44 ... plus...
TRANSCRIPT
ECONOMIC AND FISCAL IMPACT ANALYSIS UPDATE
Phoenix Convention Center
PHOENIX, ARIZONA
SUBMITTED TO:EXISTING
Ms. Lindsey Perry Auditor General Office of the Auditor General State of Arizona 2910 North 44th Street, Suite 410 Phoenix, Arizona, 85018
PREPARED BY:
HVS Convention, Sports & Entertainment Facilities Consulting 205 West Randolph Suite 1650 Chicago, Illinois 60606 +1 (312) 587-9900
July 2, 2018
2910 NORTH 44th STREET • SUITE 410 • PHOENIX, ARIZONA 85018 • (602) 553-0333 • FAX (602) 553-0051
July 2, 2018
The Honorable Steve Yarbrough, President Arizona State Senate The Honorable J.D. Mesnard, Speaker Arizona House of Representatives The Honorable Doug Ducey, Governor State of Arizona Milton Dohoney, Jr., Assistant City Manager City of Phoenix Transmitted herewith is a report of the Auditor General, An Economic and Fiscal Impact Analysis Update of the Operation of the Phoenix Convention Center. The consulting firm HVS Convention, Sports & Entertainment Facilities Consulting (HVS), conducted the analysis under contract with the Auditor General and in response to the requirements of Arizona Revised Statutes §9-626. This analysis estimates tax revenues generated for the State of Arizona from regional and national conventions and trade shows held at the Phoenix Convention Center. For the calendar year ended December 31, 2017, HVS estimated that events held at the Convention Center generated $18.6 million in tax revenues for the State, which is less than the $22.5 million the State contributed toward the Convention Center’s expansion. In addition, tax revenues have exceeded the State’s contributions by $46.5 million from the completion of the Convention Center’s expansion in 2009 through calendar year 2017. Therefore, the City of Phoenix owes no monies back to the State for fiscal year 2019. My staff and I will be pleased to discuss or clarify items in the report.
Sincerely,
Lindsey Perry, CPA, CFE Auditor General
Convention, Sports & Entertainment Facilities Consulting Chicago, Illinois
July 2, 2018
Ms. Lindsey Perry Auditor General Office of the Auditor General State of Arizona 2910 North 44th Street, Suite 410 Phoenix, Arizona, 85018
Re: Phoenix Convention Center
Phoenix, Arizona, 85018
Dear Ms. Perry:
As directed by our agreement with The Office of the Auditor General and A.R.S. §9-626(A) and (B), HVS Convention, Sports, and Entertainment Facilities Consulting (“HVS”) submits the attached Economic and Fiscal Impact Analysis Update of the Phoenix Convention Center.
HVS staff collected and analyzed all information contained in this report. HVS sought out reliable sources and deemed information obtained from third parties to be accurate. The results of this study are subject to the comments, assumptions, and limiting conditions described in the report.
It has been a pleasure working with you.
Sincerely,
HVS Convention, Sports & Entertainment
Facilities Consulting
Thomas A Hazinski
Managing Director
Alex Moon
Senior Associate
205 West Randolph
Suite 1650
Chicago, Illinois 60606
+1 312-587-9900
+1 312-488-3631 FAX
www.hvs.com
Atlanta
Boston
Boulder
Chicago
Dallas
Denver
Las Vegas
Mexico City
Miami
Nassau
New York
Newport
San Francisco
Toronto
Vancouver
Washington
Athens
Buenos Aires
Dubai
Hong Kong
Lima
London
Madrid
Mumbai
New Delhi
Sao Paulo
Shanghai
Singapore
Convention, Sports & Entertainment Facilities Consulting Chicago, Illinois
Table of Contents
SECTION TITLE
1. Introduction and Executive Summary
2. Event Demand Analysis
3. Spending Estimates
4. Fiscal Impact Estimates
5. Statement of Assumptions and Limiting Conditions
6. Certification
A. Appendix - Qualified Events 2009 - 2017
B. Appendix - Qualified Events 2003 - 2005
C. Appendix - ExPact and Longwoods Report Calculations
D. Appendix - Venue Spending Data
E. Appendix - IMPLAN Output and Qualified Revenue Calculation
Convention, Sports & Entertainment Facilities Consulting Chicago, Illinois
July 2, 2018 Introduction and Executive Summary Economic and Fiscal Impact Analysis Update - Arizona 1-1
1. Introduction and Executive Summary
The Office of the Auditor General of the State of Arizona (“Auditor General”) engaged HVS Convention, Sports & Entertainment Facilities Consulting (“HVS”) to conduct an Economic and Fiscal Impact Analysis of the Phoenix Convention Center (“PCC”) in Phoenix, Arizona.
HVS performed this analysis as directed by A.R.S. §9-626(A) and (B). This statute requires an assessment of the value of direct, indirect, and induced economic activity resulting from regional and national conventions and trade shows held at the PCC. These estimates of economic activity provide the basis for estimates of the gross amount of State General Fund revenues received from income, sales, and luxury taxes derived from the operation of the PCC. Gross State General Fund revenue minus the amounts distributed as directed by A.R.S. §9-602(D) plus construction impacts equals the net impact on the State General Fund.
In the original Economic and Fiscal Impact Analysis dated August 1, 2014, HVS estimated the impact of the PCC for the period 2009 through 2013. In the Economic and Fiscal Impact Analysis Updates dated June 10, 2015, June 3, 2016, and June 7, 2017, HVS estimated the impact of the PCC in 2014, 2015, and 2016 respectively. This update estimates the 2017 impact of the PCC.
To estimate the fiscal impacts of the expansion, HVS followed the methodology outlined in the figure on the following page.
Nature of the Assignment
Economic Impact Methodology

Convention, Sports & Entertainment Facilities Consulting Chicago, Illinois
July 2, 2018 Introduction and Executive Summary Economic and Fiscal Impact Analysis Update - Arizona 1-2
FIGURE 1-1 ECONOMIC AND FISCAL IMPACT ANALYSIS PROCESS
As required under A.R.S. §9-626, HVS estimated the change in economic activity related to “regional and national conventions and trade shows held at the site of the eligible project” referred to hereinafter as “Qualified Events.” HVS relied on historical data on Qualified Events, attendance, and room nights generated by the PCC before and after its expansion to estimate the increase in the number of and attendance at Qualified Events.
For the no-expansion scenario, HVS assumed that in 2009, the PCC would have achieved an average annual level of Qualified Events for the years 2003 through 2005. From 2006 through 2008, the project to expand the PCC was in process, negatively affecting the annual level of Qualified Events. From 2010 through 2013, we applied the actual percent change in demand to the historical averages. For
Overnight Visitors
Day Trip Visitors
Attendees
Gross Direct
Spending
Net Direct Spending
Indirect Spending
Induced Spending
IMPLAN Spending
per Visitor Day or
Attendee
Detailed Net
Spending by Sector
(Tax Base)
Effective Tax Rates
Gross General
Fund Impacts
General Fund
Support
Net General
Fund Impacts
Actual Qualified
Events
Qualified Events
without Expansion
New Qualified
Events
Convention, Sports & Entertainment Facilities Consulting Chicago, Illinois
July 2, 2018 Introduction and Executive Summary Economic and Fiscal Impact Analysis Update - Arizona 1-3
2014 through 2017, we assumed that the PCC without expansion would remain at the same level of demand as 2013. Without reinvestment, convention facilities in Phoenix would have become functionally obsolete and unable to attract new events. The difference between the expansion and the no-expansion scenarios represents net demand added by the expansion. HVS estimated overnight visitors, day-trip visitors, and attendees to the PCC.
HVS used estimates of the amounts of spending per visitor or attendee to estimate gross direct spending or income associated with Qualified Events. Gross direct spending provides the inputs into the IMPLAN model of the local area economy. IMPLAN is a nationally recognized input-output model that estimates the income and employment effects of changes in economic activity. The model used in the update relied on the most recent available data (2016) on the Arizona economy. IMPLAN generates estimates of total net spending. Spending falls into three categories: net direct spending, indirect spending, and induced spending. The sum of net direct, indirect, and induced spending estimates makes up the total estimated spending impact of the New Qualified Events.
To estimate fiscal impacts, HVS identified the sources of spending that would generate General Fund revenues: 1) Sales and Use Taxes, 2) Personal Income Taxes, 3) Corporate Income Taxes, and 4) Luxury Taxes. Detailed outputs of the IMPLAN model provide a basis for quantifying the tax base for each tax. We applied the appropriate effective tax rate to the tax base to estimate General Fund Revenue generated by Qualified Events (“Qualified Revenue”). Subtracting distributions from Qualified Revenue yields an estimate of the net impact on the State General Fund.
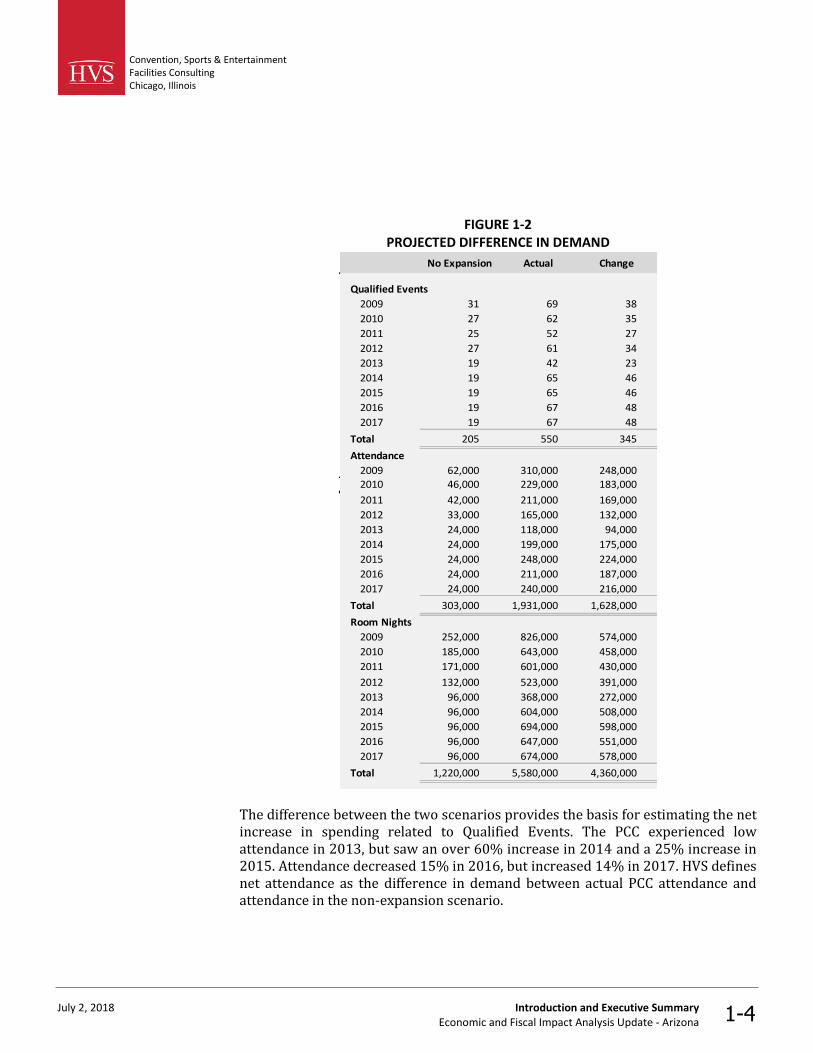
The Greater Phoenix Convention and Visitors Bureau (“GPCVB”) provided HVS with data on historical Qualified Events from 2009 through 2017. The figure on the following page shows the difference between the number of Qualified Events and their associated attendance and room nights for each year in the non-expansion and expansion scenarios.
Event Demand Analysis
Convention, Sports & Entertainment Facilities Consulting Chicago, Illinois
July 2, 2018 Introduction and Executive Summary Economic and Fiscal Impact Analysis Update - Arizona 1-4
FIGURE 1-2 PROJECTED DIFFERENCE IN DEMAND
No Expansion Actual Change
Qualified Events
2009 31 69 38
2010 27 62 35
2011 25 52 27
2012 27 61 34
2013 19 42 23
2014 19 65 46
2015 19 65 46
2016 19 67 48
2017 19 67 48
Total 205 550 345
Attendance
2009 62,000 310,000 248,0002010 46,000 229,000 183,000
2011 42,000 211,000 169,000
2012 33,000 165,000 132,000
2013 24,000 118,000 94,000
2014 24,000 199,000 175,000
2015 24,000 248,000 224,000
2016 24,000 211,000 187,000
2017 24,000 240,000 216,000
Total 303,000 1,931,000 1,628,000
Room Nights
2009 252,000 826,000 574,000
2010 185,000 643,000 458,000
2011 171,000 601,000 430,000
2012 132,000 523,000 391,000
2013 96,000 368,000 272,000
2014 96,000 604,000 508,000
2015 96,000 694,000 598,000
2016 96,000 647,000 551,000
2017 96,000 674,000 578,000
Total 1,220,000 5,580,000 4,360,000
The difference between the two scenarios provides the basis for estimating the net increase in spending related to Qualified Events. The PCC experienced low attendance in 2013, but saw an over 60% increase in 2014 and a 25% increase in 2015. Attendance decreased 15% in 2016, but increased 14% in 2017. HVS defines net attendance as the difference in demand between actual PCC attendance and attendance in the non-expansion scenario.
Convention, Sports & Entertainment Facilities Consulting Chicago, Illinois
July 2, 2018 Introduction and Executive Summary Economic and Fiscal Impact Analysis Update - Arizona 1-5
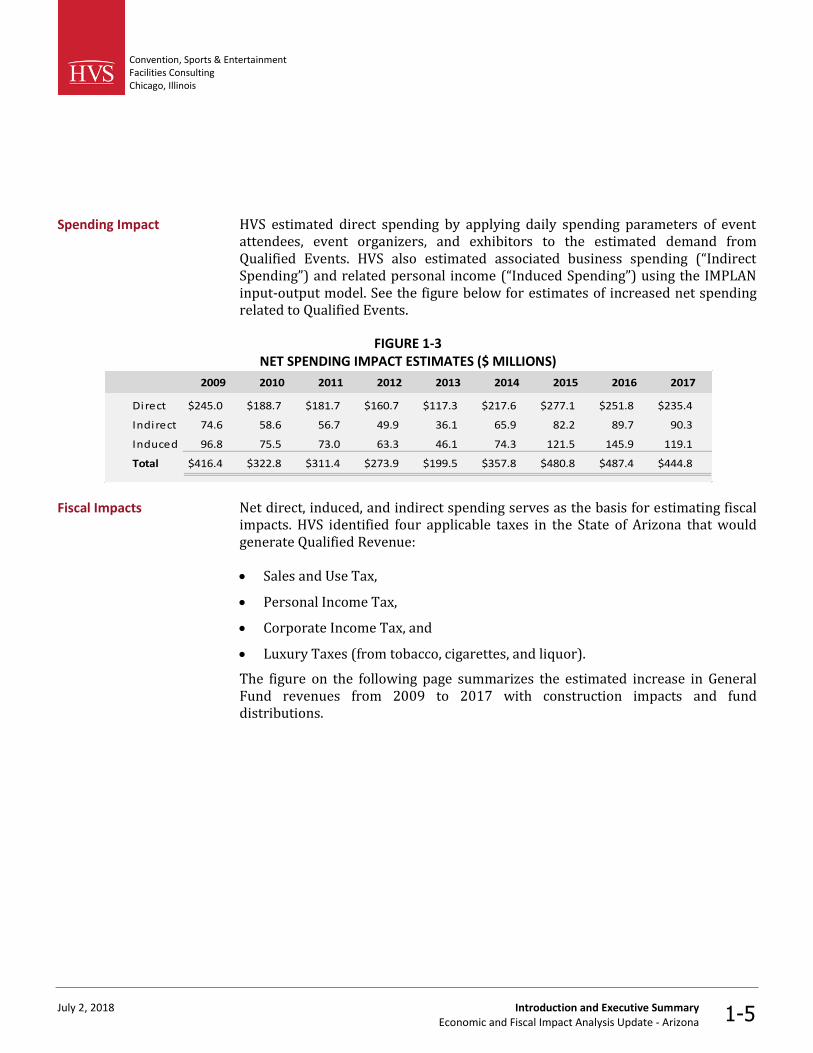
HVS estimated direct spending by applying daily spending parameters of event attendees, event organizers, and exhibitors to the estimated demand from Qualified Events. HVS also estimated associated business spending (“Indirect Spending”) and related personal income (“Induced Spending”) using the IMPLAN input-output model. See the figure below for estimates of increased net spending related to Qualified Events.
FIGURE 1-3 NET SPENDING IMPACT ESTIMATES ($ MILLIONS)
2009 2010 2011 2012 2013 2014 2015 2016 2017
Direct $245.0 $188.7 $181.7 $160.7 $117.3 $217.6 $277.1 $251.8 $235.4
Indirect 74.6 58.6 56.7 49.9 36.1 65.9 82.2 89.7 90.3
Induced 96.8 75.5 73.0 63.3 46.1 74.3 121.5 145.9 119.1
Total $416.4 $322.8 $311.4 $273.9 $199.5 $357.8 $480.8 $487.4 $444.8
Net direct, induced, and indirect spending serves as the basis for estimating fiscal impacts. HVS identified four applicable taxes in the State of Arizona that would generate Qualified Revenue:
• Sales and Use Tax,
• Personal Income Tax,
• Corporate Income Tax, and
• Luxury Taxes (from tobacco, cigarettes, and liquor).
The figure on the following page summarizes the estimated increase in General Fund revenues from 2009 to 2017 with construction impacts and fund distributions.
Spending Impact
Fiscal Impacts
Convention, Sports & Entertainment Facilities Consulting Chicago, Illinois
July 2, 2018 Introduction and Executive Summary Economic and Fiscal Impact Analysis Update - Arizona 1-6
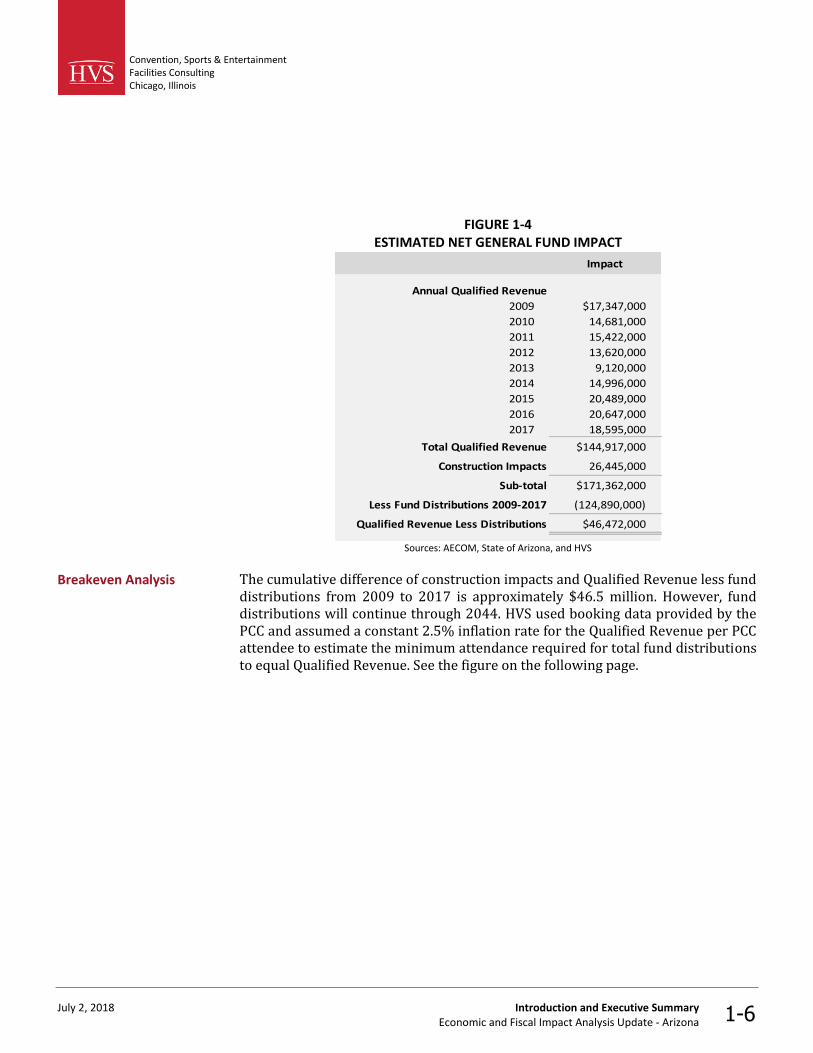
FIGURE 1-4 ESTIMATED NET GENERAL FUND IMPACT
Impact
Annual Qualified Revenue
2009 $17,347,000
2010 14,681,000
2011 15,422,000
2012 13,620,000
2013 9,120,000
2014 14,996,000
2015 20,489,000
2016 20,647,000
2017 18,595,000
Total Qualified Revenue $144,917,000
Construction Impacts 26,445,000
Sub-total $171,362,000
Less Fund Distributions 2009-2017 (124,890,000)
Qualified Revenue Less Distributions $46,472,000
Sources: AECOM, State of Arizona, and HVS
The cumulative difference of construction impacts and Qualified Revenue less fund distributions from 2009 to 2017 is approximately $46.5 million. However, fund distributions will continue through 2044. HVS used booking data provided by the PCC and assumed a constant 2.5% inflation rate for the Qualified Revenue per PCC attendee to estimate the minimum attendance required for total fund distributions to equal Qualified Revenue. See the figure on the following page.
Breakeven Analysis
Convention, Sports & Entertainment Facilities Consulting Chicago, Illinois
July 2, 2018 Introduction and Executive Summary Economic and Fiscal Impact Analysis Update - Arizona 1-7
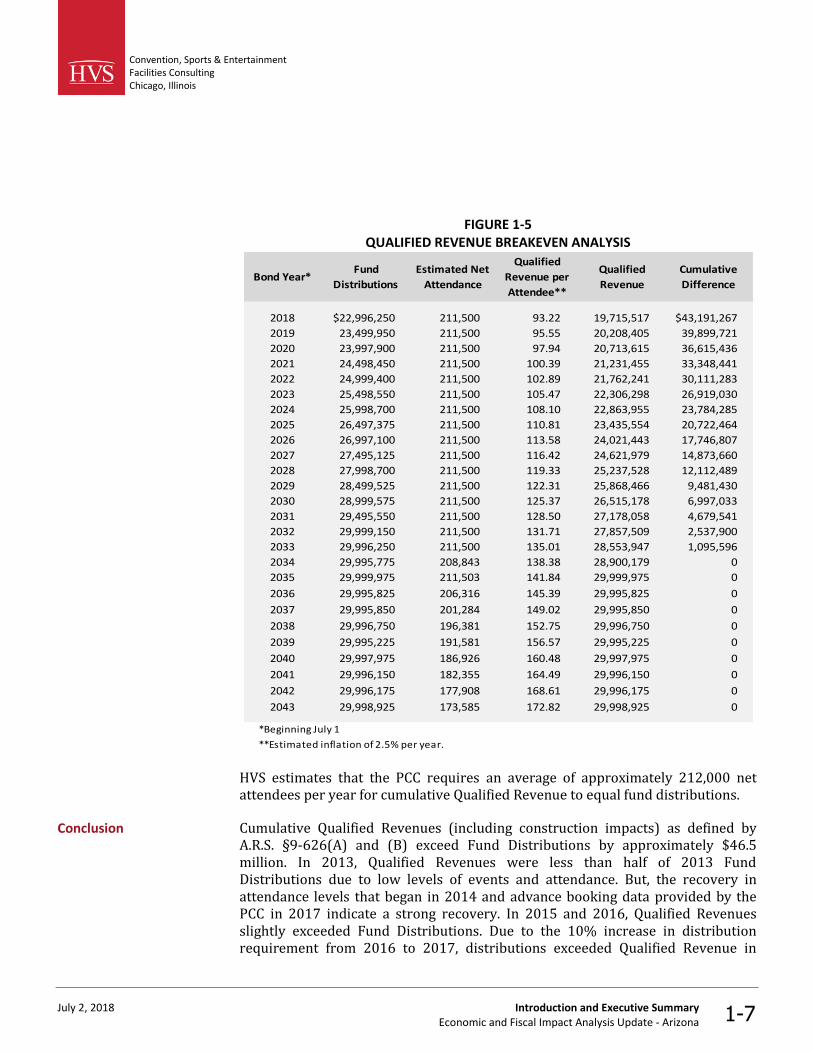
FIGURE 1-5 QUALIFIED REVENUE BREAKEVEN ANALYSIS
Bond Year*Fund
Distributions
Estimated Net
Attendance
Qualified
Revenue per
Attendee**
Qualified
Revenue
Cumulative
Difference
2018 $22,996,250 211,500 93.22 19,715,517 $43,191,267
2019 23,499,950 211,500 95.55 20,208,405 39,899,721
2020 23,997,900 211,500 97.94 20,713,615 36,615,436
2021 24,498,450 211,500 100.39 21,231,455 33,348,441
2022 24,999,400 211,500 102.89 21,762,241 30,111,283
2023 25,498,550 211,500 105.47 22,306,298 26,919,030
2024 25,998,700 211,500 108.10 22,863,955 23,784,285
2025 26,497,375 211,500 110.81 23,435,554 20,722,464
2026 26,997,100 211,500 113.58 24,021,443 17,746,807
2027 27,495,125 211,500 116.42 24,621,979 14,873,660
2028 27,998,700 211,500 119.33 25,237,528 12,112,489
2029 28,499,525 211,500 122.31 25,868,466 9,481,430
2030 28,999,575 211,500 125.37 26,515,178 6,997,033
2031 29,495,550 211,500 128.50 27,178,058 4,679,541
2032 29,999,150 211,500 131.71 27,857,509 2,537,900
2033 29,996,250 211,500 135.01 28,553,947 1,095,596
2034 29,995,775 208,843 138.38 28,900,179 0
2035 29,999,975 211,503 141.84 29,999,975 0
2036 29,995,825 206,316 145.39 29,995,825 0
2037 29,995,850 201,284 149.02 29,995,850 0
2038 29,996,750 196,381 152.75 29,996,750 0
2039 29,995,225 191,581 156.57 29,995,225 0
2040 29,997,975 186,926 160.48 29,997,975 0
2041 29,996,150 182,355 164.49 29,996,150 0
2042 29,996,175 177,908 168.61 29,996,175 0
2043 29,998,925 173,585 172.82 29,998,925 0
*Beginning July 1
**Estimated inflation of 2.5% per year.
HVS estimates that the PCC requires an average of approximately 212,000 net attendees per year for cumulative Qualified Revenue to equal fund distributions.
Cumulative Qualified Revenues (including construction impacts) as defined by A.R.S. §9-626(A) and (B) exceed Fund Distributions by approximately $46.5 million. In 2013, Qualified Revenues were less than half of 2013 Fund Distributions due to low levels of events and attendance. But, the recovery in attendance levels that began in 2014 and advance booking data provided by the PCC in 2017 indicate a strong recovery. In 2015 and 2016, Qualified Revenues slightly exceeded Fund Distributions. Due to the 10% increase in distribution requirement from 2016 to 2017, distributions exceeded Qualified Revenue in
Conclusion
Convention, Sports & Entertainment Facilities Consulting Chicago, Illinois
July 2, 2018 Introduction and Executive Summary Economic and Fiscal Impact Analysis Update - Arizona 1-8
2017. However, assuming long-term moderate levels of event demand and inflationary growth of visitor spending, the PCC should develop a net positive impact on the General Fund.
Convention, Sports & Entertainment Facilities Consulting Chicago, Illinois
July 2, 2018 Event Demand Analysis Economic and Fiscal Impact Analysis Update - Arizona 2-1
2. Event Demand Analysis
The Phoenix Civic Plaza opened in 1972. Demand for an expansion of the center arose as the population and economy of the City of Phoenix grew. In 1985, the venue doubled its total function space and expanded to approximately 300,000 square feet of rentable function space. It underwent renovations in the early 1990s.
In 2001, Phoenix voters approved a second large-scale convention center expansion project. The City gained permission to spend approximately $300 million on the project. In 2003, The Arizona Legislature approved another $300 million in funding from the State of Arizona. The project entailed;
• building a new three-story West Building on the old Symphony Terrace site with a lower level,
• demolishing and replacing the main North Building with a new three-story facility with a lower level that connects to the West Building, and
• renovating the interior of the South Building.
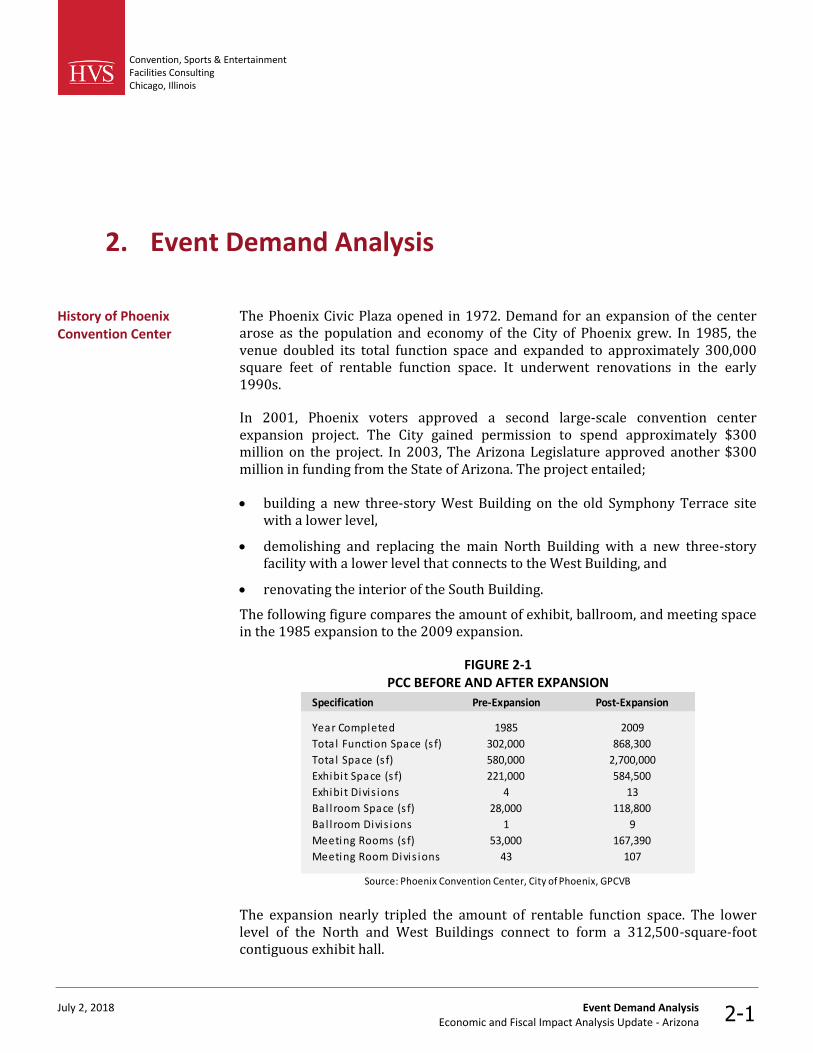
The following figure compares the amount of exhibit, ballroom, and meeting space in the 1985 expansion to the 2009 expansion.
FIGURE 2-1 PCC BEFORE AND AFTER EXPANSION
Specification Pre-Expansion Post-Expansion
Year Completed 1985 2009
Tota l Function Space (s f) 302,000 868,300
Tota l Space (s f) 580,000 2,700,000
Exhibit Space (s f) 221,000 584,500
Exhibit Divis ions 4 13
Bal l room Space (s f) 28,000 118,800
Bal l room Divis ions 1 9
Meeting Rooms (s f) 53,000 167,390
Meeting Room Divis ions 43 107
Source: Phoenix Convention Center, City of Phoenix, GPCVB
The expansion nearly tripled the amount of rentable function space. The lower level of the North and West Buildings connect to form a 312,500-square-foot contiguous exhibit hall.
History of Phoenix Convention Center
Convention, Sports & Entertainment Facilities Consulting Chicago, Illinois
July 2, 2018 Event Demand Analysis Economic and Fiscal Impact Analysis Update - Arizona 2-2
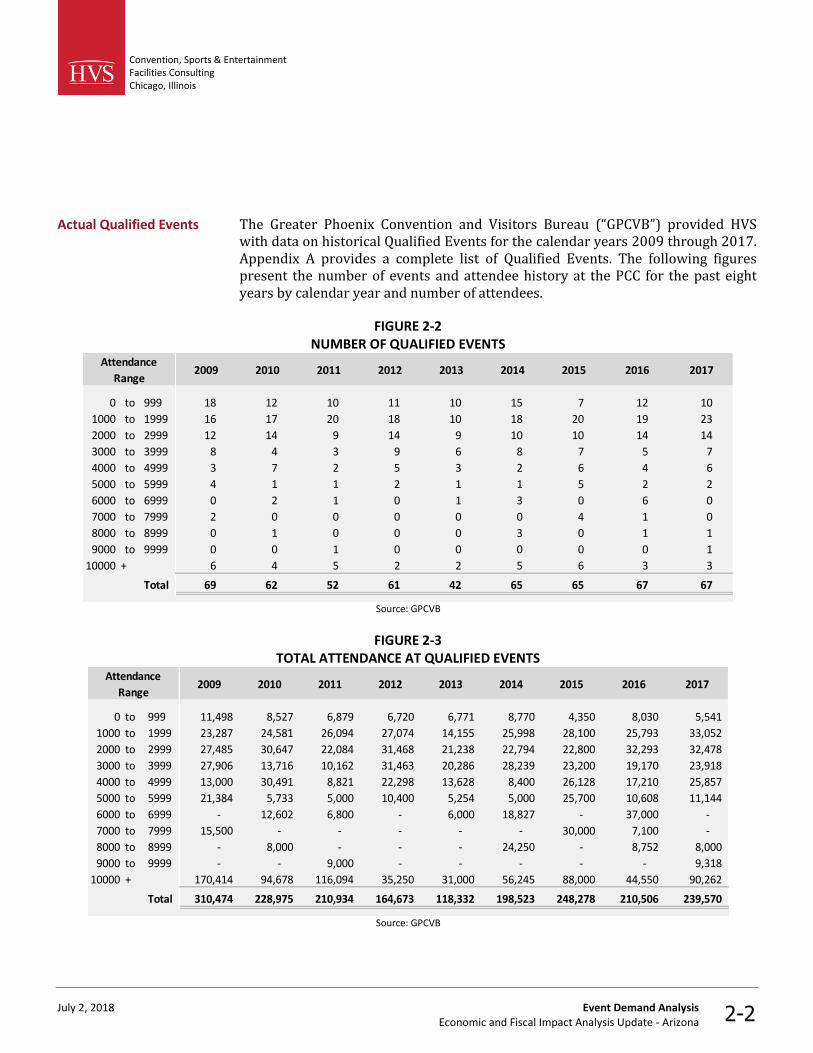
The Greater Phoenix Convention and Visitors Bureau (“GPCVB”) provided HVS with data on historical Qualified Events for the calendar years 2009 through 2017. Appendix A provides a complete list of Qualified Events. The following figures present the number of events and attendee history at the PCC for the past eight years by calendar year and number of attendees.
FIGURE 2-2 NUMBER OF QUALIFIED EVENTS
2009 2010 2011 2012 2013 2014 2015 2016 2017
0 to 999 18 12 10 11 10 15 7 12 10
1000 to 1999 16 17 20 18 10 18 20 19 23
2000 to 2999 12 14 9 14 9 10 10 14 14
3000 to 3999 8 4 3 9 6 8 7 5 7
4000 to 4999 3 7 2 5 3 2 6 4 6
5000 to 5999 4 1 1 2 1 1 5 2 2
6000 to 6999 0 2 1 0 1 3 0 6 0
7000 to 7999 2 0 0 0 0 0 4 1 0
8000 to 8999 0 1 0 0 0 3 0 1 1
9000 to 9999 0 0 1 0 0 0 0 0 1
10000 + 6 4 5 2 2 5 6 3 3
Total 69 62 52 61 42 65 65 67 67
Attendance
Range
Source: GPCVB
FIGURE 2-3 TOTAL ATTENDANCE AT QUALIFIED EVENTS
2009 2010 2011 2012 2013 2014 2015 2016 2017
0 to 999 11,498 8,527 6,879 6,720 6,771 8,770 4,350 8,030 5,541
1000 to 1999 23,287 24,581 26,094 27,074 14,155 25,998 28,100 25,793 33,052
2000 to 2999 27,485 30,647 22,084 31,468 21,238 22,794 22,800 32,293 32,478
3000 to 3999 27,906 13,716 10,162 31,463 20,286 28,239 23,200 19,170 23,918
4000 to 4999 13,000 30,491 8,821 22,298 13,628 8,400 26,128 17,210 25,857
5000 to 5999 21,384 5,733 5,000 10,400 5,254 5,000 25,700 10,608 11,144
6000 to 6999 - 12,602 6,800 - 6,000 18,827 - 37,000 -
7000 to 7999 15,500 - - - - - 30,000 7,100 -
8000 to 8999 - 8,000 - - - 24,250 - 8,752 8,000
9000 to 9999 - - 9,000 - - - - - 9,318
10000 + 170,414 94,678 116,094 35,250 31,000 56,245 88,000 44,550 90,262
Total 310,474 228,975 210,934 164,673 118,332 198,523 248,278 210,506 239,570
Attendance
Range
Source: GPCVB
Actual Qualified Events
Convention, Sports & Entertainment Facilities Consulting Chicago, Illinois
July 2, 2018 Event Demand Analysis Economic and Fiscal Impact Analysis Update - Arizona 2-3
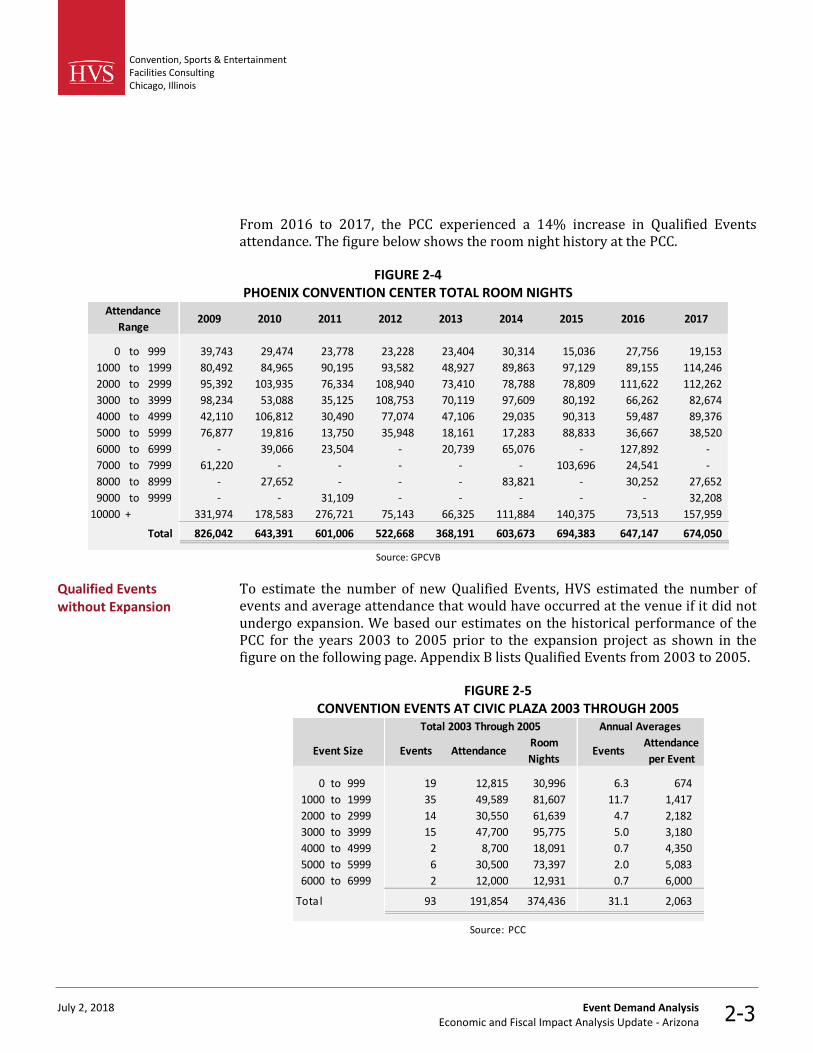
From 2016 to 2017, the PCC experienced a 14% increase in Qualified Events attendance. The figure below shows the room night history at the PCC.
FIGURE 2-4 PHOENIX CONVENTION CENTER TOTAL ROOM NIGHTS
2009 2010 2011 2012 2013 2014 2015 2016 2017
0 to 999 39,743 29,474 23,778 23,228 23,404 30,314 15,036 27,756 19,153
1000 to 1999 80,492 84,965 90,195 93,582 48,927 89,863 97,129 89,155 114,246
2000 to 2999 95,392 103,935 76,334 108,940 73,410 78,788 78,809 111,622 112,262
3000 to 3999 98,234 53,088 35,125 108,753 70,119 97,609 80,192 66,262 82,674
4000 to 4999 42,110 106,812 30,490 77,074 47,106 29,035 90,313 59,487 89,376
5000 to 5999 76,877 19,816 13,750 35,948 18,161 17,283 88,833 36,667 38,520
6000 to 6999 - 39,066 23,504 - 20,739 65,076 - 127,892 -
7000 to 7999 61,220 - - - - - 103,696 24,541 -
8000 to 8999 - 27,652 - - - 83,821 - 30,252 27,652
9000 to 9999 - - 31,109 - - - - - 32,208
10000 + 331,974 178,583 276,721 75,143 66,325 111,884 140,375 73,513 157,959
Total 826,042 643,391 601,006 522,668 368,191 603,673 694,383 647,147 674,050
Attendance
Range
Source: GPCVB
To estimate the number of new Qualified Events, HVS estimated the number of events and average attendance that would have occurred at the venue if it did not undergo expansion. We based our estimates on the historical performance of the PCC for the years 2003 to 2005 prior to the expansion project as shown in the figure on the following page. Appendix B lists Qualified Events from 2003 to 2005.
FIGURE 2-5 CONVENTION EVENTS AT CIVIC PLAZA 2003 THROUGH 2005
Total 2003 Through 2005 Annual Averages
Event Size Events AttendanceRoom
NightsEvents
Attendance
per Event
0 to 999 19 12,815 30,996 6.3 674
1000 to 1999 35 49,589 81,607 11.7 1,417
2000 to 2999 14 30,550 61,639 4.7 2,182
3000 to 3999 15 47,700 95,775 5.0 3,180
4000 to 4999 2 8,700 18,091 0.7 4,350
5000 to 5999 6 30,500 73,397 2.0 5,083
6000 to 6999 2 12,000 12,931 0.7 6,000
Tota l 93 191,854 374,436 31.1 2,063
Source: PCC
Qualified Events without Expansion
Convention, Sports & Entertainment Facilities Consulting Chicago, Illinois
July 2, 2018 Event Demand Analysis Economic and Fiscal Impact Analysis Update - Arizona 2-4
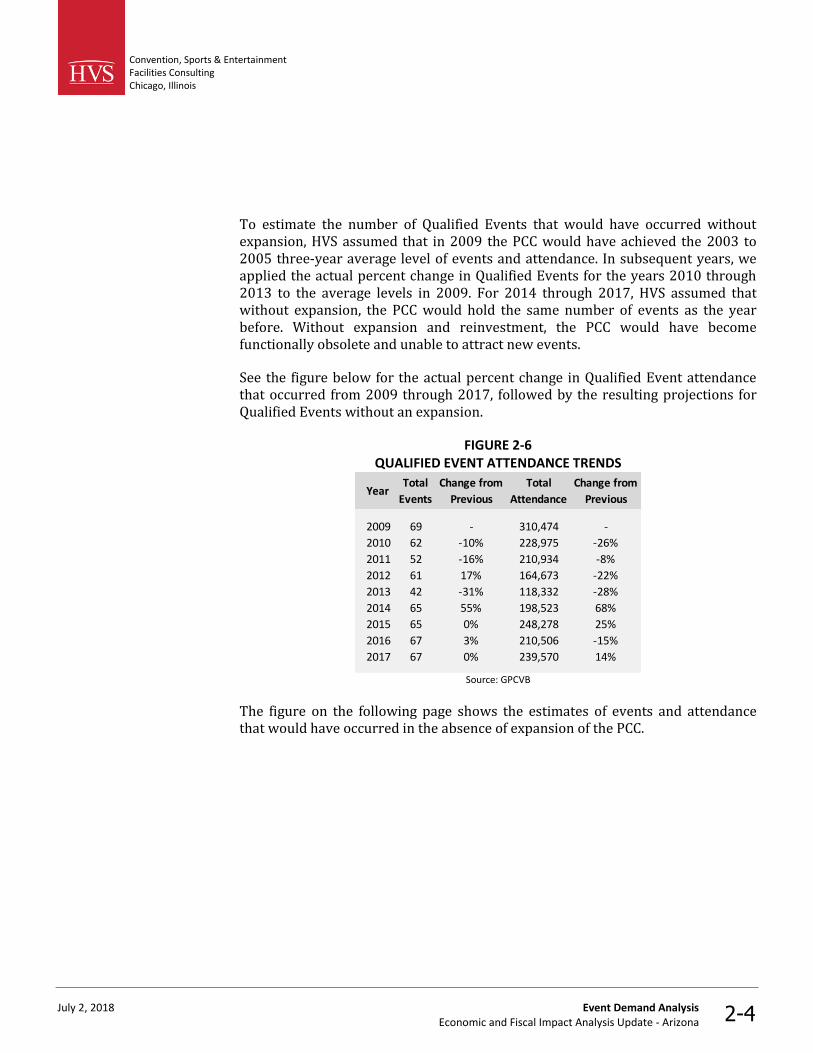
To estimate the number of Qualified Events that would have occurred without expansion, HVS assumed that in 2009 the PCC would have achieved the 2003 to 2005 three-year average level of events and attendance. In subsequent years, we applied the actual percent change in Qualified Events for the years 2010 through 2013 to the average levels in 2009. For 2014 through 2017, HVS assumed that without expansion, the PCC would hold the same number of events as the year before. Without expansion and reinvestment, the PCC would have become functionally obsolete and unable to attract new events.
See the figure below for the actual percent change in Qualified Event attendance that occurred from 2009 through 2017, followed by the resulting projections for Qualified Events without an expansion.
FIGURE 2-6 QUALIFIED EVENT ATTENDANCE TRENDS
YearTotal
Events
Change from
Previous
Total
Attendance
Change from
Previous
2009 69 - 310,474 -
2010 62 -10% 228,975 -26%
2011 52 -16% 210,934 -8%
2012 61 17% 164,673 -22%
2013 42 -31% 118,332 -28%
2014 65 55% 198,523 68%
2015 65 0% 248,278 25%
2016 67 3% 210,506 -15%
2017 67 0% 239,570 14%
Source: GPCVB
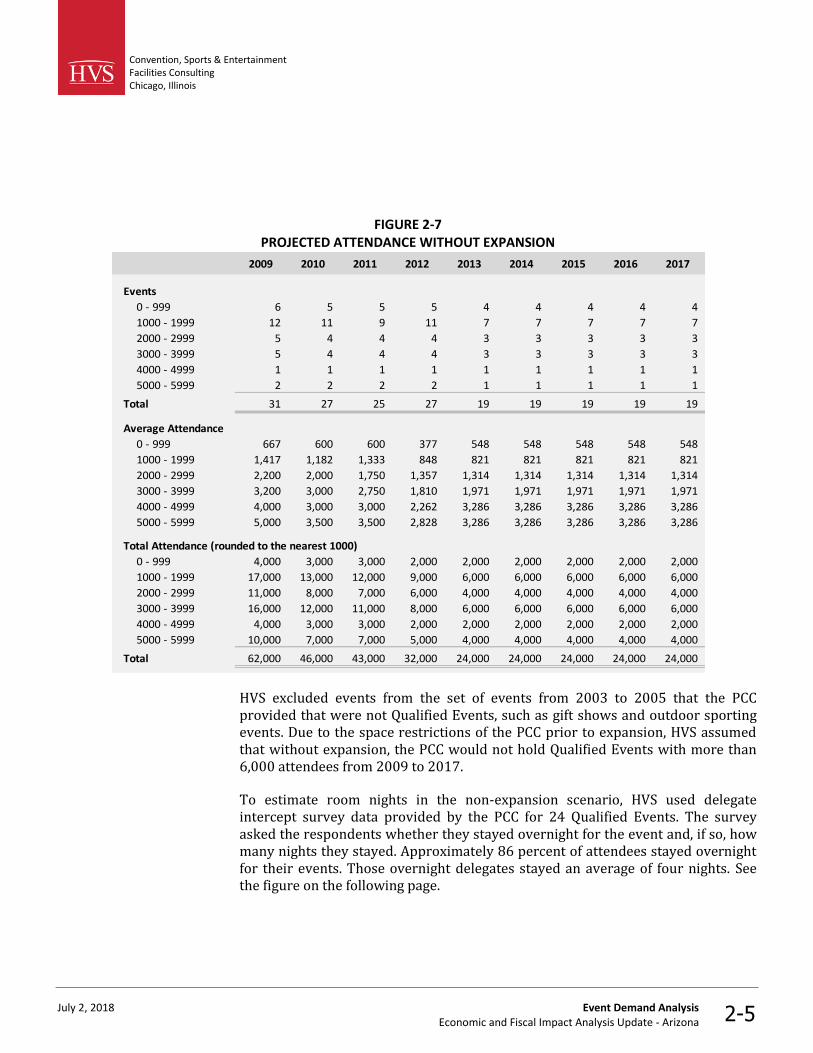
The figure on the following page shows the estimates of events and attendance that would have occurred in the absence of expansion of the PCC.
Convention, Sports & Entertainment Facilities Consulting Chicago, Illinois
July 2, 2018 Event Demand Analysis Economic and Fiscal Impact Analysis Update - Arizona 2-5
FIGURE 2-7 PROJECTED ATTENDANCE WITHOUT EXPANSION
2009 2010 2011 2012 2013 2014 2015 2016 2017
Events
0 - 999 6 5 5 5 4 4 4 4 4
1000 - 1999 12 11 9 11 7 7 7 7 7
2000 - 2999 5 4 4 4 3 3 3 3 3
3000 - 3999 5 4 4 4 3 3 3 3 3
4000 - 4999 1 1 1 1 1 1 1 1 1
5000 - 5999 2 2 2 2 1 1 1 1 1
Total 31 27 25 27 19 19 19 19 19
Average Attendance
0 - 999 667 600 600 377 548 548 548 548 548
1000 - 1999 1,417 1,182 1,333 848 821 821 821 821 821
2000 - 2999 2,200 2,000 1,750 1,357 1,314 1,314 1,314 1,314 1,314
3000 - 3999 3,200 3,000 2,750 1,810 1,971 1,971 1,971 1,971 1,971
4000 - 4999 4,000 3,000 3,000 2,262 3,286 3,286 3,286 3,286 3,286
5000 - 5999 5,000 3,500 3,500 2,828 3,286 3,286 3,286 3,286 3,286
Total Attendance (rounded to the nearest 1000)
0 - 999 4,000 3,000 3,000 2,000 2,000 2,000 2,000 2,000 2,000
1000 - 1999 17,000 13,000 12,000 9,000 6,000 6,000 6,000 6,000 6,000
2000 - 2999 11,000 8,000 7,000 6,000 4,000 4,000 4,000 4,000 4,000
3000 - 3999 16,000 12,000 11,000 8,000 6,000 6,000 6,000 6,000 6,000
4000 - 4999 4,000 3,000 3,000 2,000 2,000 2,000 2,000 2,000 2,000
5000 - 5999 10,000 7,000 7,000 5,000 4,000 4,000 4,000 4,000 4,000
Total 62,000 46,000 43,000 32,000 24,000 24,000 24,000 24,000 24,000
HVS excluded events from the set of events from 2003 to 2005 that the PCC provided that were not Qualified Events, such as gift shows and outdoor sporting events. Due to the space restrictions of the PCC prior to expansion, HVS assumed that without expansion, the PCC would not hold Qualified Events with more than 6,000 attendees from 2009 to 2017.
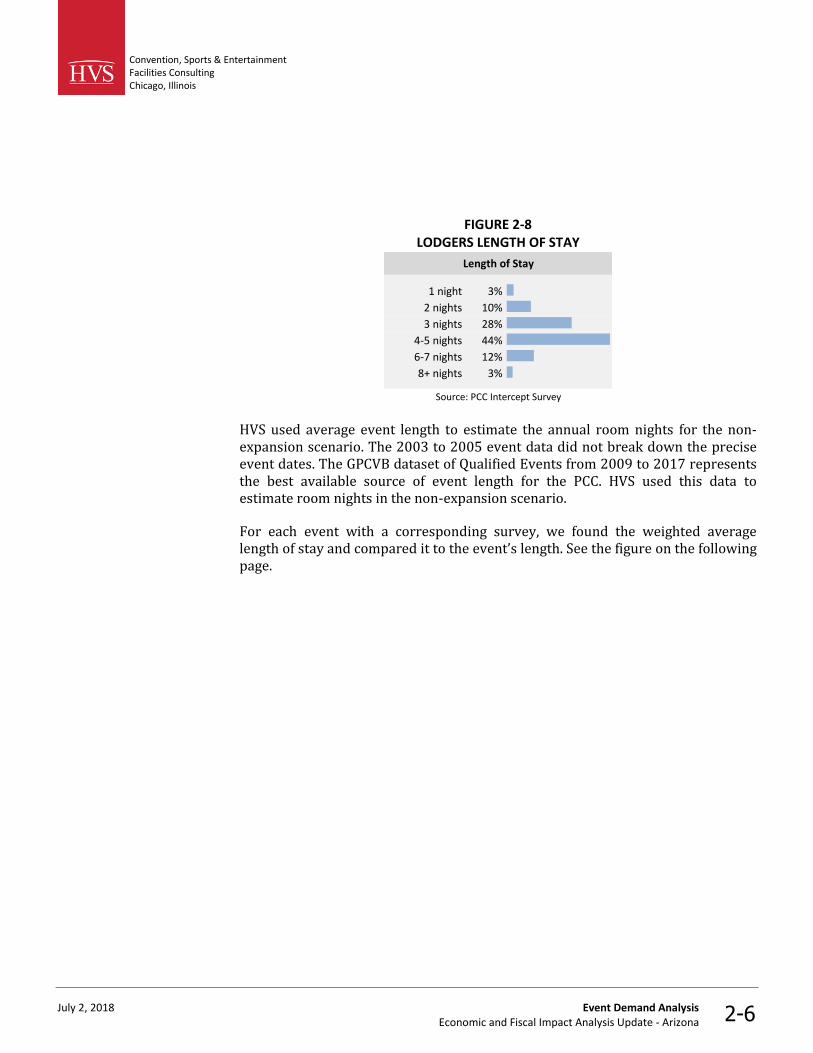
To estimate room nights in the non-expansion scenario, HVS used delegate intercept survey data provided by the PCC for 24 Qualified Events. The survey asked the respondents whether they stayed overnight for the event and, if so, how many nights they stayed. Approximately 86 percent of attendees stayed overnight for their events. Those overnight delegates stayed an average of four nights. See the figure on the following page.
Convention, Sports & Entertainment Facilities Consulting Chicago, Illinois
July 2, 2018 Event Demand Analysis Economic and Fiscal Impact Analysis Update - Arizona 2-6
FIGURE 2-8 LODGERS LENGTH OF STAY
Length of Stay
1 night 3%
2 nights 10%
3 nights 28%
4-5 nights 44%
6-7 nights 12%
8+ nights 3%
Source: PCC Intercept Survey
HVS used average event length to estimate the annual room nights for the non-expansion scenario. The 2003 to 2005 event data did not break down the precise event dates. The GPCVB dataset of Qualified Events from 2009 to 2017 represents the best available source of event length for the PCC. HVS used this data to estimate room nights in the non-expansion scenario.
For each event with a corresponding survey, we found the weighted average length of stay and compared it to the event’s length. See the figure on the following page.
Convention, Sports & Entertainment Facilities Consulting Chicago, Illinois
July 2, 2018 Event Demand Analysis Economic and Fiscal Impact Analysis Update - Arizona 2-7
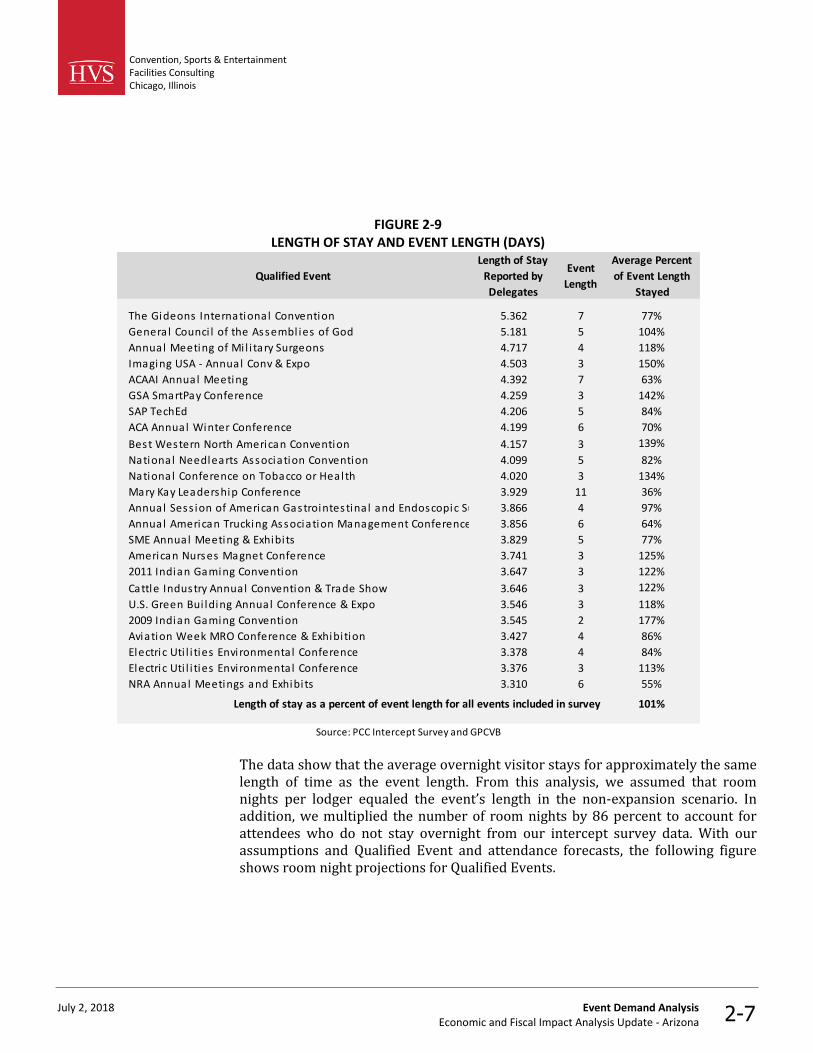
FIGURE 2-9 LENGTH OF STAY AND EVENT LENGTH (DAYS)
Qualified Event
Length of Stay
Reported by
Delegates
Event
Length
Average Percent
of Event Length
Stayed
The Gideons International Convention 5.362 7 77%
General Counci l of the Assembl ies of God 5.181 5 104%
Annual Meeting of Mi l i tary Surgeons 4.717 4 118%
Imaging USA - Annual Conv & Expo 4.503 3 150%
ACAAI Annual Meeting 4.392 7 63%
GSA SmartPay Conference 4.259 3 142%
SAP TechEd 4.206 5 84%
ACA Annual Winter Conference 4.199 6 70%
Best Western North American Convention 4.157 3 139%
National Needlearts Association Convention 4.099 5 82%
National Conference on Tobacco or Health 4.020 3 134%
Mary Kay Leadership Conference 3.929 11 36%
Annual Sess ion of American Gastrointestina l and Endoscopic Surgeons3.866 4 97%
Annual American Trucking Association Management Conference & Exhibi tion3.856 6 64%
SME Annual Meeting & Exhibi ts 3.829 5 77%
American Nurses Magnet Conference 3.741 3 125%
2011 Indian Gaming Convention 3.647 3 122%
Cattle Industry Annual Convention & Trade Show 3.646 3 122%
U.S. Green Bui lding Annual Conference & Expo 3.546 3 118%
2009 Indian Gaming Convention 3.545 2 177%
Aviation Week MRO Conference & Exhibi tion 3.427 4 86%
Electric Uti l i ties Environmental Conference 3.378 4 84%
Electric Uti l i ties Environmental Conference 3.376 3 113%
NRA Annual Meetings and Exhibi ts 3.310 6 55%
Length of stay as a percent of event length for all events included in survey 101%
Source: PCC Intercept Survey and GPCVB
The data show that the average overnight visitor stays for approximately the same length of time as the event length. From this analysis, we assumed that room nights per lodger equaled the event’s length in the non-expansion scenario. In addition, we multiplied the number of room nights by 86 percent to account for attendees who do not stay overnight from our intercept survey data. With our assumptions and Qualified Event and attendance forecasts, the following figure shows room night projections for Qualified Events.
Convention, Sports & Entertainment Facilities Consulting Chicago, Illinois
July 2, 2018 Event Demand Analysis Economic and Fiscal Impact Analysis Update - Arizona 2-8
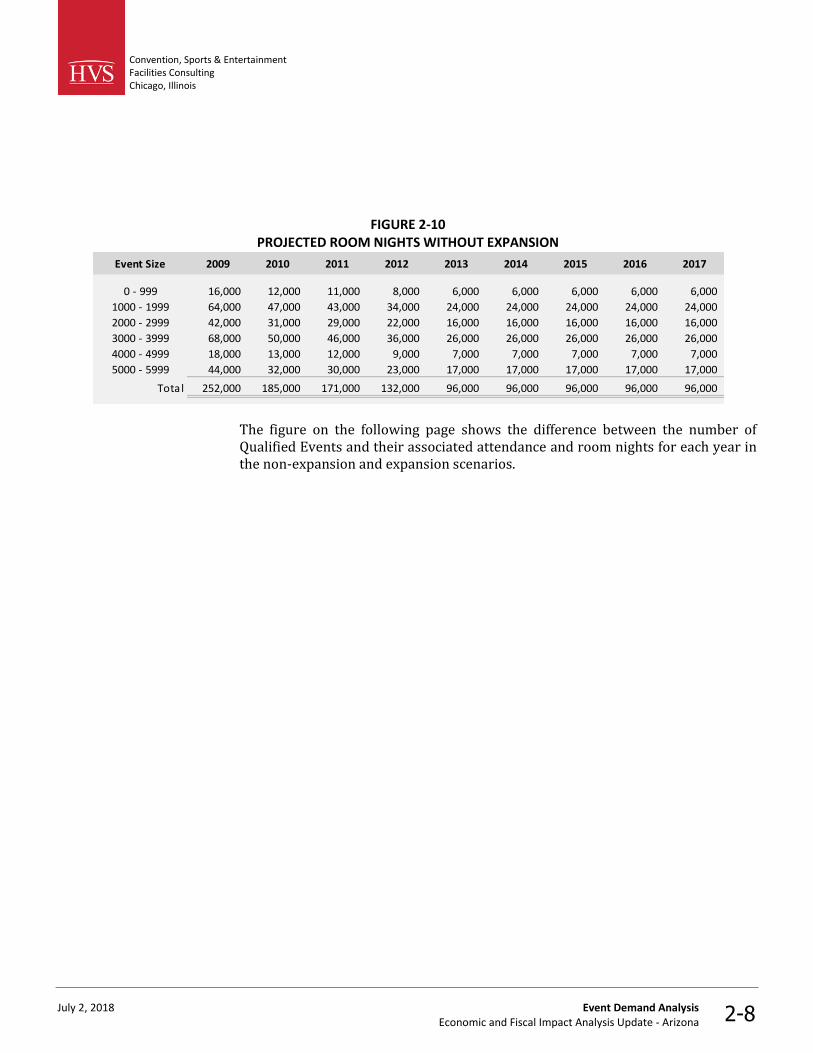
FIGURE 2-10 PROJECTED ROOM NIGHTS WITHOUT EXPANSION
Event Size 2009 2010 2011 2012 2013 2014 2015 2016 2017
0 - 999 16,000 12,000 11,000 8,000 6,000 6,000 6,000 6,000 6,000
1000 - 1999 64,000 47,000 43,000 34,000 24,000 24,000 24,000 24,000 24,000
2000 - 2999 42,000 31,000 29,000 22,000 16,000 16,000 16,000 16,000 16,000
3000 - 3999 68,000 50,000 46,000 36,000 26,000 26,000 26,000 26,000 26,000
4000 - 4999 18,000 13,000 12,000 9,000 7,000 7,000 7,000 7,000 7,000
5000 - 5999 44,000 32,000 30,000 23,000 17,000 17,000 17,000 17,000 17,000
Total 252,000 185,000 171,000 132,000 96,000 96,000 96,000 96,000 96,000
The figure on the following page shows the difference between the number of Qualified Events and their associated attendance and room nights for each year in the non-expansion and expansion scenarios.

Convention, Sports & Entertainment Facilities Consulting Chicago, Illinois
July 2, 2018 Event Demand Analysis Economic and Fiscal Impact Analysis Update - Arizona 2-9
FIGURE 2-11 PROJECTED DIFFERENCE IN DEMAND
No Expansion Actual Change
Qualified Events
2009 31 69 38
2010 27 62 35
2011 25 52 27
2012 27 61 34
2013 19 42 23
2014 19 65 46
2015 19 65 46
2016 19 67 48
2017 19 67 48
Total 205 550 345
Attendance
2009 62,000 310,000 248,0002010 46,000 229,000 183,000
2011 42,000 211,000 169,000
2012 33,000 165,000 132,000
2013 24,000 118,000 94,000
2014 24,000 199,000 175,000
2015 24,000 248,000 224,000
2016 24,000 211,000 187,000
2017 24,000 240,000 216,000
Total 303,000 1,931,000 1,628,000
Room Nights
2009 252,000 826,000 574,000
2010 185,000 643,000 458,000
2011 171,000 601,000 430,000
2012 132,000 523,000 391,000
2013 96,000 368,000 272,000
2014 96,000 604,000 508,000
2015 96,000 694,000 598,000
2016 96,000 647,000 551,000
2017 96,000 674,000 578,000
Total 1,220,000 5,580,000 4,360,000
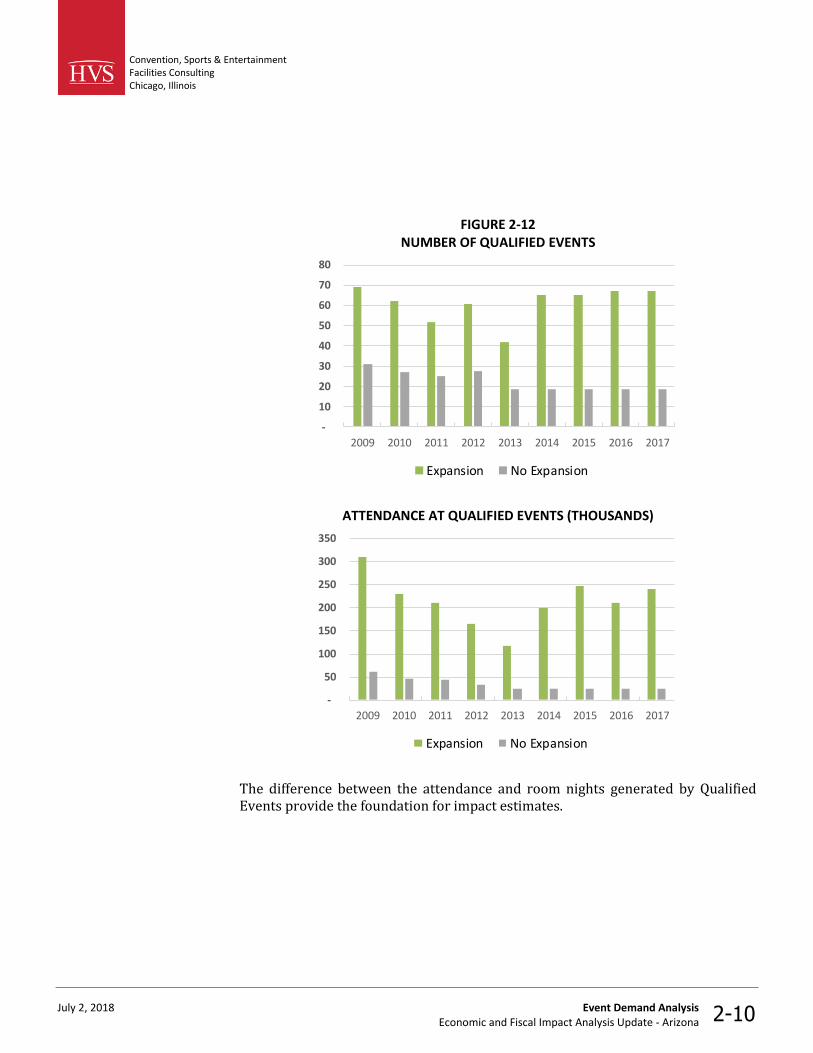
The following figures illustrate differences in the number of Qualified Events and attendance at Qualified Events between actual performance and the scenario in which the PCC did not expand.
Convention, Sports & Entertainment Facilities Consulting Chicago, Illinois
July 2, 2018 Event Demand Analysis Economic and Fiscal Impact Analysis Update - Arizona 2-10
FIGURE 2-12 NUMBER OF QUALIFIED EVENTS
-
10
20
30
40
50
60
70
80
2009 2010 2011 2012 2013 2014 2015 2016 2017
Expansion No Expansion
ATTENDANCE AT QUALIFIED EVENTS (THOUSANDS)
-
50
100
150
200
250
300
350
2009 2010 2011 2012 2013 2014 2015 2016 2017
Expansion No Expansion
The difference between the attendance and room nights generated by Qualified Events provide the foundation for impact estimates.

Convention, Sports & Entertainment Facilities Consulting Chicago, Illinois
July 2, 2018 Spending Estimates Economic and Fiscal Impact Analysis Update - Arizona 3-1
3. Spending Estimates
HVS estimated the amounts of spending caused by the economic activity generated by Qualified Events.
Spending falls into three categories:
• Direct spending includes the spending of event attendees, event organizers, and exhibitors. For example, an attendee’s expenditure on a restaurant meal is a direct spending impact.
• Indirect spending follows from the business spending resulting from the initial direct spending. For example, an event attendee’s direct expenditure on a restaurant meal causes the restaurant to purchase food and other items from suppliers. The portion of these restaurant purchases that remain within Arizona count as indirect impacts.
• Induced spending represents the change in local consumption due to the personal spending by employees whose incomes change from direct and indirect spending. For example, a waiter at a local restaurant may have more personal income as a result of an event attendee dining at the restaurant. The amount of the increased income that the waiter spends in the local economy is an induced impact.
To generate direct spending estimates, HVS applied assumptions about the amounts of spending generated by Qualified Events. HVS used the IMPLAN input-output model of the local economy to estimate net direct, indirect, and induced spending. The sum of net direct, indirect, and induced spending estimates makes up the total estimated spending impact of Qualified Events at the PCC.
HVS identified four sources of new direct spending impact:
• Overnight Guests: Delegates to Qualified Events who require overnight lodging, including convention delegates, meeting attendees, and attendees at other Qualified Events. Overnight delegate spending includes the spending on hotel catering by exhibitors and event organizers along with the personal spending of individual guests.
• Day-trip Attendees: Visitors to the PCC who do not require overnight lodging. In most markets, day-trippers typically spend money on meals, shopping, local transportation, recreation and entertainment, and other goods and services while in town.
Direct, Indirect, and Induced Spending
Sources of Direct Spending
Convention, Sports & Entertainment Facilities Consulting Chicago, Illinois
July 2, 2018 Spending Estimates Economic and Fiscal Impact Analysis Update - Arizona 3-2
• Event Organizers: Individuals, associations, or other organizations that plan, sponsor, organize, and coordinate events that take place at PCC facilities. In addition to facility spending, event organizers also spend on lodging, meals, local transportation, facility rentals, equipment rentals, and other goods and services required to plan and organize a successful event.
• Exhibitors: Individuals or companies that rent exhibition space, typically from event organizers, to display information or products at events. In addition to spending at the facility, exhibitors purchase lodging, meals, local transportation, vendor services, meeting room rentals, equipment rentals, and other goods and services.
Delegates, attendees, event organizers, and exhibitors spend locally on lodging, meals, local transportation, facility rentals, vendor services, meeting room rentals, equipment rentals, and other goods and services.
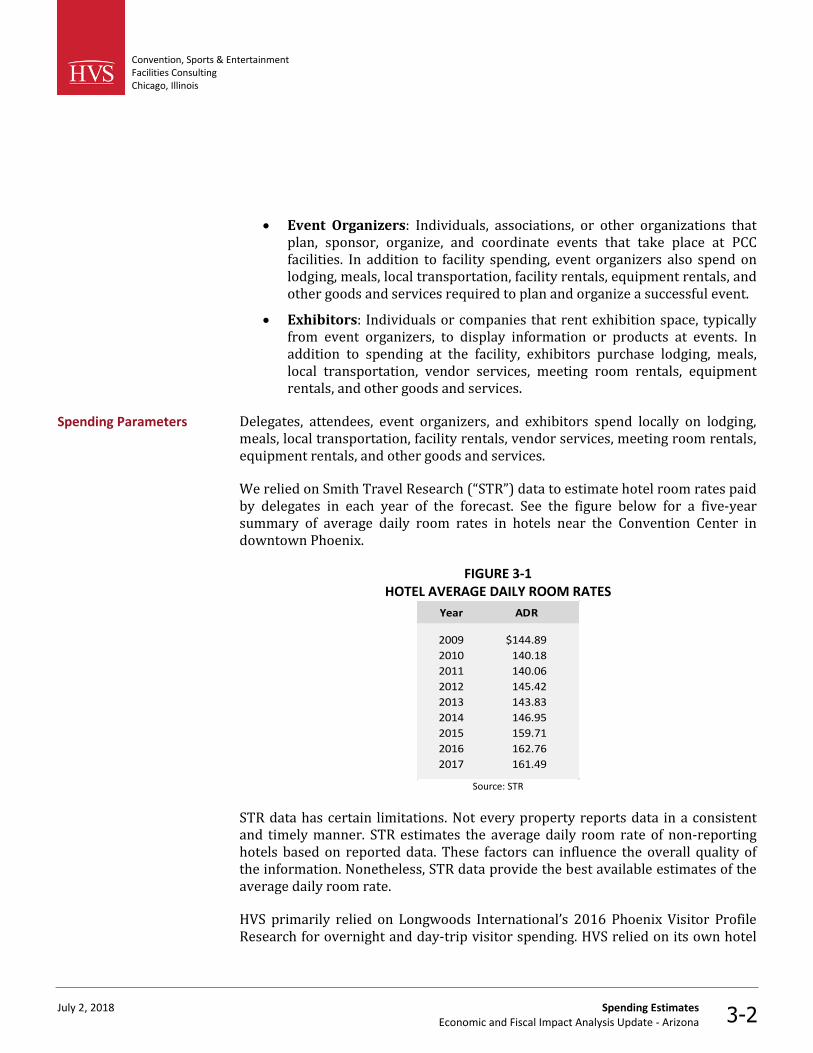
We relied on Smith Travel Research (“STR”) data to estimate hotel room rates paid by delegates in each year of the forecast. See the figure below for a five-year summary of average daily room rates in hotels near the Convention Center in downtown Phoenix.
FIGURE 3-1 HOTEL AVERAGE DAILY ROOM RATES
Year ADR
2009 $144.89
2010 140.18
2011 140.06
2012 145.42
2013 143.83
2014 146.95
2015 159.71
2016 162.76
2017 161.49
Source: STR
STR data has certain limitations. Not every property reports data in a consistent and timely manner. STR estimates the average daily room rate of non-reporting hotels based on reported data. These factors can influence the overall quality of the information. Nonetheless, STR data provide the best available estimates of the average daily room rate.
HVS primarily relied on Longwoods International’s 2016 Phoenix Visitor Profile Research for overnight and day-trip visitor spending. HVS relied on its own hotel
Spending Parameters
Convention, Sports & Entertainment Facilities Consulting Chicago, Illinois
July 2, 2018 Spending Estimates Economic and Fiscal Impact Analysis Update - Arizona 3-3
revenue database to determine additional overnight visitor spending that Longwoods International does not include in its travel surveys. For exhibitor and organizer spending, we used a 2004 national survey of convention spending conducted by the Destinations International (“DI”).
HVS adjusted all Longwoods and DI spending parameters for inflation using the Consumer Price Index as published by the US Bureau of Labor Statistics. Since DI data reflects national spending, we adjusted DI parameters for the relative cost of travel to Phoenix based on the Corporate Travel Index (“CTI”). CTI is an annual comparison of travel costs to the 100 largest U.S. cities conducted by Business Travel News.
The inclusion of Longwoods International data and HVS’s local market data represents a major change in methodology from our prior studies. The significant changes to the overnight and day-trip visitor spending inputs materially change the calculation of Qualified Revenue. Although it decreases the overnight and day-trip visitor spending estimates, it more accurately reflects current spending levels.
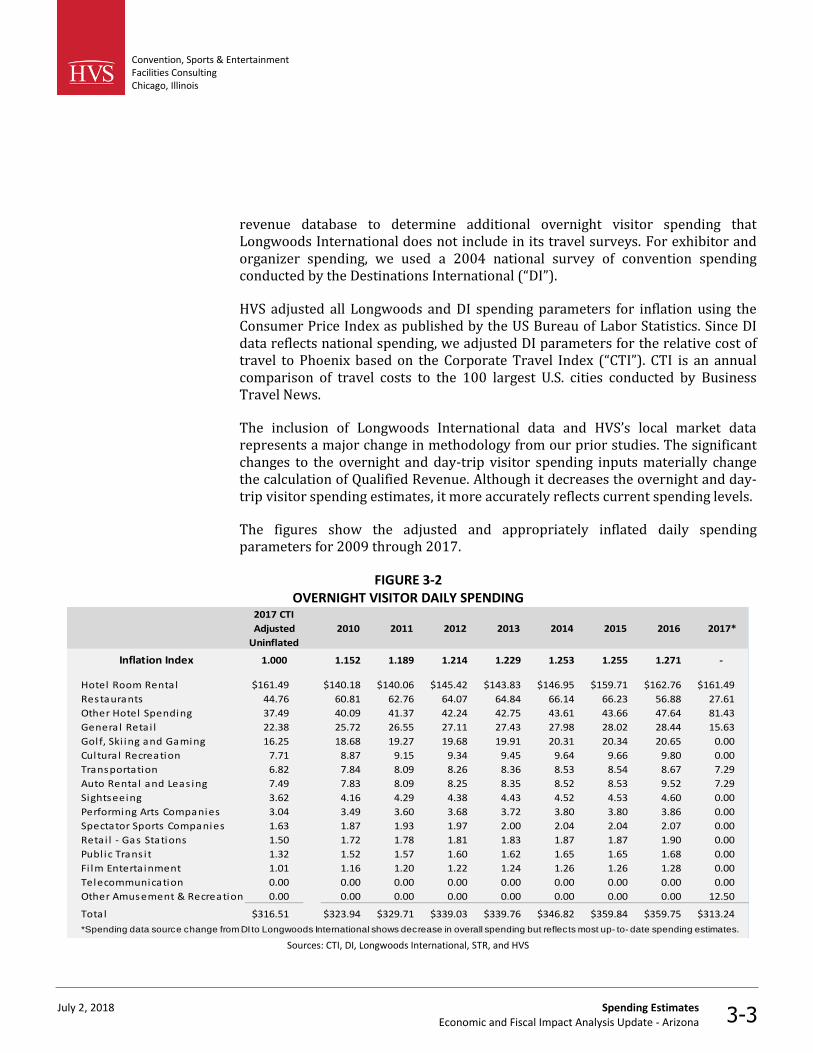
The figures show the adjusted and appropriately inflated daily spending parameters for 2009 through 2017.
FIGURE 3-2 OVERNIGHT VISITOR DAILY SPENDING
2017 CTI
Adjusted
Uninflated
2010 2011 2012 2013 2014 2015 2016 2017*
Inflation Index 1.000 1.152 1.189 1.214 1.229 1.253 1.255 1.271 -
Hotel Room Rental $161.49 $140.18 $140.06 $145.42 $143.83 $146.95 $159.71 $162.76 $161.49
Restaurants 44.76 60.81 62.76 64.07 64.84 66.14 66.23 56.88 27.61
Other Hotel Spending 37.49 40.09 41.37 42.24 42.75 43.61 43.66 47.64 81.43
General Retai l 22.38 25.72 26.55 27.11 27.43 27.98 28.02 28.44 15.63
Golf, Ski ing and Gaming 16.25 18.68 19.27 19.68 19.91 20.31 20.34 20.65 0.00
Cultura l Recreation 7.71 8.87 9.15 9.34 9.45 9.64 9.66 9.80 0.00
Transportation 6.82 7.84 8.09 8.26 8.36 8.53 8.54 8.67 7.29
Auto Rental and Leas ing 7.49 7.83 8.09 8.25 8.35 8.52 8.53 9.52 7.29
Sightseeing 3.62 4.16 4.29 4.38 4.43 4.52 4.53 4.60 0.00
Performing Arts Companies 3.04 3.49 3.60 3.68 3.72 3.80 3.80 3.86 0.00
Spectator Sports Companies 1.63 1.87 1.93 1.97 2.00 2.04 2.04 2.07 0.00
Retai l - Gas Stations 1.50 1.72 1.78 1.81 1.83 1.87 1.87 1.90 0.00
Publ ic Trans i t 1.32 1.52 1.57 1.60 1.62 1.65 1.65 1.68 0.00
Fi lm Enterta inment 1.01 1.16 1.20 1.22 1.24 1.26 1.26 1.28 0.00
Telecommunication 0.00 0.00 0.00 0.00 0.00 0.00 0.00 0.00 0.00
Other Amusement & Recreation 0.00 0.00 0.00 0.00 0.00 0.00 0.00 0.00 12.50
Total $316.51 $323.94 $329.71 $339.03 $339.76 $346.82 $359.84 $359.75 $313.24
*Spending data source change from DI to Longwoods International shows decrease in overall spending but reflects most up- to- date spending estimates.
Sources: CTI, DI, Longwoods International, STR, and HVS
Convention, Sports & Entertainment Facilities Consulting Chicago, Illinois
July 2, 2018 Spending Estimates Economic and Fiscal Impact Analysis Update - Arizona 3-4
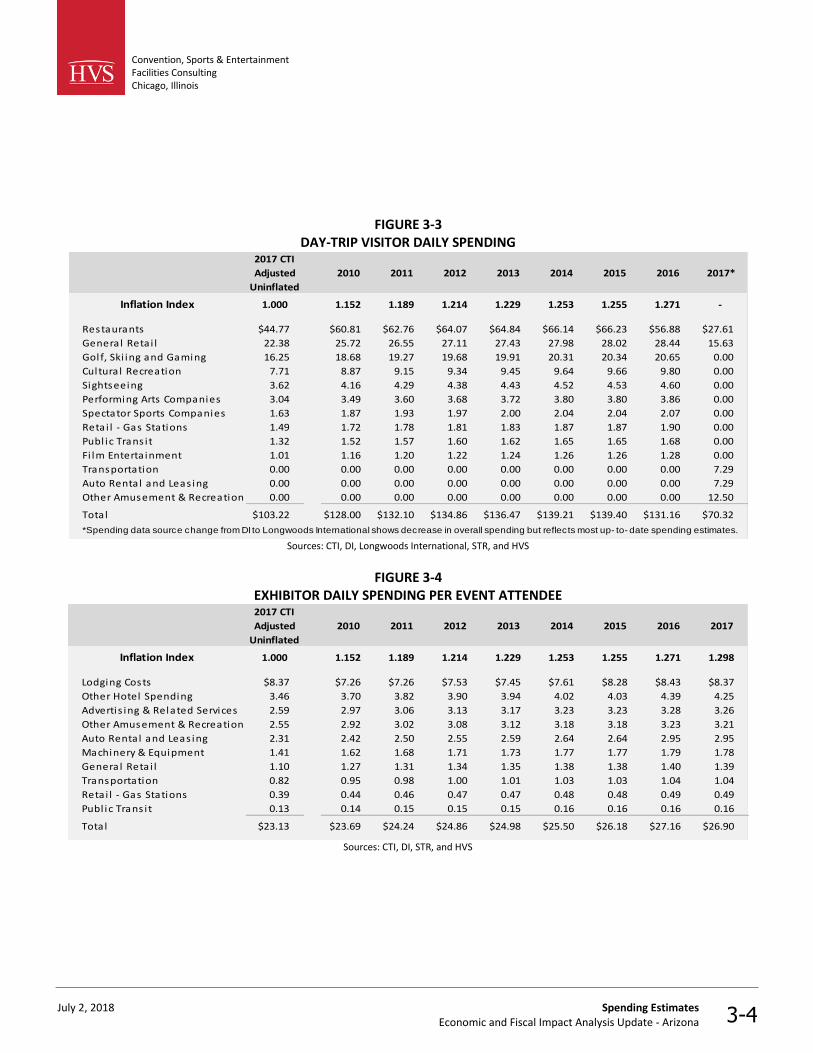
FIGURE 3-3 DAY-TRIP VISITOR DAILY SPENDING
2017 CTI
Adjusted
Uninflated
2010 2011 2012 2013 2014 2015 2016 2017*
Inflation Index 1.000 1.152 1.189 1.214 1.229 1.253 1.255 1.271 -
Restaurants $44.77 $60.81 $62.76 $64.07 $64.84 $66.14 $66.23 $56.88 $27.61
General Retai l 22.38 25.72 26.55 27.11 27.43 27.98 28.02 28.44 15.63
Golf, Ski ing and Gaming 16.25 18.68 19.27 19.68 19.91 20.31 20.34 20.65 0.00
Cultura l Recreation 7.71 8.87 9.15 9.34 9.45 9.64 9.66 9.80 0.00
Sightseeing 3.62 4.16 4.29 4.38 4.43 4.52 4.53 4.60 0.00
Performing Arts Companies 3.04 3.49 3.60 3.68 3.72 3.80 3.80 3.86 0.00
Spectator Sports Companies 1.63 1.87 1.93 1.97 2.00 2.04 2.04 2.07 0.00
Retai l - Gas Stations 1.49 1.72 1.78 1.81 1.83 1.87 1.87 1.90 0.00
Publ ic Trans i t 1.32 1.52 1.57 1.60 1.62 1.65 1.65 1.68 0.00
Fi lm Enterta inment 1.01 1.16 1.20 1.22 1.24 1.26 1.26 1.28 0.00
Transportation 0.00 0.00 0.00 0.00 0.00 0.00 0.00 0.00 7.29
Auto Rental and Leas ing 0.00 0.00 0.00 0.00 0.00 0.00 0.00 0.00 7.29
Other Amusement & Recreation 0.00 0.00 0.00 0.00 0.00 0.00 0.00 0.00 12.50
Total $103.22 $128.00 $132.10 $134.86 $136.47 $139.21 $139.40 $131.16 $70.32
*Spending data source change from DI to Longwoods International shows decrease in overall spending but reflects most up- to- date spending estimates.
Sources: CTI, DI, Longwoods International, STR, and HVS
FIGURE 3-4 EXHIBITOR DAILY SPENDING PER EVENT ATTENDEE 2017 CTI
Adjusted
Uninflated
2010 2011 2012 2013 2014 2015 2016 2017
Inflation Index 1.000 1.152 1.189 1.214 1.229 1.253 1.255 1.271 1.298
Lodging Costs $8.37 $7.26 $7.26 $7.53 $7.45 $7.61 $8.28 $8.43 $8.37
Other Hotel Spending 3.46 3.70 3.82 3.90 3.94 4.02 4.03 4.39 4.25
Advertis ing & Related Services 2.59 2.97 3.06 3.13 3.17 3.23 3.23 3.28 3.26
Other Amusement & Recreation 2.55 2.92 3.02 3.08 3.12 3.18 3.18 3.23 3.21
Auto Rental and Leas ing 2.31 2.42 2.50 2.55 2.59 2.64 2.64 2.95 2.95
Machinery & Equipment 1.41 1.62 1.68 1.71 1.73 1.77 1.77 1.79 1.78
General Retai l 1.10 1.27 1.31 1.34 1.35 1.38 1.38 1.40 1.39
Transportation 0.82 0.95 0.98 1.00 1.01 1.03 1.03 1.04 1.04
Retai l - Gas Stations 0.39 0.44 0.46 0.47 0.47 0.48 0.48 0.49 0.49
Publ ic Trans i t 0.13 0.14 0.15 0.15 0.15 0.16 0.16 0.16 0.16
Total $23.13 $23.69 $24.24 $24.86 $24.98 $25.50 $26.18 $27.16 $26.90
Sources: CTI, DI, STR, and HVS
Convention, Sports & Entertainment Facilities Consulting Chicago, Illinois
July 2, 2018 Spending Estimates Economic and Fiscal Impact Analysis Update - Arizona 3-5
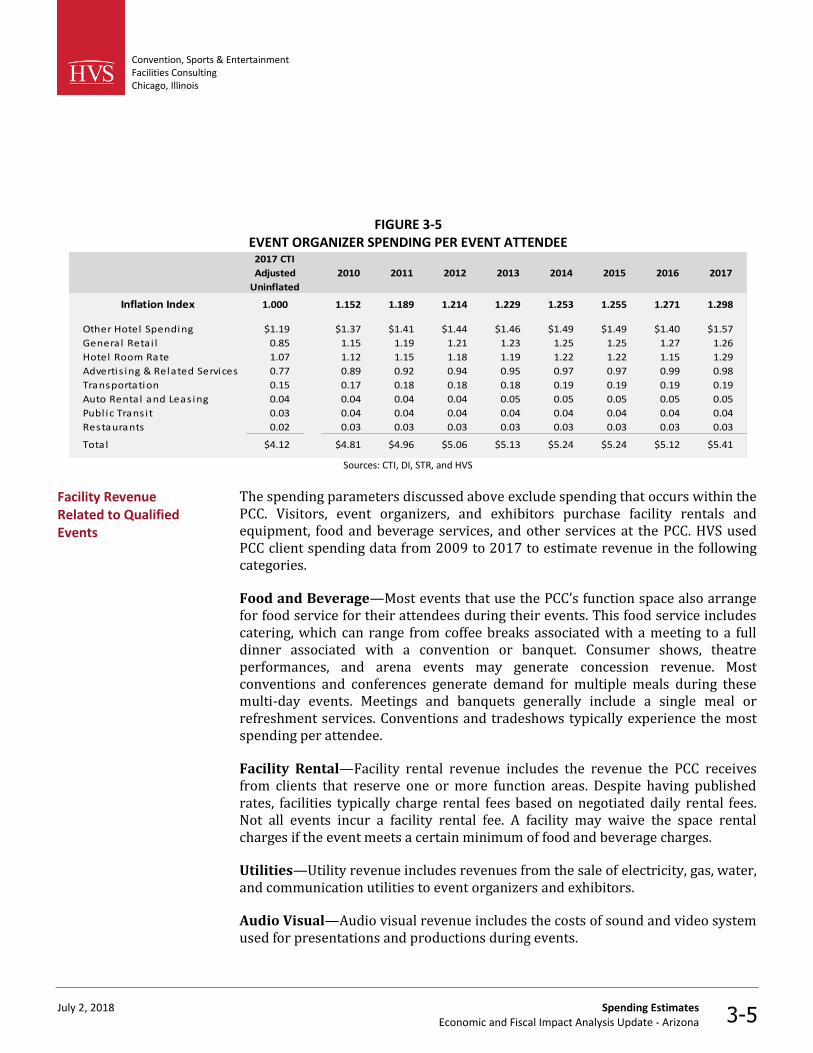
FIGURE 3-5 EVENT ORGANIZER SPENDING PER EVENT ATTENDEE
2017 CTI
Adjusted
Uninflated
2010 2011 2012 2013 2014 2015 2016 2017
Inflation Index 1.000 1.152 1.189 1.214 1.229 1.253 1.255 1.271 1.298
Other Hotel Spending $1.19 $1.37 $1.41 $1.44 $1.46 $1.49 $1.49 $1.40 $1.57
General Retai l 0.85 1.15 1.19 1.21 1.23 1.25 1.25 1.27 1.26
Hotel Room Rate 1.07 1.12 1.15 1.18 1.19 1.22 1.22 1.15 1.29
Advertis ing & Related Services 0.77 0.89 0.92 0.94 0.95 0.97 0.97 0.99 0.98
Transportation 0.15 0.17 0.18 0.18 0.18 0.19 0.19 0.19 0.19
Auto Rental and Leas ing 0.04 0.04 0.04 0.04 0.05 0.05 0.05 0.05 0.05
Publ ic Trans i t 0.03 0.04 0.04 0.04 0.04 0.04 0.04 0.04 0.04
Restaurants 0.02 0.03 0.03 0.03 0.03 0.03 0.03 0.03 0.03
Total $4.12 $4.81 $4.96 $5.06 $5.13 $5.24 $5.24 $5.12 $5.41
Sources: CTI, DI, STR, and HVS
The spending parameters discussed above exclude spending that occurs within the PCC. Visitors, event organizers, and exhibitors purchase facility rentals and equipment, food and beverage services, and other services at the PCC. HVS used PCC client spending data from 2009 to 2017 to estimate revenue in the following categories.
Food and Beverage—Most events that use the PCC’s function space also arrange for food service for their attendees during their events. This food service includes catering, which can range from coffee breaks associated with a meeting to a full dinner associated with a convention or banquet. Consumer shows, theatre performances, and arena events may generate concession revenue. Most conventions and conferences generate demand for multiple meals during these multi-day events. Meetings and banquets generally include a single meal or refreshment services. Conventions and tradeshows typically experience the most spending per attendee.
Facility Rental—Facility rental revenue includes the revenue the PCC receives from clients that reserve one or more function areas. Despite having published rates, facilities typically charge rental fees based on negotiated daily rental fees. Not all events incur a facility rental fee. A facility may waive the space rental charges if the event meets a certain minimum of food and beverage charges.
Utilities—Utility revenue includes revenues from the sale of electricity, gas, water, and communication utilities to event organizers and exhibitors.
Audio Visual—Audio visual revenue includes the costs of sound and video system used for presentations and productions during events.
Facility Revenue Related to Qualified Events
Convention, Sports & Entertainment Facilities Consulting Chicago, Illinois
July 2, 2018 Spending Estimates Economic and Fiscal Impact Analysis Update - Arizona 3-6
Services—Event services include the fees charged to tenants for services that could include business services, technical assistance, information technology set-up and take down of function spaces, cleaning services, security services, commissions from decorators, and other services provided by third-party contractors at events. Banquets and other upscale events often require elaborate decorating services. Almost all events require cleaning services; cleaning of common areas may be complimentary for most events, while cleaning services offered to individual exhibitors can represent a significant source of revenue. Service charges vary by type of event. Some of these services may be included in the rental charges for using the facility, but others will be add-on service charges.
Equipment—The PCC earns revenue through equipment rental and use fees for event organizers and attendees.
Ticket Tax/Fees—The PCC earns revenues through both ticket office fees and service fees for running its ticket offices.
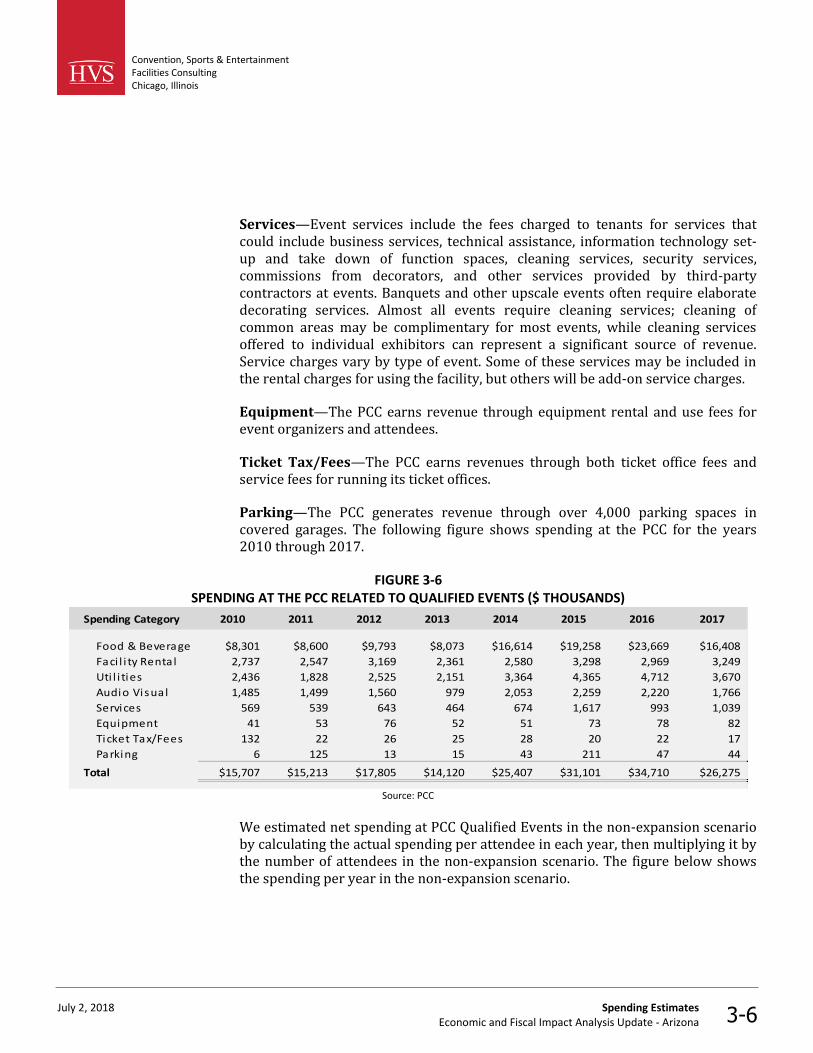
Parking—The PCC generates revenue through over 4,000 parking spaces in covered garages. The following figure shows spending at the PCC for the years 2010 through 2017.
FIGURE 3-6 SPENDING AT THE PCC RELATED TO QUALIFIED EVENTS ($ THOUSANDS)
Spending Category 2010 2011 2012 2013 2014 2015 2016 2017
Food & Beverage $8,301 $8,600 $9,793 $8,073 $16,614 $19,258 $23,669 $16,408
Faci l i ty Rental 2,737 2,547 3,169 2,361 2,580 3,298 2,969 3,249
Uti l i ties 2,436 1,828 2,525 2,151 3,364 4,365 4,712 3,670
Audio Visual 1,485 1,499 1,560 979 2,053 2,259 2,220 1,766
Services 569 539 643 464 674 1,617 993 1,039
Equipment 41 53 76 52 51 73 78 82
Ticket Tax/Fees 132 22 26 25 28 20 22 17
Parking 6 125 13 15 43 211 47 44
Total $15,707 $15,213 $17,805 $14,120 $25,407 $31,101 $34,710 $26,275
Source: PCC
We estimated net spending at PCC Qualified Events in the non-expansion scenario by calculating the actual spending per attendee in each year, then multiplying it by the number of attendees in the non-expansion scenario. The figure below shows the spending per year in the non-expansion scenario.
Convention, Sports & Entertainment Facilities Consulting Chicago, Illinois
July 2, 2018 Spending Estimates Economic and Fiscal Impact Analysis Update - Arizona 3-7
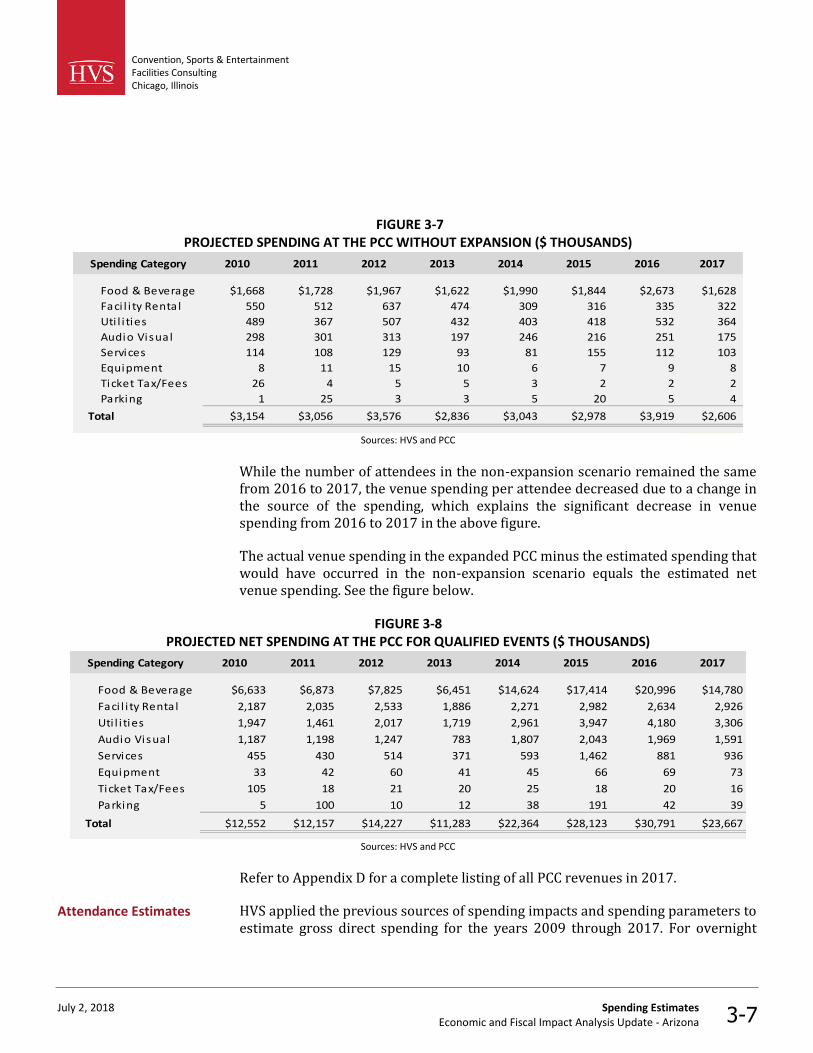
FIGURE 3-7 PROJECTED SPENDING AT THE PCC WITHOUT EXPANSION ($ THOUSANDS)
Spending Category 2010 2011 2012 2013 2014 2015 2016 2017
Food & Beverage $1,668 $1,728 $1,967 $1,622 $1,990 $1,844 $2,673 $1,628
Faci l i ty Rental 550 512 637 474 309 316 335 322
Uti l i ties 489 367 507 432 403 418 532 364
Audio Visual 298 301 313 197 246 216 251 175
Services 114 108 129 93 81 155 112 103
Equipment 8 11 15 10 6 7 9 8
Ticket Tax/Fees 26 4 5 5 3 2 2 2
Parking 1 25 3 3 5 20 5 4
Total $3,154 $3,056 $3,576 $2,836 $3,043 $2,978 $3,919 $2,606
Sources: HVS and PCC
While the number of attendees in the non-expansion scenario remained the same from 2016 to 2017, the venue spending per attendee decreased due to a change in the source of the spending, which explains the significant decrease in venue spending from 2016 to 2017 in the above figure.
The actual venue spending in the expanded PCC minus the estimated spending that would have occurred in the non-expansion scenario equals the estimated net venue spending. See the figure below.
FIGURE 3-8 PROJECTED NET SPENDING AT THE PCC FOR QUALIFIED EVENTS ($ THOUSANDS)
Spending Category 2010 2011 2012 2013 2014 2015 2016 2017
Food & Beverage $6,633 $6,873 $7,825 $6,451 $14,624 $17,414 $20,996 $14,780
Faci l i ty Rental 2,187 2,035 2,533 1,886 2,271 2,982 2,634 2,926
Uti l i ties 1,947 1,461 2,017 1,719 2,961 3,947 4,180 3,306
Audio Visual 1,187 1,198 1,247 783 1,807 2,043 1,969 1,591
Services 455 430 514 371 593 1,462 881 936
Equipment 33 42 60 41 45 66 69 73
Ticket Tax/Fees 105 18 21 20 25 18 20 16
Parking 5 100 10 12 38 191 42 39
Total $12,552 $12,157 $14,227 $11,283 $22,364 $28,123 $30,791 $23,667
Sources: HVS and PCC
Refer to Appendix D for a complete listing of all PCC revenues in 2017.
HVS applied the previous sources of spending impacts and spending parameters to estimate gross direct spending for the years 2009 through 2017. For overnight
Attendance Estimates
Convention, Sports & Entertainment Facilities Consulting Chicago, Illinois
July 2, 2018 Spending Estimates Economic and Fiscal Impact Analysis Update - Arizona 3-8
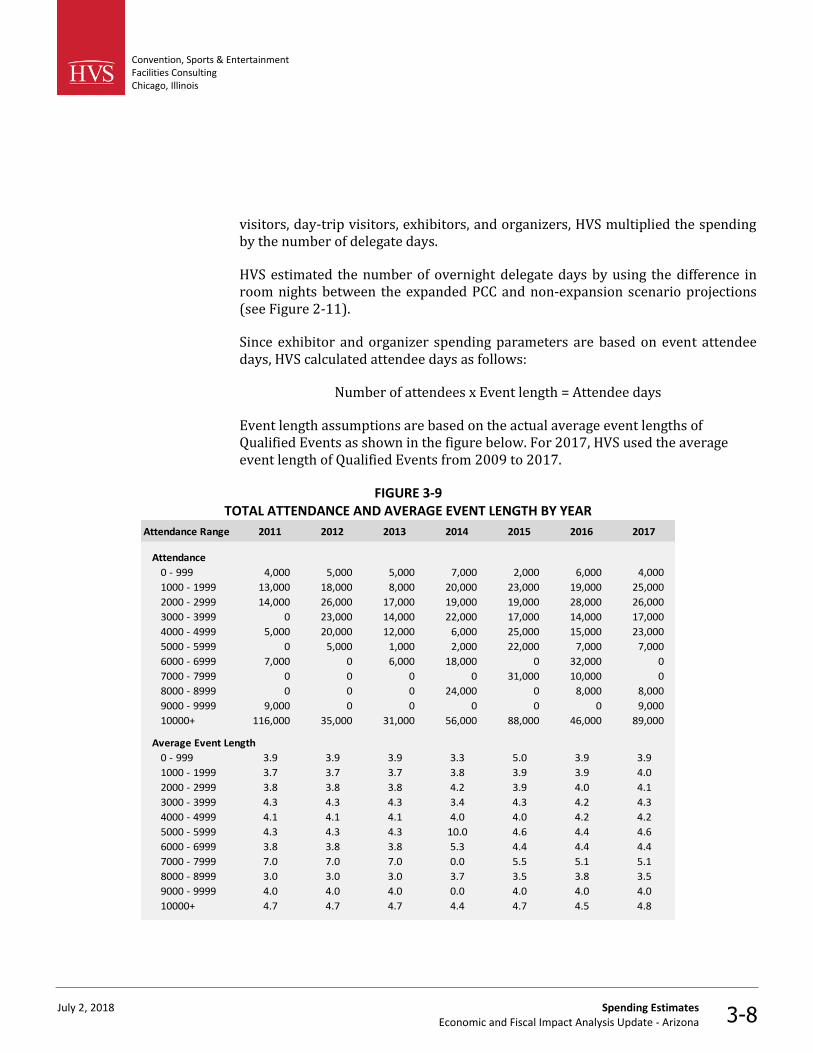
visitors, day-trip visitors, exhibitors, and organizers, HVS multiplied the spending by the number of delegate days.
HVS estimated the number of overnight delegate days by using the difference in room nights between the expanded PCC and non-expansion scenario projections (see Figure 2-11).
Since exhibitor and organizer spending parameters are based on event attendee days, HVS calculated attendee days as follows:
Number of attendees x Event length = Attendee days
Event length assumptions are based on the actual average event lengths of Qualified Events as shown in the figure below. For 2017, HVS used the average event length of Qualified Events from 2009 to 2017.
FIGURE 3-9 TOTAL ATTENDANCE AND AVERAGE EVENT LENGTH BY YEAR
Attendance Range 2011 2012 2013 2014 2015 2016 2017
Attendance
0 - 999 4,000 5,000 5,000 7,000 2,000 6,000 4,000
1000 - 1999 13,000 18,000 8,000 20,000 23,000 19,000 25,000
2000 - 2999 14,000 26,000 17,000 19,000 19,000 28,000 26,000
3000 - 3999 0 23,000 14,000 22,000 17,000 14,000 17,000
4000 - 4999 5,000 20,000 12,000 6,000 25,000 15,000 23,000
5000 - 5999 0 5,000 1,000 2,000 22,000 7,000 7,000
6000 - 6999 7,000 0 6,000 18,000 0 32,000 0
7000 - 7999 0 0 0 0 31,000 10,000 0
8000 - 8999 0 0 0 24,000 0 8,000 8,000
9000 - 9999 9,000 0 0 0 0 0 9,000
10000+ 116,000 35,000 31,000 56,000 88,000 46,000 89,000
Average Event Length
0 - 999 3.9 3.9 3.9 3.3 5.0 3.9 3.9
1000 - 1999 3.7 3.7 3.7 3.8 3.9 3.9 4.0
2000 - 2999 3.8 3.8 3.8 4.2 3.9 4.0 4.1
3000 - 3999 4.3 4.3 4.3 3.4 4.3 4.2 4.3
4000 - 4999 4.1 4.1 4.1 4.0 4.0 4.2 4.2
5000 - 5999 4.3 4.3 4.3 10.0 4.6 4.4 4.6
6000 - 6999 3.8 3.8 3.8 5.3 4.4 4.4 4.4
7000 - 7999 7.0 7.0 7.0 0.0 5.5 5.1 5.1
8000 - 8999 3.0 3.0 3.0 3.7 3.5 3.8 3.5
9000 - 9999 4.0 4.0 4.0 0.0 4.0 4.0 4.0
10000+ 4.7 4.7 4.7 4.4 4.7 4.5 4.8
Convention, Sports & Entertainment Facilities Consulting Chicago, Illinois
July 2, 2018 Spending Estimates Economic and Fiscal Impact Analysis Update - Arizona 3-9
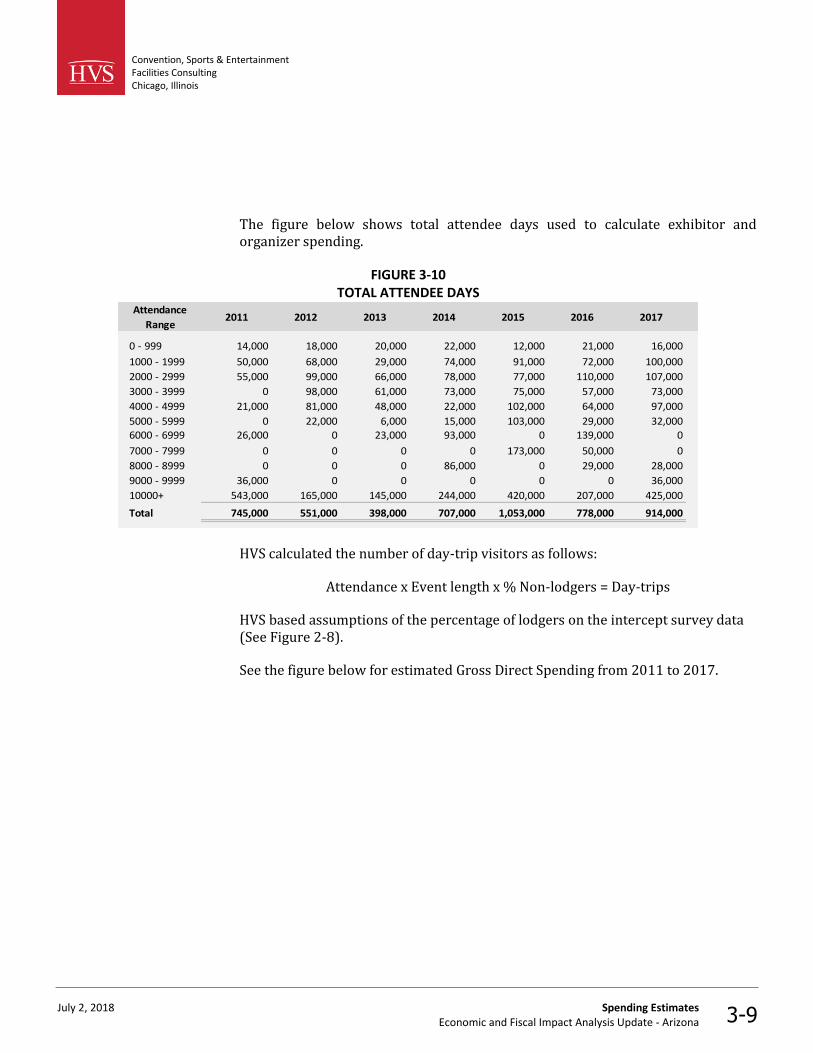
The figure below shows total attendee days used to calculate exhibitor and organizer spending.
FIGURE 3-10 TOTAL ATTENDEE DAYS
Attendance
Range2011 2012 2013 2014 2015 2016 2017
0 - 999 14,000 18,000 20,000 22,000 12,000 21,000 16,000
1000 - 1999 50,000 68,000 29,000 74,000 91,000 72,000 100,000
2000 - 2999 55,000 99,000 66,000 78,000 77,000 110,000 107,000
3000 - 3999 0 98,000 61,000 73,000 75,000 57,000 73,000
4000 - 4999 21,000 81,000 48,000 22,000 102,000 64,000 97,000
5000 - 5999 0 22,000 6,000 15,000 103,000 29,000 32,000
6000 - 6999 26,000 0 23,000 93,000 0 139,000 0
7000 - 7999 0 0 0 0 173,000 50,000 0
8000 - 8999 0 0 0 86,000 0 29,000 28,000
9000 - 9999 36,000 0 0 0 0 0 36,000
10000+ 543,000 165,000 145,000 244,000 420,000 207,000 425,000
Total 745,000 551,000 398,000 707,000 1,053,000 778,000 914,000
HVS calculated the number of day-trip visitors as follows:
Attendance x Event length x % Non-lodgers = Day-trips
HVS based assumptions of the percentage of lodgers on the intercept survey data (See Figure 2-8).
See the figure below for estimated Gross Direct Spending from 2011 to 2017.

Convention, Sports & Entertainment Facilities Consulting Chicago, Illinois
July 2, 2018 Spending Estimates Economic and Fiscal Impact Analysis Update - Arizona 3-10
FIGURE 3-11 GROSS DIRECT SPENDING
Year Spending Parameter x # Attendee Days = Total Spending
Overnight Visitor Spending
2010 $323.94 458,000 148,365,000
2011 $329.71 430,000 141,775,000
2012 $339.03 389,000 131,883,000
2013 $339.76 272,000 92,415,000
2014 $346.82 508,000 176,185,000
2015 $359.84 599,000 215,544,000
2016 $359.75 551,000 198,222,000
2017 $313.24 578,000 181,053,000
Day-trip Visitor Spending
2010 $128.00 212,000 27,136,000
2011 $132.10 204,000 26,948,000
2012 $134.86 110,000 14,835,000
2013 $136.47 87,000 11,873,000
2014 $139.21 160,000 22,274,000
2015 $139.40 215,000 29,971,000
2016 $131.16 152,000 19,936,000
2017 $70.32 227,000 15,963,000
Exhibitor Spending
2010 $23.69 780,000 18,478,000
2011 $24.24 745,000 18,059,000
2012 $24.86 551,000 13,698,000
2013 $24.98 398,000 9,942,000
2014 $25.50 707,000 18,029,000
2015 $26.18 1,053,000 27,568,000
2016 $27.16 778,000 21,130,000
2017 $26.90 914,000 24,587,000
Organizer Spending
2010 $4.81 780,000 3,752,000
2011 $4.96 745,000 3,695,000
2012 $5.06 551,000 2,788,000
2013 $5.13 398,000 2,042,000
2014 $5.24 707,000 3,705,000
2015 $5.24 1,053,000 5,518,000
2016 $5.12 778,000 3,983,000
2017 $5.41 914,000 4,945,000
Annual Venue Spending at Qualified Events
2010 12,551,000
2011 12,157,000
2012 14,227,000
2013 11,283,000
2014 22,364,000
2015 28,123,000
2016 30,791,000
2017 23,667,000
Sources: DI (as adjusted by HVS) and PCC
Convention, Sports & Entertainment Facilities Consulting Chicago, Illinois
July 2, 2018 Spending Estimates Economic and Fiscal Impact Analysis Update - Arizona 3-11
The relationship between direct spending and the multiplier effects can vary based on the specific size and characteristics of a local area’s economy. HVS entered the gross direct spending estimate into the IMPLAN input-output model of the local economy to estimate the net direct, indirect and induced spending. HVS obtained the most recent available data from IMPLAN for the state of Arizona.
IMPLAN is a nationally recognized model developed at the University of Minnesota commonly used to estimate economic impacts. An input-output model generally describes the commodities and income that normally flow through the various sectors of a given economy. The indirect and induced spending and employment effects represent the estimated changes in the flow of income, goods, and services caused by the estimated direct spending. The IMPLAN model accounts for the specific characteristics of the local area economy and estimates the share of indirect and induced spending that it would retain.
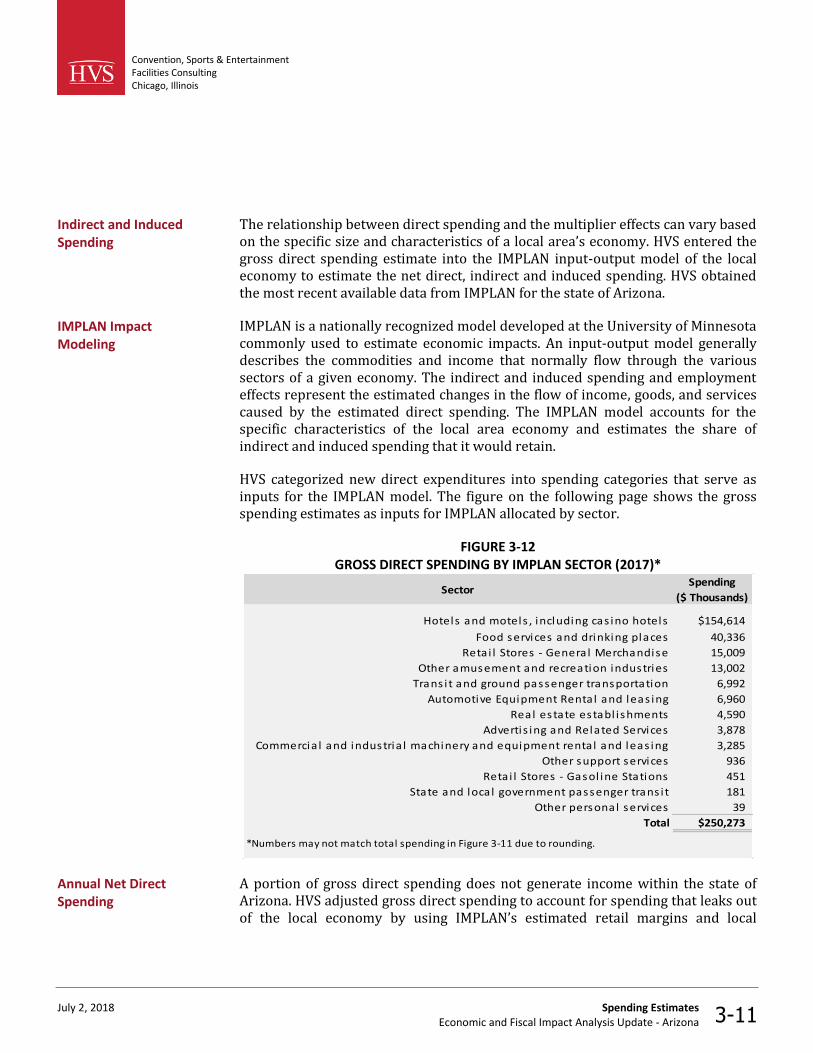
HVS categorized new direct expenditures into spending categories that serve as inputs for the IMPLAN model. The figure on the following page shows the gross spending estimates as inputs for IMPLAN allocated by sector.
FIGURE 3-12 GROSS DIRECT SPENDING BY IMPLAN SECTOR (2017)*
SectorSpending
($ Thousands)
Hotels and motels , including cas ino hotels $154,614
Food services and drinking places 40,336
Retai l Stores - General Merchandise 15,009
Other amusement and recreation industries 13,002
Trans i t and ground passenger transportation 6,992
Automotive Equipment Rental and leas ing 6,960
Real estate establ ishments 4,590
Advertis ing and Related Services 3,878
Commercia l and industria l machinery and equipment rental and leas ing 3,285
Other support services 936
Retai l Stores - Gasol ine Stations 451
State and loca l government passenger trans i t 181
Other personal services 39
Total $250,273
*Numbers may not match total spending in Figure 3-11 due to rounding.
A portion of gross direct spending does not generate income within the state of Arizona. HVS adjusted gross direct spending to account for spending that leaks out of the local economy by using IMPLAN’s estimated retail margins and local
Indirect and Induced Spending
IMPLAN Impact Modeling
Annual Net Direct Spending
Convention, Sports & Entertainment Facilities Consulting Chicago, Illinois
July 2, 2018 Spending Estimates Economic and Fiscal Impact Analysis Update - Arizona 3-12
purchase percentages. As a result, the realized direct spending (“net direct spending”) is lower than the gross direct spending.
Retailers add value equal to the margin or price increase of the good above the original price paid to obtain the good. The IMPLAN model is product based, so HVS uses IMPLAN margin numbers to account for the discrepancy between retail purchaser prices and producer prices.
To accurately measure spending impacts, HVS counts spending on products and services located in the market area. The State of Arizona cannot accommodate all of the direct spending. For example, an event organizer may need to buy novelty items for all attendees, but find that Arizona does not produce them. This effect occurs for direct, indirect, and induced spending. HVS uses IMPLAN’s Social Accounting Matrix (“SAM”) model values to track the actual dollar amounts of business transactions taking place in a localized region.
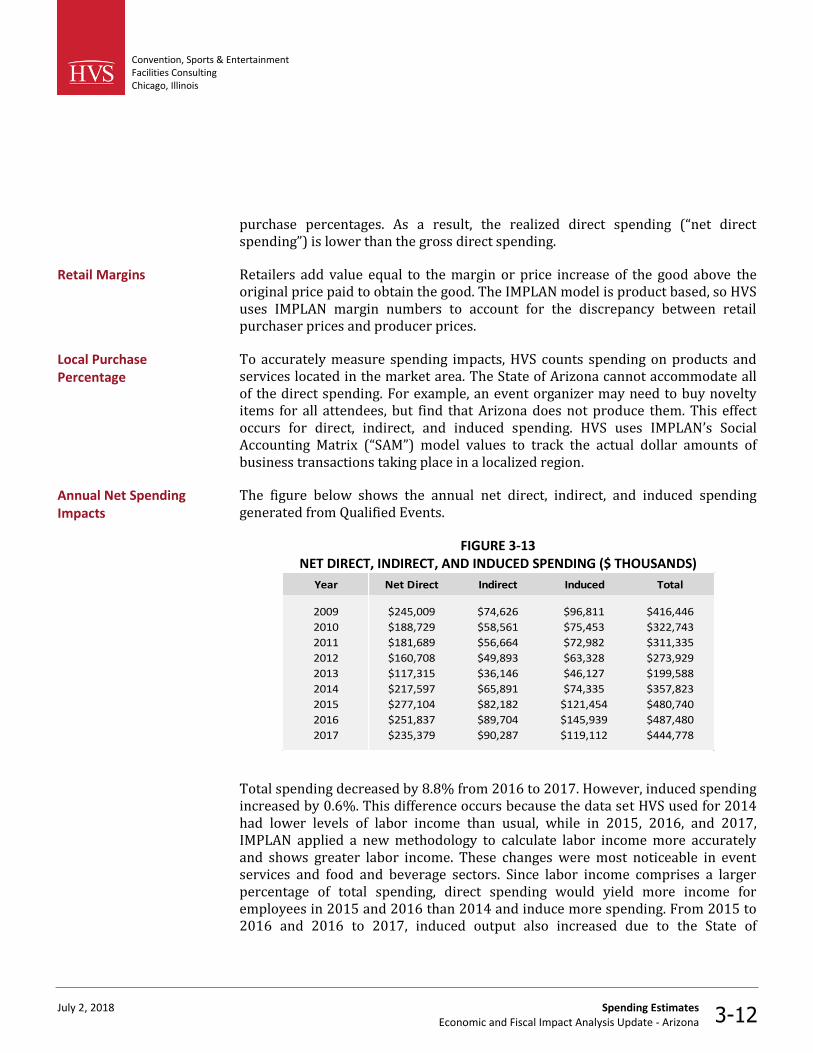
The figure below shows the annual net direct, indirect, and induced spending generated from Qualified Events.
FIGURE 3-13 NET DIRECT, INDIRECT, AND INDUCED SPENDING ($ THOUSANDS)
Year Net Direct Indirect Induced Total
2009 $245,009 $74,626 $96,811 $416,446
2010 $188,729 $58,561 $75,453 $322,743
2011 $181,689 $56,664 $72,982 $311,335
2012 $160,708 $49,893 $63,328 $273,929
2013 $117,315 $36,146 $46,127 $199,588
2014 $217,597 $65,891 $74,335 $357,823
2015 $277,104 $82,182 $121,454 $480,740
2016 $251,837 $89,704 $145,939 $487,480
2017 $235,379 $90,287 $119,112 $444,778
Total spending decreased by 8.8% from 2016 to 2017. However, induced spending increased by 0.6%. This difference occurs because the data set HVS used for 2014 had lower levels of labor income than usual, while in 2015, 2016, and 2017, IMPLAN applied a new methodology to calculate labor income more accurately and shows greater labor income. These changes were most noticeable in event services and food and beverage sectors. Since labor income comprises a larger percentage of total spending, direct spending would yield more income for employees in 2015 and 2016 than 2014 and induce more spending. From 2015 to 2016 and 2016 to 2017, induced output also increased due to the State of
Retail Margins
Local Purchase Percentage
Annual Net Spending Impacts
Convention, Sports & Entertainment Facilities Consulting Chicago, Illinois
July 2, 2018 Spending Estimates Economic and Fiscal Impact Analysis Update - Arizona 3-13
Arizona’s enhanced ability to meet local demand for wholesale. For detailed output broken down by year and IMPLAN industry sector, please refer to Appendix E.
While the Qualified Events generate a significant number of room night stays by convention delegates and other event attendees in local hotels, the precise estimates of room night generation are difficult to obtain. The analysis relies on room nights reported by Visit Phoenix, which tracks the number of rooms reserved through pre-arranged room blocks, which are set aside at designated room rates. However, a significant number of attendees book rooms through other channels (e.g. direct reservations or online hotel sites). Further obscuring the number of room nights generated in the market, large events that generate a significant room block can displace transient leisure and commercial demand, and other group business that would otherwise be in the market. Consequently, comprehensive historical data on the net number of room nights are not available.
The Convention Center also influences the level of Average Daily Rate in the hotel market during event days. Consistent with a normal supply and demand relationship, higher levels of room night demand would cause an increase in price. On event days with higher demand, hoteliers could charge higher room rates to all of their customers, regardless of their association with the Convention Center room block.
While impacts of the Qualified Events on hotel room rates and occupancy are likely to occur, HVS did not include these impacts in this report because the statistical models we used to analyze these effects produced a wide range of estimates within a 90 percent confidence interval. Further analysis of market-wide hotel impact could be considered in future years. However, the results may not significantly affect the economic impact of events at the Convention Center.
Other Impacts
Convention, Sports & Entertainment Facilities Consulting Chicago, Illinois
July 2, 2018 Fiscal Impact Estimates Economic and Fiscal Impact Analysis Update - Arizona 4-1
4. Fiscal Impact Estimates
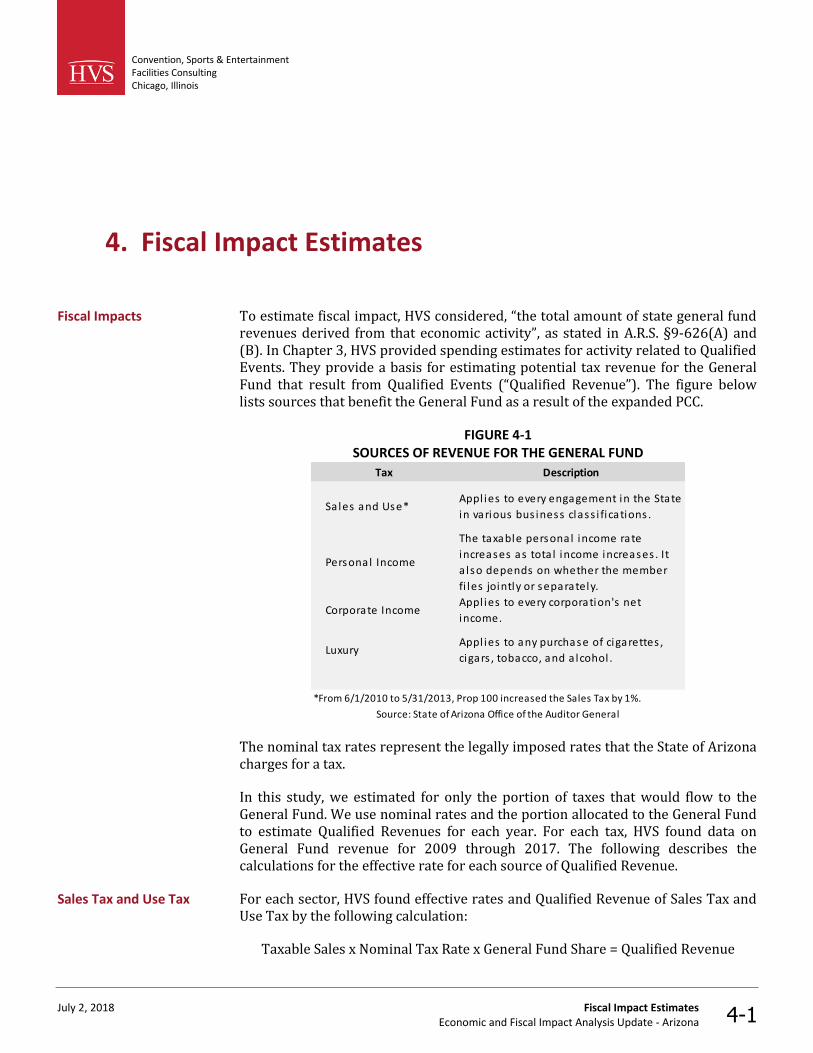
To estimate fiscal impact, HVS considered, “the total amount of state general fund revenues derived from that economic activity”, as stated in A.R.S. §9-626(A) and (B). In Chapter 3, HVS provided spending estimates for activity related to Qualified Events. They provide a basis for estimating potential tax revenue for the General Fund that result from Qualified Events (“Qualified Revenue”). The figure below lists sources that benefit the General Fund as a result of the expanded PCC.
FIGURE 4-1 SOURCES OF REVENUE FOR THE GENERAL FUND
Tax Description
Sales and Use*Appl ies to every engagement in the State
in various bus iness class i fications .
Personal Income
The taxable personal income rate
increases as tota l income increases . It
a lso depends on whether the member
fi les jointly or separately.
Corporate IncomeAppl ies to every corporation's net
income.
LuxuryAppl ies to any purchase of cigarettes ,
cigars , tobacco, and a lcohol .
*From 6/1/2010 to 5/31/2013, Prop 100 increased the Sales Tax by 1%.
Source: State of Arizona Office of the Auditor General
The nominal tax rates represent the legally imposed rates that the State of Arizona charges for a tax.
In this study, we estimated for only the portion of taxes that would flow to the General Fund. We use nominal rates and the portion allocated to the General Fund to estimate Qualified Revenues for each year. For each tax, HVS found data on General Fund revenue for 2009 through 2017. The following describes the calculations for the effective rate for each source of Qualified Revenue.
For each sector, HVS found effective rates and Qualified Revenue of Sales Tax and Use Tax by the following calculation:
Taxable Sales x Nominal Tax Rate x General Fund Share = Qualified Revenue
Fiscal Impacts
Sales Tax and Use Tax
Convention, Sports & Entertainment Facilities Consulting Chicago, Illinois
July 2, 2018 Fiscal Impact Estimates Economic and Fiscal Impact Analysis Update - Arizona 4-2
HVS calculated General Fund Share as the sum of the non-shared base and the portion of the distributed base going to the General Fund. HVS added one percent to the tax rate in years 2011 and 2012 to account for Proposition 100. HVS prorated this one percent and only added seven-twelfth of one percent in 2010 and five-twelfth of one percent in 2013 since the measure began on June 1, 2010 and ended on May 31, 2013. For detailed tax rates and General Fund Shares, see Appendix E.
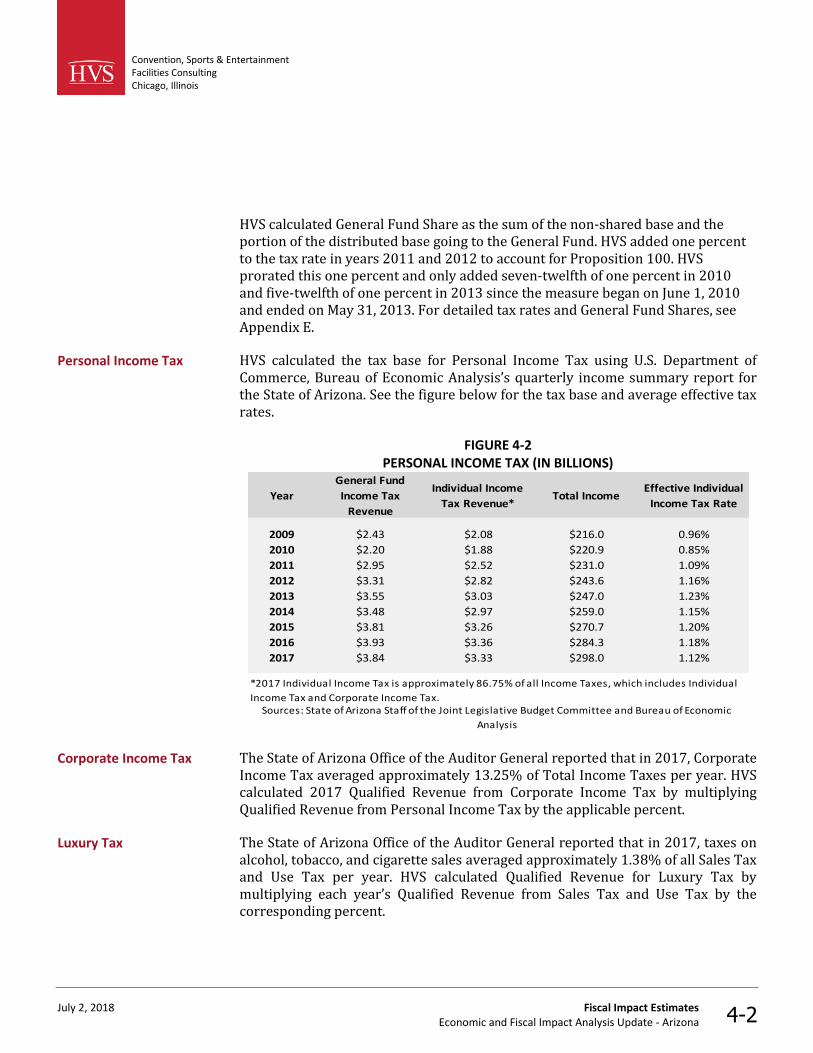
HVS calculated the tax base for Personal Income Tax using U.S. Department of Commerce, Bureau of Economic Analysis’s quarterly income summary report for the State of Arizona. See the figure below for the tax base and average effective tax rates.
FIGURE 4-2 PERSONAL INCOME TAX (IN BILLIONS)
Year
General Fund
Income Tax
Revenue
Individual Income
Tax Revenue*Total Income
Effective Individual
Income Tax Rate
2009 $2.43 $2.08 $216.0 0.96%
2010 $2.20 $1.88 $220.9 0.85%
2011 $2.95 $2.52 $231.0 1.09%
2012 $3.31 $2.82 $243.6 1.16%
2013 $3.55 $3.03 $247.0 1.23%
2014 $3.48 $2.97 $259.0 1.15%
2015 $3.81 $3.26 $270.7 1.20%
2016 $3.93 $3.36 $284.3 1.18%
2017 $3.84 $3.33 $298.0 1.12%
Sources: State of Arizona Staff of the Joint Legislative Budget Committee and Bureau of Economic
Analysis
*2017 Individual Income Tax is approximately 86.75% of all Income Taxes, which includes Individual
Income Tax and Corporate Income Tax.
The State of Arizona Office of the Auditor General reported that in 2017, Corporate Income Tax averaged approximately 13.25% of Total Income Taxes per year. HVS calculated 2017 Qualified Revenue from Corporate Income Tax by multiplying Qualified Revenue from Personal Income Tax by the applicable percent.
The State of Arizona Office of the Auditor General reported that in 2017, taxes on alcohol, tobacco, and cigarette sales averaged approximately 1.38% of all Sales Tax and Use Tax per year. HVS calculated Qualified Revenue for Luxury Tax by multiplying each year’s Qualified Revenue from Sales Tax and Use Tax by the corresponding percent.
Personal Income Tax
Corporate Income Tax
Luxury Tax
Convention, Sports & Entertainment Facilities Consulting Chicago, Illinois
July 2, 2018 Fiscal Impact Estimates Economic and Fiscal Impact Analysis Update - Arizona 4-3
HVS used the direct, indirect and induced impacts as the tax base created by activities related to Qualified Events.
Output—serves as the sales tax base. In IMPLAN this represents the value of a change in sales or the value of increased production.
Employee Compensation—serves as the tax base for personal income tax. IMPLAN defines employee compensation as “the total cost of labor including wages & salaries, other labor related income such as health and retirement benefits, and both employee & employer contributions to social insurance.” HVS calculated the effective income tax rate to adjust for the inclusion of benefits and social insurance in the tax base.
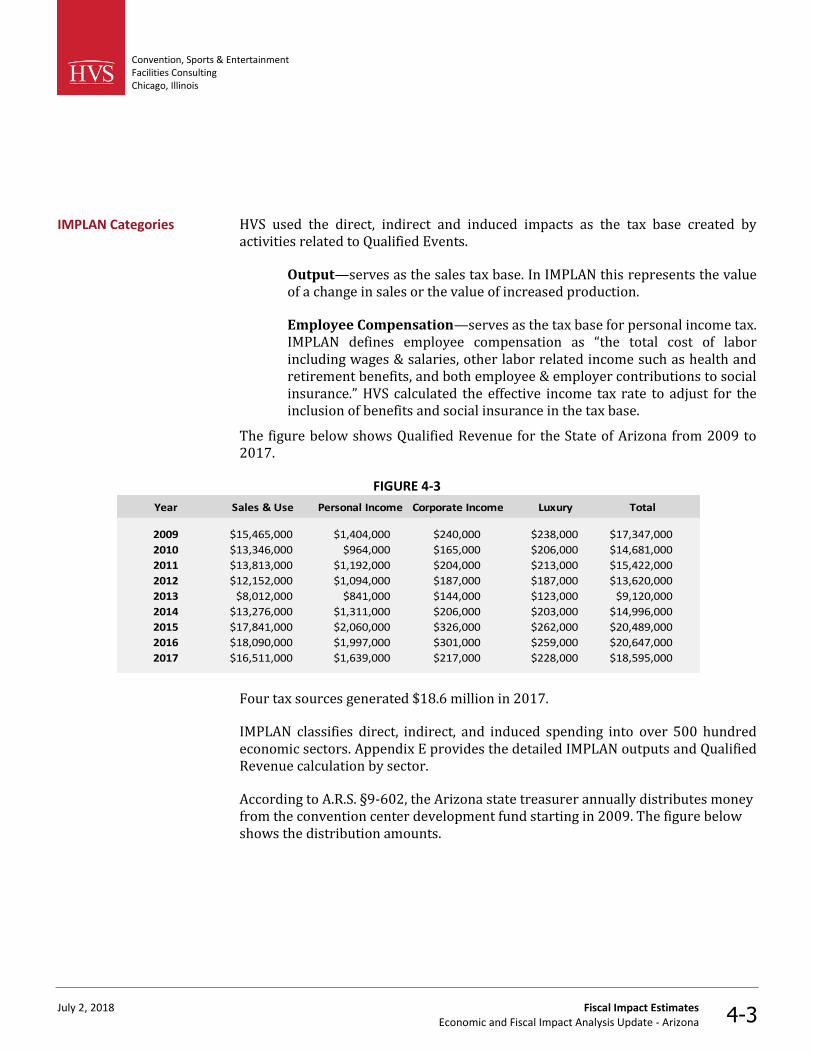
The figure below shows Qualified Revenue for the State of Arizona from 2009 to 2017.
FIGURE 4-3
Year Sales & Use Personal Income Corporate Income Luxury Total
2009 $15,465,000 $1,404,000 $240,000 $238,000 $17,347,000
2010 $13,346,000 $964,000 $165,000 $206,000 $14,681,000
2011 $13,813,000 $1,192,000 $204,000 $213,000 $15,422,000
2012 $12,152,000 $1,094,000 $187,000 $187,000 $13,620,000
2013 $8,012,000 $841,000 $144,000 $123,000 $9,120,000
2014 $13,276,000 $1,311,000 $206,000 $203,000 $14,996,000
2015 $17,841,000 $2,060,000 $326,000 $262,000 $20,489,000
2016 $18,090,000 $1,997,000 $301,000 $259,000 $20,647,000
2017 $16,511,000 $1,639,000 $217,000 $228,000 $18,595,000
Four tax sources generated $18.6 million in 2017.
IMPLAN classifies direct, indirect, and induced spending into over 500 hundred economic sectors. Appendix E provides the detailed IMPLAN outputs and Qualified Revenue calculation by sector.
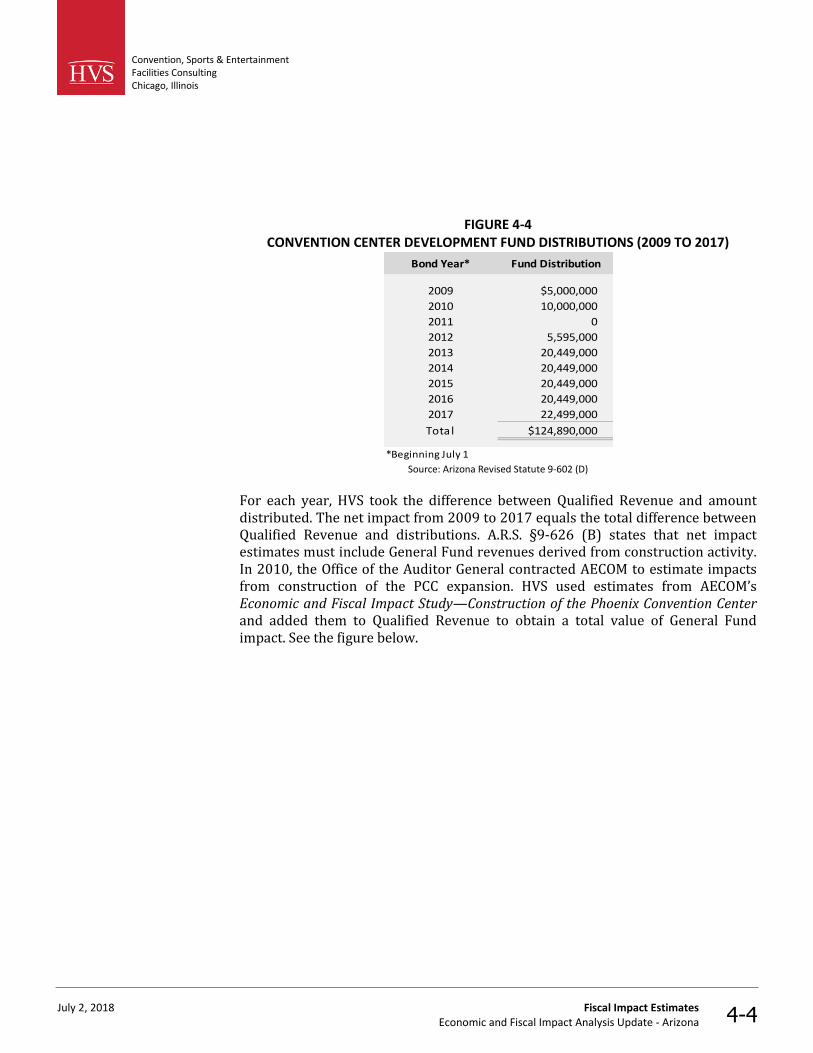
According to A.R.S. §9-602, the Arizona state treasurer annually distributes money from the convention center development fund starting in 2009. The figure below shows the distribution amounts.
IMPLAN Categories
Convention, Sports & Entertainment Facilities Consulting Chicago, Illinois
July 2, 2018 Fiscal Impact Estimates Economic and Fiscal Impact Analysis Update - Arizona 4-4
FIGURE 4-4 CONVENTION CENTER DEVELOPMENT FUND DISTRIBUTIONS (2009 TO 2017)
Bond Year* Fund Distribution
2009 $5,000,000
2010 10,000,000
2011 0
2012 5,595,000
2013 20,449,000
2014 20,449,000
2015 20,449,000
2016 20,449,000
2017 22,499,000
Total $124,890,000
*Beginning July 1 Source: Arizona Revised Statute 9-602 (D)
For each year, HVS took the difference between Qualified Revenue and amount distributed. The net impact from 2009 to 2017 equals the total difference between Qualified Revenue and distributions. A.R.S. §9-626 (B) states that net impact estimates must include General Fund revenues derived from construction activity. In 2010, the Office of the Auditor General contracted AECOM to estimate impacts from construction of the PCC expansion. HVS used estimates from AECOM’s Economic and Fiscal Impact Study—Construction of the Phoenix Convention Center and added them to Qualified Revenue to obtain a total value of General Fund impact. See the figure below.
Convention, Sports & Entertainment Facilities Consulting Chicago, Illinois
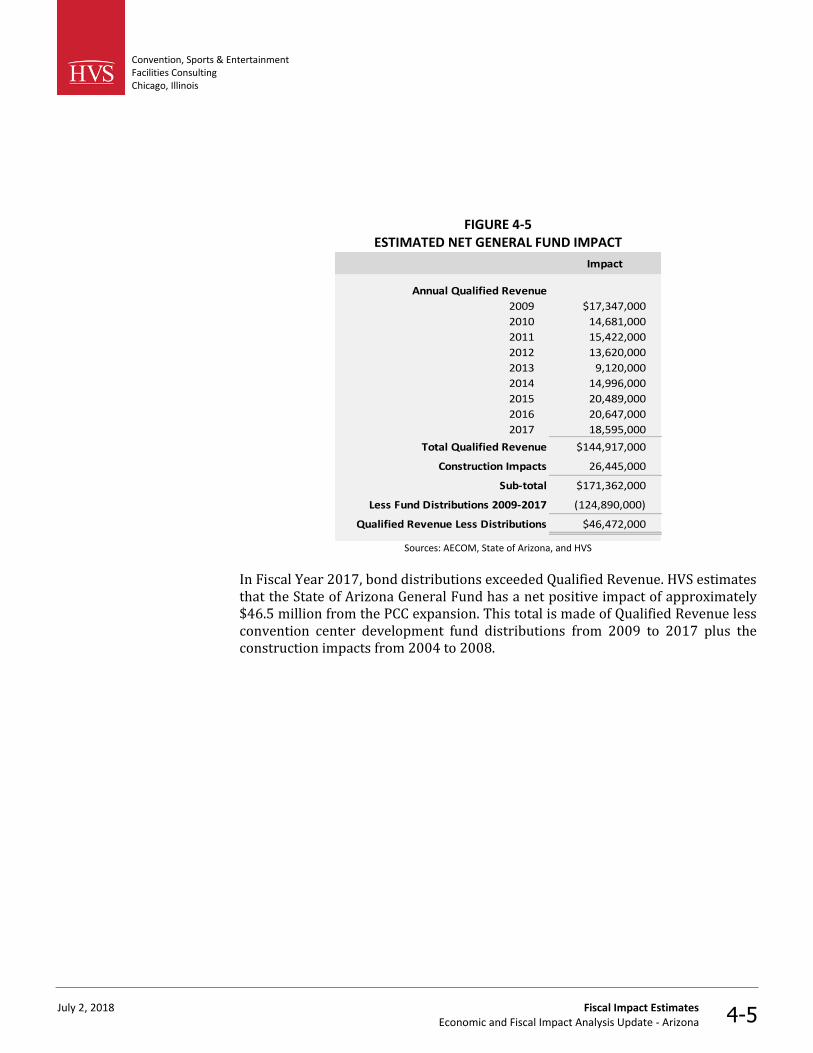
July 2, 2018 Fiscal Impact Estimates Economic and Fiscal Impact Analysis Update - Arizona 4-5
FIGURE 4-5 ESTIMATED NET GENERAL FUND IMPACT
Impact
Annual Qualified Revenue
2009 $17,347,000
2010 14,681,000
2011 15,422,000
2012 13,620,000
2013 9,120,000
2014 14,996,000
2015 20,489,000
2016 20,647,000
2017 18,595,000
Total Qualified Revenue $144,917,000
Construction Impacts 26,445,000
Sub-total $171,362,000
Less Fund Distributions 2009-2017 (124,890,000)
Qualified Revenue Less Distributions $46,472,000
Sources: AECOM, State of Arizona, and HVS
In Fiscal Year 2017, bond distributions exceeded Qualified Revenue. HVS estimates that the State of Arizona General Fund has a net positive impact of approximately $46.5 million from the PCC expansion. This total is made of Qualified Revenue less convention center development fund distributions from 2009 to 2017 plus the construction impacts from 2004 to 2008.
Convention, Sports & Entertainment Facilities Consulting Chicago, Illinois
July 2, 2018 Statement of Assumptions and Limiting Conditions Economic and Fiscal Impact Analysis Update - Arizona 5-1
5. Statement of Assumptions and Limiting Conditions
1. This report is to be used in whole and not in part.
2. No responsibility is assumed for matters of a legal nature.
3. All information, financial operating statements, estimates, and opinions obtained from parties not employed by HVS are assumed to be true and correct. We can assume no liability resulting from misinformation.
4. We are not required to give testimony or attendance in court by reason of this analysis without previous arrangements, and only when our standard per-diem fees and travel costs are paid prior to the appearance.
5. If the reader is making a fiduciary or individual investment decision and has any questions concerning the material presented in this report, it is recommended that the reader contact us.
6. We take no responsibility for any events or circumstances that take place subsequent to the date of our report.
7. The impact analysis presented in this report is based upon assumptions, estimates, and evaluations of the market conditions in the local and national economy, which may be subject to sharp rises and declines. Over the projection period considered in our analysis, wages and other operating expenses may increase or decrease due to market volatility and economic forces outside the control of the PCC’s management.
8. Many of the figures presented in this report were generated using sophisticated computer models. In the interest of simplicity, most numbers have been rounded. Thus, these figures may be subject to rounding errors.
9. Our responsibility is limited to the client, and use of this report by third parties shall be solely at the risk of the client and/or third parties. The use of this report is also subject to the terms and conditions set forth in our engagement letter with the client.
10. This report was prepared by HVS Convention, Sports & Entertainment Facilities Consulting. All opinions, recommendations, and conclusions expressed during the course of this assignment are rendered by the staff of this organization, as employees, rather than as individuals.

Convention, Sports & Entertainment Facilities Consulting Chicago, Illinois
July 2, 2018 Certification Economic and Fiscal Impact Analysis Update - Arizona 6-1
6. Certification
The undersigned hereby certify that, to the best of our knowledge and belief:
1. the statements of fact presented in this report are true and correct;
2. the reported analyses, opinions, and conclusions are limited only by thereported assumptions and limiting conditions, and are our personal,impartial, and unbiased professional analyses, opinions, and conclusions;
3. we have no present or prospective interest in the property that is thesubject of this report and no personal interest with respect to the partiesinvolved;
4. we have no bias with respect to the property that is the subject of thisreport or to the parties involved with this assignment;
5. our compensation for completing this assignment is not contingent uponthe development or reporting of a predetermined outcome that favors thecause of the client, the attainment of a stipulated result, or the occurrenceof a subsequent event directly related to the intended use of this impactanalsyis;
6. Thomas A Hazinski designed the methodology of this study and reviewedall results. Alex Moon participated in the research and analysis.
Thomas A Hazinski
Managing Director
Alex Moon
Senior Associate
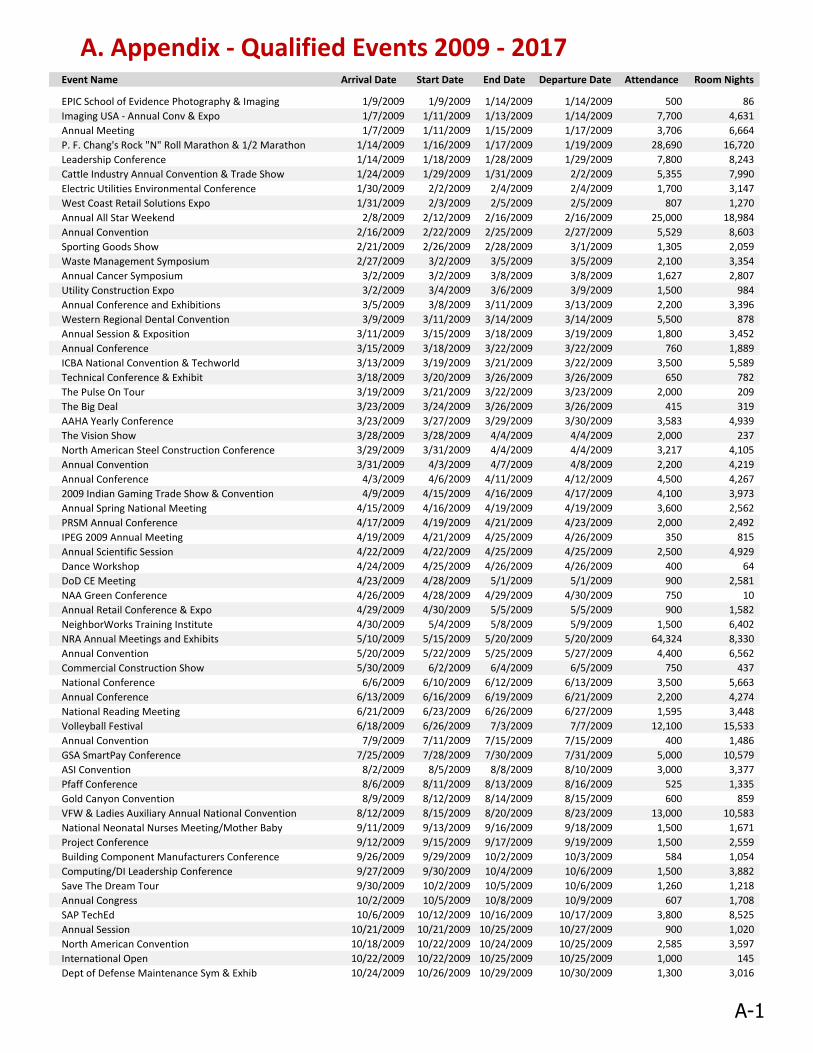
A. Appendix - Qualified Events 2009 - 2017Event Name Arrival Date Start Date End Date Departure Date Attendance Room Nights
EPIC School of Evidence Photography & Imaging 1/9/2009 1/9/2009 1/14/2009 1/14/2009 500 86
Imaging USA - Annual Conv & Expo 1/7/2009 1/11/2009 1/13/2009 1/14/2009 7,700 4,631
Annual Meeting 1/7/2009 1/11/2009 1/15/2009 1/17/2009 3,706 6,664
P. F. Chang's Rock "N" Roll Marathon & 1/2 Marathon 1/14/2009 1/16/2009 1/17/2009 1/19/2009 28,690 16,720
Leadership Conference 1/14/2009 1/18/2009 1/28/2009 1/29/2009 7,800 8,243
Cattle Industry Annual Convention & Trade Show 1/24/2009 1/29/2009 1/31/2009 2/2/2009 5,355 7,990
Electric Utilities Environmental Conference 1/30/2009 2/2/2009 2/4/2009 2/4/2009 1,700 3,147
West Coast Retail Solutions Expo 1/31/2009 2/3/2009 2/5/2009 2/5/2009 807 1,270
Annual All Star Weekend 2/8/2009 2/12/2009 2/16/2009 2/16/2009 25,000 18,984
Annual Convention 2/16/2009 2/22/2009 2/25/2009 2/27/2009 5,529 8,603
Sporting Goods Show 2/21/2009 2/26/2009 2/28/2009 3/1/2009 1,305 2,059
Waste Management Symposium 2/27/2009 3/2/2009 3/5/2009 3/5/2009 2,100 3,354
Annual Cancer Symposium 3/2/2009 3/2/2009 3/8/2009 3/8/2009 1,627 2,807
Utility Construction Expo 3/2/2009 3/4/2009 3/6/2009 3/9/2009 1,500 984
Annual Conference and Exhibitions 3/5/2009 3/8/2009 3/11/2009 3/13/2009 2,200 3,396
Western Regional Dental Convention 3/9/2009 3/11/2009 3/14/2009 3/14/2009 5,500 878
Annual Session & Exposition 3/11/2009 3/15/2009 3/18/2009 3/19/2009 1,800 3,452
Annual Conference 3/15/2009 3/18/2009 3/22/2009 3/22/2009 760 1,889
ICBA National Convention & Techworld 3/13/2009 3/19/2009 3/21/2009 3/22/2009 3,500 5,589
Technical Conference & Exhibit 3/18/2009 3/20/2009 3/26/2009 3/26/2009 650 782
The Pulse On Tour 3/19/2009 3/21/2009 3/22/2009 3/23/2009 2,000 209
The Big Deal 3/23/2009 3/24/2009 3/26/2009 3/26/2009 415 319
AAHA Yearly Conference 3/23/2009 3/27/2009 3/29/2009 3/30/2009 3,583 4,939
The Vision Show 3/28/2009 3/28/2009 4/4/2009 4/4/2009 2,000 237
North American Steel Construction Conference 3/29/2009 3/31/2009 4/4/2009 4/4/2009 3,217 4,105
Annual Convention 3/31/2009 4/3/2009 4/7/2009 4/8/2009 2,200 4,219
Annual Conference 4/3/2009 4/6/2009 4/11/2009 4/12/2009 4,500 4,267
2009 Indian Gaming Trade Show & Convention 4/9/2009 4/15/2009 4/16/2009 4/17/2009 4,100 3,973
Annual Spring National Meeting 4/15/2009 4/16/2009 4/19/2009 4/19/2009 3,600 2,562
PRSM Annual Conference 4/17/2009 4/19/2009 4/21/2009 4/23/2009 2,000 2,492
IPEG 2009 Annual Meeting 4/19/2009 4/21/2009 4/25/2009 4/26/2009 350 815
Annual Scientific Session 4/22/2009 4/22/2009 4/25/2009 4/25/2009 2,500 4,929
Dance Workshop 4/24/2009 4/25/2009 4/26/2009 4/26/2009 400 64
DoD CE Meeting 4/23/2009 4/28/2009 5/1/2009 5/1/2009 900 2,581
NAA Green Conference 4/26/2009 4/28/2009 4/29/2009 4/30/2009 750 10
Annual Retail Conference & Expo 4/29/2009 4/30/2009 5/5/2009 5/5/2009 900 1,582
NeighborWorks Training Institute 4/30/2009 5/4/2009 5/8/2009 5/9/2009 1,500 6,402
NRA Annual Meetings and Exhibits 5/10/2009 5/15/2009 5/20/2009 5/20/2009 64,324 8,330
Annual Convention 5/20/2009 5/22/2009 5/25/2009 5/27/2009 4,400 6,562
Commercial Construction Show 5/30/2009 6/2/2009 6/4/2009 6/5/2009 750 437
National Conference 6/6/2009 6/10/2009 6/12/2009 6/13/2009 3,500 5,663
Annual Conference 6/13/2009 6/16/2009 6/19/2009 6/21/2009 2,200 4,274
National Reading Meeting 6/21/2009 6/23/2009 6/26/2009 6/27/2009 1,595 3,448
Volleyball Festival 6/18/2009 6/26/2009 7/3/2009 7/7/2009 12,100 15,533
Annual Convention 7/9/2009 7/11/2009 7/15/2009 7/15/2009 400 1,486
GSA SmartPay Conference 7/25/2009 7/28/2009 7/30/2009 7/31/2009 5,000 10,579
ASI Convention 8/2/2009 8/5/2009 8/8/2009 8/10/2009 3,000 3,377
Pfaff Conference 8/6/2009 8/11/2009 8/13/2009 8/16/2009 525 1,335
Gold Canyon Convention 8/9/2009 8/12/2009 8/14/2009 8/15/2009 600 859
VFW & Ladies Auxiliary Annual National Convention 8/12/2009 8/15/2009 8/20/2009 8/23/2009 13,000 10,583
National Neonatal Nurses Meeting/Mother Baby 9/11/2009 9/13/2009 9/16/2009 9/18/2009 1,500 1,671
Project Conference 9/12/2009 9/15/2009 9/17/2009 9/19/2009 1,500 2,559
Building Component Manufacturers Conference 9/26/2009 9/29/2009 10/2/2009 10/3/2009 584 1,054
Computing/DI Leadership Conference 9/27/2009 9/30/2009 10/4/2009 10/6/2009 1,500 3,882
Save The Dream Tour 9/30/2009 10/2/2009 10/5/2009 10/6/2009 1,260 1,218
Annual Congress 10/2/2009 10/5/2009 10/8/2009 10/9/2009 607 1,708
SAP TechEd 10/6/2009 10/12/2009 10/16/2009 10/17/2009 3,800 8,525
Annual Session 10/21/2009 10/21/2009 10/25/2009 10/27/2009 900 1,020
North American Convention 10/18/2009 10/22/2009 10/24/2009 10/25/2009 2,585 3,597
International Open 10/22/2009 10/22/2009 10/25/2009 10/25/2009 1,000 145
Dept of Defense Maintenance Sym & Exhib 10/24/2009 10/26/2009 10/29/2009 10/30/2009 1,300 3,016
A-1
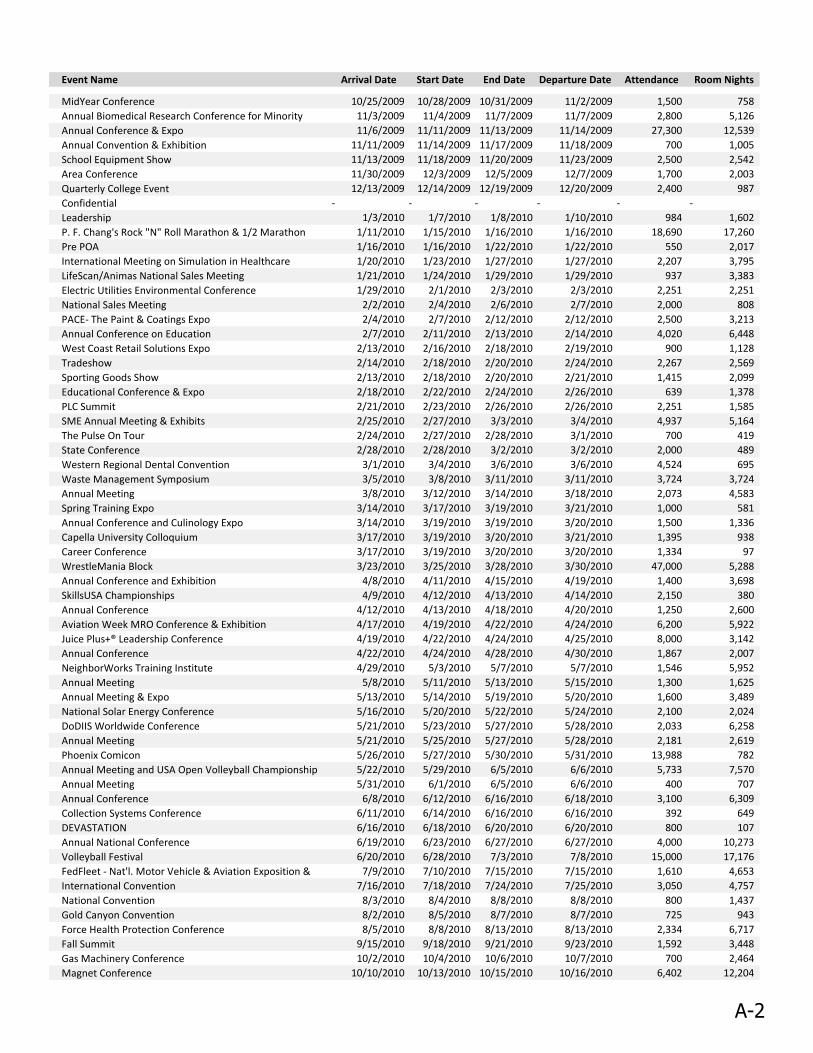
Event Name Arrival Date Start Date End Date Departure Date Attendance Room Nights
MidYear Conference 10/25/2009 10/28/2009 10/31/2009 11/2/2009 1,500 758
Annual Biomedical Research Conference for Minority 11/3/2009 11/4/2009 11/7/2009 11/7/2009 2,800 5,126
Annual Conference & Expo 11/6/2009 11/11/2009 11/13/2009 11/14/2009 27,300 12,539
Annual Convention & Exhibition 11/11/2009 11/14/2009 11/17/2009 11/18/2009 700 1,005
School Equipment Show 11/13/2009 11/18/2009 11/20/2009 11/23/2009 2,500 2,542
Area Conference 11/30/2009 12/3/2009 12/5/2009 12/7/2009 1,700 2,003
Quarterly College Event 12/13/2009 12/14/2009 12/19/2009 12/20/2009 2,400 987
Confidential - - - - - -
Leadership 1/3/2010 1/7/2010 1/8/2010 1/10/2010 984 1,602
P. F. Chang's Rock "N" Roll Marathon & 1/2 Marathon 1/11/2010 1/15/2010 1/16/2010 1/16/2010 18,690 17,260
Pre POA 1/16/2010 1/16/2010 1/22/2010 1/22/2010 550 2,017
International Meeting on Simulation in Healthcare 1/20/2010 1/23/2010 1/27/2010 1/27/2010 2,207 3,795
LifeScan/Animas National Sales Meeting 1/21/2010 1/24/2010 1/29/2010 1/29/2010 937 3,383
Electric Utilities Environmental Conference 1/29/2010 2/1/2010 2/3/2010 2/3/2010 2,251 2,251
National Sales Meeting 2/2/2010 2/4/2010 2/6/2010 2/7/2010 2,000 808
PACE- The Paint & Coatings Expo 2/4/2010 2/7/2010 2/12/2010 2/12/2010 2,500 3,213
Annual Conference on Education 2/7/2010 2/11/2010 2/13/2010 2/14/2010 4,020 6,448
West Coast Retail Solutions Expo 2/13/2010 2/16/2010 2/18/2010 2/19/2010 900 1,128
Tradeshow 2/14/2010 2/18/2010 2/20/2010 2/24/2010 2,267 2,569
Sporting Goods Show 2/13/2010 2/18/2010 2/20/2010 2/21/2010 1,415 2,099
Educational Conference & Expo 2/18/2010 2/22/2010 2/24/2010 2/26/2010 639 1,378
PLC Summit 2/21/2010 2/23/2010 2/26/2010 2/26/2010 2,251 1,585
SME Annual Meeting & Exhibits 2/25/2010 2/27/2010 3/3/2010 3/4/2010 4,937 5,164
The Pulse On Tour 2/24/2010 2/27/2010 2/28/2010 3/1/2010 700 419
State Conference 2/28/2010 2/28/2010 3/2/2010 3/2/2010 2,000 489
Western Regional Dental Convention 3/1/2010 3/4/2010 3/6/2010 3/6/2010 4,524 695
Waste Management Symposium 3/5/2010 3/8/2010 3/11/2010 3/11/2010 3,724 3,724
Annual Meeting 3/8/2010 3/12/2010 3/14/2010 3/18/2010 2,073 4,583
Spring Training Expo 3/14/2010 3/17/2010 3/19/2010 3/21/2010 1,000 581
Annual Conference and Culinology Expo 3/14/2010 3/19/2010 3/19/2010 3/20/2010 1,500 1,336
Capella University Colloquium 3/17/2010 3/19/2010 3/20/2010 3/21/2010 1,395 938
Career Conference 3/17/2010 3/19/2010 3/20/2010 3/20/2010 1,334 97
WrestleMania Block 3/23/2010 3/25/2010 3/28/2010 3/30/2010 47,000 5,288
Annual Conference and Exhibition 4/8/2010 4/11/2010 4/15/2010 4/19/2010 1,400 3,698
SkillsUSA Championships 4/9/2010 4/12/2010 4/13/2010 4/14/2010 2,150 380
Annual Conference 4/12/2010 4/13/2010 4/18/2010 4/20/2010 1,250 2,600
Aviation Week MRO Conference & Exhibition 4/17/2010 4/19/2010 4/22/2010 4/24/2010 6,200 5,922
Juice Plus+® Leadership Conference 4/19/2010 4/22/2010 4/24/2010 4/25/2010 8,000 3,142
Annual Conference 4/22/2010 4/24/2010 4/28/2010 4/30/2010 1,867 2,007
NeighborWorks Training Institute 4/29/2010 5/3/2010 5/7/2010 5/7/2010 1,546 5,952
Annual Meeting 5/8/2010 5/11/2010 5/13/2010 5/15/2010 1,300 1,625
Annual Meeting & Expo 5/13/2010 5/14/2010 5/19/2010 5/20/2010 1,600 3,489
National Solar Energy Conference 5/16/2010 5/20/2010 5/22/2010 5/24/2010 2,100 2,024
DoDIIS Worldwide Conference 5/21/2010 5/23/2010 5/27/2010 5/28/2010 2,033 6,258
Annual Meeting 5/21/2010 5/25/2010 5/27/2010 5/28/2010 2,181 2,619
Phoenix Comicon 5/26/2010 5/27/2010 5/30/2010 5/31/2010 13,988 782
Annual Meeting and USA Open Volleyball Championship 5/22/2010 5/29/2010 6/5/2010 6/6/2010 5,733 7,570
Annual Meeting 5/31/2010 6/1/2010 6/5/2010 6/6/2010 400 707
Annual Conference 6/8/2010 6/12/2010 6/16/2010 6/18/2010 3,100 6,309
Collection Systems Conference 6/11/2010 6/14/2010 6/16/2010 6/16/2010 392 649
DEVASTATION 6/16/2010 6/18/2010 6/20/2010 6/20/2010 800 107
Annual National Conference 6/19/2010 6/23/2010 6/27/2010 6/27/2010 4,000 10,273
Volleyball Festival 6/20/2010 6/28/2010 7/3/2010 7/8/2010 15,000 17,176
FedFleet - Nat'l. Motor Vehicle & Aviation Exposition & 7/9/2010 7/10/2010 7/15/2010 7/15/2010 1,610 4,653
International Convention 7/16/2010 7/18/2010 7/24/2010 7/25/2010 3,050 4,757
National Convention 8/3/2010 8/4/2010 8/8/2010 8/8/2010 800 1,437
Gold Canyon Convention 8/2/2010 8/5/2010 8/7/2010 8/7/2010 725 943
Force Health Protection Conference 8/5/2010 8/8/2010 8/13/2010 8/13/2010 2,334 6,717
Fall Summit 9/15/2010 9/18/2010 9/21/2010 9/23/2010 1,592 3,448
Gas Machinery Conference 10/2/2010 10/4/2010 10/6/2010 10/7/2010 700 2,464
Magnet Conference 10/10/2010 10/13/2010 10/15/2010 10/16/2010 6,402 12,204
A-2
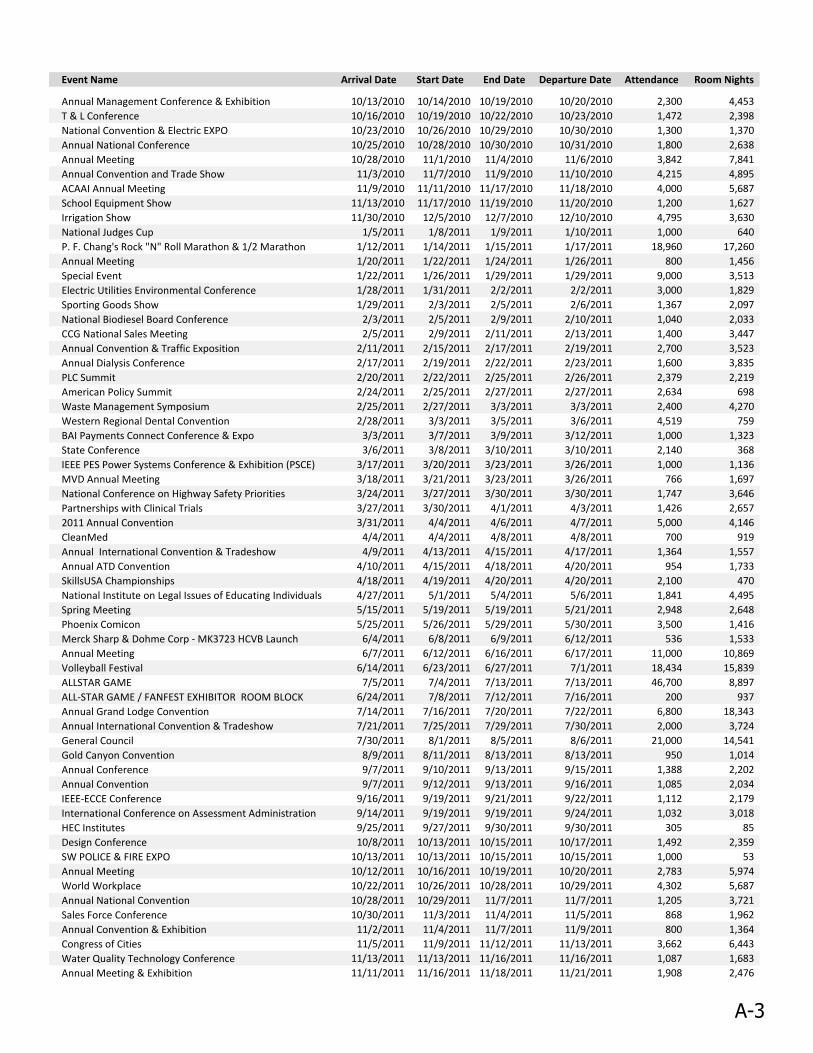
Event Name Arrival Date Start Date End Date Departure Date Attendance Room Nights
Annual Management Conference & Exhibition 10/13/2010 10/14/2010 10/19/2010 10/20/2010 2,300 4,453
T & L Conference 10/16/2010 10/19/2010 10/22/2010 10/23/2010 1,472 2,398
National Convention & Electric EXPO 10/23/2010 10/26/2010 10/29/2010 10/30/2010 1,300 1,370
Annual National Conference 10/25/2010 10/28/2010 10/30/2010 10/31/2010 1,800 2,638
Annual Meeting 10/28/2010 11/1/2010 11/4/2010 11/6/2010 3,842 7,841
Annual Convention and Trade Show 11/3/2010 11/7/2010 11/9/2010 11/10/2010 4,215 4,895
ACAAI Annual Meeting 11/9/2010 11/11/2010 11/17/2010 11/18/2010 4,000 5,687
School Equipment Show 11/13/2010 11/17/2010 11/19/2010 11/20/2010 1,200 1,627
Irrigation Show 11/30/2010 12/5/2010 12/7/2010 12/10/2010 4,795 3,630
National Judges Cup 1/5/2011 1/8/2011 1/9/2011 1/10/2011 1,000 640
P. F. Chang's Rock "N" Roll Marathon & 1/2 Marathon 1/12/2011 1/14/2011 1/15/2011 1/17/2011 18,960 17,260
Annual Meeting 1/20/2011 1/22/2011 1/24/2011 1/26/2011 800 1,456
Special Event 1/22/2011 1/26/2011 1/29/2011 1/29/2011 9,000 3,513
Electric Utilities Environmental Conference 1/28/2011 1/31/2011 2/2/2011 2/2/2011 3,000 1,829
Sporting Goods Show 1/29/2011 2/3/2011 2/5/2011 2/6/2011 1,367 2,097
National Biodiesel Board Conference 2/3/2011 2/5/2011 2/9/2011 2/10/2011 1,040 2,033
CCG National Sales Meeting 2/5/2011 2/9/2011 2/11/2011 2/13/2011 1,400 3,447
Annual Convention & Traffic Exposition 2/11/2011 2/15/2011 2/17/2011 2/19/2011 2,700 3,523
Annual Dialysis Conference 2/17/2011 2/19/2011 2/22/2011 2/23/2011 1,600 3,835
PLC Summit 2/20/2011 2/22/2011 2/25/2011 2/26/2011 2,379 2,219
American Policy Summit 2/24/2011 2/25/2011 2/27/2011 2/27/2011 2,634 698
Waste Management Symposium 2/25/2011 2/27/2011 3/3/2011 3/3/2011 2,400 4,270
Western Regional Dental Convention 2/28/2011 3/3/2011 3/5/2011 3/6/2011 4,519 759
BAI Payments Connect Conference & Expo 3/3/2011 3/7/2011 3/9/2011 3/12/2011 1,000 1,323
State Conference 3/6/2011 3/8/2011 3/10/2011 3/10/2011 2,140 368
IEEE PES Power Systems Conference & Exhibition (PSCE) 3/17/2011 3/20/2011 3/23/2011 3/26/2011 1,000 1,136
MVD Annual Meeting 3/18/2011 3/21/2011 3/23/2011 3/26/2011 766 1,697
National Conference on Highway Safety Priorities 3/24/2011 3/27/2011 3/30/2011 3/30/2011 1,747 3,646
Partnerships with Clinical Trials 3/27/2011 3/30/2011 4/1/2011 4/3/2011 1,426 2,657
2011 Annual Convention 3/31/2011 4/4/2011 4/6/2011 4/7/2011 5,000 4,146
CleanMed 4/4/2011 4/4/2011 4/8/2011 4/8/2011 700 919
Annual International Convention & Tradeshow 4/9/2011 4/13/2011 4/15/2011 4/17/2011 1,364 1,557
Annual ATD Convention 4/10/2011 4/15/2011 4/18/2011 4/20/2011 954 1,733
SkillsUSA Championships 4/18/2011 4/19/2011 4/20/2011 4/20/2011 2,100 470
National Institute on Legal Issues of Educating Individuals 4/27/2011 5/1/2011 5/4/2011 5/6/2011 1,841 4,495
Spring Meeting 5/15/2011 5/19/2011 5/19/2011 5/21/2011 2,948 2,648
Phoenix Comicon 5/25/2011 5/26/2011 5/29/2011 5/30/2011 3,500 1,416
Merck Sharp & Dohme Corp - MK3723 HCVB Launch 6/4/2011 6/8/2011 6/9/2011 6/12/2011 536 1,533
Annual Meeting 6/7/2011 6/12/2011 6/16/2011 6/17/2011 11,000 10,869
Volleyball Festival 6/14/2011 6/23/2011 6/27/2011 7/1/2011 18,434 15,839
ALLSTAR GAME 7/5/2011 7/4/2011 7/13/2011 7/13/2011 46,700 8,897
ALL-STAR GAME / FANFEST EXHIBITOR ROOM BLOCK 6/24/2011 7/8/2011 7/12/2011 7/16/2011 200 937
Annual Grand Lodge Convention 7/14/2011 7/16/2011 7/20/2011 7/22/2011 6,800 18,343
Annual International Convention & Tradeshow 7/21/2011 7/25/2011 7/29/2011 7/30/2011 2,000 3,724
General Council 7/30/2011 8/1/2011 8/5/2011 8/6/2011 21,000 14,541
Gold Canyon Convention 8/9/2011 8/11/2011 8/13/2011 8/13/2011 950 1,014
Annual Conference 9/7/2011 9/10/2011 9/13/2011 9/15/2011 1,388 2,202
Annual Convention 9/7/2011 9/12/2011 9/13/2011 9/16/2011 1,085 2,034
IEEE-ECCE Conference 9/16/2011 9/19/2011 9/21/2011 9/22/2011 1,112 2,179
International Conference on Assessment Administration 9/14/2011 9/19/2011 9/19/2011 9/24/2011 1,032 3,018
HEC Institutes 9/25/2011 9/27/2011 9/30/2011 9/30/2011 305 85
Design Conference 10/8/2011 10/13/2011 10/15/2011 10/17/2011 1,492 2,359
SW POLICE & FIRE EXPO 10/13/2011 10/13/2011 10/15/2011 10/15/2011 1,000 53
Annual Meeting 10/12/2011 10/16/2011 10/19/2011 10/20/2011 2,783 5,974
World Workplace 10/22/2011 10/26/2011 10/28/2011 10/29/2011 4,302 5,687
Annual National Convention 10/28/2011 10/29/2011 11/7/2011 11/7/2011 1,205 3,721
Sales Force Conference 10/30/2011 11/3/2011 11/4/2011 11/5/2011 868 1,962
Annual Convention & Exhibition 11/2/2011 11/4/2011 11/7/2011 11/9/2011 800 1,364
Congress of Cities 11/5/2011 11/9/2011 11/12/2011 11/13/2011 3,662 6,443
Water Quality Technology Conference 11/13/2011 11/13/2011 11/16/2011 11/16/2011 1,087 1,683
Annual Meeting & Exhibition 11/11/2011 11/16/2011 11/18/2011 11/21/2011 1,908 2,476
A-3
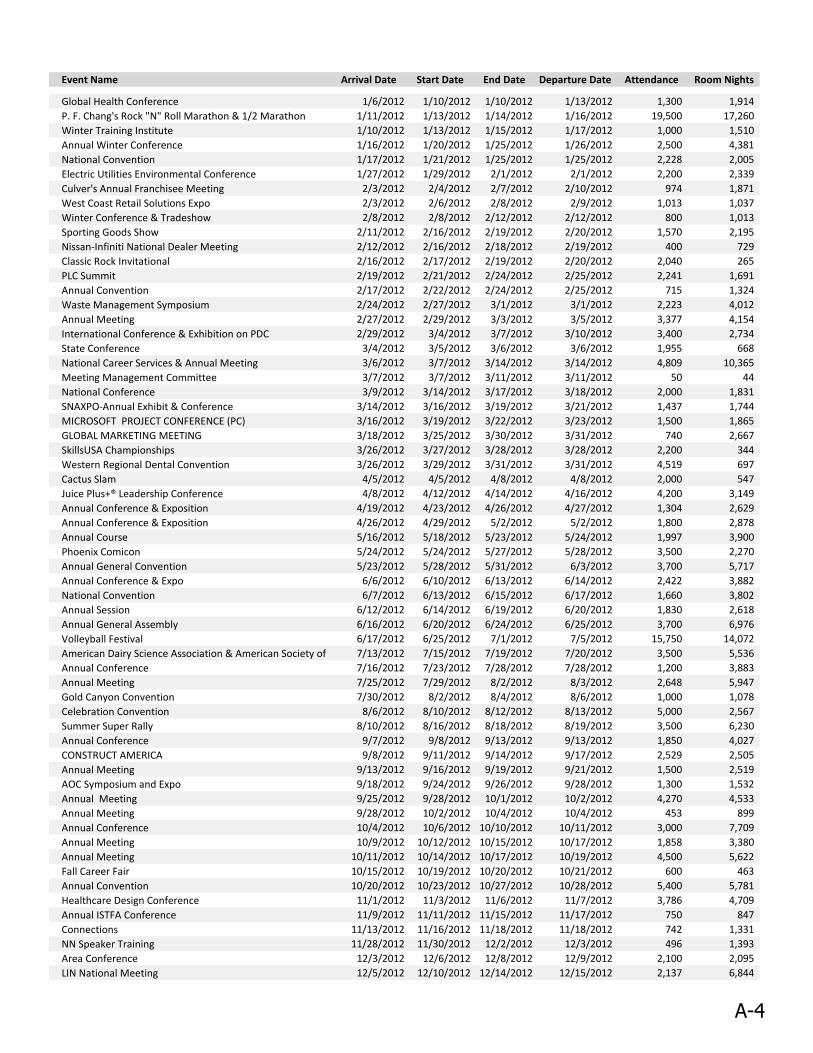
Event Name Arrival Date Start Date End Date Departure Date Attendance Room Nights
Global Health Conference 1/6/2012 1/10/2012 1/10/2012 1/13/2012 1,300 1,914
P. F. Chang's Rock "N" Roll Marathon & 1/2 Marathon 1/11/2012 1/13/2012 1/14/2012 1/16/2012 19,500 17,260
Winter Training Institute 1/10/2012 1/13/2012 1/15/2012 1/17/2012 1,000 1,510
Annual Winter Conference 1/16/2012 1/20/2012 1/25/2012 1/26/2012 2,500 4,381
National Convention 1/17/2012 1/21/2012 1/25/2012 1/25/2012 2,228 2,005
Electric Utilities Environmental Conference 1/27/2012 1/29/2012 2/1/2012 2/1/2012 2,200 2,339
Culver's Annual Franchisee Meeting 2/3/2012 2/4/2012 2/7/2012 2/10/2012 974 1,871
West Coast Retail Solutions Expo 2/3/2012 2/6/2012 2/8/2012 2/9/2012 1,013 1,037
Winter Conference & Tradeshow 2/8/2012 2/8/2012 2/12/2012 2/12/2012 800 1,013
Sporting Goods Show 2/11/2012 2/16/2012 2/19/2012 2/20/2012 1,570 2,195
Nissan-Infiniti National Dealer Meeting 2/12/2012 2/16/2012 2/18/2012 2/19/2012 400 729
Classic Rock Invitational 2/16/2012 2/17/2012 2/19/2012 2/20/2012 2,040 265
PLC Summit 2/19/2012 2/21/2012 2/24/2012 2/25/2012 2,241 1,691
Annual Convention 2/17/2012 2/22/2012 2/24/2012 2/25/2012 715 1,324
Waste Management Symposium 2/24/2012 2/27/2012 3/1/2012 3/1/2012 2,223 4,012
Annual Meeting 2/27/2012 2/29/2012 3/3/2012 3/5/2012 3,377 4,154
International Conference & Exhibition on PDC 2/29/2012 3/4/2012 3/7/2012 3/10/2012 3,400 2,734
State Conference 3/4/2012 3/5/2012 3/6/2012 3/6/2012 1,955 668
National Career Services & Annual Meeting 3/6/2012 3/7/2012 3/14/2012 3/14/2012 4,809 10,365
Meeting Management Committee 3/7/2012 3/7/2012 3/11/2012 3/11/2012 50 44
National Conference 3/9/2012 3/14/2012 3/17/2012 3/18/2012 2,000 1,831
SNAXPO-Annual Exhibit & Conference 3/14/2012 3/16/2012 3/19/2012 3/21/2012 1,437 1,744
MICROSOFT PROJECT CONFERENCE (PC) 3/16/2012 3/19/2012 3/22/2012 3/23/2012 1,500 1,865
GLOBAL MARKETING MEETING 3/18/2012 3/25/2012 3/30/2012 3/31/2012 740 2,667
SkillsUSA Championships 3/26/2012 3/27/2012 3/28/2012 3/28/2012 2,200 344
Western Regional Dental Convention 3/26/2012 3/29/2012 3/31/2012 3/31/2012 4,519 697
Cactus Slam 4/5/2012 4/5/2012 4/8/2012 4/8/2012 2,000 547
Juice Plus+® Leadership Conference 4/8/2012 4/12/2012 4/14/2012 4/16/2012 4,200 3,149
Annual Conference & Exposition 4/19/2012 4/23/2012 4/26/2012 4/27/2012 1,304 2,629
Annual Conference & Exposition 4/26/2012 4/29/2012 5/2/2012 5/2/2012 1,800 2,878
Annual Course 5/16/2012 5/18/2012 5/23/2012 5/24/2012 1,997 3,900
Phoenix Comicon 5/24/2012 5/24/2012 5/27/2012 5/28/2012 3,500 2,270
Annual General Convention 5/23/2012 5/28/2012 5/31/2012 6/3/2012 3,700 5,717
Annual Conference & Expo 6/6/2012 6/10/2012 6/13/2012 6/14/2012 2,422 3,882
National Convention 6/7/2012 6/13/2012 6/15/2012 6/17/2012 1,660 3,802
Annual Session 6/12/2012 6/14/2012 6/19/2012 6/20/2012 1,830 2,618
Annual General Assembly 6/16/2012 6/20/2012 6/24/2012 6/25/2012 3,700 6,976
Volleyball Festival 6/17/2012 6/25/2012 7/1/2012 7/5/2012 15,750 14,072
American Dairy Science Association & American Society of 7/13/2012 7/15/2012 7/19/2012 7/20/2012 3,500 5,536
Annual Conference 7/16/2012 7/23/2012 7/28/2012 7/28/2012 1,200 3,883
Annual Meeting 7/25/2012 7/29/2012 8/2/2012 8/3/2012 2,648 5,947
Gold Canyon Convention 7/30/2012 8/2/2012 8/4/2012 8/6/2012 1,000 1,078
Celebration Convention 8/6/2012 8/10/2012 8/12/2012 8/13/2012 5,000 2,567
Summer Super Rally 8/10/2012 8/16/2012 8/18/2012 8/19/2012 3,500 6,230
Annual Conference 9/7/2012 9/8/2012 9/13/2012 9/13/2012 1,850 4,027
CONSTRUCT AMERICA 9/8/2012 9/11/2012 9/14/2012 9/17/2012 2,529 2,505
Annual Meeting 9/13/2012 9/16/2012 9/19/2012 9/21/2012 1,500 2,519
AOC Symposium and Expo 9/18/2012 9/24/2012 9/26/2012 9/28/2012 1,300 1,532
Annual Meeting 9/25/2012 9/28/2012 10/1/2012 10/2/2012 4,270 4,533
Annual Meeting 9/28/2012 10/2/2012 10/4/2012 10/4/2012 453 899
Annual Conference 10/4/2012 10/6/2012 10/10/2012 10/11/2012 3,000 7,709
Annual Meeting 10/9/2012 10/12/2012 10/15/2012 10/17/2012 1,858 3,380
Annual Meeting 10/11/2012 10/14/2012 10/17/2012 10/19/2012 4,500 5,622
Fall Career Fair 10/15/2012 10/19/2012 10/20/2012 10/21/2012 600 463
Annual Convention 10/20/2012 10/23/2012 10/27/2012 10/28/2012 5,400 5,781
Healthcare Design Conference 11/1/2012 11/3/2012 11/6/2012 11/7/2012 3,786 4,709
Annual ISTFA Conference 11/9/2012 11/11/2012 11/15/2012 11/17/2012 750 847
Connections 11/13/2012 11/16/2012 11/18/2012 11/18/2012 742 1,331
NN Speaker Training 11/28/2012 11/30/2012 12/2/2012 12/3/2012 496 1,393
Area Conference 12/3/2012 12/6/2012 12/8/2012 12/9/2012 2,100 2,095
LIN National Meeting 12/5/2012 12/10/2012 12/14/2012 12/15/2012 2,137 6,844
A-4
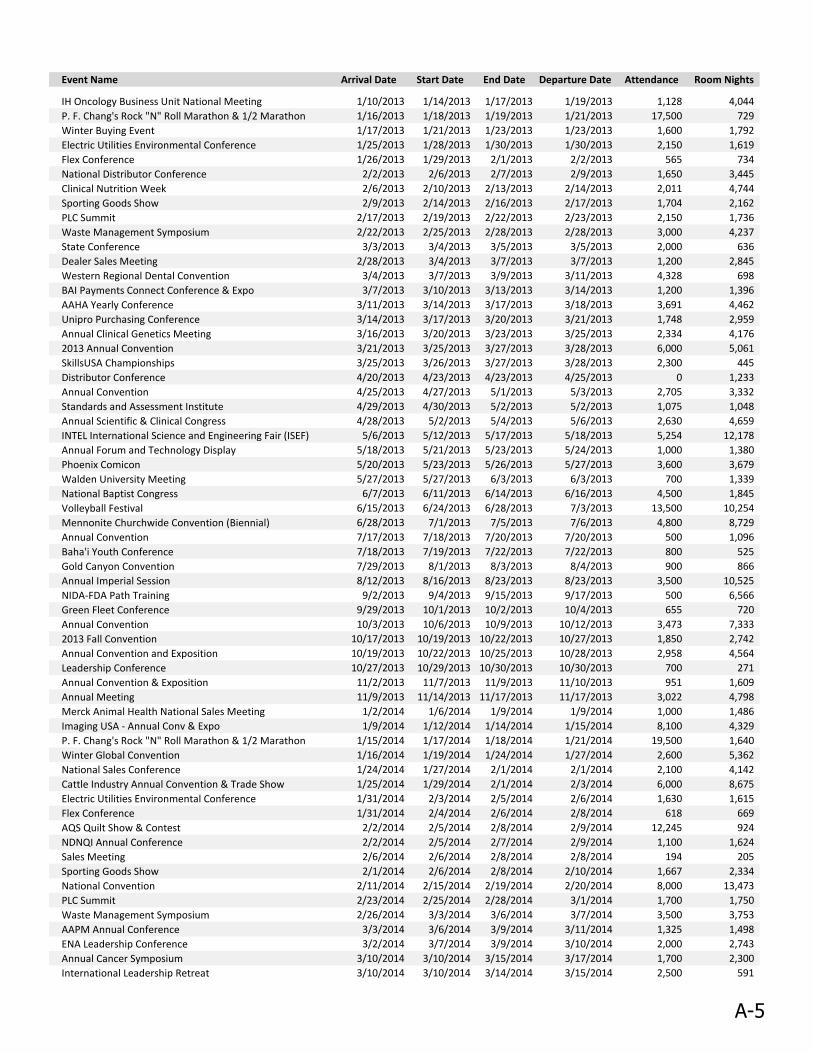
Event Name Arrival Date Start Date End Date Departure Date Attendance Room Nights
IH Oncology Business Unit National Meeting 1/10/2013 1/14/2013 1/17/2013 1/19/2013 1,128 4,044
P. F. Chang's Rock "N" Roll Marathon & 1/2 Marathon 1/16/2013 1/18/2013 1/19/2013 1/21/2013 17,500 729
Winter Buying Event 1/17/2013 1/21/2013 1/23/2013 1/23/2013 1,600 1,792
Electric Utilities Environmental Conference 1/25/2013 1/28/2013 1/30/2013 1/30/2013 2,150 1,619
Flex Conference 1/26/2013 1/29/2013 2/1/2013 2/2/2013 565 734
National Distributor Conference 2/2/2013 2/6/2013 2/7/2013 2/9/2013 1,650 3,445
Clinical Nutrition Week 2/6/2013 2/10/2013 2/13/2013 2/14/2013 2,011 4,744
Sporting Goods Show 2/9/2013 2/14/2013 2/16/2013 2/17/2013 1,704 2,162
PLC Summit 2/17/2013 2/19/2013 2/22/2013 2/23/2013 2,150 1,736
Waste Management Symposium 2/22/2013 2/25/2013 2/28/2013 2/28/2013 3,000 4,237
State Conference 3/3/2013 3/4/2013 3/5/2013 3/5/2013 2,000 636
Dealer Sales Meeting 2/28/2013 3/4/2013 3/7/2013 3/7/2013 1,200 2,845
Western Regional Dental Convention 3/4/2013 3/7/2013 3/9/2013 3/11/2013 4,328 698
BAI Payments Connect Conference & Expo 3/7/2013 3/10/2013 3/13/2013 3/14/2013 1,200 1,396
AAHA Yearly Conference 3/11/2013 3/14/2013 3/17/2013 3/18/2013 3,691 4,462
Unipro Purchasing Conference 3/14/2013 3/17/2013 3/20/2013 3/21/2013 1,748 2,959
Annual Clinical Genetics Meeting 3/16/2013 3/20/2013 3/23/2013 3/25/2013 2,334 4,176
2013 Annual Convention 3/21/2013 3/25/2013 3/27/2013 3/28/2013 6,000 5,061
SkillsUSA Championships 3/25/2013 3/26/2013 3/27/2013 3/28/2013 2,300 445
Distributor Conference 4/20/2013 4/23/2013 4/23/2013 4/25/2013 0 1,233
Annual Convention 4/25/2013 4/27/2013 5/1/2013 5/3/2013 2,705 3,332
Standards and Assessment Institute 4/29/2013 4/30/2013 5/2/2013 5/2/2013 1,075 1,048
Annual Scientific & Clinical Congress 4/28/2013 5/2/2013 5/4/2013 5/6/2013 2,630 4,659
INTEL International Science and Engineering Fair (ISEF) 5/6/2013 5/12/2013 5/17/2013 5/18/2013 5,254 12,178
Annual Forum and Technology Display 5/18/2013 5/21/2013 5/23/2013 5/24/2013 1,000 1,380
Phoenix Comicon 5/20/2013 5/23/2013 5/26/2013 5/27/2013 3,600 3,679
Walden University Meeting 5/27/2013 5/27/2013 6/3/2013 6/3/2013 700 1,339
National Baptist Congress 6/7/2013 6/11/2013 6/14/2013 6/16/2013 4,500 1,845
Volleyball Festival 6/15/2013 6/24/2013 6/28/2013 7/3/2013 13,500 10,254
Mennonite Churchwide Convention (Biennial) 6/28/2013 7/1/2013 7/5/2013 7/6/2013 4,800 8,729
Annual Convention 7/17/2013 7/18/2013 7/20/2013 7/20/2013 500 1,096
Baha'i Youth Conference 7/18/2013 7/19/2013 7/22/2013 7/22/2013 800 525
Gold Canyon Convention 7/29/2013 8/1/2013 8/3/2013 8/4/2013 900 866
Annual Imperial Session 8/12/2013 8/16/2013 8/23/2013 8/23/2013 3,500 10,525
NIDA-FDA Path Training 9/2/2013 9/4/2013 9/15/2013 9/17/2013 500 6,566
Green Fleet Conference 9/29/2013 10/1/2013 10/2/2013 10/4/2013 655 720
Annual Convention 10/3/2013 10/6/2013 10/9/2013 10/12/2013 3,473 7,333
2013 Fall Convention 10/17/2013 10/19/2013 10/22/2013 10/27/2013 1,850 2,742
Annual Convention and Exposition 10/19/2013 10/22/2013 10/25/2013 10/28/2013 2,958 4,564
Leadership Conference 10/27/2013 10/29/2013 10/30/2013 10/30/2013 700 271
Annual Convention & Exposition 11/2/2013 11/7/2013 11/9/2013 11/10/2013 951 1,609
Annual Meeting 11/9/2013 11/14/2013 11/17/2013 11/17/2013 3,022 4,798
Merck Animal Health National Sales Meeting 1/2/2014 1/6/2014 1/9/2014 1/9/2014 1,000 1,486
Imaging USA - Annual Conv & Expo 1/9/2014 1/12/2014 1/14/2014 1/15/2014 8,100 4,329
P. F. Chang's Rock "N" Roll Marathon & 1/2 Marathon 1/15/2014 1/17/2014 1/18/2014 1/21/2014 19,500 1,640
Winter Global Convention 1/16/2014 1/19/2014 1/24/2014 1/27/2014 2,600 5,362
National Sales Conference 1/24/2014 1/27/2014 2/1/2014 2/1/2014 2,100 4,142
Cattle Industry Annual Convention & Trade Show 1/25/2014 1/29/2014 2/1/2014 2/3/2014 6,000 8,675
Electric Utilities Environmental Conference 1/31/2014 2/3/2014 2/5/2014 2/6/2014 1,630 1,615
Flex Conference 1/31/2014 2/4/2014 2/6/2014 2/8/2014 618 669
AQS Quilt Show & Contest 2/2/2014 2/5/2014 2/8/2014 2/9/2014 12,245 924
NDNQI Annual Conference 2/2/2014 2/5/2014 2/7/2014 2/9/2014 1,100 1,624
Sales Meeting 2/6/2014 2/6/2014 2/8/2014 2/8/2014 194 205
Sporting Goods Show 2/1/2014 2/6/2014 2/8/2014 2/10/2014 1,667 2,334
National Convention 2/11/2014 2/15/2014 2/19/2014 2/20/2014 8,000 13,473
PLC Summit 2/23/2014 2/25/2014 2/28/2014 3/1/2014 1,700 1,750
Waste Management Symposium 2/26/2014 3/3/2014 3/6/2014 3/7/2014 3,500 3,753
AAPM Annual Conference 3/3/2014 3/6/2014 3/9/2014 3/11/2014 1,325 1,498
ENA Leadership Conference 3/2/2014 3/7/2014 3/9/2014 3/10/2014 2,000 2,743
Annual Cancer Symposium 3/10/2014 3/10/2014 3/15/2014 3/17/2014 1,700 2,300
International Leadership Retreat 3/10/2014 3/10/2014 3/14/2014 3/15/2014 2,500 591
A-5
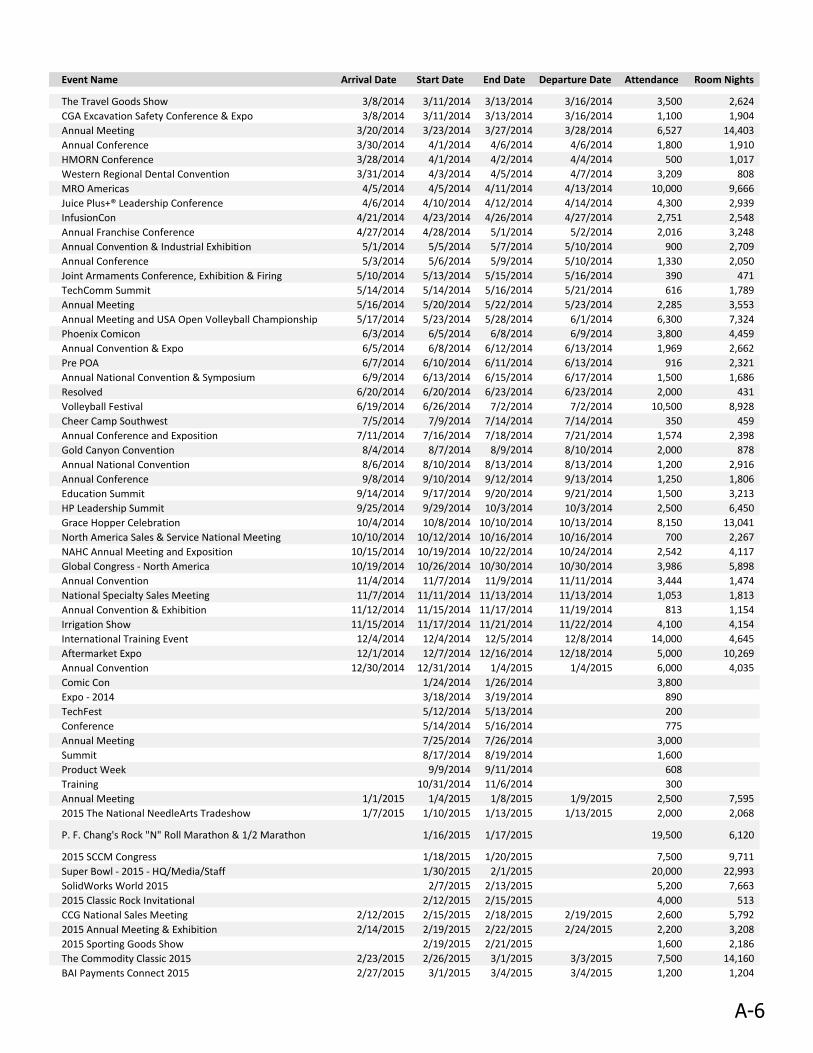
Event Name Arrival Date Start Date End Date Departure Date Attendance Room Nights
The Travel Goods Show 3/8/2014 3/11/2014 3/13/2014 3/16/2014 3,500 2,624
CGA Excavation Safety Conference & Expo 3/8/2014 3/11/2014 3/13/2014 3/16/2014 1,100 1,904
Annual Meeting 3/20/2014 3/23/2014 3/27/2014 3/28/2014 6,527 14,403
Annual Conference 3/30/2014 4/1/2014 4/6/2014 4/6/2014 1,800 1,910
HMORN Conference 3/28/2014 4/1/2014 4/2/2014 4/4/2014 500 1,017
Western Regional Dental Convention 3/31/2014 4/3/2014 4/5/2014 4/7/2014 3,209 808
MRO Americas 4/5/2014 4/5/2014 4/11/2014 4/13/2014 10,000 9,666
Juice Plus+® Leadership Conference 4/6/2014 4/10/2014 4/12/2014 4/14/2014 4,300 2,939
InfusionCon 4/21/2014 4/23/2014 4/26/2014 4/27/2014 2,751 2,548
Annual Franchise Conference 4/27/2014 4/28/2014 5/1/2014 5/2/2014 2,016 3,248
Annual Convention & Industrial Exhibition 5/1/2014 5/5/2014 5/7/2014 5/10/2014 900 2,709
Annual Conference 5/3/2014 5/6/2014 5/9/2014 5/10/2014 1,330 2,050
Joint Armaments Conference, Exhibition & Firing 5/10/2014 5/13/2014 5/15/2014 5/16/2014 390 471
TechComm Summit 5/14/2014 5/14/2014 5/16/2014 5/21/2014 616 1,789
Annual Meeting 5/16/2014 5/20/2014 5/22/2014 5/23/2014 2,285 3,553
Annual Meeting and USA Open Volleyball Championship 5/17/2014 5/23/2014 5/28/2014 6/1/2014 6,300 7,324
Phoenix Comicon 6/3/2014 6/5/2014 6/8/2014 6/9/2014 3,800 4,459
Annual Convention & Expo 6/5/2014 6/8/2014 6/12/2014 6/13/2014 1,969 2,662
Pre POA 6/7/2014 6/10/2014 6/11/2014 6/13/2014 916 2,321
Annual National Convention & Symposium 6/9/2014 6/13/2014 6/15/2014 6/17/2014 1,500 1,686
Resolved 6/20/2014 6/20/2014 6/23/2014 6/23/2014 2,000 431
Volleyball Festival 6/19/2014 6/26/2014 7/2/2014 7/2/2014 10,500 8,928
Cheer Camp Southwest 7/5/2014 7/9/2014 7/14/2014 7/14/2014 350 459
Annual Conference and Exposition 7/11/2014 7/16/2014 7/18/2014 7/21/2014 1,574 2,398
Gold Canyon Convention 8/4/2014 8/7/2014 8/9/2014 8/10/2014 2,000 878
Annual National Convention 8/6/2014 8/10/2014 8/13/2014 8/13/2014 1,200 2,916
Annual Conference 9/8/2014 9/10/2014 9/12/2014 9/13/2014 1,250 1,806
Education Summit 9/14/2014 9/17/2014 9/20/2014 9/21/2014 1,500 3,213
HP Leadership Summit 9/25/2014 9/29/2014 10/3/2014 10/3/2014 2,500 6,450
Grace Hopper Celebration 10/4/2014 10/8/2014 10/10/2014 10/13/2014 8,150 13,041
North America Sales & Service National Meeting 10/10/2014 10/12/2014 10/16/2014 10/16/2014 700 2,267
NAHC Annual Meeting and Exposition 10/15/2014 10/19/2014 10/22/2014 10/24/2014 2,542 4,117
Global Congress - North America 10/19/2014 10/26/2014 10/30/2014 10/30/2014 3,986 5,898
Annual Convention 11/4/2014 11/7/2014 11/9/2014 11/11/2014 3,444 1,474
National Specialty Sales Meeting 11/7/2014 11/11/2014 11/13/2014 11/13/2014 1,053 1,813
Annual Convention & Exhibition 11/12/2014 11/15/2014 11/17/2014 11/19/2014 813 1,154
Irrigation Show 11/15/2014 11/17/2014 11/21/2014 11/22/2014 4,100 4,154
International Training Event 12/4/2014 12/4/2014 12/5/2014 12/8/2014 14,000 4,645
Aftermarket Expo 12/1/2014 12/7/2014 12/16/2014 12/18/2014 5,000 10,269
Annual Convention 12/30/2014 12/31/2014 1/4/2015 1/4/2015 6,000 4,035
Comic Con 1/24/2014 1/26/2014 3,800
Expo - 2014 3/18/2014 3/19/2014 890
TechFest 5/12/2014 5/13/2014 200
Conference 5/14/2014 5/16/2014 775
Annual Meeting 7/25/2014 7/26/2014 3,000
Summit 8/17/2014 8/19/2014 1,600
Product Week 9/9/2014 9/11/2014 608
Training 10/31/2014 11/6/2014 300
Annual Meeting 1/1/2015 1/4/2015 1/8/2015 1/9/2015 2,500 7,595
2015 The National NeedleArts Tradeshow 1/7/2015 1/10/2015 1/13/2015 1/13/2015 2,000 2,068
P. F. Chang's Rock "N" Roll Marathon & 1/2 Marathon 1/16/2015 1/17/2015 19,500 6,120
2015 SCCM Congress 1/18/2015 1/20/2015 7,500 9,711
Super Bowl - 2015 - HQ/Media/Staff 1/30/2015 2/1/2015 20,000 22,993
SolidWorks World 2015 2/7/2015 2/13/2015 5,200 7,663
2015 Classic Rock Invitational 2/12/2015 2/15/2015 4,000 513
CCG National Sales Meeting 2/12/2015 2/15/2015 2/18/2015 2/19/2015 2,600 5,792
2015 Annual Meeting & Exhibition 2/14/2015 2/19/2015 2/22/2015 2/24/2015 2,200 3,208
2015 Sporting Goods Show 2/19/2015 2/21/2015 1,600 2,186
The Commodity Classic 2015 2/23/2015 2/26/2015 3/1/2015 3/3/2015 7,500 14,160
BAI Payments Connect 2015 2/27/2015 3/1/2015 3/4/2015 3/4/2015 1,200 1,204
A-6
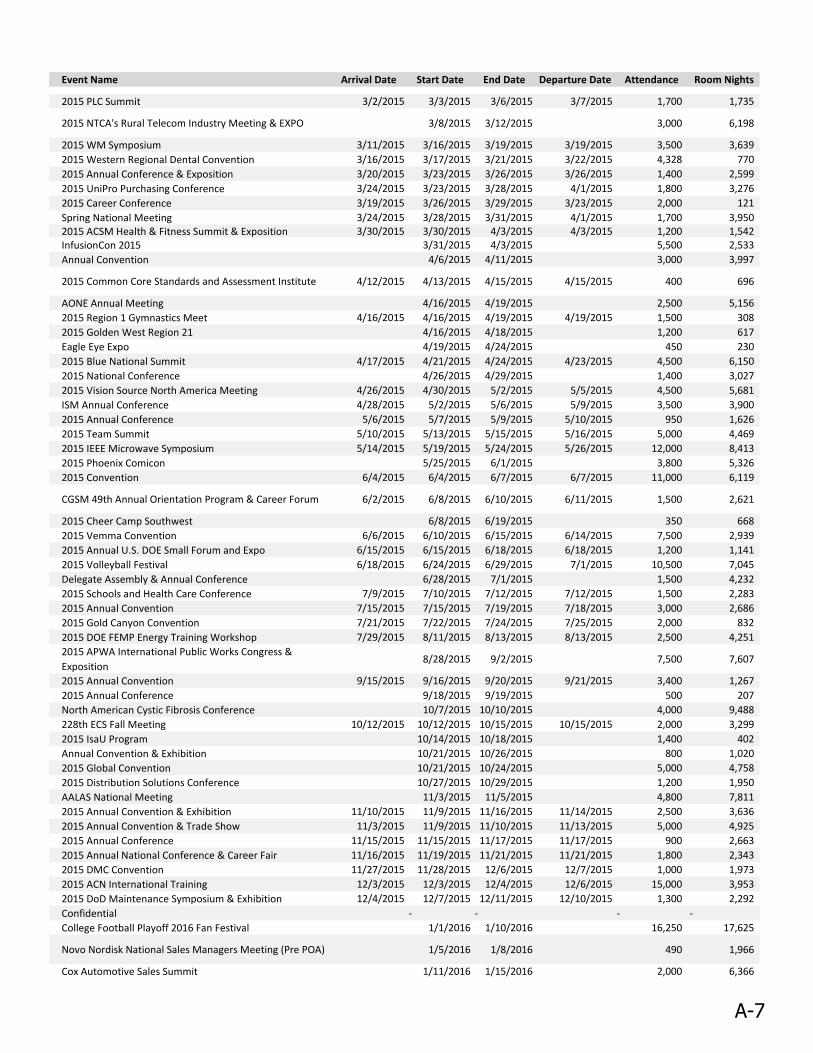
Event Name Arrival Date Start Date End Date Departure Date Attendance Room Nights
2015 PLC Summit 3/2/2015 3/3/2015 3/6/2015 3/7/2015 1,700 1,735
2015 NTCA's Rural Telecom Industry Meeting & EXPO 3/8/2015 3/12/2015 3,000 6,198
2015 WM Symposium 3/11/2015 3/16/2015 3/19/2015 3/19/2015 3,500 3,639
2015 Western Regional Dental Convention 3/16/2015 3/17/2015 3/21/2015 3/22/2015 4,328 770
2015 Annual Conference & Exposition 3/20/2015 3/23/2015 3/26/2015 3/26/2015 1,400 2,599
2015 UniPro Purchasing Conference 3/24/2015 3/23/2015 3/28/2015 4/1/2015 1,800 3,276
2015 Career Conference 3/19/2015 3/26/2015 3/29/2015 3/23/2015 2,000 121
Spring National Meeting 3/24/2015 3/28/2015 3/31/2015 4/1/2015 1,700 3,9502015 ACSM Health & Fitness Summit & Exposition 3/30/2015 3/30/2015 4/3/2015 4/3/2015 1,200 1,542InfusionCon 2015 3/31/2015 4/3/2015 5,500 2,533
Annual Convention 4/6/2015 4/11/2015 3,000 3,997
2015 Common Core Standards and Assessment Institute 4/12/2015 4/13/2015 4/15/2015 4/15/2015 400 696
AONE Annual Meeting 4/16/2015 4/19/2015 2,500 5,156
2015 Region 1 Gymnastics Meet 4/16/2015 4/16/2015 4/19/2015 4/19/2015 1,500 308
2015 Golden West Region 21 4/16/2015 4/18/2015 1,200 617
Eagle Eye Expo 4/19/2015 4/24/2015 450 230
2015 Blue National Summit 4/17/2015 4/21/2015 4/24/2015 4/23/2015 4,500 6,150
2015 National Conference 4/26/2015 4/29/2015 1,400 3,027
2015 Vision Source North America Meeting 4/26/2015 4/30/2015 5/2/2015 5/5/2015 4,500 5,681
ISM Annual Conference 4/28/2015 5/2/2015 5/6/2015 5/9/2015 3,500 3,900
2015 Annual Conference 5/6/2015 5/7/2015 5/9/2015 5/10/2015 950 1,626
2015 Team Summit 5/10/2015 5/13/2015 5/15/2015 5/16/2015 5,000 4,469
2015 IEEE Microwave Symposium 5/14/2015 5/19/2015 5/24/2015 5/26/2015 12,000 8,413
2015 Phoenix Comicon 5/25/2015 6/1/2015 3,800 5,326
2015 Convention 6/4/2015 6/4/2015 6/7/2015 6/7/2015 11,000 6,119
CGSM 49th Annual Orientation Program & Career Forum 6/2/2015 6/8/2015 6/10/2015 6/11/2015 1,500 2,621
2015 Cheer Camp Southwest 6/8/2015 6/19/2015 350 668
2015 Vemma Convention 6/6/2015 6/10/2015 6/15/2015 6/14/2015 7,500 2,939
2015 Annual U.S. DOE Small Forum and Expo 6/15/2015 6/15/2015 6/18/2015 6/18/2015 1,200 1,141
2015 Volleyball Festival 6/18/2015 6/24/2015 6/29/2015 7/1/2015 10,500 7,045
Delegate Assembly & Annual Conference 6/28/2015 7/1/2015 1,500 4,232
2015 Schools and Health Care Conference 7/9/2015 7/10/2015 7/12/2015 7/12/2015 1,500 2,283
2015 Annual Convention 7/15/2015 7/15/2015 7/19/2015 7/18/2015 3,000 2,686
2015 Gold Canyon Convention 7/21/2015 7/22/2015 7/24/2015 7/25/2015 2,000 832
2015 DOE FEMP Energy Training Workshop 7/29/2015 8/11/2015 8/13/2015 8/13/2015 2,500 4,251
2015 APWA International Public Works Congress &
Exposition8/28/2015 9/2/2015 7,500 7,607
2015 Annual Convention 9/15/2015 9/16/2015 9/20/2015 9/21/2015 3,400 1,267
2015 Annual Conference 9/18/2015 9/19/2015 500 207
North American Cystic Fibrosis Conference 10/7/2015 10/10/2015 4,000 9,488
228th ECS Fall Meeting 10/12/2015 10/12/2015 10/15/2015 10/15/2015 2,000 3,299
2015 IsaU Program 10/14/2015 10/18/2015 1,400 402
Annual Convention & Exhibition 10/21/2015 10/26/2015 800 1,020
2015 Global Convention 10/21/2015 10/24/2015 5,000 4,758
2015 Distribution Solutions Conference 10/27/2015 10/29/2015 1,200 1,950
AALAS National Meeting 11/3/2015 11/5/2015 4,800 7,811
2015 Annual Convention & Exhibition 11/10/2015 11/9/2015 11/16/2015 11/14/2015 2,500 3,636
2015 Annual Convention & Trade Show 11/3/2015 11/9/2015 11/10/2015 11/13/2015 5,000 4,925
2015 Annual Conference 11/15/2015 11/15/2015 11/17/2015 11/17/2015 900 2,663
2015 Annual National Conference & Career Fair 11/16/2015 11/19/2015 11/21/2015 11/21/2015 1,800 2,343
2015 DMC Convention 11/27/2015 11/28/2015 12/6/2015 12/7/2015 1,000 1,973
2015 ACN International Training 12/3/2015 12/3/2015 12/4/2015 12/6/2015 15,000 3,953
2015 DoD Maintenance Symposium & Exhibition 12/4/2015 12/7/2015 12/11/2015 12/10/2015 1,300 2,292
Confidential - - - -
College Football Playoff 2016 Fan Festival 1/1/2016 1/10/2016 16,250 17,625
Novo Nordisk National Sales Managers Meeting (Pre POA) 1/5/2016 1/8/2016 490 1,966
Cox Automotive Sales Summit 1/11/2016 1/15/2016 2,000 6,366
A-7
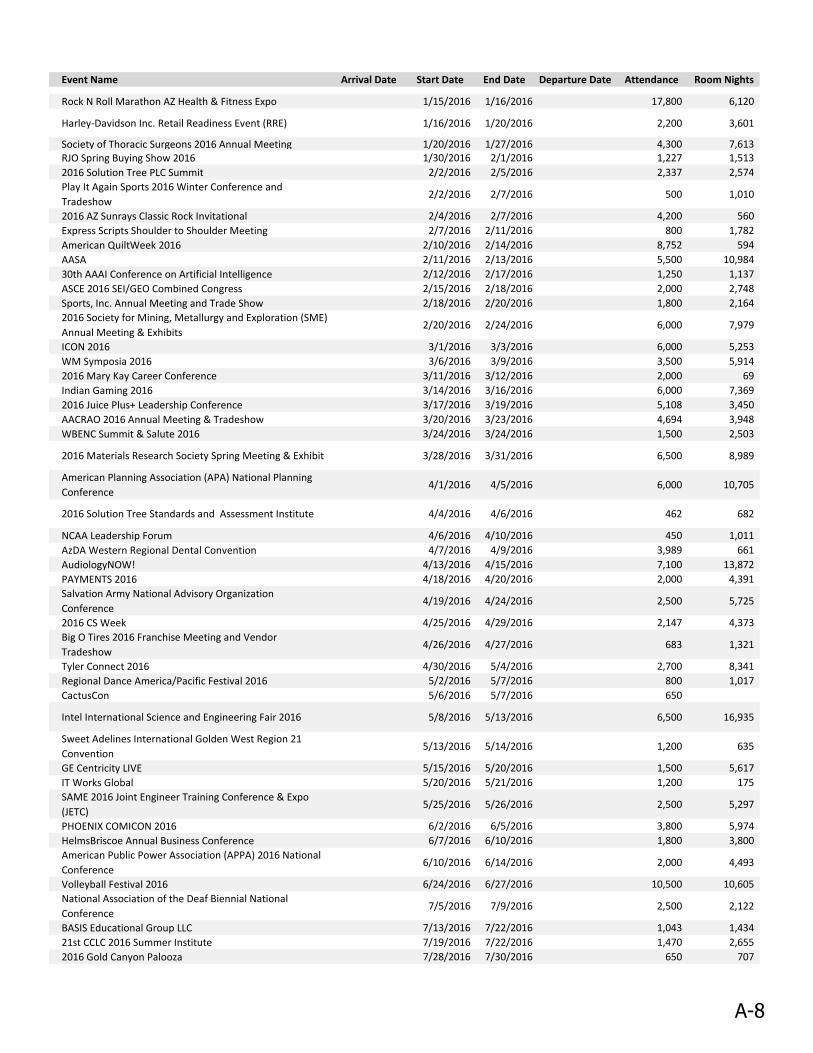
Event Name Arrival Date Start Date End Date Departure Date Attendance Room Nights
Rock N Roll Marathon AZ Health & Fitness Expo 1/15/2016 1/16/2016 17,800 6,120
Harley-Davidson Inc. Retail Readiness Event (RRE) 1/16/2016 1/20/2016 2,200 3,601
Society of Thoracic Surgeons 2016 Annual Meeting 1/20/2016 1/27/2016 4,300 7,613RJO Spring Buying Show 2016 1/30/2016 2/1/2016 1,227 1,513
2016 Solution Tree PLC Summit 2/2/2016 2/5/2016 2,337 2,574
Play It Again Sports 2016 Winter Conference and
Tradeshow2/2/2016 2/7/2016 500 1,010
2016 AZ Sunrays Classic Rock Invitational 2/4/2016 2/7/2016 4,200 560
Express Scripts Shoulder to Shoulder Meeting 2/7/2016 2/11/2016 800 1,782
American QuiltWeek 2016 2/10/2016 2/14/2016 8,752 594
AASA 2/11/2016 2/13/2016 5,500 10,984
30th AAAI Conference on Artificial Intelligence 2/12/2016 2/17/2016 1,250 1,137
ASCE 2016 SEI/GEO Combined Congress 2/15/2016 2/18/2016 2,000 2,748
Sports, Inc. Annual Meeting and Trade Show 2/18/2016 2/20/2016 1,800 2,164
2016 Society for Mining, Metallurgy and Exploration (SME)
Annual Meeting & Exhibits2/20/2016 2/24/2016 6,000 7,979
ICON 2016 3/1/2016 3/3/2016 6,000 5,253
WM Symposia 2016 3/6/2016 3/9/2016 3,500 5,914
2016 Mary Kay Career Conference 3/11/2016 3/12/2016 2,000 69
Indian Gaming 2016 3/14/2016 3/16/2016 6,000 7,369
2016 Juice Plus+ Leadership Conference 3/17/2016 3/19/2016 5,108 3,450
AACRAO 2016 Annual Meeting & Tradeshow 3/20/2016 3/23/2016 4,694 3,948
WBENC Summit & Salute 2016 3/24/2016 3/24/2016 1,500 2,503
2016 Materials Research Society Spring Meeting & Exhibit 3/28/2016 3/31/2016 6,500 8,989
American Planning Association (APA) National Planning
Conference4/1/2016 4/5/2016 6,000 10,705
2016 Solution Tree Standards and Assessment Institute 4/4/2016 4/6/2016 462 682
NCAA Leadership Forum 4/6/2016 4/10/2016 450 1,011
AzDA Western Regional Dental Convention 4/7/2016 4/9/2016 3,989 661
AudiologyNOW! 4/13/2016 4/15/2016 7,100 13,872
PAYMENTS 2016 4/18/2016 4/20/2016 2,000 4,391
Salvation Army National Advisory Organization
Conference4/19/2016 4/24/2016 2,500 5,725
2016 CS Week 4/25/2016 4/29/2016 2,147 4,373
Big O Tires 2016 Franchise Meeting and Vendor
Tradeshow4/26/2016 4/27/2016 683 1,321
Tyler Connect 2016 4/30/2016 5/4/2016 2,700 8,341
Regional Dance America/Pacific Festival 2016 5/2/2016 5/7/2016 800 1,017
CactusCon 5/6/2016 5/7/2016 650
Intel International Science and Engineering Fair 2016 5/8/2016 5/13/2016 6,500 16,935
Sweet Adelines International Golden West Region 21
Convention5/13/2016 5/14/2016 1,200 635
GE Centricity LIVE 5/15/2016 5/20/2016 1,500 5,617
IT Works Global 5/20/2016 5/21/2016 1,200 175
SAME 2016 Joint Engineer Training Conference & Expo
(JETC)5/25/2016 5/26/2016 2,500 5,297
PHOENIX COMICON 2016 6/2/2016 6/5/2016 3,800 5,974
HelmsBriscoe Annual Business Conference 6/7/2016 6/10/2016 1,800 3,800
American Public Power Association (APPA) 2016 National
Conference6/10/2016 6/14/2016 2,000 4,493
Volleyball Festival 2016 6/24/2016 6/27/2016 10,500 10,605
National Association of the Deaf Biennial National
Conference7/5/2016 7/9/2016 2,500 2,122
BASIS Educational Group LLC 7/13/2016 7/22/2016 1,043 1,434
21st CCLC 2016 Summer Institute 7/19/2016 7/22/2016 1,470 2,655
2016 Gold Canyon Palooza 7/28/2016 7/30/2016 650 707
A-8
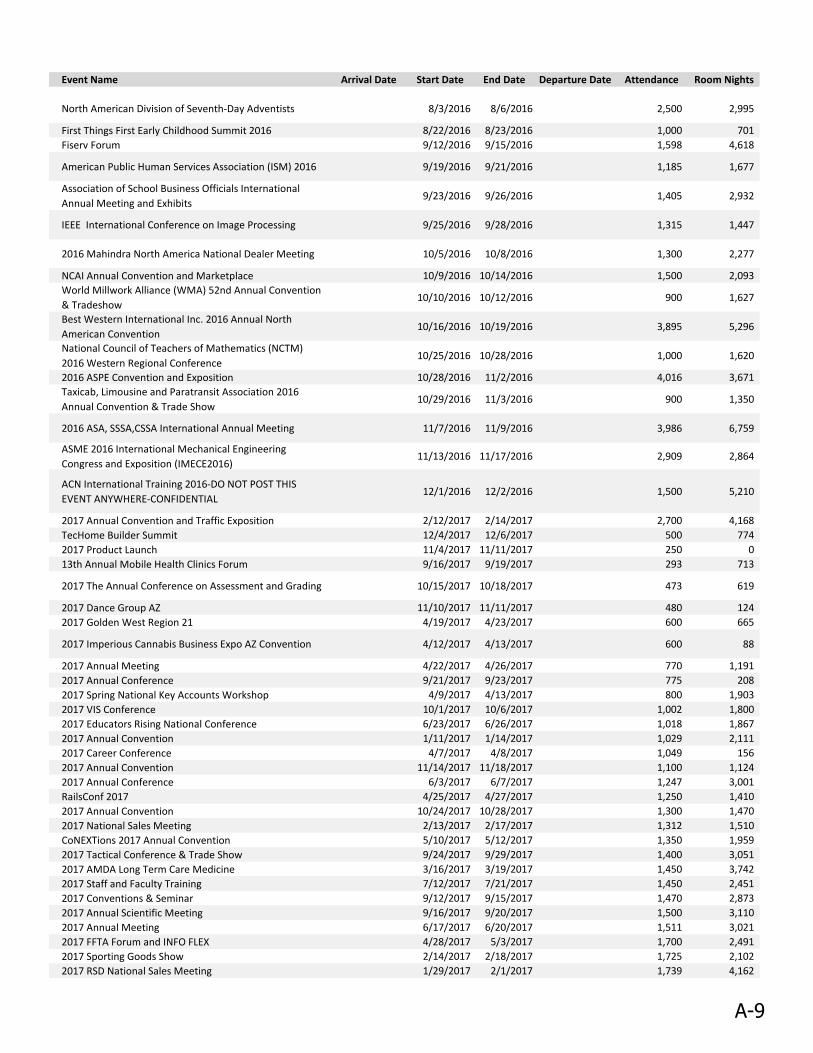
Event Name Arrival Date Start Date End Date Departure Date Attendance Room Nights
North American Division of Seventh-Day Adventists 8/3/2016 8/6/2016 2,500 2,995
First Things First Early Childhood Summit 2016 8/22/2016 8/23/2016 1,000 701
Fiserv Forum 9/12/2016 9/15/2016 1,598 4,618
American Public Human Services Association (ISM) 2016 9/19/2016 9/21/2016 1,185 1,677
Association of School Business Officials International
Annual Meeting and Exhibits9/23/2016 9/26/2016 1,405 2,932
IEEE International Conference on Image Processing 9/25/2016 9/28/2016 1,315 1,447
2016 Mahindra North America National Dealer Meeting 10/5/2016 10/8/2016 1,300 2,277
NCAI Annual Convention and Marketplace 10/9/2016 10/14/2016 1,500 2,093
World Millwork Alliance (WMA) 52nd Annual Convention
& Tradeshow10/10/2016 10/12/2016 900 1,627
Best Western International Inc. 2016 Annual North
American Convention10/16/2016 10/19/2016 3,895 5,296
National Council of Teachers of Mathematics (NCTM)
2016 Western Regional Conference10/25/2016 10/28/2016 1,000 1,620
2016 ASPE Convention and Exposition 10/28/2016 11/2/2016 4,016 3,671
Taxicab, Limousine and Paratransit Association 2016
Annual Convention & Trade Show10/29/2016 11/3/2016 900 1,350
2016 ASA, SSSA,CSSA International Annual Meeting 11/7/2016 11/9/2016 3,986 6,759
ASME 2016 International Mechanical Engineering
Congress and Exposition (IMECE2016)11/13/2016 11/17/2016 2,909 2,864
ACN International Training 2016-DO NOT POST THIS
EVENT ANYWHERE-CONFIDENTIAL12/1/2016 12/2/2016 1,500 5,210
2017 Annual Convention and Traffic Exposition 2/12/2017 2/14/2017 2,700 4,168
TecHome Builder Summit 12/4/2017 12/6/2017 500 774
2017 Product Launch 11/4/2017 11/11/2017 250 0
13th Annual Mobile Health Clinics Forum 9/16/2017 9/19/2017 293 713
2017 The Annual Conference on Assessment and Grading 10/15/2017 10/18/2017 473 619
2017 Dance Group AZ 11/10/2017 11/11/2017 480 124
2017 Golden West Region 21 4/19/2017 4/23/2017 600 665
2017 Imperious Cannabis Business Expo AZ Convention 4/12/2017 4/13/2017 600 88
2017 Annual Meeting 4/22/2017 4/26/2017 770 1,191
2017 Annual Conference 9/21/2017 9/23/2017 775 208
2017 Spring National Key Accounts Workshop 4/9/2017 4/13/2017 800 1,903
2017 VIS Conference 10/1/2017 10/6/2017 1,002 1,800
2017 Educators Rising National Conference 6/23/2017 6/26/2017 1,018 1,867
2017 Annual Convention 1/11/2017 1/14/2017 1,029 2,111
2017 Career Conference 4/7/2017 4/8/2017 1,049 156
2017 Annual Convention 11/14/2017 11/18/2017 1,100 1,124
2017 Annual Conference 6/3/2017 6/7/2017 1,247 3,001
RailsConf 2017 4/25/2017 4/27/2017 1,250 1,410
2017 Annual Convention 10/24/2017 10/28/2017 1,300 1,470
2017 National Sales Meeting 2/13/2017 2/17/2017 1,312 1,510
CoNEXTions 2017 Annual Convention 5/10/2017 5/12/2017 1,350 1,959
2017 Tactical Conference & Trade Show 9/24/2017 9/29/2017 1,400 3,051
2017 AMDA Long Term Care Medicine 3/16/2017 3/19/2017 1,450 3,742
2017 Staff and Faculty Training 7/12/2017 7/21/2017 1,450 2,451
2017 Conventions & Seminar 9/12/2017 9/15/2017 1,470 2,873
2017 Annual Scientific Meeting 9/16/2017 9/20/2017 1,500 3,110
2017 Annual Meeting 6/17/2017 6/20/2017 1,511 3,021
2017 FFTA Forum and INFO FLEX 4/28/2017 5/3/2017 1,700 2,491
2017 Sporting Goods Show 2/14/2017 2/18/2017 1,725 2,102
2017 RSD National Sales Meeting 1/29/2017 2/1/2017 1,739 4,162
A-9
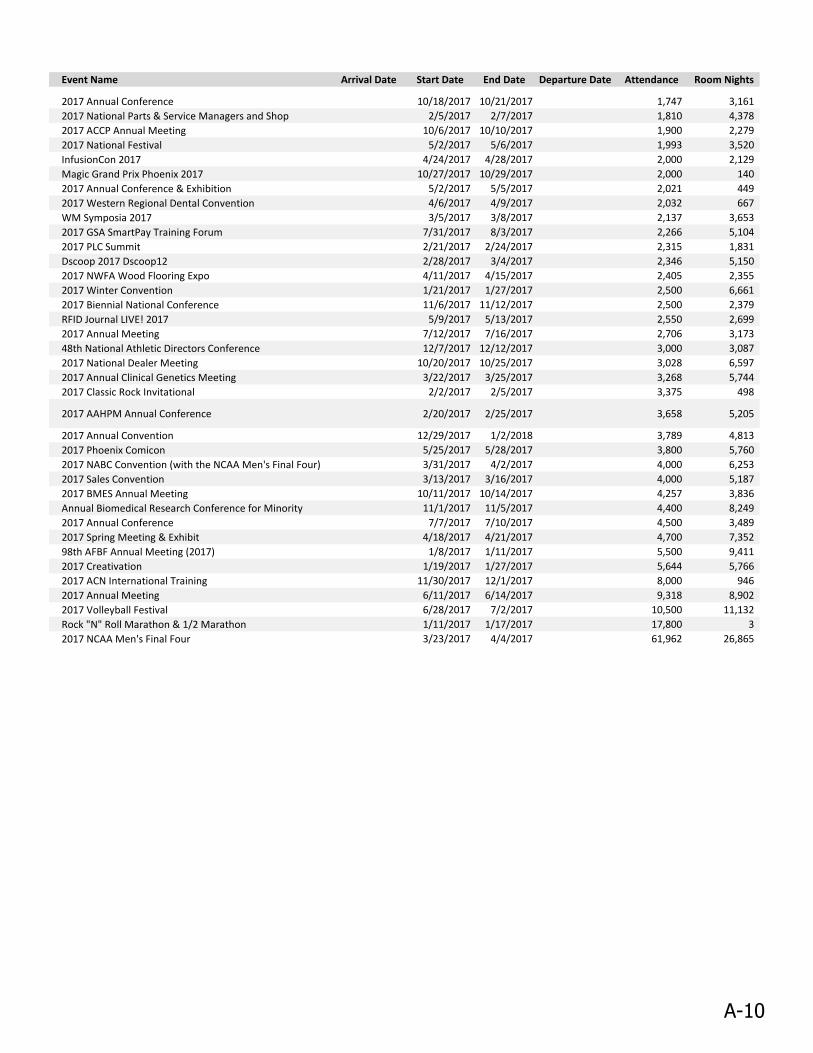
Event Name Arrival Date Start Date End Date Departure Date Attendance Room Nights
2017 Annual Conference 10/18/2017 10/21/2017 1,747 3,161
2017 National Parts & Service Managers and Shop 2/5/2017 2/7/2017 1,810 4,378
2017 ACCP Annual Meeting 10/6/2017 10/10/2017 1,900 2,279
2017 National Festival 5/2/2017 5/6/2017 1,993 3,520
InfusionCon 2017 4/24/2017 4/28/2017 2,000 2,129
Magic Grand Prix Phoenix 2017 10/27/2017 10/29/2017 2,000 140
2017 Annual Conference & Exhibition 5/2/2017 5/5/2017 2,021 449
2017 Western Regional Dental Convention 4/6/2017 4/9/2017 2,032 667
WM Symposia 2017 3/5/2017 3/8/2017 2,137 3,653
2017 GSA SmartPay Training Forum 7/31/2017 8/3/2017 2,266 5,104
2017 PLC Summit 2/21/2017 2/24/2017 2,315 1,831
Dscoop 2017 Dscoop12 2/28/2017 3/4/2017 2,346 5,150
2017 NWFA Wood Flooring Expo 4/11/2017 4/15/2017 2,405 2,355
2017 Winter Convention 1/21/2017 1/27/2017 2,500 6,661
2017 Biennial National Conference 11/6/2017 11/12/2017 2,500 2,379
RFID Journal LIVE! 2017 5/9/2017 5/13/2017 2,550 2,699
2017 Annual Meeting 7/12/2017 7/16/2017 2,706 3,173
48th National Athletic Directors Conference 12/7/2017 12/12/2017 3,000 3,087
2017 National Dealer Meeting 10/20/2017 10/25/2017 3,028 6,597
2017 Annual Clinical Genetics Meeting 3/22/2017 3/25/2017 3,268 5,744
2017 Classic Rock Invitational 2/2/2017 2/5/2017 3,375 498
2017 AAHPM Annual Conference 2/20/2017 2/25/2017 3,658 5,205
2017 Annual Convention 12/29/2017 1/2/2018 3,789 4,813
2017 Phoenix Comicon 5/25/2017 5/28/2017 3,800 5,760
2017 NABC Convention (with the NCAA Men's Final Four) 3/31/2017 4/2/2017 4,000 6,253
2017 Sales Convention 3/13/2017 3/16/2017 4,000 5,187
2017 BMES Annual Meeting 10/11/2017 10/14/2017 4,257 3,836
Annual Biomedical Research Conference for Minority 11/1/2017 11/5/2017 4,400 8,249
2017 Annual Conference 7/7/2017 7/10/2017 4,500 3,489
2017 Spring Meeting & Exhibit 4/18/2017 4/21/2017 4,700 7,352
98th AFBF Annual Meeting (2017) 1/8/2017 1/11/2017 5,500 9,411
2017 Creativation 1/19/2017 1/27/2017 5,644 5,766
2017 ACN International Training 11/30/2017 12/1/2017 8,000 946
2017 Annual Meeting 6/11/2017 6/14/2017 9,318 8,902
2017 Volleyball Festival 6/28/2017 7/2/2017 10,500 11,132
Rock "N" Roll Marathon & 1/2 Marathon 1/11/2017 1/17/2017 17,800 3
2017 NCAA Men's Final Four 3/23/2017 4/4/2017 61,962 26,865
A-10
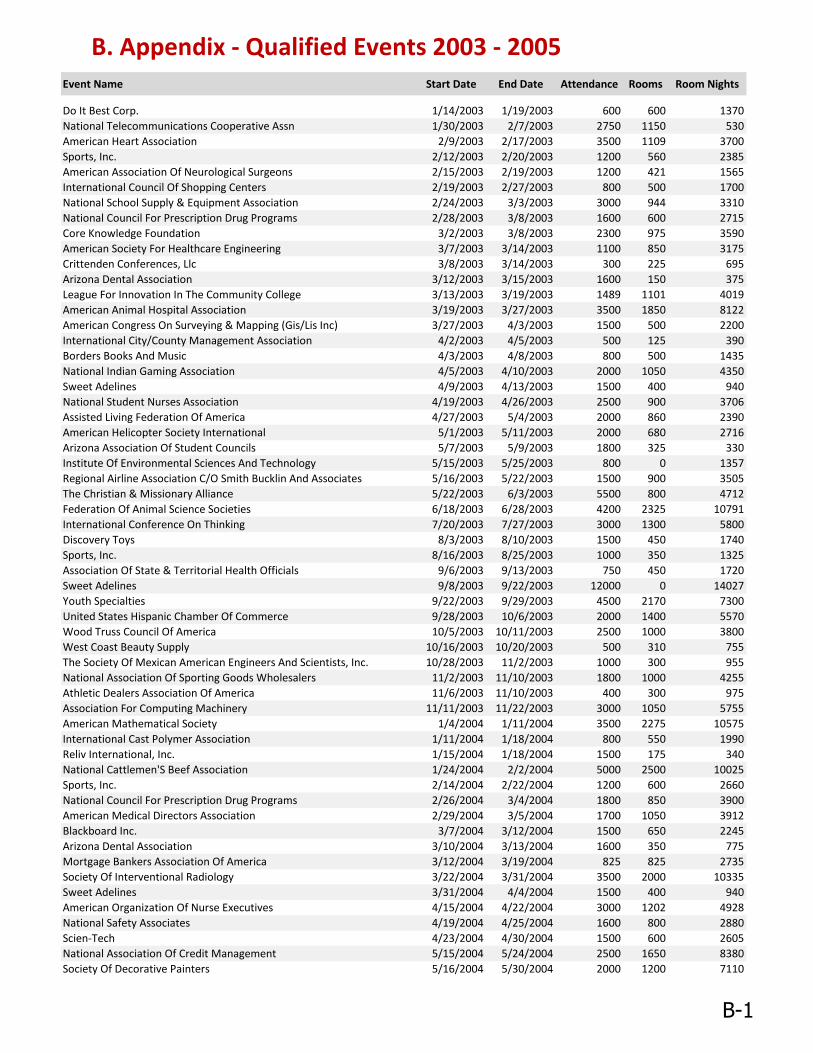
B. Appendix - Qualified Events 2003 - 2005Event Name Start Date End Date Attendance Rooms Room Nights
Do It Best Corp. 1/14/2003 1/19/2003 600 600 1370
National Telecommunications Cooperative Assn 1/30/2003 2/7/2003 2750 1150 530
American Heart Association 2/9/2003 2/17/2003 3500 1109 3700
Sports, Inc. 2/12/2003 2/20/2003 1200 560 2385
American Association Of Neurological Surgeons 2/15/2003 2/19/2003 1200 421 1565
International Council Of Shopping Centers 2/19/2003 2/27/2003 800 500 1700
National School Supply & Equipment Association 2/24/2003 3/3/2003 3000 944 3310
National Council For Prescription Drug Programs 2/28/2003 3/8/2003 1600 600 2715
Core Knowledge Foundation 3/2/2003 3/8/2003 2300 975 3590
American Society For Healthcare Engineering 3/7/2003 3/14/2003 1100 850 3175
Crittenden Conferences, Llc 3/8/2003 3/14/2003 300 225 695
Arizona Dental Association 3/12/2003 3/15/2003 1600 150 375
League For Innovation In The Community College 3/13/2003 3/19/2003 1489 1101 4019
American Animal Hospital Association 3/19/2003 3/27/2003 3500 1850 8122
American Congress On Surveying & Mapping (Gis/Lis Inc) 3/27/2003 4/3/2003 1500 500 2200
International City/County Management Association 4/2/2003 4/5/2003 500 125 390
Borders Books And Music 4/3/2003 4/8/2003 800 500 1435
National Indian Gaming Association 4/5/2003 4/10/2003 2000 1050 4350
Sweet Adelines 4/9/2003 4/13/2003 1500 400 940
National Student Nurses Association 4/19/2003 4/26/2003 2500 900 3706
Assisted Living Federation Of America 4/27/2003 5/4/2003 2000 860 2390
American Helicopter Society International 5/1/2003 5/11/2003 2000 680 2716
Arizona Association Of Student Councils 5/7/2003 5/9/2003 1800 325 330
Institute Of Environmental Sciences And Technology 5/15/2003 5/25/2003 800 0 1357
Regional Airline Association C/O Smith Bucklin And Associates 5/16/2003 5/22/2003 1500 900 3505
The Christian & Missionary Alliance 5/22/2003 6/3/2003 5500 800 4712
Federation Of Animal Science Societies 6/18/2003 6/28/2003 4200 2325 10791
International Conference On Thinking 7/20/2003 7/27/2003 3000 1300 5800
Discovery Toys 8/3/2003 8/10/2003 1500 450 1740
Sports, Inc. 8/16/2003 8/25/2003 1000 350 1325
Association Of State & Territorial Health Officials 9/6/2003 9/13/2003 750 450 1720
Sweet Adelines 9/8/2003 9/22/2003 12000 0 14027
Youth Specialties 9/22/2003 9/29/2003 4500 2170 7300
United States Hispanic Chamber Of Commerce 9/28/2003 10/6/2003 2000 1400 5570
Wood Truss Council Of America 10/5/2003 10/11/2003 2500 1000 3800
West Coast Beauty Supply 10/16/2003 10/20/2003 500 310 755
The Society Of Mexican American Engineers And Scientists, Inc. 10/28/2003 11/2/2003 1000 300 955
National Association Of Sporting Goods Wholesalers 11/2/2003 11/10/2003 1800 1000 4255
Athletic Dealers Association Of America 11/6/2003 11/10/2003 400 300 975
Association For Computing Machinery 11/11/2003 11/22/2003 3000 1050 5755
American Mathematical Society 1/4/2004 1/11/2004 3500 2275 10575
International Cast Polymer Association 1/11/2004 1/18/2004 800 550 1990
Reliv International, Inc. 1/15/2004 1/18/2004 1500 175 340
National Cattlemen'S Beef Association 1/24/2004 2/2/2004 5000 2500 10025
Sports, Inc. 2/14/2004 2/22/2004 1200 600 2660
National Council For Prescription Drug Programs 2/26/2004 3/4/2004 1800 850 3900
American Medical Directors Association 2/29/2004 3/5/2004 1700 1050 3912
Blackboard Inc. 3/7/2004 3/12/2004 1500 650 2245
Arizona Dental Association 3/10/2004 3/13/2004 1600 350 775
Mortgage Bankers Association Of America 3/12/2004 3/19/2004 825 825 2735
Society Of Interventional Radiology 3/22/2004 3/31/2004 3500 2000 10335
Sweet Adelines 3/31/2004 4/4/2004 1500 400 940
American Organization Of Nurse Executives 4/15/2004 4/22/2004 3000 1202 4928
National Safety Associates 4/19/2004 4/25/2004 1600 800 2880
Scien-Tech 4/23/2004 4/30/2004 1500 600 2605
National Association Of Credit Management 5/15/2004 5/24/2004 2500 1650 8380
Society Of Decorative Painters 5/16/2004 5/30/2004 2000 1200 7110
B-1
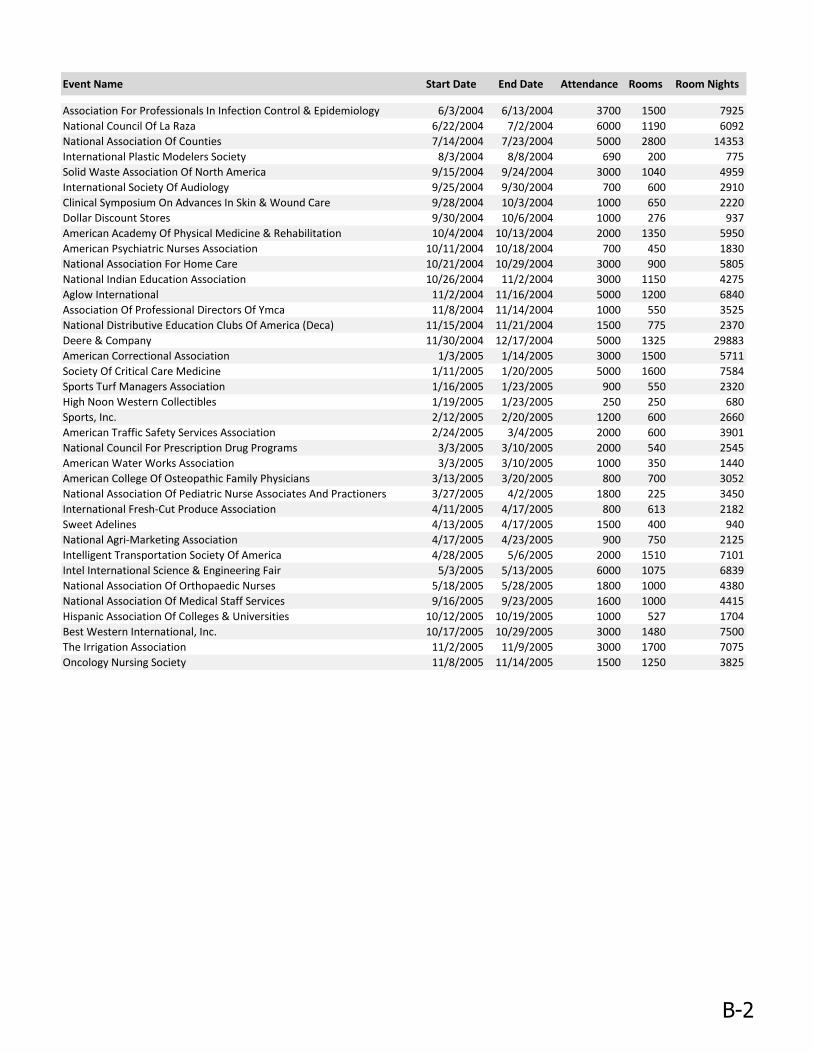
Event Name Start Date End Date Attendance Rooms Room Nights
Association For Professionals In Infection Control & Epidemiology 6/3/2004 6/13/2004 3700 1500 7925
National Council Of La Raza 6/22/2004 7/2/2004 6000 1190 6092
National Association Of Counties 7/14/2004 7/23/2004 5000 2800 14353
International Plastic Modelers Society 8/3/2004 8/8/2004 690 200 775
Solid Waste Association Of North America 9/15/2004 9/24/2004 3000 1040 4959
International Society Of Audiology 9/25/2004 9/30/2004 700 600 2910
Clinical Symposium On Advances In Skin & Wound Care 9/28/2004 10/3/2004 1000 650 2220
Dollar Discount Stores 9/30/2004 10/6/2004 1000 276 937
American Academy Of Physical Medicine & Rehabilitation 10/4/2004 10/13/2004 2000 1350 5950
American Psychiatric Nurses Association 10/11/2004 10/18/2004 700 450 1830
National Association For Home Care 10/21/2004 10/29/2004 3000 900 5805
National Indian Education Association 10/26/2004 11/2/2004 3000 1150 4275
Aglow International 11/2/2004 11/16/2004 5000 1200 6840
Association Of Professional Directors Of Ymca 11/8/2004 11/14/2004 1000 550 3525
National Distributive Education Clubs Of America (Deca) 11/15/2004 11/21/2004 1500 775 2370
Deere & Company 11/30/2004 12/17/2004 5000 1325 29883
American Correctional Association 1/3/2005 1/14/2005 3000 1500 5711
Society Of Critical Care Medicine 1/11/2005 1/20/2005 5000 1600 7584
Sports Turf Managers Association 1/16/2005 1/23/2005 900 550 2320
High Noon Western Collectibles 1/19/2005 1/23/2005 250 250 680
Sports, Inc. 2/12/2005 2/20/2005 1200 600 2660
American Traffic Safety Services Association 2/24/2005 3/4/2005 2000 600 3901
National Council For Prescription Drug Programs 3/3/2005 3/10/2005 2000 540 2545
American Water Works Association 3/3/2005 3/10/2005 1000 350 1440
American College Of Osteopathic Family Physicians 3/13/2005 3/20/2005 800 700 3052
National Association Of Pediatric Nurse Associates And Practioners 3/27/2005 4/2/2005 1800 225 3450
International Fresh-Cut Produce Association 4/11/2005 4/17/2005 800 613 2182
Sweet Adelines 4/13/2005 4/17/2005 1500 400 940
National Agri-Marketing Association 4/17/2005 4/23/2005 900 750 2125
Intelligent Transportation Society Of America 4/28/2005 5/6/2005 2000 1510 7101
Intel International Science & Engineering Fair 5/3/2005 5/13/2005 6000 1075 6839
National Association Of Orthopaedic Nurses 5/18/2005 5/28/2005 1800 1000 4380
National Association Of Medical Staff Services 9/16/2005 9/23/2005 1600 1000 4415
Hispanic Association Of Colleges & Universities 10/12/2005 10/19/2005 1000 527 1704
Best Western International, Inc. 10/17/2005 10/29/2005 3000 1480 7500
The Irrigation Association 11/2/2005 11/9/2005 3000 1700 7075
Oncology Nursing Society 11/8/2005 11/14/2005 1500 1250 3825
B-2
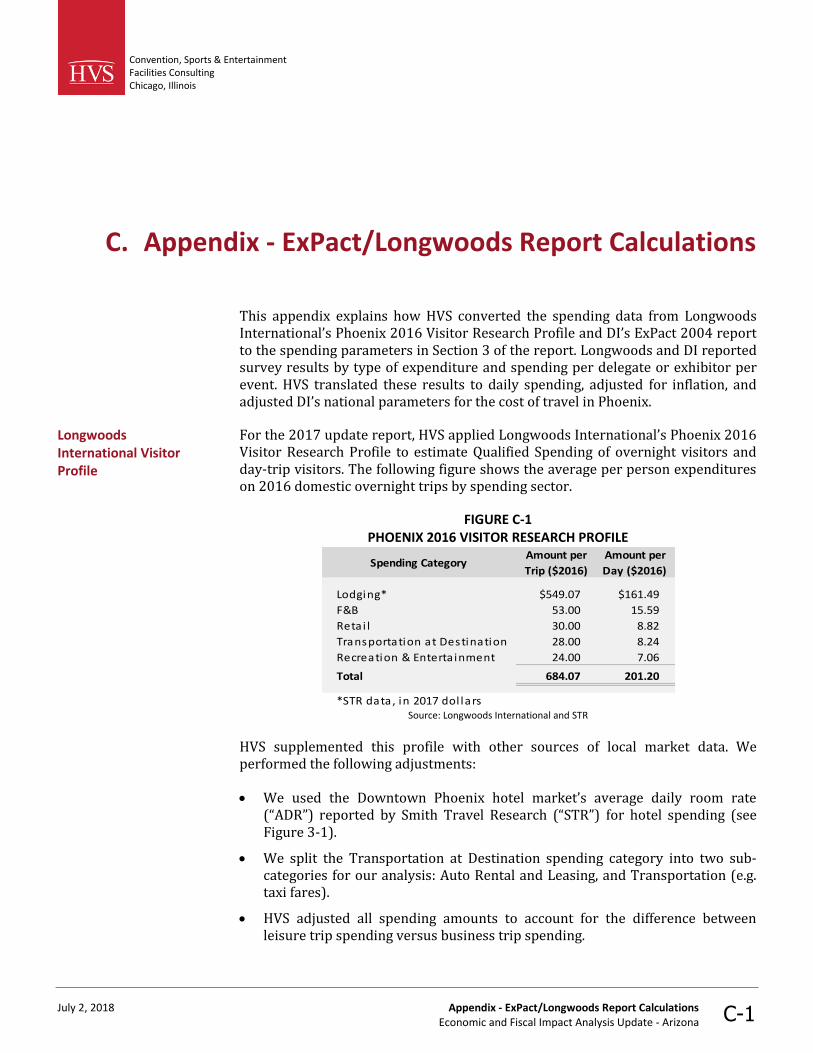
Convention, Sports & Entertainment Facilities Consulting Chicago, Illinois
July 2, 2018 Appendix - ExPact/Longwoods Report Calculations Economic and Fiscal Impact Analysis Update - Arizona C-1
C. Appendix - ExPact/Longwoods Report Calculations
This appendix explains how HVS converted the spending data from Longwoods International’s Phoenix 2016 Visitor Research Profile and DI’s ExPact 2004 report to the spending parameters in Section 3 of the report. Longwoods and DI reported survey results by type of expenditure and spending per delegate or exhibitor per event. HVS translated these results to daily spending, adjusted for inflation, and adjusted DI’s national parameters for the cost of travel in Phoenix.
For the 2017 update report, HVS applied Longwoods International’s Phoenix 2016 Visitor Research Profile to estimate Qualified Spending of overnight visitors and day-trip visitors. The following figure shows the average per person expenditures on 2016 domestic overnight trips by spending sector.
FIGURE C-1 PHOENIX 2016 VISITOR RESEARCH PROFILE
Spending CategoryAmount per
Trip ($2016)
Amount per
Day ($2016)
Lodging* $549.07 $161.49
F&B 53.00 15.59
Reta i l 30.00 8.82
Transportation at Destination 28.00 8.24
Recreation & Enterta inment 24.00 7.06
Total 684.07 201.20
*STR data, in 2017 dol lars Source: Longwoods International and STR
HVS supplemented this profile with other sources of local market data. We performed the following adjustments:
• We used the Downtown Phoenix hotel market’s average daily room rate (“ADR”) reported by Smith Travel Research (“STR”) for hotel spending (see Figure 3-1).
• We split the Transportation at Destination spending category into two sub-categories for our analysis: Auto Rental and Leasing, and Transportation (e.g. taxi fares).
• HVS adjusted all spending amounts to account for the difference between leisure trip spending versus business trip spending.
Longwoods International Visitor Profile
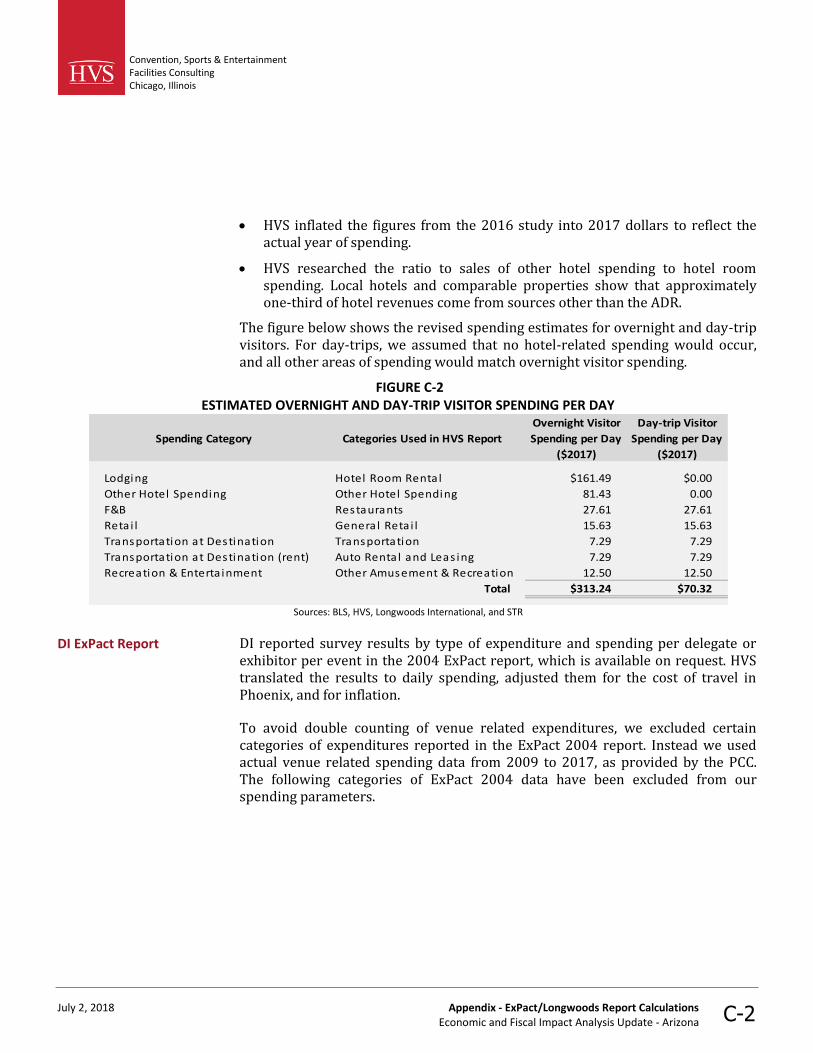
Convention, Sports & Entertainment Facilities Consulting Chicago, Illinois
July 2, 2018 Appendix - ExPact/Longwoods Report Calculations Economic and Fiscal Impact Analysis Update - Arizona C-2
• HVS inflated the figures from the 2016 study into 2017 dollars to reflect the actual year of spending.
• HVS researched the ratio to sales of other hotel spending to hotel room spending. Local hotels and comparable properties show that approximately one-third of hotel revenues come from sources other than the ADR.
The figure below shows the revised spending estimates for overnight and day-trip visitors. For day-trips, we assumed that no hotel-related spending would occur, and all other areas of spending would match overnight visitor spending.
FIGURE C-2 ESTIMATED OVERNIGHT AND DAY-TRIP VISITOR SPENDING PER DAY
Spending Category Categories Used in HVS Report
Overnight Visitor
Spending per Day
($2017)
Day-trip Visitor
Spending per Day
($2017)
Lodging Hotel Room Rental $161.49 $0.00
Other Hotel Spending Other Hotel Spending 81.43 0.00
F&B Restaurants 27.61 27.61
Retai l General Retai l 15.63 15.63
Transportation at Destination Transportation 7.29 7.29
Transportation at Destination (rent) Auto Rental and Leas ing 7.29 7.29
Recreation & Enterta inment Other Amusement & Recreation 12.50 12.50
Total $313.24 $70.32
Sources: BLS, HVS, Longwoods International, and STR
DI reported survey results by type of expenditure and spending per delegate or exhibitor per event in the 2004 ExPact report, which is available on request. HVS translated the results to daily spending, adjusted them for the cost of travel in Phoenix, and for inflation.
To avoid double counting of venue related expenditures, we excluded certain categories of expenditures reported in the ExPact 2004 report. Instead we used actual venue related spending data from 2009 to 2017, as provided by the PCC. The following categories of ExPact 2004 data have been excluded from our spending parameters.
DI ExPact Report
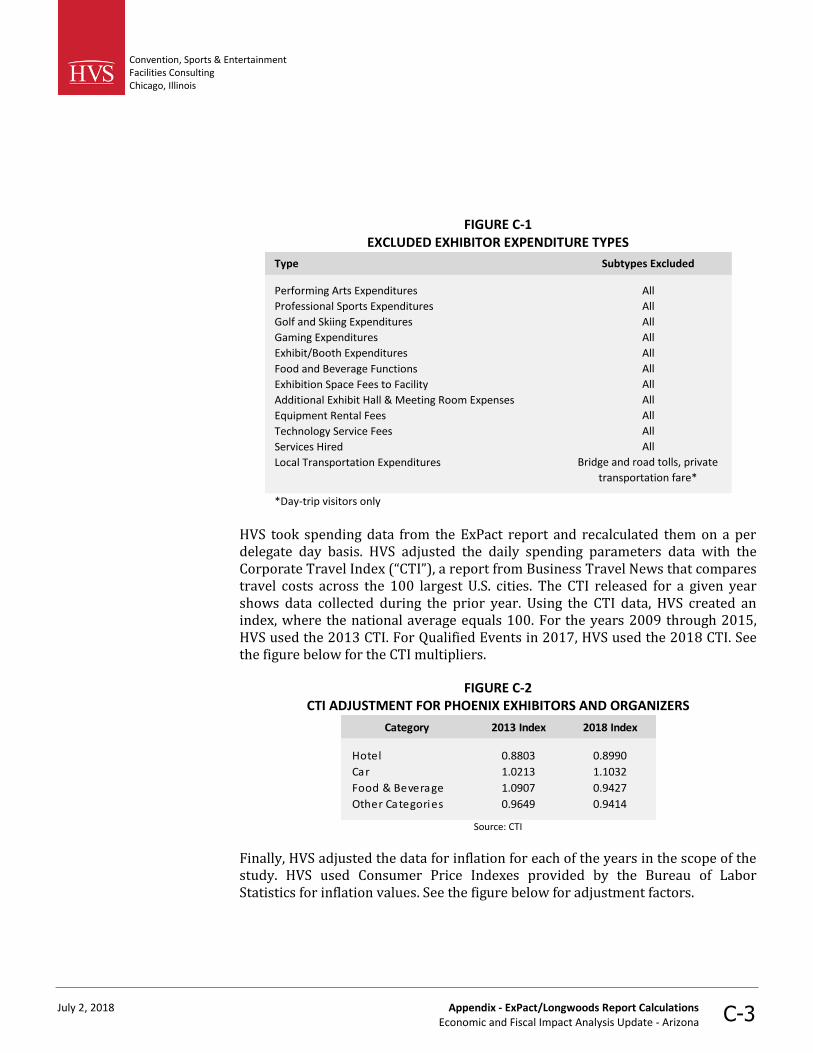
Convention, Sports & Entertainment Facilities Consulting Chicago, Illinois
July 2, 2018 Appendix - ExPact/Longwoods Report Calculations Economic and Fiscal Impact Analysis Update - Arizona C-3
FIGURE C-1 EXCLUDED EXHIBITOR EXPENDITURE TYPES
Type Subtypes Excluded
Performing Arts Expenditures All
Professional Sports Expenditures All
Golf and Skiing Expenditures All
Gaming Expenditures All
Exhibit/Booth Expenditures All
Food and Beverage Functions All
Exhibition Space Fees to Facility All
Additional Exhibit Hall & Meeting Room Expenses All
Equipment Rental Fees All
Technology Service Fees All
Services Hired All
Local Transportation Expenditures Bridge and road tolls, private
transportation fare*
*Day-trip visitors only
HVS took spending data from the ExPact report and recalculated them on a per delegate day basis. HVS adjusted the daily spending parameters data with the Corporate Travel Index (“CTI”), a report from Business Travel News that compares travel costs across the 100 largest U.S. cities. The CTI released for a given year shows data collected during the prior year. Using the CTI data, HVS created an index, where the national average equals 100. For the years 2009 through 2015, HVS used the 2013 CTI. For Qualified Events in 2017, HVS used the 2018 CTI. See the figure below for the CTI multipliers.
FIGURE C-2 CTI ADJUSTMENT FOR PHOENIX EXHIBITORS AND ORGANIZERS
Category 2013 Index 2018 Index
Hotel 0.8803 0.8990
Car 1.0213 1.1032
Food & Beverage 1.0907 0.9427
Other Categories 0.9649 0.9414
Source: CTI
Finally, HVS adjusted the data for inflation for each of the years in the scope of the study. HVS used Consumer Price Indexes provided by the Bureau of Labor Statistics for inflation values. See the figure below for adjustment factors.
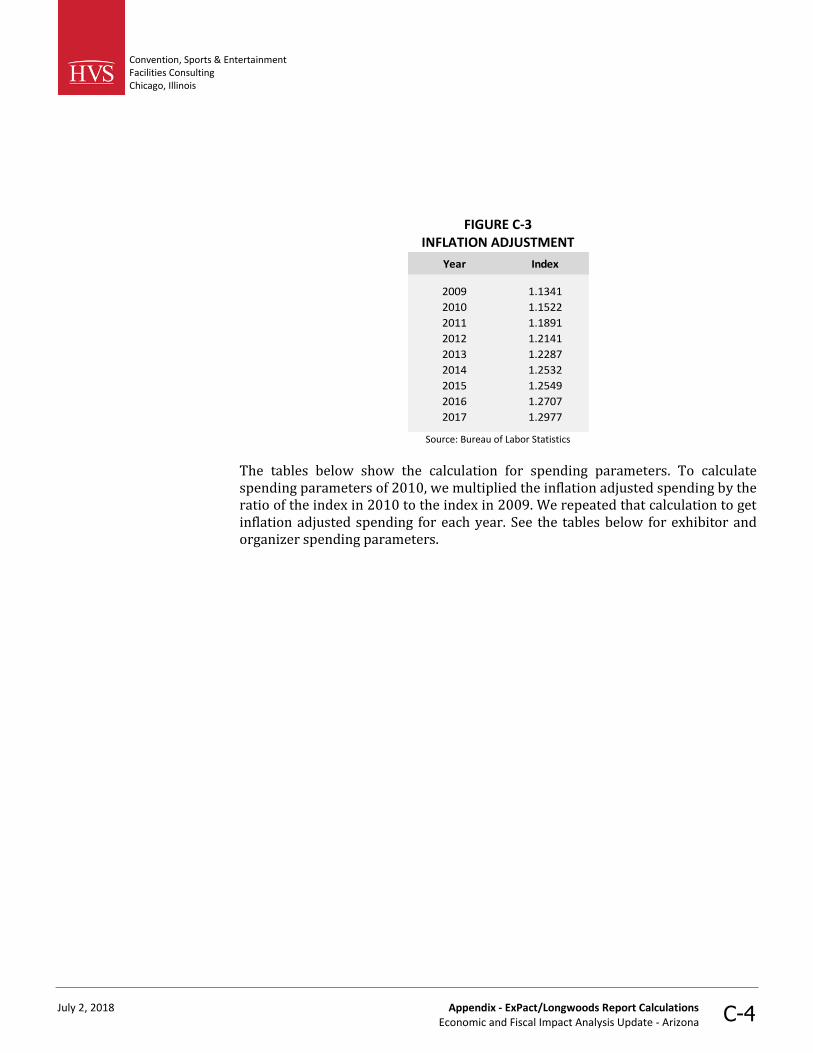
Convention, Sports & Entertainment Facilities Consulting Chicago, Illinois
July 2, 2018 Appendix - ExPact/Longwoods Report Calculations Economic and Fiscal Impact Analysis Update - Arizona C-4
FIGURE C-3 INFLATION ADJUSTMENT
Year Index
2009 1.1341
2010 1.1522
2011 1.1891
2012 1.2141
2013 1.2287
2014 1.2532
2015 1.2549
2016 1.2707
2017 1.2977
Source: Bureau of Labor Statistics
The tables below show the calculation for spending parameters. To calculate spending parameters of 2010, we multiplied the inflation adjusted spending by the ratio of the index in 2010 to the index in 2009. We repeated that calculation to get inflation adjusted spending for each year. See the tables below for exhibitor and organizer spending parameters.
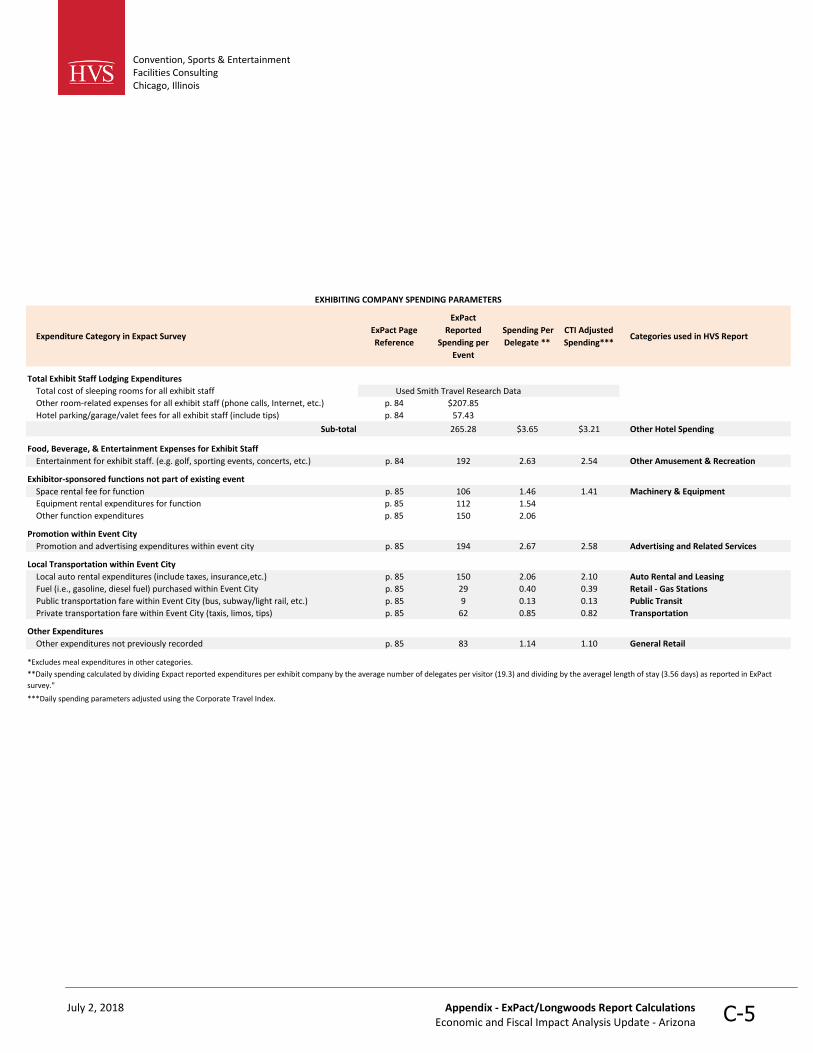
Convention, Sports & Entertainment Facilities Consulting Chicago, Illinois
July 2, 2018 Appendix - ExPact/Longwoods Report Calculations Economic and Fiscal Impact Analysis Update - Arizona C-5
Expenditure Category in Expact SurveyExPact Page
Reference
ExPact
Reported
Spending per
Event
Spending Per
Delegate **
CTI Adjusted
Spending***Categories used in HVS Report
Total Exhibit Staff Lodging Expenditures
Total cost of sleeping rooms for all exhibit staff Used Smith Travel Research Data
Other room-related expenses for all exhibit staff (phone calls, Internet, etc.) p. 84 $207.85
Hotel parking/garage/valet fees for all exhibit staff (include tips) p. 84 57.43
Sub-total 265.28 $3.65 $3.21 Other Hotel Spending
Food, Beverage, & Entertainment Expenses for Exhibit Staff
Entertainment for exhibit staff. (e.g. golf, sporting events, concerts, etc.) p. 84 192 2.63 2.54 Other Amusement & Recreation
Exhibitor-sponsored functions not part of existing event
Space rental fee for function p. 85 106 1.46 1.41 Machinery & Equipment
Equipment rental expenditures for function p. 85 112 1.54
Other function expenditures p. 85 150 2.06
Promotion within Event City
Promotion and advertising expenditures within event city p. 85 194 2.67 2.58 Advertising and Related Services
Local Transportation within Event City
Local auto rental expenditures (include taxes, insurance,etc.) p. 85 150 2.06 2.10 Auto Rental and Leasing
Fuel (i.e., gasoline, diesel fuel) purchased within Event City p. 85 29 0.40 0.39 Retail - Gas Stations
Public transportation fare within Event City (bus, subway/light rail, etc.) p. 85 9 0.13 0.13 Public Transit
Private transportation fare within Event City (taxis, limos, tips) p. 85 62 0.85 0.82 Transportation
Other Expenditures
Other expenditures not previously recorded p. 85 83 1.14 1.10 General Retail
*Excludes meal expenditures in other categories.
***Daily spending parameters adjusted using the Corporate Travel Index.
**Daily spending calculated by dividing Expact reported expenditures per exhibit company by the average number of delegates per visitor (19.3) and dividing by the averagel length of stay (3.56 days) as reported in ExPact
survey."
EXHIBITING COMPANY SPENDING PARAMETERS

Convention, Sports & Entertainment Facilities Consulting Chicago, Illinois
July 2, 2018 Appendix - ExPact/Longwoods Report Calculations Economic and Fiscal Impact Analysis Update - Arizona C-6
Expenditure Category in Expact SurveyExPact Page
Reference
ExPact
Reported
Spending per
Event
Spending Per
Delegate **
CTI Adjusted
Spending***Categories used in HVS Report
Staff Members’ Living Expenses
Staff lodging expenditures. Include cost of room(s), taxes, and surcharges. p. 91 $19,325
Other room-related expenses for all exhibit staff (phone calls, Internet, etc.) p. 92 1,910
Hotel parking/garage/valet fees (include tips) p. 92 459
Sub-total 21,694 $1.07 $0.95 Other Hotel Spending
Meals purchased in restaurants or other eating places p. 92 6,442 0.32 0.02 Restaurants
Promotional Expenditures within Event City
Promotional expenditures within Event City. Include all types of signage in Event p. 92 16,308 0.80 0.77 Advertising and Related Services
Local Transportation within Event City (for all staff)
Local auto rental expenditures (include taxes, insurance,etc.) p. 92 738 0.04 0.04 Auto Rental and Leasing
Fuel (i.e., gasoline, diesel fuel) purchased within Event City p. 92 82 0.00 0.00 Retail - Gas Stations
Public transportation fare within Event City (bus, subway/light rail, etc.) p. 92 656 0.03 0.03 Public Transit
Private transportation fare within Event City (taxis, limos, tips) p. 92 3,124 0.15 0.15 Transportation
Other Expenses
Other expenditures in Event City not previously recorded p. 92 21,039 1.03 1.00 General Retail
*Excludes meal expenditures in other categories.
**Daily spending calculated by dividing ExPact reported spending by average deletate attendance (4,751) and average event lengty (4.28) as reported in ExPact survey.
***Daily spending paramters adjusted using the Corporate Travel Index.
EVENT ORGANIZER SPENDING PARAMETERS
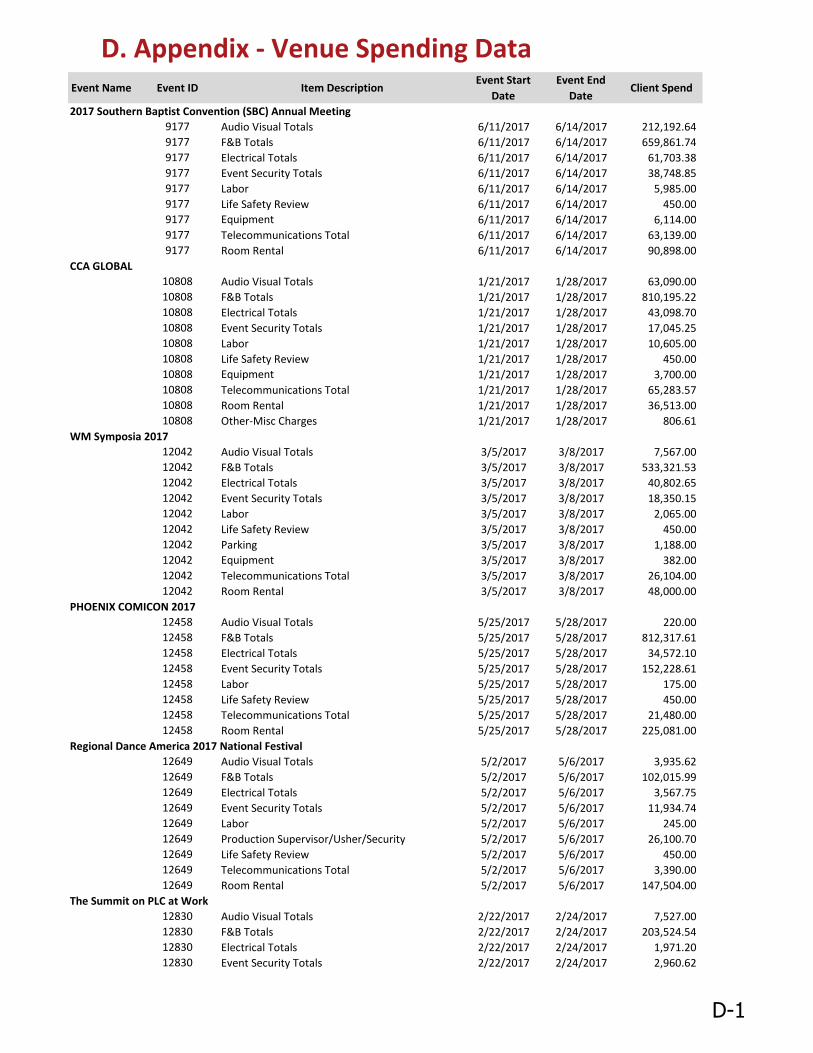
D. Appendix - Venue Spending DataEvent Name Event ID Item Description
Event Start
Date
Event End
DateClient Spend
2017 Southern Baptist Convention (SBC) Annual Meeting
9177 Audio Visual Totals 6/11/2017 6/14/2017 212,192.64
9177 F&B Totals 6/11/2017 6/14/2017 659,861.74
9177 Electrical Totals 6/11/2017 6/14/2017 61,703.38
9177 Event Security Totals 6/11/2017 6/14/2017 38,748.85
9177 Labor 6/11/2017 6/14/2017 5,985.00
9177 Life Safety Review 6/11/2017 6/14/2017 450.00
9177 Equipment 6/11/2017 6/14/2017 6,114.00
9177 Telecommunications Total 6/11/2017 6/14/2017 63,139.00
9177 Room Rental 6/11/2017 6/14/2017 90,898.00
CCA GLOBAL 2017
10808 Audio Visual Totals 1/21/2017 1/28/2017 63,090.00
10808 F&B Totals 1/21/2017 1/28/2017 810,195.22
10808 Electrical Totals 1/21/2017 1/28/2017 43,098.70
10808 Event Security Totals 1/21/2017 1/28/2017 17,045.25
10808 Labor 1/21/2017 1/28/2017 10,605.00
10808 Life Safety Review 1/21/2017 1/28/2017 450.00
10808 Equipment 1/21/2017 1/28/2017 3,700.00
10808 Telecommunications Total 1/21/2017 1/28/2017 65,283.57
10808 Room Rental 1/21/2017 1/28/2017 36,513.00
10808 Other-Misc Charges 1/21/2017 1/28/2017 806.61
WM Symposia 2017
12042 Audio Visual Totals 3/5/2017 3/8/2017 7,567.00
12042 F&B Totals 3/5/2017 3/8/2017 533,321.53
12042 Electrical Totals 3/5/2017 3/8/2017 40,802.65
12042 Event Security Totals 3/5/2017 3/8/2017 18,350.15
12042 Labor 3/5/2017 3/8/2017 2,065.00
12042 Life Safety Review 3/5/2017 3/8/2017 450.00
12042 Parking 3/5/2017 3/8/2017 1,188.00
12042 Equipment 3/5/2017 3/8/2017 382.00
12042 Telecommunications Total 3/5/2017 3/8/2017 26,104.00
12042 Room Rental 3/5/2017 3/8/2017 48,000.00
PHOENIX COMICON 2017
12458 Audio Visual Totals 5/25/2017 5/28/2017 220.00
12458 F&B Totals 5/25/2017 5/28/2017 812,317.61
12458 Electrical Totals 5/25/2017 5/28/2017 34,572.10
12458 Event Security Totals 5/25/2017 5/28/2017 152,228.61
12458 Labor 5/25/2017 5/28/2017 175.00
12458 Life Safety Review 5/25/2017 5/28/2017 450.00
12458 Telecommunications Total 5/25/2017 5/28/2017 21,480.00
12458 Room Rental 5/25/2017 5/28/2017 225,081.00
Regional Dance America 2017 National Festival
12649 Audio Visual Totals 5/2/2017 5/6/2017 3,935.62
12649 F&B Totals 5/2/2017 5/6/2017 102,015.99
12649 Electrical Totals 5/2/2017 5/6/2017 3,567.75
12649 Event Security Totals 5/2/2017 5/6/2017 11,934.74
12649 Labor 5/2/2017 5/6/2017 245.00
12649 Production Supervisor/Usher/Security 5/2/2017 5/6/2017 26,100.70
12649 Life Safety Review 5/2/2017 5/6/2017 450.00
12649 Telecommunications Total 5/2/2017 5/6/2017 3,390.00
12649 Room Rental 5/2/2017 5/6/2017 147,504.00
The Summit on PLC at Work
12830 Audio Visual Totals 2/22/2017 2/24/2017 7,527.00
12830 F&B Totals 2/22/2017 2/24/2017 203,524.54
12830 Electrical Totals 2/22/2017 2/24/2017 1,971.20
12830 Event Security Totals 2/22/2017 2/24/2017 2,960.62
D-1
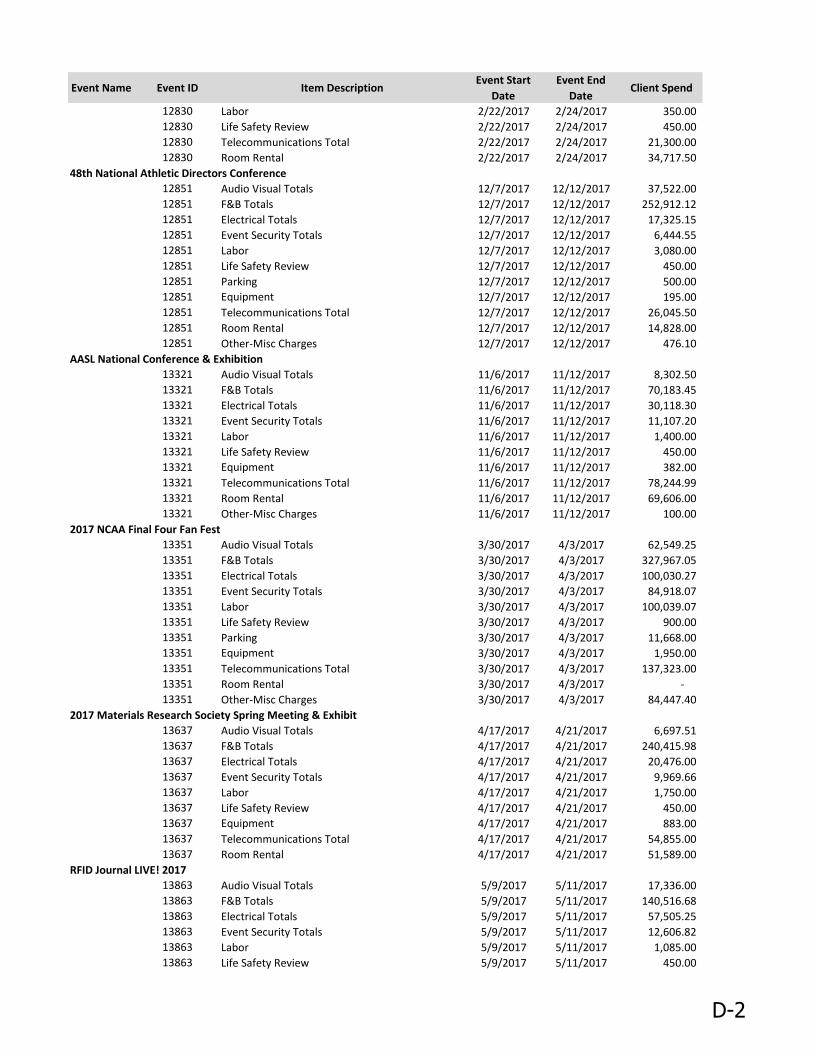
Event Name Event ID Item DescriptionEvent Start
Date
Event End
DateClient Spend
12830 Labor 2/22/2017 2/24/2017 350.00
12830 Life Safety Review 2/22/2017 2/24/2017 450.00
12830 Telecommunications Total 2/22/2017 2/24/2017 21,300.00
12830 Room Rental 2/22/2017 2/24/2017 34,717.50
48th National Athletic Directors Conference
12851 Audio Visual Totals 12/7/2017 12/12/2017 37,522.00
12851 F&B Totals 12/7/2017 12/12/2017 252,912.12
12851 Electrical Totals 12/7/2017 12/12/2017 17,325.15
12851 Event Security Totals 12/7/2017 12/12/2017 6,444.55
12851 Labor 12/7/2017 12/12/2017 3,080.00
12851 Life Safety Review 12/7/2017 12/12/2017 450.00
12851 Parking 12/7/2017 12/12/2017 500.00
12851 Equipment 12/7/2017 12/12/2017 195.00
12851 Telecommunications Total 12/7/2017 12/12/2017 26,045.50
12851 Room Rental 12/7/2017 12/12/2017 14,828.00
12851 Other-Misc Charges 12/7/2017 12/12/2017 476.10
AASL National Conference & Exhibition
13321 Audio Visual Totals 11/6/2017 11/12/2017 8,302.50
13321 F&B Totals 11/6/2017 11/12/2017 70,183.45
13321 Electrical Totals 11/6/2017 11/12/2017 30,118.30
13321 Event Security Totals 11/6/2017 11/12/2017 11,107.20
13321 Labor 11/6/2017 11/12/2017 1,400.00
13321 Life Safety Review 11/6/2017 11/12/2017 450.00
13321 Equipment 11/6/2017 11/12/2017 382.00
13321 Telecommunications Total 11/6/2017 11/12/2017 78,244.99
13321 Room Rental 11/6/2017 11/12/2017 69,606.00
13321 Other-Misc Charges 11/6/2017 11/12/2017 100.00
2017 NCAA Final Four Fan Fest
13351 Audio Visual Totals 3/30/2017 4/3/2017 62,549.25
13351 F&B Totals 3/30/2017 4/3/2017 327,967.05
13351 Electrical Totals 3/30/2017 4/3/2017 100,030.27
13351 Event Security Totals 3/30/2017 4/3/2017 84,918.07
13351 Labor 3/30/2017 4/3/2017 100,039.07
13351 Life Safety Review 3/30/2017 4/3/2017 900.00
13351 Parking 3/30/2017 4/3/2017 11,668.00
13351 Equipment 3/30/2017 4/3/2017 1,950.00
13351 Telecommunications Total 3/30/2017 4/3/2017 137,323.00
13351 Room Rental 3/30/2017 4/3/2017 -
13351 Other-Misc Charges 3/30/2017 4/3/2017 84,447.40
2017 Materials Research Society Spring Meeting & Exhibit
13637 Audio Visual Totals 4/17/2017 4/21/2017 6,697.51
13637 F&B Totals 4/17/2017 4/21/2017 240,415.98
13637 Electrical Totals 4/17/2017 4/21/2017 20,476.00
13637 Event Security Totals 4/17/2017 4/21/2017 9,969.66
13637 Labor 4/17/2017 4/21/2017 1,750.00
13637 Life Safety Review 4/17/2017 4/21/2017 450.00
13637 Equipment 4/17/2017 4/21/2017 883.00
13637 Telecommunications Total 4/17/2017 4/21/2017 54,855.00
13637 Room Rental 4/17/2017 4/21/2017 51,589.00
RFID Journal LIVE! 2017
13863 Audio Visual Totals 5/9/2017 5/11/2017 17,336.00
13863 F&B Totals 5/9/2017 5/11/2017 140,516.68
13863 Electrical Totals 5/9/2017 5/11/2017 57,505.25
13863 Event Security Totals 5/9/2017 5/11/2017 12,606.82
13863 Labor 5/9/2017 5/11/2017 1,085.00
13863 Life Safety Review 5/9/2017 5/11/2017 450.00
D-2
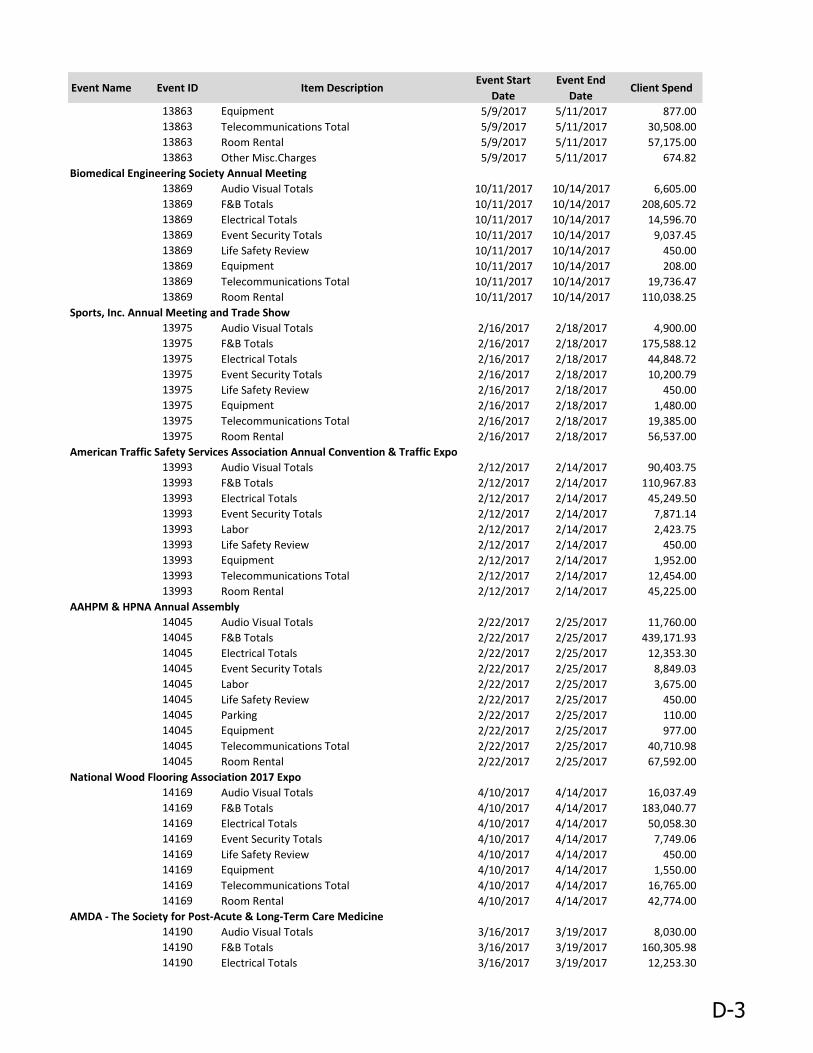
Event Name Event ID Item DescriptionEvent Start
Date
Event End
DateClient Spend
13863 Equipment 5/9/2017 5/11/2017 877.00
13863 Telecommunications Total 5/9/2017 5/11/2017 30,508.00
13863 Room Rental 5/9/2017 5/11/2017 57,175.00
13863 Other Misc.Charges 5/9/2017 5/11/2017 674.82
Biomedical Engineering Society Annual Meeting
13869 Audio Visual Totals 10/11/2017 10/14/2017 6,605.00
13869 F&B Totals 10/11/2017 10/14/2017 208,605.72
13869 Electrical Totals 10/11/2017 10/14/2017 14,596.70
13869 Event Security Totals 10/11/2017 10/14/2017 9,037.45
13869 Life Safety Review 10/11/2017 10/14/2017 450.00
13869 Equipment 10/11/2017 10/14/2017 208.00
13869 Telecommunications Total 10/11/2017 10/14/2017 19,736.47
13869 Room Rental 10/11/2017 10/14/2017 110,038.25
Sports, Inc. Annual Meeting and Trade Show
13975 Audio Visual Totals 2/16/2017 2/18/2017 4,900.00
13975 F&B Totals 2/16/2017 2/18/2017 175,588.12
13975 Electrical Totals 2/16/2017 2/18/2017 44,848.72
13975 Event Security Totals 2/16/2017 2/18/2017 10,200.79
13975 Life Safety Review 2/16/2017 2/18/2017 450.00
13975 Equipment 2/16/2017 2/18/2017 1,480.00
13975 Telecommunications Total 2/16/2017 2/18/2017 19,385.00
13975 Room Rental 2/16/2017 2/18/2017 56,537.00
American Traffic Safety Services Association Annual Convention & Traffic Expo
13993 Audio Visual Totals 2/12/2017 2/14/2017 90,403.75
13993 F&B Totals 2/12/2017 2/14/2017 110,967.83
13993 Electrical Totals 2/12/2017 2/14/2017 45,249.50
13993 Event Security Totals 2/12/2017 2/14/2017 7,871.14
13993 Labor 2/12/2017 2/14/2017 2,423.75
13993 Life Safety Review 2/12/2017 2/14/2017 450.00
13993 Equipment 2/12/2017 2/14/2017 1,952.00
13993 Telecommunications Total 2/12/2017 2/14/2017 12,454.00
13993 Room Rental 2/12/2017 2/14/2017 45,225.00
AAHPM & HPNA Annual Assembly
14045 Audio Visual Totals 2/22/2017 2/25/2017 11,760.00
14045 F&B Totals 2/22/2017 2/25/2017 439,171.93
14045 Electrical Totals 2/22/2017 2/25/2017 12,353.30
14045 Event Security Totals 2/22/2017 2/25/2017 8,849.03
14045 Labor 2/22/2017 2/25/2017 3,675.00
14045 Life Safety Review 2/22/2017 2/25/2017 450.00
14045 Parking 2/22/2017 2/25/2017 110.00
14045 Equipment 2/22/2017 2/25/2017 977.00
14045 Telecommunications Total 2/22/2017 2/25/2017 40,710.98
14045 Room Rental 2/22/2017 2/25/2017 67,592.00
National Wood Flooring Association 2017 Expo
14169 Audio Visual Totals 4/10/2017 4/14/2017 16,037.49
14169 F&B Totals 4/10/2017 4/14/2017 183,040.77
14169 Electrical Totals 4/10/2017 4/14/2017 50,058.30
14169 Event Security Totals 4/10/2017 4/14/2017 7,749.06
14169 Life Safety Review 4/10/2017 4/14/2017 450.00
14169 Equipment 4/10/2017 4/14/2017 1,550.00
14169 Telecommunications Total 4/10/2017 4/14/2017 16,765.00
14169 Room Rental 4/10/2017 4/14/2017 42,774.00
AMDA - The Society for Post-Acute & Long-Term Care Medicine
14190 Audio Visual Totals 3/16/2017 3/19/2017 8,030.00
14190 F&B Totals 3/16/2017 3/19/2017 160,305.98
14190 Electrical Totals 3/16/2017 3/19/2017 12,253.30
D-3
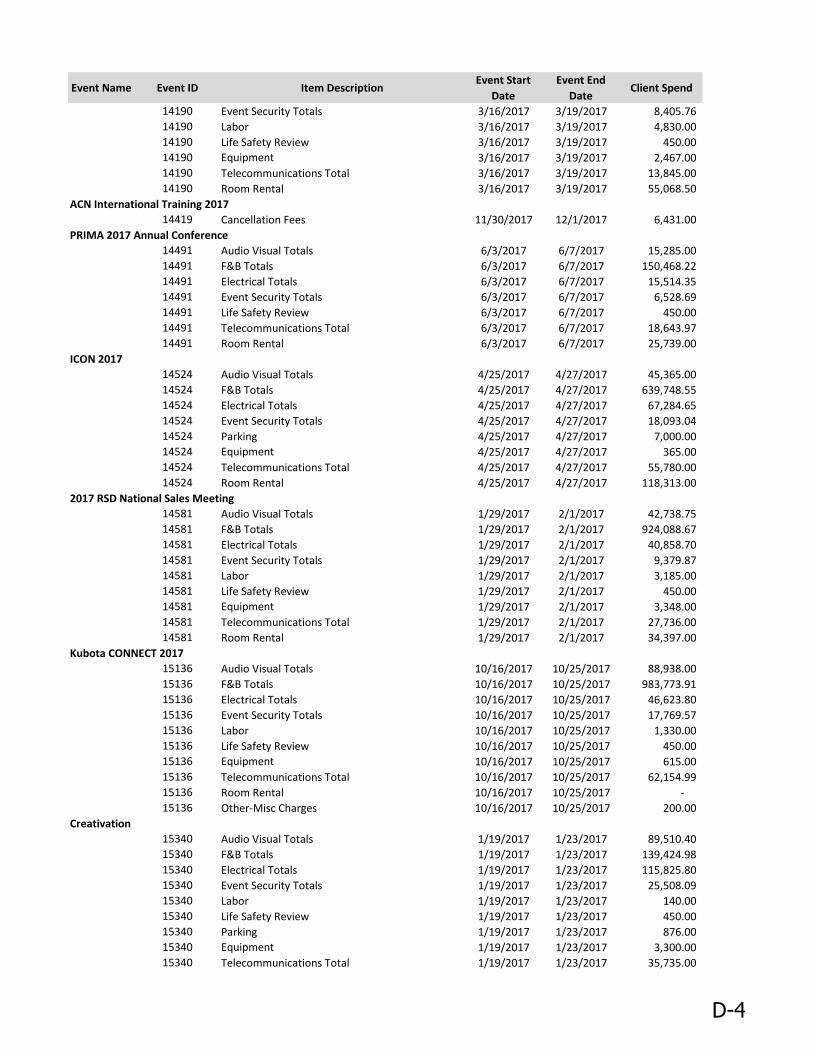
Event Name Event ID Item DescriptionEvent Start
Date
Event End
DateClient Spend
14190 Event Security Totals 3/16/2017 3/19/2017 8,405.76
14190 Labor 3/16/2017 3/19/2017 4,830.00
14190 Life Safety Review 3/16/2017 3/19/2017 450.00
14190 Equipment 3/16/2017 3/19/2017 2,467.00
14190 Telecommunications Total 3/16/2017 3/19/2017 13,845.00
14190 Room Rental 3/16/2017 3/19/2017 55,068.50
ACN International Training 2017
14419 Cancellation Fees 11/30/2017 12/1/2017 6,431.00
PRIMA 2017 Annual Conference
14491 Audio Visual Totals 6/3/2017 6/7/2017 15,285.00
14491 F&B Totals 6/3/2017 6/7/2017 150,468.22
14491 Electrical Totals 6/3/2017 6/7/2017 15,514.35
14491 Event Security Totals 6/3/2017 6/7/2017 6,528.69
14491 Life Safety Review 6/3/2017 6/7/2017 450.00
14491 Telecommunications Total 6/3/2017 6/7/2017 18,643.97
14491 Room Rental 6/3/2017 6/7/2017 25,739.00
ICON 2017
14524 Audio Visual Totals 4/25/2017 4/27/2017 45,365.00
14524 F&B Totals 4/25/2017 4/27/2017 639,748.55
14524 Electrical Totals 4/25/2017 4/27/2017 67,284.65
14524 Event Security Totals 4/25/2017 4/27/2017 18,093.04
14524 Parking 4/25/2017 4/27/2017 7,000.00
14524 Equipment 4/25/2017 4/27/2017 365.00
14524 Telecommunications Total 4/25/2017 4/27/2017 55,780.00
14524 Room Rental 4/25/2017 4/27/2017 118,313.00
2017 RSD National Sales Meeting
14581 Audio Visual Totals 1/29/2017 2/1/2017 42,738.75
14581 F&B Totals 1/29/2017 2/1/2017 924,088.67
14581 Electrical Totals 1/29/2017 2/1/2017 40,858.70
14581 Event Security Totals 1/29/2017 2/1/2017 9,379.87
14581 Labor 1/29/2017 2/1/2017 3,185.00
14581 Life Safety Review 1/29/2017 2/1/2017 450.00
14581 Equipment 1/29/2017 2/1/2017 3,348.00
14581 Telecommunications Total 1/29/2017 2/1/2017 27,736.00
14581 Room Rental 1/29/2017 2/1/2017 34,397.00
Kubota CONNECT 2017
15136 Audio Visual Totals 10/16/2017 10/25/2017 88,938.00
15136 F&B Totals 10/16/2017 10/25/2017 983,773.91
15136 Electrical Totals 10/16/2017 10/25/2017 46,623.80
15136 Event Security Totals 10/16/2017 10/25/2017 17,769.57
15136 Labor 10/16/2017 10/25/2017 1,330.00
15136 Life Safety Review 10/16/2017 10/25/2017 450.00
15136 Equipment 10/16/2017 10/25/2017 615.00
15136 Telecommunications Total 10/16/2017 10/25/2017 62,154.99
15136 Room Rental 10/16/2017 10/25/2017 -
15136 Other-Misc Charges 10/16/2017 10/25/2017 200.00
Creativation
15340 Audio Visual Totals 1/19/2017 1/23/2017 89,510.40
15340 F&B Totals 1/19/2017 1/23/2017 139,424.98
15340 Electrical Totals 1/19/2017 1/23/2017 115,825.80
15340 Event Security Totals 1/19/2017 1/23/2017 25,508.09
15340 Labor 1/19/2017 1/23/2017 140.00
15340 Life Safety Review 1/19/2017 1/23/2017 450.00
15340 Parking 1/19/2017 1/23/2017 876.00
15340 Equipment 1/19/2017 1/23/2017 3,300.00
15340 Telecommunications Total 1/19/2017 1/23/2017 35,735.00
D-4
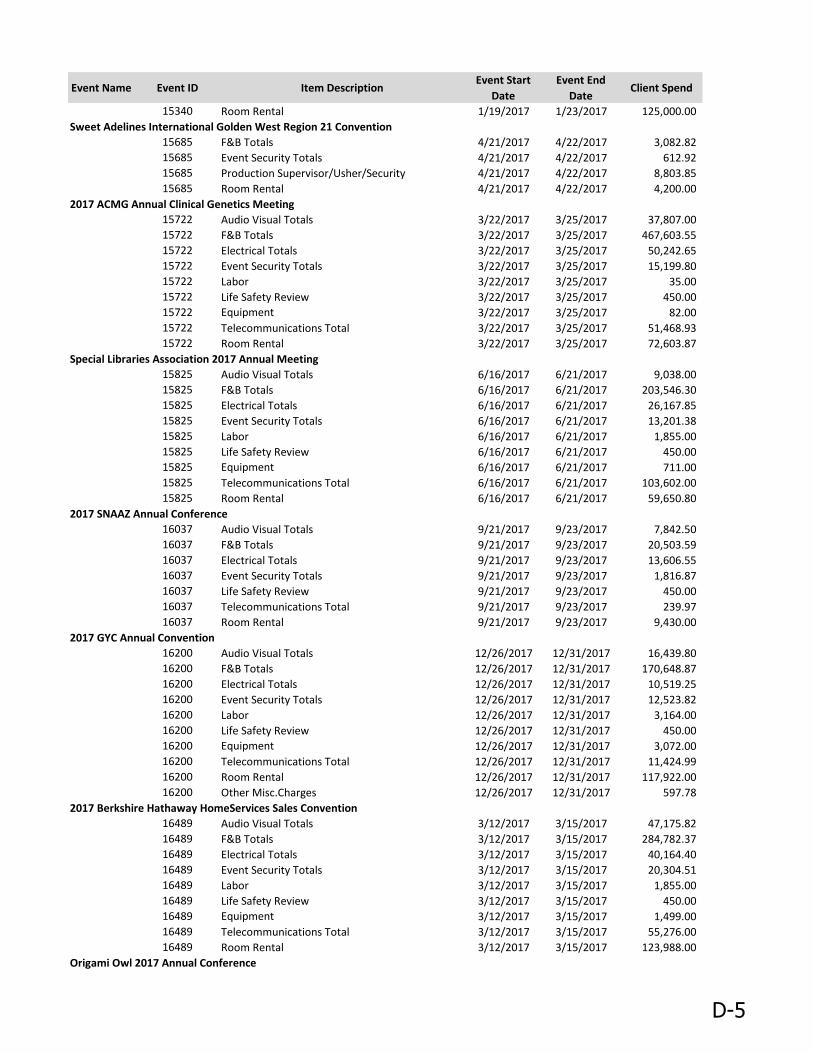
Event Name Event ID Item DescriptionEvent Start
Date
Event End
DateClient Spend
15340 Room Rental 1/19/2017 1/23/2017 125,000.00
Sweet Adelines International Golden West Region 21 Convention
15685 F&B Totals 4/21/2017 4/22/2017 3,082.82
15685 Event Security Totals 4/21/2017 4/22/2017 612.92
15685 Production Supervisor/Usher/Security 4/21/2017 4/22/2017 8,803.85
15685 Room Rental 4/21/2017 4/22/2017 4,200.00
2017 ACMG Annual Clinical Genetics Meeting
15722 Audio Visual Totals 3/22/2017 3/25/2017 37,807.00
15722 F&B Totals 3/22/2017 3/25/2017 467,603.55
15722 Electrical Totals 3/22/2017 3/25/2017 50,242.65
15722 Event Security Totals 3/22/2017 3/25/2017 15,199.80
15722 Labor 3/22/2017 3/25/2017 35.00
15722 Life Safety Review 3/22/2017 3/25/2017 450.00
15722 Equipment 3/22/2017 3/25/2017 82.00
15722 Telecommunications Total 3/22/2017 3/25/2017 51,468.93
15722 Room Rental 3/22/2017 3/25/2017 72,603.87
Special Libraries Association 2017 Annual Meeting
15825 Audio Visual Totals 6/16/2017 6/21/2017 9,038.00
15825 F&B Totals 6/16/2017 6/21/2017 203,546.30
15825 Electrical Totals 6/16/2017 6/21/2017 26,167.85
15825 Event Security Totals 6/16/2017 6/21/2017 13,201.38
15825 Labor 6/16/2017 6/21/2017 1,855.00
15825 Life Safety Review 6/16/2017 6/21/2017 450.00
15825 Equipment 6/16/2017 6/21/2017 711.00
15825 Telecommunications Total 6/16/2017 6/21/2017 103,602.00
15825 Room Rental 6/16/2017 6/21/2017 59,650.80
2017 SNAAZ Annual Conference
16037 Audio Visual Totals 9/21/2017 9/23/2017 7,842.50
16037 F&B Totals 9/21/2017 9/23/2017 20,503.59
16037 Electrical Totals 9/21/2017 9/23/2017 13,606.55
16037 Event Security Totals 9/21/2017 9/23/2017 1,816.87
16037 Life Safety Review 9/21/2017 9/23/2017 450.00
16037 Telecommunications Total 9/21/2017 9/23/2017 239.97
16037 Room Rental 9/21/2017 9/23/2017 9,430.00
2017 GYC Annual Convention
16200 Audio Visual Totals 12/26/2017 12/31/2017 16,439.80
16200 F&B Totals 12/26/2017 12/31/2017 170,648.87
16200 Electrical Totals 12/26/2017 12/31/2017 10,519.25
16200 Event Security Totals 12/26/2017 12/31/2017 12,523.82
16200 Labor 12/26/2017 12/31/2017 3,164.00
16200 Life Safety Review 12/26/2017 12/31/2017 450.00
16200 Equipment 12/26/2017 12/31/2017 3,072.00
16200 Telecommunications Total 12/26/2017 12/31/2017 11,424.99
16200 Room Rental 12/26/2017 12/31/2017 117,922.00
16200 Other Misc.Charges 12/26/2017 12/31/2017 597.78
2017 Berkshire Hathaway HomeServices Sales Convention
16489 Audio Visual Totals 3/12/2017 3/15/2017 47,175.82
16489 F&B Totals 3/12/2017 3/15/2017 284,782.37
16489 Electrical Totals 3/12/2017 3/15/2017 40,164.40
16489 Event Security Totals 3/12/2017 3/15/2017 20,304.51
16489 Labor 3/12/2017 3/15/2017 1,855.00
16489 Life Safety Review 3/12/2017 3/15/2017 450.00
16489 Equipment 3/12/2017 3/15/2017 1,499.00
16489 Telecommunications Total 3/12/2017 3/15/2017 55,276.00
16489 Room Rental 3/12/2017 3/15/2017 123,988.00
Origami Owl 2017 Annual Conference
D-5
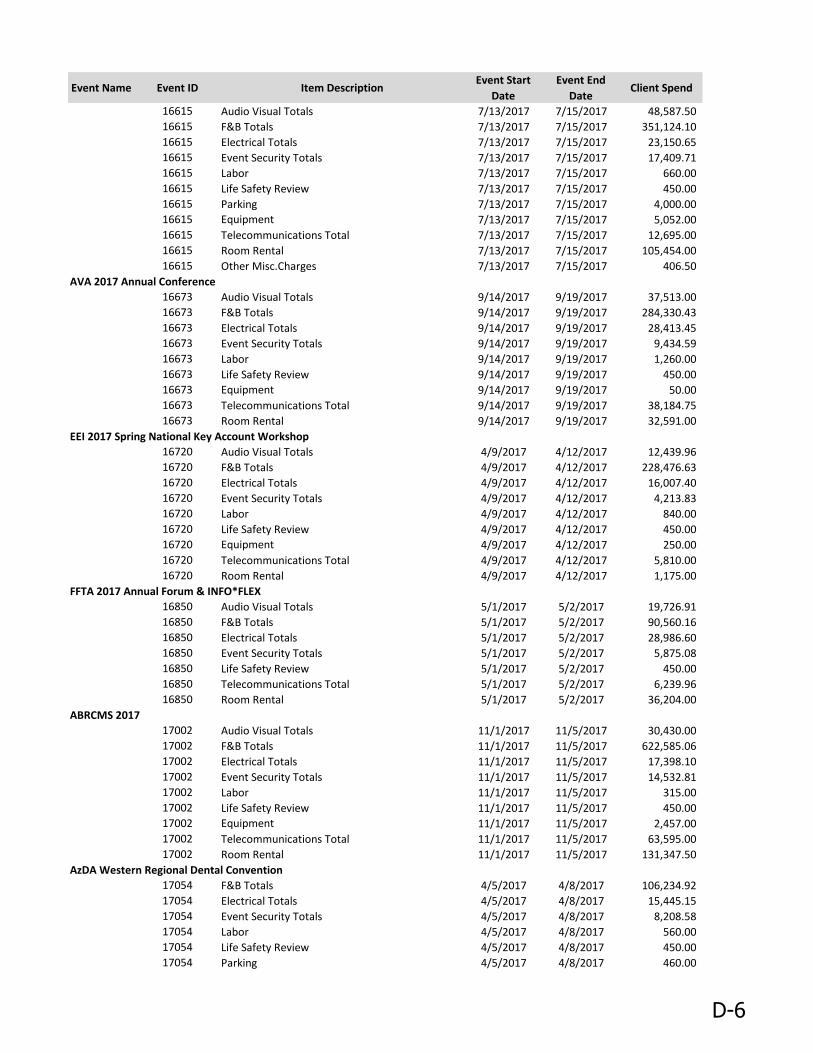
Event Name Event ID Item DescriptionEvent Start
Date
Event End
DateClient Spend
16615 Audio Visual Totals 7/13/2017 7/15/2017 48,587.50
16615 F&B Totals 7/13/2017 7/15/2017 351,124.10
16615 Electrical Totals 7/13/2017 7/15/2017 23,150.65
16615 Event Security Totals 7/13/2017 7/15/2017 17,409.71
16615 Labor 7/13/2017 7/15/2017 660.00
16615 Life Safety Review 7/13/2017 7/15/2017 450.00
16615 Parking 7/13/2017 7/15/2017 4,000.00
16615 Equipment 7/13/2017 7/15/2017 5,052.00
16615 Telecommunications Total 7/13/2017 7/15/2017 12,695.00
16615 Room Rental 7/13/2017 7/15/2017 105,454.00
16615 Other Misc.Charges 7/13/2017 7/15/2017 406.50
AVA 2017 Annual Conference
16673 Audio Visual Totals 9/14/2017 9/19/2017 37,513.00
16673 F&B Totals 9/14/2017 9/19/2017 284,330.43
16673 Electrical Totals 9/14/2017 9/19/2017 28,413.45
16673 Event Security Totals 9/14/2017 9/19/2017 9,434.59
16673 Labor 9/14/2017 9/19/2017 1,260.00
16673 Life Safety Review 9/14/2017 9/19/2017 450.00
16673 Equipment 9/14/2017 9/19/2017 50.00
16673 Telecommunications Total 9/14/2017 9/19/2017 38,184.75
16673 Room Rental 9/14/2017 9/19/2017 32,591.00
EEI 2017 Spring National Key Account Workshop
16720 Audio Visual Totals 4/9/2017 4/12/2017 12,439.96
16720 F&B Totals 4/9/2017 4/12/2017 228,476.63
16720 Electrical Totals 4/9/2017 4/12/2017 16,007.40
16720 Event Security Totals 4/9/2017 4/12/2017 4,213.83
16720 Labor 4/9/2017 4/12/2017 840.00
16720 Life Safety Review 4/9/2017 4/12/2017 450.00
16720 Equipment 4/9/2017 4/12/2017 250.00
16720 Telecommunications Total 4/9/2017 4/12/2017 5,810.00
16720 Room Rental 4/9/2017 4/12/2017 1,175.00
FFTA 2017 Annual Forum & INFO*FLEX
16850 Audio Visual Totals 5/1/2017 5/2/2017 19,726.91
16850 F&B Totals 5/1/2017 5/2/2017 90,560.16
16850 Electrical Totals 5/1/2017 5/2/2017 28,986.60
16850 Event Security Totals 5/1/2017 5/2/2017 5,875.08
16850 Life Safety Review 5/1/2017 5/2/2017 450.00
16850 Telecommunications Total 5/1/2017 5/2/2017 6,239.96
16850 Room Rental 5/1/2017 5/2/2017 36,204.00
ABRCMS 2017
17002 Audio Visual Totals 11/1/2017 11/5/2017 30,430.00
17002 F&B Totals 11/1/2017 11/5/2017 622,585.06
17002 Electrical Totals 11/1/2017 11/5/2017 17,398.10
17002 Event Security Totals 11/1/2017 11/5/2017 14,532.81
17002 Labor 11/1/2017 11/5/2017 315.00
17002 Life Safety Review 11/1/2017 11/5/2017 450.00
17002 Equipment 11/1/2017 11/5/2017 2,457.00
17002 Telecommunications Total 11/1/2017 11/5/2017 63,595.00
17002 Room Rental 11/1/2017 11/5/2017 131,347.50
AzDA Western Regional Dental Convention
17054 F&B Totals 4/5/2017 4/8/2017 106,234.92
17054 Electrical Totals 4/5/2017 4/8/2017 15,445.15
17054 Event Security Totals 4/5/2017 4/8/2017 8,208.58
17054 Labor 4/5/2017 4/8/2017 560.00
17054 Life Safety Review 4/5/2017 4/8/2017 450.00
17054 Parking 4/5/2017 4/8/2017 460.00
D-6
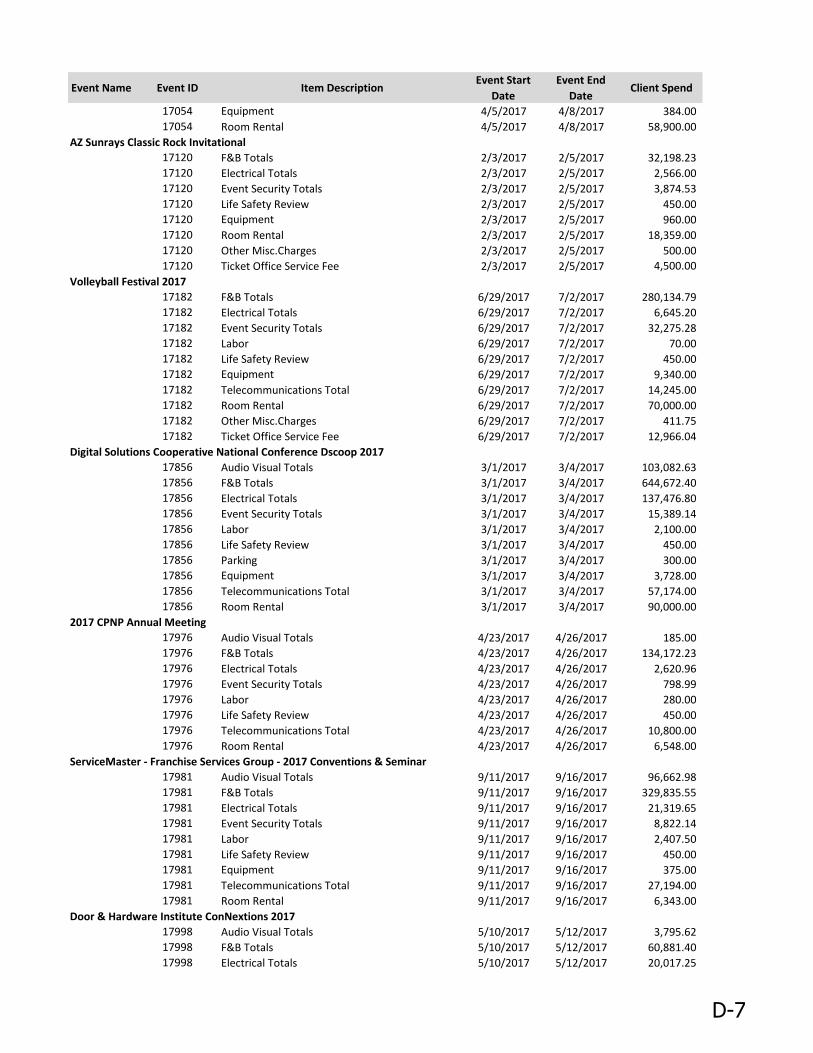
Event Name Event ID Item DescriptionEvent Start
Date
Event End
DateClient Spend
17054 Equipment 4/5/2017 4/8/2017 384.00
17054 Room Rental 4/5/2017 4/8/2017 58,900.00
AZ Sunrays Classic Rock Invitational
17120 F&B Totals 2/3/2017 2/5/2017 32,198.23
17120 Electrical Totals 2/3/2017 2/5/2017 2,566.00
17120 Event Security Totals 2/3/2017 2/5/2017 3,874.53
17120 Life Safety Review 2/3/2017 2/5/2017 450.00
17120 Equipment 2/3/2017 2/5/2017 960.00
17120 Room Rental 2/3/2017 2/5/2017 18,359.00
17120 Other Misc.Charges 2/3/2017 2/5/2017 500.00
17120 Ticket Office Service Fee 2/3/2017 2/5/2017 4,500.00
Volleyball Festival 2017
17182 F&B Totals 6/29/2017 7/2/2017 280,134.79
17182 Electrical Totals 6/29/2017 7/2/2017 6,645.20
17182 Event Security Totals 6/29/2017 7/2/2017 32,275.28
17182 Labor 6/29/2017 7/2/2017 70.00
17182 Life Safety Review 6/29/2017 7/2/2017 450.00
17182 Equipment 6/29/2017 7/2/2017 9,340.00
17182 Telecommunications Total 6/29/2017 7/2/2017 14,245.00
17182 Room Rental 6/29/2017 7/2/2017 70,000.00
17182 Other Misc.Charges 6/29/2017 7/2/2017 411.75
17182 Ticket Office Service Fee 6/29/2017 7/2/2017 12,966.04
Digital Solutions Cooperative National Conference Dscoop 2017
17856 Audio Visual Totals 3/1/2017 3/4/2017 103,082.63
17856 F&B Totals 3/1/2017 3/4/2017 644,672.40
17856 Electrical Totals 3/1/2017 3/4/2017 137,476.80
17856 Event Security Totals 3/1/2017 3/4/2017 15,389.14
17856 Labor 3/1/2017 3/4/2017 2,100.00
17856 Life Safety Review 3/1/2017 3/4/2017 450.00
17856 Parking 3/1/2017 3/4/2017 300.00
17856 Equipment 3/1/2017 3/4/2017 3,728.00
17856 Telecommunications Total 3/1/2017 3/4/2017 57,174.00
17856 Room Rental 3/1/2017 3/4/2017 90,000.00
2017 CPNP Annual Meeting
17976 Audio Visual Totals 4/23/2017 4/26/2017 185.00
17976 F&B Totals 4/23/2017 4/26/2017 134,172.23
17976 Electrical Totals 4/23/2017 4/26/2017 2,620.96
17976 Event Security Totals 4/23/2017 4/26/2017 798.99
17976 Labor 4/23/2017 4/26/2017 280.00
17976 Life Safety Review 4/23/2017 4/26/2017 450.00
17976 Telecommunications Total 4/23/2017 4/26/2017 10,800.00
17976 Room Rental 4/23/2017 4/26/2017 6,548.00
ServiceMaster - Franchise Services Group - 2017 Conventions & Seminar
17981 Audio Visual Totals 9/11/2017 9/16/2017 96,662.98
17981 F&B Totals 9/11/2017 9/16/2017 329,835.55
17981 Electrical Totals 9/11/2017 9/16/2017 21,319.65
17981 Event Security Totals 9/11/2017 9/16/2017 8,822.14
17981 Labor 9/11/2017 9/16/2017 2,407.50
17981 Life Safety Review 9/11/2017 9/16/2017 450.00
17981 Equipment 9/11/2017 9/16/2017 375.00
17981 Telecommunications Total 9/11/2017 9/16/2017 27,194.00
17981 Room Rental 9/11/2017 9/16/2017 6,343.00
Door & Hardware Institute ConNextions 2017
17998 Audio Visual Totals 5/10/2017 5/12/2017 3,795.62
17998 F&B Totals 5/10/2017 5/12/2017 60,881.40
17998 Electrical Totals 5/10/2017 5/12/2017 20,017.25
D-7
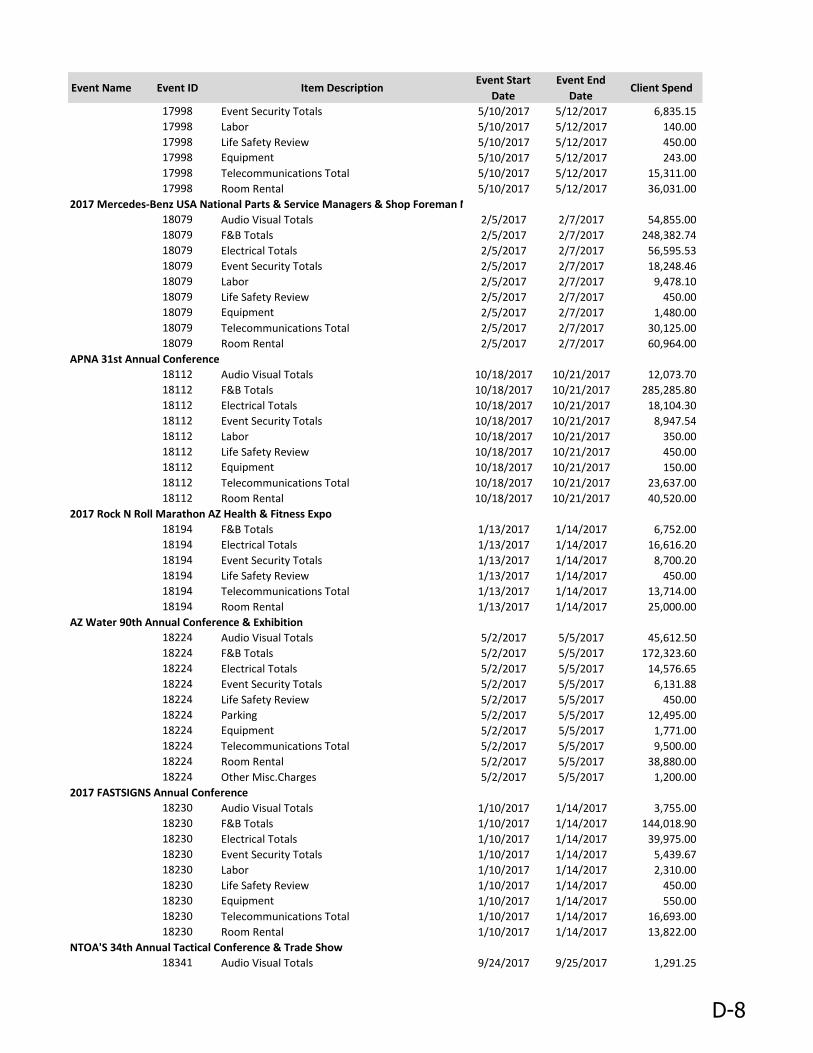
Event Name Event ID Item DescriptionEvent Start
Date
Event End
DateClient Spend
17998 Event Security Totals 5/10/2017 5/12/2017 6,835.15
17998 Labor 5/10/2017 5/12/2017 140.00
17998 Life Safety Review 5/10/2017 5/12/2017 450.00
17998 Equipment 5/10/2017 5/12/2017 243.00
17998 Telecommunications Total 5/10/2017 5/12/2017 15,311.00
17998 Room Rental 5/10/2017 5/12/2017 36,031.00
2017 Mercedes-Benz USA National Parts & Service Managers & Shop Foreman Meetings
18079 Audio Visual Totals 2/5/2017 2/7/2017 54,855.00
18079 F&B Totals 2/5/2017 2/7/2017 248,382.74
18079 Electrical Totals 2/5/2017 2/7/2017 56,595.53
18079 Event Security Totals 2/5/2017 2/7/2017 18,248.46
18079 Labor 2/5/2017 2/7/2017 9,478.10
18079 Life Safety Review 2/5/2017 2/7/2017 450.00
18079 Equipment 2/5/2017 2/7/2017 1,480.00
18079 Telecommunications Total 2/5/2017 2/7/2017 30,125.00
18079 Room Rental 2/5/2017 2/7/2017 60,964.00
APNA 31st Annual Conference
18112 Audio Visual Totals 10/18/2017 10/21/2017 12,073.70
18112 F&B Totals 10/18/2017 10/21/2017 285,285.80
18112 Electrical Totals 10/18/2017 10/21/2017 18,104.30
18112 Event Security Totals 10/18/2017 10/21/2017 8,947.54
18112 Labor 10/18/2017 10/21/2017 350.00
18112 Life Safety Review 10/18/2017 10/21/2017 450.00
18112 Equipment 10/18/2017 10/21/2017 150.00
18112 Telecommunications Total 10/18/2017 10/21/2017 23,637.00
18112 Room Rental 10/18/2017 10/21/2017 40,520.00
2017 Rock N Roll Marathon AZ Health & Fitness Expo
18194 F&B Totals 1/13/2017 1/14/2017 6,752.00
18194 Electrical Totals 1/13/2017 1/14/2017 16,616.20
18194 Event Security Totals 1/13/2017 1/14/2017 8,700.20
18194 Life Safety Review 1/13/2017 1/14/2017 450.00
18194 Telecommunications Total 1/13/2017 1/14/2017 13,714.00
18194 Room Rental 1/13/2017 1/14/2017 25,000.00
AZ Water 90th Annual Conference & Exhibition
18224 Audio Visual Totals 5/2/2017 5/5/2017 45,612.50
18224 F&B Totals 5/2/2017 5/5/2017 172,323.60
18224 Electrical Totals 5/2/2017 5/5/2017 14,576.65
18224 Event Security Totals 5/2/2017 5/5/2017 6,131.88
18224 Life Safety Review 5/2/2017 5/5/2017 450.00
18224 Parking 5/2/2017 5/5/2017 12,495.00
18224 Equipment 5/2/2017 5/5/2017 1,771.00
18224 Telecommunications Total 5/2/2017 5/5/2017 9,500.00
18224 Room Rental 5/2/2017 5/5/2017 38,880.00
18224 Other Misc.Charges 5/2/2017 5/5/2017 1,200.00
2017 FASTSIGNS Annual Conference
18230 Audio Visual Totals 1/10/2017 1/14/2017 3,755.00
18230 F&B Totals 1/10/2017 1/14/2017 144,018.90
18230 Electrical Totals 1/10/2017 1/14/2017 39,975.00
18230 Event Security Totals 1/10/2017 1/14/2017 5,439.67
18230 Labor 1/10/2017 1/14/2017 2,310.00
18230 Life Safety Review 1/10/2017 1/14/2017 450.00
18230 Equipment 1/10/2017 1/14/2017 550.00
18230 Telecommunications Total 1/10/2017 1/14/2017 16,693.00
18230 Room Rental 1/10/2017 1/14/2017 13,822.00
NTOA'S 34th Annual Tactical Conference & Trade Show
18341 Audio Visual Totals 9/24/2017 9/25/2017 1,291.25
D-8

Event Name Event ID Item DescriptionEvent Start
Date
Event End
DateClient Spend
18341 F&B Totals 9/24/2017 9/25/2017 57,979.24
18341 Electrical Totals 9/24/2017 9/25/2017 17,200.45
18341 Event Security Totals 9/24/2017 9/25/2017 2,309.40
18341 Labor 9/24/2017 9/25/2017 420.00
18341 Life Safety Review 9/24/2017 9/25/2017 450.00
18341 Equipment 9/24/2017 9/25/2017 2,408.00
18341 Telecommunications Total 9/24/2017 9/25/2017 1,770.00
18341 Room Rental 9/24/2017 9/25/2017 55,650.00
IECCon17
18360 Audio Visual Totals 10/23/2017 10/28/2017 8,830.00
18360 F&B Totals 10/23/2017 10/28/2017 140,547.88
18360 Electrical Totals 10/23/2017 10/28/2017 23,127.50
18360 Event Security Totals 10/23/2017 10/28/2017 8,701.18
18360 Life Safety Review 10/23/2017 10/28/2017 450.00
18360 Equipment 10/23/2017 10/28/2017 192.00
18360 Telecommunications Total 10/23/2017 10/28/2017 16,191.94
18360 Room Rental 10/23/2017 10/28/2017 24,240.00
National Council of La Raza 2017 Annual Conference
18399 Audio Visual Totals 7/5/2017 7/11/2017 91,728.84
18399 F&B Totals 7/5/2017 7/11/2017 404,230.74
18399 Electrical Totals 7/5/2017 7/11/2017 34,894.35
18399 Event Security Totals 7/5/2017 7/11/2017 31,837.26
18399 Labor 7/5/2017 7/11/2017 70.00
18399 Life Safety Review 7/5/2017 7/11/2017 450.00
18399 Equipment 7/5/2017 7/11/2017 4,661.00
18399 Telecommunications Total 7/5/2017 7/11/2017 49,132.97
18399 Room Rental 7/5/2017 7/11/2017 -
TecHome Builder Summit
18633 F&B Totals 12/3/2017 12/6/2017 102,255.80
18633 Electrical Totals 12/3/2017 12/6/2017 19,099.15
18633 Event Security Totals 12/3/2017 12/6/2017 5,162.35
18633 Labor 12/3/2017 12/6/2017 280.00
18633 Life Safety Review 12/3/2017 12/6/2017 450.00
18633 Equipment 12/3/2017 12/6/2017 123.00
18633 Telecommunications Total 12/3/2017 12/6/2017 5,869.00
18633 Room Rental 12/3/2017 12/6/2017 43,030.00
2017 Educators Rising National Conference
18798 F&B Totals 6/24/2017 6/26/2017 79,829.62
18798 Electrical Totals 6/24/2017 6/26/2017 3,493.75
18798 Event Security Totals 6/24/2017 6/26/2017 2,955.15
18798 Life Safety Review 6/24/2017 6/26/2017 450.00
18798 Room Rental 6/24/2017 6/26/2017 35,998.00
RailsConf 2017
18846 Audio Visual Totals 4/25/2017 4/27/2017 125.00
18846 F&B Totals 4/25/2017 4/27/2017 356,878.07
18846 Electrical Totals 4/25/2017 4/27/2017 41,076.95
18846 Event Security Totals 4/25/2017 4/27/2017 5,888.39
18846 Life Safety Review 4/25/2017 4/27/2017 450.00
18846 Equipment 4/25/2017 4/27/2017 828.00
18846 Telecommunications Total 4/25/2017 4/27/2017 49,704.00
18846 Room Rental 4/25/2017 4/27/2017 -
IEEE VIS Conference
18855 Audio Visual Totals 10/1/2017 10/6/2017 790.00
18855 F&B Totals 10/1/2017 10/6/2017 199,368.52
18855 Electrical Totals 10/1/2017 10/6/2017 2,556.40
18855 Event Security Totals 10/1/2017 10/6/2017 5,259.08
D-9
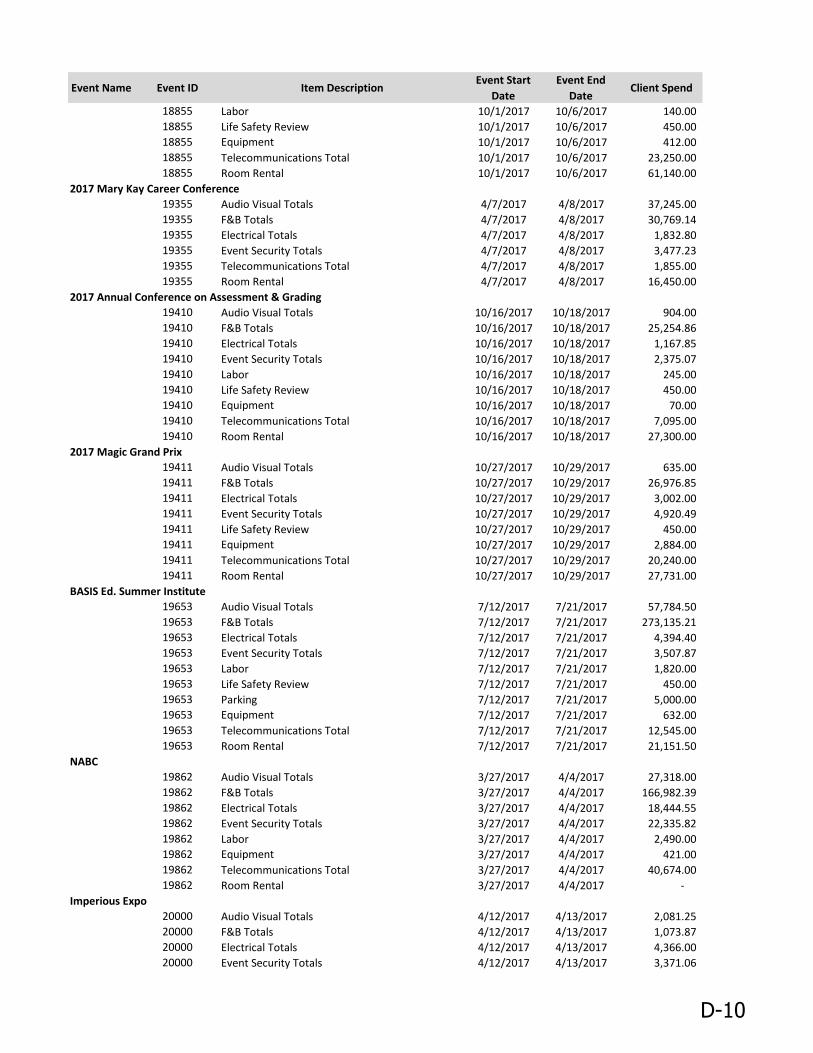
Event Name Event ID Item DescriptionEvent Start
Date
Event End
DateClient Spend
18855 Labor 10/1/2017 10/6/2017 140.00
18855 Life Safety Review 10/1/2017 10/6/2017 450.00
18855 Equipment 10/1/2017 10/6/2017 412.00
18855 Telecommunications Total 10/1/2017 10/6/2017 23,250.00
18855 Room Rental 10/1/2017 10/6/2017 61,140.00
2017 Mary Kay Career Conference
19355 Audio Visual Totals 4/7/2017 4/8/2017 37,245.00
19355 F&B Totals 4/7/2017 4/8/2017 30,769.14
19355 Electrical Totals 4/7/2017 4/8/2017 1,832.80
19355 Event Security Totals 4/7/2017 4/8/2017 3,477.23
19355 Telecommunications Total 4/7/2017 4/8/2017 1,855.00
19355 Room Rental 4/7/2017 4/8/2017 16,450.00
2017 Annual Conference on Assessment & Grading
19410 Audio Visual Totals 10/16/2017 10/18/2017 904.00
19410 F&B Totals 10/16/2017 10/18/2017 25,254.86
19410 Electrical Totals 10/16/2017 10/18/2017 1,167.85
19410 Event Security Totals 10/16/2017 10/18/2017 2,375.07
19410 Labor 10/16/2017 10/18/2017 245.00
19410 Life Safety Review 10/16/2017 10/18/2017 450.00
19410 Equipment 10/16/2017 10/18/2017 70.00
19410 Telecommunications Total 10/16/2017 10/18/2017 7,095.00
19410 Room Rental 10/16/2017 10/18/2017 27,300.00
2017 Magic Grand Prix
19411 Audio Visual Totals 10/27/2017 10/29/2017 635.00
19411 F&B Totals 10/27/2017 10/29/2017 26,976.85
19411 Electrical Totals 10/27/2017 10/29/2017 3,002.00
19411 Event Security Totals 10/27/2017 10/29/2017 4,920.49
19411 Life Safety Review 10/27/2017 10/29/2017 450.00
19411 Equipment 10/27/2017 10/29/2017 2,884.00
19411 Telecommunications Total 10/27/2017 10/29/2017 20,240.00
19411 Room Rental 10/27/2017 10/29/2017 27,731.00
BASIS Ed. Summer Institute
19653 Audio Visual Totals 7/12/2017 7/21/2017 57,784.50
19653 F&B Totals 7/12/2017 7/21/2017 273,135.21
19653 Electrical Totals 7/12/2017 7/21/2017 4,394.40
19653 Event Security Totals 7/12/2017 7/21/2017 3,507.87
19653 Labor 7/12/2017 7/21/2017 1,820.00
19653 Life Safety Review 7/12/2017 7/21/2017 450.00
19653 Parking 7/12/2017 7/21/2017 5,000.00
19653 Equipment 7/12/2017 7/21/2017 632.00
19653 Telecommunications Total 7/12/2017 7/21/2017 12,545.00
19653 Room Rental 7/12/2017 7/21/2017 21,151.50
NABC
19862 Audio Visual Totals 3/27/2017 4/4/2017 27,318.00
19862 F&B Totals 3/27/2017 4/4/2017 166,982.39
19862 Electrical Totals 3/27/2017 4/4/2017 18,444.55
19862 Event Security Totals 3/27/2017 4/4/2017 22,335.82
19862 Labor 3/27/2017 4/4/2017 2,490.00
19862 Equipment 3/27/2017 4/4/2017 421.00
19862 Telecommunications Total 3/27/2017 4/4/2017 40,674.00
19862 Room Rental 3/27/2017 4/4/2017 -
Imperious Expo
20000 Audio Visual Totals 4/12/2017 4/13/2017 2,081.25
20000 F&B Totals 4/12/2017 4/13/2017 1,073.87
20000 Electrical Totals 4/12/2017 4/13/2017 4,366.00
20000 Event Security Totals 4/12/2017 4/13/2017 3,371.06
D-10
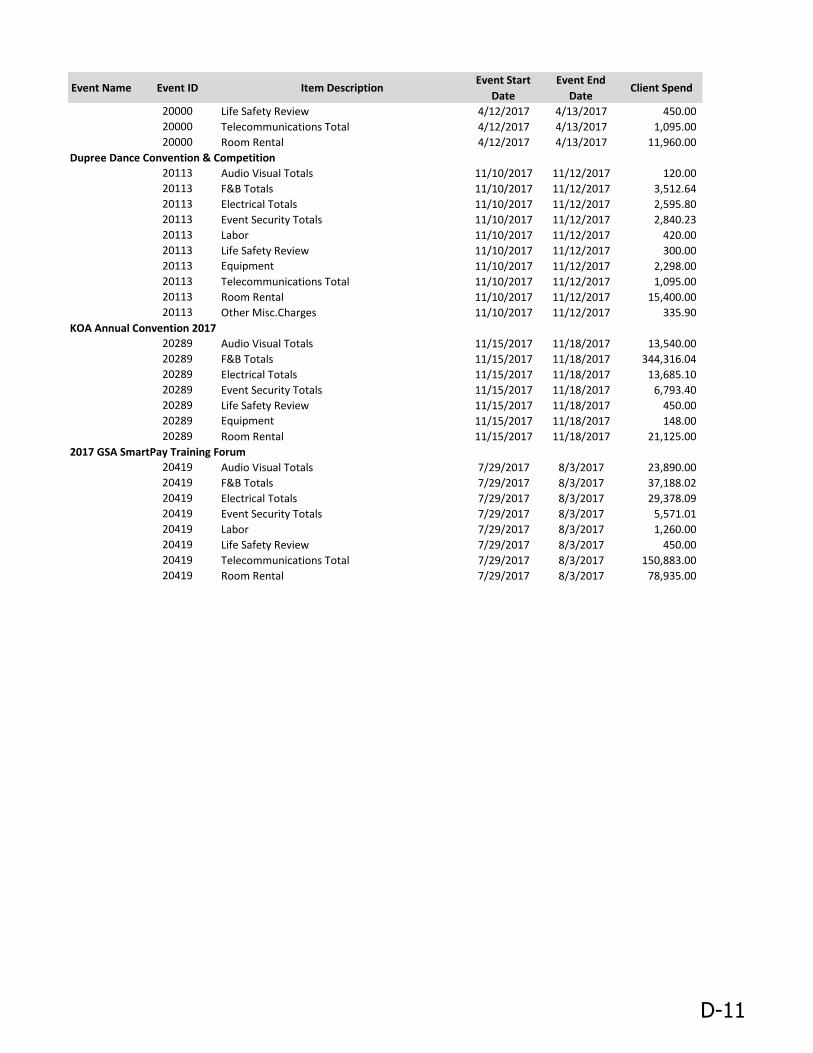
Event Name Event ID Item DescriptionEvent Start
Date
Event End
DateClient Spend
20000 Life Safety Review 4/12/2017 4/13/2017 450.00
20000 Telecommunications Total 4/12/2017 4/13/2017 1,095.00
20000 Room Rental 4/12/2017 4/13/2017 11,960.00
Dupree Dance Convention & Competition
20113 Audio Visual Totals 11/10/2017 11/12/2017 120.00
20113 F&B Totals 11/10/2017 11/12/2017 3,512.64
20113 Electrical Totals 11/10/2017 11/12/2017 2,595.80
20113 Event Security Totals 11/10/2017 11/12/2017 2,840.23
20113 Labor 11/10/2017 11/12/2017 420.00
20113 Life Safety Review 11/10/2017 11/12/2017 300.00
20113 Equipment 11/10/2017 11/12/2017 2,298.00
20113 Telecommunications Total 11/10/2017 11/12/2017 1,095.00
20113 Room Rental 11/10/2017 11/12/2017 15,400.00
20113 Other Misc.Charges 11/10/2017 11/12/2017 335.90
KOA Annual Convention 2017
20289 Audio Visual Totals 11/15/2017 11/18/2017 13,540.00
20289 F&B Totals 11/15/2017 11/18/2017 344,316.04
20289 Electrical Totals 11/15/2017 11/18/2017 13,685.10
20289 Event Security Totals 11/15/2017 11/18/2017 6,793.40
20289 Life Safety Review 11/15/2017 11/18/2017 450.00
20289 Equipment 11/15/2017 11/18/2017 148.00
20289 Room Rental 11/15/2017 11/18/2017 21,125.00
2017 GSA SmartPay Training Forum
20419 Audio Visual Totals 7/29/2017 8/3/2017 23,890.00
20419 F&B Totals 7/29/2017 8/3/2017 37,188.02
20419 Electrical Totals 7/29/2017 8/3/2017 29,378.09
20419 Event Security Totals 7/29/2017 8/3/2017 5,571.01
20419 Labor 7/29/2017 8/3/2017 1,260.00
20419 Life Safety Review 7/29/2017 8/3/2017 450.00
20419 Telecommunications Total 7/29/2017 8/3/2017 150,883.00
20419 Room Rental 7/29/2017 8/3/2017 78,935.00
D-11
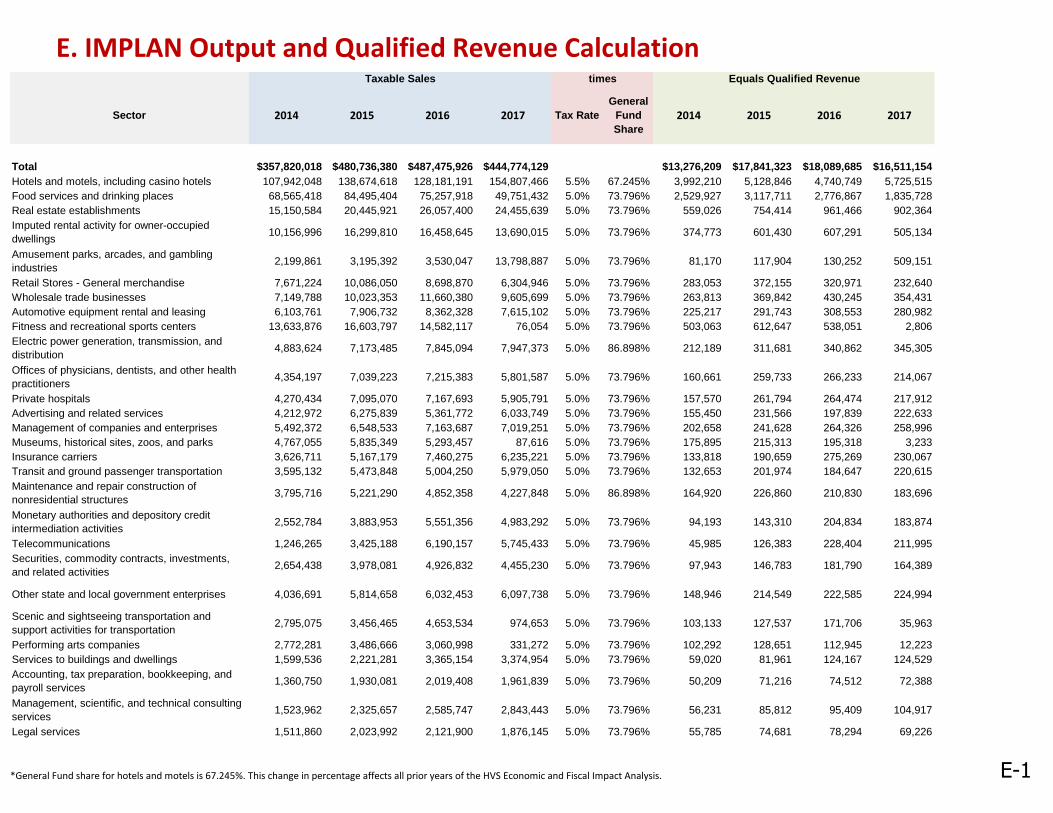
E. IMPLAN Output and Qualified Revenue CalculationTaxable Sales times Equals Qualified Revenue
Sector 2014 2015 2016 2017 Tax Rate
General
Fund
Share
2014 2015 2016 2017
Total $357,820,018 $480,736,380 $487,475,926 $444,774,129 $13,276,209 $17,841,323 $18,089,685 $16,511,154
Hotels and motels, including casino hotels 107,942,048 138,674,618 128,181,191 154,807,466 5.5% 67.245% 3,992,210 5,128,846 4,740,749 5,725,515
Food services and drinking places 68,565,418 84,495,404 75,257,918 49,751,432 5.0% 73.796% 2,529,927 3,117,711 2,776,867 1,835,728
Real estate establishments 15,150,584 20,445,921 26,057,400 24,455,639 5.0% 73.796% 559,026 754,414 961,466 902,364
Imputed rental activity for owner-occupied
dwellings10,156,996 16,299,810 16,458,645 13,690,015 5.0% 73.796% 374,773 601,430 607,291 505,134
Amusement parks, arcades, and gambling
industries2,199,861 3,195,392 3,530,047 13,798,887 5.0% 73.796% 81,170 117,904 130,252 509,151
Retail Stores - General merchandise 7,671,224 10,086,050 8,698,870 6,304,946 5.0% 73.796% 283,053 372,155 320,971 232,640
Wholesale trade businesses 7,149,788 10,023,353 11,660,380 9,605,699 5.0% 73.796% 263,813 369,842 430,245 354,431
Automotive equipment rental and leasing 6,103,761 7,906,732 8,362,328 7,615,102 5.0% 73.796% 225,217 291,743 308,553 280,982
Fitness and recreational sports centers 13,633,876 16,603,797 14,582,117 76,054 5.0% 73.796% 503,063 612,647 538,051 2,806
Electric power generation, transmission, and
distribution4,883,624 7,173,485 7,845,094 7,947,373 5.0% 86.898% 212,189 311,681 340,862 345,305
Offices of physicians, dentists, and other health
practitioners4,354,197 7,039,223 7,215,383 5,801,587 5.0% 73.796% 160,661 259,733 266,233 214,067
Private hospitals 4,270,434 7,095,070 7,167,693 5,905,791 5.0% 73.796% 157,570 261,794 264,474 217,912
Advertising and related services 4,212,972 6,275,839 5,361,772 6,033,749 5.0% 73.796% 155,450 231,566 197,839 222,633
Management of companies and enterprises 5,492,372 6,548,533 7,163,687 7,019,251 5.0% 73.796% 202,658 241,628 264,326 258,996
Museums, historical sites, zoos, and parks 4,767,055 5,835,349 5,293,457 87,616 5.0% 73.796% 175,895 215,313 195,318 3,233
Insurance carriers 3,626,711 5,167,179 7,460,275 6,235,221 5.0% 73.796% 133,818 190,659 275,269 230,067
Transit and ground passenger transportation 3,595,132 5,473,848 5,004,250 5,979,050 5.0% 73.796% 132,653 201,974 184,647 220,615
Maintenance and repair construction of
nonresidential structures3,795,716 5,221,290 4,852,358 4,227,848 5.0% 86.898% 164,920 226,860 210,830 183,696
Monetary authorities and depository credit
intermediation activities2,552,784 3,883,953 5,551,356 4,983,292 5.0% 73.796% 94,193 143,310 204,834 183,874
Telecommunications 1,246,265 3,425,188 6,190,157 5,745,433 5.0% 73.796% 45,985 126,383 228,404 211,995
Securities, commodity contracts, investments,
and related activities2,654,438 3,978,081 4,926,832 4,455,230 5.0% 73.796% 97,943 146,783 181,790 164,389
Other state and local government enterprises 4,036,691 5,814,658 6,032,453 6,097,738 5.0% 73.796% 148,946 214,549 222,585 224,994
Scenic and sightseeing transportation and
support activities for transportation2,795,075 3,456,465 4,653,534 974,653 5.0% 73.796% 103,133 127,537 171,706 35,963
Performing arts companies 2,772,281 3,486,666 3,060,998 331,272 5.0% 73.796% 102,292 128,651 112,945 12,223
Services to buildings and dwellings 1,599,536 2,221,281 3,365,154 3,374,954 5.0% 73.796% 59,020 81,961 124,167 124,529
Accounting, tax preparation, bookkeeping, and
payroll services1,360,750 1,930,081 2,019,408 1,961,839 5.0% 73.796% 50,209 71,216 74,512 72,388
Management, scientific, and technical consulting
services1,523,962 2,325,657 2,585,747 2,843,443 5.0% 73.796% 56,231 85,812 95,409 104,917
Legal services 1,511,860 2,023,992 2,121,900 1,876,145 5.0% 73.796% 55,785 74,681 78,294 69,226
*General Fund share for hotels and motels is 67.245%. This change in percentage affects all prior years of the HVS Economic and Fiscal Impact Analysis. E-1
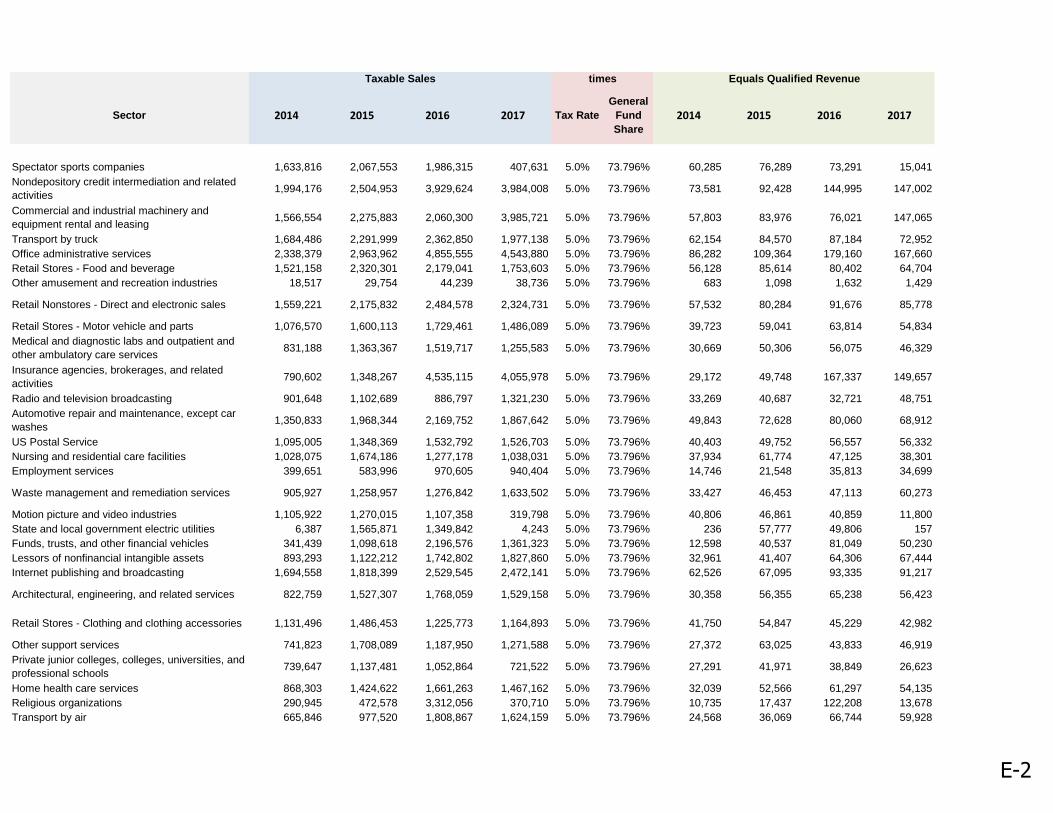
Taxable Sales times Equals Qualified Revenue
Sector 2014 2015 2016 2017 Tax Rate
General
Fund
Share
2014 2015 2016 2017
Spectator sports companies 1,633,816 2,067,553 1,986,315 407,631 5.0% 73.796% 60,285 76,289 73,291 15,041
Nondepository credit intermediation and related
activities1,994,176 2,504,953 3,929,624 3,984,008 5.0% 73.796% 73,581 92,428 144,995 147,002
Commercial and industrial machinery and
equipment rental and leasing1,566,554 2,275,883 2,060,300 3,985,721 5.0% 73.796% 57,803 83,976 76,021 147,065
Transport by truck 1,684,486 2,291,999 2,362,850 1,977,138 5.0% 73.796% 62,154 84,570 87,184 72,952
Office administrative services 2,338,379 2,963,962 4,855,555 4,543,880 5.0% 73.796% 86,282 109,364 179,160 167,660
Retail Stores - Food and beverage 1,521,158 2,320,301 2,179,041 1,753,603 5.0% 73.796% 56,128 85,614 80,402 64,704
Other amusement and recreation industries 18,517 29,754 44,239 38,736 5.0% 73.796% 683 1,098 1,632 1,429
Retail Nonstores - Direct and electronic sales 1,559,221 2,175,832 2,484,578 2,324,731 5.0% 73.796% 57,532 80,284 91,676 85,778
Retail Stores - Motor vehicle and parts 1,076,570 1,600,113 1,729,461 1,486,089 5.0% 73.796% 39,723 59,041 63,814 54,834
Medical and diagnostic labs and outpatient and
other ambulatory care services831,188 1,363,367 1,519,717 1,255,583 5.0% 73.796% 30,669 50,306 56,075 46,329
Insurance agencies, brokerages, and related
activities790,602 1,348,267 4,535,115 4,055,978 5.0% 73.796% 29,172 49,748 167,337 149,657
Radio and television broadcasting 901,648 1,102,689 886,797 1,321,230 5.0% 73.796% 33,269 40,687 32,721 48,751
Automotive repair and maintenance, except car
washes1,350,833 1,968,344 2,169,752 1,867,642 5.0% 73.796% 49,843 72,628 80,060 68,912
US Postal Service 1,095,005 1,348,369 1,532,792 1,526,703 5.0% 73.796% 40,403 49,752 56,557 56,332
Nursing and residential care facilities 1,028,075 1,674,186 1,277,178 1,038,031 5.0% 73.796% 37,934 61,774 47,125 38,301
Employment services 399,651 583,996 970,605 940,404 5.0% 73.796% 14,746 21,548 35,813 34,699
Waste management and remediation services 905,927 1,258,957 1,276,842 1,633,502 5.0% 73.796% 33,427 46,453 47,113 60,273
Motion picture and video industries 1,105,922 1,270,015 1,107,358 319,798 5.0% 73.796% 40,806 46,861 40,859 11,800
State and local government electric utilities 6,387 1,565,871 1,349,842 4,243 5.0% 73.796% 236 57,777 49,806 157
Funds, trusts, and other financial vehicles 341,439 1,098,618 2,196,576 1,361,323 5.0% 73.796% 12,598 40,537 81,049 50,230
Lessors of nonfinancial intangible assets 893,293 1,122,212 1,742,802 1,827,860 5.0% 73.796% 32,961 41,407 64,306 67,444
Internet publishing and broadcasting 1,694,558 1,818,399 2,529,545 2,472,141 5.0% 73.796% 62,526 67,095 93,335 91,217
Architectural, engineering, and related services 822,759 1,527,307 1,768,059 1,529,158 5.0% 73.796% 30,358 56,355 65,238 56,423
Retail Stores - Clothing and clothing accessories 1,131,496 1,486,453 1,225,773 1,164,893 5.0% 73.796% 41,750 54,847 45,229 42,982
Other support services 741,823 1,708,089 1,187,950 1,271,588 5.0% 73.796% 27,372 63,025 43,833 46,919
Private junior colleges, colleges, universities, and
professional schools739,647 1,137,481 1,052,864 721,522 5.0% 73.796% 27,291 41,971 38,849 26,623
Home health care services 868,303 1,424,622 1,661,263 1,467,162 5.0% 73.796% 32,039 52,566 61,297 54,135
Religious organizations 290,945 472,578 3,312,056 370,710 5.0% 73.796% 10,735 17,437 122,208 13,678
Transport by air 665,846 977,520 1,808,867 1,624,159 5.0% 73.796% 24,568 36,069 66,744 59,928
E-2
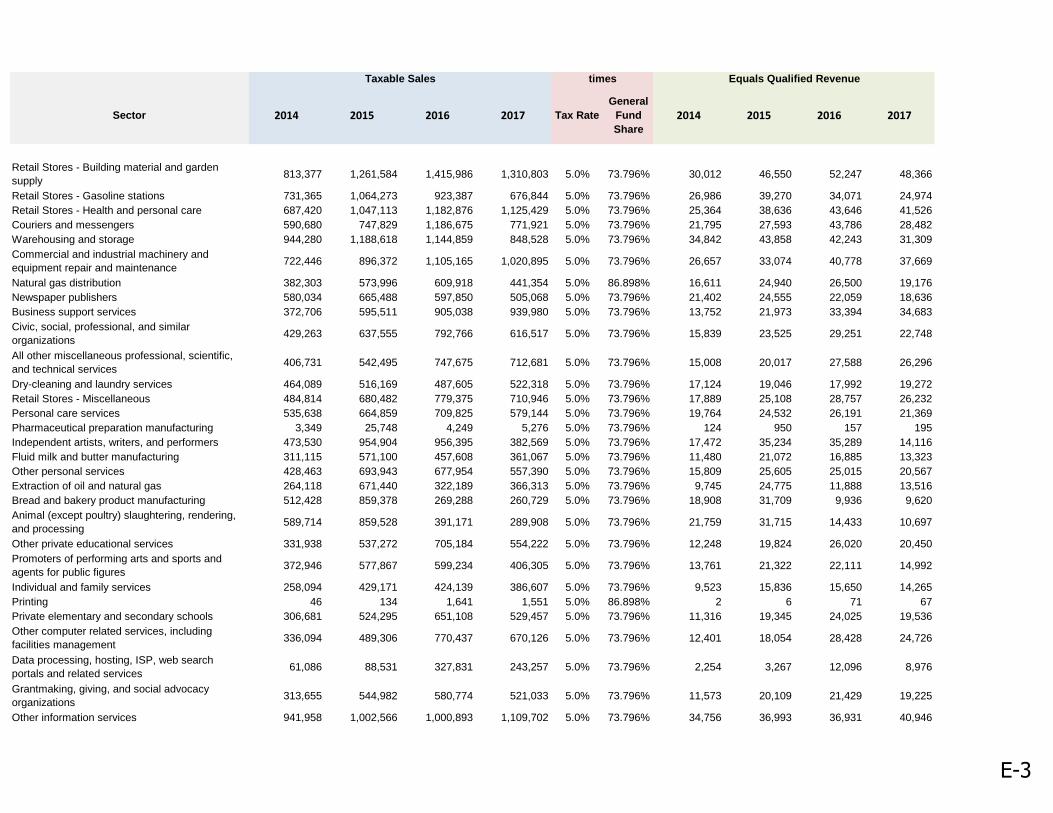
Taxable Sales times Equals Qualified Revenue
Sector 2014 2015 2016 2017 Tax Rate
General
Fund
Share
2014 2015 2016 2017
Retail Stores - Building material and garden
supply813,377 1,261,584 1,415,986 1,310,803 5.0% 73.796% 30,012 46,550 52,247 48,366
Retail Stores - Gasoline stations 731,365 1,064,273 923,387 676,844 5.0% 73.796% 26,986 39,270 34,071 24,974
Retail Stores - Health and personal care 687,420 1,047,113 1,182,876 1,125,429 5.0% 73.796% 25,364 38,636 43,646 41,526
Couriers and messengers 590,680 747,829 1,186,675 771,921 5.0% 73.796% 21,795 27,593 43,786 28,482
Warehousing and storage 944,280 1,188,618 1,144,859 848,528 5.0% 73.796% 34,842 43,858 42,243 31,309
Commercial and industrial machinery and
equipment repair and maintenance722,446 896,372 1,105,165 1,020,895 5.0% 73.796% 26,657 33,074 40,778 37,669
Natural gas distribution 382,303 573,996 609,918 441,354 5.0% 86.898% 16,611 24,940 26,500 19,176
Newspaper publishers 580,034 665,488 597,850 505,068 5.0% 73.796% 21,402 24,555 22,059 18,636
Business support services 372,706 595,511 905,038 939,980 5.0% 73.796% 13,752 21,973 33,394 34,683
Civic, social, professional, and similar
organizations429,263 637,555 792,766 616,517 5.0% 73.796% 15,839 23,525 29,251 22,748
All other miscellaneous professional, scientific,
and technical services406,731 542,495 747,675 712,681 5.0% 73.796% 15,008 20,017 27,588 26,296
Dry-cleaning and laundry services 464,089 516,169 487,605 522,318 5.0% 73.796% 17,124 19,046 17,992 19,272
Retail Stores - Miscellaneous 484,814 680,482 779,375 710,946 5.0% 73.796% 17,889 25,108 28,757 26,232
Personal care services 535,638 664,859 709,825 579,144 5.0% 73.796% 19,764 24,532 26,191 21,369
Pharmaceutical preparation manufacturing 3,349 25,748 4,249 5,276 5.0% 73.796% 124 950 157 195
Independent artists, writers, and performers 473,530 954,904 956,395 382,569 5.0% 73.796% 17,472 35,234 35,289 14,116
Fluid milk and butter manufacturing 311,115 571,100 457,608 361,067 5.0% 73.796% 11,480 21,072 16,885 13,323
Other personal services 428,463 693,943 677,954 557,390 5.0% 73.796% 15,809 25,605 25,015 20,567
Extraction of oil and natural gas 264,118 671,440 322,189 366,313 5.0% 73.796% 9,745 24,775 11,888 13,516
Bread and bakery product manufacturing 512,428 859,378 269,288 260,729 5.0% 73.796% 18,908 31,709 9,936 9,620
Animal (except poultry) slaughtering, rendering,
and processing589,714 859,528 391,171 289,908 5.0% 73.796% 21,759 31,715 14,433 10,697
Other private educational services 331,938 537,272 705,184 554,222 5.0% 73.796% 12,248 19,824 26,020 20,450
Promoters of performing arts and sports and
agents for public figures372,946 577,867 599,234 406,305 5.0% 73.796% 13,761 21,322 22,111 14,992
Individual and family services 258,094 429,171 424,139 386,607 5.0% 73.796% 9,523 15,836 15,650 14,265
Printing 46 134 1,641 1,551 5.0% 86.898% 2 6 71 67
Private elementary and secondary schools 306,681 524,295 651,108 529,457 5.0% 73.796% 11,316 19,345 24,025 19,536
Other computer related services, including
facilities management336,094 489,306 770,437 670,126 5.0% 73.796% 12,401 18,054 28,428 24,726
Data processing, hosting, ISP, web search
portals and related services61,086 88,531 327,831 243,257 5.0% 73.796% 2,254 3,267 12,096 8,976
Grantmaking, giving, and social advocacy
organizations313,655 544,982 580,774 521,033 5.0% 73.796% 11,573 20,109 21,429 19,225
Other information services 941,958 1,002,566 1,000,893 1,109,702 5.0% 73.796% 34,756 36,993 36,931 40,946
E-3

Taxable Sales times Equals Qualified Revenue
Sector 2014 2015 2016 2017 Tax Rate
General
Fund
Share
2014 2015 2016 2017
Personal and household goods repair and
maintenance459,208 657,946 723,194 676,193 5.0% 73.796% 16,944 24,277 26,684 24,950
Retail Stores - Sporting goods, hobby, book and
music291,444 402,146 469,369 380,076 5.0% 73.796% 10,754 14,838 17,319 14,024
Computer systems design services 310,000 460,489 593,861 540,092 5.0% 73.796% 11,438 16,991 21,912 19,928
Child day care services 505,216 637,969 711,382 573,736 5.0% 73.796% 18,641 23,540 26,249 21,170
Periodical publishers 306,250 408,555 446,943 379,226 5.0% 73.796% 11,300 15,075 16,491 13,993
Retail Stores - Furniture and home furnishings 342,888 522,576 658,099 602,206 5.0% 73.796% 12,652 19,282 24,283 22,220
Soft drink and ice manufacturing 310,827 365,193 1,150,162 1,010,625 5.0% 73.796% 11,469 13,475 42,439 37,290
Retail Stores - Electronics and appliances 226,067 369,802 419,597 349,064 5.0% 73.796% 8,341 13,645 15,482 12,880
Investigation and security services 312,490 460,108 613,427 590,580 5.0% 73.796% 11,530 16,977 22,634 21,791
Travel arrangement and reservation services 122,942 158,504 253,768 228,175 5.0% 73.796% 4,536 5,848 9,364 8,419
Semiconductor and related device manufacturing 339,740 564,424 294,694 275,798 5.0% 73.796% 12,536 20,826 10,874 10,176
Facilities support services 399,822 570,883 861,608 832,282 5.0% 73.796% 14,753 21,064 31,792 30,710
Cheese manufacturing 581,340 206,533 28,475 8,867 5.0% 73.796% 21,450 7,621 1,051 327
Transport by rail 329,864 382,916 428,489 348,302 5.0% 73.796% 12,171 14,129 15,810 12,852
Dairy cattle and milk production 421,537 421,014 227,071 132,471 5.0% 73.796% 15,554 15,535 8,378 4,888
Electronic and precision equipment repair and
maintenance305,344 438,273 451,511 407,599 5.0% 73.796% 11,267 16,171 16,660 15,040
Support activities for printing 619,031 850,460 815,277 742,379 5.0% 86.898% 26,896 36,952 35,423 32,256
Cable and other subscription programming 497,074 768,910 772,967 969,747 5.0% 73.796% 18,341 28,371 28,521 35,782
Environmental and other technical consulting
services258,678 382,824 413,646 386,039 5.0% 73.796% 9,545 14,125 15,263 14,244
Cattle ranching and farming 289,639 554,535 220,233 128,231 5.0% 73.796% 10,687 20,461 8,126 4,731
Community food, housing, and other relief
services, including rehabilitation services246,852 478,121 451,186 370,634 5.0% 73.796% 9,108 17,642 16,648 13,676
All other food manufacturing 275,655 479,433 103,670 41,036 5.0% 73.796% 10,171 17,690 3,825 1,514
Dry, condensed, and evaporated dairy product
manufacturing334,951 307,609 120,937 104,785 5.0% 73.796% 12,359 11,350 4,462 3,866
In-vitro diagnostic substance manufacturing 634,845 941,141 429,264 279,672 5.0% 73.796% 23,424 34,726 15,839 10,319
Water, sewage and other treatment and delivery
systems202,360 234,172 222,631 201,278 5.0% 86.898% 8,792 10,175 9,673 8,745
Veterinary services 213,450 361,570 386,368 337,173 5.0% 73.796% 7,876 13,341 14,256 12,441
Soap and cleaning compound manufacturing 181,028 242,110 73,202 69,439 5.0% 73.796% 6,680 8,933 2,701 2,562
Surgical appliance and supplies manufacturing 169,313 255,540 27,481 20,305 5.0% 73.796% 6,247 9,429 1,014 749
Bowling centers 241,534 481,597 599,723 496,189 5.0% 73.796% 8,912 17,770 22,129 18,308
E-4
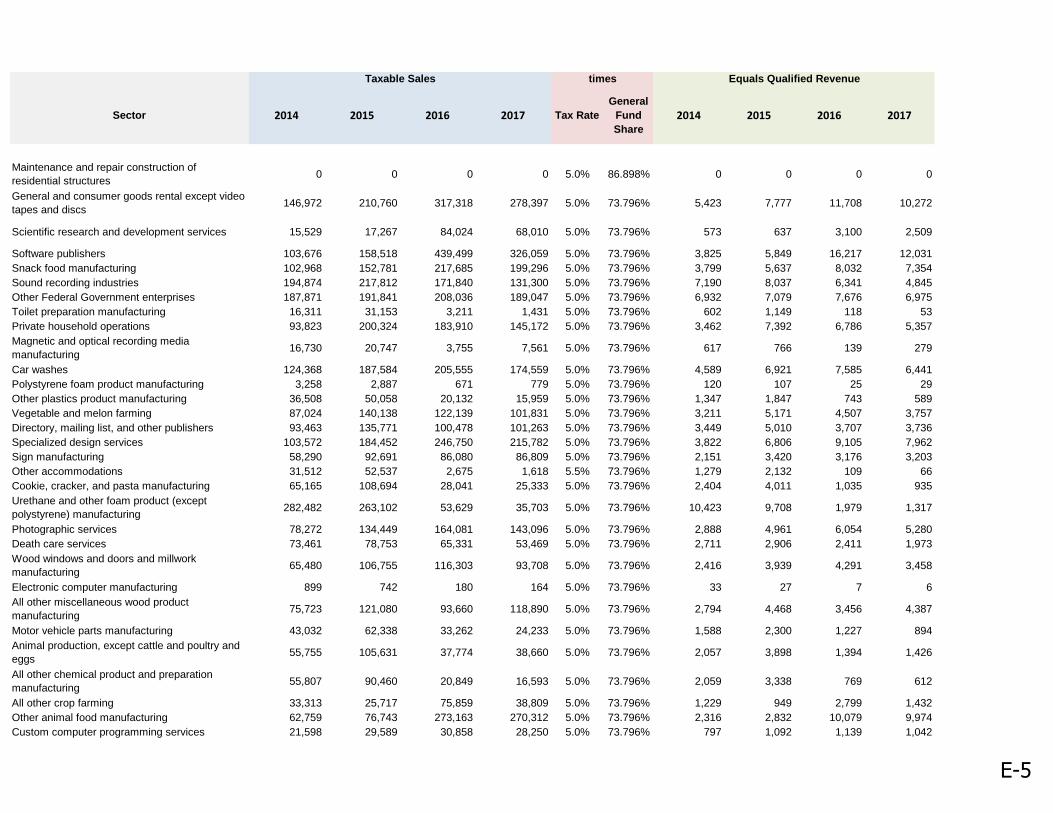
Taxable Sales times Equals Qualified Revenue
Sector 2014 2015 2016 2017 Tax Rate
General
Fund
Share
2014 2015 2016 2017
Maintenance and repair construction of
residential structures0 0 0 0 5.0% 86.898% 0 0 0 0
General and consumer goods rental except video
tapes and discs146,972 210,760 317,318 278,397 5.0% 73.796% 5,423 7,777 11,708 10,272
Scientific research and development services 15,529 17,267 84,024 68,010 5.0% 73.796% 573 637 3,100 2,509
Software publishers 103,676 158,518 439,499 326,059 5.0% 73.796% 3,825 5,849 16,217 12,031
Snack food manufacturing 102,968 152,781 217,685 199,296 5.0% 73.796% 3,799 5,637 8,032 7,354
Sound recording industries 194,874 217,812 171,840 131,300 5.0% 73.796% 7,190 8,037 6,341 4,845
Other Federal Government enterprises 187,871 191,841 208,036 189,047 5.0% 73.796% 6,932 7,079 7,676 6,975
Toilet preparation manufacturing 16,311 31,153 3,211 1,431 5.0% 73.796% 602 1,149 118 53
Private household operations 93,823 200,324 183,910 145,172 5.0% 73.796% 3,462 7,392 6,786 5,357
Magnetic and optical recording media
manufacturing16,730 20,747 3,755 7,561 5.0% 73.796% 617 766 139 279
Car washes 124,368 187,584 205,555 174,559 5.0% 73.796% 4,589 6,921 7,585 6,441
Polystyrene foam product manufacturing 3,258 2,887 671 779 5.0% 73.796% 120 107 25 29
Other plastics product manufacturing 36,508 50,058 20,132 15,959 5.0% 73.796% 1,347 1,847 743 589
Vegetable and melon farming 87,024 140,138 122,139 101,831 5.0% 73.796% 3,211 5,171 4,507 3,757
Directory, mailing list, and other publishers 93,463 135,771 100,478 101,263 5.0% 73.796% 3,449 5,010 3,707 3,736
Specialized design services 103,572 184,452 246,750 215,782 5.0% 73.796% 3,822 6,806 9,105 7,962
Sign manufacturing 58,290 92,691 86,080 86,809 5.0% 73.796% 2,151 3,420 3,176 3,203
Other accommodations 31,512 52,537 2,675 1,618 5.5% 73.796% 1,279 2,132 109 66
Cookie, cracker, and pasta manufacturing 65,165 108,694 28,041 25,333 5.0% 73.796% 2,404 4,011 1,035 935
Urethane and other foam product (except
polystyrene) manufacturing282,482 263,102 53,629 35,703 5.0% 73.796% 10,423 9,708 1,979 1,317
Photographic services 78,272 134,449 164,081 143,096 5.0% 73.796% 2,888 4,961 6,054 5,280
Death care services 73,461 78,753 65,331 53,469 5.0% 73.796% 2,711 2,906 2,411 1,973
Wood windows and doors and millwork
manufacturing65,480 106,755 116,303 93,708 5.0% 73.796% 2,416 3,939 4,291 3,458
Electronic computer manufacturing 899 742 180 164 5.0% 73.796% 33 27 7 6
All other miscellaneous wood product
manufacturing75,723 121,080 93,660 118,890 5.0% 73.796% 2,794 4,468 3,456 4,387
Motor vehicle parts manufacturing 43,032 62,338 33,262 24,233 5.0% 73.796% 1,588 2,300 1,227 894
Animal production, except cattle and poultry and
eggs55,755 105,631 37,774 38,660 5.0% 73.796% 2,057 3,898 1,394 1,426
All other chemical product and preparation
manufacturing55,807 90,460 20,849 16,593 5.0% 73.796% 2,059 3,338 769 612
All other crop farming 33,313 25,717 75,859 38,809 5.0% 73.796% 1,229 949 2,799 1,432
Other animal food manufacturing 62,759 76,743 273,163 270,312 5.0% 73.796% 2,316 2,832 10,079 9,974
Custom computer programming services 21,598 29,589 30,858 28,250 5.0% 73.796% 797 1,092 1,139 1,042
E-5
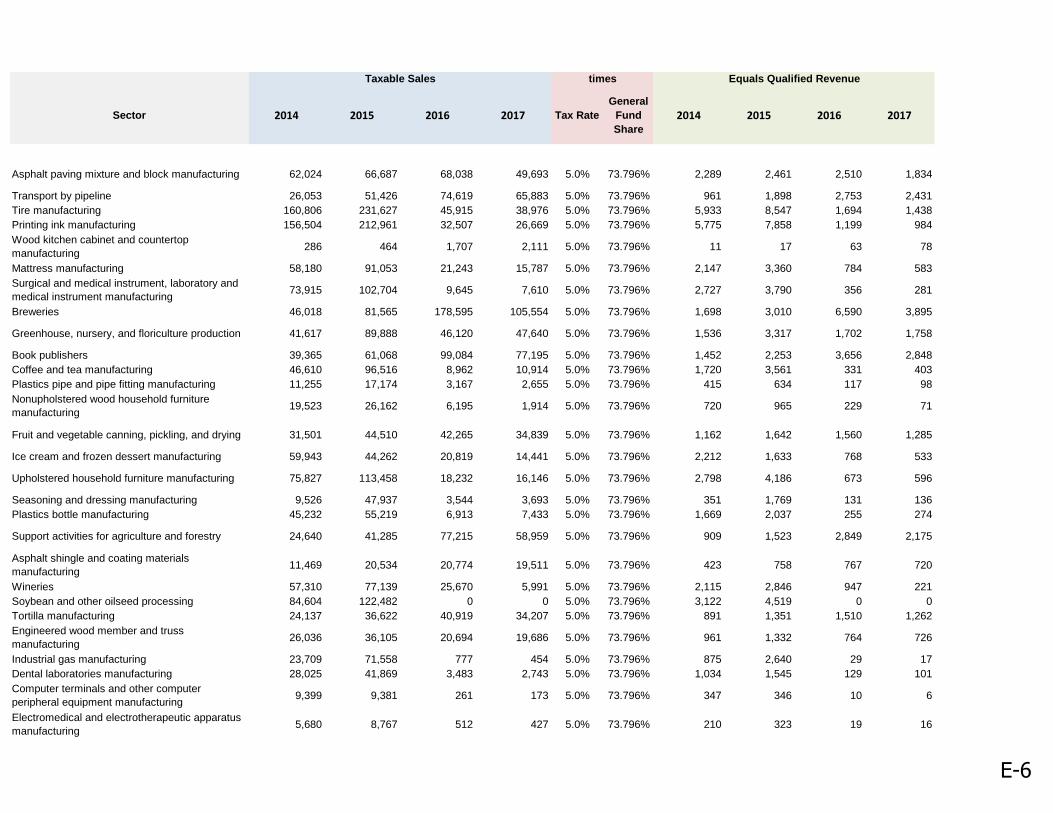
Taxable Sales times Equals Qualified Revenue
Sector 2014 2015 2016 2017 Tax Rate
General
Fund
Share
2014 2015 2016 2017
Asphalt paving mixture and block manufacturing 62,024 66,687 68,038 49,693 5.0% 73.796% 2,289 2,461 2,510 1,834
Transport by pipeline 26,053 51,426 74,619 65,883 5.0% 73.796% 961 1,898 2,753 2,431
Tire manufacturing 160,806 231,627 45,915 38,976 5.0% 73.796% 5,933 8,547 1,694 1,438
Printing ink manufacturing 156,504 212,961 32,507 26,669 5.0% 73.796% 5,775 7,858 1,199 984
Wood kitchen cabinet and countertop
manufacturing286 464 1,707 2,111 5.0% 73.796% 11 17 63 78
Mattress manufacturing 58,180 91,053 21,243 15,787 5.0% 73.796% 2,147 3,360 784 583
Surgical and medical instrument, laboratory and
medical instrument manufacturing73,915 102,704 9,645 7,610 5.0% 73.796% 2,727 3,790 356 281
Breweries 46,018 81,565 178,595 105,554 5.0% 73.796% 1,698 3,010 6,590 3,895
Greenhouse, nursery, and floriculture production 41,617 89,888 46,120 47,640 5.0% 73.796% 1,536 3,317 1,702 1,758
Book publishers 39,365 61,068 99,084 77,195 5.0% 73.796% 1,452 2,253 3,656 2,848
Coffee and tea manufacturing 46,610 96,516 8,962 10,914 5.0% 73.796% 1,720 3,561 331 403
Plastics pipe and pipe fitting manufacturing 11,255 17,174 3,167 2,655 5.0% 73.796% 415 634 117 98
Nonupholstered wood household furniture
manufacturing19,523 26,162 6,195 1,914 5.0% 73.796% 720 965 229 71
Fruit and vegetable canning, pickling, and drying 31,501 44,510 42,265 34,839 5.0% 73.796% 1,162 1,642 1,560 1,285
Ice cream and frozen dessert manufacturing 59,943 44,262 20,819 14,441 5.0% 73.796% 2,212 1,633 768 533
Upholstered household furniture manufacturing 75,827 113,458 18,232 16,146 5.0% 73.796% 2,798 4,186 673 596
Seasoning and dressing manufacturing 9,526 47,937 3,544 3,693 5.0% 73.796% 351 1,769 131 136
Plastics bottle manufacturing 45,232 55,219 6,913 7,433 5.0% 73.796% 1,669 2,037 255 274
Support activities for agriculture and forestry 24,640 41,285 77,215 58,959 5.0% 73.796% 909 1,523 2,849 2,175
Asphalt shingle and coating materials
manufacturing11,469 20,534 20,774 19,511 5.0% 73.796% 423 758 767 720
Wineries 57,310 77,139 25,670 5,991 5.0% 73.796% 2,115 2,846 947 221
Soybean and other oilseed processing 84,604 122,482 0 0 5.0% 73.796% 3,122 4,519 0 0
Tortilla manufacturing 24,137 36,622 40,919 34,207 5.0% 73.796% 891 1,351 1,510 1,262
Engineered wood member and truss
manufacturing26,036 36,105 20,694 19,686 5.0% 73.796% 961 1,332 764 726
Industrial gas manufacturing 23,709 71,558 777 454 5.0% 73.796% 875 2,640 29 17
Dental laboratories manufacturing 28,025 41,869 3,483 2,743 5.0% 73.796% 1,034 1,545 129 101
Computer terminals and other computer
peripheral equipment manufacturing9,399 9,381 261 173 5.0% 73.796% 347 346 10 6
Electromedical and electrotherapeutic apparatus
manufacturing5,680 8,767 512 427 5.0% 73.796% 210 323 19 16
E-6
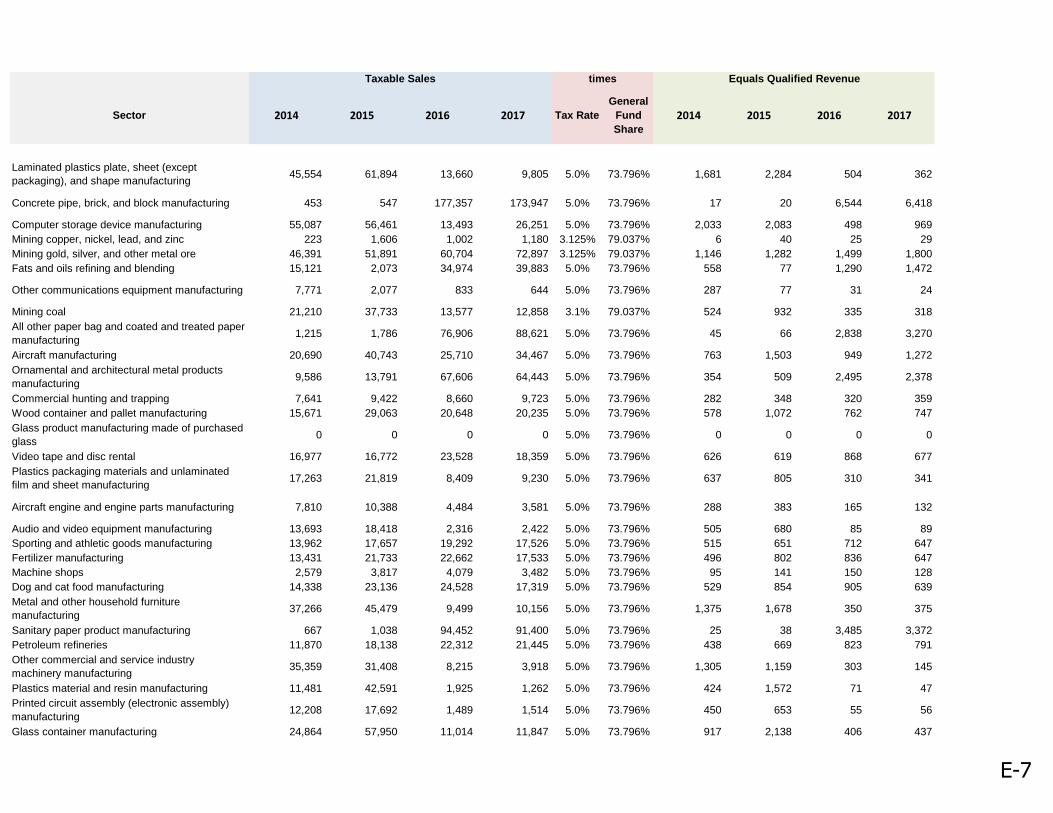
Taxable Sales times Equals Qualified Revenue
Sector 2014 2015 2016 2017 Tax Rate
General
Fund
Share
2014 2015 2016 2017
Laminated plastics plate, sheet (except
packaging), and shape manufacturing45,554 61,894 13,660 9,805 5.0% 73.796% 1,681 2,284 504 362
Concrete pipe, brick, and block manufacturing 453 547 177,357 173,947 5.0% 73.796% 17 20 6,544 6,418
Computer storage device manufacturing 55,087 56,461 13,493 26,251 5.0% 73.796% 2,033 2,083 498 969
Mining copper, nickel, lead, and zinc 223 1,606 1,002 1,180 3.125% 79.037% 6 40 25 29
Mining gold, silver, and other metal ore 46,391 51,891 60,704 72,897 3.125% 79.037% 1,146 1,282 1,499 1,800
Fats and oils refining and blending 15,121 2,073 34,974 39,883 5.0% 73.796% 558 77 1,290 1,472
Other communications equipment manufacturing 7,771 2,077 833 644 5.0% 73.796% 287 77 31 24
Mining coal 21,210 37,733 13,577 12,858 3.1% 79.037% 524 932 335 318
All other paper bag and coated and treated paper
manufacturing1,215 1,786 76,906 88,621 5.0% 73.796% 45 66 2,838 3,270
Aircraft manufacturing 20,690 40,743 25,710 34,467 5.0% 73.796% 763 1,503 949 1,272
Ornamental and architectural metal products
manufacturing9,586 13,791 67,606 64,443 5.0% 73.796% 354 509 2,495 2,378
Commercial hunting and trapping 7,641 9,422 8,660 9,723 5.0% 73.796% 282 348 320 359
Wood container and pallet manufacturing 15,671 29,063 20,648 20,235 5.0% 73.796% 578 1,072 762 747
Glass product manufacturing made of purchased
glass0 0 0 0 5.0% 73.796% 0 0 0 0
Video tape and disc rental 16,977 16,772 23,528 18,359 5.0% 73.796% 626 619 868 677
Plastics packaging materials and unlaminated
film and sheet manufacturing17,263 21,819 8,409 9,230 5.0% 73.796% 637 805 310 341
Aircraft engine and engine parts manufacturing 7,810 10,388 4,484 3,581 5.0% 73.796% 288 383 165 132
Audio and video equipment manufacturing 13,693 18,418 2,316 2,422 5.0% 73.796% 505 680 85 89
Sporting and athletic goods manufacturing 13,962 17,657 19,292 17,526 5.0% 73.796% 515 651 712 647
Fertilizer manufacturing 13,431 21,733 22,662 17,533 5.0% 73.796% 496 802 836 647
Machine shops 2,579 3,817 4,079 3,482 5.0% 73.796% 95 141 150 128
Dog and cat food manufacturing 14,338 23,136 24,528 17,319 5.0% 73.796% 529 854 905 639
Metal and other household furniture
manufacturing37,266 45,479 9,499 10,156 5.0% 73.796% 1,375 1,678 350 375
Sanitary paper product manufacturing 667 1,038 94,452 91,400 5.0% 73.796% 25 38 3,485 3,372
Petroleum refineries 11,870 18,138 22,312 21,445 5.0% 73.796% 438 669 823 791
Other commercial and service industry
machinery manufacturing35,359 31,408 8,215 3,918 5.0% 73.796% 1,305 1,159 303 145
Plastics material and resin manufacturing 11,481 42,591 1,925 1,262 5.0% 73.796% 424 1,572 71 47
Printed circuit assembly (electronic assembly)
manufacturing12,208 17,692 1,489 1,514 5.0% 73.796% 450 653 55 56
Glass container manufacturing 24,864 57,950 11,014 11,847 5.0% 73.796% 917 2,138 406 437
E-7
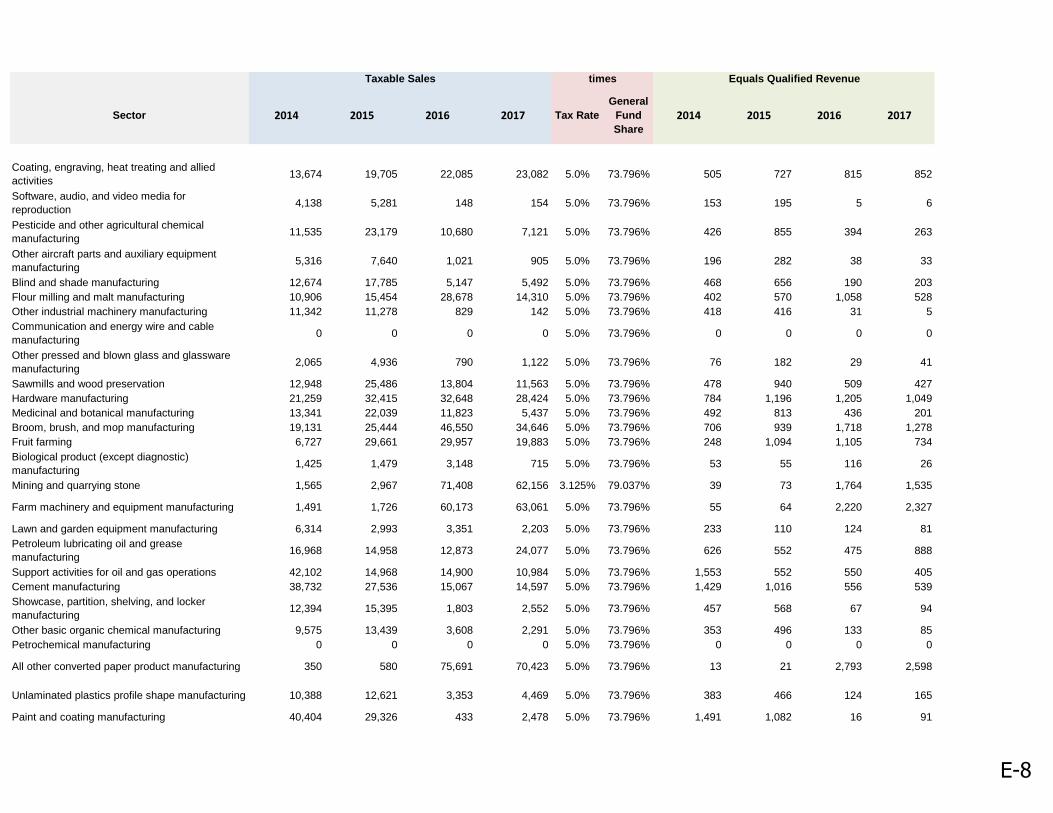
Taxable Sales times Equals Qualified Revenue
Sector 2014 2015 2016 2017 Tax Rate
General
Fund
Share
2014 2015 2016 2017
Coating, engraving, heat treating and allied
activities13,674 19,705 22,085 23,082 5.0% 73.796% 505 727 815 852
Software, audio, and video media for
reproduction4,138 5,281 148 154 5.0% 73.796% 153 195 5 6
Pesticide and other agricultural chemical
manufacturing11,535 23,179 10,680 7,121 5.0% 73.796% 426 855 394 263
Other aircraft parts and auxiliary equipment
manufacturing5,316 7,640 1,021 905 5.0% 73.796% 196 282 38 33
Blind and shade manufacturing 12,674 17,785 5,147 5,492 5.0% 73.796% 468 656 190 203
Flour milling and malt manufacturing 10,906 15,454 28,678 14,310 5.0% 73.796% 402 570 1,058 528
Other industrial machinery manufacturing 11,342 11,278 829 142 5.0% 73.796% 418 416 31 5
Communication and energy wire and cable
manufacturing0 0 0 0 5.0% 73.796% 0 0 0 0
Other pressed and blown glass and glassware
manufacturing2,065 4,936 790 1,122 5.0% 73.796% 76 182 29 41
Sawmills and wood preservation 12,948 25,486 13,804 11,563 5.0% 73.796% 478 940 509 427
Hardware manufacturing 21,259 32,415 32,648 28,424 5.0% 73.796% 784 1,196 1,205 1,049
Medicinal and botanical manufacturing 13,341 22,039 11,823 5,437 5.0% 73.796% 492 813 436 201
Broom, brush, and mop manufacturing 19,131 25,444 46,550 34,646 5.0% 73.796% 706 939 1,718 1,278
Fruit farming 6,727 29,661 29,957 19,883 5.0% 73.796% 248 1,094 1,105 734
Biological product (except diagnostic)
manufacturing1,425 1,479 3,148 715 5.0% 73.796% 53 55 116 26
Mining and quarrying stone 1,565 2,967 71,408 62,156 3.125% 79.037% 39 73 1,764 1,535
Farm machinery and equipment manufacturing 1,491 1,726 60,173 63,061 5.0% 73.796% 55 64 2,220 2,327
Lawn and garden equipment manufacturing 6,314 2,993 3,351 2,203 5.0% 73.796% 233 110 124 81
Petroleum lubricating oil and grease
manufacturing16,968 14,958 12,873 24,077 5.0% 73.796% 626 552 475 888
Support activities for oil and gas operations 42,102 14,968 14,900 10,984 5.0% 73.796% 1,553 552 550 405
Cement manufacturing 38,732 27,536 15,067 14,597 5.0% 73.796% 1,429 1,016 556 539
Showcase, partition, shelving, and locker
manufacturing12,394 15,395 1,803 2,552 5.0% 73.796% 457 568 67 94
Other basic organic chemical manufacturing 9,575 13,439 3,608 2,291 5.0% 73.796% 353 496 133 85
Petrochemical manufacturing 0 0 0 0 5.0% 73.796% 0 0 0 0
All other converted paper product manufacturing 350 580 75,691 70,423 5.0% 73.796% 13 21 2,793 2,598
Unlaminated plastics profile shape manufacturing 10,388 12,621 3,353 4,469 5.0% 73.796% 383 466 124 165
Paint and coating manufacturing 40,404 29,326 433 2,478 5.0% 73.796% 1,491 1,082 16 91
E-8
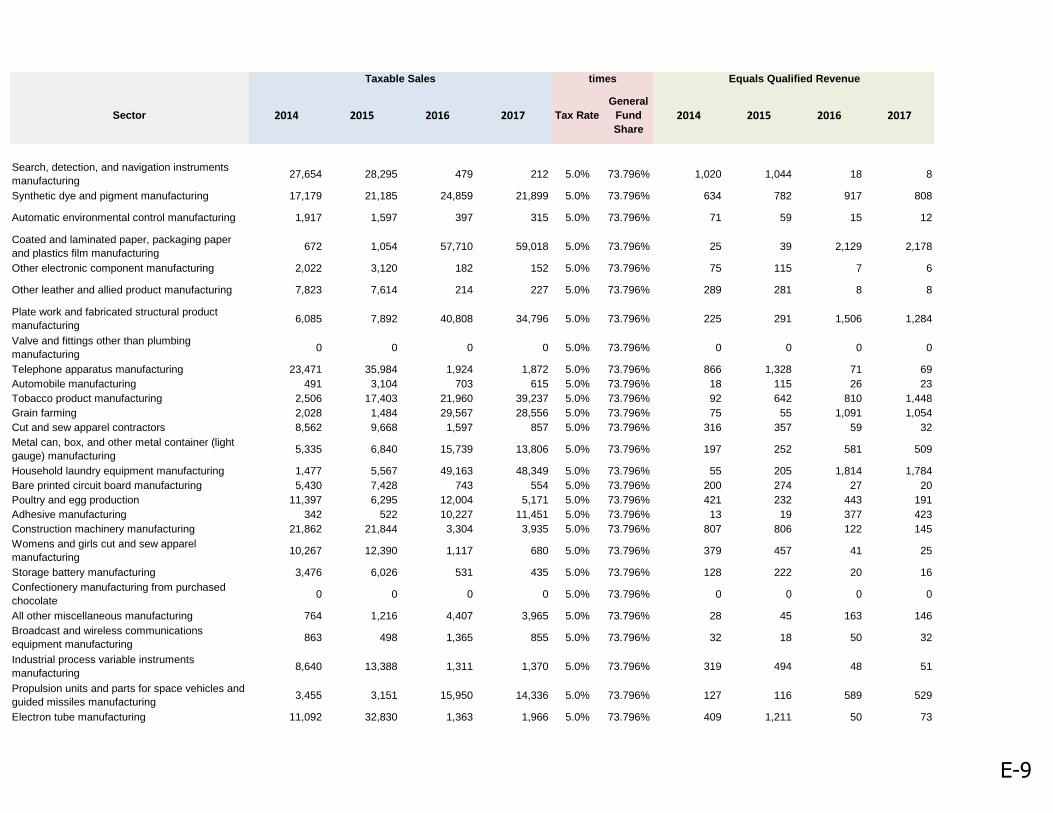
Taxable Sales times Equals Qualified Revenue
Sector 2014 2015 2016 2017 Tax Rate
General
Fund
Share
2014 2015 2016 2017
Search, detection, and navigation instruments
manufacturing27,654 28,295 479 212 5.0% 73.796% 1,020 1,044 18 8
Synthetic dye and pigment manufacturing 17,179 21,185 24,859 21,899 5.0% 73.796% 634 782 917 808
Automatic environmental control manufacturing 1,917 1,597 397 315 5.0% 73.796% 71 59 15 12
Coated and laminated paper, packaging paper
and plastics film manufacturing672 1,054 57,710 59,018 5.0% 73.796% 25 39 2,129 2,178
Other electronic component manufacturing 2,022 3,120 182 152 5.0% 73.796% 75 115 7 6
Other leather and allied product manufacturing 7,823 7,614 214 227 5.0% 73.796% 289 281 8 8
Plate work and fabricated structural product
manufacturing6,085 7,892 40,808 34,796 5.0% 73.796% 225 291 1,506 1,284
Valve and fittings other than plumbing
manufacturing0 0 0 0 5.0% 73.796% 0 0 0 0
Telephone apparatus manufacturing 23,471 35,984 1,924 1,872 5.0% 73.796% 866 1,328 71 69
Automobile manufacturing 491 3,104 703 615 5.0% 73.796% 18 115 26 23
Tobacco product manufacturing 2,506 17,403 21,960 39,237 5.0% 73.796% 92 642 810 1,448
Grain farming 2,028 1,484 29,567 28,556 5.0% 73.796% 75 55 1,091 1,054
Cut and sew apparel contractors 8,562 9,668 1,597 857 5.0% 73.796% 316 357 59 32
Metal can, box, and other metal container (light
gauge) manufacturing5,335 6,840 15,739 13,806 5.0% 73.796% 197 252 581 509
Household laundry equipment manufacturing 1,477 5,567 49,163 48,349 5.0% 73.796% 55 205 1,814 1,784
Bare printed circuit board manufacturing 5,430 7,428 743 554 5.0% 73.796% 200 274 27 20
Poultry and egg production 11,397 6,295 12,004 5,171 5.0% 73.796% 421 232 443 191
Adhesive manufacturing 342 522 10,227 11,451 5.0% 73.796% 13 19 377 423
Construction machinery manufacturing 21,862 21,844 3,304 3,935 5.0% 73.796% 807 806 122 145
Womens and girls cut and sew apparel
manufacturing10,267 12,390 1,117 680 5.0% 73.796% 379 457 41 25
Storage battery manufacturing 3,476 6,026 531 435 5.0% 73.796% 128 222 20 16
Confectionery manufacturing from purchased
chocolate0 0 0 0 5.0% 73.796% 0 0 0 0
All other miscellaneous manufacturing 764 1,216 4,407 3,965 5.0% 73.796% 28 45 163 146
Broadcast and wireless communications
equipment manufacturing863 498 1,365 855 5.0% 73.796% 32 18 50 32
Industrial process variable instruments
manufacturing8,640 13,388 1,311 1,370 5.0% 73.796% 319 494 48 51
Propulsion units and parts for space vehicles and
guided missiles manufacturing3,455 3,151 15,950 14,336 5.0% 73.796% 127 116 589 529
Electron tube manufacturing 11,092 32,830 1,363 1,966 5.0% 73.796% 409 1,211 50 73
E-9
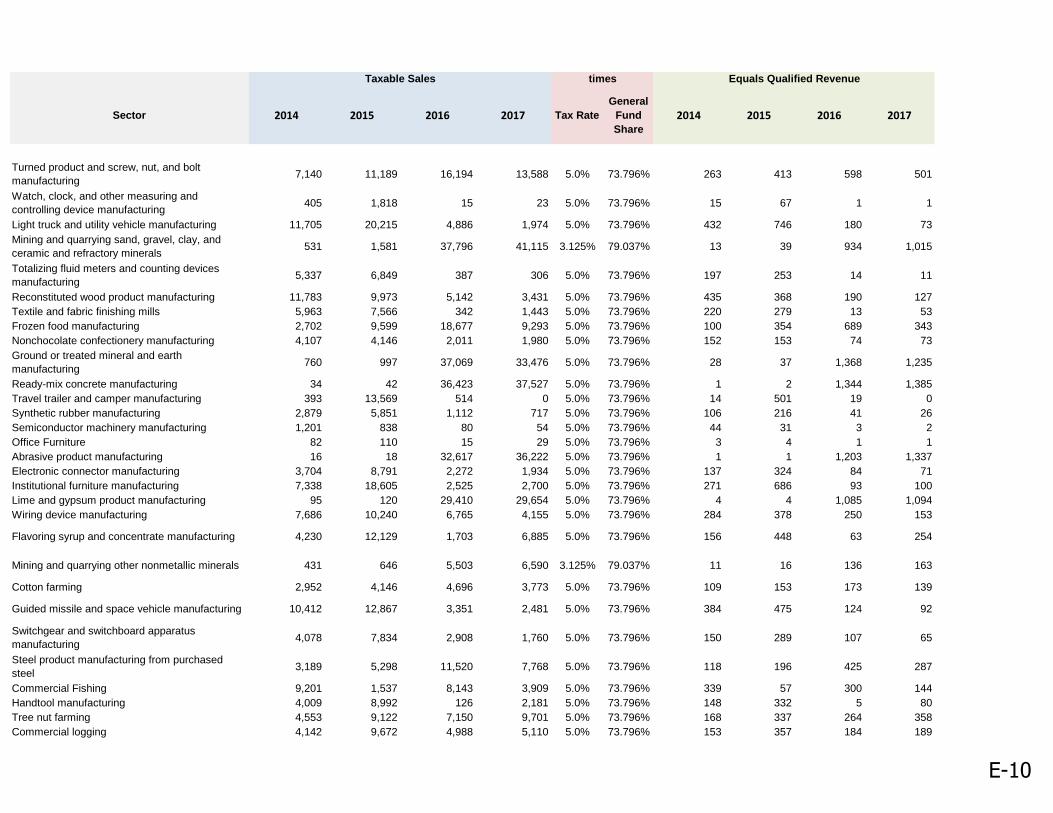
Taxable Sales times Equals Qualified Revenue
Sector 2014 2015 2016 2017 Tax Rate
General
Fund
Share
2014 2015 2016 2017
Turned product and screw, nut, and bolt
manufacturing7,140 11,189 16,194 13,588 5.0% 73.796% 263 413 598 501
Watch, clock, and other measuring and
controlling device manufacturing405 1,818 15 23 5.0% 73.796% 15 67 1 1
Light truck and utility vehicle manufacturing 11,705 20,215 4,886 1,974 5.0% 73.796% 432 746 180 73
Mining and quarrying sand, gravel, clay, and
ceramic and refractory minerals531 1,581 37,796 41,115 3.125% 79.037% 13 39 934 1,015
Totalizing fluid meters and counting devices
manufacturing5,337 6,849 387 306 5.0% 73.796% 197 253 14 11
Reconstituted wood product manufacturing 11,783 9,973 5,142 3,431 5.0% 73.796% 435 368 190 127
Textile and fabric finishing mills 5,963 7,566 342 1,443 5.0% 73.796% 220 279 13 53
Frozen food manufacturing 2,702 9,599 18,677 9,293 5.0% 73.796% 100 354 689 343
Nonchocolate confectionery manufacturing 4,107 4,146 2,011 1,980 5.0% 73.796% 152 153 74 73
Ground or treated mineral and earth
manufacturing760 997 37,069 33,476 5.0% 73.796% 28 37 1,368 1,235
Ready-mix concrete manufacturing 34 42 36,423 37,527 5.0% 73.796% 1 2 1,344 1,385
Travel trailer and camper manufacturing 393 13,569 514 0 5.0% 73.796% 14 501 19 0
Synthetic rubber manufacturing 2,879 5,851 1,112 717 5.0% 73.796% 106 216 41 26
Semiconductor machinery manufacturing 1,201 838 80 54 5.0% 73.796% 44 31 3 2
Office Furniture 82 110 15 29 5.0% 73.796% 3 4 1 1
Abrasive product manufacturing 16 18 32,617 36,222 5.0% 73.796% 1 1 1,203 1,337
Electronic connector manufacturing 3,704 8,791 2,272 1,934 5.0% 73.796% 137 324 84 71
Institutional furniture manufacturing 7,338 18,605 2,525 2,700 5.0% 73.796% 271 686 93 100
Lime and gypsum product manufacturing 95 120 29,410 29,654 5.0% 73.796% 4 4 1,085 1,094
Wiring device manufacturing 7,686 10,240 6,765 4,155 5.0% 73.796% 284 378 250 153
Flavoring syrup and concentrate manufacturing 4,230 12,129 1,703 6,885 5.0% 73.796% 156 448 63 254
Mining and quarrying other nonmetallic minerals 431 646 5,503 6,590 3.125% 79.037% 11 16 136 163
Cotton farming 2,952 4,146 4,696 3,773 5.0% 73.796% 109 153 173 139
Guided missile and space vehicle manufacturing 10,412 12,867 3,351 2,481 5.0% 73.796% 384 475 124 92
Switchgear and switchboard apparatus
manufacturing4,078 7,834 2,908 1,760 5.0% 73.796% 150 289 107 65
Steel product manufacturing from purchased
steel3,189 5,298 11,520 7,768 5.0% 73.796% 118 196 425 287
Commercial Fishing 9,201 1,537 8,143 3,909 5.0% 73.796% 339 57 300 144
Handtool manufacturing 4,009 8,992 126 2,181 5.0% 73.796% 148 332 5 80
Tree nut farming 4,553 9,122 7,150 9,701 5.0% 73.796% 168 337 264 358
Commercial logging 4,142 9,672 4,988 5,110 5.0% 73.796% 153 357 184 189
E-10
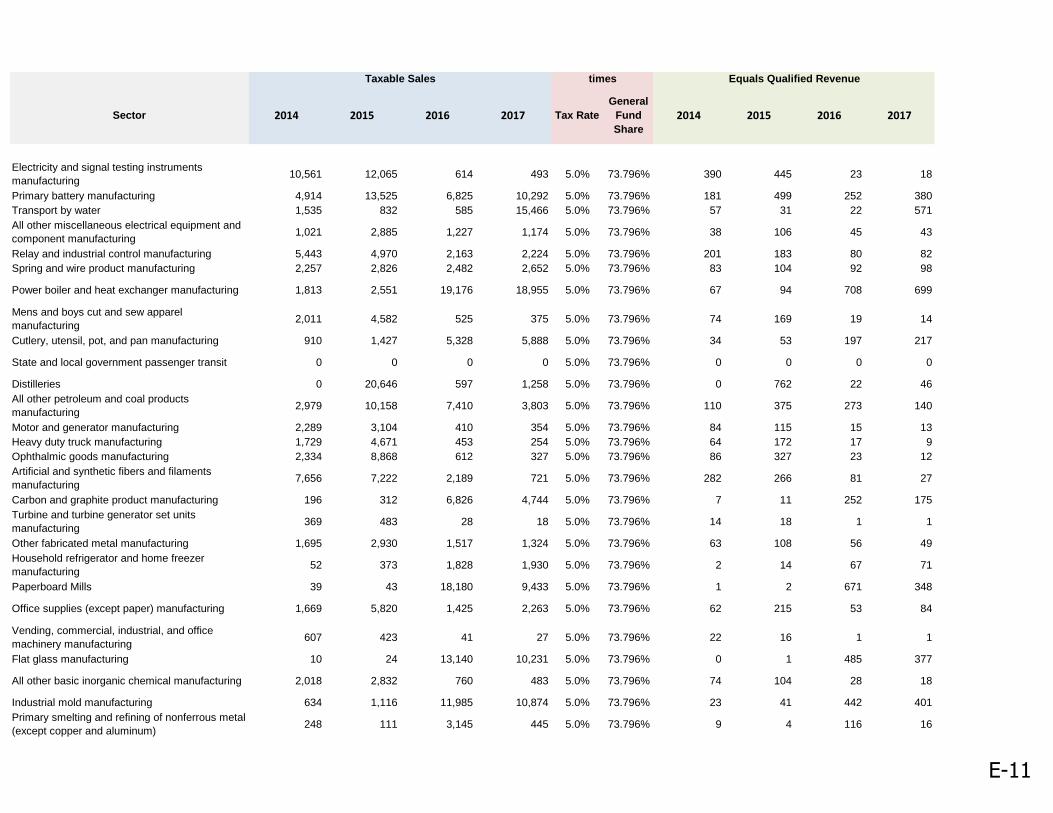
Taxable Sales times Equals Qualified Revenue
Sector 2014 2015 2016 2017 Tax Rate
General
Fund
Share
2014 2015 2016 2017
Electricity and signal testing instruments
manufacturing10,561 12,065 614 493 5.0% 73.796% 390 445 23 18
Primary battery manufacturing 4,914 13,525 6,825 10,292 5.0% 73.796% 181 499 252 380
Transport by water 1,535 832 585 15,466 5.0% 73.796% 57 31 22 571
All other miscellaneous electrical equipment and
component manufacturing1,021 2,885 1,227 1,174 5.0% 73.796% 38 106 45 43
Relay and industrial control manufacturing 5,443 4,970 2,163 2,224 5.0% 73.796% 201 183 80 82
Spring and wire product manufacturing 2,257 2,826 2,482 2,652 5.0% 73.796% 83 104 92 98
Power boiler and heat exchanger manufacturing 1,813 2,551 19,176 18,955 5.0% 73.796% 67 94 708 699
Mens and boys cut and sew apparel
manufacturing2,011 4,582 525 375 5.0% 73.796% 74 169 19 14
Cutlery, utensil, pot, and pan manufacturing 910 1,427 5,328 5,888 5.0% 73.796% 34 53 197 217
State and local government passenger transit 0 0 0 0 5.0% 73.796% 0 0 0 0
Distilleries 0 20,646 597 1,258 5.0% 73.796% 0 762 22 46
All other petroleum and coal products
manufacturing2,979 10,158 7,410 3,803 5.0% 73.796% 110 375 273 140
Motor and generator manufacturing 2,289 3,104 410 354 5.0% 73.796% 84 115 15 13
Heavy duty truck manufacturing 1,729 4,671 453 254 5.0% 73.796% 64 172 17 9
Ophthalmic goods manufacturing 2,334 8,868 612 327 5.0% 73.796% 86 327 23 12
Artificial and synthetic fibers and filaments
manufacturing7,656 7,222 2,189 721 5.0% 73.796% 282 266 81 27
Carbon and graphite product manufacturing 196 312 6,826 4,744 5.0% 73.796% 7 11 252 175
Turbine and turbine generator set units
manufacturing369 483 28 18 5.0% 73.796% 14 18 1 1
Other fabricated metal manufacturing 1,695 2,930 1,517 1,324 5.0% 73.796% 63 108 56 49
Household refrigerator and home freezer
manufacturing52 373 1,828 1,930 5.0% 73.796% 2 14 67 71
Paperboard Mills 39 43 18,180 9,433 5.0% 73.796% 1 2 671 348
Office supplies (except paper) manufacturing 1,669 5,820 1,425 2,263 5.0% 73.796% 62 215 53 84
Vending, commercial, industrial, and office
machinery manufacturing607 423 41 27 5.0% 73.796% 22 16 1 1
Flat glass manufacturing 10 24 13,140 10,231 5.0% 73.796% 0 1 485 377
All other basic inorganic chemical manufacturing 2,018 2,832 760 483 5.0% 73.796% 74 104 28 18
Industrial mold manufacturing 634 1,116 11,985 10,874 5.0% 73.796% 23 41 442 401
Primary smelting and refining of nonferrous metal
(except copper and aluminum)248 111 3,145 445 5.0% 73.796% 9 4 116 16
E-11
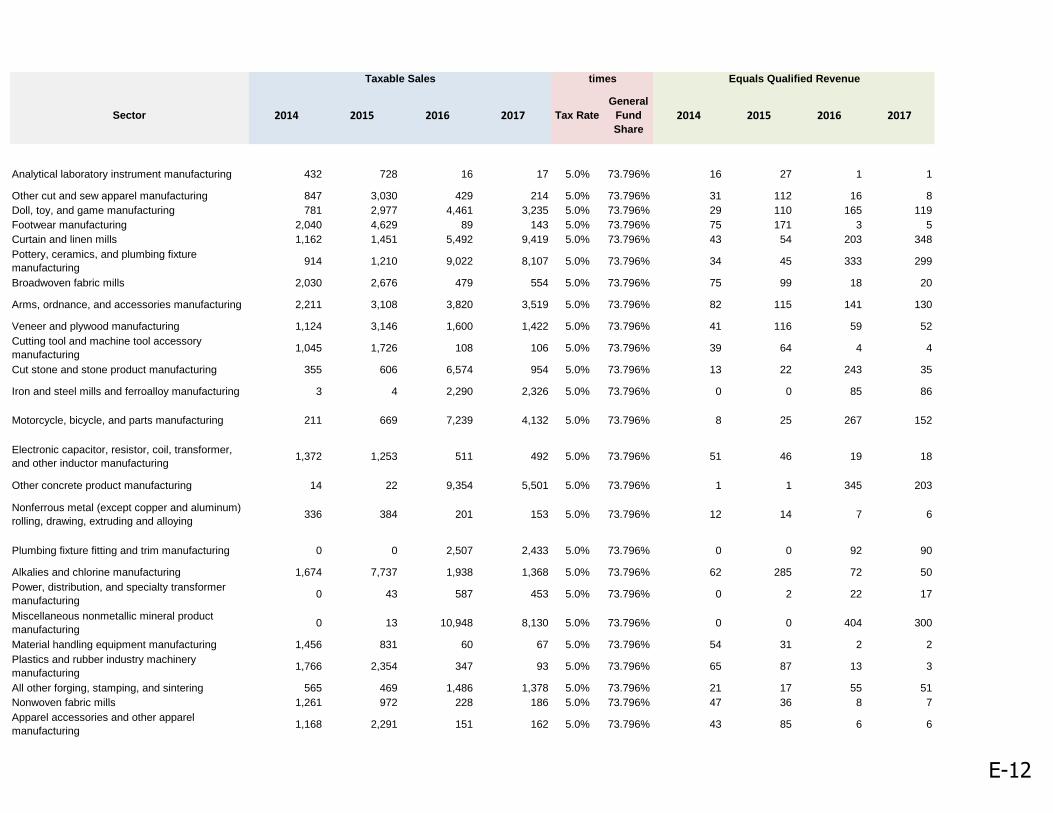
Taxable Sales times Equals Qualified Revenue
Sector 2014 2015 2016 2017 Tax Rate
General
Fund
Share
2014 2015 2016 2017
Analytical laboratory instrument manufacturing 432 728 16 17 5.0% 73.796% 16 27 1 1
Other cut and sew apparel manufacturing 847 3,030 429 214 5.0% 73.796% 31 112 16 8
Doll, toy, and game manufacturing 781 2,977 4,461 3,235 5.0% 73.796% 29 110 165 119
Footwear manufacturing 2,040 4,629 89 143 5.0% 73.796% 75 171 3 5
Curtain and linen mills 1,162 1,451 5,492 9,419 5.0% 73.796% 43 54 203 348
Pottery, ceramics, and plumbing fixture
manufacturing914 1,210 9,022 8,107 5.0% 73.796% 34 45 333 299
Broadwoven fabric mills 2,030 2,676 479 554 5.0% 73.796% 75 99 18 20
Arms, ordnance, and accessories manufacturing 2,211 3,108 3,820 3,519 5.0% 73.796% 82 115 141 130
Veneer and plywood manufacturing 1,124 3,146 1,600 1,422 5.0% 73.796% 41 116 59 52
Cutting tool and machine tool accessory
manufacturing1,045 1,726 108 106 5.0% 73.796% 39 64 4 4
Cut stone and stone product manufacturing 355 606 6,574 954 5.0% 73.796% 13 22 243 35
Iron and steel mills and ferroalloy manufacturing 3 4 2,290 2,326 5.0% 73.796% 0 0 85 86
Motorcycle, bicycle, and parts manufacturing 211 669 7,239 4,132 5.0% 73.796% 8 25 267 152
Electronic capacitor, resistor, coil, transformer,
and other inductor manufacturing1,372 1,253 511 492 5.0% 73.796% 51 46 19 18
Other concrete product manufacturing 14 22 9,354 5,501 5.0% 73.796% 1 1 345 203
Nonferrous metal (except copper and aluminum)
rolling, drawing, extruding and alloying336 384 201 153 5.0% 73.796% 12 14 7 6
Plumbing fixture fitting and trim manufacturing 0 0 2,507 2,433 5.0% 73.796% 0 0 92 90
Alkalies and chlorine manufacturing 1,674 7,737 1,938 1,368 5.0% 73.796% 62 285 72 50
Power, distribution, and specialty transformer
manufacturing0 43 587 453 5.0% 73.796% 0 2 22 17
Miscellaneous nonmetallic mineral product
manufacturing0 13 10,948 8,130 5.0% 73.796% 0 0 404 300
Material handling equipment manufacturing 1,456 831 60 67 5.0% 73.796% 54 31 2 2
Plastics and rubber industry machinery
manufacturing1,766 2,354 347 93 5.0% 73.796% 65 87 13 3
All other forging, stamping, and sintering 565 469 1,486 1,378 5.0% 73.796% 21 17 55 51
Nonwoven fabric mills 1,261 972 228 186 5.0% 73.796% 47 36 8 7
Apparel accessories and other apparel
manufacturing1,168 2,291 151 162 5.0% 73.796% 43 85 6 6
E-12

Taxable Sales times Equals Qualified Revenue
Sector 2014 2015 2016 2017 Tax Rate
General
Fund
Share
2014 2015 2016 2017
Fabricated pipe and pipe fitting manufacturing 580 1,062 6,754 6,342 5.0% 73.796% 21 39 249 234
Dental equipment and supplies manufacturing 481 1,071 90 56 5.0% 73.796% 18 40 3 2
Mineral wool manufacturing 15 31 10,063 9,529 5.0% 73.796% 1 1 371 352
All other textile product mills 1,291 1,780 2,191 2,831 5.0% 73.796% 48 66 81 104
Primary smelting and refining of copper 464 534 4,967 5,009 5.0% 73.796% 17 20 183 185
Prefabricated wood building manufacturing 608 851 5,991 4,643 5.0% 73.796% 22 31 221 171
Jewelry and silverware manufacturing 486 2,689 2,210 1,841 5.0% 73.796% 18 99 82 68
Electric lamp bulb and part manufacturing 3,149 5,547 374 299 5.0% 73.796% 116 205 14 11
Chocolate and confectionery manufacturing from
cacao beans5,213 1,440 2,345 2,486 5.0% 73.796% 192 53 87 92
Ammunition manufacturing 3,390 3,842 1,082 484 5.0% 73.796% 125 142 40 18
Mining and oil and gas field machinery
manufacturing2,193 2,383 1,073 1,221 5.0% 73.796% 81 88 40 45
Other engine equipment manufacturing 144 0 0 0 5.0% 73.796% 5 0 0 0
Gasket, packing, and sealing device
manufacturing616 938 4,519 3,096 5.0% 73.796% 23 35 167 114
Stationery product manufacturing 60 88 3,804 4,383 5.0% 73.796% 2 3 140 162
Pump and pumping equipment manufacturing 1,203 4,888 634 774 5.0% 73.796% 44 180 23 29
Rubber and plastics hoses and belting
manufacturing24 33 5,164 2,208 5.0% 73.796% 1 1 191 81
Motor vehicle body manufacturing 166 563 124 165 5.0% 73.796% 6 21 5 6
Custom architectural woodwork and millwork
manufacturing2,302 2,314 424 418 5.0% 73.796% 85 85 16 15
Optical instrument and lens manufacturing 308 1,486 25 18 5.0% 73.796% 11 55 1 1
Speed changer, industrial high-speed drive, and
gear manufacturing470 1,740 41 64 5.0% 73.796% 17 64 2 2
Metal cutting and forming machine tool
manufacturing196 245 166 132 5.0% 73.796% 7 9 6 5
Aluminum product manufacturing from purchased
aluminum113 94 1,972 1,830 5.0% 73.796% 4 3 73 68
Support activities for other mining 262 266 4,879 2,288 5.0% 73.796% 10 10 180 84
Photographic and photocopying equipment
manufacturing916 4,155 532 343 5.0% 73.796% 34 153 20 13
Other rubber product manufacturing 268 267 1,710 2,828 5.0% 73.796% 10 10 63 104
Rolling mill and other metalworking machinery
manufacturing495 1,444 570 530 5.0% 73.796% 18 53 21 20
Carpet and rug mills 115 150 4,417 2,330 5.0% 73.796% 4 6 163 86
Textile bag and canvas mills 340 621 2,001 1,694 5.0% 73.796% 13 23 74 63
E-13
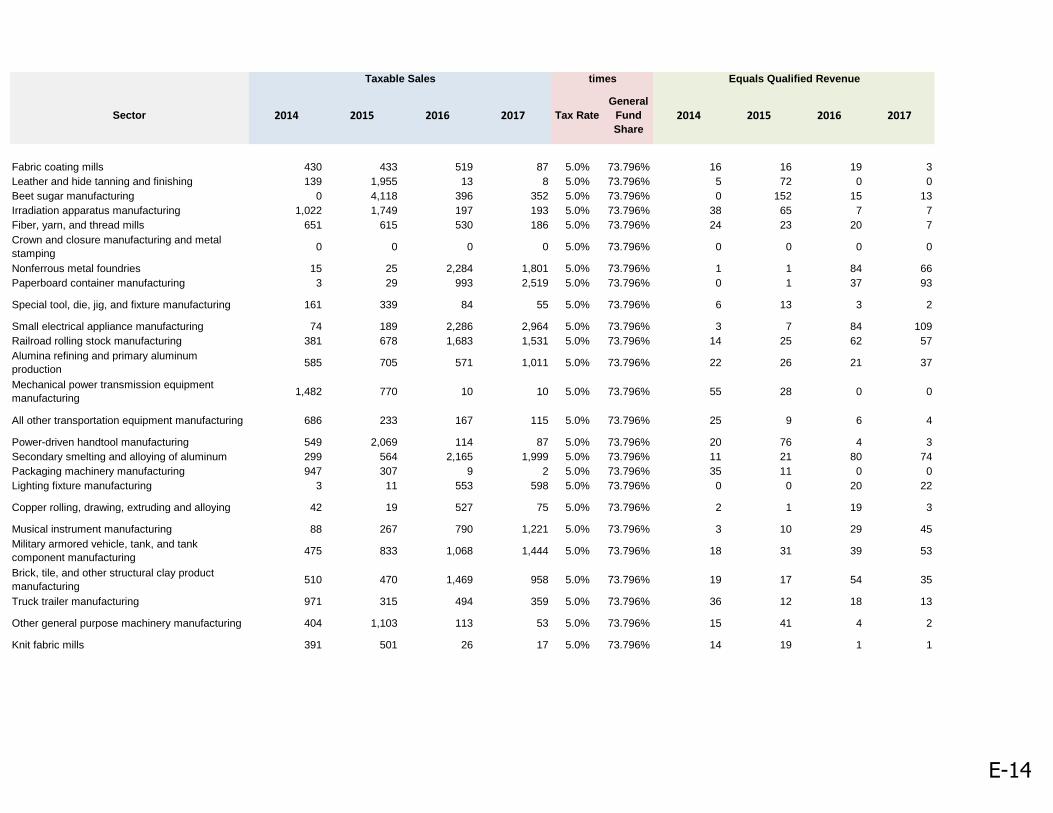
Taxable Sales times Equals Qualified Revenue
Sector 2014 2015 2016 2017 Tax Rate
General
Fund
Share
2014 2015 2016 2017
Fabric coating mills 430 433 519 87 5.0% 73.796% 16 16 19 3
Leather and hide tanning and finishing 139 1,955 13 8 5.0% 73.796% 5 72 0 0
Beet sugar manufacturing 0 4,118 396 352 5.0% 73.796% 0 152 15 13
Irradiation apparatus manufacturing 1,022 1,749 197 193 5.0% 73.796% 38 65 7 7
Fiber, yarn, and thread mills 651 615 530 186 5.0% 73.796% 24 23 20 7
Crown and closure manufacturing and metal
stamping0 0 0 0 5.0% 73.796% 0 0 0 0
Nonferrous metal foundries 15 25 2,284 1,801 5.0% 73.796% 1 1 84 66
Paperboard container manufacturing 3 29 993 2,519 5.0% 73.796% 0 1 37 93
Special tool, die, jig, and fixture manufacturing 161 339 84 55 5.0% 73.796% 6 13 3 2
Small electrical appliance manufacturing 74 189 2,286 2,964 5.0% 73.796% 3 7 84 109
Railroad rolling stock manufacturing 381 678 1,683 1,531 5.0% 73.796% 14 25 62 57
Alumina refining and primary aluminum
production585 705 571 1,011 5.0% 73.796% 22 26 21 37
Mechanical power transmission equipment
manufacturing1,482 770 10 10 5.0% 73.796% 55 28 0 0
All other transportation equipment manufacturing 686 233 167 115 5.0% 73.796% 25 9 6 4
Power-driven handtool manufacturing 549 2,069 114 87 5.0% 73.796% 20 76 4 3
Secondary smelting and alloying of aluminum 299 564 2,165 1,999 5.0% 73.796% 11 21 80 74
Packaging machinery manufacturing 947 307 9 2 5.0% 73.796% 35 11 0 0
Lighting fixture manufacturing 3 11 553 598 5.0% 73.796% 0 0 20 22
Copper rolling, drawing, extruding and alloying 42 19 527 75 5.0% 73.796% 2 1 19 3
Musical instrument manufacturing 88 267 790 1,221 5.0% 73.796% 3 10 29 45
Military armored vehicle, tank, and tank
component manufacturing475 833 1,068 1,444 5.0% 73.796% 18 31 39 53
Brick, tile, and other structural clay product
manufacturing510 470 1,469 958 5.0% 73.796% 19 17 54 35
Truck trailer manufacturing 971 315 494 359 5.0% 73.796% 36 12 18 13
Other general purpose machinery manufacturing 404 1,103 113 53 5.0% 73.796% 15 41 4 2
Knit fabric mills 391 501 26 17 5.0% 73.796% 14 19 1 1
E-14