phillips carbon black cmp target rating risks3.amazonaws.com/zanran_storage/ carbon black initiating...
TRANSCRIPT
Phillips Carbon Black Initiating Coverage 09 October 2009
1
RHH: Winner of LIPPER-STARMINE broker award for “Earnings Estimates in Midcap Research 2008”
“Honourable Mention” in Institutional Investor 2009
RHH Research is also available on Bloomberg FTIS <GO> and Thomson First Call
Girish Solanki Niket Shah
(91-22) 6766 3458 (91-22) 6766 3438
[email protected] [email protected]
Initiating Coverage 09 October 2009
Profitability and return ratios
(%) FY08 FY09 FY10E FY11E
EBITDA margin 14.2 (5.6) 13.3 15.2
EBIT margin 12.2 (7.2) 11.4 13.1
Adj PAT margin 8.6 (5.6) 6.9 8.5
ROE 44.7 (28.4) 38.0 39.3
ROIC 23.5 (10.2) 19.5 23.1
ROCE 21.8 (6.0) 17.6 20.4
Financial highlights
(Rs mn) FY08 FY09 FY10E FY11E
Revenue 10,332 11,633 14,588 17,407
Growth (%) 3.5 12.6 25.4 19.3
EBITDA 1,462 (646) 1,941 2,640
Growth (%) 56.5 (144.2) 400.3 36.0
FDEPS (Rs) 34.2 (24.1) 35.4 52.5
Growth (%) 198.0 (170.6) 246.8 48.3
Phillips Carbon Black Power-packed growth
Well-timed expansion to bolster volumes: Phillips Carbon Black (PCBL), India’s leading carbon black manufacturer, is all set to capitalise on the revival in the domestic tyre industry. The company intends to commence its carbon black capacity of 90,000mt (metric tonnes) at Mundra by the end of October ’09 and expand its facility at Kochi by 50,000mt. This would take its total capacity to 410,000mt. In line with this expansion, we expect PCBL’s carbon black sales volume to grow by 35% in FY10 and further by 15% in FY11. In the backdrop of an improving demand environment, we believe that this expansion is well-timed and will fortify the company’s market leadership. PCBL is also expected to benefit from the imposition of anti-dumping duty on carbon black imports from China, Australia, Thailand, and Russia.
Power business will de-risk operations: Forward integration into power generation from waste gas has de-risked PCBL’s business profile, adding a steady, high-margin power business to a pure commodity play. Of the total power capacity of 44.5MW, 10.5MW is used internally and the rest is sold to state electricity boards (SEBs). PCBL recently commenced a 30MW captive power plant in Durgapur; it now intends to set up a 16MW plant at Mundra by November ’09 and another 10MW plant at Kochi. Consequently, we expect revenues from the power segment to leapfrog from Rs 155mn in FY09 to Rs 1.3bn in FY11.
Operating margin in the black again: PCBL’s operating margin turned around during the last quarter, from -5.6 % in FY09 to 10.9% in Q1FY10. We expect a further improvement to 15.2% in FY11, primarily on account of a higher contribution from the power segment; a drop in raw material prices is also likely to support this expansion.
Healthy earnings trajectory: We expect PCBL’s revenues to increase at a 22.3% CAGR over FY09-FY11as against a 16.9% CAGR over FY06-FY09; this growth will be driven by a 24.6% increase in volumes during this period as expanded capacities become operational. A healthy contribution from the high-margin power segment is likely to steer profits into the positive territory; the company is expected to report a net profit of Rs 1.5bn in FY11 as against a net loss of Rs 648mn in FY09.
Initiate with Buy and target of Rs 262: We have arrived at an SOTP-based target price of Rs 262, valuing PCBL’s core carbon black business (commodity) at Rs 106 (4x FY11E PAT of the division) and power business at Rs 156 (based on DCFE of individual power plants). At this value, the implied P/BV for the power business works out to 2x FY11E power book value which, in our opinion, is attractive. We initiate coverage on PCBL with a Buy.
CMP TARGET RATING RISK
Rs 172 Rs 262 BUY MEDIUM
BSE NSE BLOOMBERG
506590 PHILIPCARB PHCB IN
Company data
Market cap (Rs mn / US$ mn) 4,862 / 105
Outstanding equity shares (mn) 28
Free float (%) 19.3
Dividend yield (%) -
52-week high/low (Rs) 189 / 24
2-month average daily volume 69,112
Stock performance
Returns (%) CMP 1-mth 3-mth 6-mth
PCBL 172 18.2 177.4 295.9
Sensex 16,643 2.8 21.0 54.0
Valuation matrix
(x) FY08 FY09 FY10E FY11E
P/E @ CMP 5.0 - 4.9 3.3
P/E @ Target 7.6 (10.8) 7.3 5.0
EV/EBITDA @ CMP 6.2 (14.0) 4.7 3.4

Phillips Carbon Black Initiating Coverage 09 October 2009
2
Investment rationale
Booming tyre industry to magnify demand for carbon black The automotive tyre sector, the principal consumer segment of carbon black, is likely to boom as the Indian government sharpens its focus on improving the country’s road network. Buoyant prospects for the domestic automobile sector have triggered capacity expansion programmes, both greenfield and brownfield, across the tyre industry. Many players are expected to commence production at their greenfield units in the next three years (see fig 2). The total capex planned by these companies ranges between Rs 35bn and Rs 40bn. Similar developments in the Asia Pacific region would also trigger demand for carbon black, both in OEM and replacement markets.
Fig 1 - Month-wise production volumes of truck and bus tyres
800900
1,0001,1001,2001,3001,400
Apr
-04
Aug
-04
Jan-
05
Jun-
05
Nov
-05
Apr
-06
Aug
-06
Jan-
07
Jun-
07
Nov
-07
Apr
-08
Sep-
08
Jan-
09
Jun-
09
('000 nos) Steep fall in volumes during 2HFY09; recovery in Q1FY10
onwards.
Source: Siam, RHH
Fig 2 - Tyre industry: capex details
Player Tyre expansion Investment (Rs bn)
Apollo Tyres To set up a greenfield radial tyre plant for passenger cars, trucks, and buses in Chennai with an investment of Rs 11bn. It is also expanding its Baroda passenger car radial tyre plant by 40tonnes per day (tpd) at a capex of Rs 0.5bn.
11.5
Birla Tyres To set up a greenfield radial tyre plant at Uttarakhand with a capacity of ~85tpd. The plant would commence production from December ’09.
5.0
Ceat To set up a radial tyre plant at Baroda, Gujarat, with a capacity of ~100tpd for truck and bus radials, and passenger cars. Plant to commence production in FY10-FY11.
5.5
Bridgestone To expand passenger car radial capacity by 30tpd. To be operational from July ‘09 NA
JK Tyres Expansion of truck and bus radial capacity from 367,000 tyres p.a. to 800,000 units. Began operations in Q1FY10.
3.2
MRF Expanding radial tyre capacity by 350,000 tyres p.a. 4.0
Source: Crisil
Over the last nine years, the Indian passenger vehicle (PV) segment grew by 12.9%, whereas the commercial vehicle (CV) segment grew by 14% (see Fig 3). Over FY09-FY11, the PV and CV segments are expected to log a CAGR of 13% and 12% respectively, albeit on a higher base. Phillips Carbon Black (PCBL), the market leader in carbon black manufacturing in India, is likely to emerge as one of the key beneficiaries of the revival in the domestic tyre industry due to its well-timed expansion.
Domestic tyre manufacturers to incur
Rs 35bn–40bn on capacity expansion
Strong growth in PV and CV segments
will boost demand for carbon black

Phillips Carbon Black Initiating Coverage 09 October 2009
3
Fig 3 - Auto sales
(in ‘000) FY01 FY02 FY03 FY04 FY05 FY06 FY07 FY08 FY09 April - Aug ‘09
Commercial Vehicles (LHS) 150 159 203 277 349 391 518 551 428 189
LCV (LHS) 90 64 82 108 137 170 223 253 227 109
MHCV (LHS) 60 95 122 169 213 221 295 298 201 79
Passenger Vehicles (LHS) 718 728 780 1,031 1,228 1,319 1,578 1,768 1,888 889
Cars (LHS) 591 558 612 821 981 1,052 1,269 1,415 1,551 731
UV (LHS) 127 107 115 149 181 200 224 251 229 103
MPV (LHS) - 63 53 61 66 67 84 102 108 55
Two Wheelers (LHS) 3,746 4,307 4,992 5,628 6,577 7,566 8,467 8,051 8,416 4,050
Motorcycles 2,156 2,944 3,771 4,357 5,242 6,197 7,098 6,544 6,806 3,255
Mopeds 688 427 362 331 352 376 393 432 438 225
Scooter 902 936 859 940 983 993 976 1,075 1,172 570
Total 4,614 5,194 5,975 6,936 8,154 9,275 10,562 10,370 10,732 5,128
% YoY change (RHS) 12.59 15.03 16.09 17.55 13.75 13.88 (1.82) 3.49
Source: SIAM, RHH
Fig 4 - PCBL: Trend in quarterly carbon black volumes
60,444 59,776 63,022 63,266 59,520 63,490 64,918 61,548 60,559 57,861
43,73748,423
61,012
010,00020,00030,00040,00050,00060,00070,000
Q1 Q2 Q3 Q4 Q1 Q2 Q3 Q4 Q1 Q2 Q3 Q4 Q1
FY07 FY08 FY09 FY10
(mt)Improving trend
Source: Company, RHH
Expansion to boost volumes, strengthen international presence Buoyed by increasing demand from the tyre OEM and replacement markets, the domestic carbon black industry is expected to grow at an 8–9% CAGR over FY07-FY12. To cater to this growing demand, PCBL has embarked on an aggressive expansion plan. The company intends to set up a 90,000mt greenfield plant at Mundra by the end of October, to take its total carbon black capacity to 360,000mt. It is further expanding its capacity at Kochi by 50,000mt, to be commissioned in December ’10 (Kochi expansion not factored into our valuations at present).
When all these expansion projects come on-stream, the company’s total capacity would rise to 410,000mt along with cogeneration power plants (CPP) of 70.5MW (see Fig 5). The benefits of most of these expansion projects are likely to flow in from FY11 onwards. PCBL will incur a total capex of Rs 3.8bn towards capacity augmentation: Rs 2.8bn for carbon black and Rs 1bn for the power plants. This will be funded by a mix of debt and equity in the ratio of 2:1.
To capitalise on buoyant industry
prospects through capacity expansion

Phillips Carbon Black Initiating Coverage 09 October 2009
4
Fig 5 - Proposed capacity expansion
Commencement of Production Capacity expansion Carbon Black(mt) CPP(MW)
Carbon black CPP
Mundra (Greenfield) 90,000 16 Oct-09 Nov-09
Kochi (Brownfield) 50,000 10 Dec-10 Dec-10
Total Domestic 140,000 26
Existing 270,000 44.5
Total 410,000 70.5
Source: Company, RHH
The Mundra plant would have freight advantages, as it would cater to the western Indian markets. We estimate savings of Rs 1,500–2,000/tonne on freight costs. PCBL has been able to reduce freight costs for carbon black feed stock (CBFS), the key raw material, by changing its port of operations from JNPT to Mundra during the monsoons.
As the largest player in the domestic market, PCBL also enjoys economies of scale. Addition of capacities will strengthen this advantage and bolster the company’s sale volumes by 35% in FY10 and further by 15% in FY11. Moreover, with carbon black capacities from the US, the EU, and Japan shifting to developing countries, the export potential is immense. Before expansion, PCBL’s capacities were mostly restricted to the domestic market; post expansion, the company would be able to fortify its international presence by leveraging on its established brand and leadership position.
Moreover, the imposition of anti-dumping duty on carbon black imports from China, Australia, Thailand, and Russia, is expected to improve the pricing power of domestic carbon black producers. The duty is typically placed in the US$ 78–195/tonne range.
Planned foray into Vietnam to enhance global footprint To cash in on Vietnam’s growing attraction as a preferred location for tyre manufacturing, PCBL has formed a joint venture (80:20) with Vietnam National Chemical Corporation (Vinachem), a Vietnam-based company. The venture will set up a greenfield capacity for manufacturing 100,000mt of carbon black and 16MW of cogeneration power using fuel gases from the plant. This will be the first carbon black plant in Vietnam and serve as a hub for exports to the region. While the present demand for carbon black is in the region of 40,000–50,000tonnes, it is expected to more than double in the next two to three years as many tyre manufacturers shift base to Vietnam due to the easy availability of rubber.
The project will require an estimated investment of US$ 50mn and is likely to be funded through a mix of debt (US$ 30mn) and equity (US$ 20mn: 80% by PCBL and the rest by the JV partner). We have not factored this expansion into our numbers as of now.
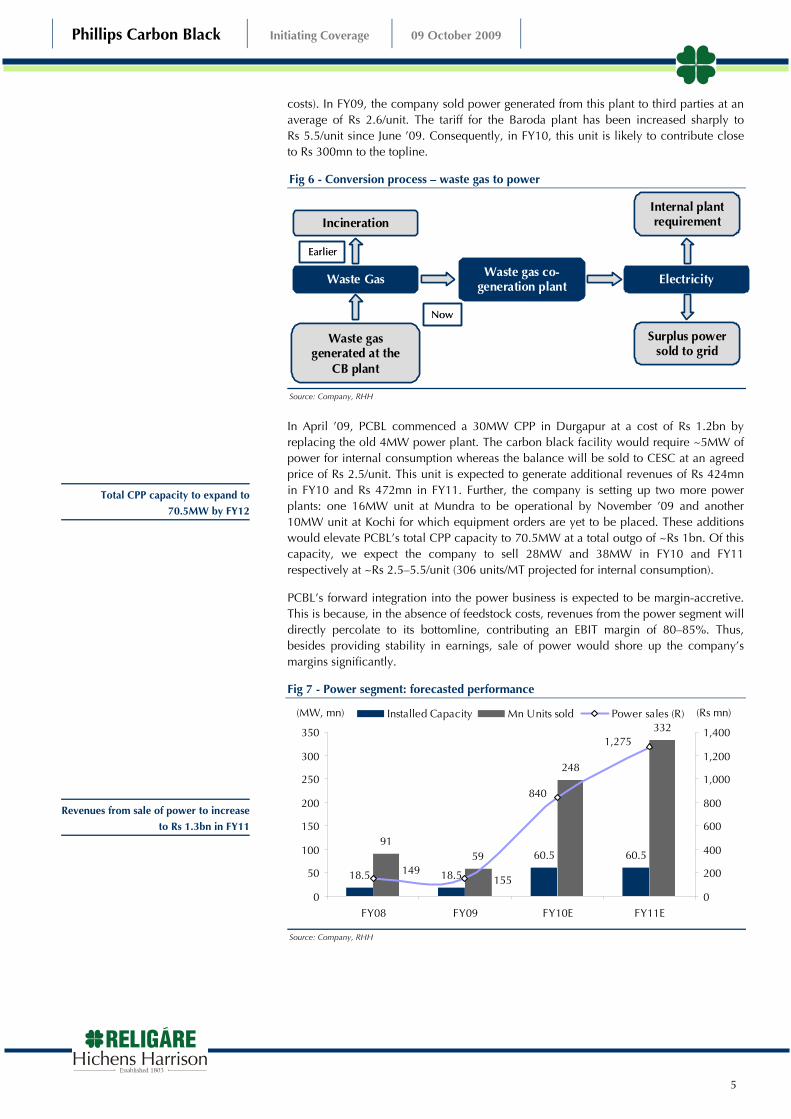
CPP generation to de-risk operations, augment revenues and margins Typically, the process for carbon black manufacturing is environmentally unfriendly, since the ‘off-gas’, a by-product of the manufacturing process, is either released or flared. This requires additional investments in pollution control equipment to ensure uninterrupted operations. Alternately, the gas can be converted into steam that, in turn, can be used to generate power. This yields three benefits:
Savings on expenditure associated with the flaring of gas
Savings on power cost by captively using the electricity generated
Increase in revenues as surplus power generated can be sold to third parties.
Generating power by this technique has enabled PCBL to significantly reduce its power costs. PCBL’s current power generation capacity stands at 44.5MW of which 10.5MW is used for internal consumption and the remaining is sold to SEBs. Sale of power from the Baroda plant translated into revenue inflows of Rs 155mn (8MW) in FY09. The production cost per unit of power is low at Rs 0.3/unit (in the absence of raw material
Sales volume to increase 35% in FY10
and 15% in FY11
Greenfield expansion in Vietnam to
facilitate exports to the region
Baroda power plant to contribute
Rs 300mn to revenues in FY10
Phillips Carbon Black Initiating Coverage 09 October 2009
5
costs). In FY09, the company sold power generated from this plant to third parties at an average of Rs 2.6/unit. The tariff for the Baroda plant has been increased sharply to Rs 5.5/unit since June ’09. Consequently, in FY10, this unit is likely to contribute close to Rs 300mn to the topline.
Fig 6 - Conversion process – waste gas to power
Waste gas generated at the
CB plant
Incineration
Waste Gas
Earlier
Waste gas co-generation plant Electricity
Now
Internal plant requirement
Surplus power sold to grid
Waste gas generated at the
CB plant
Incineration
Waste Gas
Earlier
Waste gas co-generation plant Electricity
Now
Internal plant requirement
Surplus power sold to grid
Source: Company, RHH
In April ’09, PCBL commenced a 30MW CPP in Durgapur at a cost of Rs 1.2bn by replacing the old 4MW power plant. The carbon black facility would require ~5MW of power for internal consumption whereas the balance will be sold to CESC at an agreed price of Rs 2.5/unit. This unit is expected to generate additional revenues of Rs 424mn in FY10 and Rs 472mn in FY11. Further, the company is setting up two more power plants: one 16MW unit at Mundra to be operational by November ’09 and another 10MW unit at Kochi for which equipment orders are yet to be placed. These additions would elevate PCBL’s total CPP capacity to 70.5MW at a total outgo of ~Rs 1bn. Of this capacity, we expect the company to sell 28MW and 38MW in FY10 and FY11 respectively at ~Rs 2.5–5.5/unit (306 units/MT projected for internal consumption).
PCBL’s forward integration into the power business is expected to be margin-accretive. This is because, in the absence of feedstock costs, revenues from the power segment will directly percolate to its bottomline, contributing an EBIT margin of 80–85%. Thus, besides providing stability in earnings, sale of power would shore up the company’s margins significantly.
Fig 7 - Power segment: forecasted performance
18.5 18.5
60.5 60.591
59
248
332
149155
840
1,275
0
50
100
150
200
250
300
350
FY08 FY09 FY10E FY11E0
200
400
600
800
1,000
1,200
1,400
Installed Capacity Mn Units sold Power sales (R)(MW, mn) (Rs mn)
Source: Company, RHH
Total CPP capacity to expand to
70.5MW by FY12
Revenues from sale of power to increase
to Rs 1.3bn in FY11

Phillips Carbon Black Initiating Coverage 09 October 2009
6
Industry overview
What is Carbon Black? Carbon black is a black, fluffy powder or granular substance made by burning hydrocarbons in a limited supply of air. It is derived by partial consumption of a liquid feedstock rich in carbon, and is produced through thermal decomposition of oils with high carbon content at high temperatures.
Carbon black is mostly used as a reinforcing agent for rubber. The most extensive use of this product is in the manufacture of automotive tyres as it imparts high resistance to abrasion of tyres, increases their life span, and enhances their grip. Carbon black is available in three grades: soft, hard, and super hard. It is also used to colour printing ink, painting, paper, and plastics. Carbon black is an important ingredient in the manufacture of various rubber goods for applications ranging from aerospace to common household goods.
CBFS prices determined by crude prices CBFS, a crude derivative, is a major raw material for the manufacture of carbon black and constitutes more than 90% of PCBL’s total raw material costs. Typically, to produce 1mt of carbon black, 1.7mt of CBFS is needed. CBFS is the phenol/furfural extract obtained during lube oil processing.
Prices of CBFS are positively correlated with crude prices. Therefore, extreme fluctuation in crude prices impacts the margins of carbon black producers. In the past, prices of carbon black increased in line with that of crude oil. Despite this, domestic producers were unable to pass on this increase to consumers due to low bargaining power. However, with prices of crude correcting, the pressure on carbon black producers has eased significantly.
Carbon black’s base material is produced by companies like IPCL and NOCIL. The quantities offered by them, however, are not adequate. The base material is also supplied by oil refineries (in the form of CBFS) but it is low in carbon content and high in sulphur; hence, it does not measure up to international specifications. Therefore, the industry is importing the base material from the US.
Uses of carbon black The tyre industry consumes ~65% of the total carbon black production, the rubber sector 15%, the belts and horses sector 10%, and printing ink and other specialty sectors the remaining ~10%. Carbon black accounts for almost 35% (by weight) and 16% (by value) of raw material used in the manufacture of automobile tyres.
Fig 8 - Uses of carbon black Printing Ink &
other speciality10%
Belts & hoses10%
Rubber15% Tyre
65%
Source: Industry, RHH
Carbon black primarily used as a
reinforcing agent for rubber
CBFS price positively correlated with
crude prices
Tyre industry, followed by rubber, are
biggest end users of carbon black

Phillips Carbon Black Initiating Coverage 09 October 2009
7
Domestic market: key players India’s carbon black industry is dominated by two major players: PCBL (270,000mt) and Hi-Tech, an Aditya Birla Nuvo unit (230,000mt). Both companies together control ~81% of the domestic capacity. Other players include Continental, Cabot India and Ralson Carbon Black. PCBL will commission its 90,000mt capacity in October ’09, taking its total capacity to 360,000mt. With this expansion, PCBL will become the eighth largest player in terms of capacity, globally.
Fig 9 - Market share (based on FY09 production )
Ralson1%
Cabot8%Continental
10%
Hi-Tech40%
PCBL41%
Source: Company, RHH
Fig 10 - Global ranking of carbon black players Global Ranking - Carbon Black
Company Capacity (mmt)
1 Cabot, USA 2.01
2 Evonik, Germany 1.45
3 Columbian, USA 1.13
4 Birla, India 0.79
5 CSRC, Taiwan 0.74
6 Sid Richardson, USA 0.45
7 Tokai, Japan 0.37
8 Omsk, Russia 0.35
9 Black Cat, China 0.29
10 PCBL, India 0.27
Source: Company, RHH
Asia Pacific region to drive demand Global demand for carbon black is expected to grow at a 3% CAGR, from 9.2mt in CY07 to 10.8mt in CY10. The Asia Pacific region is likely to record the highest growth at a 4.4% CAGR whereas growth in the North American region is likely to remain flat. Western and Eastern Europe are expected to record a CAGR of 2.1% and 3% respectively over CY07-CY10. The total demand is projected to reach 13mmt till CY15.
Fig 11 - Global demand for carbon black
2007 Carbon black 2010 CAGR % 2007-10
2015 Region (mmt)
Demand Capacity Demand Demand
North America 1.9 2.2 2.0 1.0 2.1
Western Europe 1.8 1.6 2.0 2.1 2.2
Asia Pacific 4.2 4.5 5.2 4.4 6.8
South America 0.5 0.6 0.6 2.8 0.7
Eastern Europe 0.6 0.9 0.7 3.0 0.9
Africa & Middle east 0.3 0.3 0.3 3.9 0.4
Overall 9.2 10.1 10.8 3.2 13.0
Source: Company, RHH
PCBL and Hi-Tech together own ~81%
of domestic carbon black capacity
Capacity expansion to improve PCBL’s
global ranking from 10 to 8
Asia Pacific region to record highest
growth of 4.4% CAGR over CY07-CY10
Phillips Carbon Black Initiating Coverage 09 October 2009
8
Financial overview
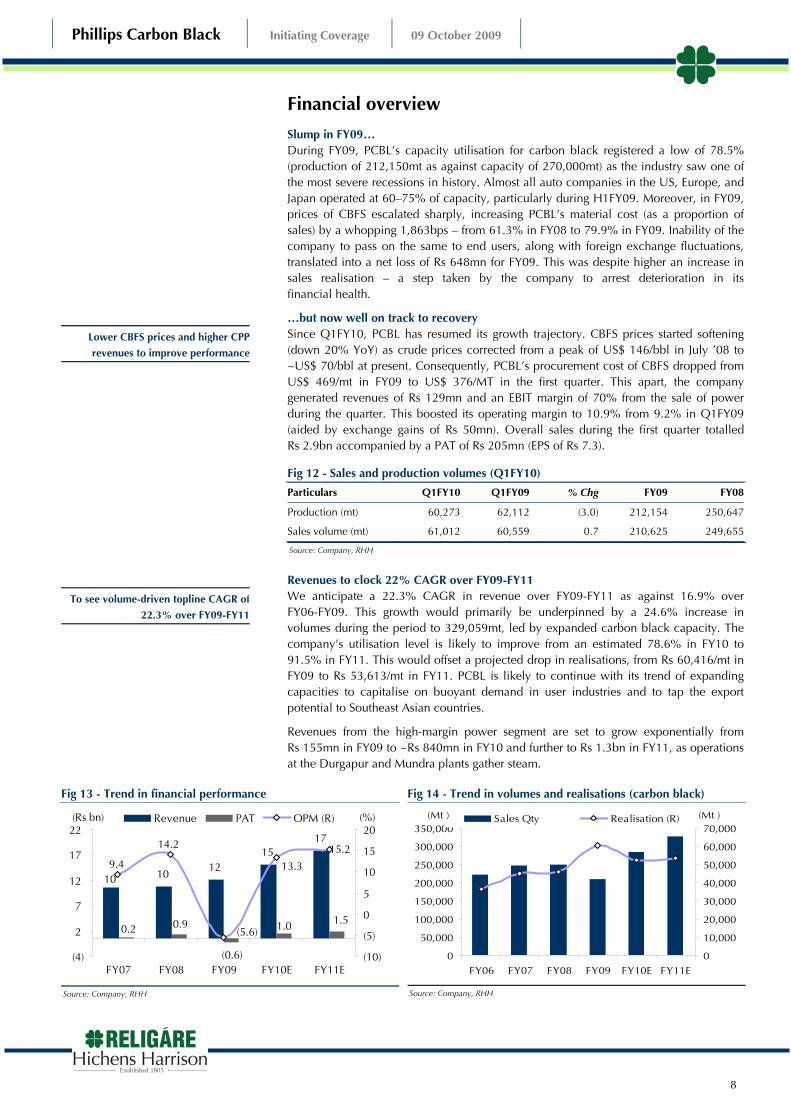
Slump in FY09… During FY09, PCBL’s capacity utilisation for carbon black registered a low of 78.5% (production of 212,150mt as against capacity of 270,000mt) as the industry saw one of the most severe recessions in history. Almost all auto companies in the US, Europe, and Japan operated at 60–75% of capacity, particularly during H1FY09. Moreover, in FY09, prices of CBFS escalated sharply, increasing PCBL’s material cost (as a proportion of sales) by a whopping 1,863bps – from 61.3% in FY08 to 79.9% in FY09. Inability of the company to pass on the same to end users, along with foreign exchange fluctuations, translated into a net loss of Rs 648mn for FY09. This was despite higher an increase in sales realisation – a step taken by the company to arrest deterioration in its financial health.
…but now well on track to recovery Since Q1FY10, PCBL has resumed its growth trajectory. CBFS prices started softening (down 20% YoY) as crude prices corrected from a peak of US$ 146/bbl in July ’08 to ~US$ 70/bbl at present. Consequently, PCBL’s procurement cost of CBFS dropped from US$ 469/mt in FY09 to US$ 376/MT in the first quarter. This apart, the company generated revenues of Rs 129mn and an EBIT margin of 70% from the sale of power during the quarter. This boosted its operating margin to 10.9% from 9.2% in Q1FY09 (aided by exchange gains of Rs 50mn). Overall sales during the first quarter totalled Rs 2.9bn accompanied by a PAT of Rs 205mn (EPS of Rs 7.3).
Fig 12 - Sales and production volumes (Q1FY10)
Particulars Q1FY10 Q1FY09 % Chg FY09 FY08
Production (mt) 60,273 62,112 (3.0) 212,154 250,647
Sales volume (mt) 61,012 60,559 0.7 210,625 249,655
Source: Company, RHH
Revenues to clock 22% CAGR over FY09-FY11 We anticipate a 22.3% CAGR in revenue over FY09-FY11 as against 16.9% over FY06-FY09. This growth would primarily be underpinned by a 24.6% increase in volumes during the period to 329,059mt, led by expanded carbon black capacity. The company’s utilisation level is likely to improve from an estimated 78.6% in FY10 to 91.5% in FY11. This would offset a projected drop in realisations, from Rs 60,416/mt in FY09 to Rs 53,613/mt in FY11. PCBL is likely to continue with its trend of expanding capacities to capitalise on buoyant demand in user industries and to tap the export potential to Southeast Asian countries.
Revenues from the high-margin power segment are set to grow exponentially from Rs 155mn in FY09 to ~Rs 840mn in FY10 and further to Rs 1.3bn in FY11, as operations at the Durgapur and Mundra plants gather steam.
Fig 13 - Trend in financial performance
1012
1517
(0.6)
10
0.2 0.9 1.51.0
13.3
15.214.2
9.4
(5.6)
(4)
2
7
12
17
22
FY07 FY08 FY09 FY10E FY11E(10)
(5)
0
5
10
15
20Revenue PAT OPM (R)(Rs bn) (%)
Source: Company, RHH
Fig 14 - Trend in volumes and realisations (carbon black)
0
50,000
100,000
150,000
200,000
250,000
300,000
350,000
FY06 FY07 FY08 FY09 FY10E FY11E0
10,000
20,000
30,000
40,000
50,000
60,000
70,000Sales Qty Realisation (R) (Mt )(Mt )
Source: Company, RHH
Lower CBFS prices and higher CPP
revenues to improve performance
To see volume-driven topline CAGR of
22.3% over FY09-FY11
Phillips Carbon Black Initiating Coverage 09 October 2009
9
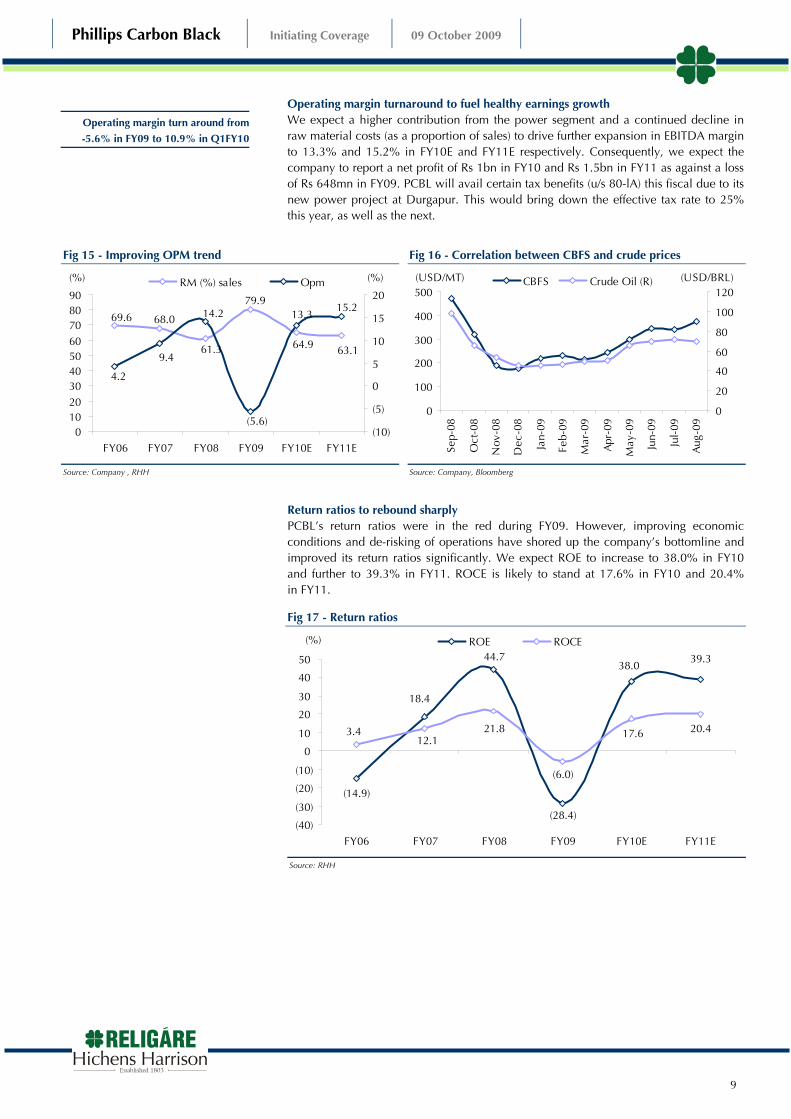
Operating margin turnaround to fuel healthy earnings growth We expect a higher contribution from the power segment and a continued decline in raw material costs (as a proportion of sales) to drive further expansion in EBITDA margin to 13.3% and 15.2% in FY10E and FY11E respectively. Consequently, we expect the company to report a net profit of Rs 1bn in FY10 and Rs 1.5bn in FY11 as against a loss of Rs 648mn in FY09. PCBL will avail certain tax benefits (u/s 80-lA) this fiscal due to its new power project at Durgapur. This would bring down the effective tax rate to 25% this year, as well as the next.
Fig 15 - Improving OPM trend
63.164.9
79.9
61.3
69.6 68.015.2
13.3
(5.6)
14.2
9.4
4.2
0102030405060708090
FY06 FY07 FY08 FY09 FY10E FY11E(10)
(5)
0
5
10
15
20RM (%) sales Opm (%) (%)
Source: Company , RHH
Fig 16 - Correlation between CBFS and crude prices
0
100
200
300
400
500
Sep-
08
Oct
-08
Nov
-08
Dec
-08
Jan-
09
Feb-
09
Mar
-09
Apr
-09
May
-09
Jun-
09
Jul-
09
Aug
-09
0
20
40
60
80
100
120CBFS Crude Oil (R)(USD/MT) (USD/BRL)
Source: Company, Bloomberg
Return ratios to rebound sharply PCBL’s return ratios were in the red during FY09. However, improving economic conditions and de-risking of operations have shored up the company’s bottomline and improved its return ratios significantly. We expect ROE to increase to 38.0% in FY10 and further to 39.3% in FY11. ROCE is likely to stand at 17.6% in FY10 and 20.4% in FY11.
Fig 17 - Return ratios
39.338.0
(28.4)
44.7
18.4
(14.9)
20.417.6
(6.0)
21.812.1
3.4
(40)
(30)
(20)
(10)
0
10
20
30
40
50
FY06 FY07 FY08 FY09 FY10E FY11E
ROE ROCE(%)
Source: RHH
Operating margin turn around from
-5.6% in FY09 to 10.9% in Q1FY10

Phillips Carbon Black Initiating Coverage 09 October 2009
10
Valuation Scope for re-rating Barring the past two fiscals, the automobile industry in India has witnessed strong growth of ~10% over the years; this trend is expected to continue, boosting demand for tyres in the OEM and replacement markets. Consequently, the domestic carbon black industry is estimated to grow at an 8–9% CAGR over the next five years. PCBL, the market leader with strong economies of scale, stands to benefit from this emerging demand and the continued migration of tyre capacities from the US and EU to emerging markets to save on emission compliance costs
We see sufficient scope for re-rating of the stock due to the company’s leadership position, strategic initiatives, operational turnaround, capacity expansion, and its transformation from a commodity business to a steady, high-margin power business.
Carbon black business valued at Rs 106 In line with most domestic commodity businesses, we have valued PCBL’s carbon black division at 4x FY11E earnings.
Fig 18 - Segment wise PAT breakup
Particulars (Rs mn) FY10E FY11E
Carbon black PAT 422.9 737.0
Power PAT 577.6 746.8
Power contribution to Topline (%) 5.3 6.8
Source: RHH
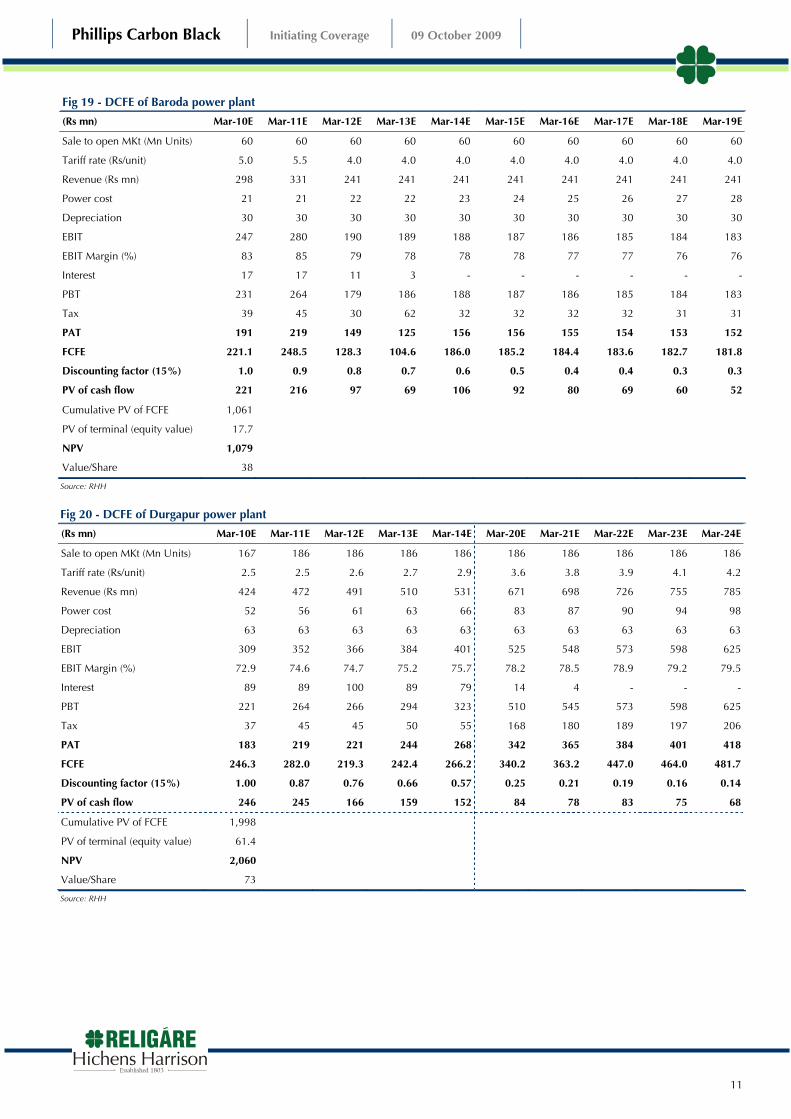
Power business valued at Rs 156
We have valued all the power plants on DCFE basis, wherein we have discounted cash flows from the external sale of power. The underlying assumptions for the same are:
Cost of equity of 15%
Cost of power at 25ps/unit escalating by 4% every year
Short-term realisation of Rs 5.5/unit for the Baroda plant (rate at which the company has tied up with Tata Power’s trading arm for selling the surplus 8MW power from this plant). We have reduced this rate to Rs 4/unit from FY12 onwards (same rates assumed for upcoming Mundra power plant).
Realisation for the 30MW Durgapur power plant assumed at Rs 2.5/unit (tied up with CESC on a short-term basis), with a 4% escalation over the years. The company is in the process of getting open access for this power plant; if this happens, it will be able to sell at a much higher rate.
Strong industry outlook and power
business – potential upsides
Phillips Carbon Black Initiating Coverage 09 October 2009
11
Fig 19 - DCFE of Baroda power plant
(Rs mn) Mar-10E Mar-11E Mar-12E Mar-13E Mar-14E Mar-15E Mar-16E Mar-17E Mar-18E Mar-19E
Sale to open MKt (Mn Units) 60 60 60 60 60 60 60 60 60 60
Tariff rate (Rs/unit) 5.0 5.5 4.0 4.0 4.0 4.0 4.0 4.0 4.0 4.0
Revenue (Rs mn) 298 331 241 241 241 241 241 241 241 241
Power cost 21 21 22 22 23 24 25 26 27 28
Depreciation 30 30 30 30 30 30 30 30 30 30
EBIT 247 280 190 189 188 187 186 185 184 183
EBIT Margin (%) 83 85 79 78 78 78 77 77 76 76
Interest 17 17 11 3 - - - - - -
PBT 231 264 179 186 188 187 186 185 184 183
Tax 39 45 30 62 32 32 32 32 31 31
PAT 191 219 149 125 156 156 155 154 153 152
FCFE 221.1 248.5 128.3 104.6 186.0 185.2 184.4 183.6 182.7 181.8
Discounting factor (15%) 1.0 0.9 0.8 0.7 0.6 0.5 0.4 0.4 0.3 0.3
PV of cash flow 221 216 97 69 106 92 80 69 60 52
Cumulative PV of FCFE 1,061
PV of terminal (equity value) 17.7
NPV 1,079
Value/Share 38
Source: RHH
Fig 20 - DCFE of Durgapur power plant
(Rs mn) Mar-10E Mar-11E Mar-12E Mar-13E Mar-14E Mar-20E Mar-21E Mar-22E Mar-23E Mar-24E
Sale to open MKt (Mn Units) 167 186 186 186 186 186 186 186 186 186
Tariff rate (Rs/unit) 2.5 2.5 2.6 2.7 2.9 3.6 3.8 3.9 4.1 4.2
Revenue (Rs mn) 424 472 491 510 531 671 698 726 755 785
Power cost 52 56 61 63 66 83 87 90 94 98
Depreciation 63 63 63 63 63 63 63 63 63 63
EBIT 309 352 366 384 401 525 548 573 598 625
EBIT Margin (%) 72.9 74.6 74.7 75.2 75.7 78.2 78.5 78.9 79.2 79.5
Interest 89 89 100 89 79 14 4 - - -
PBT 221 264 266 294 323 510 545 573 598 625
Tax 37 45 45 50 55 168 180 189 197 206
PAT 183 219 221 244 268 342 365 384 401 418
FCFE 246.3 282.0 219.3 242.4 266.2 340.2 363.2 447.0 464.0 481.7
Discounting factor (15%) 1.00 0.87 0.76 0.66 0.57 0.25 0.21 0.19 0.16 0.14
PV of cash flow 246 245 166 159 152 84 78 83 75 68
Cumulative PV of FCFE 1,998
PV of terminal (equity value) 61.4
NPV 2,060
Value/Share 73
Source: RHH

Phillips Carbon Black Initiating Coverage 09 October 2009
12
Fig 21 - DCFE of Mundra power plant
(Rs mn) Mar-10E Mar-11E Mar-12E Mar-13E Mar-14E Mar-20E Mar-21E Mar-22E Mar-23E Mar-24E
Sale to open MKt (Mn Units) 21 86 86 86 86 86 86 86 86 86
Tariff rate (Rs/unit) 5.5 5.5 4.0 4.0 4.0 4.0 4.0 4.0 4.0 4.0
Revenue (Rs mn) 118 473 344 344 344 344 344 344 344 344
Power cost 8 27 30 31 32 40 42 44 46 47
Depreciation 35 35 35 35 35 35 35 35 35 35
EBIT 75 410 279 278 276 268 266 265 263 261
EBIT Margin (%) 63.4 86.8 81.2 80.8 80.5 78.0 77.5 77.0 76.5 76.0
Interest 16 49 69 62 54 10 2 (0) - -
PBT 58 361 210 216 222 258 264 265 263 261
Tax 10 61 36 37 38 85 87 87 87 86
PAT 48 299 174 179 184 173 177 177 176 175
FCFE 83.6 334.6 164.6 169.8 174.9 163.4 167.2 212.6 211.4 210.2
Discounting factor (15%) 1.00 0.87 0.76 0.66 0.57 0.25 0.21 0.19 0.16 0.14
PV of cash flow 84 291 124 112 100 40 36 40 34 30
Cumulative PV of FCFE 1,252
PV of terminal (equity value) 23.6
NPV (Rs mn) 1,275
Value/Share 45
Source: RHH
PCBL also stands to benefit from the sale of carbon credits. The company has already sold CERs worth Rs 28mn in FY07; we, however, have not factored this in our model.
Group company investments not factored in In addition, PCBL has equity investments in its group companies which, at current market price, are valued at Rs 774mn. We have not considered this in our valuations since it is a group company investment.
Fig 22 - Value of investments
Investment Number of Shares
Cost of Investment
(Rs mn) CMP
Current Valueof Invest(Rs mn)
Bank of Baroda 7,186 1.6 490 3.5
CEAT 4,155,743 261.5 154 640
CESC 344,130 111.6 375 128.9
Total ~400.1 ~774
Source: Company, RHH Prices as on 9th Oct 09
Initiate with Buy and target of Rs 262 At Rs 172, the stock trades at a P/E of 4.9x FY10E and 3.3x FY11E, and EV/ EBITDA of 4.7x FY10E and 3.4x FY11E. We have arrived at a SOTP-based target price of Rs 262, valuing PCBL’s core carbon black business (commodity) at Rs 106 and power business at Rs 156. At this value, the implied P/BV for the power business works out to 2x FY11E power book value which, in our opinion, is attractive (see fig.19-21 for details). We initiate coverage on PCBL with a Buy.
Phillips Carbon Black Initiating Coverage 09 October 2009
13
Key risks
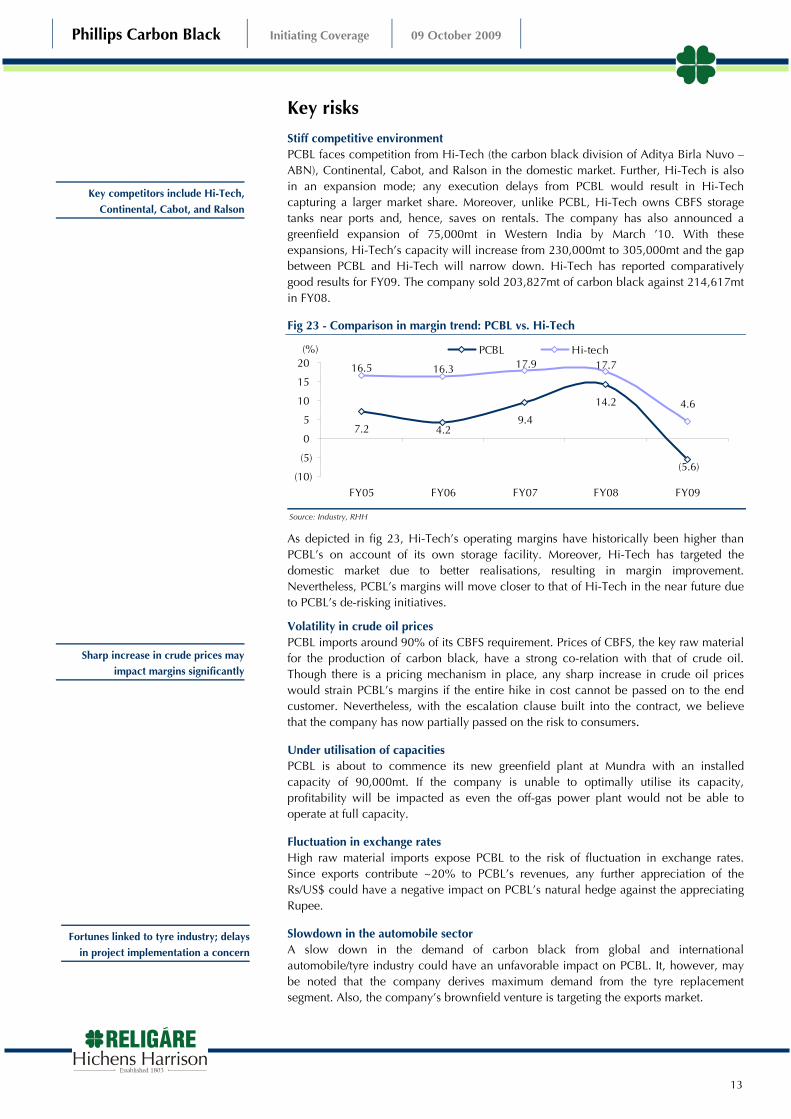
Stiff competitive environment PCBL faces competition from Hi-Tech (the carbon black division of Aditya Birla Nuvo – ABN), Continental, Cabot, and Ralson in the domestic market. Further, Hi-Tech is also in an expansion mode; any execution delays from PCBL would result in Hi-Tech capturing a larger market share. Moreover, unlike PCBL, Hi-Tech owns CBFS storage tanks near ports and, hence, saves on rentals. The company has also announced a greenfield expansion of 75,000mt in Western India by March ’10. With these expansions, Hi-Tech’s capacity will increase from 230,000mt to 305,000mt and the gap between PCBL and Hi-Tech will narrow down. Hi-Tech has reported comparatively good results for FY09. The company sold 203,827mt of carbon black against 214,617mt in FY08.
Fig 23 - Comparison in margin trend: PCBL vs. Hi-Tech
7.29.4
14.2 4.6
(5.6)
4.2
16.5 16.3 17.9 17.7
(10)
(5)
0
5
10
15
20
FY05 FY06 FY07 FY08 FY09
PCBL Hi-tech(%)
Source: Industry, RHH
As depicted in fig 23, Hi-Tech’s operating margins have historically been higher than PCBL’s on account of its own storage facility. Moreover, Hi-Tech has targeted the domestic market due to better realisations, resulting in margin improvement. Nevertheless, PCBL’s margins will move closer to that of Hi-Tech in the near future due to PCBL’s de-risking initiatives.
Volatility in crude oil prices PCBL imports around 90% of its CBFS requirement. Prices of CBFS, the key raw material for the production of carbon black, have a strong co-relation with that of crude oil. Though there is a pricing mechanism in place, any sharp increase in crude oil prices would strain PCBL’s margins if the entire hike in cost cannot be passed on to the end customer. Nevertheless, with the escalation clause built into the contract, we believe that the company has now partially passed on the risk to consumers.
Under utilisation of capacities PCBL is about to commence its new greenfield plant at Mundra with an installed capacity of 90,000mt. If the company is unable to optimally utilise its capacity, profitability will be impacted as even the off-gas power plant would not be able to operate at full capacity.
Fluctuation in exchange rates High raw material imports expose PCBL to the risk of fluctuation in exchange rates. Since exports contribute ~20% to PCBL’s revenues, any further appreciation of the Rs/US$ could have a negative impact on PCBL’s natural hedge against the appreciating Rupee.
Slowdown in the automobile sector A slow down in the demand of carbon black from global and international automobile/tyre industry could have an unfavorable impact on PCBL. It, however, may be noted that the company derives maximum demand from the tyre replacement segment. Also, the company’s brownfield venture is targeting the exports market.
Key competitors include Hi-Tech,
Continental, Cabot, and Ralson
Sharp increase in crude prices may
impact margins significantly
Fortunes linked to tyre industry; delays
in project implementation a concern

Phillips Carbon Black Initiating Coverage 09 October 2009
14
Delay in implementation of power projects The high-margin power project is the main driver for margin improvement. Hence, delays in implementation of the power projects would impact PCBL’s overall margins significantly. We, however, have factored in delays of one-two months in the implementation of these projects.
Company background
PCBL, headquartered at Kolkata and part of the RPG Group, is India’s leading producer of carbon black. Besides being the largest exporter of carbon black from India, it is one of the largest in Asia in its field and the tenth largest in the world. Not surprisingly, though the company exports only 20% of its annual production, these constitute 58% of the industry exports.
PCBL started production in 1962 through oil furnace, the then most widely accepted manufacturing process of carbon black, patented by its collaborator and world carbon black leader Phillips Petroleum Company, USA. In 1988, PCBL entered into a technical agreement with Columbian Chemicals Company, USA, and acquired access to state-of-the-art carbon black technology, helping the company gain flexibility, product range, production capacity, and energy conservation.
The company has two business verticals: carbon black and power. It generates power from the waste heat (off-gas) emitted while producing carbon black. Part of the power generated is used internally and the remaining is sold to SEBs.
Fig 24 - Business overview
PCBL
Carbon BlackRevenue
FY09- Rs11,478mn
PowerRevenue
FY09- Rs155mn
Durgapur-1,40,000MT
Baroda-90,000MT
Kochi-40,000MT
Durgapur-4MW
Baroda-12MW
Kochi-2.5MW
PCBL
Carbon BlackRevenue
FY09- Rs11,478mn
PowerRevenue
FY09- Rs155mn
Durgapur-1,40,000MT
Baroda-90,000MT
Kochi-40,000MT
Durgapur-4MW
Baroda-12MW
Kochi-2.5MW
Source: Company, RHH
The company has an installed capacity of 270,000mt across three locations in India (Durgapur, Cochin, Baroda). Production capacity of the three units put together is almost 47% of India’s total installed carbon black capacity. The production capacity of Durgapur unit alone accounts for ~20% of the domestic carbon black capacity. The company supplies carbon black to the world’s leading tyre companies. PCBL’s top international clients include the Bridgestone Group, Goodyear, Trellebrog, and Loadstarand Danang Rubber. In the domestic market, the company supplies to Apollo, MRF, and Ceat, which together contribute 10% of its total revenues; revenue contribution of Birla and JK Industry stands at 5%. Hence, concentration risk arising out of dependence on a single client is ruled out.
PCBL manufactures 23 grades (15 hard, 8 soft) of carbon black to cater to the automobile and plastics industries, as well as for specialty applications. It manufactures all four soft grades for the plastic industry. Currently, the domestic carbon black industry comprises five players, viz., PCBL, Aditya Birla Nuvo, Continental, Cabot India, and Ralson. PCBL enjoys an edge over Continental, Cabot and Ralson as these companies together have less than a quarter of PCBL's capacity. Moreover, these companies operate in the different segment of printing ink and carbon for photocopying. In the export market, PCBL does not face competition from these players.
Part of the RPG group, PCBL
contributes 58% of industry exports
Manufactures 23 grades of carbon
black; installed capacity 2,70,000MTPA

Phillips Carbon Black Initiating Coverage 09 October 2009
15
PCBL is the first carbon black company in the world to receive carbon credits. The company has taken advantage of the Electricity Act, 2003 to set up a 12MW co-generation power plant at its Baroda unit using off-gas in October ’04. After meeting the internal demand for production of carbon black, the surplus power of around 8MW has been sold to the GEB Grid from March ’05 end. Encouraged by the success of the Baroda co-generation power plant, the company, in April ’09, has replaced its 4MW power capacity with a 30MW cogeneration power plant at Durgapur.
Fig 25 - Current installed capacities
Location Carbon black (MTPA) Power (MW)
Durgapur 140,000 30
Baroda 90,000 12
Cochin 40,000 2.5
Total 270,000 44.5
Source: Company, RHH
In FY09, 80% of PCBL’s revenues came from the domestic market with exports constituting the remaining.
Fig 26 - Contribution from export and domestic markets (FY09)
Export20%
Domes tic80%
Source: Company, RHH
PCBL’s operating margins were negatively impacted last year due to high volatility in raw material cost. However, the company has taken adequate steps and de-risked its business model by setting up captive power plants. PCBL, therefore, is no longer the carbon black (commodity) story alone – it is a play on the power segment as well.
Domestic market contributed majority
of revenues in FY09

Phillips Carbon Black Initiating Coverage 09 October 2009
16
Financials
Profit and Loss statement Balance sheet Y/E March (Rs mn) FY08 FY09 FY10E FY11E
Revenues 10,332 11,633 14,588 17,407
Growth (%) 3.5 12.6 25.4 19.3
EBITDA 1,462 (646) 1,941 2,640
Growth (%) 56.5 (144.2) 400.3 36.0
Depreciation & amortisation 201 196 276 353
EBIT 1,261 (843) 1,665 2,286
Growth (%) 72.6 (166.8) 297.6 37.3
Interest 194 294 385 370
Other income 61 163 54 63
EBT 1,128 (973) 1,334 1,978
Income taxes 235 (325) 333 495
Effective tax rate (%) 20.8 33.4 25.0 25.0
Extraordinary items - - - -
Min into / inc from associates - - - -
Reported net income 893 (648) 1,000 1,484
Adjustments - - - -
Adjusted net income 893 (648) 1,000 1,484
Growth (%) 279.5 (172.6) 254.3 48.3
Shares outstanding (mn) 25.3 28.3 28.3 28.3
FDEPS (Rs) (adj) 34.2 (24.1) 35.4 52.5
Growth (%) 198.0 (170.6) 246.8 48.3
DPS (Rs) 4.0 - 3.0 3.0
Y/E March (Rs mn) FY08 FY09 FY10E FY11E
Cash and cash eq 151 71 1,039 847
Accounts receivable 2,176 1,808 2,198 2,575
Inventories 1,553 1,210 1,556 1,806
Other current assets 618 844 999 1,097
Investments 281 378 378 378
Gross fixed assets 4,507 4,405 7,855 7,855
Net fixed assets 2,449 2,280 5,454 5,100
CWIP 1,305 3,828 700 1,400
Intangible assets - - - -
Deferred tax assets, net (353) (17) (17) (17)
Other assets 9 7 7 7
Total assets 8,188 10,407 12,315 13,193
Accounts payable 2,695 3,917 3,949 3,943
Other current liabilities 42 53 53 53
Provisions 118 - 99 99
Debt funds 2,904 4,256 5,130 4,630
Other liabilities - - - -
Equity capital 253 283 283 283
Reserves & surplus 2,175 1,899 2,801 4,185
Shareholder's funds 2,428 2,182 3,083 4,468
Total liabilities 8,188 10,407 12,315 13,193
BVPS (Rs) 104.4 87.2 119.1 168.1
Cash flow statement Financial ratios Y/E March (Rs mn) FY08 FY09 FY10E FY11E
Net income + Depreciation 1,101 (447) 1,276 1,837
Non-cash adjustments (73) (648) - -
Changes in working capital (609) 1,793 (860) (730)
Cash flow from operations 419 698 416 1,107
Capital expenditure (1,090) (2,424) (322) (700)
Change in investments 1 14 - -
Other investing cash flow 13 - - -
Cash flow from investing (1,076) (2,410) (322) (700)
Issue of equity 0 402 - -
Issue/repay debt 368 2,061 874 (500)
Dividends paid (59) (117) - (99)
Other financing cash flow 33 (734) - -
Change in cash & cash eq (315) (99) 968 (192)
Closing cash & cash eq 151 71 1,039 847
Economic Value Added (EVA) analysis Y/E March FY08 FY09 FY10E FY11E
WACC (%) 9.8 9.1 9.8 10.7
ROIC (%) 23.5 (10.2) 19.5 23.1
Invested capital (Rs mn) 4,994 5,966 6,873 7,950
EVA (Rs mn) 687 (1,156) 667 989
EVA spread (%) 13.7 (19.4) 9.7 12.4
Y/E March FY08 FY09 FY10E FY11E
Profitability & Return ratios (%)
EBITDA margin 14.2 (5.6) 13.3 15.2
EBIT margin 12.2 (7.2) 11.4 13.1
Net profit margin 8.6 (5.6) 6.9 8.5
ROE 44.7 (28.4) 38.0 39.3
ROCE 21.8 (6.0) 17.6 20.4
Working Capital & Liquidity ratios
Receivables (days) 80 62 50 50
Inventory (days) 78 54 53 56
Payables (days) 156 130 152 131
Current ratio (x) 1.6 1.0 1.4 1.6
Quick ratio (x) 0.8 0.5 0.5 0.6
Turnover & Leverage ratios (x)
Gross asset turnover 2.3 2.6 2.4 2.2
Total asset turnover 1.4 1.3 1.3 1.4
Interest coverage ratio 6.5 (2.9) 4.3 6.2
Adjusted debt/equity 1.2 2.0 1.7 1.0
Valuation ratios (x)
EV/Sales 0.9 0.8 0.6 0.5
EV/EBITDA 6.2 (14.0) 4.7 3.4
P/E 5.0 - 4.9 3.3
P/BV 1.6 2.0 1.4 1.0

Phillips Carbon Black Initiating Coverage 09 October 2009
17
Quarterly trend
Particulars Q1FY09 Q2FY09 Q3FY09 Q4FY09 Q1FY10
Revenue (Rs mn) 2,993 3,370 2,874 2,415 2,914
YoY growth (%) 27.4 35.1 4.6 (11.9) (2.6)
QoQ growth (%) 9.2 12.6 (14.7) (16.0) 20.7
EBITDA (Rs mn) 225 234 (513) (778) 253
EBITDA margin (%) 7.5 6.9 (17.8) (32.2) 8.7
Adj net income (Rs mn) 229 154 (460) (571) 204
YoY growth (%) 4 (36) (290) (399) (11)
QoQ growth (%) 20 (33) (399) 24 136
DuPont analysis
(%) FY07 FY08 FY09 FY10E FY11E
Tax burden (Net income/PBT) 52.8 79.2 66.6 75.0 75.0
Interest burden (PBT/EBIT) 61.0 89.4 115.5 80.1 86.5
EBIT margin (EBIT/Revenues) 7.3 12.2 (7.2) 11.4 13.1
Asset turnover (Revenues/Avg TA) 145.7 136.4 125.1 128.4 136.5
Leverage (Avg TA/Avg equtiy) 527.2 370.8 403.4 431.6 337.8
Return on equity 18.1 43.7 (28.1) 38.0 39.3
Company profile
PCBL, headquartered at Kolkata and part of the RPG Group, is
India’s leading producer of carbon black with an installed capacity
of 2,70,000 MTPA across three locations (Durgapur, Cochin,
Baroda). The company, with its 23 grades of carbon black, is the
largest exporter from India and the eighth largest carbon black
company, globally. PCBL company has recently diversified into the
power segment by setting up three captive power units.
Shareholding pattern
(%) Dec-08 March-09 June-09
Promoters 53.7 53.9 53.9
FIIs 5.2 4.6 6.2
Banks & FIs 28.0 25.1 23.8
Public 14.8 16.4 16.1
Recommendation history
Date Event Reco price Tgt price Reco
09-Sep-08 Initiating coverage 172 262 Buy
Stock performance
507090
110130150170190
Jul-09 Aug-09 Sep-09 Oct-09
● Buy

Phillips Carbon Black Initiating Coverage 09 October 2009
18
Coverage Profile
By recommendation By market cap (US$)
58
32
10
0102030405060
Buy Hold Sell
(%)
58
9
33
0102030405060
> $1bn $200mn - $1bn < $200mn
(%)
Recommendation interpretation
Recommendation Expected absolute returns (%) over 12 months
Buy More than 15%
Hold Between 15% and –5%
Sell Less than –5%
Recommendation structure changed with effect from March 1, 2009
Expected absolute returns are based on share price at market close unless otherwise stated. Stock recommendations are based on absolute upside (downside) and have a 12-month horizon. Our target price represents the fair value of the stock based upon the analyst’s discretion. We note that future price fluctuations could lead to a temporary
mismatch between upside/downside for a stock and our recommendation.
Religare Capital Markets Ltd
4th Floor, GYS Infinity, Paranjpe ‘B’ Scheme, Subhash Road, Vile Parle (E), Mumbai 400 057.
Disclaimer
This document is NOT addressed to or intended for distribution to retail clients (as defined by the FSA). This document is issued by Religare Hichens, Harrison & Co Plc (“Hichens”) in the UK, which is authorised and regulated by the Financial Services Authority in connection with its UK distribution. Hichens is a member of the London Stock Exchange.
This material should not be construed as an offer or recommendation to buy or sell or solicitation of any offer to buy any security or other financial instrument, nor shall it, or the fact of its distribution, form the basis of, or be relied upon in connection with, any contract relating to such action or any other matter. The material in this report is based on information that we consider reliable and accurate at, and share prices are given as at close of business on, the date of this report but we do not warrant or represent (expressly or impliedly) that it is accurate, complete, not misleading or as to its fitness for the purpose intended and it should not be relied upon as such. Any opinion expressed (including estimates and forecasts) is given as of the date of this report and may be subject to change without notice.
Hichens, and any of its connected or affiliated companies or their directors or employees, may have a position in any of the securities or may have provided corporate finance advice, other investment services in relation to any of the securities or related investments referred to in this document. Our asset management area, our proprietary trading desks and investing businesses may make investment decisions that are inconsistent with the recommendations or views expressed in this briefing note.
Hichens accepts no liability whatsoever for any direct, indirect or consequential loss or damage of any kind arising out of the use of or reliance upon all or any of this material howsoever arising. Investors should make their own investment decisions based upon their own financial objectives and financial resources and it should be noted that investment involves risk, including the risk of capital loss.
This document is confidential and is supplied to you for information purposes only. It may not (directly or indirectly) be reproduced, further distributed to any person or published, in whole or in part, for any purpose whatsoever. Neither this document, nor any copy of it, may be taken or transmitted into the United States, Canada, Australia, Ireland, South Africa or Japan or into any jurisdiction where it would be unlawful to do so. Any failure to comply with this restriction may constitute a violation of relevant local securities laws. If you have received this document in error please telephone Nicholas Malins-Smith on +44 (0) 20 7382 4479.
“Religare Enterprises Limited proposes, subject to receipt of requisite approvals, market conditions and other considerations, to make a rights issue of its equity shares to its existing shareholders and has filed a draft letter of offer (“DLOF”) with the Securities and Exchange Board of India (“SEBI”). The DLOF is available on the website of SEBI at www.sebi.gov.in as well as on the websites of the lead manager at www.enam.com. Investment in equity shares involves a high degree of risk and for details relating to the same, please refer to the section titled “Risk Factors” of the DLOF.”