philippines national telephone program, phase i, · pdf filephilippines national telephone...
TRANSCRIPT
2
Philippines National Telephone Program, Phase I, Tranche I-1, Regions III, IV & V
Report Date: October 2002
Field Survey: June 2001
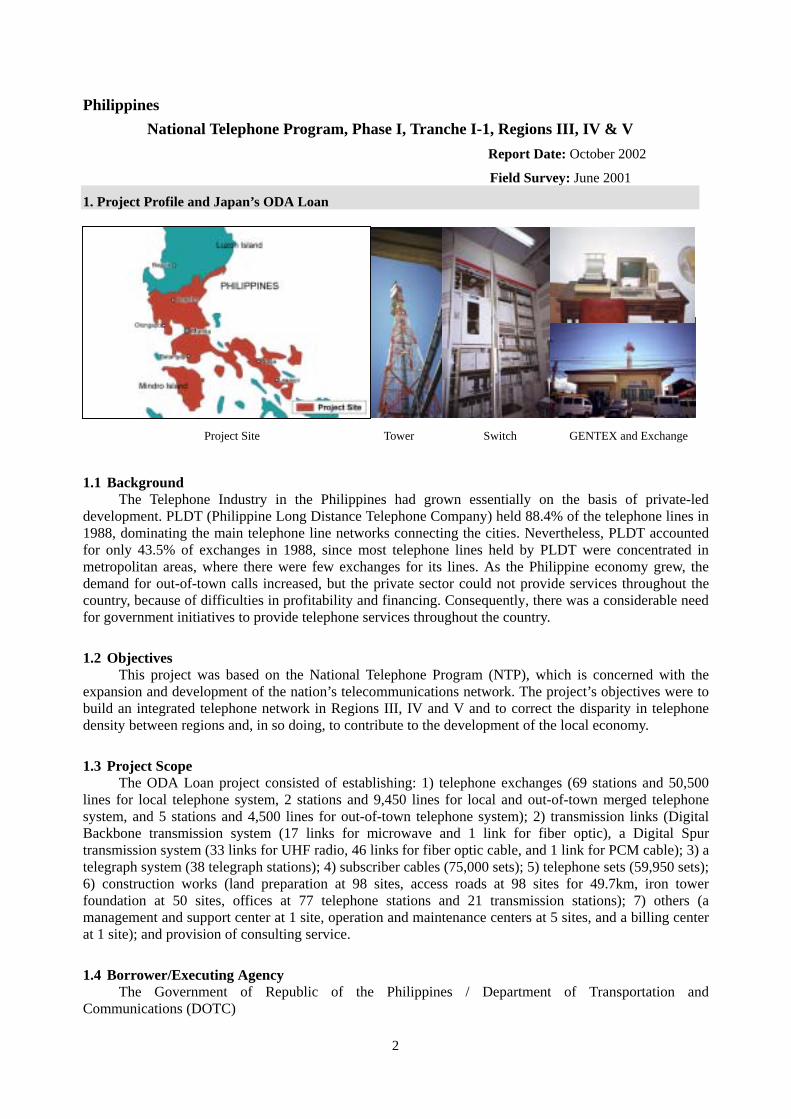
1. Project Profile and Japan’s ODA Loan
Project Site Tower Switch GENTEX and Exchange
1.1 Background The Telephone Industry in the Philippines had grown essentially on the basis of private-led
development. PLDT (Philippine Long Distance Telephone Company) held 88.4% of the telephone lines in 1988, dominating the main telephone line networks connecting the cities. Nevertheless, PLDT accounted for only 43.5% of exchanges in 1988, since most telephone lines held by PLDT were concentrated in metropolitan areas, where there were few exchanges for its lines. As the Philippine economy grew, the demand for out-of-town calls increased, but the private sector could not provide services throughout the country, because of difficulties in profitability and financing. Consequently, there was a considerable need for government initiatives to provide telephone services throughout the country.
1.2 Objectives This project was based on the National Telephone Program (NTP), which is concerned with the
expansion and development of the nation’s telecommunications network. The project’s objectives were to build an integrated telephone network in Regions III, IV and V and to correct the disparity in telephone density between regions and, in so doing, to contribute to the development of the local economy.
1.3 Project Scope The ODA Loan project consisted of establishing: 1) telephone exchanges (69 stations and 50,500
lines for local telephone system, 2 stations and 9,450 lines for local and out-of-town merged telephone system, and 5 stations and 4,500 lines for out-of-town telephone system); 2) transmission links (Digital Backbone transmission system (17 links for microwave and 1 link for fiber optic), a Digital Spur transmission system (33 links for UHF radio, 46 links for fiber optic cable, and 1 link for PCM cable); 3) a telegraph system (38 telegraph stations); 4) subscriber cables (75,000 sets); 5) telephone sets (59,950 sets); 6) construction works (land preparation at 98 sites, access roads at 98 sites for 49.7km, iron tower foundation at 50 sites, offices at 77 telephone stations and 21 transmission stations); 7) others (a management and support center at 1 site, operation and maintenance centers at 5 sites, and a billing center at 1 site); and provision of consulting service.
1.4 Borrower/Executing Agency The Government of Republic of the Philippines / Department of Transportation and
Communications (DOTC)
1.5 Outline of Loan Agreement
Loan Amount Loan Disbursed Amount
21,752 million yen 16,346 million yen
Exchange of Notes Loan Agreement
October 1989
February 1990
Teams and Conditions Interest Rate Repayment Period (Grace Period) Procurement
2.7 %
30 years (10 years) General Untied (Partially untied for Consultant)
Final Disbursement Date March 1997
2. Results and Evaluation 2.1 Relevance
Most telecommunications services in the Philippines were started by private telecommunications companies during the U.S. occupation period. The development of the telecommunications sector was somewhat distorted; not considered a high priority issue in the national development plans, telecommunication services were concentrated in highly profitable areas. Telecommunications companies also installed a variety of different technologies, which made interconnection very difficult and created regional differences in the quality of telecommunication services. The National Telecommunication Master Plan was adopted in 1982 in order to address these conditions, and the National Telephone Program (NTP) was implemented in 1984 on the basis of the Master Plan. The objective of the Master Plan was to establish a high-capacity, standardized trunk transmission network that covered the whole country, and to provide highly reliable telecommunication services. The regional Telecommunications Development Project (RTDP) Phase B project was carried out as part of both the National Telecommunication Master Plan and the National Telephone Program.
The concentration of population and economic activity in metropolitan Manila was a significant factor in the growing per capita income gap between rural and urban areas. As a result, private enterprises tended to avoid rural areas, where telecommunications services were inferior to those found in urban areas. This project intended to narrow the telecommunications gap between urban and rural areas.
At the moment, the equipment installed in this project (excluding telegram equipment) is leased to a private telecommunication company (Digital Telecommunications Phils., Inc. or DIGITEL) by the executing agency DOTC, and the equipment is operated and maintained by the company. DIGITEL is making efforts to expand and upgrade its telecommunication network in order to meet demand for telephone service. As the existing equipment is replaced with new equipment, the older equipment is relocated to rural areas, where it is being efficiently and effectively reused. In that respect, the objectives of narrowing the gap in telecommunications development between urban and rural areas and of contributing to local economic development are being maintained even at the present.
2.2 Efficiency 2.2.1 Project Scope
This project targeted 71 cities and towns in Regions III, IV and V where PLDT was not providing services, and where there were no other telephone services. Telephone demand in the Regions was forecast to reach 74,000 lines, and the installation of 60,000 lines, that is 81% of predicted demand, had been planned in this project.
Even though there were inevitable changes by natural and artificial causes such as damage by Mt. Pinatubo eruption and lahar flow in region III, flood damage by the typhoon in Region IV and V, and by
3
problems in acquiring lots for repeater stations and exchanges since landowners in the project site asked for exorbitant prices, it is considered that these changes were relevant since they complied with the objective of the project.
Modifications to the project scope and reasons for the same are stated below. a) Mt. Pinatubo eruption and continued lahar flow caused the evacuation of residents on the
eastern side of the volcano. As a result, 2,200 lines were redistributed to other areas. b) 6,700 telephone lines affected by the Mt. Pinatubo eruption were distributed to Calapan,
Pinamalayan, Socorro and other un-served and underserved areas because the route towards those places were ideal and economical and demand was high.
c) 5,400 lines affected by modernization of equipment by local operator caused the transfer of several switches to un-served and underserved areas where the demand was high and the route is economical.
d) Transmission system was modified to include the transmission system for the Oriental Mindro area where some of the telephone systems were redistributed.
e) Additional telephone sets were purchased to replace those damaged by flooding in Regions IV and V.
f) Construction works were modified to improve unforeseen problems especially with the lot acquisition for construction of access road and construction site.
g) Consultancy services were revised because of the Mt. Pinatubo eruption and a strong typhoon, which caused damage to Regions IV and V.
2.2.2
2.2.3
2.3.1
Implementation Schedule Initially, the planned implementation schedule was from November 1990 to June 1993 (2 years and
8 months), but this was changed to December 1991 to December 1995 (about 4 years). The actual implementation schedule was delayed substantially, for the following reasons:
a) Mt. Pinatubo erupted in July 1991 and lahar flows during the rainy season of 1991, 1992 and 1993 caused the evacuation of towns buried by lahar.
b) Procurement of lots for Repeater Station and Switch buildings faced problems in prospective areas where the demand would be high due to tourism, as landowners ask for exorbitant prices which the government could not accommodate.
As a consequence, equipment installation was planned for 20 months from November 1990 to June 1992, however it took for 61 months from December 1991 to December 1996. In addition, land acquisition, which was scheduled to take place between January 1990 and December 1990, was substantially delayed. It took 43 months, from July 1991 to January 1995, to acquire the land necessary for the implementation of the project.
As these natural disasters and the rise of land prices were unexpected, the postponement of the implementation schedule was inevitable.
Project Cost The total project cost ran approximately 9,400 million yen under budget. The planned project cost
was 29,003 million yen, and the actual project cost was 19,607 million yen. This can be attributed to: the fluctuation of the peso-dollar exchange rate, which lowered the cost of labor and materials; the effect of Mt. Pinatubo eruption, which reduced subscriber cables; and the adoption of radio transmission instead of fiber optic cables.
2.3 Effectiveness Number of Telephone Lines and Telephone Density The project aims to narrow the gap in telephone density between urban and rural areas by providing
unified telecommunication networks in Regions III, IV and V. The target of this project was to achieve, in 1993, a telephone density of 0.62 lines per 100 persons in the three regions; telephone densities in Regions III, IV and V were 0.85, 0.63 and 0.23 lines per 100 persons, respectively, in 1993. Data on the number of telephone lines and telephone densities in Regions III, IV and V are shown in Table 1. Telephone density in the three Regions had already reached 3.20 lines per 100 persons in 1996. This proves that the objective of this project has been fully achieved, although a significant part of the figure was achieved as a result of
4

extension projects executed by DIGITEL independently. Figures rose drastically from 1995 to 1996 due to the liberalization of the telecommunication
industry (Executive Order 109, executed in 1995), which stimulated the participation of new telecommunication companies in the sector.
However, telephone density then fell from 1998 to 2000. The rapid diffusion of mobile phones after 1998 and continuous population growth may have led to the decrease in telephone density.
Table 1. Number of Telephone Lines and Telephone Density
Year 1988 1993 1994 1995 1996 RegionⅢ n.a. 6,839 7,003 7,167 7,063 RegionⅣ n.a. 9,200 9,449 9,698 10,184 RegionⅤ n.a. 4,292 4,391 4,490 4,399 Total of III, IV & V n.a. 20,331 20,843 21,355 21,646
Population (Unit: 1000 persons)
Nationwide n.a. 66,982 68,624 70,267 69,946 RegionⅢ n.a. 57,936 69,784 129,945 233,899 RegionⅣ n.a. 57,483 72,550 182,966 380,044 RegionⅤ n.a. 9,850 11,350 42,700 78,850 Total of III, IV & V n.a. 125,269 153,684 355,611 692,793
Number of Telephone Line
(Unit: Lines)
Nationwide n.a. 941,632 1,186,002 1,877,072 3,352,842 RegionⅢ 0.42 0.85 1.00 1.81 3.31 RegionⅣ 0.41 0.63 0.77 1.89 3.73 RegionⅤ 0.15 0.23 0.26 0.95 1.79 In III, IV & V 0.35 0.62 0.74 1.67 3.20
Telephone Density (Unit: Lines/100persons)
Nationwide n.a. 1.41 1.73 2.67 4.79
Year 1997 1998 1999 2000 RegionⅢ 7,219 7,375 7,531 7,687 RegionⅣ 10,463 10,742 11,021 11,301 RegionⅤ 4,488 4,577 4,666 4,756 Total of III, IV & V
22,170 22,694 23,218 23,744
Population (Unit: 1000 persons)
Nationwide 71,541 73,130 74,723 76,320 RegionⅢ 427,199 513,626 513,626 513,626 RegionⅣ 734,047 1,017,155 1,017,155 1,086,030 RegionⅤ 133,363 122,589 136,465 136,465 Total of III, IV & V
1,294,609 1,653,370 1,667,246 1,736,121
Number of Telephone Line
(Unit: Lines)
Nationwide 5,775,556 6,641,480 6,811,616 6,905,962 RegionⅢ 5.92 6.96 6.82 6.68 RegionⅣ 7.02 9.47 9.23 9.61 RegionⅤ 2.97 2.68 2.92 2.87 In III, IV & V 5.84 7.29 7.18 7.31
Telephone Density (Unit: Lines/100persons)
Nationwide 8.07 9.08 9.12 9.05 Source: National Telecommunications Commission (NTC)
National Statistical Coordination Board (NSCB)
2.3.2 Internal Rate of Return At the time of appraisal, the Financial Internal Rate of Return (FIRR) was predicted to be 16.8 %.
However, it is impossible to calculate the actual FIRR since the executing agency did not provide the necessary data. Available figures cannot be used since they include data from the expansion and upgrading of other facilities implemented after this project.
5
Assumptions used for the calculation of FIRR (1) Income by Telephone Charges
a) Income by Local Call b) Income by Long Distance Call c) Income by International Call
(2) Income by Telegraph (GENTEX) (3) Income by Miscellaneous (4) Income by Provision for Doubtful Accounts (5) Investment Expenditure (6) O&M Expenditure
a) Maintenance b) Insurance c) Office Salaries d) Commercial e) Other Operating Expenses f) Traffic g) Operating Rent h) Operating Taxes
(7) Project Life: 20 years
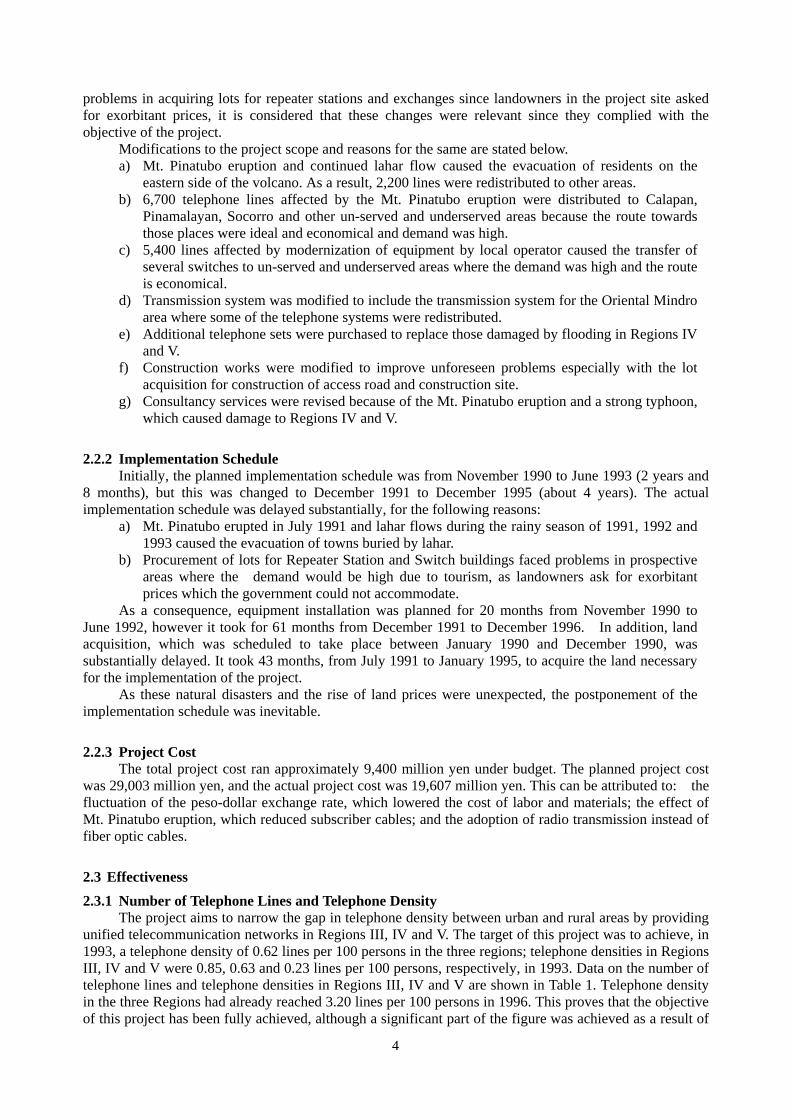
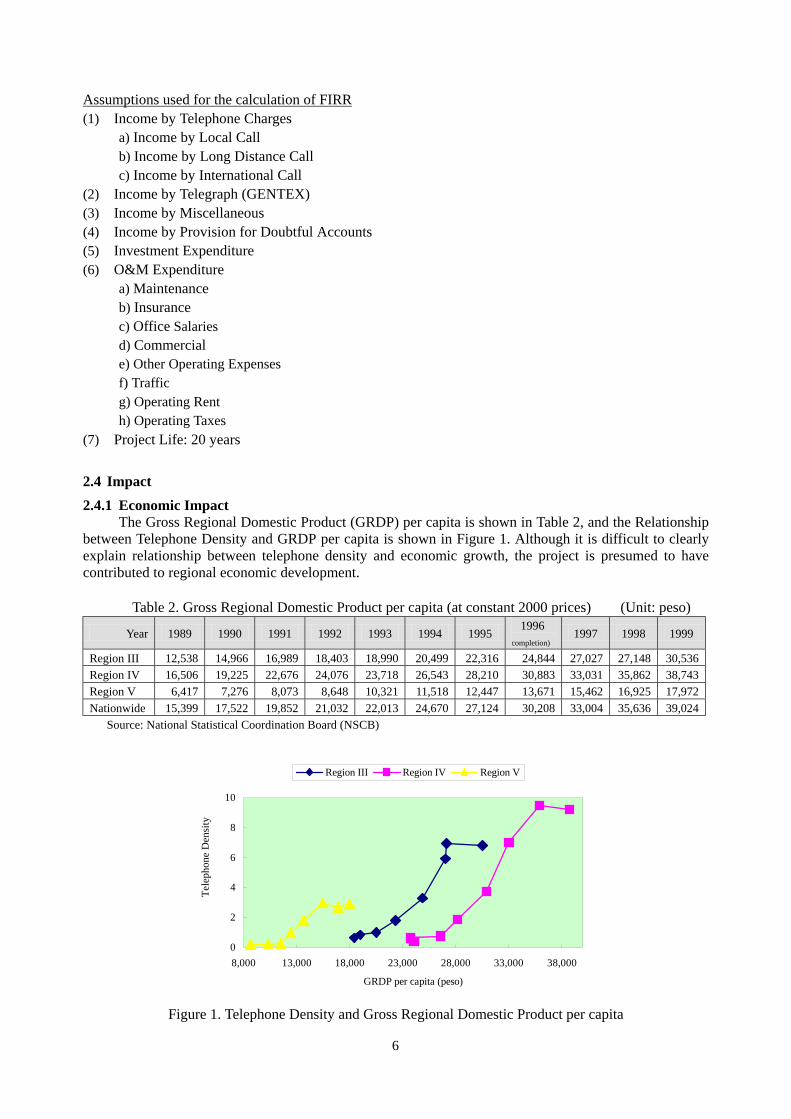
2.4 Impact 2.4.1 Economic Impact
The Gross Regional Domestic Product (GRDP) per capita is shown in Table 2, and the Relationship between Telephone Density and GRDP per capita is shown in Figure 1. Although it is difficult to clearly explain relationship between telephone density and economic growth, the project is presumed to have contributed to regional economic development.
Table 2. Gross Regional Domestic Product per capita (at constant 2000 prices) (Unit: peso)
Year 1989 1990 1991 1992 1993 1994 1995 1996
(completion) 1997 1998 1999
Region III 12,538 14,966 16,989 18,403 18,990 20,499 22,316 24,844 27,027 27,148 30,536 Region IV 16,506 19,225 22,676 24,076 23,718 26,543 28,210 30,883 33,031 35,862 38,743 Region V 6,417 7,276 8,073 8,648 10,321 11,518 12,447 13,671 15,462 16,925 17,972 Nationwide 15,399 17,522 19,852 21,032 22,013 24,670 27,124 30,208 33,004 35,636 39,024
Source: National Statistical Coordination Board (NSCB)
0
2
4
6
8
10
8,000 13,000 18,000 23,000 28,000 33,000 38,000
GRDP per capita (peso)
Tele
phon
e D
ensi
ty
Region III Region IV Region V
Figure 1. Telephone Density and Gross Regional Domestic Product per capita
6

2.4.2
2.4.3
Impacts on Natural Environment According to Telecommunications Office (TELOF) under the DOTC, no negative impacts on the
natural environment have been reported as a result of the implementation of the project. Also, although it took time to acquire land for the project due to the exorbitant prices landowners
asked, the problem was eventually solved in the courts. No relocation of local residents was required for the project.
Impact on Society In an interview survey carried out to 112 residents in the project areas (Region III & IV), 67% of
respondents said they (74persons) installed a telephone at their home after the completion of this project (after 1997), and 99% (111 persons) reported positive effects, such as “improvement in family communication”, and “increase in income and/or savings” (Figure 2).
7

2.5.1
18%
3%
13%
13%
18%
27%
86%
1%
0% 20% 40% 60% 80% 100%
Others
Increased enrollment ratio
Improvement in health and nutrition
Increased job creation
Improved working/studying conditions
Improved village security
Increased income and/or savings
Improved family communication
Figure 2. Impact from Installation of Telephones (Several Answers)
Figure 3. Grade of Satisfaction at Services of
DIGITEL
Yes, satisfied28%
Yes, completelysatisfied
39%
Not satisfied atall6%
Yes, but lowlevel of
satisfaction27%
2.5 Sustainability The facilities installed in this project have been leased to DIGITEL, a private company. The
participation of a private company in the supply of telephone services has helped to improve the quality of services. The sustainability of DIGITEL is considered satisfactory in terms of organizational structure and technological level.
Operation and Maintenance In line with the government thrust towards privatization, DOTC decided to proceed with the
privatization of all government-owned facilities in August 1991 by leasing the RTDP1. Phase A and B and NTP I-1 facilities. On April 19, 1993, DIGITEL and DOTC entered into a Facilities Management
1 Regional Telecommunications Development Project in Regions I and II 8

Agreement (FMA) covering the telecommunications facilities owned by the DOTC Under the FMA, DIGITEL has the exclusive right to operate, maintain and develop the abovementioned facilities, for which it shall pay DOTC an annual lease payment over a period 30 years.
DIGITEL is the second largest provider of wire lines in the Philippines in terms of working lines. Through 555 regional and local exchanges, DIGITEL telephones are available in 268 towns and cities throughout Luzon. As of the end of 2000, DIGITEL had a total of 611,000 lines system-wide. The number of installed and subscribed lines that DIGITEL managed in Regions Ⅲ, Ⅳ and Ⅴ is shown in Table 3.
Table 3. DIGITEL-owned Number of Installed Lines and Subscribed Lines (Unit: lines)
Number of Telephone Line Subscribed Lines Region III (Total) 1)
193,431 (493,831)
87,893 (196,197)
Region IV (Total) 1)
216,673 (1,009,057)
74,301 (409,072)
Region V (Total) 1)
47,646 (136,465)
21,021 (54,707)
Source: National Telecommunications Commission (NTC) Note: 1) “(Total)” include lines owned by other telecommunication firms DIGITEL registered a manpower growth rate of 2% in year 2000, from its 1999 manpower
level of 2,423 to the year-end 2000 count of 2,479. The company also achieved a 30 % increase in the ratio of working lines per employee in 2000, from 111 lines per employee in 1999 to 147 lines in year 2000. More efficient personnel distribution has been carried out with the expansion of telephone system. According to DIGITEL, the company has sufficient manpower for O&M of the network.
2.5.2
2.5.3
2.5.4
Technical Capacity The Human Resources Division of DIGITEL conducts in-house training courses, including
seminars, workshops and technical training. Sixty five (65) in-house training programs were conducted in 2000, bringing the total to one hundred sixty(160) runs, or an average of thirteen(13) runs every month. In addition, employees are trained on-site by technical consultants and sent to seminars and training abroad. DIGITEL maintains the sustainability of technical capacity and staff skilled.
Condition of Equipment The Balagtas, Macabebe, Ibaan, Rosario, San Juan, Cuenca, Lemery, Balayan and Nasugbu
exchanges in Region Ⅲ, Ⅳ and Ⅴ, which were inspected for this evaluation, have switching systems, transmitting systems, and power systems installed by this project. At present, new high-performance and high-capacity equipment has been installed with funds from DIGITEL’s own budget, as the equipment installed by this project has already gone out of date. The old equipment occupies only a small portion of the telephone system. However, most of the old equipment has been relocated to exchanges in Region II where there is more telephone demand. Thus the equipment continues to be used effectively. The condition of the equipment is generally good, although some equipment is out of order and not working.
For the telegraph system (GENTEX), the O&M agency is TELOF. However, this service is hardly being provided any more because innovations in telecommunications have made the equipment obsolete. At present, only some telegraph stations are providing service.
Financial Status Financial ratios, calculated historically from consolidated financial statements of DIGITEL,
are shown in Table 4.
9

Table 4. Financial Ratios of DIGITEL 1995 1996 1997 1998 1999 2000 2001
Return on Equity (ROE) n.a. 9.04% 7.80% 5.49% 0.04% 0.04% 0.59%
Return on Assets (ROA) n.a. 6.96% 4.66% 3.09% 0.02% 0.01% 0.19%
Return (Net Income) on Total Assets n.a. 4.88% 3.72% 2.15% 0.01% 0.09% 0.26%
Return (Current Income) on Stockholders’ Equity n.a. 12.91% 9.78% 7.90% 0.05% 0.27% 0.80%
Profit (Current Income) on Net Sales 64.82% 83.05% 55.27% 28.33% 0.17% 0.64% 1.45%
Turnover Rate of Total Assets n.a. 0.08 0.08 0.11 0.12 0.14 0.18
Turnover Rate of Stockholders’ Equity n.a. 0.16 0.18 0.28 0.33 0.43 0.55
Ratio of Net Worth 53.06% 54.45% 42.76% 36.29% 35.41% 32.85% 32.77%
Ratio of Fixed Assets 102.67% 103.53% 150.69% 191.65% 216.47% 243.88% 241.51%
Ratio of Fixed Assets to Long-Term Capital 60.37% 60.74% 71.77% 82.08% 87.72% 94.78% 102.24%
Current Ratio 416.84% 592.25% 351.16% 205.63% 193.53% 130.89% 90.14%
Cumulative Lines Installed (Unit: Lines) 81,626 204,184 374,638 484,036 603,624 611,000 n.a.
Cumulative Lines in Service (Unit: Lines) 50,694 80,586 150,688 201,459 269,600 365,476 n.a. Source: DIGITEL i) Analysis of Profitability
The profitability of DIGITEL is as analyzed by the looked at the figures for Return on Equity (ROE), Return on Assets (ROA), Return (Net Income) on Total Assets, and Return (Current Income) on Stockholders’ Equity and Profit (Current Income) on Net Sales. These indicators all declined between 1996 and 1999, and since then have been slowly increasing. Although the Turnover Rate of Total Assets and the Turnover Rate of Stockholders’ Equity are low, and the efficiency of asset management has not been good, these indicators are slowly improving, indicating that the situation is changing for the better.
The fall in DIGITEL’s profitability has been caused by increases in investment in facilities and equipment, rent of buildings and facilities, and human development costs. DIGITEL’s acquisition of an IT company in 1999 also severely affected profits.
ii) Analysis of Financial Soundness The Financial Soundness of DIGITEL can be measured by the Ratio of Net Worth, Ratio of
Fixed Assets, Ratio of Fixed Assets to Long-Term Capital and Current Ratio. The Ratio of Net Worth has fallen below 50%, and liability exceeds Stockholders’ Equity. The Ratio of Fixed Assets and the Ratio of Fixed Assets to Long-Term Capital are on the increase, and the long-term liability makes up a large proportion of this total. The amount of fixed assets in 2000 is barely below the amount of Long-Term Capital (Stockholders’ Equity and Long-Term Liability). Although the Current Ratio is relatively low, no particular problems noted for financial soundness.
10
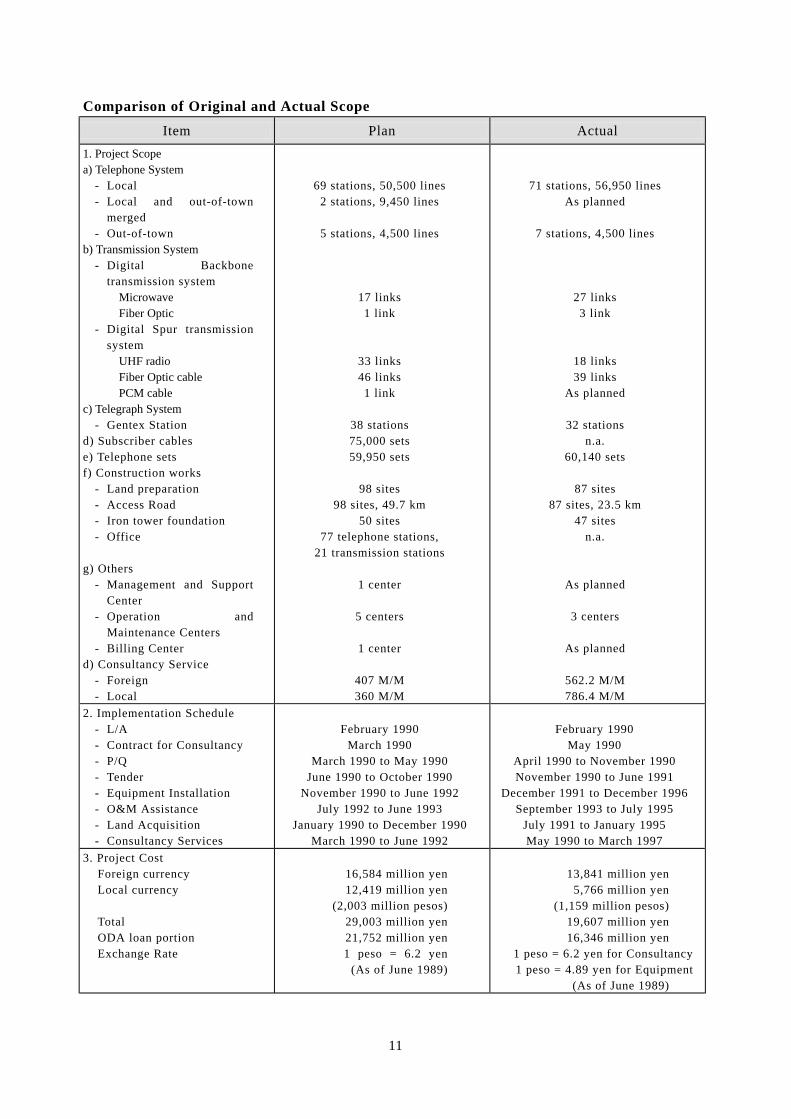
Comparison of Original and Actual Scope
Item Plan Actual 1. Project Scope a) Telephone System
- Local - Local and out-of-town
merged - Out-of-town
b) Transmission System - Digital Backbone
transmission system Microwave Fiber Optic
- Digital Spur transmission system
UHF radio Fiber Optic cable PCM cable
c) Telegraph System - Gentex Station
d) Subscriber cables e) Telephone sets f) Construction works
- Land preparation - Access Road - Iron tower foundation - Office
g) Others - Management and Support
Center - Operation and
Maintenance Centers - Billing Center
d) Consultancy Service - Foreign - Local
69 stations, 50,500 lines 2 stations, 9,450 lines
5 stations, 4,500 lines
17 links 1 link
33 links 46 links 1 link
38 stations 75,000 sets 59,950 sets
98 sites
98 sites, 49.7 km 50 sites
77 telephone stations, 21 transmission stations
1 center
5 centers
1 center
407 M/M 360 M/M
71 stations, 56,950 lines As planned
7 stations, 4,500 lines
27 links 3 link
18 links 39 links
As planned
32 stations n.a.
60,140 sets
87 sites 87 sites, 23.5 km
47 sites n.a.
As planned
3 centers
As planned
562.2 M/M 786.4 M/M
2. Implementation Schedule - L/A - Contract for Consultancy - P/Q - Tender - Equipment Installation - O&M Assistance - Land Acquisition - Consultancy Services
February 1990
March 1990 March 1990 to May 1990
June 1990 to October 1990 November 1990 to June 1992
July 1992 to June 1993 January 1990 to December 1990
March 1990 to June 1992
February 1990
May 1990 April 1990 to November 1990 November 1990 to June 1991
December 1991 to December 1996 September 1993 to July 1995
July 1991 to January 1995 May 1990 to March 1997
3. Project Cost Foreign currency Local currency Total ODA loan portion Exchange Rate
16,584 million yen 12,419 million yen
(2,003 million pesos) 29,003 million yen 21,752 million yen 1 peso = 6.2 yen
(As of June 1989)
13,841 million yen
5,766 million yen (1,159 million pesos)
19,607 million yen 16,346 million yen
1 peso = 6.2 yen for Consultancy 1 peso = 4.89 yen for Equipment
(As of June 1989)
11

Independent Evaluator’s Opinion on
National Telephone Program, Phase I, Tranche I-1, Regions III, IV, and V
Ponciano S. Intal Jr. Professor of Economics, Executive Director of Economic and Business Studies,
De La Salle University
Before the major reform efforts in telecommunications in the 1990s, the country had one of the lowest telephone densities in East Asia, the regional distribution of telephone facilities heavily skewed in favor of Metro Manila, and the waiting time to get a telephone installed was the longest in the ASEAN. In addition, the quality of telephone service was bad. In response, the government undertook major policy reforms that encouraged private investments, both domestic and foreign, into the sector. The government also provided catalytic interventions for the development of the sector especially in underdeveloped regions through the use of official development assistance. The project is an example of such catalytic government interventions.
Recent studies indicate that rural telecommunication can be an important government measure in reducing rural poverty. Likewise, the remarkable growth of information technology as a driver of growth and competitiveness in the world has brought into sharper focus the importance of improving the Filipinos’ access to telecommunication facilities, especially those living outside of Metro Manila. The discussion above shows that the project has been, and is still, relevant to the Philippine development strategy and policy.
The project met the target density as early as 1993 and by 2000, the actual telephone density more than 10 times higher than the target densities. Much of the increase in the telephone densities was contributed by the private sector through the service area scheme. Nonetheless, the NTP and the RTDP also contributed through their catalytic roles, especially in the less industrialized parts of the country.
An important insight implied by the two Project Evaluation Reports is that in the face of the fast technological developments in the sector, the government’s decision to lease the NTP and RTDP facilities to a private corporation (DIGITEL), as a matter of policy, proved to be a boon to the project. This is because DIGITEL invested in upgrading the facilities probably to improve the quality of service and to meet the market competition. The equipment purchased under the two projects have become largely obsolete and were transferred to Region II.
It is worth noting that the subscribed lines are much lower than the total installed lines. The large “surplus lines” is not quite surprising given the acceleration in the implementation of the service area scheme as mandated by the government and given the weak income growth (and therefore weak demand growth for telecommunication services) in recent years. This large surplus of local exchange lines has had significant adverse effect on the financial performances of virtually all of the telecommunication operators, including DIGITEL, considering that financing their telecommunication rollout programs necessitated large external borrowing. And as the project evaluation reports note, the case of DIGITEL was aggravated by the acquisition of an IT company in 1999, which severely affected company profits.
The evaluation report seems to indicate very positive socioeconomic impact of the project, given that 99 % of the respondents said so. They seem to be bullish with respect to the income/saving effect of the project. (Unfortunately, the magnitude of responses cannot be ascertained. Note: Figure 1 on page 6 of the draft NTP evaluation report is wrong. The figure shows satisfaction of services of DIGITEL similar to Figure 2. Please correct.) It is useful to examine the responses further. Did the installation of telephone services generate new investments or production expansions that led to increased jobs, income and saving? Or was it the other way around; i.e., a general improvement of the economy (1994-1997) led to demand for and capability to purchase telecommunication services? If in fact the responses are correct (and the questionnaire well specified), the survey results provide strong support for the beneficial effects of
12

telecommunication investments in the country. Still, it would be useful to elaborate on the survey results, possibly including anecdotal descriptions of such success stories to make the survey findings more vivid and believable.
13