philippines fishing ports development project (ii) · philippines fishing ports development project...
TRANSCRIPT
1
Philippines Fishing Ports Development Project (II)
Report Date: February 2003 Field Survey: October - December 2002
1. Project Profile and Japan’s ODA Loan
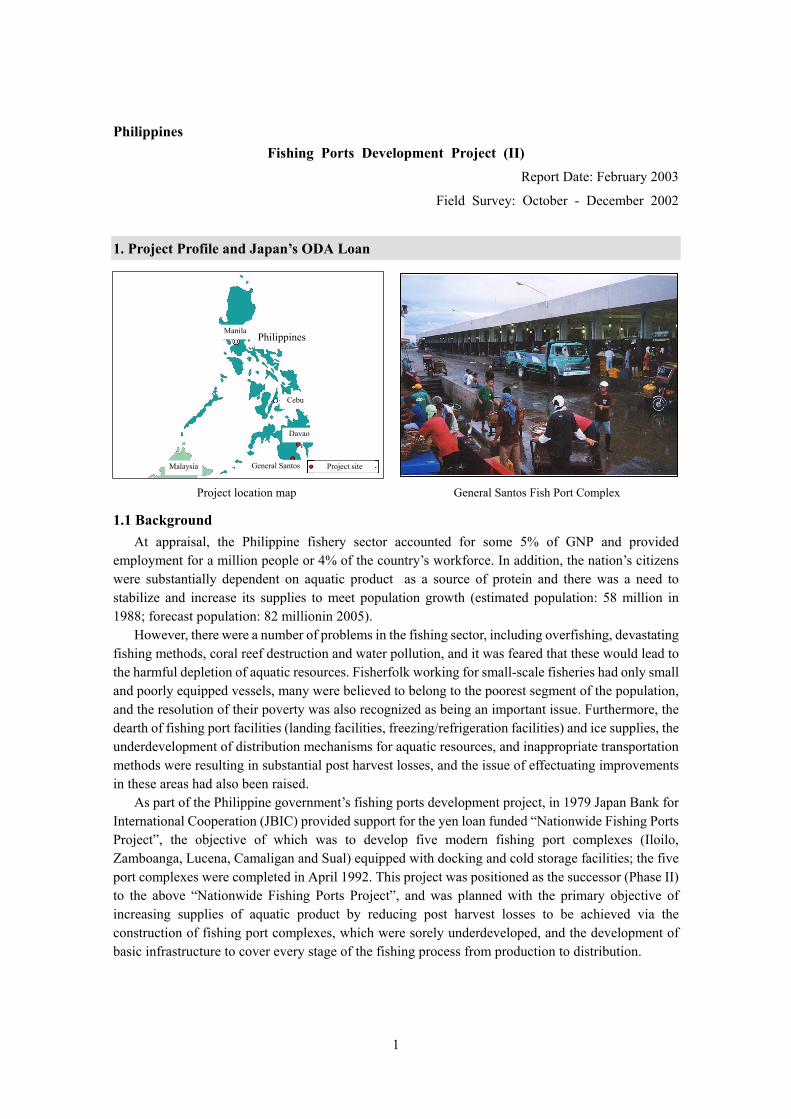
Project location map General Santos Fish Port Complex
1.1 Background At appraisal, the Philippine fishery sector accounted for some 5% of GNP and provided
employment for a million people or 4% of the country’s workforce. In addition, the nation’s citizens were substantially dependent on aquatic product as a source of protein and there was a need to stabilize and increase its supplies to meet population growth (estimated population: 58 million in 1988; forecast population: 82 millionin 2005).
However, there were a number of problems in the fishing sector, including overfishing, devastating fishing methods, coral reef destruction and water pollution, and it was feared that these would lead to the harmful depletion of aquatic resources. Fisherfolk working for small-scale fisheries had only small and poorly equipped vessels, many were believed to belong to the poorest segment of the population, and the resolution of their poverty was also recognized as being an important issue. Furthermore, the dearth of fishing port facilities (landing facilities, freezing/refrigeration facilities) and ice supplies, the underdevelopment of distribution mechanisms for aquatic resources, and inappropriate transportation methods were resulting in substantial post harvest losses, and the issue of effectuating improvements in these areas had also been raised.
As part of the Philippine government’s fishing ports development project, in 1979 Japan Bank for International Cooperation (JBIC) provided support for the yen loan funded “Nationwide Fishing Ports Project”, the objective of which was to develop five modern fishing port complexes (Iloilo, Zamboanga, Lucena, Camaligan and Sual) equipped with docking and cold storage facilities; the five port complexes were completed in April 1992. This project was positioned as the successor (Phase II) to the above “Nationwide Fishing Ports Project”, and was planned with the primary objective of increasing supplies of aquatic product by reducing post harvest losses to be achieved via the construction of fishing port complexes, which were sorely underdeveloped, and the development of basic infrastructure to cover every stage of the fishing process from production to distribution.
Philippines
Davao
Cebu
Manila
Malaysia Project site General Santos

2
1.2 Objectives The aim of this project was to promote the development of basic infrastructure and to reduce post
harvest losses via the construction of modern fishing port complexes in Cebu, Davao and General Santos, so as to increase supplies of aquatic product.
1.3 Project Scope The scope of this project encompassed the development of basic facilities (port facilities such as
berths, breakwater, etc.) and functional facilities (market halls, ice-making facilities, freezers, refrigerators, administrative buildings, etc.) at Cebu, Davao and General Santos, and the consulting services necessary for the construction and project management of the above facilities.
Japan’s ODA loan covered 75% of total project costs (the entire foreign currency portion and part of the local currency portion), and was specifically allocated to the procurement of necessary equipment and services for the civil engineering and construction work, and to financing the consulting services needed for the project.
1.4 Borrower/Executing Agency Government of the Philippine Republic/Department of Transportation and Communications
(DOTC)
1.5 Outline of Loan Agreement
Loan Amount Loan Disbursed Amount
7,655 million yen 4,660 million yen
Exchange of Notes Loan Agreement
March 1991 March 1992
Terms and Conditions -Interest Rate -Repayment Period (Grace Period) -Procurement
2.7% 30 years
(10 years) General untied
Final Disbursement Date June 2000
2. Results and Evaluation
2.1 Relevance Under the mid-term development plan (1987-1992) that was current at appraisal, improvements to
the living standards of the citizens, the eradication of poverty, the creation of employment opportunities and the realization of equality and social justice were set forth as key policy objectives. The fishing sector was positioned as a subsidiary to the agricultural sector, with express importance assigned to infrastructure improvements, and to the construction and expansion of fishing ports and related facilities in the regions in particular.
The current mid-term development plan (2001-2004) has defined four primary development goals, namely, (1) stabilizing the macro economy through private sector led economic growth, (2) the modernization of the agricultural and fisheries industries in consideration of social equality, (3) the development of human resources and the protection of the socially vulnerable, and (4) good governance and the rule of law, with the fishing sector positioned as a priority area.
The government of the Philippines (GOP) established the Agriculture and Fisheries Modernization Act (AFMA) in 1997 and the Fisheries Code in 1998, and it is focusing its efforts on the modernization

3
of the agriculture and fisheries sectors and on regional development. The AFMA provides the delineation of Strategic Agriculture and Fisheries Development Zones (SAFDZ), i.e. regions that are competitive and have comparative advantages, and is concentrating public investment on these regions whilst ensuring coordination with the relevant regional development plans. Both Davao and General Santos have been named SAFDZ. The government has also established production and marketing support programs for strategic agriculture and fisheries commodities, which are serving to promote improvements to fishing port infrastructure and processing facilities for fishery and other aquatic product in the fishing sector.
In addition, Davao City, home to the Davao Fish Port Complex (DFPC), has put a number of investment incentives in place, starting with tax breaks, and is actively working to attract companies into its fish processing industry, with the aim of promoting this port development-driven industry. As part of this bid the city has laid plans to develop a fish processing-centered industrial estate (“Food Terminal”) on a 25 hectare lot owned by the city, which is located near the DFPC.
As the above demonstrates, the objectives of this project are priority issues within the former (appraisal) and current mid-term development plans and the fish sector policies and are considered to have been both relevant at appraisal and to have retained their relevancy to the present day. However, although fish catches have increased, changes in the plans for DFPC, which is now utilized as a transshipment port for foreign deep-sea fishing vessels, have resulted in a diminishing of the beneficial effects on local fisherfolk.
2.2 Efficiency
2.2.1 Project Scope The biggest change in the project scope was the cancellation of the Cebu Fishing Port construction
component. This revision was made because the executing agency (DOTC) was experiencing difficulties with the allocation of local currency portion, and the Pasil Fishing Port Complex built by the Cebu municipal government using grant assistance from the Belgian government had only recently been completed in 1993. Moreover, the yen loan funded “Metro Cebu Development Project (III)” was being implemented concurrently, which effectively diminished the necessity of and priority for the development of the Cebu Fishing Port Complex.
Other changes included the addition of dredging work at the DFPC, which was necessary to increase the water depth of the berth from 2.5 to 3.5 meters to enable larger vessels to enter the port. The construction of a sewage treatment plant was also newly added into the scope. Other basic and functional facilities were essentially constructed as per the plans. With regard to the General Santos Fishing Port Complex (GSFPC), a review of the design resulted in the addition of major design revisions, primarily of the basic facilities. The lot area, quays, sea wall and fish market were all expanded and the number of guide lights was increased from two to five. Again, the construction of a sewage treatment plant was newly added into the scope.
The design for the docking section of the fourth berth at GSFPC comprised the creation of a sandy beach area with several staircases built at intervals for unloading; this component was completed as per the initial plans. However, since the sand was washed away after completion, the executing agency (DOTC) is funding rehabilitation work involving the fortification of the docking area with concrete (scheduled for completion in December 2002). This work was not included in the scope of this project.
2.2.2 Implementation Schedule The implementation schedule was originally planned to span 52 months from March 1992 (loan
agreement (L/A)) through June 1996 (completion of work), but the project actually took 105 months (March 1992-December 2000) and was completed four years and five months (53 months) behind the
4
schedule. The timeframe for the loan disbursement was extended as a result. The primary reason for the delay was the partial changes made at the strong request of the Philippine Fisheries Development Authority (PFDA), the organization scheduled to take on the operation and maintenance of the complex after completion, and the fishing associations, to the design of GSFPC1, which rendered it necessary to extend the implementation schedule. The delay is also attributed to the difficulties in commencing part of the additional work undertaken at GSFPC within the timeframe of the L/A.
2.2.3 Project Cost Total project costs were planned at JPY 10,207 million (ODA loan portion: JPY 7,655 million),
but actually amounted to JPY 5,797 million (ODA loan portion: JPY 4,660 million). The massive reduction in total project costs over the initial plans was the result of the cancellation of the Cebu Fishing Port Complex component.
2.3 Effectiveness
2.3.1 Post Harvest Distribution and Processing Routes (1) Davao Fish Port Complex (DFPC)
Via this project, one berth (total length 235m), a 350-meter breakwater, a 480-meter sea wall, one market hall (total area 1,700m3), an ice-making facility (production capacity: 30 tons/day), freezers (270kg/day × 2), cold storage (80 ton capacity), a sewage treatment plant (300 tons/day), and administrative buildings were developed at the DFPC.
The development of the fish port complexes at Davao and General Santos was intended to target small- and medium-scale local fisheries like municipal and commercial fisheries2, etc. However, being favorably situated in the proximity of tuna fishing grounds and offering good distribution access to Manila with three roundtrip flights between Davao and Manila per day, the Davao port attracted the notice of foreign commercial fishing corporations, which lobbied the GOP for permission to use the port as a calling point for deep-sea fishing vessels to allow them to make transshipment of their tuna hauls. The GOP sanctioned the request, resulting in the provision of the country’s only transshipment port.
This led to the berths at DFPC and contiguous fish markets being divided into two separate zones: a domestic zone for local municipal and commercial fishing vessels and a bond zone exclusively for the transshipment of catches landed by foreign deep-sea fishing vessels (the berths and fish markets were originally part of the same facility but the bond zone and the domestic zone were fenced off), with the berths and market halls being operated as separate functional entities. Roughly 90% of the berths and market facilities were used to offload catches for transshipment and for processing, with the remaining 10% set aside for local fisherfolk to land their catches and conduct business transactions. Foreign vessels were only permitted to anchor at designated berths within the bond zone3, however, other functional facilities, such as ice-making facilities, refrigerators and freezers, provided services to all vessels and users.
1 In October 1996, General Santos City announced a policy prohibiting municipal and sustenance fishermen from using sandy
beaches to land their catches for reasons of sanitation and tourism. It thus became essential to enhance the handling capacity of the breakwater for municipal/sustenance fishermen at the GSFPC, and the initial plans were partially revised having given due consideration to the views of the local community as gleaned from a public hearing.
2 The Philippine fishing sector is structured according to the following classifications. (1) Municipal fisheries: Fisheries utilizing vessels of 3.0 gross tons (GT) or less, or fishing not requiring the use of fishing vessels. The operational area is contained within a 7-km radius of the shoreline and includes fishing on inland bodies of water, i.e. lakes, etc. The fishing is specialized and conducted on a small-scale. (2) Commercial and offshore fisheries: Fisheries utilizing vessels with of 3.1 GT or more and operating more than 7 kilometers off the shoreline. (3) Aquaculture: fishery operations involving all forms of raising and culturing fish and other fishery species in fresh, brackish and marine water areas.
3 The bond zone is classified as being inside Philippine territory, but aquatic product landed by foreign vessels for transshipment to foreign destinations is not subject to duty tariffs.

5
Figure 2-1 shows the breakdown of catches at DFPC. There has been particularly marked growth in transshipments by foreign vessels since 1998, with around 90% of all catches coming off foreign vessels. All foreign vessels are used for deep-sea tuna fishing, and tuna that is landed at DFPC is taken immediately to the market halls where it is separated according to weight and grade (A to D). Only A-grade tuna is used for sashimi and this is flown out the same day. Tuna assigned a B or lower grade is exported after processing at a processing plant within the complex. In principle, tuna that is landed for transshipment is exported and since this represents economic activities within the bond zone the exports are not handled as being Philippine-based. The catches landed by local fisherfolk, on the other hand, account for no more than 10% of the total. Most are landed by commercial fisherfolk and although many of the municipal fisherfolk use the berths to unload their catches they do not pass through the market halls within the complex but go directly to retailers in the public markets within Davao city or are sold directly to consumers. This is mainly because the hauls of municipal fisherfolk only amount to a few kilograms per day, and in most cases they will get a better price for the fish at the public markets than at the fish markets within DFPC. These fisherfolk do business in the DFPC market halls for larger catches (amounting to several dozen kilos). A summary of the above flow is shown in Figure 2-2 below.
Figure 2-1: Breakdown of Catches at DFPC
Source: PFDA data. Note: It was not possible to obtain data on local catches landed at DFPC for 2002, thus the figures are unknown.
0
500
1,000
1,500
2,000
2,500
3,000
3,500
4,000
1995 1996 1997 1998 1999 2000 2001 2002
年
トン
転載(輸出用) 転載(加工用) ローカルTransshipment (for processing) Local Year
Tons
Transshipment (for export)

6
Figure 2-2: Post Harvest Distribution Routes at DFPC
Prior to the implementation of this project, commercial fishing vessels landed their catches at
Daliao and Talomo to the south of Davao, and municipal fisherfolk predominantly used Salmonan in the heart of the city, as well as Daliao and Talomo. However, there were no unloading facilities at any of these locations and the work was carried out on the beaches or the banks of the estuary, which was both inefficient and unsanitary. In addition, Bankerohan, a wholesale market in the city, was confined and its activities inefficient. The majority of the fish product landed in Davao was consumed within the city.
外国船 (遠洋漁業船)
商業漁船
刺身用マグロ A 級
マグロ B 級以下 水産加工会社
輸出 (主に日本)
輸出 (日本、アメリカ等)
水揚げ高 全体の約 90%
水揚げ高 全体の約 10%
魚市場 仲買人
国内(主にダバオ)
国内(ダバオ公設市場)
<保税区域>
<国内区域>
零細漁船
[Bond zone]
[Domestic zone]
B-D grade tuna
Foreign vessels (deep-sea fishing
vessels) Fish processing
company
Export (mainly Japan)
Export (Japan, USA, etc.)
Approx. 10% of total catches
Commercial fishing vessels
Sustenance fishing vessels
Fish market
Traders Domestic sale
(mainly Davao)
Domestic sale (Davao public market)
Approx. 90% of total catches A-grade tuna for
sashimi

7
For reference, the vessels shown below are representative of the craft in use at the Davao and General Santos Fishing Port Complexes.
Fishing Vessels in Use at DFPC and GSFPC (examples)
Foreign deep-sea tuna “Banka” vessels Purse-seine fishing vessels fishing vessels (transshipment) (Municipal fishing) (Commercial fishing)
(2) General Santos Fish Port Complex (GSFPC)
GSFPC was officially completed in December 2000, however, the facilities in fact had become operational in January 1999. This project provided funding for the construction of three berths and four market halls. The breakwater for the fourth berth (Berth #4) is currently under construction4 and is scheduled for completion in the immediate future. Accordingly, the basic facilities that are currently operational comprise three berths and three market halls, plus functional facilities such as ice plants and refrigerators. Unlike DFPC, the majority of GSFPC users are small and medium-scale fisherfolk (people engaged in the municipal/commercial fishing industry), berth usage, i.e. the type of vessels that can use a certain berth, is determined by water depth, and the complex’s berths and market halls exist as three separate functional entities. The flow of post harvest activities at GSFPC is as shown in Figure 2-3 below.
Average daily catches unloaded in Berth #1 (depth: 1.5m; length: 685m) are around 15-20 tons and are all tuna. As at Davao, tuna is weighed and graded immediately after it is landed, with A-grade sashimi tuna being flown out to Japan the same day (approx. 70% of the total). Tuna assigned a B or lower grade (approx. 30%) is sold wholesale for processing at a processing plant within the complex after which it is distributed to domestic or offshore markets. Berth #1 is used by small-scale municipal fisherfolk operating bankas (small-scale fishing vessels).
An average of approximately 30 tons of fish per day is unloaded at Berth #2 (depth: 3.5m; length: 412m), with catches predominantly made up of tuna species. Of this, 20% is exported, with the remaining 80% going to general domestic consumers and some to bulk consumers, for example fish processing companies (canneries, food processors) and restaurants.
An average of approximately 62 tons of fish per day is unloaded at Berth #3 (depth: 6.0m; length: 340m), with catches predominantly made up of yellow fin tuna, skipjack, horse mackerel and mackerel. Of this, 5% (mainly horse mackerel) is exported as tuna bait, with the remaining 95% being distributed to domestic markets or utilized for canning and/or processing at fish processing companies.
4 The development of Berth #4, excluding the construction of its breakwater, plus the No. 4 fish market were included in the scope
of this project.

8
Figure 2-3: Post Harvest Distribution Routes at GSFPC
Again, prior to project implementation, there were no public facilities for landing activities in
General Santos City and the municipal fisherfolk using private jetties would enlist the labor of people along the coast to unload their hauls and this, like the examples given for Davao, meant that the fishery were handled both inefficiently and in unhygienic conditions. Much of the fish landed at General Santos was consumed in large cities on Mindanao like Davao and Cagayan de Oro, where fish production is low, with a proportion being transported to Manila and Cebu. In terms of handling (both fresh fish and fish for processing), the city is home to one joint venture with an American company and 18 local companies.
2.3.2 Catches Fish catches at DFPC and GSFPC are as shown in Figure 2-4 below. Volumes of fish landed at
DFPC vary from year to year but have been in the region of 4-6 thousand tons since 1998. As has already been stated, Figure 2-4 illustrates that only around 10% of catches at DFPC are landed by local fisherfolk, with all the rest being landed by foreign deep-sea fishing vessels for transshipment. It thus follows that one of the major reasons for the variable hauls is that there are major fluctuations in the catches unloaded by foreign vessels.
零細漁船
商業漁船
零細漁船
70%(刺身用マグロ A 級)
30%(刺身用マグロ B 級以下)
水産加工会社
(缶詰)
輸出(日本、アメリカ、 ヨーロッパ)
国内(ミンダナオ、マニラ、
ビサヤス)
水揚げ高 15~20 トン/日
水揚げ高 30 トン/日
輸出
国内(ミンダナオ、マニラ、ビサヤス)
� ƒ‘ æ1 係船場/第 1 魚市場>
� ƒ‘ æ2 係船場/第 2 魚市場>
� ƒ‘ æ3 係船場/第 3 魚市場>
輸出
国内
20%
10%
20%(主にマグロ類)
80%(主にマグロ類)
水産加工会社(缶詰、食品加工)、
法人顧客(レストラン等)
水揚げ高 60 トン/日
商業漁船
5%(主にアジ)
95%(キハダマグロ、
カツオ、アジ、サバ等)
輸出
国内(ミンダナオ中心)
水産加工会社 (缶詰、食品加工)
国内
輸出(少量)
Daily catch 15-20 tons
[Berth #1/No. 1 Fish Market]
[Berth #2/No. 2 Fish Market]
[Berth #3/No. 3 Fish Market]
Daily catch 30 tons
Daily catch 60 tons
Sustenance
fishing vessels
70% (A-grade tuna for sashimi)
30% (B-grade and under for sashimi) Fish processing
companies (canneries)
Fish processing companies (canneries,
food processors)
Export (Japan, US, Europe)
Domestic (Mindanao, Manila, Visayas)
Domestic
Export
20% (mainly tuna species)
80% (mainly tuna species)
Export Commercial
fishing vessels Sustenance
fishing vessels
Commercial
fishing vessels
5% (mainly horse mackerel) Export
Domestic (Mindanao, Manila, Visayas)
Fish processing companies (canneries, food processors) Corporate customers (restaurants, etc.)
Domestic (mainly Mindanao) 95% (yellow fin tuna,
skipjack, horse mackerel, mackerel, etc.)
Export (small volume)
Domestic

9
Figure 2-4: Catches at DFPC and GSFPC
Source: PFDA data Note 1: DFPC figures for 2002 do not include catches from local fishing vessels. Note 2: GSFPC catches for 2002 are the results for the 8-month period from January through August.
The GSFPC commenced practical operations in January 1999 and annual catches have been
exceeding 40 thousand tons since then (the GSFPC catches for 2002 shown in Figure 2-4 are the results for the 8-month period from January through August). In comparative terms, the volume of catches landed at GSFPC during 2001 was some 8.3 times greater than that unloaded at DFPC in the same year. This is attributed to three factors as follows. (1) The fish port complex at GSFPC is comparatively larger (the lot area 3.5 times larger, the total length of berths 6.2 times longer, the total floor area of market halls 6.6 times larger, etc.) and the processing capacity higher. (2) Seven of the nation’s eleven leading canneries have plants in General Santos and it is a key stronghold for the canning industry, centered on tuna. (3) As compared to the fishing grounds off the Davao coast, the waters off General Santos have more abundant aquatic resources.
Tables 2-1 and 2-2 below show the catches landed at DFPC and GSFPC by species. At DFPC, tuna for transshipment accounts for the majority. The largest catches at GSFPC are of mackerel, followed by tuna, skipjack and horse mackerel, which are also landed in significant quantities
0
10,000
20,000
30,000
40,000
50,000
60,000
1995 1996 1997 1998 1999 2000 2001 2002
年
トン
ダバオ漁港 ジェネラル・サントス漁港
運用開始
完成
完成
DFPC GSFPC Year
Tons
Completion
Start of operations
Completion

10
Table 2-1: Catches by Species (DFPC) (tons)
1996 (Year 2)
1997 (Year 3)
1998 (Year 4)
1999 (Year 5)
2000 (Year 6)
2001 (Year 7)
Local fishing vessels Tuna 0.3 6.6 2.2 0.0 0.4 0.0 Yellow fin tuna 16.9 4.0 0.0 2.8 0.2 0.0 Sardines 3.8 0 30.5 0.4 8.3 1.4 Horse mackerel 397.4 430.6 506.6 323.4 175.6 305.4 Mackerel 9.9 31.8 5.6 14.5 8.9 11.0 Skipjack 22.6 7.2 11.0 65.6 5.3 37.8 Moon fish (horse mackerel species) 35.6 77.3 29.7 56.2 91.0 131.0 Salmon 0.5 2.2 0.0 0.0 0.0 0.0 Soda horse mackerel 469.1 478.4 163.5 119.5 24.2 44.9 Other 38.9 6.9 1.0 100.6 0.0 0.0
Total 995.0 1,045.0 750.0 583.0 313.9 531.5 Foreign vessels (transshipment)
Predominantly tuna species 1,700.0 1,053.0 5,410.0 4,544.0 3,399.0 5,318.0 Source: PFDA data Note: PFDA does not have detailed data on the fish species in the catches of foreign vessels landed at DFPC for transshipment,
however, the majority is tuna for sashimi and processing (incl. yellow fin tuna, etc.).
Table 2-2: Catches by Species (GSFPC) (tons)
1996 1997 1998 1999 2000 (completion)
2001 (Year 2)
Tuna - - - 7,495.7 7,664.0 7,648.6 Sardines - - - 81.9 139.8 46.8 Horse mackerel - - - 3,356.4 4,250.4 4,020.0 Mackerel - - - 26,143.0 20,072.0 24,261.0 Skipjack - - - 5,175.9 4,075.4 3,008.2 Sea bream - - - 103.7 92.5 96.6 Striped mullet - - - 82.9 74.0 77.3 Milk fish - - - 725.8 483.9 506.5 Other - - - 5,470.7 4,269.4 4,304.0
Total - - - 48,816.0 41,121.0 43,969.0 Source: PFDA data Note: GSFPC catches for 2002 are the results for the 8-month period from January through August.
2.3.3 Other Operational Indicators Tables 2-3 and 2-4 below are operational statistics other than fish catches for the project facilities.
Table 2-3: Other Operational Indicators (DFPC)
1996 (Year 2)
1997 (Year 3)
1998 (Year 4)
1999 (Year 5)
2000 (Year 6)
2001 (Year 7)
Foreign 22 25 41 36 45 58 Vessel registration Local n.a. n.a n.a n.a 158 178
Foreign 1,624 1,901 1,683 1,053 694 822 Frequency of the return to port Local 538 358 1282 1247 897 932 Trading hours of fish markets (hours/day) Fish markets open for business when vessels come into port and there is no fixed
schedule. No. of traders / trading companies at the fish markets
n.a. n.a n.a n.a n.a n.a
Ice production (tons/day) 15.88 13.48 27.13 25.77 24.81 27.43 Capacity operating rate of ice plants (%) 53 45 90 86 83 91 Sales of ice (tons/day) 16.42 13.45 27.12 25.79 24.81 27.34 Freezing capacity (tons/day) 80 77 61 40 72 80 Capacity operating rate of freezers (%) 55 45 90 86 83 91
Source: PFDA data

11
Table 2-4: Other Operational Indicators (GSFPC)
1996 1997 1998 1999 2000 (completion)
2001 (Year 2)
Vessel registration - - - n.a. n.a. n.a. Frequency of the return to port - - - 21,380 24,109 24,217 Trading hours of fish markets (hours/day) - - - 20 20 20 No. of traders / trading companies at the fish markets
- - - 180 200 200
Ice production (tons/day) - - - 48 52 54 Capacity operating rate of ice plants (%) - - - 80 87 90 Sales of ice (tons/day) - - - 48 52 54 Freezing capacity (tons/day) - - - 1,000 1,200 14,00 Capacity operating rate of freezers (%) - - - 67 80 93
Source: PDFA data Note: GSFPC was officially completed in 2000, but facilities commenced operations in January 1999. (1) Fishing Vessel Registration
The number of local and foreign fishing vessels registering at DFPC has been increasing annually. By contrast, work is still in progress to establish the registration fee scale at GSFPC, and since official vessel registration activities have not yet commenced the exact figures are unknown (no vessels are officially registered). Nevertheless, according to a port official at GSFPC, since the port was opened for business there has been a gradual relocation of port functions from existing harbors to the project facility, and the number of vessels using the GSFPC has been increasing year-on-year.
(2) Frequency of the Return to Port
The figures for DFPC are subject to annual variation, however, GSFPC has been witnessing annual increases in port return frequency.
(3) Trading Hours of Fish Markets
The DFPC fish markets do not operate on a fixed schedule but will open for business when vessels come into port. In the majority of instances they are open for a few hours early in the morning. The fish markets at the GSFPC are open for business 20 hours a day.
(4) Trader Numbers at Fish Markets
At DFPC, 90% of the space in the market halls is leased to the agents that handle tuna for transshipment and the operation of the markets has been turned over to these agents. The remaining 10% (for local fisherfolk) is under the direct management of DFPC and the exact number of traders is unknown. There are 200 traders (companies) doing business at the GSFPC markets.
(5) Capacity Operating Rate of Ice-Making and Freezing Facilities
The capacity operating rates of ice-making and freezing facilities at both DFPC and GSFPC are high and fluctuate in the region of 80-90%; i.e. the facilities have been operating efficiently.
As is evidenced above, in improving the efficiency of post harvest unloading and transportation
operations, and introducing methods and technologies for the handling and transportation of fish utilizing ice-making facilities, freezers and refrigerators, it is inferred that the effects of this project are being manifested via improvements in the existing post harvest distribution process and reductions in post harvest losses.
12
2.3.4 Other Effects In developing landing facilities such as berths, etc., this project has effectuated significant
improvements in the unloading and transportation of fish, and linked to reductions in the workload and time involved in these operations. It has also led to diversification in distribution routes and consumer markets and has made it possible to ship large volumes of fish, not only within Mindanao, but also to Manila, to Cebu and to foreign destinations. The development of mains water and sewage systems within the port complexes means that the polluted water generated during fish treatment that was formerly discharged simply into the rivers is now being treated, and environmental improvements to sanitation, etc., have been effectuated.
A number of group interviews were conducted with municipal/commercial fisherfolk, processing companies, and market operators using the two port complexes during this survey as a means of ascertaining the effects and impacts of the project. The assessment of all the participants is that the project has effectuated dramatic improvements in the post landing distribution process. The fisherfolk also cited the merits of having acquired a safe place to anchor their vessels.
2.3.5 Recalculation of EIRR and FIRR At appraisal, the project’s economic internal rate of return (EIRR) was calculated to be 25.9% and the financial internal rate of return (FIRR) to be 4.8%. However, since it is not known what data were used to calculate the two figures at appraisal and it was not possible to obtain sufficient information, the EIRR and FIRR were not recalculated during this survey5.
2.4 Impact
2.4.1 Improved Earning Opportunities for Small- to Medium-Scale Fisherfolk The objective of this project was to reduce post harvest losses via the development of modern port
infrastructure targeting an increase in the supply of aquatic products, and at the same time, it was also anticipated to have an impact in terms of reducing the poverty and improving the earnings of small- and medium-scale fisherfolk (people engaged in municipal and commercial fishing) operating locally. Limited interviews were conducted with 5-6 small-/medium-scale fisherfolk and traders at the two port complexes, during which the fisherfolk responded that the project has increased their earnings, that work opportunities have expanded and so forth. The traders and brokers also stated that their earnings and profits are up.
2.4.2 Impacts on Regional Development As has already been mentioned in section 2.1 “Relevance”, Davao City has been making efforts to
promote the DFPC as a base for the fish processing industry in recent years, and there have been rapid developments in General Santos City also as leading operators in the industry have concentrated in the area; both ports have thus become important strongholds in their respective regional economies.
5 Regarding the EIRR for DFPC, whereas the port did not contribute to the calculation prerequisite “effectiveness of exports” because transshipments by foreign companies (Taiwanese, etc.) account for 90% and this volume is not handled as exports from the Philippines, it is considered that the “improvements in freshness” condition has increased. Again, regarding the FIRR, it is possible to predict revenue increases on the basis of the facilities use fees being paid by foreign fishing vessels.
13
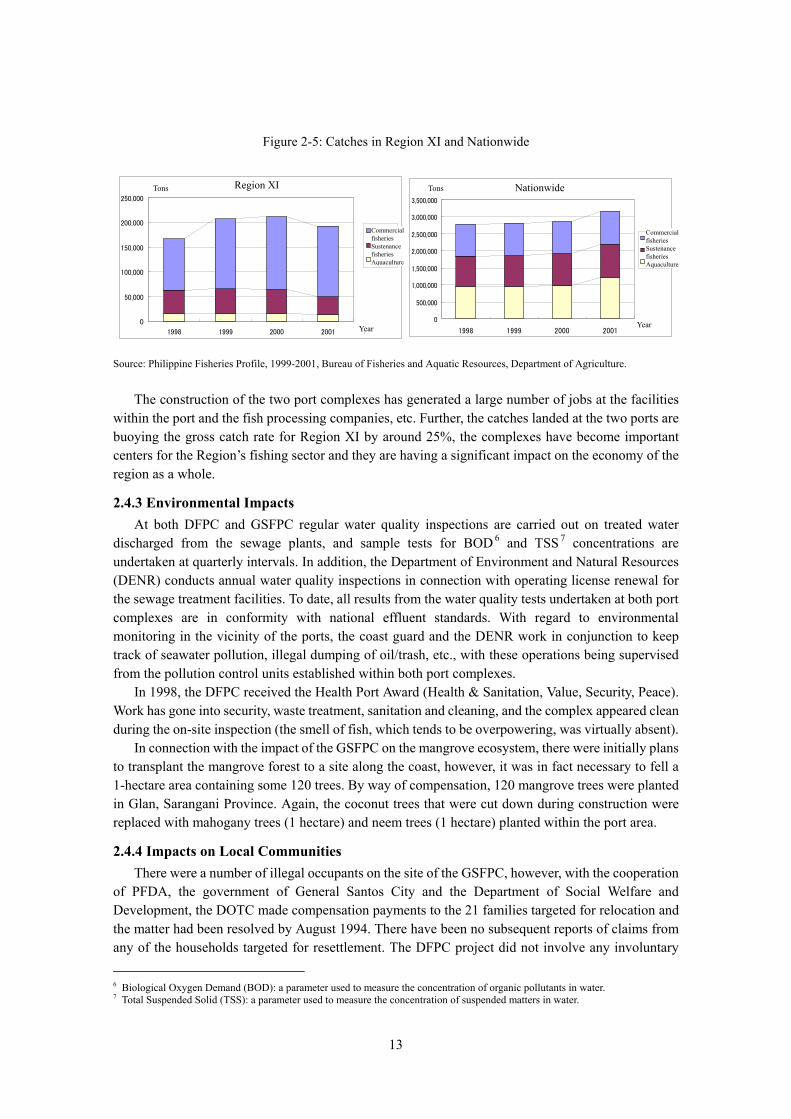
Figure 2-5: Catches in Region XI and Nationwide
Source: Philippine Fisheries Profile, 1999-2001, Bureau of Fisheries and Aquatic Resources, Department of Agriculture.
The construction of the two port complexes has generated a large number of jobs at the facilities
within the port and the fish processing companies, etc. Further, the catches landed at the two ports are buoying the gross catch rate for Region XI by around 25%, the complexes have become important centers for the Region’s fishing sector and they are having a significant impact on the economy of the region as a whole.
2.4.3 Environmental Impacts At both DFPC and GSFPC regular water quality inspections are carried out on treated water
discharged from the sewage plants, and sample tests for BOD 6 and TSS 7 concentrations are undertaken at quarterly intervals. In addition, the Department of Environment and Natural Resources (DENR) conducts annual water quality inspections in connection with operating license renewal for the sewage treatment facilities. To date, all results from the water quality tests undertaken at both port complexes are in conformity with national effluent standards. With regard to environmental monitoring in the vicinity of the ports, the coast guard and the DENR work in conjunction to keep track of seawater pollution, illegal dumping of oil/trash, etc., with these operations being supervised from the pollution control units established within both port complexes.
In 1998, the DFPC received the Health Port Award (Health & Sanitation, Value, Security, Peace). Work has gone into security, waste treatment, sanitation and cleaning, and the complex appeared clean during the on-site inspection (the smell of fish, which tends to be overpowering, was virtually absent).
In connection with the impact of the GSFPC on the mangrove ecosystem, there were initially plans to transplant the mangrove forest to a site along the coast, however, it was in fact necessary to fell a 1-hectare area containing some 120 trees. By way of compensation, 120 mangrove trees were planted in Glan, Sarangani Province. Again, the coconut trees that were cut down during construction were replaced with mahogany trees (1 hectare) and neem trees (1 hectare) planted within the port area.
2.4.4 Impacts on Local Communities There were a number of illegal occupants on the site of the GSFPC, however, with the cooperation
of PFDA, the government of General Santos City and the Department of Social Welfare and Development, the DOTC made compensation payments to the 21 families targeted for relocation and the matter had been resolved by August 1994. There have been no subsequent reports of claims from any of the households targeted for resettlement. The DFPC project did not involve any involuntary
6 Biological Oxygen Demand (BOD): a parameter used to measure the concentration of organic pollutants in water. 7 Total Suspended Solid (TSS): a parameter used to measure the concentration of suspended matters in water.
全国
0
500,000
1,000,000
1,500,000
2,000,000
2,500,000
3,000,000
3,500,000
1998 1999 2000 2001年
トン
商業漁業
零細漁業
養殖
リージョンXI
0
50,000
100,000
150,000
200,000
250,000
1998 1999 2000 2001 年
トン
商業漁業
零細漁業
養殖
Region XI Tons
Year
Nationwide Tons
Commercial fisheries Sustenance fisheries Aquaculture
Commercial fisheries Sustenance fisheries Aquaculture
Year
14
resettlement.
2.5 Sustainability
2.5.1 Organizational Capability After the completion of DFPC and GSFPC the facilities were transferred from DOTC, which was
responsible for construction, to the Department of Agriculture’s Philippine Fisheries Development Authority (PFDA), which is now charged with the operation and maintenance of the two port complexes. The PFDA was established in 1976 with aim of improving efficiency in the handling, marketing and distribution of aquatic product via the operation and maintenance of fishing ports and related facilities, and of promoting the growth of the fishing sector.
The DFPC and GSFPC organizations are constituted of a port director at the top, a port/market management section, a technical/ice plant management section, and a financial/general affairs section, with 41 employees at the DFPC and 72 at the GSFPC.
2.5.2 Technical Capability The maintenance of ice-making and cold storage facilities is undertaken directly by employees at
the two port complexes; no major problems have arisen to date and the facilities are in favorable operating condition. There are sufficient stocks of spare parts and there have been no major problems as the result of shortages thus far. Maintenance costs of less than 10 thousand pesos are cleared by the port director, whereas PFDA in Manila settles those exceeding this amount. To date both ports have been favorably managed and operations have not been hampered by a lack of budget funds. The ice plant at DFPC has been partially upgraded in pursuit of greater operational efficiency.
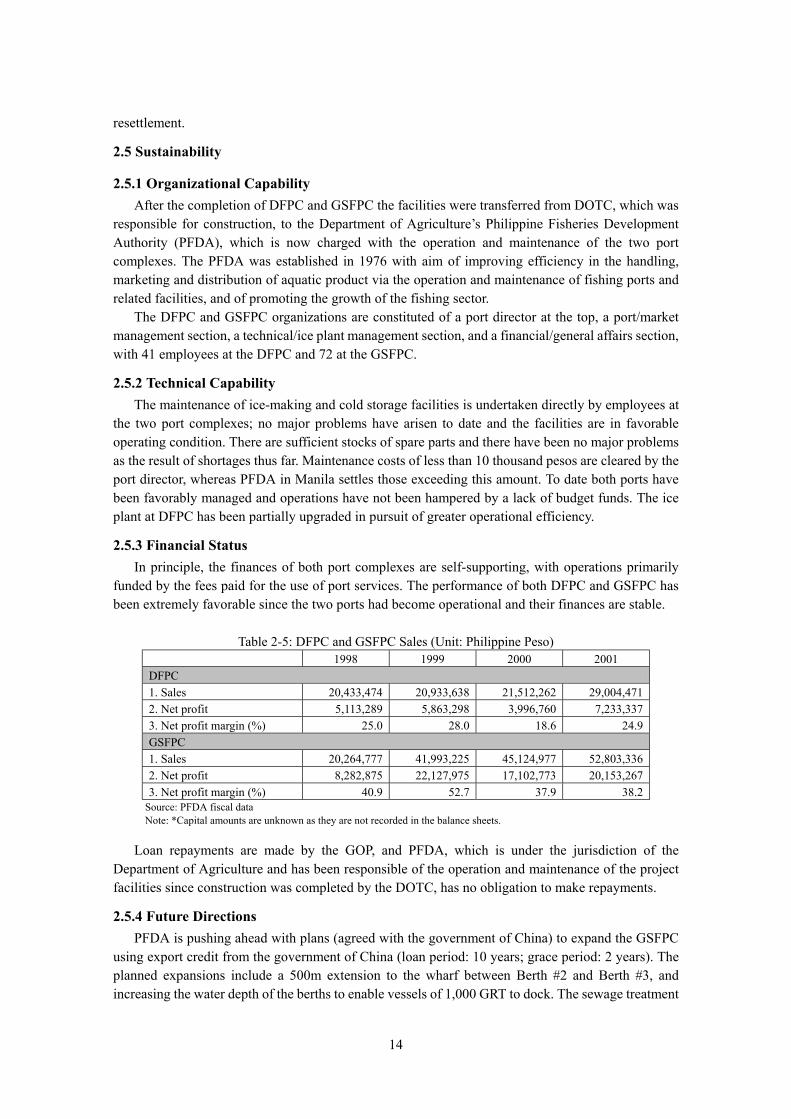
2.5.3 Financial Status In principle, the finances of both port complexes are self-supporting, with operations primarily
funded by the fees paid for the use of port services. The performance of both DFPC and GSFPC has been extremely favorable since the two ports had become operational and their finances are stable.
Table 2-5: DFPC and GSFPC Sales (Unit: Philippine Peso) 1998 1999 2000 2001
DFPC 1. Sales 20,433,474 20,933,638 21,512,262 29,004,471 2. Net profit 5,113,289 5,863,298 3,996,760 7,233,337 3. Net profit margin (%) 25.0 28.0 18.6 24.9 GSFPC 1. Sales 20,264,777 41,993,225 45,124,977 52,803,336 2. Net profit 8,282,875 22,127,975 17,102,773 20,153,267 3. Net profit margin (%) 40.9 52.7 37.9 38.2
Source: PFDA fiscal data Note: *Capital amounts are unknown as they are not recorded in the balance sheets.
Loan repayments are made by the GOP, and PFDA, which is under the jurisdiction of the
Department of Agriculture and has been responsible of the operation and maintenance of the project facilities since construction was completed by the DOTC, has no obligation to make repayments.
2.5.4 Future Directions PFDA is pushing ahead with plans (agreed with the government of China) to expand the GSFPC
using export credit from the government of China (loan period: 10 years; grace period: 2 years). The planned expansions include a 500m extension to the wharf between Berth #2 and Berth #3, and increasing the water depth of the berths to enable vessels of 1,000 GRT to dock. The sewage treatment

15
facilities, which have almost reached their capacity limit, are also to be expanded, and there are plans to enhance the development area near the port so that it can admit more fish processing companies.
At appraisal, the detailed designs for these berths were planned on a slightly smaller scale so as to avoid excess based on (1) the existence of numerous private wharfs in the vicinity of GSFPC capable of accommodating larger vessels, (2) the fact that it was anticipated that the complex would primarily be used by small-scale local fisherfolk, and (3) there were no Philippine vessels requiring a water depth exceeding 6 meters at the time. The current expansion plan is being promoted in response to subsequent circumstantial changes that were not initially predicted, including the increased use of the facility by medium- and large-scale commercial fishing vessels. The plan is expected to enable GSFPC to offer its services not only to the small-scale fishing vessels and small-/medium-scale commercial vessels that currently frequent the port, but also to large-scale commercial fishing vessels. 3. Feedback
3.1 Lessons Learned Any major changes in project objectives, even if occurring after project completion, should
be discussed by JBIC and the executing agency so as to secure project efficiency. In the case of the DFPC, the role of the facility changed after the project was completed when it
became a transshipment port used by foreign deep-sea fisheries, and this diminished the beneficial effects that were forecast to be extended to local fisherfolk, and particularly to those engaged in small-scale and sustenance fishing, under the initial plans. Even though this policy shift occurred after the project’s completion, since it also represented a partial change in the project’s objectives it is considered that JBIC should have established closer contact with the executing agency and have taken the opportunity to investigate the significance/relevance of the change as it related to the project.
When formulating plans for similar port construction projects in the future, the roles of
individual ports and target beneficiaries must be accurately identified at the outset and particular consideration afforded to the people engaged in small-scale fisheries and to obtaining the cooperation of local government bodies.
Fishing port construction projects are planned in expectation of future developments in the fishing
industry, not only on the basis of the current industry scale and the type of persons engaged therein, but in the societies of developing countries, it is often the case that large-scale fisheries will not coincide with the needs of many of those engaged in small-scale/sustenance fishing. To this end, future port construction projects need to bear in mind future mixtures of the various methods and scales of fishing, and should be designed so that they continue to reflect the profits of those engaged in small-scale fishing and through the establishment of close relationship with local government bodies.
3.2 Recommendations Nothing specific.

16
Comparison of Original and Actual Scope
Item Plan Actual
(1) Project Scope A. DFPC (Basic facilities)
1. Lot area 2. Wharf
3. Breakwater 4. Sea wall 5. Dredging 6. Landfill 7. Guide lights (Functional facilities) 8.Fish market 9. Ice making facilities 10. Freezers 11. Cold storage 12. Administrative building 13. Utilities 14. Sewerage treatment plant
B. GSFPC (Basic facilities)
1. Lot area 2. Wharf
3. Breakwater 4. Sea wall 5. Dredging 6. Land leveling 7. Guide lights (Functional facilities) 8. Fish market 9. Ice making facilities 10. Freezers 11. Cold storage 12. Administrative building 13. Utilities 14. Sewerage treatment plant C. Cebu Fish Port (Basic facilities) 1. Lot area 2.Wharf (berthing area) 3. Breakwater 4. Sea wall 5. Dredging 6. Landfill 7. Guide lights
12ha 1 (total length:235m) Total length: 350m Total length: 480m - 4.5ha 2 1 (total area: 1,700m3) Production capacity: 30t/day Capacity: 270kg/day × 2 Capacity: 80t (-35oC) Total area: 300m2 Mains water, sea water supply facilities, etc. (Not planned) 20ha 3 (total length: 820m) Total length: 280m Total length: 230m 116,000m3 175,000m3 1 3 (total area: 4,500m2) Production capacity: 60t/day Capacity: 288kg/shift × 4 Capacity: 1,500t Total area: 420m2 Mains water, sea water supply facilities, electricity, etc. (Not planned) 30ha Total length: 100m Total length: 530m Total length: 1,150m - 12ha -
As left As left As left As left 4,576.8m3 As left As left As left As left As left As left As left As left Treatment capacity: 300t/day 42ha 3 (total length :1,465m) Total length: 64m Total length: 612m 252,904m3 235,580m3 5 4 (total area: 11,190m2) As left As left As left As left As left Treatment capacity: 440t/day Cebu Fish Port construction was totally cancelled

17
(Functional facilities) 8. Fish market 9. Ice making facilities 10. Freezers 11. Cold storage 12. Administrative building 13. Utilities
Total area: 2,700m3 Production capacity: 60t/day Capacity: 270kg/day× 4 Capacity: 80t × 2 1 (total area: 420m2) Mains water, sea water supply facilities, etc.
(2) Implementation Schedule 1. L/A 2. Consultant selection 3. Tender 4. Civil engineering/construction
works 5. Consulting services 6. Project completion
Mar. 1992 Apr. 1992 - Apr. 1993 Apr. 1992 - Jul. 1993 Jul. 1993 - Jun. 1996 Apr. 1993 - Dec. 1996 Jun. 1996
Mar. 1992 Concluded in Jan. 1992 (direct contracting) A: Nov. 1990 - May 1993 B: Sep. 1992 - Oct. 1994 A: Jun. 1993 - Jul. 1995 B: Dec. 1994 - Dec. 2000
(additional construction: Aug. 1999 - Dec. 2000)
A: Oct. 1993 - Aug. 1995 B: Dec. 1994 - Jun. 2000 A: Jul. 1995 B: Dec. 2000
(A: Davao, B: General Santos) (3) Project Cost Foreign currency Local currency Total ODA loan portion Exchange rate
5,639 million yen 4,514 million yen (30,695 million peso) 10,207 million yen 7,655 million yen 1 peso = 6.8 yen (Jul. 1990)
3,338 million yen 2,459 million yen (Local currency) 5,797 million yen 4,660 million yen 1 peso = 3.0 yen (Average for 1992 - 2000)

18
Third Party Evaluator’s Opinion on Fishing Ports Project (II)
Dr. Olegario G. Villoria, Jr.
Consultant Trans Core ITS, Inc.
Relevance
The project’s objectives are indeed in line with the country’s medium-term development plans, both at the time of appraisal and upon completion. Specifically, the infrastructure development in the fisheries industries in Davao and General Santos has increased efficiency in the production, processing, marketing and distribution of aquatic product. The intended beneficiaries of the fish port complexes were small-and medium-scale local fisheries. The modern complexes were meant to provide safe, hygienic and efficient unloading facilities where none existed in the past, as well as a more efficient system of wholesale and retail arrangements. However, it appears foreign commercial fishing companies had more to gain from the use of these facilities as transshipment ports because of their greater volume of catches. A number of external factors had impacted the original scope of the project. In particular, the construction of the Cebu Fishing Port was canceled, due to budgetary constraints from the executing agency (DOTC). It was also deemed that the relatively new Pasil Fishing Port Complex and the already-in-place “Metro Cebu Development Project (III)” did not warrant the allocation of funding towards a similar project. A number of changes to the design of the DFPC and GSFPC were also necessary, to respond to the peculiar needs of the projects (i.e., additional dredging work, construction of sewerage treatment plants). These changes helped to increase the effectiveness and efficiency of the project. Impact With the exception of the Cebu Fishing Port component of the project, it is my opinion that the overall objective of the project has been met. The construction of these modern facilities was essential to the growth the prosperity of the fisheries industries in Davao and General Santos, as evidenced by the increase in the volume of production, and the consistently increasing trends in the number of trading companies, port return frequency, volume of ice production, sales of ice, freezing capacity, etc. This project benefited greatly from the Philippine Government’s experience with implementing the previous Nationwide Fishing Ports Project (Phase I). Such experience formed the basis for defining the project assumptions and strategies to overcome factors that could have hindered the achievement of the project objectives. This project had significant positive impacts on the environment and social health conditions. The inefficiencies and health hazards posed by previous operations in Daliao, Talomo, Salmonan, and Bankerohan were greatly reduced, if not eliminated due to this project. The negative impacts of the project were mainly on the relocation of a relatively small number of households and destruction of some mangrove trees that were mitigated through compensation and replanting, respectively. The project’s impact on the regional economy and poverty alleviation programs of the Philippine government are significant. These projects generated income and employment in the fisheries industry, keeping in mind that this must be sustained in the long-term. The capital outlay is therefore, justified. While it is true that the local fisherfolk reaped numerous benefits from the construction of a modern fishing port, foreign commercial fishing companies have likewise benefited. But this does not in any way, diminish the overall impact of the project on the local, as well as, national economy.