philanthropic giving index - lilly family school of ... · in the december 2009 philanthropic...
TRANSCRIPT

Philanthropic Giving Index
December 2009
We gratefully acknowledge
The staff of the Center for Survey Research at Indiana University,
for survey administration and coding of data, and
to our panel of professional fundraisers who make this study possible.

2
In the December 2009 Philanthropic Giving Index (PGI) survey, fundraisers were slightly more
optimistic about the climate for fundraising than they were six months ago (8.7 percent) and
slightly more optimistic than they were this time last year (9.8 percent). The Present Situation
Index (PSI) shows a 1.7 percent decrease over last year‟s index, and fundraisers are slightly more
optimistic about future fundraising with the Expectations Index showing a 20.7 percent increase
from one year ago.
Key Findings for the December 2009 Philanthropic Giving Index, which included a series
of questions on the economy and giving:
The overall PGI was 71.1, an increase of 8.7 percent since Summer 2009 and up 9.8
percent from this time last year.
The PSI was 62.5, an increase of 7.7 percent from six months ago and down 1.7 percent
from one year ago. The Expectations Index, at 79.8, also increased 9.6 percent from six
months ago and 20.7 percent from a year ago.
Fundraisers from human services nonprofits are substantially less optimistic about the
current fundraising climate (PSI of 52.9) than other types of nonprofits.
Consultants who provide outside fundraising counsel to nonprofits are also less confident
about the current conditions for giving (PGI of 67.0) than other survey respondents.
Development officers from educational and religious organizations were the most
optimistic about the present climate.
The vast majority of the panel believes that the economy is having a negative impact on
fundraising, but fundraisers are less pessimistic about the impact of the economy on
fundraising six months from now (60.7 percent currently pessimistic and 42.5 percent six
months from now). Very few fundraisers (20 percent) have positive views about the
current economic impact compared to those expecting a positive economic impact six
months from now (45.9 percent).
With the exception of direct mail, fundraisers in the latest survey experienced less
success with all types of fundraising techniques in December 2009 than they predicted in
the first half of 2009.
Fundraisers reported statistically significantly less success with planned giving, corporate
gifts, Internet, and e-mail solicitations than they predicted just six months ago.
Approximately 63 percent of fundraisers said their organizations were projecting an
increase (31.2 percent) or no change at all (31.9 percent) in revenue generated from
fundraising when preparing the budget for the next fiscal or calendar year.
Just under 40 percent of fundraisers reported fewer repeat donors during the past two
years. One-third of fundraisers reported no shift either way in the number of donors that
gave year to year.
Most of the professional fundraisers reported that retaining current donors was a high
priority for their organization (92.5 percent). Nearly 70 percent of fundraisers made it a
medium to high priority for their organization to cultivate prospective donors. Only, 69.7
percent of fundraisers reported that cultivating prospective donors was a high priority for
their organization.
Philanthropic Giving Index December 2009

3
About the Philanthropic Giving Index
The Philanthropic Giving Index (PGI) is a semiannual study of the climate for charitable giving
and fundraising in the United States. It is similar to the Consumer Confidence Index, but for
charitable giving. The survey was fielded between October and November of 2009 and mailed to
a panel of 404 fundraising executives of nonprofits and fundraising consultants nationwide by
the Indiana University Center for Survey Research in Bloomington, Indiana, on behalf of the
Center on Philanthropy. Initially the panel was contacted by mail and then by follow-up e-mails.
Of the fundraisers and consultants receiving the survey, 146 returned the questionnaire, 1 was
not eligible, and 3 refused to participate; making the overall response rate 37.1 percent. The
panel represents a cross-section of the nonprofit sector in terms of subsectors (e.g., health,
education, or arts organizations), revenue size, and donor base.
The study produces three indexes. The Philanthropic Giving Index is the overall assessment of
the fundraising climate in the U.S. The Present Situation Index reflects professional fundraisers‟
view of the current fundraising climate, and the Expectations Index indicates what the panel of
fundraisers thinks the philanthropic climate will look like in the upcoming six months.
As with the Consumer Confidence Index, the PGI indexes range from 0 to 100, with higher
scores indicating more optimistic attitudes about the climate for giving. Table 1 lists the indexes
for the December 2009 wave and shows the percentage change from the two previous waves.
Table 2 shows the changes since the survey began; these changes are graphed in Figure 1.
Detailed Findings for the December 2009 Philanthropic Giving Index
The Philanthropic Giving Index for December 2009 is 71.1, an increase of 8.7 percent from six
months ago. These fundraisers are slightly more optimistic about the charitable giving climate
than they were last year (see Table 1). The Present Situation Index is 62.5, a 7.7 percent increase
from Summer of 2009 and a 1.7 percent decrease from one year ago. The Expectations Index is
79.8, a 9.6 percent increase from six months ago and a 20.7 percent increase from a year ago. All
indications suggest the fundraising climate is improving and is expected to remain this way for
the next six months.
Table 1 Values and Changes in Indexes Over the Past Year
December 2009
Change Since Summer 2009
Change Since December 2008
Philanthropic Giving Index (PGI) (overall assessment of climate for
fundraising) 71.1 8.7% 9.8%
Present Situation Index (PSI) (assessment of current climate for
fundraising) 62.5 7.7% -1.7%
Expectations Index (assessment of fundraising climate
in the next six months) 79.8 9.6% 20.7%

4
0
20
40
60
80
100
Philanthropic Giving Index Present Situation Index Expectations Index
Figure 1: Philanthropy Giving Index
Main Indexes Over Time

5
Table 2: Values of Philanthropic Giving Index Over Time
Report Date
Philanthropic
Giving Index
Present Situation
Index Expectations Index
Summer 98 88.8 87.2 90.4
December 98 87.1 86.2 87.9
Summer 99 86.8 85.5 88.0
December 99 94.6 93.6 95.6
Summer 00 94.5 93.7 95.3
December 00 92.0 90.5 93.5
Summer 01 91.1 89.9 92.3
December 01 83.6 79.0 88.2
Summer 02 89.0 83.8 94.1
December 02 77.7 69.7 85.8
Summer 03 72.3 63.0 81.6
December 03 83.3 75.5 91.1
Summer 04 90.6 87.4 93.8
December 04 89.7 88.2 91.3
Summer 05 85.2 82.2 88.2
December 05 86.3 84.9 87.6
Summer 06 88.9 86.6 91.2
December 06 87.6 85.8 89.5
Summer 07 87.5 85.4 89.7
December 07 88.8 88.0 89.7
Summer 08 82.8 81.7 83.9
December 08 64.8 63.6 66.1
Summer 09 65.4 58.0 72.8
December 09 71.1 62.5 79.8

6
Indexes by Subsector
Across all subsectors, development officers were noticeable more optimistic about the
fundraising climate in the next six months than the current fundraising climate (see Figure 2).
Fundraisers working in religious and educational organizations were the most optimistic about
the current fundraising climate and were also highly optimistic about the fundraising climate six
months from now. Nonprofit consultants and development officers working in human services
organizations were noticeably less optimistic about the current fundraising climate, rating the
Present Situation Index 8 to 10 points lower than their peers in other organizations. Fundraisers
working in public benefit, environment/animal, and international (PEAI) nonprofits were the
least optimistic about the future fundraising climate than their counterparts working in other
types of organizations.
Figure 2: Indexes by Subsector
December 2009
* PEAI: Public Benefit, Environment/Animal and International nonprofits
^ Arts: Results are not statistically meaningful because the sample size was less than 10
86.7
70.6
81.5
75.5
77.1
87.3
79.6
79.8
58.9
60.0
65.1
64.3
52.9
75.6
54.3
62.5
72.8
65.3
73.3
69.9
65.0
81.4
67.0
71.1
Arts^
PEAI*
Education
Health
Human Services
Religion
Consultants
Total
Index Values
Philanthropic Giving Index Present Situation Index Expectations Index

7
Effectiveness of Solicitation Techniques
As shown in Figure 3, fundraisers expect greater success with all solicitation techniques six
months from now, with the exception of direct mail. Fundraisers continue to report major gifts
and direct mail as the most successful fundraising techniques (69.7 percent and 66.7 percent
respectively). However, fundraisers believe that they will have more success with major gifts
(76.6 percent) and less success with direct mail in the next six months (65.1 percent). On the
other hand, development officers predict they will have more success with planned giving,
special events, foundation grants and telephone solicitations in the next six months than currently
reported. Few fundraisers report success with e-mail (21.3 percent), Internet (28.4 percent), or
corporate giving (29.2 percent).
76.6
69.9
55.9
46.9
65.1
45.1
34.0
35.0
37.1
69.7
61.4
54.7
44.8
66.7
34.8
29.2
28.4
21.3
Major Gifts
Planned Giving
Special Events
Foundations
Direct Mail
Telephone
Corporate Gifts
Internet
Percentage
Figure 3: Percentage of Respondents Who Rated Fundraising
Techniques as Successful or Somewhat Successful
December 2009
Current Future

8
Effectiveness of Solicitation Techniques Over Time
As Figure 4 shows, since the start of the recession in December 2007 the economy has affected
various types of solicitation techniques differently. Fewer fundraisers are reporting success with
major gifts, planned giving, and foundation grants. Development officers are reporting slight
increases in reported success with major gifts and planned giving compared to six months ago
(69.7 percent and 61.4 percent respectively) but they still remain at historic lows. In addition, the
reported success with foundation grants has fallen to 44.8 percent, one of its lowest levels. The
average reported success with foundation grants since the study began in summer of 1998 is
63.5. All indications suggest that direct mail still remains one of the most successful techniques
for raising philanthropic dollars for nonprofits. For this wave of the PGI, the reported success
with direct mail is 66.7; whereas the average reported success with direct mail since the study
began in Summer 1998 is 66.5.
0
20
40
60
80
100
Per
cen
tage
Figure 4: Percentage Reporting Success Over Time With
Major Gifts, Direct Mail, Foundation Grants, and
Planned Giving
Major Gifts Direct Mail Foundation Grants Planned Giving
9
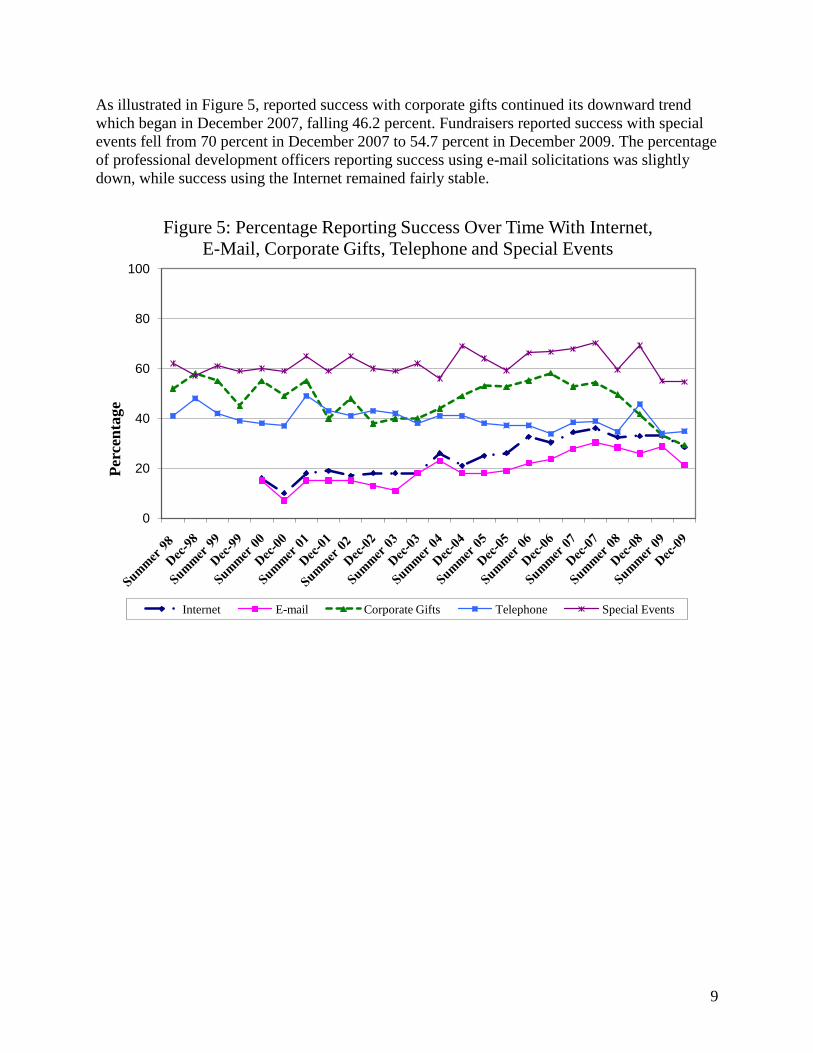
As illustrated in Figure 5, reported success with corporate gifts continued its downward trend
which began in December 2007, falling 46.2 percent. Fundraisers reported success with special
events fell from 70 percent in December 2007 to 54.7 percent in December 2009. The percentage
of professional development officers reporting success using e-mail solicitations was slightly
down, while success using the Internet remained fairly stable.
0
20
40
60
80
100
Per
cen
tage
Figure 5: Percentage Reporting Success Over Time With Internet,
E-Mail, Corporate Gifts, Telephone and Special Events
Internet E-mail Corporate Gifts Telephone Special Events

10
Predicted Versus Actual Levels of Success, by Fundraising Technique
The panel of professional fundraisers was asked six months ago (Summer 2009) to predict the
level of success they would have with various fundraising techniques. Here we examine their
predicted success with their current success as reported in December 2009 for those who
responded to both surveys. For nearly every type of fundraising technique, development officers
anticipated more success than they reported with the surprising exception of direct mail. Six
months ago, only 59.6 percent of fundraisers thought they would have success with direct mail in
the coming months, but in December of 2009, 66.7 percent of these same fundraisers reported
success. On the other hand, development officers anticipated much more success with corporate
gift fundraising than reported in December 2009. Fundraisers reported statistically significantly
less success with planned giving, corporate gifts, Internet, and e-mail solicitations than they
predicted just six months ago.
Note: Planned giving, corporate gifts, Internet, and e-mail solicitations are statistically significantly less successful
currently than predicted to be just six months ago.
69.7
61.4
66.7
44.8
54.7
29.2
34.8
28.4
21.3
73.9
66.5
59.6
44.5
54.6
34.8
38.8
42.7
37.4
Major Gifts
Planned Giving
Direct Mail
Foundation Grants
Special Events
Corporate Gifts
Telephone
Internet
Percentage
Figure 6: Predicted (Summer 2009) Versus Reported
(December 2009) Success of Fundraising Techniques
(of those that responded to both surveys)
Predicted Summer 2009 Reported December 2009
11
The Economy
Several indicators influence the fundraising climate for the U.S. In the third quarter of 2009, the
U.S. economy saw modest growth, with economic output increasing 2.8 percent and Personal
Disposable Income increasing 0.4 percent (Bureau of Economic Analysis, 2009). The Consumer
Confidence Index (CCI), which is reported monthly by The Conference Board, increased from
46.6 in July of 2009 to 49.5 in November indicating consumers are slightly more confident. At
the close of November 2009, the Standard & Poor‟s 500 Index increased nearly 110 points since
July of 2009. However, the civilian unemployment rate was 10 percent in November 2009 with
widespread job losses across all major industry sectors. At the start of the recession in December
2007, the unemployment rate was 4.9 percentage points.
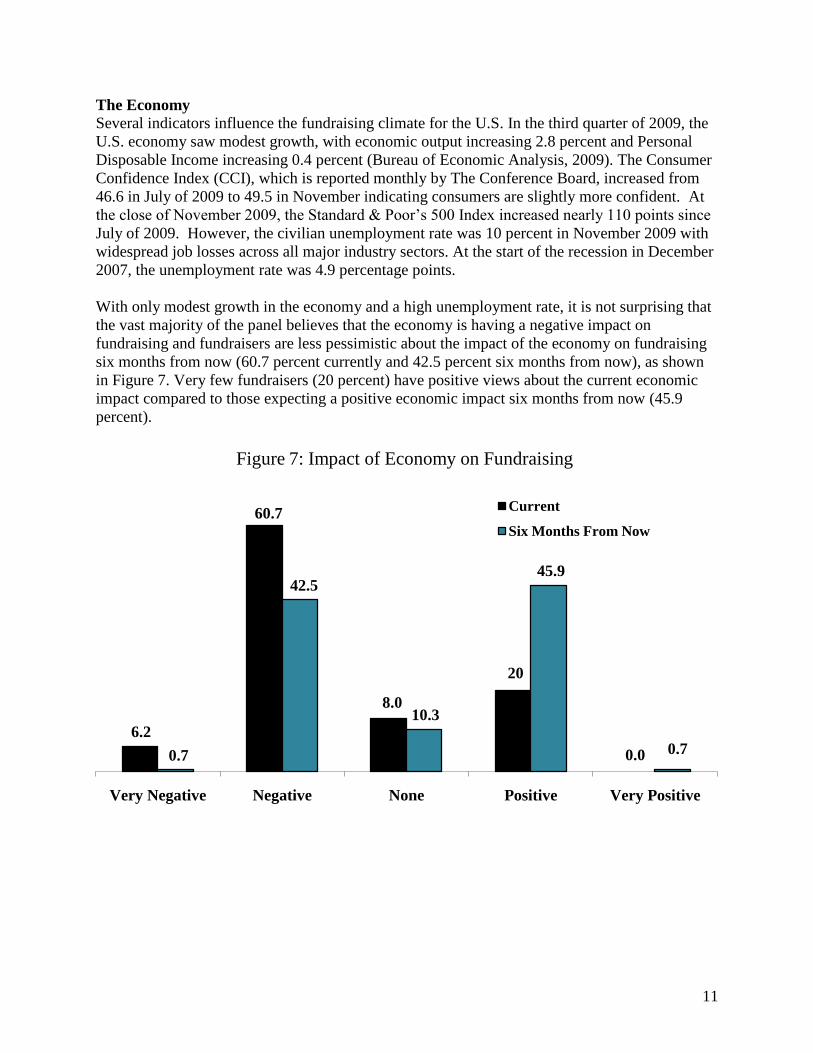
With only modest growth in the economy and a high unemployment rate, it is not surprising that
the vast majority of the panel believes that the economy is having a negative impact on
fundraising and fundraisers are less pessimistic about the impact of the economy on fundraising
six months from now (60.7 percent currently and 42.5 percent six months from now), as shown
in Figure 7. Very few fundraisers (20 percent) have positive views about the current economic
impact compared to those expecting a positive economic impact six months from now (45.9
percent).
6.2
60.7
8.0
20
0.00.7
42.5
10.3
45.9
0.7
Very Negative Negative None Positive Very Positive
Figure 7: Impact of Economy on Fundraising
Current
Six Months From Now

12
Figure 8 shows the average assessments of the current impact of the U.S. economy on
fundraising during each of the past seven years. Between 2004 and 2007, fundraisers in general
reported a more positive influence of the economy on fundraising. However, just over 90 percent
of fundraisers reported that the economy had a negative or very negative impact on fundraising
in 2008. The panel of fundraisers was slightly less pessimistic in 2009, where 76.5 percent
reported that the economy had a negative or very negative impact on fundraising. Nearly 2
percent reported that the economy had a positive impact on fundraising in 2008. This compares
to 13 percent of fundraisers that reported the economy is having a positive impact on fundraising
in 2009, suggesting that the panel of fundraisers is slightly more optimistic about the impact of
the economy on fundraising.
71.2
36 3628.9
35.3
90.3
76.5
9.5
21.128.2
21.6
23.5
7.7
10.6
19.5
42.935.9
49.643.5
2.2
13
Average
2003
Average
2004
Average
2005
Average
2006
Average
2007
Average
2008
Average
2009
Per
cen
tag
e
Figure 8: Current Impact of the U.S. Economy on Fundraising
Negative None Positive

13
Questions related to the economy
In the December 2009 edition of the Philanthropic Giving Index, we asked a series of questions
related to the impact of the economy on organizations. Figure 9 shows the change, if any, that
fundraisers are projecting in revenue generated from fundraising when preparing the budget for
the next fiscal or calendar year. Approximately 28 percent of fundraisers are projecting a
decrease in revenue generated from fundraising when preparing their budgets. This is slightly
less than the 35 percent of fundraisers who projected a decrease in Summer 2009. Nearly 31.2
percent of fundraisers reported an increase in revenue when preparing their budgets, an increase
of more than 10 percentage points when compared to Summer 2009. In comparison, 31.9 percent
of fundraisers are projecting no changes at all.
Table 3 shows that the majority of fundraisers that project a decrease in revenue (75.7 percent)
reported a decrease in revenue of between 1 and 15 percent. Nearly 80 percent of fundraisers that
are projecting an increase in revenue reported an increase of between 1 and 15 percent.
Table 3: Reported Change in Projected Revenue for the Next Fiscal or Calendar Year
Decrease of: Increase of:
1 to 5 percent 18.9 44.1
6 to 15 percent 56.8 35.3
16 to 25 percent 16.2 17.6
26 percent or more 8.1 2.9
TOTAL 100.0 100.0
34.7
38.9
19.2
7.2
28.3
31.9 31.2
8.7
Decrease No change at all Increase Don‟t know
Figure 9: Percent of Fundraisers Reporting the Projected Change
in Revenue Generated from Fundraising when Preparing the
Budget for the Next Fiscal or Calendar Year
Summer 2009
December 2009

14
The panel of fundraisers was also asked about new activities or initiatives implemented in 2009
that increased organizational revenue (see Figure 10). The majority of fundraisers, 84 percent,
reported that a focus on stewardship and communication with donors led to increased
organizational revenue. In addition, 83.7 percent set organizational priorities and made tough
budget decisions that generated new revenue. Only 51.1 percent of fundraisers wrote grant
proposals for foundation and corporate grants. Whereas, 38.9 percent accepted in-kind donations
and 31.2 percent partnered with community organizations. However, only one-fifth of
fundraisers reported receiving American Recovery and Reinvestment Act funding in 2009.
Approximately 23 percent of fundraisers reported other activities or initiatives such as hiring
new staff with specific skill sets, increased solicitation of gifts and intensified communication
with donors.
20.5
22.6
24.4
31.2
38.9
51.1
83.7
84.0
Received American Recovery and
Reinvestment Act Funding
Other
Increase secondary sources of income
Partner with community organizations
Accept in-kind donations
Write grant proposals
Set organizational priorities and tough
budget decisions
Focus on stewardship and
communication with donors
Figure 10: Percent of Fundraisers Reporting the Types of New
Activities Implemented that Increased Organizational Revenue in
2009

15
Figure 11 shows the percentage of fundraisers reporting a change in the number of donors that
gave year to year, during the past two years. Just under 40 percent of fundraisers reported fewer
repeat donors during the past two years. One-third of fundraisers reported no shift either way in
the number of donors that gave year to year. About 27 percent, however, did report an increase in
the number of repeat donors during the past two years. This amounts to a decline in the number
of donors that gave year to year.
39.6
33.3
27.1
Fewer repeat donors No shift either way More repeat donors
Figure 11: Percentage of Fundraisers Reporting the Change in the
Number of Donors that Gave Year to Year

16
The panel of fundraisers was also asked about how much priority their organization has devoted
to retaining current donors, cultivating prospective donors, and reengaging lapsed donors in 2009
(see Figure 12). Most of the professional fundraisers reported that retaining current donors was a
high priority for their organization (92.5 percent). Nearly 70 percent of fundraisers made it a
high priority for their organization to cultivate prospective donors. Only, 69.7 percent of
fundraisers reported that cultivating prospective donors was a high priority for their organization.
In comparison, only 56.3 percent of development officers made reengaging lapsed donors a high
priority for their organization. This indicates that most fundraisers are focusing their primary
efforts on retaining current donors and cultivating prospective donors.
Most of the professional fundraisers reported that giving to their organization was down and that
they were experiencing uncertainty about the fundraising climate. However, a fair amount
reported the economy was having a mixed effect on fundraising for their organization.
Fundraisers on our panel said:
“Annual giving gift range donors have increased in number, but dollars per donation have
decreased. The number of major gift range donors, especially in the $1.0 million plus
range have dropped dramatically from prior years.”
“As fund raising has become more challenging we have invested more energy in fund
raising and donor cultivation. We had a development consultant assess our methods
which resulted in some improved techniques.”
0.75.5 6.8
92.5
0.75.5
24.1
69.7
1.4
13.4
28.9
56.3
Not a priority Low priority Medium priority High priority
Figure 12: Percentage of Fundraisers Reporting the Level of
Priority Their Organization has Devoted to Retaining Current
Donors, Cultivating Prospective Donors, and Reengaging Lapsed
Donors
Retaining Current Donors
Cultivating Prospective Donors
Reengaging Lapsed Donors

17
“Foundation funding is most directly impacted negatively. Also, corporations,
particularly banks, are avoiding high-end events.”
“Organizations that had strong relationships (good reporting and communication whether
by mail or in person) with donors prior to the economic downturn are doing well or at
least remaining stable.”
“We continue to see organizations with comprehensive, balanced development programs
that are committed to best practices are the ones that do well. The ones that struggle don't
embrace best practices. They often have a narrow donor base.”
“Planned Giving has improved (at least distributions of gifts) as the real estate market has
improved and homes are selling faster and for better prices than 12 months ago.”
“While we are not losing donors, the amount that individual donors are contributing is
less per donor than in the past.”
The Impact of the Economy by Subsector, Revenue, and Location of Donor Support
Overall, there were few differences in how the economy impacted fundraising among the various
types of nonprofits. Below we discuss those few differences.
Subsector
Fundraisers from PEAI and health organizations were the most likely to report that the
economy was having a negative impact on fundraising (93.3 percent and 73.7 percent,
respectively).
Fundraisers from educational and religious nonprofits were the most likely to report a
projected increase in revenue generated from fundraising when preparing the budget for
the next fiscal or calendar year.
Approximately 50 percent of consultants are projecting a decrease in revenue generated
from fundraising when organizations they consult with are preparing their budgets.
Consultants and fundraisers from educational organizations reported fewer repeat donors
during the past two years (62.5 percent and 40.6 percent respectively).
Religious organizations were more likely to report an increase in the number of repeat
donors during the past two years (40.9 percent).
Revenue
Small organizations, those with revenue between $1 and $5 million, were most likely to
report that the economy was having a negative impact on fundraising.
Medium organizations, those with revenue between $10 and $50 million were the most
likely to report a projected increase in revenue generated from fundraising when
preparing the budget for the next fiscal or calendar year.
Medium organizations, those with revenue between $10 and $50 million were the most
likely to report fewer repeat donors during the past two years (57.9 percent).
Larger nonprofit organizations, those with revenue more than $50 million were the most
likely to report more repeat donors during the past two years (45.8 percent).

18
Location of Donor Support
More than three-quarters of organizations with a regional donor base reported that the
economy was having a negative impact on fundraising (76.3 percent).
Nearly one-third of organizations with a national donor based report a projected decrease
in revenue generated from fundraising when preparing the budget for the next fiscal or
calendar year.
Nonprofit organizations with a national donor base were the most likely to report fewer
repeat donors during the past two years (43.3 percent).
Capital Campaign
Just one-third of nonprofits reported their organization was currently conducting a capital
campaign. Education and health organizations were the most likely to be involved in a capital
campaign (35.5 percent and 57.9 percent, respectively). Religious organizations (9.9 percent),
human services organizations (20.0 percent) followed by public-benefit, environment/animal,
and international (20.0 percent) were the least likely to be in a capital campaign. Local
organizations (36.2 percent) and organizations with more than $50 million in revenue were also
more likely to be involved in a capital campaign (54.1 percent).

19
Results of Fundraising Techniques by Subsector
Success with various fundraising methods differs widely by the type of organization. Table 4
shows the percentage of fundraisers that reported current success with various fundraising
techniques and Table 5 presents the predicted success rates six months from now. „*‟ Denotes
whether or not there were statistical differences within each column as well as the level of
significance.
Table 4: The Percentage of Respondents Reporting Success with Fundraising Techniques by Subsector
(%)
Direct
Mail Telephone
Special
Events
Planned
Giving
Major
Gifts Corporate Foundation E-mail Internet
ACH^ 77.8 62.5 87.5*** 66.7 66.7 33.3 55.6 25 25
PEAI 64.3 13.3* 60 53.3 46.7 28.6 60 14.3 35.7
ED 84.4* 75.0*** 46.4 65.6 81.3 38.7 48.4 30 38.7
HE 55.6 12.5*** 64.7 66.7 52.6 42.1 42.1 11.1 22.2
HS 65 20 55 25.0*** 50 30 55 25 20
RE 77.3 27.3 31.8 86.4 85.7 13.6 36.4 13.6 27.3
CS 42.3* 20 65.4 57.7 80.8 23.1 30.8 23.1 28
Total 66.7 34.8 54.7 61.4 69.7 29.2 44.8 21.3 28.4
Note: ACH = Arts, Culture, and Humanities; PEAI = Public Benefit, Environment, Animal, and International;
ED = Education; HE= Health; HS = Human Services; RE = Religion; CS = Consultants
Note: Statistical significance tests determined by the means; *p<.05, **p<.01, ***p<.001
^ Results are not statistically meaningful since the sample size is less than 10
Table 5: The Percentage of Respondents Predicting Success with Fundraising Techniques Six Months
from Now by Subsector (%)
Direct
Mail Telephone
Special
Events
Planned
Giving
Major
Gifts Corporate Foundation E-mail Internet
ACH^ 77.8 62.5 87.5** 77.8 100 44.4 33.3 50 37.5
PEAI 66.7 26.7** 53.3 53.3 57.1 42.9 60 28.6 46.2
ED 78.1 75.0*** 45.2 81.3 81.3 41.9 54.8 45.2 43.3
HE 52.6 23.5 61.1 63.2 63.2 42.1 47.4 15.8 26.3
HS 55 35 60 45.0*** 75 30 55 45 35
RE 72.7 45.5 45.5 86.4 81.8 18.2* 40.9 27.3 31.8
CS 53.8 36 65.4 69.2 76.9 26.9 30.8 34.6 40
Total 65.1 45.1 55.9 69.9 76.6 34.0 46.9 35.0 37.1
Note: ACH = Arts, Culture, and Humanities; PEAI = Public Benefit, Environment, Animal, and International; ED =
Education; HE= Health; HS = Human Services; RE = Religion; CS = Consultants
Note: Statistical significance tests determined by the means; *p<.05, **p<.01, ***p<.001
^ Results are not statistically meaningful since the sample size is less than 10
Arts, Culture, and Humanities
Fewer than 10 respondents from arts, culture, and humanities organizations responded to this
wave of the PGI. Therefore, the reader should exercise caution when interpreting these numbers
given the smaller sample size.

20
Public-Benefit, Environment/Animal, and International (PEAI)
Fundraising professionals from public-benefit, environment/animal, and international (PEAI)
nonprofits reported the most success with direct mail. This success is predicted to increase
slightly six months from now. Along with direct mail, fundraisers had the most success with
special events and foundation grants. However, the success with special events is expected to
decrease six months from now. PEAI fundraisers as a group were statistically significantly less
likely to report success with telephone solicitations; however, this success is expected to
statistically significantly increase in the future. The least successful fundraising techniques
reported were telephone solicitations, corporate gifts, and e-mail solicitations. PEAI fundraisers
are optimistic about their future success in major gifts and corporate fundraising. Finally, public-
society benefit, environment/animals, and international organizations as a group were the least
likely, 2.6 percent, to be involved in a capital campaign.
Education
Fundraisers from educational organizations reported statistically significantly more success than
their peers with using direct mail and telephone solicitations as fundraising techniques. This
success with direct mail solicitations is predicted to decrease six months from now, but
fundraisers still remain more confident than any other groups. Development officers from
educational organizations also reported planned giving and major gifts as their most successful
fundraising techniques. These fundraisers are optimistic about their future success with planned
giving. E-mail and Internet continue to be the least successful fundraising techniques reported by
these fundraisers.
Health
Fundraisers working in health organizations report the most success with special events and
planned giving, while they report statistically significantly less success with telephone
fundraising than their peers working in other types of organizations. Development officers from
health organizations reported their least successful fundraising techniques as the telephone, e-
mail and Internet. Health fundraisers are more optimistic about their fundraising success with
telephone solicitations, major gifts, foundation grants, e-mail and Internet solicitations six
months from now than they are currently experiencing. Finally, health organizations were the
most likely to be involved in a capital campaign (57.9 percent).
Human Services
Development professionals from human services organizations report the most success with
direct mail, special events and foundation grants. However, these fundraisers experienced
statistically significantly less success with planned giving than their peers working in other types
of organizations. These fundraisers also predict statistically significantly less success with
planned giving six months from now than their peers. In addition, human services fundraisers
predict more success with major gifts six months from now than they are currently experiencing.
Human service fundraisers are less optimistic about their success with telephone, e-mail and
Internet solicitations.

21
Religion
Fundraisers from religious organizations reported the most success with planned giving and
major gifts than their peers working in other types of organizations. Fundraisers predict less
success with major gifts six months from now. These fundraisers also reported success with
direct mail, however, the success with this technique is expected to decrease six months from
now. These fundraisers are the least likely to report fundraising success with corporate gifts,
though this is expected to statistically significantly increase in the future. Development personnel
from religious organizations also predict success with telephone and special events fundraising in
six months.
Consultants
Consultants working for all types of nonprofit organizations report the most success with major
gifts, and this success is expected to decrease six months from now. These fundraisers also had a
statistically significantly lower level of reported success with direct mail than their peers.
However, this success is expected to increase six months from now. Consultants report the least
success with telephone, corporate gifts, and e-mail fundraising. Consultants predict they will
have the most success with major gifts and planned giving six months from now and they also
predict low levels of success with corporate gifts, foundation grants and e-mail solicitations.

22
Results of Fundraising Techniques by Revenue
Success with various fundraising techniques also differs by the revenue size of the organization.
Table 6 shows the percentage of fundraisers that reported current success with various
techniques by revenue size. Table 7 details the predicted success of various techniques six
months from now. „*‟ Denotes whether or not there were statistical differences within each
column as well as the level of significance.
Table 6: Percentage of Respondents Reporting Success with Fundraising Techniques by Revenue Size
(%)
Direct
Mail Telephone
Special
Events
Planned
Giving
Major
Gifts Corporate Foundation E-mail Internet
<$1 mil 79.2 21.7 66.7 54.2 66.7 26.1 45.8 19 36.4
$1-5 mil 71.4 42.9 47.6 28.6*** 42.9** 14.3 47.6 4.8 14.3
$5-10 mil 53.3 26.7 66.7 60 64.3 33.3 26.7 6.7 13.3
$10-50 mil 83.3 38.9 55.6 78.9 84.2 57.9 84.2** 47.4 52.6
> $50 mil 65.2 50.0 38.9 82.6*** 70.8 30.4 39.1 22.7 22.7
Total 71.2 36.3 55.2 60.7 65.6 31.6 49.0 20.4 28.2
Note: Statistical significance tests determined by the means
Note: * indicates statistical significance *p<.05, **p<.01, ***p<.001
Table 7: The Percentage of Respondents Predicting Success with Fundraising Techniques Six Months
From Now by Revenue Size (%)
Direct
Mail Telephone
Special
Events
Planned
Giving
Major
Gifts Corporate Foundation E-mail Internet
<$1 mil 75 43.5 66.7 62.5 82.6 39.1 54.2 31.8 36.4
$1-5 mil 61.9 42.9 52.4 52.4** 52.4* 19 52.4 23.8 19
$5-10 mil 53.3 26.7 53.3 60 73.3 53.3 40 20 26.7
$10-50 mil 73.7 55.6 47.4 84.2 89.5 52.6 73.7* 52.6 61.1
> $50 mil 66.7 60.9 52.4 87.5** 83.3 34.8 47.8 43.5 34.8
Total 66.9 47.0 55 69.9 76.4 38.6 53.9 35 35.3
Note: Statistical significance tests determined by the means
Note: * indicates statistical significance *p<.05, **p<.01, ***p<.001
$1 million
Fundraisers from small organizations, those with revenues of less than $1 million, report more
success with direct mail, special events and major gifts fundraising. These organizations report
less success with these techniques six months from now, with the exception of major gifts, which
fundraisers predict more success in the future. Small-sized organizations are less optimistic
about their success with e-mail and Internet solicitations six months from now.
$1 million to $5 million
Fundraisers from medium-sized organizations, those with revenues in the $1 million to $5 million
range, report the most success with direct mail. The least successful techniques reported were e-
mail, telephone and Internet giving. Medium-sized organizations are expecting statistically
significantly less success with planned giving and major gifts. In addition, they are predicting

23
statistically significantly less success with these techniques than all other organizations six
months from now.
$5 million to $10 million
Development personnel from organizations with revenues between $5 million and $10 million
report the most success with special events and major gifts. The least successful techniques
reported were e-mail and Internet giving. These organizations predict less success with corporate
gifts than their peers from other types of organizations, however this is expected to increase six
months from now. These organizations predict more success with major gifts and planned
giving and less success with Internet, telephone and e-mail giving six months from now.
$10 million to $50 million
Fundraisers from organizations with revenues between $10 million and $50 million report
statistically significantly more success with foundations, followed by direct mail and major gifts,
as the most successful fundraising techniques. These fundraisers had the most success of all
organizations with direct mail and foundation grants. The least successful type of fundraising
reported was telephone solicitations. These organizations predict more success with major gifts,
planned giving, and foundations and less success with telephone and e-mail giving six months
from now.
$50 million and above
Fundraisers from the largest nonprofits, those with revenues of more than $50 million report
statistically significantly more success with planned giving than their peers from other types of
organizations. In fact, the very largest organizations expect this success to continue six months
from now. These organizations report success with major gifts and direct mail and less success
with Internet, corporate, and e-mail giving. Fundraisers from the largest nonprofits are the most
optimistic about their success with major gifts and planned giving and least optimistic about their
success with Internet and corporate giving six months from now.

24
Results of Fundraising Techniques by Donor Base
Success rates with fundraising techniques also vary by the location of the organization‟s donor
base. Table 8 outlines the percentage of fundraisers reporting success with various fundraising
techniques by where their donor base is located. Table 9 presents predicted success rates six
months from now. „*‟ Denotes whether or not there were statistical differences within each
column as well as the level of significance.
Table 8: The Percentage of Respondents Reporting Success with Fundraising Techniques by Location
of Donor Base (%)
Direct
Mail Telephone
Special
Events
Planned
Giving
Major
Gifts Corporate Foundation E-mail Internet
Local 60 25 73.9*** 41.3*** 61.7 32.6 51.1 15.9 20.5
Regional 76.3 31.6 50 68.4 64.9 34.2 50 10.5 18.4
National 82.9 61.8 22.6 82.9 77.1 23.5 41.2 39.4 50
Total 72 37.9 52.2 62.2 67.2 30.5 47.9 20.9 28.4
Note: Statistical significance tests determined by the means
Note: * indicates statistical significance *p<.05, **p<.01, ***p<.001
Table 9: The Percentage of Respondents Predicting Success with Fundraising Techniques Six Months
from Now by Location of Donor Base (%)
Direct
Mail Telephone
Special
Events
Planned
Giving
Major
Gifts Corporate Foundation E-mail Internet
Local 55.3 35.6 68.1** 55.3** 71.7 41.3 46.8 35.6 34.1
Regional 68.4 44.7 54.1 71.1 76.3 36.8 57.9 23.7* 24.3*
National 82.9 64.7 33.3 88.6 82.9 26.5 47.1 47.1 52.9
Total 67.5 47 53.8 70 76.5 35.6 50.4 35 36.5
Note: Statistical significance tests determined by the means
Note: * indicates statistical significance *p<.05, **p<.01, ***p<.001
Local Donor Base
Fundraisers from organizations with a local donor base report statistically significantly more
success with special events, higher than all other organizations. However, they reported
statistically significantly less success with planned giving than their peers from other
organizations. They reported the least success with e-mail, telephone and Internet fundraising.
Development officers with a local donor base are expecting to have the most success with major
gifts and special events and the least success with e-mail and telephone fundraising six months
from now. In our sample, organizations with local donor bases were the most likely to be
involved in a capital campaign (36.2 percent).
Regional Donor Base
Development officers from organizations with a regional donor base report the most success with
planned giving and direct mail. The least successful techniques reported were e-mail and
telephone solicitations. They predict that e-mail and Internet giving will continue to be the least
successful techniques for fundraising; however this is statistically significant from what they are
currently experiencing. Planned giving and major gifts will continue to be the most successful
fundraising techniques in the next six months.

25
National Donor Base
Organizations with a national donor base had the most success of all organizations with direct
mail, major gifts and planned giving, and this success is expected to continue six months from
now. Fundraisers had more success with e-mail and Internet solicitations than corporate gifts.
Fundraisers from organizations with national donor bases predict that planned giving will
continue to be the most successful technique while corporate gifts and special events will be the
least successful six months from now.
For further information please contact:
Reema T. Bhakta
The Center on Philanthropy at Indiana University
550 West North Street, Suite 301
Indianapolis, IN 46202-3272
(317) 278-8996
http://www.philanthropy.iupui.edu
Also for a copy of previous PGI studies, please go to www.philanthropy.iupui.edu
PGI Summer 2009 – The Economy
PGI December 2008 – The Economy
PGI Summer 2008 – Special Events
PGI December 2007 – Planned Giving
PGI Summer 2007 – Internet Fundraising
PGI December 2006 – Pension Protection Act
PGI Summer 2006 – Fundraising after Gulf Coast Hurricanes