phil steelesplus.philsteele.com/inside_the_pressbox/2017/nfl/week_03/itpb_nfl... · phil steeles i...
TRANSCRIPT

The Perfect Complementto Phil Steele’s
INSIDE THE PRESSBOXCOLLEGE
PHIL STEELE’SInside the Pressbox
BEST BETS in green
301 LA RAMS 8:25 p.m. Thursday NFL302 SAN FRANCISCO 461 BALTIMORE 9:30 a.m. London, Eng.462 JACKSONVILLE 463 CLEVELAND 1:00 p.m.464 INDIANAPOLIS 465 PITTSBURGH 1:00 p.m.466 CHICAGO
467 MIAMI 1:00 p.m.468 NY JETS469 DENVER 1:00 p.m.470 BUFFALO 471 HOUSTON 1:00 p.m.472 NEW ENGLAND 473 NEW ORLEANS 1:00 p.m.474 H CAROLINA
475 TAMPA BAY 1:00 p.m.476 MINNESOTA477 ATLANTA 1:00 p.m.478 DETROIT479 NY GIANTS 1:00 p.m.480 H PHILADELPHIA 481 SEATTLE 4:05 p.m.482 TENNESSEE
483 H KANSAS CITY 4:25 p.m.484 LA CHARGERS 485 CINCINNATI 4:25 p.m.486 GREEN BAY 487 OAKLAND 8:30 p.m. NBC488 WASHINGTON489 DALLAS 8:30 p.m. Monday ESPN490 ARIZONA

LAR FOE LAR FOE DATE FOE SCORE W/L OFF DEF ST OFF DEF ST SF FOE SF FOE DATE FOE SCORE W/L OFF DEF ST OFF DEF ST0-0 0-0 96 98 95.4 #5 69.1 #62 9/10 46-9 W 31 13 2 14 32 20 0-0 0-0 98 100 80.4 #50 89.9 #18 9/10 3-23 L 30 31 22 7 8 141-0 0-1 100 95 79.9 #53 89.4 #20 9/17 20-27 L 30 11 2 20 28 9 0-1 0-1 98 104 85.2 #35 83.9 #39 9/17 9-12 L 31 30 22 18 1 161-1 0-2 96 91 9/21 26 11 2 31 29 22 0-2 1-1 96 96 9/21 31 29 22 26 11 2
1-1 99 10/1 9 27 17 #23 #16 1-1 98 10/1 9 27 171-1 101 10/8 21 1 16 #7 #31 0-2 94 10/8 21 1 161-1 97 10/15 19 13 21 #10 #32 1-1 98 10/15 19 13 211-1 98 10/22 23 14 29 #3 #31 1-1 99 10/22 23 14 29
10/29 #8 #20 1-1 102 10/29 14 28 90-2 98 11/5 28 8 13 #30 #24 1-1 98 11/5 28 8 131-1 97 11/12 30 5 27 #3 #7 0-2 98 11/12 30 5 271-1 100 11/19 17 3 26 #13 #10 11/190-2 96 11/26 5 32 10 #11 #10 1-1 101 11/26 5 32 101-1 98 12/3 23 14 29 #9 #24 0-2 93 12/3 23 14 291-1 102 12/10 10 16 1 #9 #28 1-1 97 12/10 10 16 11-1 101 12/17 21 1 16 0 -1 1-1 102 12/17 21 1 161-1 102 12/24 6 15 24 10.68 Off YPP 38.75 1-1 97 12/24 6 15 240-2 91 12/31 31 29 22 #3 Off YPP Rank #31 1-1 96 12/31 31 29 22
16.94 Def YPP 17.11#11 Def YPP Rank #10
Comp Yds Comp Yds Comp Yds Comp YdsYds FD QBR TO's FD RA-RY YPC Att Pass Sks FD RA-RY YPC Att Pass Sks Yds FD QBR TO's FD RA-RY YPC Att Pass Sks FD RA-RY YPC Att Pass Sks
Indianapolis 46-9 148 9 87.9 2 19 33-63 1.9 22-30 310 1 10 24-75 3.1 11-21 150 4 Carolina 3-23 -70 -7 -17.0 0 13 15-51 3.4 24-35 166 4 20 38-116 3.1 14-25 171 0 Washington 20-27 -53 -7 -7.1 -2 14 21-92 4.4 16-26 240 2 21 39-229 5.9 18-27 156 2 at Seattle 9-12 -64 -10 -32.7 -1 11 19-159 8.4 15-27 89 2 21 37-131 3.5 23-39 181 3at San Francisco LA Ramsat Dallas at Arizona Seattle at Indianapolisat Jacksonville at Washington Arizona Dallasat Bye at Philadelphiaat NY Giants Arizona Houston NY Giantsat Minnesota at Bye New Orleans Seattleat Arizona at Chicago Philadelphia at Houston at Seattle Tennesseeat Tennessee Jacksonville San Francisco at LA Rams
Average 33-18 47.5 0.0 38.4 0 17 27-78 2.9 19-28 275 5.4% 16 32-152 4.8 15-24 153 12.5% Average 6-18 -67.0 0.0 -22.7 -1 12 17-105 6.2 20-31 128 9.7% 21 38-124 3.3 19-32 176 4.7% Vs NFC West 0-0 0.0 0.0 0.0 0 0 0-0 0.0 0-0 0 0.0% 0 0-0 0.0 0-0 0 0.0% Vs NFC West 9-12 -64.0 -10.0 -32.7 -1 11 19-159 8.4 15-27 89 7.4% 21 37-131 3.5 23-39 181 7.7%
Away 0-0 0.0 0.0 0.0 0 0 0-0 0.0 0-0 0 0.0% 0 0-0 0.0 0-0 0 0.0% Home 3-23 -70.0 -7.0 -17.0 0 13 15-51 3.4 24-35 166 11.4% 20 38-116 3.1 14-25 171 0.0%
Indianapolis -3.5/41.5 Jeff Goff 21-29-306-1-0 Todd Gurley 19-40-2.1-1 Cooper Kupp 4-76-19.0-1 Carolina +4.5/47.5 Brian Hoyer 24-35-193-0-1 Carlos Hyde 9-45-5.0-0 Pierre Garcon 6-81-13.5-0 Washington -2.5/45.5 Jeff Goff 15-25-224-1-1 Todd Gurley 16-88-5.5-1 Gerald Everett 3-95-31.7-0 at Seattle +13.5/41.5 Brian Hoyer 15-27-99-0-1 Carlos Hyde 15-124-8.3-0 Pierre Garcon 3-26-8.7-0at San Francisco vs. LA Ramsat Dallas at Arizona Seattle at Indianapolisat Jacksonville vs. at Washington Arizona Dallasat Bye at Philadelphiaat NY Giants vs. Arizona Houston NY Giantsat Minnesota at Bye New Orleans vs. Seattleat Arizona at Chicago Philadelphia at Houston at Seattle vs. Tennesseeat Tennessee Jacksonville San Francisco at LA Rams
vs.
Jeff Goff 36-54-530-2-1 Todd Gurley 35-128-3.7-2 Gerald Everett 4-134-33.5-0 vs. Brian Hoyer 39-62-292-0-2 Carlos Hyde 24-169-7.0-0 Pierre Garcon 9-107-11.9-0Johnny Hekker 1-1-28-0-0 Malcolm Brown 7-16-2.3-1 Cooper Kupp 7-109-15.6-1 Matt Breida 8-46-5.8-0 Carlos Hyde 9-51-5.7-0Sean Mannion 1-1-12-0-0 Tavon Austin 4-14-3.5-0 Todd Gurley 8-104-13.0-1 Marquise Goodwin 6-47-7.8-0
vs. CategoryLine Score Yds FD Rush TO's
LA Rams -2.5 0 185 10 23-65SAN FRANCISCO 43 28 320 28 42-150 1 vs.
Line Score Yds FD Rush TO'sLA Rams -5 21 177 13 29-99SAN FRANCISCO 39.5 22 323 21 29-70 0 vs.
Line Score Yds FD Rush TO'sSt Louis -8 27 388 16 41-197SAN FRANCISCO 40.5 6 189 11 21-38 1
Line Score Yds FD Rush TO'sSt Louis -3 16 364 21 33-133SAN FRANCISCO 39 19 458 21 33-108 -1
Line Score Yds FD Rush TO'sSt Louis 43.5 17 309 19 24-93San Francisco -3 31 432 17 30-89 0
Indianapolis Washingtonat San Francisco
FOE
San Francisco 49ers49ers LogsRams Logs
OVERALL: OVERALL:
Vs NFC West1-1 0-2
Vs NFC West
Los Angeles Rams
ScoreDefenseOffenseRams Net Stats
--PS RANK--LARFOE
GAME GRADESRECORD PLUS/MINUSLAR
RECORD
Score DefSks ByYpg Diff
Sks Allowed
NFL RANKINGS
San Francisco
Pass Def
Score Off
CarolinaSF
LA Rams By 2.0
Phil's Forecast:
Rushing
Team & Margin
FOESF --PS RANK--PLUS/MINUS
Defense
GAME GRADESFOE
San Francisco Season LeadersSF SPECIAL TMS
LAR SPECIAL TMS
1.38
0-10-0
Total Off
Total Def
Rush Off
Los Angeles
Rush Def
2017 CURRENT RANKINGS
Pass Off
0.40SF DEF LINE
SF RB's
0.69LAR DEF LINE
SF OFF LINE
0.66LAR SECONDARY
SF QB/WR
LAR KICKER
0.18SF COACHES
LAR COACHES
SF KICKER
POSITIONAL EDGE AWARDED TO:
By 3.93 Points
Projected Final Score
ChiefsFuture Schedule Strength
SF LB's
Projected Box Score2016 Comp-Att-Yds
LAR RB's0.19
0.86LAR LB'S
LAR OFF LINE
0.15
Los Angeles Season Leaders
Last Five Meetings (Last 16 years at PhilSteele.com)
Retu
rn t
o T
ab
le o
f C
on
ten
ts
Projected Rushing107 yards Los Angeles San Francisco 132 yards
20 points
14-23-191
#29 Los Angeles San Francisco #27
285 yards
San FranciscoLos Angeles
Los Angeles San FranciscoTeam Schedule Strength
#31 #9
Los Angeles San Francisco
Projected Passing0.574.51Los Angeles San Francisco 149 yards
Projected Yardage Total178 yards
281 yards
LAR TOTAL PTS
Los Angeles
SF TOTAL PTS
17 points
0.58LAR QB/WR
SF SECONDARY
Position by Position Edges By Game Yardage Leaders PassingSan FranciscoLos Angeles
By Game Yardage Leaders Passing Rushing Receiving
Los
An
gele
s R
am
s
Weekly
Lead
ers
& T
eam
Ave
rag
es
San
Fra
nci
sco
49
ers
Offense49ers Net StatsScore
LA Rams 285 - 281
Game Grade
Phil Steele
Weather: Clear, Mid 60's, Winds 10-15 mph - The 49ers haven't reached the EZ yet this ssn in matchups against CAR & SEA. The Rams meanwhile are a favorite for the 3rd consecutive week with a win in the opener vs IND and a loss to WAS LW. While the 49ers earned their only 2 wins of a season ago against the Rams, I feel that the Rams are the stronger team on both sides of the ball and will agree with my computer's forecast to the left.
LA Rams By 2.5
Las Vegas Total39.5 Points
+/- Ratings
Las Vegas Line
Receiving
Computer PointsLA Rams 20 - 17
LA Rams By 3 LA RAMS 20 SAN FRANCISCO 17
LA Rams By 1.9
Computer Yards
at Dallas Seattleat Jacksonville Arizonaat Byeat NY Giants Houston at Minnesota New Orleansat Arizona Philadelphia
at Seattle LA Ramsat Arizonaat Indianapolisat Washington Dallasat Philadelphia Arizona NY Giantsat Bye Seattleat Chicagoat Houston Tennessee Jacksonville
at Seattle Total TO'sat Tennessee San Francisco at LA Rams
17-35-13022-35-170
2016 Comp-Att-Yds11-24-9028-38-266
2015 Comp-Att-Yds
20-41-1622015 Comp-Att-Yds
22-38-23128-44-354
2014 Comp-Att-Yds21-42-21622-35-343

BAL FOE BAL FOE DATE FOE SCORE W/L OFF DEF ST OFF DEF ST JAX FOE JAX FOE DATE FOE SCORE W/L OFF DEF ST OFF DEF ST0-0 0-0 100 100 95.3 #6 75.9 #60 9/10 20-0 W 23 18 8 19 10 18 0-0 0-0 97 100 97.4 #2 74.5 #61 9/10 29-7 W 22 11 21 25 4 271-0 0-1 105 94 88.4 #23 82.4 #46 9/17 24-10 W 23 12 8 28 24 19 1-0 0-1 102 97 78.4 #56 95.9 #4 9/17 16-37 L 21 6 21 9 17 242-0 1-1 105 97 9/24 20 10 8 19 13 21 1-1 2-0 97 105 9/24 19 13 21 20 10 8
2-0 108 10/1 2 6 23 #3 #9 0-2 88 10/1 2 6 232-0 106 10/8 4 25 6 #30 #26 2-0 108 10/8 4 25 60-2 93 10/15 25 21 28 #22 #23 1-1 96 10/15 25 21 281-1 100 10/22 17 3 26 #13 #12 0-2 94 10/22 17 3 261-0 99 10/26 22 22 4 #8 #1 10/291-1 102 11/5 6 15 24 #12 #29 0-2 93 11/5 6 15 24
11/12 #17 #4 0-2 96 11/12 14 28 91-1 103 11/19 7 23 31 #11 #9 0-2 94 11/19 7 23 311-1 97 11/27 30 5 27 #2 #20 1-1 98 11/26 30 5 272-0 103 12/3 16 24 5 #4 #1 0-2 94 12/3 16 24 52-0 108 12/10 2 6 23 #17 #18 1-1 101 12/10 2 6 230-2 94 12/17 24 26 19 7 2 1-1 97 12/17 24 26 190-2 94 12/23 29 30 20 13.75 Off YPP 13.11 0-2 91 12/24 29 30 200-2 93 12/31 27 7 18 #10 Off YPP Rank #8 1-1 102 12/31 27 7 18
100.00 Def YPP 13.48#1 Def YPP Rank #28
Comp Yds Comp Yds Comp Yds Comp YdsYds FD QBR TO's FD RA-RY YPC Att Pass Sks FD RA-RY YPC Att Pass Sks Yds FD QBR TO's FD RA-RY YPC Att Pass Sks FD RA-RY YPC Att Pass Sks
at Cincinnati 20-0 47 3 42.6 4 17 42-157 3.7 9-17 111 1 14 22-77 3.5 16-31 144 5 at Houston 29-7 77 -4 23.7 4 19 39-155 4.0 11-21 125 0 23 23-93 4.0 19-36 110 10 Cleveland 24-10 -49 4 57.4 3 24 32-136 4.3 25-34 201 2 20 21-93 4.4 20-42 293 3 Tennessee 16-37 -80 -1 -14.7 -2 20 25-99 4.0 20-34 211 2 21 36-179 5.0 15-27 211 1† Jacksonville Baltimore Pittsburgh at NY Jetsat Oakland at Pittsburgh Chicago LA Ramsat Minnesota at Indianapolis Miami at Byeat Tennessee Cincinnatiat Bye LA Chargersat Green Bay at Cleveland Houston at Arizona Detroit Indianapolisat Pittsburgh Seattleat Cleveland Houston Indianapolis at San Francisco Cincinnati at Tennessee
Average 22-5 -1.0 0.0 53.5 7 21 37-147 4.0 17-26 156 5.9% 17 22-85 4.0 18-37 219 11.0% Average 23-22 -1.5 0.0 2.9 2 20 32-127 4.0 16-28 168 3.6% 22 30-136 4.6 17-32 161 17.5% Vs AFC North 22-5 -1.0 3.5 53.5 7 21 37-147 4.0 17-26 156 5.9% 17 22-85 4.0 18-37 219 11.0% Vs AFC South 23-22 -1.5 -2.5 2.9 2 20 32-127 4.0 16-28 168 3.6% 22 30-136 4.6 17-32 161 17.5%
Away 20-0 47.0 3.0 42.6 4 17 42-157 3.7 9-17 111 5.9% 14 22-77 3.5 16-31 144 16.1% Home 16-37 -80.0 -1.0 -14.7 -2 20 25-99 4.0 20-34 211 5.9% 21 36-179 5.0 15-27 211 3.7%
at Cincinnati +3/41 Joe Flacco 9-17-121-1-1 Terrance West 19-80-0.0-1 Jeremy Maclin 2-56-0.0-1 at Houston -5/39 Blake Bortles 11-21-125-1-0 Leonard Fournette 26-100-0.0-1 Allen Hurns 3-42-0.0-0 Cleveland -7.5/39 Joe Flacco 25-34-217-2-1 Javorius Allen 14-66-0.0-0 Benjamin Watson 8-91-0.0-0 Tennessee +1/41.5 Blake Bortles 20-34-223-1-2 Leonard Fournette 14-40-0.0-1 Allen Hurns 6-82-0.0-1† Jacksonville vs. Baltimore Pittsburgh at NY Jetsat Oakland at Pittsburgh Chicago vs. LA Ramsat Minnesota at Indianapolis Miami at Byeat Tennessee vs. Cincinnatiat Bye LA Chargersat Green Bay at Cleveland Houston vs. at Arizona Detroit Indianapolisat Pittsburgh Seattleat Cleveland vs. Houston Indianapolis at San Francisco Cincinnati at Tennessee
vs.
Joe Flacco 34-51-338-3-2 Javorius Allen 35-137-3.9-0 Benjamin Watson 8-91-11.4-0 vs. Blake Bortles 31-55-348-2-2 Leonard Fournette 40-140-3.5-2 Allen Hurns 9-124-13.8-1Terrance West 27-102-3.8-2 Jeremy Maclin 6-87-14.5-2 Chris Ivory 15-59-3.9-0 Marqise Lee 7-76-10.9-0Alex Collins 7-42-6.0-0 Javorius Allen 5-35-7.0-1 Blake Bortles 7-42-6.0-0 Leonard Fournette 5-45-9.0-0
vs. CategoryLine Score Yds FD Rush TO's
Baltimore -2.5 19 283 18 22-84JACKSONVILLE 45.5 17 216 14 21-48 0 vs.
Line Score Yds FD Rush TO'sBaltimore -5.5 20 397 22 21-89JACKSONVILLE 47.5 22 258 22 22-90 3 vs.
Line Score Yds FD Rush TO'sBaltimore -14 20 314 17 26-93Jacksonville 44.5 12 248 13 23-82 0
By 3.83 Points Baltimore By 1 BALTIMORE 17 JACKSONVILLE 16
39.5 Points
Baltimore By 5.0
Baltimore By 1.0
Computer Yards
Baltimore
POSITIONAL EDGE AWARDED TO:
Computer PointsTeam Schedule Strength
#32#9 Baltimore Jacksonville
#32 Baltimore Jacksonville #18Future Schedule Strength
Projected Rushing89 yards Baltimore Jacksonville 96 yards
Projected Passing171 yards
Phil's Forecast:
ReceivingRushingPassing
34-45-316
Baltimore By 3.5
Team & Margin
2015 Comp-Att-Yds
By Game Yardage Leaders
24-38-194JAX COACHES
1.57BAL COACHES
Baltimore 5.22BAL TOTAL PTS
196 yards 1.38JAX TOTAL PTS
JAX KICKER
Game Grade
+/- Ratings
Projected Yardage Total
Baltimore19 pointsProjected Final Score
292 yardsJacksonvilleBaltimore260 yards
18 pointsJacksonville
Jacksonville
Projected Box Score
BAL SPECIAL TMS
Baltimore Season Leaders JAX SPECIAL TMS
0.57
1.58BAL KICKER
Last Five Meetings (Last 16 years at PhilSteele.com)
Retu
rn t
o T
ab
le o
f C
on
ten
ts
0.72
JAX QB/WR
BAL SECONDARY0.78
0.21
JAX RB's
BAL LB'S
BAL OFF LINE
JAX OFF LINE
BAL DEF LINE
BAL QB/WR
JAX LB's
0.22BAL RB's
Defense
Passing ReceivingRushing
FOEJAX FOE
Jaguars Net Stats Offense Defense
PLUS/MINUS GAME GRADES JAX --PS RANK--
Weather: 70 degrees and clear. London England: The Ravens are off a pair of divisional wins and making their first trip to London. The Jaguars head to England for a 5th straight year winning the last 2. JAX beat BAL in '15 and the Ravens needed a 54-yard field goal with 1:04 left to win by 2 LY. Talent-wise I like JAX to stay within the line in this one and my computer agrees.
Baltimore 19 - 18
Jacksonville 292 - 260
Phil Steele
Las Vegas Total
JAX DEF LINE
0.81
Score
Position by Position Edges
JAX SECONDARY
0.14
By Game Yardage Leaders
Balt
imo
re R
ave
ns
Jack
son
ville J
ag
uars
Jacksonville Season Leaders
Las Vegas Line
Weekly
Lead
ers
& T
eam
Ave
rag
es
RECORDNFL RANKINGS
Baltimore Jacksonville
BAL FOE1-1
Vs AFC South Jaguars LogsRECORD PLUS/MINUS GAME GRADES BAL --PS RANK-- FOE 2-0
Ravens
at Cincinnati 2017 CURRENT RANKINGS at Houston Cleveland
Baltimore Jacksonville Tennessee
† Jacksonville Baltimore Pittsburgh Rush Off at NY Jetsat Oakland Pass Off at Pittsburgh Chicago Total Off LA Ramsat Minnesota Score Off at Indianapolis Miami Sks Allowed at Byeat Tennessee Rush Def Cincinnatiat Bye Pass Def LA Chargersat Green Bay Total Def at Cleveland Houston Score Def at Arizona Detroit Sks By Indianapolis
Ypg Diff Seattleat Cleveland Total TO's Houston Indianapolis at San Francisco Cincinnati at Tennessee
Baltimore Ravens OVERALL: OVERALL: Jacksonville Jaguars2-0 1-1Ravens Logs Vs AFC North
2016 Comp-Att-Yds29-40-214
Ravens Net Stats OffenseScore
at Pittsburgh
22-45-1882014 Comp-Att-Yds
20-30-22122-38-166

CLE FOE CLE FOE DATE FOE SCORE W/L OFF DEF ST OFF DEF ST IND FOE IND FOE DATE FOE SCORE W/L OFF DEF ST OFF DEF ST0-0 0-0 93 108 87.9 #27 87.5 #28 9/10 18-21 L 26 26 19 1 12 23 0-0 0-0 98 96 69.1 #62 95.4 #5 9/10 9-46 L 14 32 20 31 13 20-1 1-0 94 105 82.4 #46 88.4 #23 9/17 10-24 L 28 24 19 23 12 8 0-1 0-1 94 98 81.7 #47 84.3 #38 9/17 13-16 L 24 32 20 14 18 290-2 0-2 94 94 9/24 24 26 19 29 30 20 0-2 0-2 94 94 9/24 29 30 20 24 26 19
0-2 93 10/1 27 7 18 #25 #24 1-1 101 10/1 27 7 180-2 88 10/8 32 31 32 #14 #25 0-2 91 10/8 32 31 321-1 97 10/15 30 5 27 #18 #29 1-1 102 10/16 30 5 271-1 102 10/22 6 15 24 #24 #27 1-1 97 10/22 6 15 241-1 100 10/29 17 3 26 #31 #27 0-2 93 10/29 17 3 26
11/5 #13 #7 1-1 97 11/5 14 28 92-0 103 11/12 16 24 5 #19 #29 2-0 108 11/12 16 24 51-1 97 11/19 19 13 21 #18 #28 11/190-2 93 11/26 27 7 18 #22 #29 1-1 102 11/26 27 7 180-2 96 12/3 13 18 30 #24 #14 1-1 97 12/3 13 18 301-1 103 12/10 7 23 31 #19 #31 1-1 97 12/10 7 23 312-0 105 12/17 20 10 8 -3 -2 2-0 105 12/14 20 10 80-2 93 12/24 25 21 28 22.25 Off YPP 22.32 2-0 105 12/23 25 21 282-0 108 12/31 2 6 23 #24 Off YPP Rank #25 1-1 97 12/31 2 6 23
13.93 Def YPP 12.29#22 Def YPP Rank #32
Comp Yds Comp Yds Comp Yds Comp YdsYds FD QBR TO's FD RA-RY YPC Att Pass Sks FD RA-RY YPC Att Pass Sks Yds FD QBR TO's FD RA-RY YPC Att Pass Sks FD RA-RY YPC Att Pass Sks
Pittsburgh 18-21 -53 4 -9.3 0 20 25-57 2.3 20-30 180 7 16 17-35 2.1 24-36 255 1 at LA Rams 9-46 -148 -9 -87.9 -2 10 24-75 3.1 11-21 150 4 19 33-63 1.9 22-30 310 1at Baltimore 10-24 49 -4 -57.4 -3 20 21-93 4.4 20-42 293 3 24 32-136 4.3 25-34 201 2 Arizona 13-16 -123 1 -22.0 0 18 29-76 2.6 20-37 190 4 17 25-83 3.3 19-36 306 4at Indianapolis Cleveland Cincinnati at Seattle NY Jets San Franciscoat Houston at Tennessee Tennessee Jacksonville Minnesota at Cincinnatiat Bye at Houston at Detroit Pittsburgh Jacksonville at Byeat Cincinnati Tennesseeat LA Chargers at Jacksonville Green Bay at Buffalo Baltimore Denverat Chicago at Baltimoreat Pittsburgh Houston
Average 14-23 -2.0 0.0 -37.2 -3 20 23-75 3.3 20-36 237 13.9% 20 25-86 3.5 25-35 228 4.3% Average 11-31 -135.5 0.0 -50.3 -2 14 27-76 2.8 16-29 170 13.8% 18 29-73 2.5 21-33 308 7.6% Vs AFC North 14-23 -2.0 0.0 -37.2 -3 20 23-75 3.3 20-36 237 13.9% 20 25-86 3.5 25-35 228 4.3% Vs AFC South 0-0 0.0 0.0 0.0 0 0 0-0 0.0 0-0 0 0.0% 0 0-0 0.0 0-0 0 0.0%
Away 10-24 49.0 -4.0 -57.4 -3 20 21-93 4.4 20-42 293 7.1% 24 32-136 4.3 25-34 201 5.9% Home 13-16 -123.0 1.0 -22.0 0 18 29-76 2.6 20-37 190 10.8% 17 25-83 3.3 19-36 306 11.1%
Pittsburgh +9/47 DeShone Kizer 20-30-222-1-1 Isaiah Crowell 17-33-0.0-0 Corey Coleman 5-53-0.0-1 at LA Rams +3.5/41.5 Scott Tolzien 9-18-128-0-2 Frank Gore 10-42-4.2-0 TY Hilton 3-57-19.0-0at Baltimore +7.5/39 DeShone Kizer 15-31-182-0-3 Isaiah Crowell 10-37-0.0-0 Rashard Higgins 7-95-0.0-0 Arizona +7/44 Jacoby Brissett 20-37-216-0-1 Frank Gore 14-46-3.3-1 Jack Doyle 8-79-9.9-0at Indianapolis vs. Cleveland Cincinnati at Seattle NY Jets San Franciscoat Houston vs. at Tennessee Tennessee Jacksonville Minnesota at Cincinnatiat Bye vs. at Houston at Detroit Pittsburgh Jacksonville at Byeat Cincinnati vs. Tennesseeat LA Chargers at Jacksonville Green Bay at Buffalo Baltimore vs. Denverat Chicago at Baltimoreat Pittsburgh Houston
vs.
DeShone Kizer 35-61-404-1-4 Isaiah Crowell 27-70-2.6-0 Seth DeValve 6-103-17.2-0 vs. Jacoby Brissett 22-40-267-0-1 Frank Gore 24-88-3.7-1 Jack Doyle 10-120-12.0-0Kevin Hogan 5-11-118-1-1 DeShone Kizer 10-43-4.3-1 Rashard Higgins 7-95-13.6-0 Scott Tolzien 9-18-128-0-2 Jacoby Brissett 6-22-3.7-0 TY Hilton 7-106-15.1-0
Duke Johnson Jr 4-21-5.3-0 Duke Johnson 5-79-15.8-0 Marlon Mack 16-21-1.3-1 Donte Moncrief 3-68-22.7-0vs. Category
Line Score Yds FD Rush TO'sCleveland 49.5 24 248 14 32-115Indianapolis -3 25 362 23 20-93 -2 vs.
Line Score Yds FD Rush TO'sCleveland 46 13 319 19 17-55Indianapolis -1 17 321 21 37-148 -1 vs.
CLE FOECLE
Projected Rushing105 yards Cleveland Indianapolis 88 yards
OVERALL: OVERALL:0-2
Vs AFC North Vs AFC South0-2
FOE 0-2 0-0Browns Logs
RECORD PLUS/MINUS GAME GRADES --PS RANK--
0.25CLE RB's
0.27
Cleveland Season Leaders
IND OFF LINE
CLE LB'S
0.90
0.59
PLUS/MINUSRECORD
IND LB's
Passing
Phil's Forecast:
Cleveland 324 - 297
GAME GRADES --PS RANK-- FOE
Rushing Receiving
IND
Cleveland By 6.7
Colts LogsIndianapolis Colts
Offense Defense
+/- RatingsIndianapolis By 3.0
NFL RANKINGS IND FOE
By Game Yardage Leaders Passing Rushing Receiving
Ind
ian
ap
olis
Co
lts
By Game Yardage Leaders
Browns Net Stats Offense Defense
Position by Position Edges
Cle
vela
nd
Bro
wn
s
Weekly
Lead
ers
& T
eam
Ave
rag
es
Colts Net StatsScore
Cleveland IndianapolisCLE QB/WR
0.24IND SECONDARY
1.30IND QB/WR
CLE SECONDARY
IND DEF LINE
CLE OFF LINE
IND RB's
CLE DEF LINE
Projected Box Score
Indianapolis Season Leaders0.11
CLE SPECIAL TMS
IND SPECIAL TMSCLE KICKER
IND TOTAL PTSProjected Yardage Total219 yards Cleveland Indianapolis 210 yards
41 PointsLas Vegas Total
IND KICKERLas Vegas Line
0.89 Team & Margin
IND COACHES2012 Comp-Att-Yds
13-30-13324-53-269
324 yards ClevelandProjected Final Score
21 points Cleveland Indianapolis
Indianapolis
Retu
rn t
o T
ab
le o
f C
on
ten
ts
Team Schedule Strength#2 Cleveland Indianapolis #29
Indianapolis 297 yards
Projected Passing
Computer Yards
Future Schedule Strength
Computer PointsIndianapolis18 points
POSITIONAL EDGE AWARDED TO:Game Grade
3.252.13CLE TOTAL PTS
By 1.13 Points Cleveland By 3 CLEVELAND 21 INDIANAPOLIS 18Phil Steele
Weather: Dome. The Browns just took on a pair of probable playoff teams in the Steelers and Ravens, but have only been outgained by just two yards per game. Indianapolis is a different team without Andrew Luck. They took on two probable non-playoff teams in the Rams and Cardinals and were outgained by 136 yards per game. With Luck out again the Browns are the stronger team, but they have been an away favorite just once in the last five years and lost that game 24-6 to Jacksonville (2014). The Colts have allowed eight sacks this year, but the Browns’ offensive line hasn’t fared any better by giving up 10. There are questions on both sides, but I will agree with my computer and call for the Browns to grab a rare win.
CLE COACHES0.82
Cleveland By 1.5
Cleveland 21 - 18Colts
Pittsburgh 2017 CURRENT RANKINGS at LA Ramsat Baltimore
Cleveland Indianapolis Arizona
at Indianapolis Cleveland Cincinnati Rush Off at Seattle NY Jets Pass Off San Franciscoat Houston Total Off at Tennessee Tennessee Score Off Jacksonville Minnesota Sks Allowed at Cincinnatiat Bye Rush Def at Houston at Detroit Pass Def Pittsburgh Jacksonville Total Def at Byeat Cincinnati Score Def Tennesseeat LA Chargers Sks By at Jacksonville
Ypg Diff at Buffalo Baltimore Total TO's Denverat Chicago at Baltimoreat Pittsburgh Houston
2014 Comp-Att-YdsLast Five Meetings (Last 16 years at PhilSteele.com)
Score
Cleveland Browns
Green Bay
25-41-26416-29-173
#25#24 Cleveland

PIT FOE PIT FOE DATE FOE SCORE W/L OFF DEF ST OFF DEF ST CHI FOE CHI FOE DATE FOE SCORE W/L OFF DEF ST OFF DEF ST0-0 0-0 108 93 87.5 #28 87.9 #27 9/10 21-18 W 1 12 23 26 26 19 0-0 0-0 96 107 85.2 #36 88.0 #26 9/10 17-23 L 21 22 28 2 15 251-0 1-0 106 102 96.1 #3 83.8 #40 9/17 26-9 W 2 7 23 17 2 26 0-1 0-0 96 99 79.2 #55 90.8 #15 9/17 7-29 L 22 21 28 15 20 122-0 0-2 108 93 9/24 2 6 23 25 21 28 0-2 2-0 93 108 9/24 25 21 28 2 6 23
2-0 105 10/1 20 10 8 #29 #26 1-1 103 9/28 20 10 81-1 97 10/8 19 13 21 #11 #15 1-1 100 10/9 19 13 212-0 107 10/15 8 9 3 #16 #21 2-0 105 10/15 8 9 30-2 93 10/22 27 7 18 #11 #25 2-0 102 10/22 27 7 182-0 103 10/29 16 24 5 #8 #14 0-2 96 10/29 16 24 5
11/5 #8 #15 11/50-2 94 11/12 29 30 20 #5 #24 1-1 103 11/12 29 30 201-1 102 11/16 6 15 24 #3 #25 2-0 103 11/19 6 15 241-1 103 11/26 7 23 31 #6 #28 1-1 102 11/26 7 23 310-2 93 12/4 27 7 18 #2 #18 0-2 91 12/3 27 7 182-0 105 12/10 20 10 8 #3 #25 0-2 93 12/10 20 10 81-1 105 12/17 3 17 7 1 -3 2-0 103 12/16 3 17 71-1 97 12/25 30 5 27 13.30 Off YPP 25.46 0-2 94 12/24 30 5 270-2 94 12/31 24 26 19 #9 Off YPP Rank #28 1-1 100 12/31 24 26 19
17.56 Def YPP 13.13#7 Def YPP Rank #30
Comp Yds Comp Yds Comp Yds Comp YdsYds FD QBR TO's FD RA-RY YPC Att Pass Sks FD RA-RY YPC Att Pass Sks Yds FD QBR TO's FD RA-RY YPC Att Pass Sks FD RA-RY YPC Att Pass Sks
at Cleveland 21-18 53 -4 9.3 0 16 17-35 2.1 24-36 255 1 20 25-57 2.3 20-30 180 7 Atlanta 17-23 -71 2 -29.3 0 20 19-125 6.6 26-40 176 4 18 23-64 2.8 21-30 308 2 Minnesota 26-9 98 8 40.6 1 22 32-102 3.2 23-35 233 2 14 20-91 4.6 20-38 146 2 at Tampa Bay 7-29 -1 -3 -12.4 -3 19 16-20 1.3 31-45 290 1 22 34-117 3.4 18-31 194 2at Chicago Pittsburghat Baltimore at Green Bay Jacksonville Minnesotaat Kansas City at Baltimore Cincinnati Carolinaat Detroit at New Orleansat Bye at Byeat Indianapolis Green Bay Tennessee Detroit Green Bay at Philadelphiaat Cincinnati San Francisco Baltimore at Cincinnati New England at Detroitat Houston Cleveland Cleveland at Minnesota
Average 24-14 75.5 0.0 26.1 1 19 25-69 2.8 24-36 244 4.2% 17 23-74 3.3 20-34 163 13.2% Average 12-26 -36.0 0.0 -21.0 -3 20 18-73 4.1 29-43 233 5.9% 20 29-91 3.2 20-31 251 6.6% Vs AFC North 21-18 53.0 -4.0 9.3 0 16 17-35 2.1 24-36 255 2.8% 20 25-57 2.3 20-30 180 23.3% Vs NFC North 0-0 0.0 0.0 0.0 0 0 0-0 0.0 0-0 0 0.0% 0 0-0 0.0 0-0 0 0.0%
Away 21-18 53.0 -4.0 9.3 0 16 17-35 2.1 24-36 255 2.8% 20 25-57 2.3 20-30 180 23.3% Home 17-23 -71.0 2.0 -29.3 0 20 19-125 6.6 26-40 176 10.0% 18 23-64 2.8 21-30 308 6.7%
at Cleveland -9/47 Ben Roethlisberger 24-36-263-2-1 Le'Veon Bell 10-32-3.2-0 Antonio Brown 11-182-16.5-0 Atlanta +7/48.5 Mike Glennon 26-40-213-1-0 Tarik Cohen 5-66-13.2-0 Tarik Cohen 8-47-5.9-1 Minnesota -9.5/43.5 Ben Roethlisberger 23-35-243-2-0 Le'Veon Bell 27-87-3.2-0 Martavis Bryant 3-91-30.3-1 at Tampa Bay +7/44.5 Mike Glennon 31-45-301-1-2 Tarik Cohen 7-13-1.9-0 Kendall Wright 7-69-9.9-0at Chicago vs. Pittsburghat Baltimore at Green Bay Jacksonville Minnesotaat Kansas City vs. at Baltimore Cincinnati Carolinaat Detroit at New Orleansat Bye vs. at Byeat Indianapolis Green Bay Tennessee Detroit Green Bay vs. at Philadelphiaat Cincinnati San Francisco Baltimore at Cincinnati New England vs. at Detroitat Houston Cleveland Cleveland at Minnesota
vs.
Ben Roethlisberger 47-71-506-4-1 Le'Veon Bell 37-119-3.2-0 Antonio Brown 16-244-15.3-0 vs. Mike Glennon 57-85-514-2-2 Tarik Cohen 12-79-6.6-0 Kendall Wright 10-103-10.3-0James Conner 5-20-4.0-0 Martavis Bryant 5-105-21.0-1 Jordan Howard 22-59-2.7-1 Tarik Cohen 16-102-6.4-1Martavis Bryant 1-7-7.0-0 Jesse James 10-68-6.8-2 Michael Burton 1-7-7.0-0 Zach Miller 10-81-8.1-0
vs. CategoryLine Score Yds FD Rush TO's
Pittsburgh 41 23 459 21 21-80Chicago -2 40 258 15 28-107 5 vs.
vs.
0.17
0.55
0.22PIT SECONDARY
PIT LB'S
#21 Pittsburgh Chicago #4
14 points
CHI LB's
0.91PIT COACHES
CHI KICKER
PittsburghTeam Schedule StrengthChicago
PIT RB's
Computer Points
Phil SteeleBy 6.62 Points
1.96
Chicago
CHI OFF LINE
0.26
PittsburghPIT QB/WR
CHI SECONDARY
1.17
CHI RB's
PIT DEF LINE
PIT OFF LINE
CHI DEF LINE
Offense
--PS RANK-- FOE
Phil's Forecast:
Pittsburgh 22 - 14
Pittsburgh By 4 PITTSBURGH 21 CHICAGO 17
Weather: Mid 80's, clear. The Bears delivered in the opener as a seven point home ‘dog versus Atlanta while nearly winning the game outright. Last week I liked the Bears again, but they had three turnovers and a missed field goal. They surprisingly trailed 26-0 at the half despite only being outgained by a 149-121 margin. Last year Pittsburgh averaged 373 yards per game on offense, but with running back Le’Veon Bell just working himself back into shape, they have just 313 yards per game this year. The defense has registered nine sacks and allowed just 237 yards per game, but that was versus the Browns and a Vikings team missing Sam Bradford. Since 2012, the Steelers have had 41 games away from home and only 10 times have they won by more than seven points.
Pittsburgh By 12.0
Computer Yards
Pittsburgh By 6.6
Pittsburgh 313 - 262
ReceivingRushing
Defense
Vs AFC North Vs NFC North Bears LogsPittsburgh Steelers OVERALL: OVERALL: Chicago Bears2-0 0-2
RECORD PLUS/MINUS GAME GRADES CHIPIT --PS RANK-- FOE 1-0 0-0CHI FOE
RECORD PLUS/MINUS GAME GRADES
Defense
NFL RANKINGSPIT FOE
Steelers Net Stats
Pass Def
Green Bay Score Def
Baltimore Ypg Diff
By Game Yardage Leaders Passing Rushing Receiving Position by Position Edges By Game Yardage Leaders
Pit
tsb
urg
h S
teele
rs
Weekly
Lead
ers
& T
eam
Ave
rag
es
Ch
icag
o B
ears
Bears Net StatsScore
Passing
CHI QB/WR
Pittsburgh Season Leaders Chicago Season LeadersCHI SPECIAL TMS
0.91PIT KICKER
Last Five Meetings (Last 16 years at PhilSteele.com)Projected Box Score
0.46
Pittsburgh By 7
CHI COACHES 44 Points
Las Vegas Line
Las Vegas Total
Team & Margin
PIT SPECIAL TMS
0.00+/- Ratings
Game Grade313 yards Pittsburgh Chicago 262 yards
POSITIONAL EDGE AWARDED TO:Projected Final Score
CHI TOTAL PTS
Future Schedule Strength#8
6.62PIT TOTAL PTS
210 yards Pittsburgh Chicago 190 yardsProjected Passing
Projected Yardage Total
PittsburghProjected Rushing
Chicago 72 yards
Pittsburgh Chicago #4
Retu
rn t
o T
ab
le o
f C
on
ten
ts
22 points Pittsburgh
103 yards
Chargers
Atlanta Minnesota
Pittsburgh Chicagoat Tampa Bay
at Chicago Pittsburgh
at Cleveland 2017 CURRENT RANKINGS
at Green Bay Jacksonville Pass Off Minnesotaat Baltimore Rush Off
at Baltimore Cincinnati Score Off Carolinaat Kansas City Total Off
at New Orleansat Bye Rush Def at Byeat Detroit Sks Allowed
Green Bay Tennessee Total Def Detroitat Indianapolis
at Philadelphiaat Cincinnati Sks By San Francisco
at Cincinnati New England Total TO's at Detroitat Houston Cleveland Cleveland at Minnesota
2013 Comp-Att-Yds
ScoreOffense
Steelers Logs
26-41-37920-30-151

MIA FOE MIA FOE DATE FOE SCORE W/L OFF DEF ST OFF DEF ST NYJ FOE NYJ FOE DATE FOE SCORE W/L OFF DEF ST OFF DEF ST0-0 97 9/10 24 23 4 0-0 0-0 89 97 77.8 #57 85.8 #34 9/10 12-21 L 32 27 32 12 29 110-0 0-1 97 98 86.7 #31 83.4 #42 9/17 19-17 W 25 25 4 12 15 30 0-1 1-0 89 105 76.3 #59 90.1 #17 9/17 20-45 L 32 29 32 8 23 61-0 0-2 99 88 9/24 22 22 4 32 31 32 0-2 1-0 88 99 9/24 32 31 32 22 22 4
0-2 96 10/1 5 32 10 #12 #21 1-1 97 10/1 5 32 101-1 102 10/8 6 15 24 #17 #28 0-2 94 10/8 6 15 242-0 108 10/15 1 12 25 #13 #30 1-1 105 10/15 1 12 250-2 88 10/22 32 31 32 #18 #22 1-0 99 10/22 32 31 322-0 105 10/26 20 10 8 #1 #14 2-0 108 10/29 20 10 82-0 106 11/5 4 25 6 #2 #32 1-1 97 11/2 4 25 62-0 102 11/13 11 2 14 #30 #18 1-0 102 11/12 11 2 141-0 102 11/19 15 19 12 #27 #30 11/191-1 105 11/26 3 17 7 #9 #32 2-0 102 11/26 3 17 72-0 105 12/3 12 4 15 #31 #30 2-0 107 12/3 12 4 151-1 105 12/11 3 17 7 #24 #32 2-0 105 12/10 3 17 71-1 97 12/17 18 20 11 0 -3 0-2 96 12/17 18 20 112-0 107 12/24 8 9 3 17.68 Off YPP 15.16 0-2 96 12/24 8 9 31-1 97 12/31 18 20 11 #18 Off YPP Rank #14 1-1 105 12/31 18 20 11
21.59 Def YPP 12.39#6 Def YPP Rank #31
Comp Yds Comp Yds Comp Yds Comp YdsYds FD QBR TO's FD RA-RY YPC Att Pass Sks FD RA-RY YPC Att Pass Sks Yds FD QBR TO's FD RA-RY YPC Att Pass Sks FD RA-RY YPC Att Pass Sks
Bye at Buffalo 12-21 -194 -12 -35.7 -1 11 15-38 2.5 26-39 176 1 23 42-190 4.5 16-28 218 2at LA Chargers 19-17 -31 -3 -11.7 0 21 32-111 3.5 24-34 225 2 24 14-44 3.1 31-39 323 1 at Oakland 20-45 -139 -4 -23.5 -2 17 25-126 5.0 17-25 145 4 21 27-180 6.7 23-28 230 0at NY Jets Miami† New Orleans Jacksonville Tennessee at Clevelandat Atlanta New England NY Jets at Miamiat Baltimore Atlanta Oakland Buffaloat Carolina at Tampa Bay Tampa Bay at Byeat New England Carolina Denver Kansas City New England at Denverat Buffalo at New Orleansat Kansas City LA Chargers Buffalo at New England
Average 19-17 -31.0 -3.0 -11.7 0 21 32-111 3.5 24-34 225 5.9% 24 14-44 3.1 31-39 323 2.6% Average 16-33 -166.5 0.0 -37.8 -3 14 20-82 4.1 22-32 161 7.8% 22 35-185 5.4 20-28 224 3.6% Vs AFC East 0-0 0.0 0.0 0.0 0 0 0-0 0.0 0-0 0 0.0% 0 0-0 0.0 0-0 0 0.0% Vs AFC East 12-21 -194.0 -12.0 -35.7 -1 11 15-38 2.5 26-39 176 2.6% 23 42-190 4.5 16-28 218 7.1%
Away 19-17 -31.0 -3.0 -11.7 0 21 32-111 3.5 24-34 225 5.9% 24 14-44 3.1 31-39 323 2.6% Home 0-0 0.0 0.0 0.0 0 0 0-0 0.0 0-0 0 0.0% 0 0-0 0.0 0-0 0 0.0%
Bye at Buffalo +8/41.5 Josh McCown 26-39-187-0-2 Bilal Powell 7-22-3.1-0 Jermaine Kearse 7-59-8.4-0at LA Chargers +3.5/45.5 Jay Cutler 24-33-230-1-0 Jay Ajayi 28-122-4.4-0 DeVante Parker 4-85-21.3-0 at Oakland +13.5/43.5 Josh McCown 17-25-166-2-0 Matt Forte 9-53-5.9-0 Jermaine Kearse 4-64-16.0-2at NY Jets vs. Miami† New Orleans Jacksonville Tennessee at Clevelandat Atlanta vs. New England NY Jets at Miamiat Baltimore Atlanta Oakland vs. Buffaloat Carolina at Tampa Bay Tampa Bay at Byeat New England vs. Carolina Denver Kansas City New England at Denverat Buffalo vs. at New Orleansat Kansas City LA Chargers Buffalo at New England
vs.
Jay Cutler 24-33-230-1-0 Jay Ajayi 28-122-4.4-0 DeVante Parker 4-85-21.3-0 vs. Josh McCown 43-64-353-2-2 Matt Forte 15-69-4.6-0 Jermaine Kearse 11-123-11.2-2Jarvis Landry 0-1-0-0-0 Jay Cutler 2-(-1)-(-0.5)-0 Jarvis Landry 13-78-6.0-0 Bilal Powell 13-35-2.7-0 Matt Forte 7-58-8.3-0
Kenyan Drake 1-(-3)-(-3.0)-0 Kenny Stills 2-37-18.5-1 Josh McCown 6-31-5.2-1 Robby Anderson 6-50-8.3-0vs. Category
Line Score Yds FD Rush TO'sMiami -4 27 274 20 32-137NY JETS 45 23 332 18 21-140 -2 vs.
Line Score Yds FD Rush TO'sMiami -3 34 303 13 27-67NY JETS 38.5 13 360 20 23-116 -3 vs.
Line Score Yds FD Rush TO'sMiami 42 14 226 17 11-59NY JETS -2.5 27 425 23 43-207 1
Line Score Yds FD Rush TO'sMiami 43 20 333 20 9-12NY JETS -4 38 411 24 34-137 2
Line Score Yds FD Rush TO'sMiami -6.5 16 291 16 18-74NY Jets 41.5 13 326 18 49-277 0
NYJ LB's
MIA RB's
By Game Yardage Leaders
New York Jets
+/- RatingsMiami By 8.0
New York Season Leaders
0.34MIA LB'S
NYJ RB's
Passing
Phil's Forecast:
ReceivingRushing
Team & Margin
Las Vegas Total
Jets LogsFOE
Miami Dolphins OVERALL: OVERALL:
Vs AFC East Vs AFC EastDolphins Logs1-0 0-2
--PS RANK--NFL RANKINGS
0-1FOE 0-0
Offense
NYJRECORD PLUS/MINUS GAME GRADES
FOEMIA FOEMIA --PS RANK--RECORD GAME GRADES NYJPLUS/MINUS
DefenseScore Score
Mia
mi D
olp
hin
s
Weekly
Lead
ers
& T
eam
Ave
rag
es
New
Yo
rk J
ets
Dolphins Net Stats Offense Defense Jets Net Stats
Receiving
0.60
Position by Position EdgesMiami New York
MIA DEF LINE
NYJ OFF LINE
0.97
1.33MIA SECONDARY
NYJ QB/WR
NYJ DEF LINE
MIA OFF LINE0.57
1.62MIA QB/WR
NYJ SECONDARY
1.017.87
NYJ KICKER
NYJ SPECIAL TMS
2.30MIA SPECIAL TMS
MIA KICKER
0.44
Projected Yardage Total
101 yards
New York 177 yardsProjected Passing
196 yards
New York
Miami
Miami99 yardsProjected Rushing
Projected Box Score
NYJ COACHES
0.70MIA COACHES
Weather: High 80's, clear. The Dolphins trailed for the majority of the game last week against the Chargers, but got a 54-yard field goal with 1:05 left. They held on following a missed Los Angeles field goal in the final seconds. Their best matchup here is running back Jay Ajayi versus a Jets rush defense that allows 185 yards per game and 5.4 yards per carry. The Jets have the weakest roster in the NFL and are 0-2 being outgained by 167 yards per game. With Miami headed to London next, I do not like either side here.
Miami By 6
42.5 Points
NYJ TOTAL PTS
MIA TOTAL PTS
Miami By 6.6Game Grade
Miami 22 - 16
Las Vegas Line
#28
MiamiProjected Final Score
22 points Miami 295 - 278Miami
Computer Points
Computer Yards
Miami
POSITIONAL EDGE AWARDED TO:
New York #13Miami
New York
25-35-2177-13-49
295 yards
33-58-35122-37-277
Future Schedule Strength
New York 278 yards
16 pointsTeam Schedule Strength
2015 Comp-Att-Yds
19-44-19816-29-218
Phil Steele#15 Miami New York #1 By 6.86 Points Miami By 6 MIAMI 23 NY JETS 17
Dolphins
2017 CURRENT RANKINGS at Buffaloat LA Chargers
Miami New Yorkat Oakland
at NY Jets Miami
Bye
† New Orleans Rush Off Jacksonville Tennessee Pass Off at Clevelandat Atlanta Total Off New England NY Jets Score Off at Miamiat Baltimore Sks Allowed Atlanta Oakland Rush Def Buffaloat Carolina Pass Def at Tampa Bay Tampa Bay Total Def at Byeat New England Score Def Carolina Denver Sks By Kansas City New England Ypg Diff at Denverat Buffalo Total TO's at New Orleansat Kansas City LA Chargers Buffalo at New England
2016 Comp-Att-Yds
Passing
Last Five Meetings (Last 16 years at PhilSteele.com)
By Game Yardage Leaders
Miami Season Leaders
Rushing
17-29-14919-30-212
2016 Comp-Att-Yds12-18-23625-46-266
2015 Comp-Att-Yds
2014 Comp-Att-Yds Retu
rn t
o T
ab
le o
f C
on
ten
ts

DEN FOE DEN FOE DATE FOE SCORE W/L OFF DEF ST OFF DEF ST BUF FOE BUF FOE DATE FOE SCORE W/L OFF DEF ST OFF DEF ST0-0 0-0 100 98 87.1 #29 88.6 #21 9/11 24-21 W 27 2 15 20 6 30 0-0 0-0 97 89 85.8 #34 77.8 #57 9/10 21-12 W 12 29 11 32 27 321-0 1-0 100 104 93.5 #8 82.7 #45 9/17 42-17 W 19 3 15 5 22 17 1-0 1-0 97 102 85.9 #33 88.4 #24 9/17 3-9 L 13 26 11 7 5 142-0 1-1 105 97 9/24 12 4 15 18 20 11 1-1 2-0 97 105 9/24 18 20 11 12 4 15
2-0 106 10/1 4 25 6 #1 #8 2-0 108 10/1 4 25 610/8 #21 #27 0-2 93 10/8 14 28 9
0-2 98 10/15 28 8 13 #11 #24 10/150-2 96 10/22 13 18 30 #3 #25 1-0 102 10/22 13 18 302-0 107 10/30 8 9 3 #20 #14 2-0 106 10/29 8 9 31-1 102 11/5 10 16 1 #3 #5 0-2 88 11/2 10 16 11-1 105 11/12 3 17 7 #15 #8 0-2 96 11/12 3 17 70-2 93 11/19 27 7 18 #4 #2 0-2 96 11/19 27 7 182-0 106 11/26 4 25 6 #13 #4 2-0 107 11/26 4 25 61-0 99 12/3 22 22 4 #24 #6 1-1 105 12/3 22 22 40-2 88 12/10 32 31 32 #1 #7 0-2 94 12/10 32 31 320-2 94 12/14 29 30 20 -1 1 1-0 99 12/17 29 30 201-1 98 12/24 14 28 9 10.62 Off YPP 24.33 1-1 105 12/24 14 28 92-0 107 12/31 8 9 3 #2 Off YPP Rank #27 1-0 99 12/31 8 9 3
13.61 Def YPP 22.33#27 Def YPP Rank #5
Comp Yds Comp Yds Comp Yds Comp YdsYds FD QBR TO's FD RA-RY YPC Att Pass Sks FD RA-RY YPC Att Pass Sks Yds FD QBR TO's FD RA-RY YPC Att Pass Sks FD RA-RY YPC Att Pass Sks
LA Chargers 24-21 72 5 -5.4 -1 22 36-140 3.9 17-28 181 4 17 22-64 2.9 22-33 185 1 NY Jets 21-12 194 12 35.7 1 23 42-190 4.5 16-28 218 2 11 15-38 2.5 26-39 176 1 Dallas 42-17 112 10 47.4 0 26 39-178 4.6 22-32 202 2 16 14-40 2.9 30-50 228 2 at Carolina 3-9 -79 -9 -4.3 0 10 23-69 3.0 17-25 107 3 19 28-77 2.8 20-32 178 6at Buffalo Denver Oakland at Atlantaat Bye at Cincinnati NY Giants at Byeat LA Chargers Tampa Bayat Kansas City Oaklandat Philadelphia at NY Jets New England New Orleans Cincinnati at LA Chargersat Oakland at Kansas Cityat Miami New England NY Jets Indianapolisat Indianapolis Miamiat Washington at New England Kansas City at Miami
Average 33-19 92.0 0.0 26.0 -1 24 38-159 4.2 20-30 192 10.0% 17 18-52 2.9 26-42 207 3.6% Average 12-11 57.5 0.0 17.4 1 17 33-130 4.0 17-27 163 9.4% 15 22-58 2.7 23-36 177 9.9% Vs AFC West 24-21 72.0 5.0 -5.4 -1 22 36-140 3.9 17-28 181 14.3% 17 22-64 2.9 22-33 185 3.0% Vs AFC East 21-12 194.0 12.0 35.7 1 23 42-190 4.5 16-28 218 7.1% 11 15-38 2.5 26-39 176 2.6%
Away 0-0 0.0 0.0 0.0 0 0 0-0 0.0 0-0 0 0.0% 0 0-0 0.0 0-0 0 0.0% Home 21-12 194.0 12.0 35.7 1 23 42-190 4.5 16-28 218 7.1% 11 15-38 2.5 26-39 176 2.6%
LA Chargers -3/43 Trevor Siemiam 17-28-219-2-1 CJ Anderson 20-81-0.0-0 Demaryius Thomas 5-67-0.0-0 NY Jets -8/41.5 Tyrod Taylor 16-28-224-2-1 LeSean McCoy 22-110-0.0-0 Jordan Matthews 2-61-0.0-0 Dallas +2.5/43.5 Trevor Siemiam 22-32-231-4-1 CJ Anderson 25-118-0.0-1 Demaryius Thomas 6-71-0.0-0 at Carolina +6.5/43 Tyrod Taylor 17-25-125-0-0 Tyrod Taylor 8-55-0.0-0 LeSean McCoy 6-34-0.0-0at Buffalo vs. Denver Oakland at Atlantaat Bye at Cincinnati NY Giants vs. at Byeat LA Chargers Tampa Bayat Kansas City Oaklandat Philadelphia vs. at NY Jets New England New Orleans Cincinnati at LA Chargersat Oakland vs. at Kansas Cityat Miami New England NY Jets Indianapolisat Indianapolis vs. Miamiat Washington at New England Kansas City at Miami
vs.
Trevor Siemiam 39-60-450-6-2 CJ Anderson 45-199-4.4-1 Demaryius Thomas 11-138-12.5-0 vs. Tyrod Taylor 33-53-349-2-1 LeSean McCoy 34-119-3.5-0 Jordan Matthews 5-91-18.2-0Jamaal Charles 19-86-4.5-0 Emmanuel Sanders 9-88-9.8-2 Tyrod Taylor 16-93-5.8-0 LeSean McCoy 11-83-7.5-0Trevor Siemian 11-33-3.0-1 Virgil Green 3-55-18.3-1 Mike Tolbert 15-47-3.1-1 Charles Clay 7-76-10.9-1
vs. CategoryLine Score Yds FD Rush TO's
Denver -10 24 306 15 29-133Buffalo 46.5 17 415 24 16-74 0 vs.
vs.
Denver BuffaloRushing Receiving
BUF SECONDARY
0.56DEN QB/WR
BUF LB's
0.55DEN RB's
DEN COACHES
0.63
DEN DEF LINE0.76
BUF OFF LINE
BUF DEF LINE
DEN OFF LINE
DEN SPECIAL TMS
2014 Comp-Att-Yds BUF KICKER
Retu
rn t
o T
ab
le o
f C
on
ten
ts
Denver
Projected Rushing
BUF TOTAL PTS
0.24BUF COACHES
285 yardsProjected Yardage Total
98 yards Denver Buffalo 110 yards
Buffalo 16 pointsTeam Schedule Strength
#15 Denver Buffalo #24
20 points
DENVER 17 BUFFALO 16Denver By 1
Weather: Mid 80's, clear. Last week the Bills had a 12-1 first down deficit against the Panthers, but somehow only trailed 6-0 at halftime. Now they are back at home and catch the Broncos off a dominating win over Dallas at home. Buffalo is allowing just 235 yards per game and Denver, despite losing defensive coordinator Wade Phillips, is yielding just 259 yards per game. My forecast is calling for a low-scoring affair and I agree but will lean with the home dog.
Denver By 3
Las Vegas Total
Las Vegas Line
Denver 20 - 16
40 Points
Denver By 5.0
Denver By 1.4
Denver 285 - 256
Game Grade
Computer Yards
Phil's Forecast:
Vs AFC West Vs AFC East Bills Logs
OVERALL: OVERALL: Buffalo Bills2-0 1-1
RECORD PLUS/MINUS GAME GRADES BUFDEN --PS RANK-- FOE 1-0 1-0 --PS RANK-- FOEDEN FOE NFL RANKINGS BUF FOE
RECORD PLUS/MINUS GAME GRADES
Offense DefenseScore
By Game Yardage Leaders Passing Rushing ReceivingPosition by Position Edges
0.19DEN LB'S
BUF RB's
1.51DEN SECONDARY
BUF QB/WR
0.06Denver Season Leaders Buffalo Season LeadersBUF SPECIAL TMS
DEN KICKER
0.23Last Five Meetings (Last 16 years at PhilSteele.com)Projected Box Score
Team & Margin
1.91187 yards Denver Buffalo 146 yards 2.82DEN TOTAL PTSProjected Passing
Computer Points
Buffalo 256 yardsProjected Final Score
POSITIONAL EDGE AWARDED TO:
Denver
Denver
Phil Steele#18 Denver Buffalo #12 By 0.91 Points
Future Schedule Strength
+/- Ratings
Broncos
LA Chargers 2017 CURRENT RANKINGS NY Jets Dallas
Denver Buffaloat Carolina
at Buffalo Denver Oakland Rush Off at Atlantaat Bye Pass Off at Cincinnati NY Giants Total Off at Byeat LA Chargers Score Off Tampa Bayat Kansas City Sks Allowed Oaklandat Philadelphia Rush Def at NY Jets New England Pass Def New Orleans Cincinnati Total Def at LA Chargersat Oakland Score Def at Kansas Cityat Miami Sks By New England NY Jets Ypg Diff Indianapolisat Indianapolis Total TO's Miamiat Washington at New England Kansas City at Miami
Broncos Net Stats Offense Defense
Den
ver
Bro
nco
s
Weekly
Lead
ers
& T
eam
Ave
rag
es
Bu
ffalo
Bills
Bills Net Stats
14-20-17338-57-341
By Game Yardage Leaders Passing
Score
Broncos LogsDenver Broncos

HOU FOE HOU FOE DATE FOE SCORE W/L OFF DEF ST OFF DEF ST NE FOE NE FOE DATE FOE SCORE W/L OFF DEF ST OFF DEF ST0-0 0-0 100 97 74.5 #61 97.4 #2 9/10 7-29 L 25 4 27 22 11 21 0-0 0-0 108 102 80.4 #51 98.5 #1 9/7 27-42 L 3 7 7 17 9 30-1 0-1 95 95 86.8 #30 84.4 #37 9/14 13-9 W 29 4 27 27 10 18 0-1 0-1 103 98 93.8 #7 81.1 #49 9/17 36-20 W 4 13 7 3 31 101-1 1-1 97 105 9/24 30 5 27 3 17 7 1-1 1-1 105 97 9/24 3 17 7 30 5 27
1-1 102 10/1 6 15 24 #7 #10 2-0 102 10/1 6 15 242-0 107 10/8 8 9 3 #32 #1 1-0 102 10/5 8 9 30-2 94 10/15 24 26 19 #31 #1 0-2 88 10/15 24 26 19
10/22 #29 #5 2-0 108 10/22 14 28 91-1 101 10/29 21 1 16 #32 #14 0-2 96 10/29 21 1 160-2 94 11/5 29 30 20 #22 #27 11/51-1 96 11/12 26 11 2 #6 #31 2-0 105 11/12 26 11 21-1 98 11/19 23 14 29 #6 #31 2-0 106 11/19 23 14 292-0 105 11/27 20 10 8 #13 #29 1-0 99 11/26 20 10 81-1 102 12/3 6 15 24 #24 #18 1-1 97 12/3 6 15 240-2 91 12/10 31 29 22 #27 #22 1-0 99 12/11 31 29 221-1 97 12/17 19 13 21 -3 1 2-0 108 12/17 19 13 212-0 108 12/25 2 6 23 23.45 Off YPP 14.70 1-1 97 12/24 2 6 230-2 94 12/31 29 30 20 #26 Off YPP Rank #12 0-2 88 12/31 29 30 20
15.13 Def YPP 15.58#19 Def YPP Rank #17
Comp Yds Comp Yds Comp Yds Comp YdsYds FD QBR TO's FD RA-RY YPC Att Pass Sks FD RA-RY YPC Att Pass Sks Yds FD QBR TO's FD RA-RY YPC Att Pass Sks FD RA-RY YPC Att Pass Sks
Jacksonville 7-29 -77 4 -21.9 -4 23 23-93 4.0 19-35 110 10 19 39-155 4.0 11-21 125 0 Kansas City 27-42 -166 -1 -78.5 1 25 35-124 3.5 16-36 247 3 26 27-185 6.9 28-35 352 3at Cincinnati 13-9 -29 2 -0.5 1 14 35-168 4.8 15-24 98 3 12 24-82 3.4 20-35 213 3 at New Orleans 36-20 126 9 39.7 0 29 31-119 3.8 30-39 436 2 20 17-81 4.8 27-45 348 1at New England Houston Tennessee Carolina Kansas City at Tampa Bay Cleveland at NY Jetsat Bye Atlantaat Seattle LA Chargers Indianapolis at Byeat LA Rams at Denver Arizona Oaklandat Baltimore Miamiat Tennessee at Buffalo San Francisco at Miamiat Jacksonville at Pittsburgh Pittsburgh Buffaloat Indianapolis NY Jets
Average 10-19 -53.0 0.0 -11.0 -3 19 29-131 4.5 17-30 104 22.0% 16 32-119 3.8 16-28 169 5.4% Average 32-31 -20.0 0.0 -15.9 1 27 33-122 3.7 23-38 342 6.7% 23 22-133 6.0 28-40 350 5.0% Vs AFC South 7-29 -77.0 4.0 -21.9 -4 23 23-93 4.0 19-35 110 28.6% 19 39-155 4.0 11-21 125 0.0% Vs AFC East 0-0 0.0 0.0 0.0 0 0 0-0 0.0 0-0 0 0.0% 0 0-0 0.0 0-0 0 0.0%
Away 13-9 -29.0 2.0 -0.5 1 14 35-168 4.8 15-24 98 12.5% 12 24-82 3.4 20-35 213 8.6% Home 27-42 -166.0 -1.0 -78.5 1 25 35-124 3.5 16-36 247 8.3% 26 27-185 6.9 28-35 352 8.6%
Jacksonville -5/39 Deshaun Watson 12-23-102-1-1 Lamar Miller 17-65-0.0-0 DeAndre Hopkins 7-55-0.0-1 Kansas City -8.5/48 Tom Brady 16-36-267-0-0 Mike Gillislee 15-45-0.0-3 Danny Amendola 6-100-0.0-0at Cincinnati +6.5/38 Deshaun Watson 15-24-125-0-0 Deshaun Watson 5-67-0.0-1 DeAndre Hopkins 7-73-0.0-0 at New Orleans -6.5/55.5 Tom Brady 30-39-447-3-0 Mike Gillislee 18-69-0.0-1 Rob Gronkowski 6-116-0.0-1at New England vs. Houston Tennessee Carolina Kansas City at Tampa Bay Cleveland vs. at NY Jetsat Bye Atlantaat Seattle LA Chargers Indianapolis vs. at Byeat LA Rams at Denver Arizona Oaklandat Baltimore vs. Miamiat Tennessee at Buffalo San Francisco at Miamiat Jacksonville vs. at Pittsburgh Pittsburgh Buffaloat Indianapolis NY Jets
vs.
Deshaun Watson 27-47-227-1-1 Lamar Miller 35-126-3.6-0 DeAndre Hopkins 14-128-9.1-1 vs. Tom Brady 46-75-714-3-0 Mike Gillislee 33-114-3.5-4 Rob Gronkowski 8-149-18.6-1Tom Savage 7-13-62-0-0 Deshaun Watson 7-83-11.9-1 Lamar Miller 5-57-11.4-0 James White 12-49-4.1-0 Brandin Cooks 5-125-25.0-0
D'Onta Foreman 13-44-3.4-0 CJ Fiedorowicz 4-46-11.5-0 Dion Lewis 6-23-3.8-0 James White 11-115-10.5-0vs. Category
Line Score Yds FD Rush TO'sHouston -1 0 284 19 27-109NEW ENGLAND 40.5 27 282 15 39-185 3 vs.
Line Score Yds FD Rush TO'sHouston 45.5 6 189 7 22-87NEW ENGLAND -4.5 27 313 18 31-116 0 vs.
Line Score Yds FD Rush TO'sHouston 48.5 31 385 19 28-121New England -7 34 453 28 27-88 0
Line Score Yds FD Rush TO'sHouston 51 14 323 19 27-100New England -5.5 42 419 27 33-130 0
Vs AFC South
HOU SPECIAL TMS
NE SPECIAL TMSHOU KICKER
Future Schedule StrengthNew England #10
NE KICKER
99 yards Houston New EnglandProjected Passing
173 yards Houston
#22Phil Steele
By 4.67 Points New England By 18 NEW ENGLAND 31 HOUSTON 13
RECORD
1.58
0-0
1.21
HOU DEF LINE
HOU OFF LINE
NE OFF LINE
HOU QB/WR
NE LB's
Vs AFC East Patriots LogsHouston Texans OVERALL: OVERALL: New England Patriots1-1 1-1
0-1RECORD PLUS/MINUS GAME GRADES PLUS/MINUS GAME GRADES NEHOU FOE NFL RANKINGS NE
HOU --PS RANK-- FOE
ReceivingPassing
--PS RANK-- FOEFOE
Buffalo
Kansas Cityat New Orleans Houston Carolina
Position by Position Edges By Game Yardage Leaders
DefenseScore Score
By Game Yardage Leaders Passing Rushing Receiving RushingHouston New England
NE DEF LINE
1.26
1.08NE SECONDARY
0.21HOU RB's
NE RB's
HOU SECONDARY
0.97HOU LB'S
NE QB/WR
Team & Margin Phil's Forecast:
1.21New England Season Leaders
0.33
Weather: Mid 80's, clear. The Patriots have owned the Texans with wins by 21 in 2015, 27 in the 2016 regular season and a 34-16 victory in the playoffs. The second game came without Tom Brady and as a home ‘dog. Houston is struggling on the offensive line that features a rookie quarterback under center versus a Bill Belichick defense. I expect a great effort from the Patriots and will lean with them here as they are off a home loss where their defense yielded 537 yards.
New England By 9.4
New England 299 - 272
New England 24 - 14
44 Points
Las Vegas LineNew England By 14
Las Vegas Total
Computer Yards
+/- RatingsNew England By 11.0
Game Grade
7.12
80 yards NE COACHES
HOU COACHES1.71
Projected Yardage Total NE TOTAL PTS
2.44HOU TOTAL PTS
New England 219 yards
Projected Final ScoreNew England 24 points
New England 299 yards272 yards Houston
14 pointsNew EnglandTeam Schedule Strength
Computer Points
POSITIONAL EDGE AWARDED TO:
#27 Houston
Houston
Houston New England #30
Retu
rn t
o T
ab
le o
f C
on
ten
ts
Projected Box Score
Projected Rushing
2016 Comp-Att-Yds
Patriots
Tennessee Rush Off
Jacksonville 2017 CURRENT RANKINGS at Cincinnati
Houston New Englandat New England
at Tampa Bay Cleveland Total Off at NY Jets Kansas City Pass Off
Score Off Atlantaat Seattle Sks Allowed LA Chargers
Rush Def at Byeat LA Rams Pass Def at Denver
Total Def Oaklandat Baltimore Score Def Miami
Sks By at Buffalo San Francisco Ypg Diff at Miamiat Jacksonville Total TO's at Pittsburgh Pittsburgh
NY Jets
Texans Net Stats Offense Defense
Ho
ust
on
Texan
s
Weekly
Lead
ers
& T
eam
Ave
rag
es
New
En
gla
nd
Patr
iots
Patriots Net Stats Offense
Houston Season Leaders
Last Five Meetings (Last 16 years at PhilSteele.com)
Texans Logs
at Indianapolis
at Tennessee
Arizona
Indianapolis
at Bye
24-41-19611-19-103
2015 Comp-Att-Yds12-24-15922-30-226
2013 Comp-Att-Yds15-30-26429-41-365
2012 Comp-Att-Yds21-36-22321-36-289

NO FOE NO FOE DATE FOE SCORE W/L OFF DEF ST OFF DEF ST CAR FOE CAR FOE DATE FOE SCORE W/L OFF DEF ST OFF DEF ST0-0 0-0 99 101 83.2 #43 90.1 #16 9/11 19-29 L 9 20 10 29 1 26 0-0 0-0 100 98 89.9 #18 80.4 #50 9/10 23-3 W 7 8 14 30 31 220-1 0-1 98 103 81.1 #49 93.8 #7 9/17 20-36 L 3 31 10 4 13 7 1-0 1-0 102 97 88.4 #24 85.9 #33 9/17 9-3 W 7 5 14 13 26 110-2 2-0 96 102 9/24 5 32 10 11 2 14 2-0 0-2 102 96 9/24 11 2 14 5 32 10
1-0 99 10/1 22 22 4 #28 #18 1-1 105 10/1 22 22 410/8 #2 #24 2-0 103 10/8 14 28 9
2-0 103 10/15 16 24 5 #3 #25 1-1 102 10/12 16 24 51-1 103 10/22 7 23 31 #16 #22 0-2 93 10/22 7 23 310-2 93 10/29 25 21 28 #1 #20 1-0 102 10/29 25 21 281-0 102 11/5 15 19 12 #25 #6 2-0 108 11/5 15 19 121-1 97 11/12 18 20 11 #32 #2 1-0 99 11/13 18 20 111-1 98 11/19 14 28 9 #32 #1 11/191-1 96 11/26 26 11 2 #31 #1 0-2 88 11/26 26 11 22-0 102 12/3 11 2 14 #24 #6 0-2 96 12/3 11 2 142-0 108 12/7 1 12 25 #30 #4 1-1 100 12/10 1 12 250-2 88 12/17 32 31 32 0 0 1-1 103 12/17 32 31 322-0 108 12/24 1 12 25 19.82 Off YPP 16.94 1-0 102 12/24 1 12 251-0 102 12/31 15 19 12 #23 Off YPP Rank #17 2-0 108 12/31 15 19 12
15.77 Def YPP 65.50#16 Def YPP Rank #2
Comp Yds Comp Yds Comp Yds Comp YdsYds FD QBR TO's FD RA-RY YPC Att Pass Sks FD RA-RY YPC Att Pass Sks Yds FD QBR TO's FD RA-RY YPC Att Pass Sks FD RA-RY YPC Att Pass Sks
at Minnesota 19-29 -126 -4 -38.3 0 19 21-60 2.9 27-37 284 1 23 30-129 4.3 27-32 341 1 at San Francisco 23-3 70 7 17.0 0 20 38-116 3.1 14-25 171 0 13 15-51 3.4 24-35 166 4 New England 20-36 -126 -9 -39.7 0 20 17-81 4.8 27-45 348 1 29 31-119 3.8 30-39 436 2 Buffalo 9-3 79 9 4.3 0 19 28-77 2.8 20-32 178 6 10 23-69 3.0 17-25 107 3at Carolina New Orleans Miami at New Englandat Bye at Detroit Detroit Philadelphiaat Green Bay at Chicago Chicago at Tampa Bay Tampa Bay Atlantaat Buffalo Miami Washington at Byeat LA Rams at NY Jets Carolina at New Orleansat Atlanta Minnesota NY Jets Green Bay Atlanta Tampa Bayat Tampa Bay at Atlanta
Average 20-33 -126.0 0.0 -39.3 0 20 19-71 3.7 27-41 316 2.4% 26 31-124 4.1 29-36 389 4.2% Average 16-3 74.5 0.0 11.2 0 20 33-97 2.9 17-29 175 10.5% 12 19-60 3.2 21-30 137 11.7% Vs NFC South 0-0 0.0 0.0 0.0 0 0 0-0 0.0 0-0 0 0.0% 0 0-0 0.0 0-0 0 0.0% Vs NFC South 0-0 0.0 0.0 0.0 0 0 0-0 0.0 0-0 0 0.0% 0 0-0 0.0 0-0 0 0.0%
Away 19-29 -126.0 -4.0 -38.3 0 19 21-60 2.9 27-37 284 2.7% 23 30-129 4.3 27-32 341 3.1% Home 9-3 79.0 9.0 4.3 0 19 28-77 2.8 20-32 178 18.8% 10 23-69 3.0 17-25 107 12.0%
at Minnesota +3/48 Drew Brees 27-37-291-1-0 Alvin Kamara 7-18-2.6-0 Mark Ingram 5-54-10.8-0 at San Francisco +4.5/47.5 Cam Newton 14-25-171-2-1 Jonathan Stewart 18-65-3.6-0 Russell Shepard 2-53-26.5-1 New England +6.5/55.5 Drew Brees 27-45-356-2-0 Mark Ingram 8-52-6.5-0 Michael Thomas 5-89-17.8-0 Buffalo -6.5/43 Cam Newton 20-32-228-0-0 Jonathan Stewart 15-40-2.7-0 Kelvin Benjamin 6-77-12.8-0at Carolina vs. New Orleans Miami at New Englandat Bye at Detroit Detroit vs. Philadelphiaat Green Bay at Chicago Chicago at Tampa Bay Tampa Bay vs. Atlantaat Buffalo Miami Washington at Byeat LA Rams vs. at NY Jets Carolina at New Orleansat Atlanta Minnesota NY Jets vs. Green Bay Atlanta Tampa Bayat Tampa Bay at Atlanta
vs.
Drew Brees 54-82-647-3-0 Mark Ingram 14-69-4.9-0 Michael Thomas 10-134-13.4-0 vs. Cam Newton 34-57-399-2-1 Jonathan Stewart 33-105-3.2-0 Kelvin Benjamin 7-102-14.6-0Adrian Peterson 14-44-3.1-0 Brandon Coleman 6-95-15.8-1 Christian McCaffrey 21-57-2.7-0 Devin Funchess 6-88-14.7-0Alvin Kamara 8-21-2.6-0 Coby Fleener 8-87-10.9-2 Cam Newton 11-30-2.7-0 Christian McCaffrey 9-72-8.0-0
vs. CategoryLine Score Yds FD Rush TO's
New Orleans 53 41 523 23 21-63CAROLINA -2.5 38 406 32 27-103 -1 vs.
Line Score Yds FD Rush TO'sNew Orleans 51.5 20 371 28 25-107CAROLINA -3.5 23 223 17 27-50 2 vs.
Line Score Yds FD Rush TO'sNew Orleans 42.5 22 380 27 24-70CAROLINA -9.5 27 431 24 30-119 2
Line Score Yds FD Rush TO'sNew Orleans 44.5 38 334 21 14-70CAROLINA -7.5 41 497 33 34-175 -2
Line Score Yds FD Rush TO'sNew Orleans -3 28 375 27 37-105Carolina 49.5 10 231 15 22-109 0
Panthers Net Stats Offense
OVERALL: OVERALL: Carolina Panthers2-0
CAR SECONDARY
1.83NO QB/WR
0-2Vs NFC South Vs NFC South
Position by Position Edges
2017 CURRENT RANKINGS
CAR LB's
NO RB's0.86
NO OFF LINE0.87
CAR DEF LINE
NO LB'S
CAR RB's
NO SECONDARY
0.05NO DEF LINE
CAR OFF LINE
Panthers LogsNew Orleans Saints
PLUS/MINUSRECORD PLUS/MINUS GAME GRADES NO --PS RANK-- FOE 0-0 0-0 --PS RANK-- FOENO FOE NFL RANKINGS CAR FOE
RECORD GAME GRADES CAR
Score ScoreSaints Net Stats Offense
Caro
lin
a P
an
thers
By Game Yardage LeadersReceiving
Defense
Rushing ReceivingPassing
Defense
New
Orl
ean
s S
ain
ts
Weekly
Lead
ers
& T
eam
Ave
rag
es
0.13NO SPECIAL TMS
New Orleans Carolina
1.80
0.63
CAR QB/WR
Carolina By 5.5
Carolina Season LeadersCAR SPECIAL TMSNO KICKER
0.20 Team & Margin
4.36+/- Ratings
0.07NO COACHES
Las Vegas TotalCAR COACHES
223 yards New Orleans Carolina
Phil's Forecast:CAR KICKER
Las Vegas Line
Weather: Mid 80's, clear. Dating back to 2015 the Saints are a solid 8-2-1 ATS on the road, but did lose to the Vikings by 10 this year. Carolina had a 12-1 first down edge in the first half last week versus Buffalo. Cam Newton was hobbled and lost his best receiver in Greg Olsen during the game (overthrown touchdown pass from the two yard line at the end cost them the cover). The defensive edge here is massive. Carolina is allowing just 197 yards per game and allowed just two field goals so far this season. The Saints are yielding 513 yards per game and I like the Panthers here.
CAR TOTAL PTS
46.5 Points
Carolina By 9.0
112 yards
Game Grade295 yards New Orleans Carolina 354 yards
POSITIONAL EDGE AWARDED TO:
2.09NO TOTAL PTSProjected Passing
Carolina By 10.0Projected Final Score
Computer YardsCarolina 25 points
CarolinaCarolina 354 - 295
Team Schedule StrengthComputer Points
New Orleans
16 points New Orleans
Retu
rn t
o T
ab
le o
f C
on
ten
ts
Projected Box Score
Projected Yardage Total
Projected Rushing72 yards New Orleans
242 yards
Carolina
Carolina 25 - 16Future Schedule Strength
Phil Steele#13 New Orleans Carolina #5
#22 Carolina #23
By 2.27 Points Carolina By 11 BEST BET: H CAROLINA 27 NEW ORLEANS 16
Panthers
at Minnesota at San Francisco New England
New Orleans Carolina Buffalo
at Carolina New Orleans Miami Rush Off at New Englandat Bye Pass Off at Detroit Detroit Total Off Philadelphiaat Green Bay Score Off at Chicago Chicago Sks Allowed at Tampa Bay Tampa Bay Rush Def Atlantaat Buffalo Pass Def Miami Washington Total Def at Byeat LA Rams Score Def at NY Jets Carolina Sks By at New Orleans
Green BayYpg Diff
Atlanta Tampa Bay
at Atlanta Minnesota NY Jets Total TO's
at Tampa Bay at Atlanta
2016 Comp-Att-YdsLast Five Meetings (Last 16 years at PhilSteele.com)
New Orleans Season Leaders
By Game Yardage Leaders Passing Rushing
Saints Logs
34-49-46527-47-322
2016 Comp-Att-Yds35-44-28514-33-192
2015 Comp-Att-Yds
2014
31-38-31020-31-315
2015 Comp-Att-Yds
24-34-27010-28-122
24-42-28228-41-331
Comp-Att-Yds
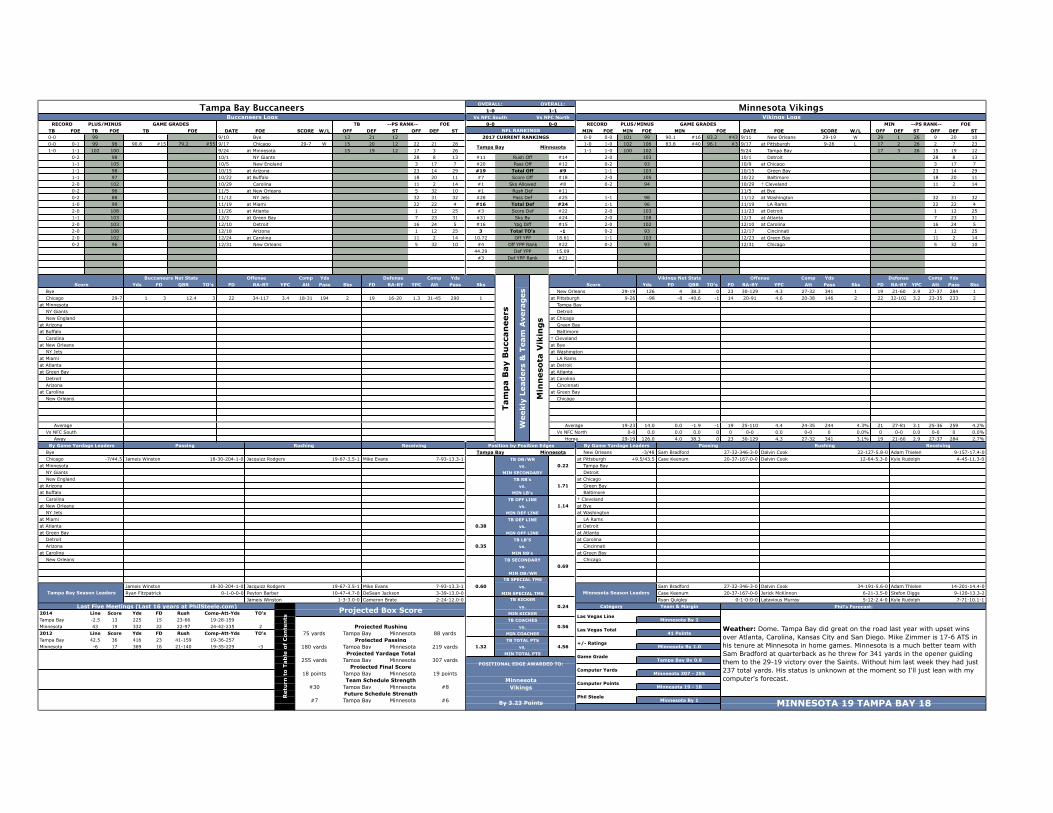
TB FOE TB FOE DATE FOE SCORE W/L OFF DEF ST OFF DEF ST MIN FOE MIN FOE DATE FOE SCORE W/L OFF DEF ST OFF DEF ST0-0 99 9/10 13 21 12 0-0 0-0 101 99 90.1 #16 83.2 #43 9/11 29-19 W 29 1 26 9 20 100-0 0-1 99 96 90.8 #15 79.2 #55 9/17 29-7 W 15 20 12 22 21 28 1-0 1-0 102 106 83.8 #40 96.1 #3 9/17 9-26 L 17 2 26 2 7 231-0 1-1 102 100 9/24 15 19 12 17 3 26 1-1 1-0 100 102 9/24 17 3 26 15 19 12
0-2 98 10/1 28 8 13 #11 #14 2-0 103 10/1 28 8 131-1 105 10/5 3 17 7 #20 #12 0-2 93 10/9 3 17 71-1 98 10/15 23 14 29 #19 #9 1-1 103 10/15 23 14 291-1 97 10/22 18 20 11 #7 #18 2-0 105 10/22 18 20 112-0 102 10/29 11 2 14 #1 #8 0-2 94 10/29 11 2 140-2 96 11/5 5 32 10 #1 #11 11/50-2 88 11/12 32 31 32 #28 #25 1-1 98 11/12 32 31 321-0 99 11/19 22 22 4 #16 #24 1-1 96 11/19 22 22 42-0 108 11/26 1 12 25 #3 #22 2-0 103 11/23 1 12 251-1 103 12/3 7 23 31 #31 #24 2-0 108 12/3 7 23 312-0 103 12/10 16 24 5 #16 #15 2-0 102 12/10 16 24 52-0 108 12/18 1 12 25 3 -1 0-2 93 12/17 1 12 252-0 102 12/24 11 2 14 10.72 Off YPP 18.61 1-1 103 12/23 11 2 140-2 96 12/31 5 32 10 #4 Off YPP Rank #22 0-2 93 12/31 5 32 10
44.29 Def YPP 15.09#3 Def YPP Rank #21
Comp Yds Comp Yds Comp Yds Comp YdsYds FD QBR TO's FD RA-RY YPC Att Pass Sks FD RA-RY YPC Att Pass Sks Yds FD QBR TO's FD RA-RY YPC Att Pass Sks FD RA-RY YPC Att Pass Sks
Bye New Orleans 29-19 126 4 38.3 0 23 30-129 4.3 27-32 341 1 19 21-60 2.9 27-37 284 1 Chicago 29-7 1 3 12.4 3 22 34-117 3.4 18-31 194 2 19 16-20 1.3 31-45 290 1 at Pittsburgh 9-26 -98 -8 -40.6 -1 14 20-91 4.6 20-38 146 2 22 32-102 3.2 23-35 233 2at Minnesota Tampa Bay NY Giants Detroit New England at Chicagoat Arizona Green Bayat Buffalo Baltimore Carolina † Clevelandat New Orleans at Bye NY Jets at Washingtonat Miami LA Ramsat Atlanta at Detroitat Green Bay at Atlanta Detroit at Carolina Arizona Cincinnatiat Carolina at Green Bay New Orleans Chicago
Average Average 19-23 14.0 0.0 -1.9 -1 19 25-110 4.4 24-35 244 4.3% 21 27-81 3.1 25-36 259 4.2% Vs NFC South Vs NFC North 0-0 0.0 0.0 0.0 0 0 0-0 0.0 0-0 0 0.0% 0 0-0 0.0 0-0 0 0.0%
Away Home 29-19 126.0 4.0 38.3 0 23 30-129 4.3 27-32 341 3.1% 19 21-60 2.9 27-37 284 2.7%
Bye New Orleans -3/48 Sam Bradford 27-32-346-3-0 Dalvin Cook 22-127-5.8-0 Adam Thielen 9-157-17.4-0 Chicago -7/44.5 Jameis Winston 18-30-204-1-0 Jacquizz Rodgers 19-67-3.5-1 Mike Evans 7-93-13.3-1 at Pittsburgh +9.5/43.5 Case Keenum 20-37-167-0-0 Dalvin Cook 12-64-5.3-0 Kyle Rudolph 4-45-11.3-0at Minnesota vs. Tampa Bay NY Giants Detroit New England at Chicagoat Arizona vs. Green Bayat Buffalo Baltimore Carolina † Clevelandat New Orleans vs. at Bye NY Jets at Washingtonat Miami LA Ramsat Atlanta vs. at Detroitat Green Bay at Atlanta Detroit at Carolina Arizona vs. Cincinnatiat Carolina at Green Bay New Orleans Chicago
vs.
Jameis Winston 18-30-204-1-0 Jacquizz Rodgers 19-67-3.5-1 Mike Evans 7-93-13.3-1 vs. Sam Bradford 27-32-346-3-0 Dalvin Cook 34-191-5.6-0 Adam Thielen 14-201-14.4-0Ryan Fitzpatrick 0-1-0-0-0 Peyton Barber 10-47-4.7-0 DeSean Jackson 3-39-13.0-0 Case Keenum 20-37-167-0-0 Jerick McKinnon 6-21-3.5-0 Stefon Diggs 9-120-13.3-2
Jameis Winston 1-3-3.0-0 Cameron Brate 2-24-12.0-0 Ryan Quigley 0-1-0-0-0 Latavious Murray 5-12-2.4-0 Kyle Rudolph 7-71-10.1-1vs. Category
Line Score Yds FD Rush TO'sTampa Bay -2.5 13 225 15 23-66Minnesota 43 19 332 22 22-97 2 vs.
Line Score Yds FD Rush TO'sTampa Bay 42.5 36 416 23 41-159Minnesota -6 17 369 16 21-140 -3 vs.
Receiving
MINNESOTA 19 TAMPA BAY 18
Min
neso
ta V
ikin
gs
Offense
at Detroit
Chicago
at Atlantaat Carolina Cincinnatiat Green Bay
† Clevelandat Byeat Washington LA Rams
at Atlantaat Green Bay Detroit Arizonaat Carolina New Orleans
Carolinaat New Orleans NY Jetsat Miami
Minnesota By 1By 3.23 Points
Position by Position Edges By Game Yardage Leaders Passing Rushing
Tam
pa B
ay
Bu
ccan
eers
Weekly
Lead
ers
& T
eam
Ave
rag
es
By Game Yardage Leaders Passing Rushing Receiving
ScoreDefenseOffenseBuccaneers Net Stats
Las Vegas Line
Weather: Dome. Tampa Bay did great on the road last year with upset wins over Atlanta, Carolina, Kansas City and San Diego. Mike Zimmer is 17-6 ATS in his tenure at Minnesota in home games. Minnesota is a much better team with Sam Bradford at quarterback as he threw for 341 yards in the opener guiding them to the 29-19 victory over the Saints. Without him last week they had just 237 total yards. His status is unknown at the moment so I'll just lean with my computer's forecast.
Minnesota By 2
Las Vegas Total41 Points
+/- Ratings
Tampa Bay By 0.8
Computer YardsMinnesota 307 - 255
Computer Points
Minnesota By 1.0
Game Grade
Future Schedule StrengthMinnesota 19 - 18
Team Schedule Strength#30
Phil Steele
Projected Yardage Total255 yards Tampa Bay Minnesota 307 yards
Projected Passing180 yards Tampa Bay Minnesota 219 yards
Projected Rushing75 yards Tampa Bay
MinnesotaTB QB/WR
0.22MIN SECONDARY
Minnesota 88 yards
Tampa Bay Season Leaders
Last Five Meetings (Last 16 years at PhilSteele.com)
Tampa Bay
2014 Comp-Att-Yds
TB RB's
0.35TB LB'S
1.71MIN LB's
Minnesota
Projected Final Score
TB KICKER
POSITIONAL EDGE AWARDED TO:
TB SECONDARY0.69
MIN QB/WR
18 points Tampa Bay Minnesota 19 points
VikingsTampa Bay Minnesota
Retu
rn t
o T
ab
le o
f C
on
ten
ts
Projected Box Score
19-36-25719-35-229 1.32
TB TOTAL PTS4.56
MIN TOTAL PTS
MIN RB's
0.38TB DEF LINE
MIN OFF LINE
TB OFF LINE1.14
MIN DEF LINE
Pass Def
FOE
Score Off
0.60
0-00-0
Total Off
Total Def
Rush Off
Tampa Bay
Minnesota Season LeadersMIN SPECIAL TMS
0.24MIN KICKER
TB SPECIAL TMS
0.56MIN COACHES
TB COACHES
FOEMIN
Vikings Net Stats
--PS RANK--PLUS/MINUS
Defense
GAME GRADESMIN
at Pittsburgh
Detroit Tampa Bay
FOE New Orleans
Team & Margin Phil's Forecast:
at Chicago Green Bay Baltimore
RECORD
Score
Score DefSks By
Total TO'sYpg Diff
Sks Allowed
NFL RANKINGS
Minnesota
--PS RANK--TBFOE
GAME GRADESRECORD PLUS/MINUSTB
Minnesota VikingsVikings LogsBuccaneers Logs
OVERALL: OVERALL:
Vs NFC South1-0 1-1
Vs NFC North
Tampa Bay Buccaneers
Rush Def
2017 CURRENT RANKINGS
Pass Off
Bye Chicagoat Minnesota NY Giants New Englandat Arizonaat Buffalo
19-28-15924-42-235
2012 Comp-Att-Yds
#7 Tampa Bay Minnesota #6
#8

ATL FOE ATL FOE DATE FOE SCORE W/L OFF DEF ST OFF DEF ST DET FOE DET FOE DATE FOE SCORE W/L OFF DEF ST OFF DEF ST0-0 0-0 107 96 88.0 #26 85.2 #36 9/10 23-17 W 2 15 25 21 22 28 0-0 0-0 99 100 91.2 #14 79.6 #54 9/10 35-23 W 18 30 5 10 14 291-0 1-0 107 104 91.9 #13 86.2 #32 9/17 34-23 W 1 14 25 6 19 31 1-0 0-1 101 100 88.1 #25 81.5 #48 9/18 24-10 W 16 27 5 26 9 132-0 2-0 108 103 9/24 1 12 25 16 24 5 2-0 2-0 103 108 9/24 16 24 5 1 12 25
1-1 97 10/1 18 20 11 #17 #14 1-1 100 10/1 18 20 1110/8 #8 #19 2-0 102 10/8 14 28 9
1-0 99 10/15 22 22 4 #8 #17 0-2 96 10/15 22 22 41-1 105 10/22 3 17 7 #8 #6 10/220-2 88 10/29 32 31 32 #14 #13 2-0 108 10/29 32 31 322-0 102 11/5 11 2 14 #16 #4 1-1 103 11/6 11 2 141-1 99 11/12 9 27 17 #23 #21 0-2 94 11/12 9 27 171-1 101 11/20 21 1 16 #22 #7 0-2 93 11/19 21 1 161-0 102 11/26 15 19 12 #15 #7 1-1 100 11/23 15 19 121-1 100 12/3 17 3 26 #6 #9 2-0 105 12/3 17 3 260-2 96 12/7 5 32 10 #11 #14 1-0 102 12/10 5 32 101-0 102 12/18 15 19 12 2 3 0-2 93 12/16 15 19 120-2 96 12/24 5 32 10 12.91 Off YPP 10.58 0-2 93 12/24 5 32 102-0 102 12/31 11 2 14 #7 Off YPP Rank #1 1-1 103 12/31 11 2 14
16.70 Def YPP 17.55#12 Def YPP Rank #8
Comp Yds Comp Yds Comp Yds Comp YdsYds FD QBR TO's FD RA-RY YPC Att Pass Sks FD RA-RY YPC Att Pass Sks Yds FD QBR TO's FD RA-RY YPC Att Pass Sks FD RA-RY YPC Att Pass Sks
at Chicago 23-17 71 -2 29.3 0 18 23-64 2.8 21-30 308 2 20 19-125 6.6 26-40 176 4 Arizona 35-23 58 -5 59.8 3 19 27-82 3.0 29-41 285 1 24 18-45 2.5 27-48 264 1 Green Bay 34-23 -3 -5 17.4 2 19 27-141 5.2 19-28 223 3 24 15-59 3.9 33-50 308 3 at NY Giants 24-10 -13 -2 29.7 0 12 32-138 4.3 15-21 119 3 14 18-62 3.4 22-32 208 5at Detroit Atlanta Buffalo at Minnesotaat Bye Carolina Miami at New Orleansat New England at Byeat NY Jets Pittsburghat Carolina at Green Bay Dallas Clevelandat Seattle at Chicago Tampa Bay Minnesota Minnesota at Baltimore New Orleans at Tampa Bayat Tampa Bay Chicagoat New Orleans at Cincinnati Carolina Green Bay
Average 29-20 34.0 0.0 23.3 2 19 25-103 4.1 20-29 266 8.6% 22 17-92 5.4 30-45 242 7.8% Average 30-17 22.5 0.0 47.5 3 16 30-110 3.7 22-31 202 6.5% 19 18-54 3.0 25-40 236 7.5% Vs NFC South 0-0 0.0 0.0 0.0 0 0 0-0 0.0 0-0 0 0.0% 0 0-0 0.0 0-0 0 0.0% Vs NFC North 0-0 0.0 0.0 0.0 0 0 0-0 0.0 0-0 0 0.0% 0 0-0 0.0 0-0 0 0.0%
Away 23-17 71.0 -2.0 29.3 0 18 23-64 2.8 21-30 308 6.7% 20 19-125 6.6 26-40 176 10.0% Home 35-23 58.0 -5.0 59.8 3 19 27-82 3.0 29-41 285 2.4% 24 18-45 2.5 27-48 264 2.1%
at Chicago -7/48.5 Matt Ryan 21-30-321-1-0 Devonta Freeman 12-37-3.1-1 Austin Hooper 2-128-64.0-1 Arizona +2.5/48.5 Matthew Stafford 29-41-292-4-1 Ameer Abdullah 15-30-2.0-0 Golden Tate 10-107-10.7-0 Green Bay -3/54 Matt Ryan 19-28-252-1-0 Devonta Freeman 19-84-4.4-2 Julio Jones 5-108-21.6-0 at NY Giants +3/42 Matthew Stafford 15-21-122-2-0 Ameer Abdullah 17-86-5.1-0 Eric Ebron 5-42-8.4-1at Detroit vs. Atlanta Buffalo at Minnesotaat Bye Carolina Miami vs. at New Orleansat New England at Byeat NY Jets Pittsburghat Carolina vs. at Green Bay Dallas Clevelandat Seattle at Chicago Tampa Bay vs. Minnesota Minnesota at Baltimore New Orleans at Tampa Bayat Tampa Bay vs. Chicagoat New Orleans at Cincinnati Carolina Green Bay
vs.
Matt Ryan 40-58-573-2-0 Devonta Freeman 31-121-3.9-3 Julio Jones 9-174-19.3-0 vs. Matthew Stafford 44-62-414-6-1 Ameer Abdullah 32-116-3.6-0 Golden Tate 14-132-9.4-0Tevin Coleman 14-58-4.1-0 Austin Hooper 4-135-33.8-1 Matthew Stafford 5-37-7.4-0 Kenny Golladay 5-77-15.4-2Matt Ryan 4-19-4.8-0 Mohamed Sanu 11-132-12.0-0 Dwayne Washington 9-31-3.4-0 Marvin Jones Jr 3-64-21.3-2
vs. CategoryLine Score Yds FD Rush TO's
Atlanta 45 21 291 22 26-78Detroit -3 22 385 22 23-60 0 vs.
Line Score Yds FD Rush TO'sAtlanta -3.5 31 344 19 22-73Detroit 51 18 522 25 22-79 -3 vs.
Detroit Season Leaders
Las Vegas Line
Computer Points
Chicagoat New Orleans at Cincinnati Carolina Green Bay
Total TO's
at Baltimore New Orleans Ypg Diff at Tampa Bay
Sks By
at Chicago Tampa Bay Score Def Minnesotaat Seattle
at Green Bay Dallas Pass Def Clevelandat Carolina
at Byeat NY Jets Sks Allowed Pittsburghat New England
Carolina Miami Total Off at New Orleansat Bye
at NY Giantsat Detroit Atlanta Buffalo Rush Off at Minnesota
Green Bay2017 CURRENT RANKINGS Arizonaat Chicago
2-0
Falcons Atlanta 24 - 23
OVERALL:
Lions Logs
OVERALL: Detroit Lions2-0Vs NFC South Vs NFC North
Atlanta FalconsRECORD PLUS/MINUS GAME GRADES
ATL FOE
Detr
oit
Lio
ns
Atlanta Detroit
Pass Off
Score Off
Rush Def
Total Def
--PS RANK-- FOE
Weekly
Lead
ers
& T
eam
Ave
rag
es
Atl
an
ta F
alc
on
s
0-0
Las Vegas Total
Game Grade
+/- Ratings
Phil Steele
Computer YardsAtlanta 323 - 296
Position by Position EdgesReceiving
Falcons Net Stats Offense Defense
Atlanta Detroit
1.61ATL RB's
DET SECONDARY
2.00ATL QB/WR
Projected Yardage Total
DET COACHES
215 yards
0.12ATL DEF LINE
ATL KICKER
0.02
DET QB/WR
Atlanta24 pointsProjected Final Score
296 yardsDetroitAtlanta323 yards
Detroit 23 pointsAtlanta
1.87ATL TOTAL PTS
POSITIONAL EDGE AWARDED TO:
DET TOTAL PTS
5.42
DET DEF LINE
DETGAME GRADES
FOE0-0 RECORD PLUS/MINUS
NFL RANKINGS
ATL OFF LINE
Detroit
OffenseScore
0.42Projected Rushing
1.18
0.21
DET OFF LINE
DET LB's
DET SPECIAL TMS
2012 Comp-Att-Yds
226 yards
81 yards97 yards Atlanta DetroitProjected Passing
Atlanta
24-47-325
Lions Net Stats
ATL SECONDARY
1.19
DET RB's
ATL LB'S
0.54
FOE--PS RANK--DET
Atlanta By 3
50.5 Points
Atlanta By 2.0
Team & Margin Phil's Forecast:
ReceivingRushingPassingBy Game Yardage Leaders
Future Schedule StrengthAtlanta#12
Team Schedule Strength#20Detroit
#2#17 Atlanta Detroit
Retu
rn t
o T
ab
le o
f C
on
ten
ts
Projected Box Score
By 3.55 Points Atlanta By 1 ATLANTA 24 DETROIT 23
Defense
Weather: Dome. The Super Bowl hangover has not kicked in yet as Atlanta is 2-0. In the opener a weaker Chicago team did have a first and goal at the Atlanta five yard line trailing by six, but could not score on four consecutive plays. Atlanta does have an improved defense this year and possesses the stronger run game. Detroit is on a short week, but the Lions are on a 10-3 run at Ford Field. Atlanta is the stronger team, but is off an A plus effort versus Green Bay in their new stadium opener. I will lean with my computer's forecast and call for ATL to escape with the 1 point win.
Detroit By 2.7
ATL COACHESDET KICKER
ATL SPECIAL TMS
Falcons Logs
Score
Minnesota
at Tampa Bay
ATL
25-32-27137-56-443
2014 Comp-Att-Yds20-27-213
By Game Yardage Leaders Passing
Last Five Meetings (Last 16 years at PhilSteele.com)
Rushing
Atlanta Season Leaders

NYG FOE NYG FOE DATE FOE SCORE W/L OFF DEF ST OFF DEF ST PHI FOE PHI FOE DATE FOE SCORE W/L OFF DEF ST OFF DEF ST0-0 0-0 102 102 77.7 #58 92.1 #11 9/10 3-19 L 28 5 13 15 16 17 0-0 0-0 98 99 93.1 #9 80.3 #52 9/10 30-17 W 8 19 1 16 28 90-1 1-0 100 101 81.5 #48 88.1 #25 9/18 10-24 L 26 9 13 16 27 5 1-0 1-0 102 107 88.5 #22 89.7 #19 9/17 20-27 L 10 16 1 11 8 30-2 1-1 98 102 9/24 28 8 13 10 16 1 1-1 0-2 102 98 9/24 10 16 1 28 8 13
1-0 102 10/1 15 19 12 #32 #20 0-2 96 10/1 15 19 120-2 96 10/8 13 18 30 #18 #3 1-1 98 1/6 13 18 302-0 105 10/15 12 4 15 #28 #5 2-0 102 10/12 12 4 151-1 101 10/22 21 1 16 #30 #10 1-1 98 10/23 21 1 16
10/29 #27 #27 0-2 91 10/29 14 28 91-1 96 11/5 26 11 2 #28 #14 2-0 105 11/5 26 11 20-2 91 11/12 31 29 22 #11 #16 11/122-0 107 11/19 8 9 3 #20 #12 1-1 99 11/19 8 9 31-1 98 11/23 14 28 9 #17 #20 0-2 93 11/26 14 28 92-0 106 12/3 4 25 6 #18 #4 1-1 101 12/3 4 25 61-1 99 12/10 9 27 17 #29 #2 1-1 96 12/10 9 27 171-1 102 12/17 10 16 1 -1 0 0-2 98 12/17 10 16 11-1 98 12/24 23 14 29 38.69 Off YPP 15.24 2-0 106 12/25 23 14 291-1 98 12/31 14 28 9 #30 Off YPP Rank #15 1-1 99 12/31 14 28 9
15.09 Def YPP 13.82#20 Def YPP Rank #23
Comp Yds Comp Yds Comp Yds Comp YdsYds FD QBR TO's FD RA-RY YPC Att Pass Sks FD RA-RY YPC Att Pass Sks Yds FD QBR TO's FD RA-RY YPC Att Pass Sks FD RA-RY YPC Att Pass Sks
at Dallas 3-19 -159 -9 -11.7 -1 13 12-35 2.9 29-38 198 3 22 31-129 4.2 24-39 263 1 at Washington 30-17 92 3 23.9 2 19 24-58 2.4 26-39 298 2 16 17-64 3.8 23-40 200 4 Detroit 10-24 13 2 -29.7 0 14 18-62 3.4 22-32 208 5 12 32-138 4.3 15-21 119 3 at Kansas City 20-27 62 11 -30.9 -2 27 17-107 6.3 25-46 299 6 16 19-112 5.9 21-28 232 4at Philadelphia NY Giantsat Tampa Bay at LA Chargers LA Chargers Arizonaat Denver at Carolina Seattle Washingtonat Bye San Francisco LA Rams Denverat San Francisco at Bye Kansas City at Dallasat Washington Chicagoat Oakland at Seattle Dallas at LA Rams Philadelphia at NY Giantsat Arizona Oakland Washington Dallas
Average 7-22 -73.0 0.0 -17.0 -1 14 15-49 3.2 26-35 203 11.4% 17 32-134 4.2 20-30 191 6.7% Average 25-22 77.0 0.0 -0.4 0 23 21-83 4.0 26-43 299 9.4% 16 18-88 4.9 22-34 216 11.8% Vs NFC East 3-19 -159.0 -9.0 -11.7 -1 13 12-35 2.9 29-38 198 7.9% 22 31-129 4.2 24-39 263 2.6% Vs NFC East 30-17 92.0 3.0 23.9 2 19 24-58 2.4 26-39 298 5.1% 16 17-64 3.8 23-40 200 10.0%
Away 3-19 -159.0 -9.0 -11.7 -1 13 12-35 2.9 29-38 198 7.9% 22 31-129 4.2 24-39 263 2.6% Home 0-0 0.0 0.0 0.0 0 0 0-0 0.0 0-0 0 0.0% 0 0-0 0.0 0-0 0 0.0%
at Dallas +4/47 Eli Manning 29-38-220-0-1 Paul Perkins 7-16-2.3-0 Roger Lewis 4-54-13.5-0 at Washington -1/49.5 Carson Wentz 26-39-307-2-1 LeGarrette Blount 14-46-3.3-0 Zach Ertz 8-93-11.6-0 Detroit -3/42 Eli Manning 22-32-239-1-1 Shane Vereen 6-28-4.7-0 Evan Engram 4-49-12.3-1 at Kansas City +5/46.5 Carson Wentz 25-46-333-2-1 Carson Wentz 4-55-13.8-0 Zach Ertz 5-97-19.4-0at Philadelphia vs. NY Giantsat Tampa Bay at LA Chargers LA Chargers Arizonaat Denver vs. at Carolina Seattle Washingtonat Bye San Francisco LA Rams vs. Denverat San Francisco at Bye Kansas City at Dallasat Washington vs. Chicagoat Oakland at Seattle Dallas at LA Rams Philadelphia vs. at NY Giantsat Arizona Oakland Washington Dallas
vs.
Eli Manning 51-70-459-1-2 Orleans Darkwa 6-31-5.2-0 Evan Engram 8-93-11.6-1 vs. Carson Wentz 51-85-640-4-2 Carson Wentz 8-61-7.6-0 Zach Ertz 13-190-14.6-0Shane Vereen 6-28-4.7-0 Shane Vereen 12-78-6.5-0 Darren Sproles 12-50-4.2-0 Alshon Jeffery 10-130-13.0-1Paul Perkins 14-26-1.9-0 Roger Lewis 6-67-11.2-0 LeGarrette Blount 14-46-3.3-0 Torrey Smith 5-96-19.2-0
vs. CategoryLine Score Yds FD Rush TO's
NY Giants -3 28 302 16 24-54PHILADELPHIA 43 23 443 21 25-96 0 vs.
Line Score Yds FD Rush TO'sNY Giants -2 19 470 24 25-114PHILADELPHIA 42 24 286 15 30-118 2 vs.
Line Score Yds FD Rush TO'sNY Giants 50.5 7 247 18 23-81PHILADELPHIA -4.5 27 425 24 37-155 -1
Line Score Yds FD Rush TO'sNY Giants -4 30 502 30 36-208PHILADELPHIA 50.5 35 435 23 26-120 -1
Line Score Yds FD Rush TO'sNY Giants 49.5 0 254 12 24-86Philadelphia -2 27 448 24 36-203 -1
New York Philadelphia
Washington Dallas
Philadelphia Total TO's at NY Giantsat Arizona Oakland
at Oakland Sks By at Seattle Dallas Ypg Diff at LA Rams
Kansas City Total Def at Dallasat Washington Score Def Chicago
LA Rams Rush Def Denverat San Francisco Pass Def at Bye
Seattle Score Off Washingtonat Bye Sks Allowed San Francisco
LA Chargers Pass Offat Denver Total Off
at Tampa Bay Rush Off
at Dallas 2017 CURRENT RANKINGS Detroitat Philadelphia
NFL RANKINGS
New York Philadelphia
PHI FOE
at Carolina
Philadelphia 22 points
#5Future Schedule Strength
#20 #21 Philadelphia By 13
12 points
24-38-189
#11 New York PhiladelphiaTeam Schedule Strength
Retu
rn t
o T
ab
le o
f C
on
ten
ts
Projected Box Score
Projected Passing199 yards New York
1.20
1.07
Projected Yardage Total258 yards New York Philadelphia 314 yards
PHI TOTAL PTS
PHI COACHES
Projected Final ScoreNew York
Receiving
Giants Net Stats Offense Defense
Philadelphia 94 yardsProjected Rushing
59 yards
Score
By Game Yardage Leaders Passing Rushing
Score
Position by Position Edges By Game Yardage Leaders
NYG SECONDARY
New
Yo
rk G
ian
ts
Weekly
Lead
ers
& T
eam
Ave
rag
es
Ph
ilad
elp
hia
Eag
les
PHI QB/WR
0.62
42.5 Points
Offense
Passing
Phil's Forecast:
Eagles Net Stats
Philadelphia
PHI SECONDARY
1.84NYG QB/WR
PHI LB's
Eagles LogsPhiladelphia Eagles
--PS RANK--
Las Vegas LineWeather: High 80's, clear. Normally when I throw the Giants in the trash they jump up and play to their talent level. I had the Giants as a top 10 team at the start of the year, but they have looked well below average thus far. The offensive line has allowed eight sacks and they are averaging just 252 yards per game. I am officially throwing them in the trash. The Eagles opened last year 4-0 straight up and ATS at home beating teams like the Steelers, Vikings and Falcons by 18 points per game. The Eagles have won their last three home games versus the Giants by 17 points per game. Philadelphia has outgained Washington and Kansas City by 77 yards per game on the road and they are now in their home opener where they should dominate.
Philadelphia By 6
Phil Steele
Philadelphia 22 - 12
Philadelphia 314 - 258
FOE
Rushing Receiving
Defense
at Washingtonat Kansas City NY Giantsat LA Chargers
GAME GRADES
Computer Yards
Team & Margin
Arizona
PHI
+/- Ratings
Computer Points
Las Vegas Total
PHI DEF LINE
NYG OFF LINE
New York
5.01
POSITIONAL EDGE AWARDED TO:
By 2.12 Points
Philadelphia
PLUS/MINUS
Philadelphia By 7.0
Game Grade
Eagles
Philadelphia By 14.2
BEST BET: H PHILADELPHIA 23 NY GIANTS 10
Philadelphia Season Leaders
RECORD
New York0.56
NYG COACHES
NYG KICKER
PHI KICKER
PHI RB's
NYG LB'S
0.45
Philadelphia 220 yardsNYG TOTAL PTS
0.04NYG DEF LINE
NYG SPECIAL TMS
PHI SPECIAL TMS
2.89
RECORD PLUS/MINUS GAME GRADES
0.55
NYG RB's1.56
PHI OFF LINE
Vs NFC East Vs NFC East0-2
0-1 1-0
1-1OVERALL: OVERALL:
NYG FOENYG
2016 Comp-Att-Yds
New York GiantsGiants Logs
--PS RANK-- FOE
New York Season Leaders
Last Five Meetings (Last 16 years at PhilSteele.com)
22-36-25727-47-364
2016 Comp-Att-Yds38-63-35614-25-168
2015 Comp-Att-Yds
24-38-2802015 Comp-Att-Yds
24-43-30230-38-320
2014 Comp-Att-Yds17-28-16821-34-245

SEA FOE SEA FOE DATE FOE SCORE W/L OFF DEF ST OFF DEF ST TEN FOE TEN FOE DATE FOE SCORE W/L OFF DEF ST OFF DEF ST0-0 0-0 105 103 83.1 #44 92.3 #10 9/10 9-17 L 11 3 16 5 25 31 0-0 0-0 100 102 83.6 #41 92.0 #12 9/10 16-26 L 6 17 24 4 24 60-1 0-1 104 98 83.9 #39 85.2 #35 9/17 12-9 W 18 1 16 31 30 22 0-1 1-0 97 102 95.9 #4 78.4 #56 9/17 37-16 W 9 17 24 21 6 211-1 1-1 101 102 9/24 21 1 16 6 15 24 1-1 1-1 102 101 9/24 6 15 24 21 1 16
0-2 94 10/1 29 30 20 #13 #6 1-1 97 10/1 29 30 201-1 96 10/8 26 11 2 #29 #15 1-0 99 10/8 26 11 2
10/15 #26 #6 0-2 94 10/16 14 28 90-2 98 10/22 28 8 13 #28 #9 0-2 94 10/22 28 8 131-1 97 10/29 30 5 27 #20 #1 10/291-1 98 11/5 14 28 9 #23 #17 2-0 105 11/5 14 28 91-1 98 11/9 23 14 29 #10 #20 0-2 93 11/12 23 14 292-0 108 11/20 1 12 25 #15 #23 2-0 108 11/16 1 12 250-2 91 11/26 31 29 22 #5 #16 0-2 94 11/26 31 29 221-1 102 12/3 10 16 1 #9 #18 1-1 97 12/3 10 16 11-1 97 12/10 19 13 21 #26 #10 1-1 98 12/10 19 13 211-1 96 12/17 26 11 2 1 2 0-2 91 12/17 26 11 21-1 99 12/24 9 27 17 25.57 Off YPP 13.96 1-1 96 12/24 9 27 171-1 98 12/31 23 14 29 #29 Off YPP Rank #11 1-1 97 12/31 23 14 29
23.77 Def YPP 15.93#4 Def YPP Rank #15
Comp Yds Comp Yds Comp Yds Comp YdsYds FD QBR TO's FD RA-RY YPC Att Pass Sks FD RA-RY YPC Att Pass Sks Yds FD QBR TO's FD RA-RY YPC Att Pass Sks FD RA-RY YPC Att Pass Sks
at Green Bay 9-17 -145 -14 -16.8 0 12 18-90 5.0 14-27 135 3 26 28-84 3.0 28-42 286 4 Oakland 16-26 -9 -1 -35.4 0 21 21-95 4.5 25-41 255 1 22 29-109 3.8 22-32 250 2 San Francisco 12-9 64 10 32.7 1 21 37-131 3.5 23-39 181 3 11 19-159 8.4 15-27 89 2 at Jacksonville 37-16 80 1 14.7 2 21 36-179 5.0 15-27 211 1 20 25-99 4.0 20-34 211 2at Tennessee Seattle Indianapolis at Houston at LA Rams at Miamiat Bye Indianapolisat NY Giants at Cleveland Houston at Bye Washington Baltimoreat Arizona Cincinnati Atlanta at Pittsburghat San Francisco at Indianapolis Philadelphia Houston at Jacksonville at Arizona LA Rams at San Franciscoat Dallas LA Rams Arizona Jacksonville
Average 11-13 -40.5 0.0 4.8 1 17 28-111 4.0 19-33 158 9.1% 19 24-122 5.2 22-35 188 8.7% Average 27-21 35.5 0.0 -9.5 2 21 29-137 4.8 20-34 233 2.9% 21 27-104 3.9 21-33 231 6.1% Vs NFC West 12-9 64.0 10.0 32.7 1 21 37-131 3.5 23-39 181 7.7% 11 19-159 8.4 15-27 89 7.4% Vs AFC South 37-16 80.0 1.0 14.7 2 21 36-179 5.0 15-27 211 3.7% 20 25-99 4.0 20-34 211 5.9%
Away 9-17 -145.0 -14.0 -16.8 0 12 18-90 5.0 14-27 135 11.1% 26 28-84 3.0 28-42 286 9.5% Home 16-26 -9.0 -1.0 -35.4 0 21 21-95 4.5 25-41 255 2.4% 22 29-109 3.8 22-32 250 6.3%
at Green Bay +3/51 Russell Wilson 14-27-158-0-0 Russell Wilson 2-40-20.0-0 Doug Baldwin 4-63-15.8-0 Oakland -2.5/50.5 Marcus Mariota 25-41-256-0-0 DeMarco Murray 12-44-3.7-0 Derrick Henry 7-76-10.9-0 San Francisco -13.5/41.5 Russell Wilson 23-39-198-1-0 Chris Carson 20-93-4.7-0 Tyler Lockett 6-64-10.7-0 at Jacksonville -1/41.5 Marcus Mariota 15-27-215-1-1 Derrick Henry 14-92-6.6-1 Delanie Walker 4-61-15.3-0at Tennessee vs. Seattle Indianapolis at Houston at LA Rams at Miamiat Bye vs. Indianapolisat NY Giants at Cleveland Houston at Bye Washington vs. Baltimoreat Arizona Cincinnati Atlanta at Pittsburghat San Francisco vs. at Indianapolis Philadelphia Houston at Jacksonville at Arizona LA Rams vs. at San Franciscoat Dallas LA Rams Arizona Jacksonville
vs.
Russell Wilson 37-66-356-1-0 Chris Carson 26-132-5.1-0 Doug Baldwin 10-107-10.7-0 vs. Marcus Mariota 40-68-471-1-1 Derrick Henry 20-117-5.9-1 Rishard Matthews 8-114-14.3-0Russell Wilson 14-74-5.3-0 Sheldon Richardson 6-78-13.0-1 DeMarco Murray 21-69-3.3-0 Derrick Henry 7-76-10.9-0CJ Prosise 4-11-2.8-0 Tyler Lockett 7-72-10.3-0 Marcus Mariota 9-50-5.6-1 Corey Davis 7-73-10.4-0
vs. CategoryLine Score Yds FD Rush TO's
Seattle -12 20 404 24 33-151Tennessee 41.5 13 223 13 20-66 0 vs.
vs.
Arizona Jacksonville
LA Rams Total TO's at San Francisco LA Rams
Philadelphia Sks By Houston Ypg Diff at Arizona
at Byeat Cleveland
Atlanta Total Def at Pittsburgh
Baltimore Cincinnati
at Houston
at Bye Total Off Indianapolis
at Tennessee Seattle
Seahawks Logs Vs NFC West Vs AFC South Titans Logs
Seahawks
Score OffSks Allowed
at Miami
Future Schedule Strength#6
By 1.84 PointsTennessee#28 Seattle #31
#26 Seattle Tennessee
14 points Seattle Tennessee
Seattle Season Leaders
Last Five Meetings (Last 16 years at PhilSteele.com) Projected Box Score
Retu
rn t
o T
ab
le o
f C
on
ten
ts
Team Schedule Strength
Projected RushingTennessee86 yards Seattle
Projected Yardage Total
101 yards
Seattle Tennessee 180 yards
20 points
281 yards
Projected Passing
Projected Final Score
185 yards
271 yards TennesseeSeattle
Tennessee By 2.5
0.32SEA SECONDARY
TEN QB/WR
SEA COACHES
TEN COACHES
Tennessee Season LeadersTEN SPECIAL TMS
Score
By Game Yardage Leaders Passing Rushing Receiving
at NY Giants Houston
at Arizona Washington
at San Francisco
at Jacksonville
at Dallas
Defense
NFL RANKINGSat Green Bay 2017 CURRENT RANKINGS
Indianapolis Rush Off
San FranciscoSeattle
at LA Rams Pass Off
RECORD PLUS/MINUS GAME GRADESSEA FOE
Tennessee Titans1-1
at Indianapolis
Phil's Forecast:
Weather: Mid 80's, partly cloudy. It took Pete Carroll three years to get them to being a playoff/Super Bowl caliber team. Since 2012 the Seahawks are 10-3-3 as a ‘dog. I thought Tennessee would beat Oakland in the opener, but the Titans struggled in a 10 point defeat. Seattle is averaging just 269 yards per game, but had just 15 points in their first two games last year before exploding for 30 points per game over the next three. I will gladly take Seattle as a ‘dog.
ReceivingRushing
Offense Defense
42.5 Points
By Game Yardage Leaders
--PS RANK--
Titans Net Stats
at Jacksonville Oakland
TENPLUS/MINUS GAME GRADES
SEA OFF LINE
TEN RB's
0.04SEA DEF LINE
SEA LB'S0.19
TEN DEF LINE
TEN SECONDARY
Tennessee
Ten
ness
ee T
itan
s
Weekly
Lead
ers
& T
eam
Ave
rag
es
Score
Position by Position Edges
OVERALL:
1-0
Score Def
OVERALL:1-1
TEN OFF LINE
RECORD
Pass Def
1-0
SEA RB's
TEN LB's
SEA QB/WR
Seattle
1.30
0.07
0.99
Seatt
le S
eah
aw
ks
Tennessee
Rush Def
Team & Margin
Passing
FOETENFOE
SEATTLE 17 TENNESSEE 16
Seattle
POSITIONAL EDGE AWARDED TO:
3.47SEA TOTAL PTS
TEN TOTAL PTS
1.62 Tennessee By 4.0+/- Ratings
Game Grade
Tennessee 281 - 271
Phil Steele
Tennessee By 9.3
Computer Yards
Computer PointsTennessee 20 - 14
Seattle By 1
Las Vegas Total
0.32SEA SPECIAL TMS
TEN KICKER Las Vegas Line
1.73
SEA KICKER
0.142013 Comp-Att-Yds
23-31-253
Seattle SeahawksSEA --PS RANK-- FOE
Seahawks Net Stats Offense
17-29-157

KC FOE KC FOE DATE FOE SCORE W/L OFF DEF ST OFF DEF ST LAC FOE LAC FOE DATE FOE SCORE W/L OFF DEF ST OFF DEF ST0-0 0-0 102 108 98.5 #1 80.4 #51 9/7 42-27 W 17 9 3 3 7 7 0-0 0-0 98 100 88.6 #21 87.1 #29 9/11 21-24 L 20 6 30 27 2 151-0 1-0 107 102 89.7 #19 88.5 #22 9/17 27-20 W 11 8 3 10 16 1 0-1 0-0 98 97 83.4 #42 86.7 #31 9/17 17-19 L 12 15 30 25 25 42-0 0-2 107 96 9/24 8 9 3 13 18 30 0-2 2-0 96 107 9/24 13 18 30 8 9 3
1-1 98 10/2 14 28 9 #2 #31 1-1 102 10/1 14 28 91-1 97 10/8 30 5 27 #5 #9 0-2 98 10/8 30 5 272-0 108 10/15 2 6 23 #2 #20 2-0 106 10/15 2 6 232-0 106 10/19 4 25 6 #2 #18 2-0 105 10/22 4 25 62-0 105 10/30 12 4 15 #25 #1 1-1 105 10/29 12 4 151-1 99 11/5 9 27 17 #20 #26 11/5
11/12 #27 #14 1-1 97 11/12 14 28 90-2 98 11/19 28 8 13 #29 #21 1-1 97 11/19 28 8 131-1 97 11/26 18 20 11 #25 #17 1-1 99 11/23 18 20 110-2 88 12/3 32 31 32 #2 #9 0-2 94 12/3 32 31 322-0 106 12/10 4 25 6 #8 #23 1-1 98 12/10 4 25 60-2 96 12/16 13 18 30 1 1 2-0 107 12/16 13 18 301-0 99 12/24 22 22 4 12.77 Off YPP 16.21 0-2 88 12/24 22 22 42-0 105 12/31 12 4 15 #6 Off YPP Rank #16 2-0 106 12/31 12 4 15
16.53 Def YPP 15.28#13 Def YPP Rank #18
Comp Yds Comp Yds Comp Yds Comp YdsYds FD QBR TO's FD RA-RY YPC Att Pass Sks FD RA-RY YPC Att Pass Sks Yds FD QBR TO's FD RA-RY YPC Att Pass Sks FD RA-RY YPC Att Pass Sks
at New England 42-27 166 1 78.5 -1 26 27-185 6.9 28-35 352 3 25 35-124 3.5 16-36 247 3 at Denver 21-24 -72 -5 5.4 1 17 22-64 2.9 22-33 185 1 22 36-140 3.9 17-28 181 4 Philadelphia 27-20 -62 -11 27.0 2 16 19-112 5.9 21-29 232 4 27 17-107 6.3 25-46 299 6 Miami 17-19 31 3 11.7 0 24 14-44 3.1 31-39 323 1 21 32-111 3.5 24-34 225 2at LA Chargers Kansas City Washington Philadelphiaat Houston at NY Giants Pittsburgh at Oaklandat Oakland Denver Denver at New Englandat Dallas at Byeat Bye at Jacksonvilleat NY Giants Buffalo Buffalo at Dallasat NY Jets Cleveland Oakland Washington LA Chargers at Kansas City Miami at NY Jetsat Denver Oakland
Average 35-24 52.0 0.0 54.9 1 21 23-149 6.5 25-32 292 10.9% 26 26-116 4.4 21-41 273 11.0% Average 19-22 -20.5 0.0 9.6 1 21 18-54 3.0 27-36 254 2.8% 22 34-126 3.7 21-31 203 9.7% Vs AFC West 0-0 0.0 0.0 0.0 0 0 0-0 0.0 0-0 0 #DIV/0! 0 0-0 0.0 0-0 0 #DIV/0! Vs AFC West 21-24 -72.0 -5.0 5.4 1 17 22-64 2.9 22-33 185 3.0% 22 36-140 3.9 17-28 181 14.3%
Away 42-27 166.0 1.0 78.5 -1 26 27-185 6.9 28-35 352 8.6% 25 35-124 3.5 16-36 247 8.3% Home 17-19 31.0 3.0 11.7 0 24 14-44 3.1 31-39 323 2.6% 21 32-111 3.5 24-34 225 5.9%
at New England +8.5/48 Alex Smith 28-35-368-4-0 Kareem Hunt 17-148-8.7-1 Tyreek Hill 7-133-19.0-1 at Denver +3/43 Philip Rivers 22-33-192-3-1 Melvin Gordon 18-54-3.0-0 Tyrell Williams 5-54-10.8-0 Philadelphia -5/46.5 Alex Smith 21-28-251-1-0 Kareem Hunt 13-81-6.2-2 Travis Kelce 8-103-12.9-1 Miami -3.5/45.5 Philip Rivers 31-39-331-1-0 Branden Oliver 3-31-10.3-0 Keenan Allen 9-100-11.1-0at LA Chargers vs. Kansas City Washington Philadelphiaat Houston at NY Giants Pittsburgh vs. at Oaklandat Oakland Denver Denver at New Englandat Dallas vs. at Byeat Bye at Jacksonvilleat NY Giants Buffalo Buffalo vs. at Dallasat NY Jets Cleveland Oakland Washington LA Chargers vs. at Kansas City Miami at NY Jetsat Denver Oakland
vs.
Alex Smith 49-63-619-5-0 Kareem Hunt 30-229-7.6-3 Tyreek Hill 11-176-16.0-1 vs. Philip Rivers 53-72-523-4-1 Melvin Gordon 27-67-2.5-1 Keenan Allen 14-135-9.6-1Alex Smith 9-24-2.7-0 Travis Kelce 13-143-11.0-1 Branden Oliver 7-41-5.9-0 Tyrell Williams 9-108-12.0-0Charcandrick West 1-21-21.0-1 Kareem Hunt 8-126-15.8-2 Philip Rivers 1-0-0.0-0 Melvin Gordon 12-90-7.5-1
vs. CategoryLine Score Yds FD Rush TO's
Kansas City -6.5 33 413 26 19-83SAN DIEGO 45 27 388 25 32-155 1 vs.
Line Score Yds FD Rush TO'sKansas City -5 37 365 26 31-103SAN DIEGO 44.5 27 398 26 26-129 -1 vs.
Line Score Yds FD Rush TO'sKansas City -3 33 385 22 31-153SAN DIEGO 45 3 201 14 25-52 -2
Line Score Yds FD Rush TO'sKansas City -10.5 10 329 18 25-150SAN DIEGO 44 3 280 15 18-44 1
Line Score Yds FD Rush TO'sKansas City 45 23 365 22 39-154San Diego -3 20 251 19 16-69 -1
Miami at NY Jetsat Denver Oakland
Oakland Ypg Diff Washington LA Chargers Total TO's at Kansas City
Buffalo Score Def at Dallasat NY Jets Sks By Cleveland
at Bye Pass Def at Jacksonvilleat NY Giants Total Def Buffalo
Denver Sks Allowed at New Englandat Dallas Rush Def at Bye
Pittsburgh Total Off at Oaklandat Oakland Score Off Denver
Washington Rush Off Philadelphiaat Houston Pass Off at NY Giants
PhiladelphiaKansas City Los Angeles
Miamiat LA Chargers Kansas City
Kansas City By 10 BEST BET: H KANSAS CITY 30 LA CHARGERS 20Phil Steele
#19 Kansas City Los Angeles #16 By 5.86 Points
Chiefs#3 Kansas City 21 - 19Future Schedule StrengthKansas City Los Angeles #7
Computer Points
303 yards
Los Angeles 19 pointsKansas City
Projected Final Score21 points Kansas City
Kansas City
Team Schedule Strength
Los Angeles
Computer Yards
Las Vegas Line
302 yardsPOSITIONAL EDGE AWARDED TO:
0.52
0.29
2.43KC COACHES
LAC COACHES
KC SECONDARY
KC SPECIAL TMS
193 yards 6.38KC TOTAL PTS
LAC TOTAL PTSProjected Yardage Total
78 yards
Los Angeles 223 yardsProjected Passing
109 yards
Position by Position EdgesKansas City Los Angeles
LAC SPECIAL TMS
0.52LAC QB/WR
Projected Box Score
Projected Rushing
KC KICKER
LAC KICKER
Score Score
Kan
sas
Cit
y C
hie
fs
Weekly
Lead
ers
& T
eam
Ave
rag
es
Los
An
gele
s C
harg
ers
Chiefs Net Stats Offense Defense
at New England
RECORDKC
2017 CURRENT RANKINGS
--PS RANK-- FOE 0-0NFL RANKINGS
0-1FOEKC
RECORD PLUS/MINUS GAME GRADES
Kansas City Chiefs OVERALL:
Chargers Logs
Rushing
FOE
Offense
--PS RANK--LACFOE
Defense
OVERALL:2-0 0-2
Vs AFC West Vs AFC West
By Game Yardage Leaders
Kansas City 303 - 302
Los Angeles Season Leaders
GAME GRADESLAC
+/- RatingsKansas City By 8.0
Passing
Phil's Forecast:
Weather: Low 80's, clear. The Chiefs have won six in a row in this series and could have a decent crowd in this small venue like the Dolphins did a week ago. Kansas City has been the most impressive team in the NFL the first two weeks, including that 42-27 win at New England. Last year it was a bunch of near misses in San Diego and while they are now in Los Angeles, it is more of the same as they are two missed field goals away from possibly being undefeated. The Chiefs have played the tougher schedule and with an improved offense featuring rookie running back Kareem Hunt, they are potent. While my computer calls for a 2 pt win by the visitor, the Chargers are on a 0-6-1 ATS run and drop another one against the spread this week.
Kansas City By 3
47.5 Points
Kansas City By 5.1
Los Angeles Chargers
Receiving
Chargers Net Stats
at Denver
PLUS/MINUS
Kansas City Season Leaders
Team & Margin
Las Vegas TotalKansas City
Kansas City
2.06
Los Angeles
Game Grade
KC LB'S
LAC RB's
0.54KC DEF LINE
LAC OFF LINE
0.30
LAC DEF LINE
0.18KC OFF LINE
LAC LB's
0.07KC RB's
LAC SECONDARY
0.51KC QB/WR
2016 Comp-Att-Yds34-48-363
Chiefs Logs
Passing Rushing Receiving
Last Five Meetings (Last 16 years at PhilSteele.com)
By Game Yardage Leaders
Retu
rn t
o T
ab
le o
f C
on
ten
ts
25-36-2432016 Comp-Att-Yds
21-28-26422-38-269
2015 Comp-Att-Yds20-25-25319-30-178
2015 Comp-Att-Yds15-23-19124-43-263
2014 Comp-Att-Yds19-28-21117-31-182

CIN FOE CIN FOE DATE FOE SCORE W/L OFF DEF ST OFF DEF ST GB FOE GB FOE DATE FOE SCORE W/L OFF DEF ST OFF DEF ST0-0 0-0 100 100 75.9 #60 95.3 #6 9/10 0-20 L 19 10 18 23 18 8 0-0 0-0 103 105 92.3 #10 83.1 #44 9/10 17-9 W 5 25 31 11 3 160-1 0-1 95 95 84.4 #37 86.8 #30 9/14 9-13 L 27 10 18 29 4 27 1-0 1-0 104 107 86.2 #32 91.9 #13 9/17 23-34 L 6 19 31 1 14 250-2 1-1 93 103 9/24 27 7 18 7 23 31 1-1 0-2 103 93 9/24 7 23 31 27 7 18
0-2 94 10/1 24 26 19 #22 #27 0-2 93 9/28 24 26 191-1 97 10/8 18 20 11 #22 #4 1-1 99 10/8 18 20 11
10/15 #27 #7 1-1 100 10/15 14 28 92-0 108 10/22 2 6 23 #32 #15 0-2 96 10/22 2 6 230-2 94 10/29 29 30 20 #27 #25 10/291-1 97 11/5 19 13 21 #31 #20 2-0 103 11/6 19 13 211-1 102 11/12 6 15 24 #1 #9 0-2 93 11/12 6 15 242-0 105 11/19 12 4 15 #5 #8 2-0 105 11/19 12 4 150-2 94 11/26 24 26 19 #7 #17 2-0 108 11/26 24 26 192-0 108 12/4 2 6 23 #18 #9 1-0 102 12/3 2 6 230-2 93 12/10 25 21 28 #20 #5 0-2 94 12/10 25 21 281-1 100 12/17 17 3 26 -5 -2 2-0 102 12/17 17 3 262-0 103 12/24 16 24 5 100.00 Off YPP 18.43 1-1 100 12/23 16 24 52-0 105 12/31 20 10 8 #32 Off YPP Rank #21 2-0 103 12/31 20 10 8
16.18 Def YPP 13.70#14 Def YPP Rank #25
Comp Yds Comp Yds Comp Yds Comp YdsYds FD QBR TO's FD RA-RY YPC Att Pass Sks FD RA-RY YPC Att Pass Sks Yds FD QBR TO's FD RA-RY YPC Att Pass Sks FD RA-RY YPC Att Pass Sks
Baltimore 0-20 -47 -3 -42.6 -4 14 22-77 3.5 16-31 144 5 17 42-157 3.7 9-17 111 1 Seattle 17-9 145 14 16.8 0 26 28-84 3.0 28-42 286 4 12 18-90 5.0 14-27 135 3 Houston 9-13 29 -2 0.5 -1 12 24-82 3.4 20-35 213 3 14 35-168 4.8 15-24 98 3 at Atlanta 23-34 3 5 -17.4 -2 24 15-59 3.9 33-50 308 3 19 27-141 5.2 19-28 223 3at Green Bay Cincinnatiat Cleveland Chicago Buffalo at Dallasat Bye at Minnesotaat Pittsburgh New Orleans Indianapolis at Byeat Jacksonville Detroitat Tennessee at Chicagoat Denver Baltimore Cleveland at Pittsburgh Pittsburgh Tampa Bay Chicago at Clevelandat Minnesota at Carolina Detroit Minnesotaat Baltimore at Detroit
Average 5-17 -9.0 0.0 -26.7 -5 13 23-80 3.5 18-33 179 12.1% 16 39-163 4.2 12-21 105 9.8% Average 20-22 74.0 0.0 -0.4 -2 25 22-72 3.3 31-46 297 7.6% 16 23-116 5.1 17-28 179 10.9% Vs AFC North 0-20 -47.0 -3.0 -42.6 -4 14 22-77 3.5 16-31 144 16.1% 17 42-157 3.7 9-17 111 5.9% Vs NFC North 0-0 0.0 0.0 0.0 0 0 0-0 0.0 0-0 0 0.0% 0 0-0 0.0 0-0 0 0.0%
Away 0-0 0.0 0.0 0.0 0 0 0-0 0.0 0-0 0 0.0% 0 0-0 0.0 0-0 0 0.0% Home 17-9 145.0 14.0 16.8 0 26 28-84 3.0 28-42 286 9.5% 12 18-90 5.0 14-27 135 11.1%
Baltimore -3/41 Andy Dalton 16-31-170-0-4 Giovani Bernard 7-40-5.7-0 AJ Green 5-74-14.8-0 Seattle -3/51 Aaron Rodgers 28-42-311-1-1 Ty Montgomery 19-54-2.8-1 Randall Cobb 9-85-9.4-0 Houston -6.5/38 Andy Dalton 20-35-224-0-0 Joe Mixon 9-36-4.0-0 AJ Green 5-67-13.4-0 at Atlanta +3/54.5 Aaron Rodgers 33-50-343-2-1 Ty Montgomery 10-35-3.5-1 Davante Adams 8-99-12.4-1at Green Bay vs. Cincinnatiat Cleveland Chicago Buffalo at Dallasat Bye vs. at Minnesotaat Pittsburgh New Orleans Indianapolis at Byeat Jacksonville vs. Detroitat Tennessee at Chicagoat Denver Baltimore Cleveland vs. at Pittsburgh Pittsburgh Tampa Bay Chicago at Clevelandat Minnesota vs. at Carolina Detroit Minnesotaat Baltimore at Detroit
vs.
Andy Dalton 36-66-394-0-4 Giovani Bernard 12-50-4.2-0 AJ Green 10-141-14.1-0 vs. Aaron Rodgers 61-92-654-3-2 Ty Montgomery 29-89-3.1-2 Davante Adams 11-146-13.3-1Joe Mixon 17-45-2.6-0 Alex Erickson 4-62-15.5-0 Aaron Rodgers 9-29-3.2-0 Randall Cobb 15-145-9.7-0Jeremy Hill 12-43-3.6-0 Giovani Bernard 3-55-18.3-0 Jamaal Williams 4-15-3.8-0 Ty Montgomery 10-114-11.4-1
vs. CategoryLine Score Yds FD Rush TO's
Cincinnati 50 34 297 19 24-82Green Bay -2.5 30 399 27 30-182 0 vs.
vs.
Detroit Minnesotaat Baltimore at Detroit
Chicago Ypg Diff at Clevelandat Minnesota Total TO's at Carolina
Cleveland Score Def at Pittsburgh Pittsburgh Sks By Tampa Bay
at Tennessee Pass Def at Chicagoat Denver Total Def Baltimore
Indianapolis Sks Allowed at Byeat Jacksonville Rush Def Detroit
at Bye Total Off at Minnesotaat Pittsburgh Score Off New Orleans
at Cleveland Rush Off Chicago Buffalo Pass Off at Dallas
Houston Cincinnati Green Bay
at Atlantaat Green Bay Cincinnati
Cincinnati Green Bay
Cincinnati Green Bay #10 By 0.00 Points
#1Future Schedule Strength
Computer Yards
Cincinnati
Projected Final ScoreGreen Bay 21 points14 points Cincinnati
Team Schedule Strength
POSITIONAL EDGE AWARDED TO:
Computer Points
#14
Cincinnati Season Leaders Green Bay Season Leaders
0.03Last Five Meetings (Last 16 years at PhilSteele.com) Team & Margin
Retu
rn t
o T
ab
le o
f C
on
ten
ts
Green Bay
Las Vegas Line
#14
Phil Steele
1.26GB QB/WR
0.83
280 yards Cincinnati Green Bay 309 yardsProjected Yardage Total
Receiving Passing Rushing Receiving
GAME GRADES
Offense DefenseScore
Bengals Net Stats Offense Defense
Baltimore 2017 CURRENT RANKINGS Seattle
0-1 --PS RANK-- FOENFL RANKINGS GB FOE
GB0-0 RECORD PLUS/MINUSVs AFC North Vs NFC North Packers Logs
RECORD PLUS/MINUS GAME GRADESCIN FOE
CIN
Cincinnati Bengals OVERALL: OVERALL: Green Bay Packers0-2 1-1
Phil's Forecast:
Las Vegas Total
Game Grade
Bengals
GREEN BAY 23 CINCINNATI 13Green Bay By 13
Cincinnati Green Bay 96 yards
Projected Box Score
97 yards
Green Bay By 11.6
Weather: High 80's, clear. Since 2014 the Packers are just 11-10-1 ATS off a loss. Coming into the season, I had the Bengals as a playoff contender with their main weakness being the offensive line. Their offense has been virtually non-existent thus far as they’ve mustered just nine points and have yet to reach the end zone. Green Bay’s defensive home performance in week one against the Seahawks where they surrendered just nine points has me leaning with them a bit more than my computer's forecast in this one.
Green Bay 309 - 280
Green Bay 21 - 14
46.5 Points
Green Bay By 9
Green Bay By 12.5GB TOTAL PTS
+/- RatingsProjected Passing CIN TOTAL PTS2.59183 yards Cincinnati 212 yards 2.60
CIN SPECIAL TMS
GB KICKER
Projected RushingCIN COACHES
GB COACHES
1.27GB SPECIAL TMS
CIN KICKER
GB RB's
GB OFF LINE
CIN DEF LINEGB DEF LINE
CIN OFF LINE
0.50CIN LB'S
0.28
CIN SECONDARY
0.47
GB LB's
0.17CIN RB's
GB SECONDARY
0.37CIN QB/WR
Cincinnati Green BayPosition by Position Edges
Cin
cin
nati
Ben
gals
Weekly
Lead
ers
& T
eam
Ave
rag
es
Gre
en
Bay
Pack
ers
Score
By Game Yardage Leaders
Packers Net Stats
2013 Comp-Att-Yds20-28-215
Bengals Logs--PS RANK-- FOE
By Game Yardage Leaders Passing Rushing
26-43-217

OAK FOE OAK FOE DATE FOE SCORE W/L OFF DEF ST OFF DEF ST WAS FOE WAS FOE DATE FOE SCORE W/L OFF DEF ST OFF DEF ST0-0 0-0 102 100 92.0 #12 83.6 #41 9/10 26-16 W 4 24 6 6 17 24 0-0 0-0 99 98 80.3 #52 93.1 #9 9/10 17-30 L 16 28 9 8 19 11-0 0-1 105 89 90.1 #17 76.3 #59 9/17 45-20 W 8 23 6 32 29 32 0-1 1-0 95 100 89.4 #20 79.9 #53 9/17 27-20 W 20 28 9 30 11 22-0 1-1 106 98 9/24 4 25 6 14 28 9 1-1 2-0 98 106 9/24 14 28 9 4 25 6
2-0 105 10/1 12 4 15 #5 #3 2-0 107 10/2 12 4 152-0 105 10/8 20 10 8 #13 #23 10/80-2 96 10/15 13 18 30 #4 #15 0-2 91 10/15 13 18 302-0 107 10/19 8 9 3 #1 #13 1-1 102 10/23 8 9 31-1 97 10/29 18 20 11 #1 #20 1-1 99 10/29 18 20 111-0 99 11/5 22 22 4 #19 #9 1-1 101 11/5 22 22 4
11/12 #12 #26 1-1 100 11/12 14 28 91-1 105 11/19 3 17 7 #17 #26 0-2 96 11/19 3 17 72-0 105 11/26 12 4 15 #11 #27 0-2 98 11/23 12 4 150-2 98 12/3 28 8 13 #14 #18 1-1 99 11/30 28 8 132-0 107 12/10 8 9 3 #5 #21 0-2 96 12/10 8 9 31-1 99 12/17 9 27 17 2 0 1-1 98 12/17 9 27 171-1 102 12/25 10 16 1 10.83 Off YPP 14.75 2-0 105 12/24 10 16 10-2 96 12/31 13 18 30 #5 Off YPP Rank #13 0-2 98 12/31 13 18 30
17.25 Def YPP 13.76#9 Def YPP Rank #24
Comp Yds Comp Yds Comp Yds Comp YdsYds FD QBR TO's FD RA-RY YPC Att Pass Sks FD RA-RY YPC Att Pass Sks Yds FD QBR TO's FD RA-RY YPC Att Pass Sks FD RA-RY YPC Att Pass Sks
at Tennessee 26-16 9 1 35.4 0 22 29-109 3.8 22-32 250 2 21 21-95 4.5 25-41 255 1 Philadelphia 17-30 -92 -3 -23.9 -2 16 17-64 3.8 23-40 200 4 19 24-58 2.4 26-39 298 2 NY Jets 45-20 139 4 23.5 2 21 27-180 6.7 23-28 230 0 17 25-126 5.0 17-25 145 4 at LA Rams 27-20 53 7 7.1 2 21 39-229 5.9 18-27 156 2 14 21-92 4.4 16-26 240 2at Washington Oaklandat Denver at Kansas City Baltimore at Bye LA Chargers San Francisco Kansas City at Philadelphiaat Buffalo Dallasat Miami at Seattleat Bye Minnesota† New England at New Orleans Denver NY Giants NY Giants at Dallasat Kansas City at LA Chargers Dallas Arizonaat Philadelphia Denverat LA Chargers at NY Giants
Average 36-18 74.0 0.0 34.7 2 22 28-145 5.2 23-30 240 3.3% 19 23-111 4.8 21-33 200 7.6% Average 22-25 -19.5 0.0 -11.5 0 19 28-147 5.2 21-34 178 9.0% 17 23-75 3.3 21-33 269 6.2% Vs AFC West 0-0 0.0 0.0 0.0 0 0 0-0 0.0 0-0 0 0.0% 0 0-0 0.0 0-0 0 0.0% Vs NFC East 17-30 -92.0 -3.0 -23.9 -2 16 17-64 3.8 23-40 200 10.0% 19 24-58 2.4 26-39 298 5.1%
Away 26-16 9.0 1.0 35.4 0 22 29-109 3.8 22-32 250 6.3% 21 21-95 4.5 25-41 255 2.4% Home 17-30 -92.0 -3.0 -23.9 -2 16 17-64 3.8 23-40 200 10.0% 19 24-58 2.4 26-39 298 5.1%
at Tennessee +2.5/50.5 Derek Carr 22-32-262-2-0 Marshawn Lynch 18-76-0.0-0 Michael Crabtree 6-83-0.0-0 Philadelphia +1/49.5 Kirk Cousins 23-40-240-1-1 Rob Kelley 10-30-3.0-0 Terrelle Pryor 6-66-11.0-0 NY Jets -13.5/43.5 Derek Carr 23-28-230-3-0 Jalen Richard 6-58-0.0-1 Michael Crabtree 6-80-0.0-3 at LA Rams +2.5/45.5 Kirk Cousins 18-27-179-1-0 Rob Kelley 12-78-6.5-0 Jordan Reed 6-48-8.0-0at Washington vs. Oaklandat Denver at Kansas City Baltimore at Bye LA Chargers vs. San Francisco Kansas City at Philadelphiaat Buffalo Dallasat Miami vs. at Seattleat Bye Minnesota† New England at New Orleans Denver vs. NY Giants NY Giants at Dallasat Kansas City at LA Chargers Dallas vs. Arizonaat Philadelphia Denverat LA Chargers at NY Giants
vs.
Derek Carr 45-60-492-5-0 Marshawn Lynch 30-121-4.0-1 Michael Crabtree 12-163-13.6-3 vs. Kirk Cousins 41-67-419-2-1 Rob Kelley 22-108-4.9-0 Terrelle Pryor 8-97-12.1-0Jalen Richard 11-80-7.3-1 Amari Cooper 9-95-10.6-1 Chris Thompson 6-81-13.5-2 Jordan Reed 11-84-7.6-0Cordarrelle Patterson 4-62-15.5-1 Jared Cook 9-81-9.0-0 Samaje Perine 21-67-3.2-0 Chris Thompson 7-81-11.6-1
vs. CategoryLine Score Yds FD Rush TO's
Oakland 44 14 298 14 26-104Washington -3 24 339 15 32-122 2 vs.
vs.
Raiders Net Stats Offense Defense
Oakla
nd
Raid
ers
Weekly
Lead
ers
& T
eam
Ave
rag
es
Wash
ing
ton
Red
skin
s
Redskins Net Stats Offense
Denverat LA Chargers at NY Giantsat Philadelphia
at Kansas City Ypg Diff at LA Chargers Dallas Total TO's Arizona
Denver Score Def NY Giants NY Giants Sks By at Dallas
Pass Def Minnesota† New England Total Def at New Orleans
Sks Allowed Dallasat Miami Rush Def at Seattle
Total Off San Francisco Kansas City Score Off at Philadelphia LA Chargers
Rush Off at Kansas City Baltimore Pass Off at Bye
Oakland Washingtonat LA Rams
at Washington Oakland
at Tennessee 2017 CURRENT RANKINGS Philadelphia
OAK --PS RANK-- FOE GAME GRADES
Oakland Washington #11#3
Washington 320 yardsProjected Final Score
Oakland
327 yards Oakland
23 pointsTeam Schedule Strength Computer Points
#25 Oakland Washington #17
Projected Yardage Total
Washington 22 points
215 yards Oakland
Projected Rushing
Projected Passing3.98
OAK TOTAL PTS112 yards Oakland Washington 111 yards
Washington 208 yards 1.07
Game GradePOSITIONAL EDGE AWARDED TO:
Computer Yards
WAS TOTAL PTS
Oakland
Phil's Forecast:
OAK COACHES Oakland By 3
Las Vegas Total54.5 Points
Las Vegas Line
Team & Margin
WAS COACHES
0.05OAK KICKER
0.24OAK SPECIAL TMS
WAS KICKER
Oakland WashingtonPosition by Position Edges
0.05OAK RB's
WAS LB's
OAK DEF LINE
1.64
By Game Yardage Leaders
DefenseScore Score
By Game Yardage Leaders Passing Rushing Receiving Rushing ReceivingPassing
FOENFL RANKINGS WAS FOE
WAS0-0 0-1 RECORD PLUS/MINUSRedskins Logs
RECORD PLUS/MINUS GAME GRADESOAK FOE
--PS RANK--Vs NFC EastVs AFC West
OVERALL: OVERALL:
WAS DEF LINE
0.45
OAK OFF LINE
WAS OFF LINE
1.44
Phil SteeleBy 2.91 Points Oakland By 6 OAKLAND 30 WASHINGTON 24
Weather: High 70's, clear. After an expected win last weekend in the “Black Hole” against the Jets, the Raiders head East for second time this season sporting an excellent 13-3 ATS mark in road games dating back to the start of 2015. While the Redskins also finished with a victory last week in their road trip to Los Angeles, they did struggle in their home opener against the Eagles (outgained 356-264) in the 13 point defeat. With one of the strongest and consistent offensive lines in the NFL protecting QB Derek Carr, I’ll call for the Raiders to remain undefeated this weekend.
0.57
Future Schedule StrengthRaiders
Retu
rn t
o T
ab
le o
f C
on
ten
ts
Projected Box Score21-32-19418-31-217
Last Five Meetings (Last 16 years at PhilSteele.com)
Oakland 23 - 22
Oakland 327 - 320
+/- RatingsOakland By 5.0
Oakland By 3.2
OAK SECONDARY
WAS QB/WR
OAK LB'S
Washington Season Leaders
0.08
WAS SECONDARY
WAS RB's
0.54
OAK QB/WR
WAS SPECIAL TMS
Washington Redskins2-0 1-1
2013 Comp-Att-Yds
Oakland RaidersRaiders Logs
Oakland Season Leaders
NY Jets
at Denver
at Buffalo
at Bye

DAL FOE DAL FOE DATE FOE SCORE W/L OFF DEF ST OFF DEF ST ARZ FOE ARZ FOE DATE FOE SCORE W/L OFF DEF ST OFF DEF ST0-0 0-0 102 102 92.1 #11 77.7 #58 9/10 19-3 W 15 16 17 28 5 13 0-0 0-0 100 99 79.6 #54 91.2 #14 9/10 23-35 L 10 14 29 18 30 51-0 1-0 104 100 82.7 #45 93.5 #8 9/17 17-42 L 5 22 17 19 3 15 0-1 0-1 98 94 84.3 #38 81.7 #47 9/17 16-13 W 14 18 29 24 32 201-1 1-1 99 98 9/25 9 27 17 23 14 29 1-1 1-1 98 99 9/25 23 14 29 9 27 17
1-1 96 10/1 26 11 2 #19 #30 0-2 91 10/1 26 11 21-1 103 10/8 7 23 31 #10 #6 1-1 102 10/8 7 23 31
10/15 #14 #12 1-0 102 10/15 14 28 90-2 91 10/22 31 29 22 #21 #16 1-1 96 10/22 31 29 221-1 98 10/29 14 28 9 #8 #14 10/292-0 107 11/5 8 9 3 #18 #10 0-2 91 11/5 8 9 32-0 108 11/12 1 12 25 #12 #22 1-1 101 11/9 1 12 251-1 102 11/19 10 16 1 #14 #19 1-1 97 11/19 10 16 10-2 96 11/23 13 18 30 #22 #26 1-1 97 11/26 13 18 301-1 98 11/30 14 28 9 #14 #14 1-1 96 12/3 14 28 90-2 98 12/10 28 8 13 #13 #12 1-1 102 12/10 28 8 132-0 106 12/17 4 25 6 1 -3 1-1 98 12/17 4 25 61-1 101 12/24 21 1 16 18.33 Off YPP 17.90 0-2 98 12/24 21 1 161-1 102 12/31 10 16 1 #20 Off YPP Rank #19 1-1 101 12/31 10 16 1
13.62 Def YPP 13.19#26 Def YPP Rank #29
Comp Yds Comp Yds Comp Yds Comp YdsYds FD QBR TO's FD RA-RY YPC Att Pass Sks FD RA-RY YPC Att Pass Sks Yds FD QBR TO's FD RA-RY YPC Att Pass Sks FD RA-RY YPC Att Pass Sks
NY Giants 19-3 159 9 11.7 1 22 31-129 4.2 24-39 263 1 13 12-35 2.9 29-38 198 3 at Detroit 23-35 -58 5 -59.8 -3 24 18-45 2.5 27-48 264 1 19 27-82 3.0 29-41 285 1at Denver 17-42 -112 -10 -47.4 0 16 14-40 2.9 30-50 228 2 26 39-178 4.6 22-32 202 2 at Indianapolis 16-13 123 -1 22.0 0 17 25-83 3.3 19-36 306 4 18 29-76 2.6 20-37 190 4at Arizona Dallas LA Rams San Francisco Green Bay at Philadelphiaat Bye Tampa Bayat San Francisco at LA Ramsat Washington at Bye Kansas City at San Franciscoat Atlanta Seattle Philadelphia at Houston LA Chargers Jacksonville Washington LA Ramsat NY Giants Tennesseeat Oakland at Washington Seattle NY Giantsat Philadelphia at Seattle
Average 18-23 23.5 0.0 -18.6 1 19 23-85 3.8 27-45 246 3.4% 20 26-107 4.2 26-35 200 7.1% Average 20-24 32.5 0.0 -22.4 -3 21 22-64 3.0 23-42 285 6.0% 19 28-79 2.8 25-39 238 6.4% Vs NFC East 19-3 159.0 9.0 11.7 1 22 31-129 4.2 24-39 263 2.6% 13 12-35 2.9 29-38 198 7.9% Vs NFC West 0-0 0.0 0.0 0.0 0 0 0-0 0.0 0-0 0 0.0% 0 0-0 0.0 0-0 0 0.0%
Away 17-42 -112.0 -10.0 -47.4 0 16 14-40 2.9 30-50 228 4.0% 26 39-178 4.6 22-32 202 6.3% Home 0-0 0.0 0.0 0.0 0 0 0-0 0.0 0-0 0 0.0% 0 0-0 0.0 0-0 0 0.0%
NY Giants -4/47 Dak Prescott 24-39-268-1-0 Ezekiel Elliott 24-104-0.0-0 Terrance Williams 6-68-0.0-0 at Detroit -2.5/48.5 Carson Palmer 27-48-269-1-3 David Johnson 11-23-2.1-0 Larry Fitzgerald 6-74-12.3-0at Denver -2.5/43.5 Dak Prescott 30-50-238-2-2 Dak Prescott 3-24-0.0-0 Jason Witten 10-97-0.0-1 at Indianapolis -7/44 Carson Palmer 19-36-332-1-1 Chris Johnson 11-44-4.0-0 JJ Nelson 5-120-24.0-1at Arizona vs. Dallas LA Rams San Francisco Green Bay at Philadelphiaat Bye vs. Tampa Bayat San Francisco at LA Ramsat Washington at Bye Kansas City vs. at San Franciscoat Atlanta Seattle Philadelphia at Houston LA Chargers vs. Jacksonville Washington LA Ramsat NY Giants Tennesseeat Oakland vs. at Washington Seattle NY Giantsat Philadelphia at Seattle
vs.
Dak Prescott 54-89-506-3-2 Ezekiel Elliott 33-112-3.4-0 Jason Witten 17-156-9.2-2 vs. Carson Palmer 46-84-601-2-4 Chris Johnson 11-44-4.0-0 JJ Nelson 10-163-16.3-2Dak Prescott 6-48-8.0-0 Dez Bryant 9-102-11.3-1 Kerwynn Williams 14-32-2.3-0 Larry Fitzgerald 9-95-10.6-0Rod Smith 2-8-4.0-0 Terrance Williams 10-85-8.5-0 David Johnson 11-23-2.1-0 Jaron Brown 4-73-18.3-0
vs. CategoryLine Score Yds FD Rush TO's
Dallas -1.5 17 266 18 25-92Arizona 45 28 339 22 29-102 1 vs.
vs.
at Philadelphia at Seattle
at WashingtonYpg Diff
Seattle NY Giants
at NY Giants Tennesseeat Oakland Total TO's
LA Chargers Score Def Jacksonville Washington Sks By LA Rams
at Atlanta Pass Def Seattle Philadelphia Total Def at Houston
at Washington Sks Allowed at Bye Kansas City Rush Def at San Francisco
at Bye Total Off Tampa Bayat San Francisco Score Off at LA Rams
LA Rams Rush Off San Francisco Green Bay Pass Off at Philadelphia
2017 CURRENT RANKINGS at Detroitat Denver
Dallas Arizonaat Indianapolis
at Arizona Dallas
DALLAS 24 ARIZONA 23
Dallas By 2.5
Arizona 316 - 296
Dallas By 1
Dallas Arizona #19Computer Points
CowboysTeam Schedule Strength
Future Schedule Strength Phil Steele#23 Dallas Arizona #26 By 3.22 Points
316 yards
2014
Even at 20 - 20#16
20 points DallasProjected Final Score
Arizona 20 points
46.5 Points
4.80DAL TOTAL PTS
1.58+/- Ratings
Game Grade
Las Vegas Total
POSITIONAL EDGE AWARDED TO:Computer Yards
Dallas
ARZ TOTAL PTS188 yards
296 yards
ARZ COACHES
Arizona
Arizona 93 yards
Projected Yardage TotalDallas Arizona
108 yards DallasProjected Passing
Dallas 223 yards
Phil's Forecast:Comp-Att-Yds ARZ KICKER Las Vegas Line
Weather: Dome. The Cowboys were dominated in nearly every facet of the game last week as a road favorite against the Broncos in a 42-17 defeat (outgained 380-268). They’re now back on the road for a second consecutive week to take on a Cardinals squad that has been equally unimpressive in their matchups against Detroit and Indianapolis. While my computer is forecast a tied game in the desert, I'll go ahead and give the Cowboys the 1 pt edge as they're still a better team on paper.
DAL COACHES0.22Projected Rushing
Projected Box Score
Arizona Season Leaders
Last Five Meetings (Last 16 years at PhilSteele.com) Team & Margin
Retu
rn t
o T
ab
le o
f C
on
ten
ts
Arizona By 2.0
Dallas By 3
Rushing ReceivingDallas Arizona
Position by Position Edges By Game Yardage Leaders Passing
Dallas Season Leaders1.06
1.10DAL KICKER
ARZ SPECIAL TMS
DefenseScore Score
Cowboys Net Stats Offense Defense Cardinals Net Stats Offense
--PS RANK-- FOEDAL FOE ARZ FOE
GAME GRADES ARZCardinals Logs
PLUS/MINUSRECORD PLUS/MINUS GAME GRADES DAL --PS RANK-- FOE RECORDVs NFC West
Dallas Cowboys 1-1Vs NFC East
1.81DAL OFF LINE
0.14DAL DEF LINE
ARZ OFF LINE
DAL SECONDARY
ARZ QB/WRDAL SPECIAL TMS
1.36
ARZ LB's
0.09DAL RB's
ARZ DEF LINE
0.53DAL LB'S
ARZ RB's
0.08DAL QB/WR
0-0
Dall
as
Co
wb
oys
Weekly
Lead
ers
& T
eam
Ave
rag
es
Ari
zon
a C
ard
inals
ARZ SECONDARY
1-0NFL RANKINGS
OVERALL: OVERALL: Arizona Cardinals1-1
18-33-17422-34-237
Cowboys Logs
By Game Yardage Leaders Passing Rushing Receiving
NY Giants