phenotypic characterization of cassava ethno-varieties in
TRANSCRIPT

©FUNPEC-RP www.funpecrp.com.br Genetics and Molecular Research 19 (2): gmr18538
Phenotypic characterization of cassava ethno-varieties in the state of Mato Grosso, Brazil
A.V.Tiago1, E.C.M.Pedri1, F.S.Rossi2, L.L.Santos3, J.A.Lima4, E.S.Cardoso1, A.P.Roveda3, E.S.S.Hoogerheide5 and A.A.B.Rossi6
1 Programa de Pós-Graduação em Biodiversidade e Biotecnologia da Rede Bionorte, Universidade do Estado de Mato Grosso Carlos Alberto Reyes Maldonado, Alta Floresta, MT, Brasil 2 Programa de Pós-Graduação em Biodiversidade e Agroecossistemas Amazônicos, Universidade do Estado de Mato Grosso Carlos Alberto Reyes Maldonado, Alta Floresta, MT, Brasil 3 Licenciatura e Bacharelado em Ciências Biológicas, Universidade do Estado de Mato Grosso Carlos Alberto Reyes Maldonado, Alta Floresta, MT, Brasil 4 Programa de Pós-Graduação em Genética e Melhoramento de Plantas, Universidade do Estado de Mato Grosso Carlos Alberto Reyes Maldonado, Alta Floresta, MT, Brasil 5 Embrapa Agrossilvipastoril, Sinop, MT, Brasil 6 Universidade do Estado de Mato Grosso Carlos Alberto Reyes Maldonado, Faculdade de Ciências Biológicas e Agrárias, PPGBionorte, PPGBioAgro, PGMP, Laboratório de Genética Vegetal e Biologia Molecular, Centro de Pesquisa e Tecnologia da Amazônia Meridional, Alta Floresta, MT, Brasil Corresponding author: A.A.B. Rossi E-mail: [email protected] Genet. Mol. Res. 19 (2): gmr18538 Received December 05, 2019 Accepted May 31, 2020 Published June 30, 2020 DOI http://dx.doi.org/10.4238/gmr18538 ABSTRACT. Brazil is the fourth largest producer of cassava in the world. In the state of Mato Grosso more than 90% of family farmers grow cassava; therefore, studies that evaluate the genetic resources of this species present in the fields of these farmers can be considered essential. The objective of this study was to evaluate the genetic variability among ethnovarieties of cassava grown in five regions of the state of Mato Grosso, at a phenotypic level using morphoagronomic and molecular characteristics. Forty-five ethno-varieties of cassava were evaluated using 45 morphoagronomic descriptors, 36 qualitative descriptors and nine quantitative descriptors, in addition to 15 microsatellite loci. The data were analyzed with the help of the Past and

©FUNPEC-RP www.funpecrp.com.br Genetics and Molecular Research 19 (2): gmr18538
A.V. Tiago et al. 2
Genes programs. The descriptors of qualitative nature revealed the existence of morphological divergence, with 97.35% polymorphism and the formation of five genetic groups using the UPGMA method. Forty-four ethno-varieties had more than one desirable root characteristic from an agronomic point of view. Among all the varieties, the Amarela I ethno-variety had the most of these characteristics. With the quantitative variables obtained using the UPGMA method, it was possible to form seven distinct groups, which revealed the Branca Comum and Paraguaia ethno-varieties to be the most dissimilar. The characteristic that most contributed to the distinction of the groups was that of root length (30%). The 15 microsatellite loci amplified 109 alleles, and mean heterozygosity observed was higher than the expected heterozygosity. The UPGMA grouping revealed the formation of four distinct groups, and it was possible to verify duplicity of the Mandioca Batatinha and Pramuquem ethnovarities. By using joint analysis of the data, five genetic groups were observed, without duplicity of material; groups III, IV and V were isolated individuals. Between qualitative and quantitative variables, there was a significant correlation of 31% and between qualitative and molecular data the correlation was 12.4%. The collection of ethno-varieties grown in the fields of family farmers in the state of Mato Grosso present genetic divergence at the phenotypic level, based on morphoagronomic and molecular characteristics, and these ethno-varieties have characteristics of interest for genetic improvement and improved marketability. Key words: Manihot esculenta; Genetic resources; Joint analysis
INTRODUCTION Cassava (Manihot esculenta) is characterized by its wide genetic diversity; there are
many local varieties that are capable of adapting to different regions (Nick et al., 2010). Mainly cultivated by family farmers in over 100 tropical and subtropical countries, it is a major source of energy for millions of people because its roots are rich in carbohydrates (FAO, 2013). The roots can be converted into ethanol, which serves as a renewable energy source (Avijala, 2013).
The peculiar characteristics found in cassava enable it to be grown in virtually all Brazilian regions, and its cultivation occurs mainly in the north, northeast, southeast, south and midwest regions of the country (EMBRAPA, 2017; SEAB, 2017). Family farming alone accounts for 76% of the national production of cassava (Souza et al., 2012). In the state of Mato Grosso, more than 90% of family farmers cultivate cassava, as well as producing fruit and milk (EMBRAPA, 2014).
The genetic diversity of cassava ethno-varieties in Brazil provides a broad genetic basis for breeding programs (Fukuda et al., 2005). The genetic diversity present in the species is related to the large number of ethno-varieties cultivated by small, family farmers and presents specific characteristics that are not normally found in improved materials (Alves-Pereira et al., 2011).
Several tools are used to estimate genetic divergence in studies on cassava, such as the use of qualitative and quantitative phenotypic characters, as well as molecular markers. Morphological descriptors are considered the “business card” in cassava varieties. In

Genetics and Molecular Research 19 (2): gmr18538 ©FUNPEC-RP www.funpecrp.com.br
Phenotypic characterization of cassava ethno-varieties 3
addition to influencing the farmers' choice regarding varieties, they are also considered indicators of variability among ethno-varieties (Siqueira, 2008). Among the characteristics that can be used for the evaluation of varieties of cassava, the characteristics most influenced by the environment are the quantitative descriptors which, despite being controlled by many genes, have a very small individual effect. Most characteristics of economic interest are quantitative, such as yield, vegetative cycle and plant height. The qualitative ones are those that have distinct phenotypic classes, and their expression is minimally affected by the environment, and these characteristics are usually controlled by only a few genes. Therefore, they have a high correlation between genotype and phenotype and, consequently, rapid responses to selection, and are easily fixed (Vieira et al., 2008a; Borém and Caixeta, 2016).
On the other hand, molecular markers are frequently used in studies on diversity, since they do not suffer environmental influences. This information is used to identify individuals, allow analysis of materials of interest, and associate variability with phenotypic characteristics (Faraldo et al., 2000; Siqueira, 2008).
Among the molecular markers available, the microsatellites (SSR - Simple sequence Repeats) are noteworthy. The microsatellite technique reveals polymorphism in the locus due to size differences in the allele, which provides a high degree of information, quick and easy genotyping, and distribution throughout the genome as well as its co-dominant nature (Ferreira and Grattaplagia, 1998; Carrasco, 2012).
Other studies have also been performed using qualitative, quantitative and molecular phenotypic characterization information, such as those published by Vieira et al. (2008a), Mezette (2013), Vieira et al. (2013), Mtunguja et al. (2015), and Zago et al. (2017).
Taking into account the economic and dietary importance of cassava for family farming in all Brazilian regions, and in particular in the state of Mato Grosso, as well as the large number of ethno-varieties cultivated in the fields of the family farmers, we aimed to evaluate the genetic variability among these cassava samples grown in five regions of the state of Mato Grosso, Brazil, at the phenotypic level based on morphoagronomic and molecular characters.
MATERIAL AND METHODS
Study area We evaluated 45 cassava ethno-varieties which were obtained in the municipalities
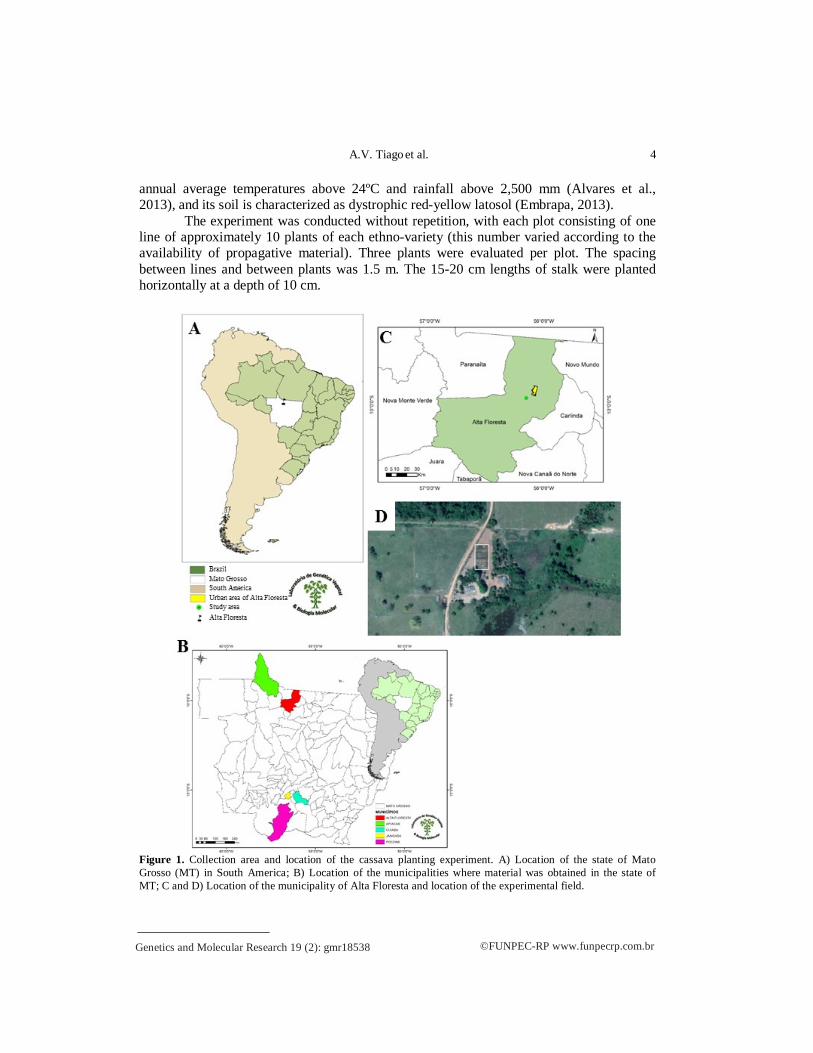
of Alta Floresta (27), Apiacás (10), Jangada (4), Cuiabá (3) and Poconé (1) (Figure 1 and Table 1). In each locality only cassava samples with different names were collected, and the identification of ethno-varieties was based on the knowledge of the farmers, or rather, how the farmers identified the variety, hence the term “ethno-varieties” (Tiago et al., 2019).
The experimental plantation was started in January 2017, in Alta Floresta, MT, on the São Paulo smallholding, which is located in the Nova Esperança Community, on the Segunda Oeste highway, MT 208 (Figure 1).
The municipality of Alta Floresta (9°57’00.8” S, 56°05’44.4” W) has an Am type climate, with two well-defined seasons, rainy summer and dry winter, characterized by
©FUNPEC-RP www.funpecrp.com.br Genetics and Molecular Research 19 (2): gmr18538
A.V. Tiago et al. 4
annual average temperatures above 24ºC and rainfall above 2,500 mm (Alvares et al., 2013), and its soil is characterized as dystrophic red-yellow latosol (Embrapa, 2013).
The experiment was conducted without repetition, with each plot consisting of one line of approximately 10 plants of each ethno-variety (this number varied according to the availability of propagative material). Three plants were evaluated per plot. The spacing between lines and between plants was 1.5 m. The 15-20 cm lengths of stalk were planted horizontally at a depth of 10 cm.
Figure 1. Collection area and location of the cassava planting experiment. A) Location of the state of Mato Grosso (MT) in South America; B) Location of the municipalities where material was obtained in the state of MT; C and D) Location of the municipality of Alta Floresta and location of the experimental field.

Genetics and Molecular Research 19 (2): gmr18538 ©FUNPEC-RP www.funpecrp.com.br
Phenotypic characterization of cassava ethno-varieties 5
Table 1. Identification of 45 cassava ethno-varieties collected in the state of Mato Grosso.
Code Popular name Collection area (MT) Code Popular name Collection area
(MT) AF01 Cacau Roxa Alta Floresta AF25 Mandioca Batatinha Alta Floresta AF02 Cacau Arara Alta Floresta AF26 Pramuquem Alta Floresta AF03 Mandioca Cenoura Alta Floresta AF39 Antena Alta Floresta AF04 Cacau Branca Alta Floresta AF40 Paraguaia Alta Floresta AF05 Cacau Pinheiro Alta Floresta AP27 Mandioca de São Paulo Apiacás AF06 Mandioca Pão Alta Floresta AP28 Mandioca Manteiguinha Apiacás AF07 Vassourinha Alta Floresta AP29 Mandioca Liberata Apiacás AF08 Branca Comum Alta Floresta AP30 Mandioca Peixe Apiacás AF09 Mandioca de Ano Alta Floresta AP32 Cacauzinha Apiacás
AF10 Mandioca Eucalipta Alta Floresta AP33 Mandioca de Fritar sem cozinhar III Apiacás
AF11A Branca do Baiano Alta Floresta AP34 Boliviana Apiacás AF11B Branca do Baiano Alta Floresta AP36 Branca s/nome Apiacás AF12 Cacau Amarela Alta Floresta AP37 Manteiga (pão) Apiacás AF13 Amarela I Alta Floresta AP38 Amarela de Minas Apiacás AF14 Amarela II Alta Floresta JM02 Macaxeira Jangada AF16 Mandioca de Fritar sem Cozinhar Alta Floresta JM03 Broto Branco Jangada AF17 Amarela III Alta Floresta JM07 Sem Nome Jangada AF18 Amarela da Bahia Alta Floresta JM38 Liberata Jangada AF19 Mandioca da Folha Roxa Alta Floresta RC27 Osso Cuiabá AF20 Mandioca 3 meses Alta Floresta RC37 Amarela Cuiabá AF21 Cacau Copinha Alta Floresta RC38 Brancona Cuiabá AF22 Mandioca fritar sem cozinhar II Alta Floresta SB14 Carneiro Poconé AF23 Amarela Folha Fina Alta Floresta ------ --------- ------
Morpho-agronomic and molecular characterization For the morpho-agronomic characterization, 45 descriptors were used, as described by
Fukuda and Guevara (1998). Figure 2 illustrates the evaluation of some of the morpho-agronomic descriptors. In total, there were 36 qualitative descriptors presented (Table 2). Of these, 26 were evaluated eight months after planting, and the remaining 10 were evaluated 12 months after planting.
Figure 2. Illustration of the evaluation of some morpho-agronomic descriptors used in the analysis of the 45 cassava ethno-varieties. A) Phyllotaxis Length; B) Petiole length; C) Root position and diameter; D) Plant height; E) Length and external color of root and F) Root pulp color.
©FUNPEC-RP www.funpecrp.com.br Genetics and Molecular Research 19 (2): gmr18538
A.V. Tiago et al. 6
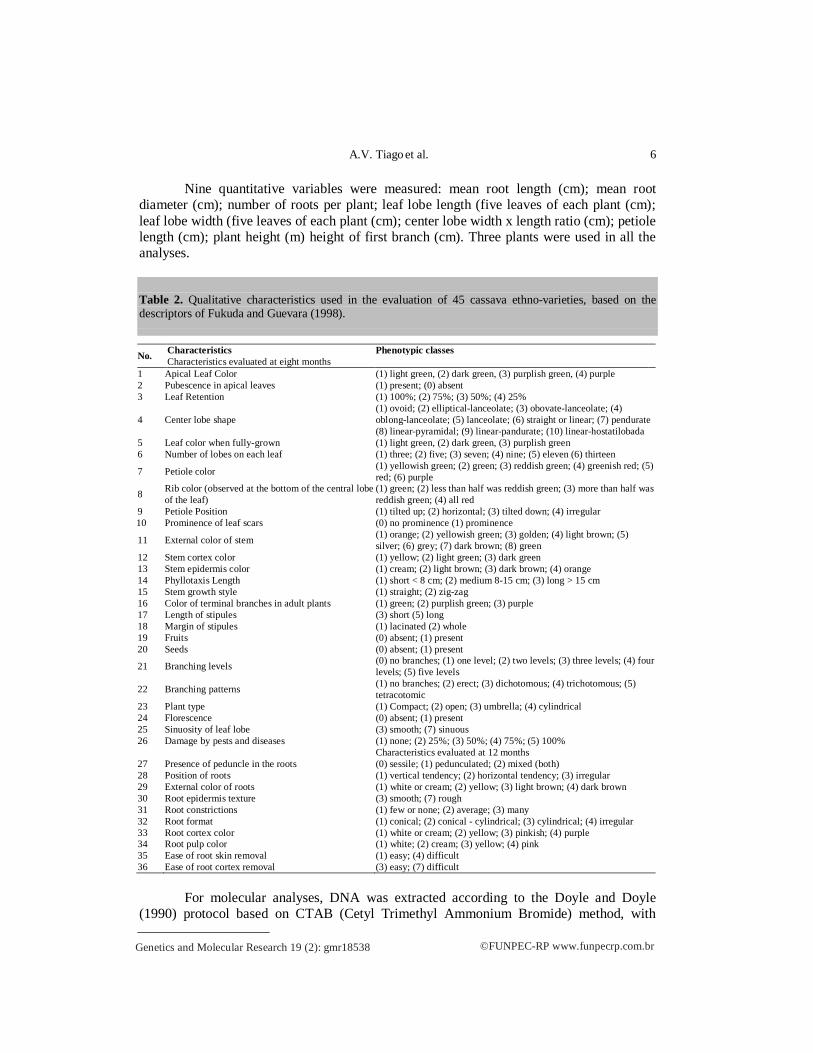
Nine quantitative variables were measured: mean root length (cm); mean root diameter (cm); number of roots per plant; leaf lobe length (five leaves of each plant (cm); leaf lobe width (five leaves of each plant (cm); center lobe width x length ratio (cm); petiole length (cm); plant height (m) height of first branch (cm). Three plants were used in all the analyses.
Table 2. Qualitative characteristics used in the evaluation of 45 cassava ethno-varieties, based on the descriptors of Fukuda and Guevara (1998).
No. Characteristics Phenotypic classes Characteristics evaluated at eight months
1 Apical Leaf Color (1) light green, (2) dark green, (3) purplish green, (4) purple 2 Pubescence in apical leaves (1) present; (0) absent 3 Leaf Retention (1) 100%; (2) 75%; (3) 50%; (4) 25%
4 Center lobe shape (1) ovoid; (2) elliptical-lanceolate; (3) obovate-lanceolate; (4) oblong-lanceolate; (5) lanceolate; (6) straight or linear; (7) pendurate (8) linear-pyramidal; (9) linear-pandurate; (10) linear-hostatilobada
5 Leaf color when fully-grown (1) light green, (2) dark green, (3) purplish green
6 Number of lobes on each leaf (1) three; (2) five; (3) seven; (4) nine; (5) eleven (6) thirteen
7 Petiole color (1) yellowish green; (2) green; (3) reddish green; (4) greenish red; (5) red; (6) purple
8 Rib color (observed at the bottom of the central lobe of the leaf)
(1) green; (2) less than half was reddish green; (3) more than half was reddish green; (4) all red
9 Petiole Position (1) tilted up; (2) horizontal; (3) tilted down; (4) irregular 10 Prominence of leaf scars (0) no prominence (1) prominence
11 External color of stem (1) orange; (2) yellowish green; (3) golden; (4) light brown; (5) silver; (6) grey; (7) dark brown; (8) green
12 Stem cortex color (1) yellow; (2) light green; (3) dark green 13 Stem epidermis color (1) cream; (2) light brown; (3) dark brown; (4) orange 14 Phyllotaxis Length (1) short < 8 cm; (2) medium 8-15 cm; (3) long > 15 cm 15 Stem growth style (1) straight; (2) zig-zag 16 Color of terminal branches in adult plants (1) green; (2) purplish green; (3) purple 17 Length of stipules (3) short (5) long 18 Margin of stipules (1) lacinated (2) whole 19 Fruits (0) absent; (1) present 20 Seeds (0) absent; (1) present
21 Branching levels (0) no branches; (1) one level; (2) two levels; (3) three levels; (4) four levels; (5) five levels
22 Branching patterns (1) no branches; (2) erect; (3) dichotomous; (4) trichotomous; (5) tetracotomic
23 Plant type (1) Compact; (2) open; (3) umbrella; (4) cylindrical 24 Florescence (0) absent; (1) present 25 Sinuosity of leaf lobe (3) smooth; (7) sinuous 26 Damage by pests and diseases (1) none; (2) 25%; (3) 50%; (4) 75%; (5) 100% Characteristics evaluated at 12 months 27 Presence of peduncle in the roots (0) sessile; (1) pedunculated; (2) mixed (both) 28 Position of roots (1) vertical tendency; (2) horizontal tendency; (3) irregular 29 External color of roots (1) white or cream; (2) yellow; (3) light brown; (4) dark brown 30 Root epidermis texture (3) smooth; (7) rough 31 Root constrictions (1) few or none; (2) average; (3) many 32 Root format (1) conical; (2) conical - cylindrical; (3) cylindrical; (4) irregular 33 Root cortex color (1) white or cream; (2) yellow; (3) pinkish; (4) purple 34 Root pulp color (1) white; (2) cream; (3) yellow; (4) pink 35 Ease of root skin removal (1) easy; (4) difficult 36 Ease of root cortex removal (3) easy; (7) difficult
For molecular analyses, DNA was extracted according to the Doyle and Doyle
(1990) protocol based on CTAB (Cetyl Trimethyl Ammonium Bromide) method, with
Genetics and Molecular Research 19 (2): gmr18538 ©FUNPEC-RP www.funpecrp.com.br
Phenotypic characterization of cassava ethno-varieties 7
modifications: STE buffer to macerate leaves instead of liquid nitrogen, increase in polyvinylpyrrolidone (PVP) concentration from 1% to 2% and β-mercaptoethanol from 0.2 to 2% in the extraction buffer, and incubation time at 65°C reduced from 60 min. to 30 min. To visualize the result of DNA extraction, the individuals were applied to 1% agarose gel which was stained with GelRed (Biotium, Hayward, USA). Then, the samples were quantified based on the absorbance at 260nm, and the purity analysis was done based on the absorbance ratio at 260 and 280nm using a Nanodrop-2000 spectrophotometer (Thermo Fisher Scientific). After quantification, DNA concentrations were standardized to 100 ng/µL.
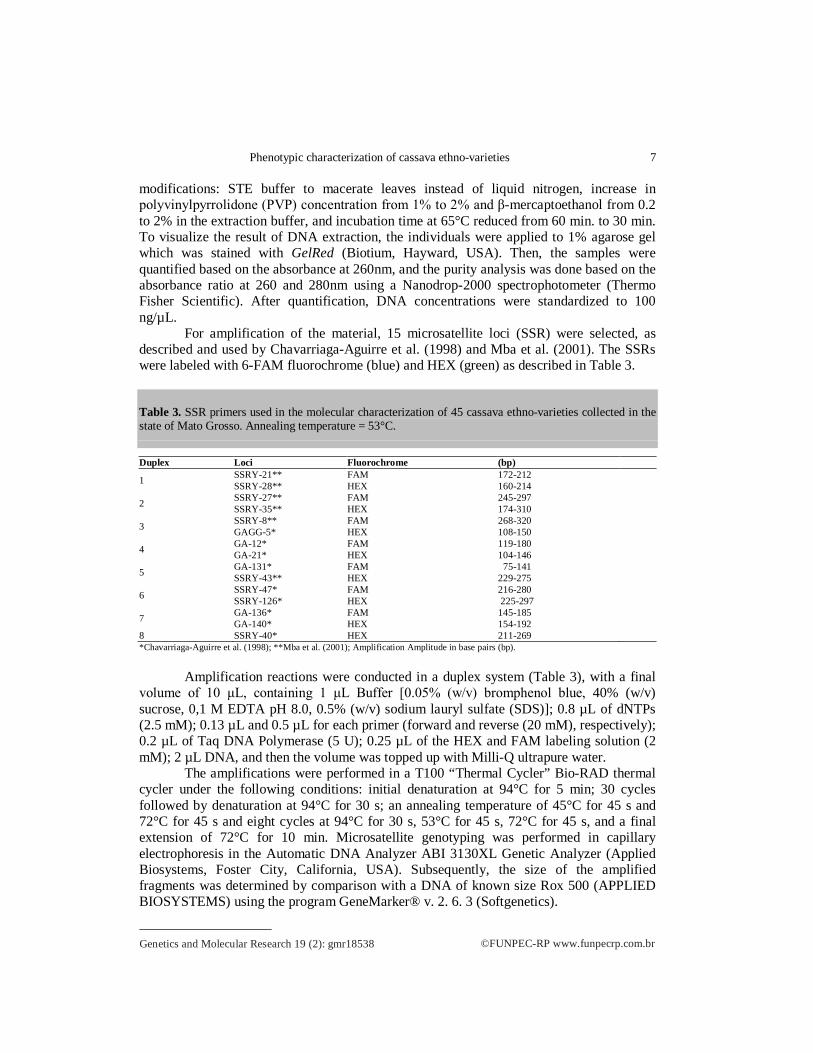
For amplification of the material, 15 microsatellite loci (SSR) were selected, as described and used by Chavarriaga-Aguirre et al. (1998) and Mba et al. (2001). The SSRs were labeled with 6-FAM fluorochrome (blue) and HEX (green) as described in Table 3.
Table 3. SSR primers used in the molecular characterization of 45 cassava ethno-varieties collected in the state of Mato Grosso. Annealing temperature = 53°C.
Duplex Loci Fluorochrome (bp)
1 SSRY-21** FAM 172-212 SSRY-28** HEX 160-214
2 SSRY-27** FAM 245-297 SSRY-35** HEX 174-310
3 SSRY-8** FAM 268-320 GAGG-5* HEX 108-150
4 GA-12* FAM 119-180 GA-21* HEX 104-146
5 GA-131* FAM 075-141 SSRY-43** HEX 229-275
6 SSRY-47* FAM 216-280 SSRY-126* HEX 225-297
7 GA-136* FAM 145-185 GA-140* HEX 154-192
8 SSRY-40* HEX 211-269 *Chavarriaga-Aguirre et al. (1998); **Mba et al. (2001); Amplification Amplitude in base pairs (bp).
Amplification reactions were conducted in a duplex system (Table 3), with a final
volume of 10 μL, containing 1 μL Buffer [0.05% (w/v) bromphenol blue, 40% (w/v) sucrose, 0,1 M EDTA pH 8.0, 0.5% (w/v) sodium lauryl sulfate (SDS)]; 0.8 µL of dNTPs (2.5 mM); 0.13 µL and 0.5 µL for each primer (forward and reverse (20 mM), respectively); 0.2 µL of Taq DNA Polymerase (5 U); 0.25 µL of the HEX and FAM labeling solution (2 mM); 2 µL DNA, and then the volume was topped up with Milli-Q ultrapure water.
The amplifications were performed in a T100 “Thermal Cycler” Bio-RAD thermal cycler under the following conditions: initial denaturation at 94°C for 5 min; 30 cycles followed by denaturation at 94°C for 30 s; an annealing temperature of 45°C for 45 s and 72°C for 45 s and eight cycles at 94°C for 30 s, 53°C for 45 s, 72°C for 45 s, and a final extension of 72°C for 10 min. Microsatellite genotyping was performed in capillary electrophoresis in the Automatic DNA Analyzer ABI 3130XL Genetic Analyzer (Applied Biosystems, Foster City, California, USA). Subsequently, the size of the amplified fragments was determined by comparison with a DNA of known size Rox 500 (APPLIED BIOSYSTEMS) using the program GeneMarker® v. 2. 6. 3 (Softgenetics).

©FUNPEC-RP www.funpecrp.com.br Genetics and Molecular Research 19 (2): gmr18538
A.V. Tiago et al. 8
Statistical analysis Qualitative variables were analyzed as quantitative binary multi-categories. This
methodology is based on Euclidean distance (D) and has the advantage that it can be applied to cases where the evaluated accessions do not necessarily present a single category for each multi-categorical characteristic, in which the variables are represented by values that represent the amount of a particular class when evaluating the sample of individuals from a given accession (Cruz and Regazzi, 2001; Cruz, 2006). That is, each characteristic was represented by its classes and the number of plants evaluated was indicated in each class. The dissimilarity index used is given by:
푑 ′ = ∑ ∑ ∗ (Eq. 1)
in which 푛∗ is the number of categories between accession pairs for a given variable, where there was no absence of values observed in both accessions simultaneously.
훿 = 푌 −푌 ′ : deviation of the observed quantity of category k, of the jth variable, from the pair of accessions i and i'.
Subsequently, the percentage of polymorphism for qualitative morphological descriptors determined by the presence and absence of the characteristic found in the evaluated materials was estimated.
The qualitative characteristics of agronomic interest in relation to the root (pulp color being yellow; little or no constriction; root cortex color being white or cream; easy removal of cortex and external root color being white), were grouped by the method UPGMA (Unweighted Pair-Group Method Using an Arithmetic Average) by using the program PAST.
For quantitative data, the file of means, which was converted to Euclidean distance (D), was used, then the relative importance of the descriptors was determined as proposed by Singh (1981).
The genetic relationships between cassava ethno-varieties from molecular data (SSR) were evaluated using the dissimilarity matrix, constructed using the Jaccard dissimilarity index complement for co-dominant and multi-allelic data. From this transformation we obtained the number of alleles per locus (n), expected heterozygosity (He) and observed heterozygosity (Ho), polymorphic information content (PIC) and inbreeding coefficient (f) (Cruz et al., 2011).
The genetic distance for the joint analysis of quantitative, qualitative and molecular variables was performed based on the algorithm by Gower (1971), given by:
푆 =.
(Eq. 2)
in which: K is the number of variables (k = 1, 2,…; p = total number of characteristics evaluated); i and j = any two individuals; 푊 is a weight given to the ijk comparison, assigning a value of 1 for valid comparisons and a value of 0 for invalid comparisons (when the value of the variable is absent in one or both individuals); 푆 = is the contribution of variable k to the similarity between individuals i and j, with values

Genetics and Molecular Research 19 (2): gmr18538 ©FUNPEC-RP www.funpecrp.com.br
Phenotypic characterization of cassava ethno-varieties 9
between 0 and 1. For a nominal variable, if the value of variable k is the same for both individuals, i and j, then 푆 = 1, otherwise, it is equal to 0; for a continuous variable 푆 = 1 - | 푋 – 푋 | / 푅 in which 푋 and 푋 are the values of variable k for individuals i and j, respectively, and 푅 is the amplitude of variation of variable k in the sample. The division by 푅 eliminates differences between scales of variables, producing a value within the range [0, 1] and equal weights.
The hierarchical groupings of the analyses (qualitative, quantitative, molecular and joint analysis) from the genetic distance matrices were obtained by the UPGMA method. (Unweighted Pair-Group Method Using an Arithmetic Average). The validation of the clusters was determined by the cophenetic correlation coefficient (CCC) according to Sokal and Rohlf (1962). To estimate the significance of the correlation (association) between the dissimilarity matrices obtained in the qualitative, quantitative and molecular character groups, the Mantel matrix comparison test (Z-test) was used, with 5,000 permutations (Mantel, 1967). All analyses were performed using the GENES program (Cruz, 2013).
RESULTS
Qualitative characterization The 36 qualitative morphological descriptors evaluated for the 45 cassava ethno-
varieties presented 97.35% polymorphism, which reveals morphological divergence and efficiency of these estimates in the dissimilarity analysis between the evaluated samples.
Other studies have demonstrated the importance of morphological descriptors, such as those of Vieira et al. (2008a); they evaluated genetic divergence among sugary and nonsugary cassava accessions and observed that of the 33 qualitative characters, 22 presented variability among the accessions. Vieira et al. (2013), while carrying out phenotypic characterization of accessions of cassava for industrial use, based on 33 qualitative characters, observed that 26 showed polymorphism, revealing the existence of wide morphological divergence between accessions. Mtunguja et al. (2015) evaluated the genetic diversity of 52 cassava varieties in farmers' fields with 24 morphological descriptors, and found a total of 82 polymorphic markers, indicating variability among the evaluated varieties.
Of the qualitative descriptors used in our study, three did not reveal variability among cassava ethno-varieties, and all ethno-varieties showed pubescence in apical leaves, upright stem growth habit and horizontally positioned roots, as shown in Figure 3.
By analyzing the qualitative variables by the UPGMA method, five genetic groups were formed, as shown in Figure 4. The GI group was constituted of 84% individuals, allocating ethno-varieties of Alta Floresta, Cuiabá, Jangada and Apiacás.
The second and fifth groups (GII and GV) were represented by only one individual, AF17 and AF40, respectively, called Mandioca Amarela III e Paraguaia, both from the municipality of Alta Floresta (Table 1), (Figure 5 and 6), and were considered the most divergent groups in relation to the others.
The GIII group was represented by two ethno-varieties (RC38= Amarela and RC37= Brancona), and GIV by three ethno-varieties (AF25 = Mandioca Batatinha; AF39= Antena and RC27= Osso), which came from the municipalities of Cuiabá and Alta Floresta (Table 1).

©FUNPEC-RP www.funpecrp.com.br Genetics and Molecular Research 19 (2): gmr18538
A.V. Tiago et al. 10
Note that groups GI and GIV allocated individuals regardless of their origin, which is indicative that materials from different geographical regions share similar characteristics for qualitative morphological descriptors.
Figure 3. Non-divergent characteristics among cassava ethno-varieties: A) Pubescence in apical leaves; B) Roots in a horizontal position and C) Upright stem growth pattern.
Figure 4. UPGMA Dendrogram obtained via 45 qualitative morphological characteristics based on Euclidean distance in 45 cassava ethno-varieties collected in the state of Mato Grosso. Data obtained using the GENES software (CRUZ, 2013). Cutoff point at 79.55% and cophenetic correlation coefficient (CCC) 72.53%.

Genetics and Molecular Research 19 (2): gmr18538 ©FUNPEC-RP www.funpecrp.com.br
Phenotypic characterization of cassava ethno-varieties 11
Figure 5. Phenotypic characteristics presented by cassava ethno-variety AF17 (Amarela III), that most contributed to its isolation in the UPGMA cluster. A) Apical leaf color (purplish green) and petiole color (greenish red); B) Central leaf vein color (more than half was reddish green) central lobe shape (obovate-lanceolate) and C) Margin of stipules (whole).
Figure 6. Phenotypic characteristics that most contributed to the differentiation of cassava ethno-variety AF40 (Paraguaia) in relation to the other ethno-varieties. A) Root constrictions (many) and root shape (irregular); B) Stem external color (orange); C) Apical leaf color (purple), leaf retention (0,25%) and D) Color of central leaf vein (less than half was reddish green).
According to Silva et al. (2002), Gomes, (2007) and Vieira et al. (2008b), from the
point of view of genetic improvement, cassava that has a yellow root pulp color, little or no root constriction, white root cortex color, easy removal of the root cortex, and white external root color can be useful as breeding stock since these are desirable characteristics for the root from an agronomic point of view.
Of the 45 cassava ethno-varieties, only one did not stand out for having the desirable agronomic traits for the root, so only 44 ethno-varieties were evaluated.
Based on the aforementioned criteria, it is possible to observe in our study that 11.12% of the studied samples had yellow-colored pulp; 55.55% of roots had little or no constriction; 60% had white or cream root cortex color; 77.78% had easy cortex removal and 11.12% had white external root color, as shown in Figures 7 and 8.

©FUNPEC-RP www.funpecrp.com.br Genetics and Molecular Research 19 (2): gmr18538
A.V. Tiago et al. 12
Figure 7. Qualitative characteristics found among 44 cassava ethno-varieties in relation to root.
According to Figure 8, which represents the UPGMA grouping in relation to the
five qualitative characteristics for the root, we can observe that the roots with yellow flesh color (PRA) were only present among the ethno-varieties AF16 (Mandioca de Fritar sem Cozinhar); AF13 (Amarela I); AF03 (Mandioca Cenoura); AF14 (Amarela II) and AF19 (Mandioca da Folha Roxa), both belong to the municipality of Alta Floresta (Figure 8).
Figure 8. Attributes of agronomic interest presented by some cassava ethno-varieties based on UPGMA clustering via five qualitative root traits. Root cortex color: white or cream (RCC: W/C); Easy removal of cortex (ERC); few or no constrictions (FC); Yellow root pulp (YRP); white external root color (WERC).

Genetics and Molecular Research 19 (2): gmr18538 ©FUNPEC-RP www.funpecrp.com.br
Phenotypic characterization of cassava ethno-varieties 13
It is noteworthy that the color of the root pulp is one of the determining factors in its value. The color yellow is desirable in the commercialization of cassava, and is also related to its nutritional quality, since it indicates richness in carotenoids that are precursors of vitamin A, which is important in the diet of humans and animals (Iglesias et al., 1997; Barbosa et al., 2007).
Among the 44 ethno-varieties, 70.45% (31) present more than one characteristic of these five and stand out as being of agronomic interest in relation to root, and 29.55% (13) show only one desirable characteristic. Among the characteristics of commercial importance, the ethno-variety of AF13 (Amarela I) is the one that congregates the majority of these characteristics - four characteristics of the five which we have highlighted, as shown in Figure 8. This indicates that this ethno-variety may serve as a progenitor in breeding programs, due to its favorable set of alleles.
Quantitative Characterization The estimated genetic distances between the 45 ethno-varieties ranged from 1.870
to 0.154, with the shortest distance observed between AF10 and AF16 (Mandioca Eucalipta and Mandioca de Fritar sem Cozinhar). While the largest genetic distance was found between AF08 and AF40, called Branca Comum and Paraguaia, both of which were acquired in Alta Floresta.
Considering the nine descriptors obtained by quantitative variables, the analysis of genetic divergence by the UPGMA method had a cut off point of 83.90%, which made it possible to form seven distinct groups (GI, GII, GIII, GIV, GV, GVI and GVII), the first group (GI) and the fourth group (GIV) were the most numerously populated, and were composed of 67% ethno-varieties and 13% ethno-varieties, respectively. The groups GII, GIII and GVII were constituted by two and three ethno-varieties, respectively. The GV and GVI groups allocated only one sample each, identified as Sem Nome (JM07) and Broto Branco (JM03), which were collected in the municipality of Jangada (Figure 9).
JM07 (Sem Nome) stood out for the having the following characteristics: smallest leaf lobe width; longest leaf length and leaf lobe width-length ratio, lowest value for height of the first branch and lowest height compared to other ethno-varieties (Figure 10). The ethno-variety JM03 (Broto Branco) also had the lowest height, lowest height of the first branch, longest leaf length, but had the longest petiole length and the lowest number of roots per plant (Figure 11).
It is noteworthy that the varieties preferred by farmers are those with the highest height of the first branch, because it facilitates the maintenance and harvesting practices of the crop. Plants that branch too close to the ground make weeding difficult, one of the main activities performed during crop cultivation (Gomes, 2007). Therefore, the ethno-varieties JM03 and JM07 presented this undesirable characteristic by farmers.
The analysis of the relative contribution of the nine quantitative characters among the 45 cassava ethno-varieties allowed us to identify of the most important characteristics (Table 4). According to the analysis done by Singh (1981), the characteristics that most contributed to the differentiation of ethno-varieties were root length (30.23%), petiole length (20.82%), number of roots (17.53%) and leaf length-width ratio (13.78%). On the other hand, the descriptors that contributed the least were root diameter (7.01%), leaf length

©FUNPEC-RP www.funpecrp.com.br Genetics and Molecular Research 19 (2): gmr18538
A.V. Tiago et al. 14
(5.69%), height of the first branch (3.75%), leaf width (0.74%) and height of the plant (0.43%).
Figure 9. UPGMA Dendrogram obtained via nine quantitative characters based on Euclidean distance in 45 cassava ethno-varieties collected in the state of Mato Grosso. Performed using the GENES software (Cruz, 2013). Cophenetic correlation coefficient (CCC) 63.95%.
Figure 10. Quantitative characteristics that most contributed to the differentiation of the JM07 cassava ethno-variety identified by the farmer as Sem Nome. A) Leaf lobe width; B) Leaf length; C) Height of first branching level and height of plant.

Genetics and Molecular Research 19 (2): gmr18538 ©FUNPEC-RP www.funpecrp.com.br
Phenotypic characterization of cassava ethno-varieties 15
Figure 11. Quantitative characteristics that most contributed to the differentiation of cassava ethno-variety JM03 (Broto Branco). A) Height of plant; B) Height of first branching level; C) Number of roots per plant.
A similar result was found by Zuin et al. (2009) while evaluating the quantitative
characteristics that most contributed to explaining the genetic divergence between 43 accessions of table cassava. The results indicated that the average length of tuberous roots (32.04%), the average length of petioles (18.04%) and the average number of tuberous roots per plant (16.05%) were the characteristics that most contributed to the diversity. The characteristics for tuberous root diameter, average plant height and average height of the first branch were the ones that least explained the genetic divergence, contributing 0.27%, 0.47% and 0.56%, respectively, as is reported in our study.
Table 4. Relative contribution (%) of the nine quantitative descriptors for genetic divergence in 45 cassava ethno-varieties, obtained by the Singh method (1981).
Characteristics S.j (%) Length of root 30.23 Length of petiole 20.82 Number of roots 17.53 Leaf lobe length-width ratio 13.78 Diameter of root 07.01 Length of leaf 05.69 Height of first branching level 03.75 Width of leaf 00.74 Height of plant 00.43
Molecular characterization The 15 microsatellite loci used for 45 cassava ethno-varieties amplified a total of
109 alleles, ranging from two (SSRY126) to 12 alleles (SSRY28), and averaging 7.27 alleles per locus (Table 5).
Ortiz et al. (2016) used 13 SSR loci in the genetic characterization of cassava and found a total of 40 alleles with an average of 3.07 alleles per loci. Siqueira et al. (2010) evaluated 83 cassava accessions in Mato Grosso do Sul, based on 9 microsatellite loci,

©FUNPEC-RP www.funpecrp.com.br Genetics and Molecular Research 19 (2): gmr18538
A.V. Tiago et al. 16
found 66 alleles, with an average of 6 alleles per loci. Mezette et al. (2013) studied the morphological and molecular diversity of cassava genotypes with 14 SSR loci and obtained an average of 3.53 alleles per locus, out of a total of 419 cassava accessions.
The number of alleles obtained in this study was higher than that reported by other authors. This fact can be explained by the different origins of the cassava ethno-varieties that were collected in five municipalities of different regions of the state of Mato Grosso. It can be observed that the selection process as practiced by the farmers favors the expansion and the maintenance of the cassava’s genetic diversity, as also observed by Elias et al. (2001), Zuin et al. (2009), Costa et al. (2013).
Table 5. Genetic diversity among the 45 cassava ethno-varieties studied in 15 SSR loci. Number of alleles (n); expected heterozygosity (He); observed heterozygosity (Ho) and polymorphic information content (PIC).
Loci n He Ho PIC SSRY21 07 0.75 0.92 0.71 SSRY28 12 0.76 0.94 0.74 SSRY27 07 0.74 0.80 0.71 SSRY35 05 0.54 0.69 0.47 SSRY8 07 0.65 0.80 0.60 GAGG5 03 0.52 0.67 0.41 GA12 08 0.73 0.85 0.70 GA21 04 0.64 0.80 0.58 GA131 10 0.78 0.64 0.75 SSRY43 10 0.76 0.51 0.73 SSRY47 11 0.65 0.41 0.63 SSRY126 02 0.09 0.00 0.08 GA136 06 0.69 0.91 0.63 GA140 08 0.72 0.69 0.68 SSRY40 09 0.81 0.61 0.79 Median 07.27 0.66 0.68 0.61
Table 5 presents estimates of genetic-statistical parameters of molecular analyses. It
can be noted that the expected heterozygosity (He) observed heterozygosity (Ho) presented averages from 0.66 to 0.68, respectively, with values ranging between 0.09 (SSRY126) and 0.81 (SSRY40) for He, and from 0.00 (SSRY126) to 0.94 (SSRY28) for Ho. As a general average, Ho was greater than He in 9 of the 15 loci evaluated (Table 5), which suggests excess heterozygotes in relation to the Hardy-Weinberg equilibrium model.
Similar results were found by de Pedri et al. (2019), who evaluated the genetic diversity of cassava ethno-varieties, with average values of 0.674 for He and an average of 0.875 for Ho. All microsatellite loci analyzed showed higher observed heterozygosity in relation to expected heterozygosity, which indicates a predominance of heterozygotes in the set evaluated by the author. Turyagyenda et al. (2012), who studied genetic diversity among traditional cassava accesses cultivated by farmers in Uganda, also obtained values for the average expected heterozygosity of 0.667, while the observed heterozygosity presented an average of 0.726, Ho being greater than He.
The polymorphic information content (PIC) for each marker presented values between 0.08 (SSRY126) and 0.79 (SSRY40), with an average of 0.61. PIC expresses the quality of the marker in genetic studies, therefore, loci with values above 0.50 were considered very informative (12 loci), and are indicated for future studies of the genetic

Genetics and Molecular Research 19 (2): gmr18538 ©FUNPEC-RP www.funpecrp.com.br
Phenotypic characterization of cassava ethno-varieties 17
diversity of cassava. According to the classification of Botstein et al. (1980), loci may be classified as moderately informative (0.25 to 0.50) and minimally informative (≤ 0.25). Thus, in our study, two loci were considered moderately informative (GAGG5 and SSRY35) and one as minimally informative (SSRY126).
Figure 12, based on SSR markers, revealed the formation of four distinct groups using the UPGMA clustering method, with the first group (GI) allocating 91% ethno-varieties, in this group, there were ethno-varieties of various origins. It is also possible to observe the duplicity of individuals AF25 and AF26 (Mandioca Batatinha and Pramuquem), both from the municipality of Alta Floresta. However, by analyzing the qualitative and quantitative characteristics, this duplicity was not noted among the samples, since they have distinct characteristics. Thus, the exclusion any of the ethno-varieties was not recommended when considering the evaluated data set.
The second group (GII) clustered 4% of the ethno-varieties, and was composed by the samples for Mandioca Manteiga (AP37) and Amarela de Minas (AP38), from the municipality of Apiacás. The third (GIII) and fourth (GIV) groups were composed of only one ethno-variety each, AF03 (Mandioca Cenoura) and AF40 (Paraguaia), respectively, and were from the municipality of Alta Floresta (Figure 13).
The divergence of AF40 ethno-variety (Paraguaia) was confirmed in the qualitative characteristics. However, it presented many root constrictions, which is an undesirable characteristic.
Figure 12. Dendrogram resulting from the cluster analysis of 45 cassava ethno-varieties obtained via the UPGMA method using the Jaccard dissimilarity coefficient with 15 SSR loci. Performed using the GENES software (CRUZ, 2013). Cophenetic correlation coefficient (CCC) 82.54%.

©FUNPEC-RP www.funpecrp.com.br Genetics and Molecular Research 19 (2): gmr18538
A.V. Tiago et al. 18
Figure 13. Phenotypic characteristics present in ethno-varieties AF03 and AF40. Characteristics of AF03 (Mandioca Cenoura): A) Root pulp color (yellow) and root cortex color (cream); B) stem epidermis color (light brown); external color of the stem (light brown); stem cortex color (dark green) and C) developed plant. Characteristics of AF40 (Paraguaia): D), Root pulp color (white); root cortex color (cream); F) external color of the stem (orange); stem epidermis color (light brown) and stem cortex color (light green) and G) developed plant.
Genetic diversity based on joint data analysis In the joint analysis of quantitative, qualitative and molecular data by the UPGMA
clustering method based on the Gower distance to the cut-off point at 82.04%, the formation of five genetic groups was found (Figure 14). The GI group was formed by 15 ethno-varieties, 13 belonging to Alta Floresta and only two ethno-varieties from Apiacás (AP29 = Mandioca Liberata; AP27 = Mandioca de São Paulo). The GII group has the largest number of ethno-varieties (27), with a mixture of ethno-varieties of different origins. Groups GIII and GIV and GV presented isolated individuals (AF08: Branca Comum; AF40: Paraguaia and RC27: Osso), therefore being the most divergent groups.
The ethno-variety AF40 (Paraguaia) also remained isolated in this analysis, confirming what had already been found through the analysis of qualitative and molecular characteristics. The same was found for the ethno-varieties AF08 (Branca Comum) and RC27 (Osso) which were also allocated among the most dissimilar groups for quantitative descriptors and joint analysis.

Genetics and Molecular Research 19 (2): gmr18538 ©FUNPEC-RP www.funpecrp.com.br
Phenotypic characterization of cassava ethno-varieties 19
Figure 14. Dendrogram resulting from combined analysis of qualitative, quantitative and molecular data (SSR), based on the Gower distance (1971). Performed using the GENES software (CRUZ, 2013). Cophenetic correlation coefficient (CCC) 70.52%.
The value of the cophenetic correlation coefficient (CCC) was satisfactory for
all distance matrices, revealing it to be a good fit between the dissimilarity dendrogram and the original dissimilarity matrix (Table 6). This value is considered to be good when it is significant and equal to, or greater than, 0.7 (Rohlf, 1970), and in this study, only the matrix for quantitative data presented a lower value for cophenetic correlation.
Table 6. Values obtained for the cophenetic correlation coefficient between the matrices for genetic distance in relation to clustering using the UPGMA method.
Matrices Cophenetic Correlation Coefficient Qualitative 0.72** Quantitative 0.64** Molecular 0.82** Joint 0.70** ** cophenetic correlation coefficient significant at 1% probability.
The results for the correlation between dissimilarity matrices revealed
significance, but were of low magnitude. The qualitative and quantitative variables showed a correlation of 31%, and between the qualitative and molecular data a correlation of 12.4%, however there is no correlation between the quantitative and molecular variables, i.e., there is no correspondence between them (Table 7).

©FUNPEC-RP www.funpecrp.com.br Genetics and Molecular Research 19 (2): gmr18538
A.V. Tiago et al. 20
Table 7. Correlations between matrices for genetic distance, estimated using qualitative, quantitative and molecular characteristic analyses (SSR) among 45 cassava ethno-varieties.
Matrices Qualitative Quantitative Molecular Qualitative - 0.310++ 0.124+ Quantitative - 0.032ns Molecular -
(++) and (+): significant at 1 and 5% probability; ns: insignificant, by Mantel test, based on 5.000 simulations. This lack of association between the estimates should not be considered as a
limitation of this tool to access genetic variability, but as an indication of their complementarity. This can also be explained by the different properties of molecular markers and quantitative and qualitative characteristics (Lefebvre et al., 2001; Vieira et al., 2013).
Thus, it is possible to establish a scenario in which the associations between genetic distances/dissimilarities estimated by qualitative, quantitative and molecular characters will be closer as the association between loci that control quantitative and qualitative characters and bands is greater. evaluated and the higher the number of quantitative and qualitative characters evaluated, which will increase the genome coverage of the accessions (Máric et al., 2004; Roy et al., 2004; Vieira et al., 2008a).
CONCLUSIONS The collection of ethno-varieties presents different genetic divergence according to
the variable, that is, if it is qualitative phenotypic, quantitative and molecular phenotypic. For the choice of progenitors within a range of ethno-varieties, the combination of
phenotypic and molecular analyses is complementary, but for characterization purposes aimed at conserving genetic resources, one type of characterization is sufficient.
The ethno-variety AF40 (Paraguaia) stands out for having the greatest divergence for qualitative, molecular characteristics, and in the joint analysis.
Among the ethno-varieties studied, the ethno-variety AF13 (Amarela I) presented the most favorable characteristics from a commercialization, consumption and agronomic point of view.
ACKNOWLEDGMENTS This work was carried out with the support of the Coordination of Improvement of
Higher Education Personnel - Brazil (CAPES) Financing Code 001.
CONFLICTS OF INTEREST The authors declare no conflict of interest.
REFERENCES Alvares CA, Stape JL, Sentelhas PC, Gonçalves JLM, et al. (2013). Koppen’s climate classification map for Brazil.
Meteorol. Z. 22: 711-728.

Genetics and Molecular Research 19 (2): gmr18538 ©FUNPEC-RP www.funpecrp.com.br
Phenotypic characterization of cassava ethno-varieties 21
Alves-Pereira A, Peroni N, Abreu AG, Gribel R, et al. (2011). Genetic structure of traditional varieties of bitter manioc in three soils in Central Amazonia. Genetica. 139: 1259-1271.
Avijala MF (2013). Diversidade e estimativas de parâmetros genéticos em mandioca (Manihot esculenta Crantz), oriunda de Moçambique. Master’s thesis, Universidade Federal de Viçosa, Minas Gerais.
Barbosa CZR, Alves JMA, Schwengber DR and Smiderle OJ (2007). Características morfológicas e agronômicas de dez clones de mandioca cultivados no Estado de Roraima. Agro@mbiente On-line. 1: 28-31.
Borém A and Caixeta E (2016). Marcadores Moleculares. 1st edn. UFV, Viçosa. Botstein D, White RL, Skolnick M and Davis RW (1980). Construction of a genetic linkage map in man using restriction
fragment length polymorphisms. Am. J. Hum. Genet. 32: 314-331. Carrasco NF, Oler JRL, Marchetti FF, Carniello MA, et al. (2016). Growing Cassava (Manihot esculenta) in Mato
Grosso, Brazil: Genetic Diversity Conservation in Small–Scale Agriculture. Econ. Bot. 70: 15-28. Chavarriaga-Aguirre PP, Maya MM, Bonierbale MW, Kresovich S, et al. (1998). Microsatellites in cassava (Manihot
esculenta Crantz): discovery, inheritance and variability. Theor. Appl. Genet. 97: 493-501. Costa TR, Vidigal Filho PS, Gonçalves-Vidigal MC, Galván MZ, et al. (2013). Genetic diversity and population
structure of sweet cassava using simple sequence repeat (SSR) molecular markers. Afr. J. Biotechnol. 12: 1040-1048.
Cruz CD (2006). Programa Genes: Análise multivariada e simulação. 1st edn. UFV, Viçosa. Cruz CD (2013). Genes - a software package for analysis in experimental statistics and quantitative genetics. Acta Sci.
Agron. 35: 271-276. Cruz CD and Regazzi AJ (2001). Modelos biométricos aplicados ao melhoramento genético. 2st edn. UFV, Viçosa. Cruz CD, Ferreira MF and Pessoni LA (2011). Biometria aplicada ao estudo da diversidade genética. 1st edn. Suprema,
Visconde do Rio Branco, Minas Gerais. Doyle JJ and Doyle JL (1990). Isolation of plant DNA from fresh tissue. Focus. 12: 13-15. Elias M, Penet L, Vindry P, Mckey D, et al. (2001). Unmanaged sexual reproduction and the dynamics of genetic
diversity of a vegetatively propagated crop plant, cassava (Manihot esculenta Crantz), in a traditional farming system. Mol. Ecol. 10: 1895-1907.
EMBRAPA (Empresa Brasileira de Pesquisa Agropecuária) (2013). Sistema brasileiro de classificação de Solos. 3st edn. Embrapa, Brasília.
EMBRAPA (Empresa Brasileira de Pesquisa Agropecuária) (2014). 2ª Oficina de Concertação Estadual de Mato Grosso. Available at [https://www.embrapa.br/documents/1354377/2109296/Documento+base+CONTEXTUALIZA%C3%87%C3%83 O.pdf/247bf759-27f9-4b4e-afad-1aa6cabd18d4?version=1.0]. Accessed April 24, 2020.
EMBRAPA (Empresa Brasileira de Pesquisa Agropecuária) (2017). Mandioca em números. Available at [https://www.embrapa.br/congresso-de-mandioca-2018/mandioca-em-numeros]. Accessed April 24, 2020.
FAO (Organização das Nações Unidas para Agricultura e Alimentação) (2013). Save and Grow: Cassava. Available at [http://www.fao.org/3/a-i3278e.pdf]. Accessed April 15, 2020.
Faraldo MIF, Silva RM, Ando A and Martins PS (2000). Variabilidade genética de etnovariedades de mandioca em regiões geográficas do Brasil. Sci. Agric. 57: 499-505.
Ferreira ME and Grattapaglia D (1998). Introdução ao uso de marcadores moleculares em análise genética. 3st edn. Embrapa, Brasília.
Fukuda WMG and Guevara CL (1998). Descritores morfológicos e agronômicos para a caracterização de mandioca (Manihot esculenta Crantz). Embrapa, Mandioca e Fruticultura, Cruz das Almas. Available at [https://www.infoteca.cnptia.embrapa.br/infoteca/handle/doc/638631]. Accessed April 15, 2020.
Fukuda WMG, Oliveira RD, Fialho JDF, Cavalcanti J, et al. (2005). Germoplasma de mandioca (Manihot esculenta Crantz) no Brasil. Rev. Bras. Mandioca. 18: 7-12.
Genemarker SoftGenetics. Software PowerTools for Genetic Analysis. Available at [https://softgenetics.com/GeneMarker.php]. Accessed April 20, 2020.
Gomes CN (2007). Caracterização morfo-agronômica e diversidade genética em mandioca Manihot esculenta Crantz. Master’s thesis, Universidade Federal de Lavras, Minas Gerais.
Gower JC (1971). A general coefficient of similarity and some of its properties. Biometrics. 27: 857-874, 1971. Iglesias C, Mayer J, Chavez L and Calle F (1997). Genetic potential and stability of carotene content in cassava roots.
Euphytica. 94: 367-373. Lefebvre V, Goffinet B, Chauvet JC, Caromel B, et al. (2001). Evaluation of genetic distances between pepper inbred
lines for cultivar protection purposes: comparison of AFLP, RAPD, and phenotypic data. Theor. Appl. Genet. 102: 741-750.
Mantel N (1967). The detection of disease clustering and a generalized regression approach. Cancer Res. 27: 209‑220. Máric S, Bolaríc S, Martincic J, Pejíc I, et al. (2004). Genetic diversity of hexaploid wheat cultivars estimated by RAPD
markers, morphological traits and coefficients of parentage. Plant Breeding 123: 366‑369.

©FUNPEC-RP www.funpecrp.com.br Genetics and Molecular Research 19 (2): gmr18538
A.V. Tiago et al. 22
Mba REC, Stephenson P, Edwards K, Melzer S, et al. (2001). Simple sequence repeat (SSR) markers survey of the cassava (Manihot esculenta Crantz) genome: towards an SSR-based molecular genetic map of cassava. Theor. Appl. Genet. 102: 21-31.
Mezette TF, Blumer CG and Veasey EA (2013). Morphological and molecular diversity among cassava genotypes. Pesq. Agropec. Bras. 48: 510-518.
Mtunguja MK, Ranjan A, Laswai HS, Muzanila Y, at al. (2015). Genetic diversity of farmer-preferred cassava landraces in Tanzania based on morphological descriptors and single nucleotide polymorphisms. Plant Genet. Resour. 15: 138-146.
Nick C, Carvalho SPD, Madeira ASJ, Custódio TN, et al. (2010). Divergência genética entre subamostras de mandioca. Bragantia. 69: 289-298.
Ortiz AHT, Rocha VPC, Moiana LD, Gonçalves-Vidigal MC, et al. (2016). Population Structure and Genetic Diversity in Sweet Cassava Cultivars from Paraná, Brazil. Plant. Mol. Biol. Rep. 34: 1153-1166.
Pedri ECM, Hoogerheide ESS, Tiago AV, Cardoso ES, et al. (2019). Genetic diversity of cassava landraces cultivated in northern Mato Grosso State, Brazil, using microsatellite markers. Genet. Mol. Res. 18: gmr18315.
Rohlf FJ (1970). Adaptive hierarchical clustering schemes. Syst. Biol. 18: 58-82. Roy JK, Lakshmikumaran MS, Balyan HS and Gupta PK (2004). AFLP‑based genetic diversity and its comparison with
diversity based on SSR, SAMPL, and phenotypic traits in bread wheat. Biochem. genet. 42: 43‑59. SEAB (Secretaria de Estado da Agricultura e do Abastecimento) (2017). Prognóstico mandioca 2017/18. Available at:
[http://www.agricultura.pr.gov.br/arquivos/File/deral/Prognosticos/2018/Mandioca_2017_18.pdf]. Accessed April 24, 2020.
Silva RM, Faraldo MFI, Ando A and Veasey EA (2002). Variabilidade genética de etnovariedades de mandioca. In: Cultura de tuberosas amiláceas Latino Americanas (Cereda MP, eds). Fundação Cargil, São Paulo.
Singh D (1981). The relative importance of characters affecting genetic divergence. Indian J. Genet. Pl. Br. 41: 237-245. Siqueira MVBM (2008). Diversidade genética de etnovariedades de mandioca (Manihot esculenta Crantz) em áreas de
Cerrado no Estado de Mato Grosso do Sul e de variedades comerciais por meio de marcadores microssatélites. Master’s thesis, Universidade de São Paulo, Escola Superior de Agricultura “Luiz de Queiroz” Centro de Energia Nuclear na Agricultura, Piracicaba.
Siqueira MVBM, Pinheiro TT, Borges A, Valle TL, et al. (2010). Microsatellite polymorphisms in cassava landraces from the Cerrado biome, Mato Grosso do Sul, Brazil. Biochem. genet. 48: 879-895.
Sokal RR and Rohlf FJ (1962). The comparison of dendrograms by objective methods. Taxon. 11: 33-40. Souza E, Silva M and Silva S (2012). A cadeia produtiva da mandiocultura no vale do Jequitinhonha (MG): Uma análise
dos aspectos sócio produtivos, culturais e da geração de renda para a Agricultura familiar. Isegoria. 1: 73-85. Tiago AV, Hoogerheide ESS, Pedri ECM, Rossi FS, et al. (2019). Genetic diversity and population structure of cassava
ethno-varieties grown in six municipalities in the state of Mato Grosso, Brazil. Genet. Mol. Res. 18: gmr18357. Turyagyenda LF, Kizito EB, Ferguson ME, Baguma Y, et al. (2012). Genetic diversity among farmer-preferred cassava
landraces in uganda. Afr. Crop Sci. J. 20: 15-30. Vieira EA, Fialho JF, Faleiro GF, Bellon G, et al. (2013). Caracterização fenotípica e molecular de acessos de mandioca
de indústria com potencial de adaptação às condições do cerrado do Brasil Central. Semin. Ciênc. Agrár. 34: 567-582.
Vieira EA, Freitas Fialho J, Faleiro FG, Bellon G, et al. (2008a). Divergência genética entre acessos açucarados e não açucarados de mandioca. Pesq. Agropec. Bras. 43: 1707-1715.
Vieira EA, Fialho JF, Silva MS, Fukuda WMG, et al. (2008b). Variabilidade genética do banco de germoplasma de mandioca da Embrapa Cerrados acessada por meio de descritores morfológicos. Científica. 36: 56-67.
Zago BW, Barelli MAA, Hoogerheide ESS, Correia CL, et al. (2017). Morphological diversity of cassava accessions of the south-central mesoregion of the State of Mato Grosso, Brazil. Genet. Mol. Res. 16: gmr16039725.
Zuin GC, Vidigal Filho S, Kvitschal VM, Gonçalves-Vidigal MC, et al. (2009). Divergência genética entre acessos de mandioca-de-mesa coletados no município de Cianorte, região Noroeste do Estado do Paraná. Semin. Ciênc. Agrár. 30: 21-30.