phenotypic characterization of adipose-specific … characterization of adipose-specific vdr ... it...
TRANSCRIPT

Phenotypic characterization of adipose-specific VDR knockout mice
An honors thesis presented to the Department of Biological Sciences
University at Albany, State University of New York in partial fulfillment
of the requirements for graduation with Honors in Biological Sciences
and graduation from The Honors College.
Joseph D’Angelo
Research Mentors: JoEllen Welsh Ph.D, Donald G Matthews Ph.D
Research Advisor: Dr. Richard Zitomer
May 2016

2
Abstract
Breast cancer is a prominent and lethal disease that currently affects close to three million people in the United States. Each year displays close to 250,000 new cases of breast cancer and around 40,000 deaths in the United States alone. A geographic pattern of breast cancer suggests a higher incidence in more temperate regions. Research has suggested that low Vitamin D levels associated with reduced sun exposure might contribute to increased breast cancer incidence. In recent studies, Vitamin D has been shown to slow the proliferation of breast cancer cells, but the mechanisms involved in vivo are poorly defined. It is known that adipose tissue is involved in the progression of breast cancer. Adipose cells in the mammary tissue are not just for support, they also release signals to the epithelium known as ‘cross talk’. To shed light onto the effects of low vitamin D on adipose signaling in the mammary gland, we studied mice with adipose-specific vitamin D receptor (VDR) deletion. The goal of this project was to study the impact of VDR deletion in adipocytes on mammary gland morphology using histological and whole mount techniques. Tissues of mice with adipose specific VDR deletion (CVF strain) were compared to those of control mice (CN1 strain). By PCR we confirmed that VDR expression was reduced approximately 80% in adipose tissue of CVF mice compared to CN1 mice. Hematoxylin and Eosin Y staining for the mammary gland revealed a slight increase in the number of epithelial ducts in the CVF mice. Further quantitation of the epithelial content of the mammary glands confirmed that glands from CVF mice had higher epithelial tissue density than glands from CN1 mice. Whole mount analysis revealed significantly increased epithelial branching in the mammary glands of the CVF compared to CN1 mice. Collectively, our data indicates that deletion of VDR in adipose tissue results in increased growth of the mammary epithelial tissue. The results imply that VDR activity in the adipose compartment of the mammary gland contributes to the anti-proliferative actions of vitamin D in this tissue.

3
Acknowledgements
I would like to thank Dr. JoEllen Welsh and Dr. Donald G. Matthews for the support
and mentoring that was kindly provided throughout the course of this research project. I would
also like to thank Dr. Namita Chatterjee for her guidance and trainings as well as past lab
partners Jordan Drelich and Thomas Dunn for their assistance.

4
Table of Contents Abstract 2
Acknowledgements 3
Introduction 5
Methods 7 Results 11 Discussion 23 References 28

5
Introduction Breast cancer is a startlingly common disease in the United States that affects
about 1 in 8 women nationwide, second in incidence only to cancers of the skin. (1) Allowed to
progress unchecked, survival rates plummet once breast cancer reaches stages 2, 3, and 4, with
survival rates past 5 years at 93%, 72%, and 22%, respectively. (2) Higher incidences of breast
cancer have been associated with certain conditions, including defective BRCA1 and 2 genes,
obesity and age. (3) Past research has revealed an overlap between diagnosed cases of breast
cancer in a particular region and the distance of that region from the equator. (4) As distance from
the equator increases, the body becomes less able to naturally synthesize Vitamin D in response
to sunlight. Consequently, it has been suggested that there is a link between levels of Vitamin D
in the blood and frequency of breast cancer diagnoses. In vitro studies revealed that Vitamin D
inhibits proliferation and stimulates apoptosis of breast cancer cells. (5) Research by the Welsh
lab and others has also demonstrated that the global deletion of the Vitamin D Receptor (VDR)
gene in mice escalates oxidative DNA damage, stimulates cell proliferation, and inhibits
apoptosis, thereby increasing the likelihood of carcinogenesis.(6)
Vitamin D is naturally synthesized in skin after UVB exposure. Some fish oils and other
dietary supplements can also provide Vitamin D. The compound 7-dehydrocholesterol in the
skin absorbs ultraviolet rays and is converted into cholecalciferol (Vitamin D), which must be
metabolized for biological activity. To activate Vitamin D, it is first hydroxylated to 25-
hydroxycholecalciferol in the liver. 25-hydroxycholecalciferol is hydroxylated once again in the
kidneys to yield the active 1,25-dihydroxycholecalciferol; more commonly known as 1,25-
dihydroxy Vitamin D or calcitriol. (7) This active form produces physiological effects by binding
6
to the VDR. Some of these effects include regulation of calcium and phosphate homeostasis,
stimulation of appropriate immune responses and control of cell proliferation. (8)
The VDR is a nuclear receptor that binds active 1, 25-dihydroxy Vitamin D. In an active
ligand state, VDR modulates gene expression through heterodimerization with the retinoid X-
receptor and/or recruitment of various activating and repressing proteins. (9) Recent studies have
linked VDR activity to the proper growth and development of mammary glands in mice. Global
VDR deletion results in accelerated ductal growth and branching in the mammary gland,
suggesting that VDR is involved in negative growth regulation. (10) Abnormal atrophy of the
mammary fat pad as well as white adipose tissue depots has also been reported in aged VDR null
mice, suggesting VDR has a role in energy metabolism as well as the maintenance of the stromal
microenvironment of the mammary gland. (11) In addition, the VDR pathway has been shown to
impact metabolic organs, for example Vitamin-D inhibits fibrotic responses in liver, kidney, and
pancreas. Global VDR knockout mice exhibit hepatic, pancreatic, renal, and intestinal fibrosis,
supporting Vitamin D’s metabolic effects. (12,13,14,15) Global VDR ablation has also been shown to
lead to insulin resistance in mice, suggesting Vitamin D has a role in the development of Type 2
Diabetes which is another risk factor of breast cancer. (16) These findings collectively suggest a
link between the Vitamin D pathway, adiposity, and breast cancer development or progression.
Adipose tissue is involved in the normal development of the mammary glands by
regulating the growth and differentiation of the adjacent epithelial cells. For example, during
pregnancy, adipocytes signal the growth of the epithelium to create milk-producing cells. Other
work shows that deletion of white adipose tissue in mice prevents mammary gland development.
(17) Obesity has long been associated with both Vitamin-D deficiency and breast cancer, but the
mechanisms and cross talk underlying this association are largely unknown. (18) Since the

7
absence of VDR causes increased growth in the mammary glands, we hypothesized that Vitamin
D regulates epithelial cells via the mammary adipose tissue. (19)
In this experiment, we compared mice with deletion of the VDR gene specifically in
adipose tissue (CVF strain) to the CN1 control strain from which they were derived.
Specifically, we compared body and tissue weights, whole mount morphology and
histopathology of the mammary tissue, white adipose tissue, liver, and pancreas from mature
CVF and CN1 mice. We also assessed VDR expression in adipose tissue by quantitative reverse
transcription PCR to validate the model.
Methods
Mice
The VDR gene was eliminated from adipose tissue of mice using standard cre-flox
knockout procedures. The gene deletion was targeted to the adipose tissue through use of the
well-characterized adipose-specific promoter of the fatty acid binding protein 4 (Fapb4) gene.
CN1 mice bearing the cre transgene driven by the FABP4 promoter were mated with VDR
floxed mice (originally generated by Dr. S. Kato, Tokyo University, Japan) to generate offspring
with the adipose-specific VDR knockout, which were termed CVF mice. A limitation of this
model is that the FABP4-driven gene deletion occurs in mature adipocytes, but not in
mesenchymal stem cells or pre-adipocytes, therefore residual VDR expression in these cell types
is expected. Previous studies on mice with global VDR deletion revealed enhanced proliferation
of the mammary epithelium during puberty and pregnancy, but severe atrophy of the mammary
fat pad with age.(11) In the studies reported here, CN1 and CVF mice were maintained on high fat
diets to promote adipogenesis and enhance the proliferative signaling from the adipocytes to the
epithelium. A subset of CN1 and CVF mice were reared on a high calcium, high lactose 'rescue'

8
diet instead of a high fat diet for comparison to the global VDRKO mice. At time of harvesting,
ages of the mice were recorded, as well as body weight, mammary gland weight, and abdominal
white adipose tissue weight.
After CO2 euthanasia, mammary glands, including the entire mammary fat pad, were
dissected from the CN1 and CVF mice. One inguinal gland from each animal was weighed,
formalin-fixed, paraffin embedded and sectioned. The contralateral inguinal gland was used for
whole mounting. One thoracic gland from each animal was quick-frozen in liquid nitrogen for
RNA isolation. Visceral white adipose tissue collected from the abdominal cavity was also
archived for histological and molecular analysis.
Analysis of mammary gland morphology
Sectioning and H&E staining. Using a microtome, 5-micrometer slices were cut and
plated to charged slides, to ensure tissue adhesion. These tissues were then stained with both
Hematoxylin and Eosin Y. This allowed for a general morphological analysis, which includes
the overall density of cell clusters, size of cells, and ductal growth. Images were taken of the
stained sections at 25x magnification and 100x magnification. A representative area adjacent to
the lymph node was chosen for quantitative analysis, which was performed with Image J
software to estimate the epithelial density. Pixel counts were used to determine the area of
epithelium present in relation to the total glandular area. Regions containing gaps, holes, or cuts
in the tissue were removed from the sample, and thus from the total pixel count to provide the
pixel count of the relevant tissue. Epithelial cell pixels were then divided by the tissue pixel
count to yield the epithelial to mammary gland ratio which was expressed as a percentage.

9
Whole mount analysis
Dissected inguinal glands were stretched onto glass slides and fixed with Carnoy’s
solution. The glands were then stained with carmine alum to stain the epithelium, and
subsequently dehydrated and mounted. This allowed for the visualization of ductal
morphogenesis and outgrowth across the entire gland. Quantitation of the epithelial density was
conducted with Image J on images taken at 10x magnification. Images were converted to black
and white and the light/dark threshold was adjusted to outline epithelial branches. The pixel
count of the outlined epithelial branches was divided by the total pixel count of the image to
yield a ratio of epithelium to the rest of the gland which was expressed as a percentage.
Analysis of white adipose tissue morphology
Abdominal white adipose was dissected and subsequently sectioned and stained with
both Hematoxylin and Eosin Y. Gross morphological analysis was performed to observe
changes in adipocyte size and density. Quantitation with Image J was performed to measure the
number of adipocytes per field at 25x magnification.
Analysis of liver morphology and adiposity
Liver sections were obtained in a similar fashion as noted above and stained with
Hemotoxylin and Eosin Y. Images were taken at 25x magnification. A representative area of
each tissue was chosen such to avoid cuts or ducts. Quantitative analysis of adipose content was
performed using Image J. Images were converted to black and white and the light/dark threshold
was adjusted to fill in the area of white fat globules vs. the rest of the tissue. Pixel counts were
then used to determine the total pixel area of adipose globules. Adipose globule pixels were then
divided by the total tissue pixel count to yield the adipose to liver ratio which was expressed as a
percentage.

10
Analysis of Pancreas Morphology
Pancreas sections were obtained through similar processes as previously described and
stained with Hematoxylin and Eosin Y. Gross morphological analyses was conducted with
special consideration given to the pancreatic islets and ducts.
Analysis of liver and pancreatic fibrotic response
Liver and pancreas sections were stained with Masson’s trichrome to allow for evaluation
of fibrosis. Gross morphological analysis was performed to search for evidence of fibrosis within
the sections.
RNA isolation and qRT-PCR
To verify that the VDR gene was deleted in adipose tissue, RNA was isolated from
visceral white adipose tissue removed from CN1 and CVF mice. Briefly, 100-150mg of tissue
was subjected to TRIzol extraction and isolated RNA was reverse transcribed into cDNA.
Samples were analyzed for VDR expression using Invitrogen platinum mix (Life Technologies,
Grand Island, NY). Concurrently, 18S RNA expression was determined for normalization
purposes. qRT-PCR was run for 40 cycles, and data for VDR expression was expressed relative
to that of 18S RNA and reported as relative gene expression with CN1 values set to 1.
AlternativemethodofRNAisolation
TheisolationofRNAfromthewhiteadiposetissueposedseveralissues.Since
adiposetissueishighinlipidandlowincellulardensity,totalRNAyieldswereverylow.
ThelowyieldsmadeitverydifficulttopurifyenoughRNAforPCR.Wethereforemodified
theprotocoltoincludeLithiumChlorideprecipitationasanadditionalstepafterthe
isopropanolprecipitation.LiClisaveryspecificforprecipitatingRNA,asitwillnot
efficientlyprecipitateDNA,protein,orcarbohydrates.Weexpectedthattheinclusionofthe

11
LiCLstepwouldavoidsubsequentstepstoenhanceRNApuritywhichtendtodecrease
yield.PurityofsamplesisolatedwithandwithouttheLiCLstepwascomparedonan
AgilentBioanalyzerwhichcalculatedthe28S/18SrationandtheRNAIntegrityNumber
(RIN)values.
Statistical analyses
All data in graphs depict the mean values derived from CN1 or CVF mice accompanied
with a standard error bar. Three mice from each strain were utilized for analysis of VDR in
adipose tissue. For Hematoxylin and Eosin Y quantitation, four mice from each strain were
analyzed. Whole mount analysis involved seven CN1 mice and eight for CVF. Two outliers were
removed from the H+E staining results (CN1 151 and CVF 200) based on Grubbs’ test.
Significance was tested with an unpaired t test for each data set.
Results RNA Isolation and qRT-PCR RNA from white adipose tissue was isolated, reverse transcribed, and analyzed by qPCR
for VDR expression which was normalized in each sample against 18S rRNA expression. The
data comparing VDR expression in adipose tissue from age-matched CVF adipose-specific VDR
knockout mice and CN1 control mice is displayed in Figure 1. Compared to the endogenous
level of VDR in adipose tissue detected in CN1 mice, tissue from CVF mice exhibited a mean
reduction in VDR expression of approximately 80%. Despite the small number of samples
utilized (n=3), the difference was statistically significant, indicating successful VDR deletion in
adipose tissue. Residual VDR expression in the CVF adipose tissue likely represents expression
of the gene in cells other than mature adipocytes, such as mesenchymal stem cells or pre-
adipocytes.

12
Mice Characterization
Overall body weights of the mice as well as the inguinal mammary gland were measured.
Both CN1 and CVF mice fed a high fat diet demonstrated increased body weight gain compared
to the lower fat, high calcium and lactose rescue diet (Figure 2). Interestingly, female CVF mice
gained weight at an accelerated rate compared to CN1 mice on both types of diet. Caloric intakes
between CVF females compared to their CN1 counterparts were not significantly different (data
not shown). However, there were no significant differences in weight gain patterns in male mice
on either diet. This could indicate that VDR’s function in adipose tissue is gender specific.
Figure 3 represents the weight of the mammary gland as the percent of the total body
weight for the subset of CN1 and CVF mice fed high fat diets. The weight of the mammary
glands from CVF mice were slightly reduced compared to those of CN1 mice, however this
difference was not statistically significant (p=0.0552).
Figure 1: Relative expression of the VDR in white adipose tissue of age-matched CN1 control and CVF knockout strains. VDR expression was analyzed by qPCR and normalized against 18S RNA expression. VDR expression is reported as relative gene expression with CN1 values set to 1. Bars indicate mean ± standard error for each data set. *p< 0.05, as determined by t test.
0.00.20.40.60.81.01.21.41.6
VDR
NormalizedVDRExpression
Strain
WhiteAdiposeTissueVDRExpression
CN1
CVF*
CN1 CVF

13
Figure 3: Mammary gland weights in CN1 and CVF mice fed high fat diets. Whole inguinal mammary glands were
weighed after dissection. Results were expressed as mammary gland weight in relation to total body weight. Bars indicate the mean ± standard error for each data set.
0.00%
0.50%
1.00%
1.50%
2.00%
2.50%
3.00%
3.50%
4.00%
4.50%
�Strain
Mam
maryGlandWeight
(%TotalBodyWeight)
CN1
CVF
Figure 2: Post weaning body weight of CN1 and CVF mice. Temporal body weight gain of CN1 and CVF mice weaned on high calcium/lactose rescue diets (left) or high fat diets (right). Points and error bars represent mean standard deviation of 4-12 mice per datapoint. Statistical significance at p<0.05 was determined by linear regression slope.
CN1CVF

14
Whole Mounts Whole mounts were used to observe the entirety of the mammary gland morphology
including its ductal system. Representative images of glands from 2 CN1 and 2 CVF mice are
shown in Figure 4 at 3.5x magnification. These low power stereoscope images suggest that
glands from the CVF mice have more extensive epithelial branching than glands from CN1 mice.
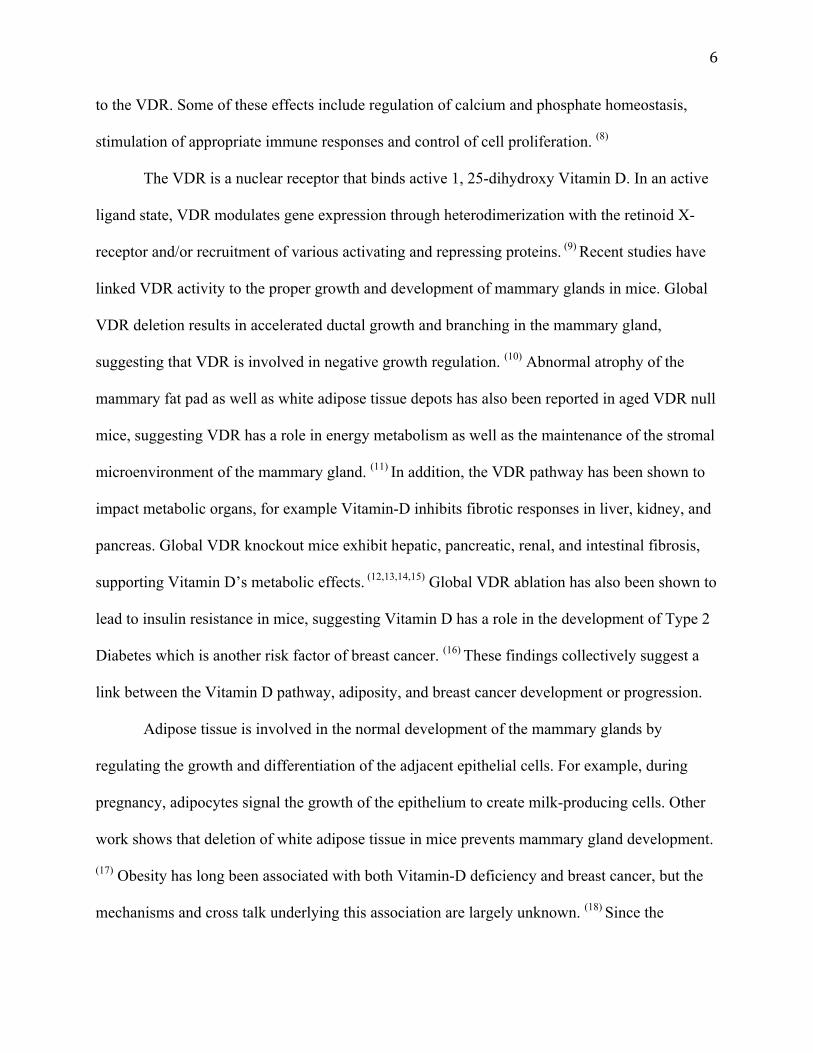
At higher magnification (10x, Figure 5) ductal structure appears normal in both strains but higher
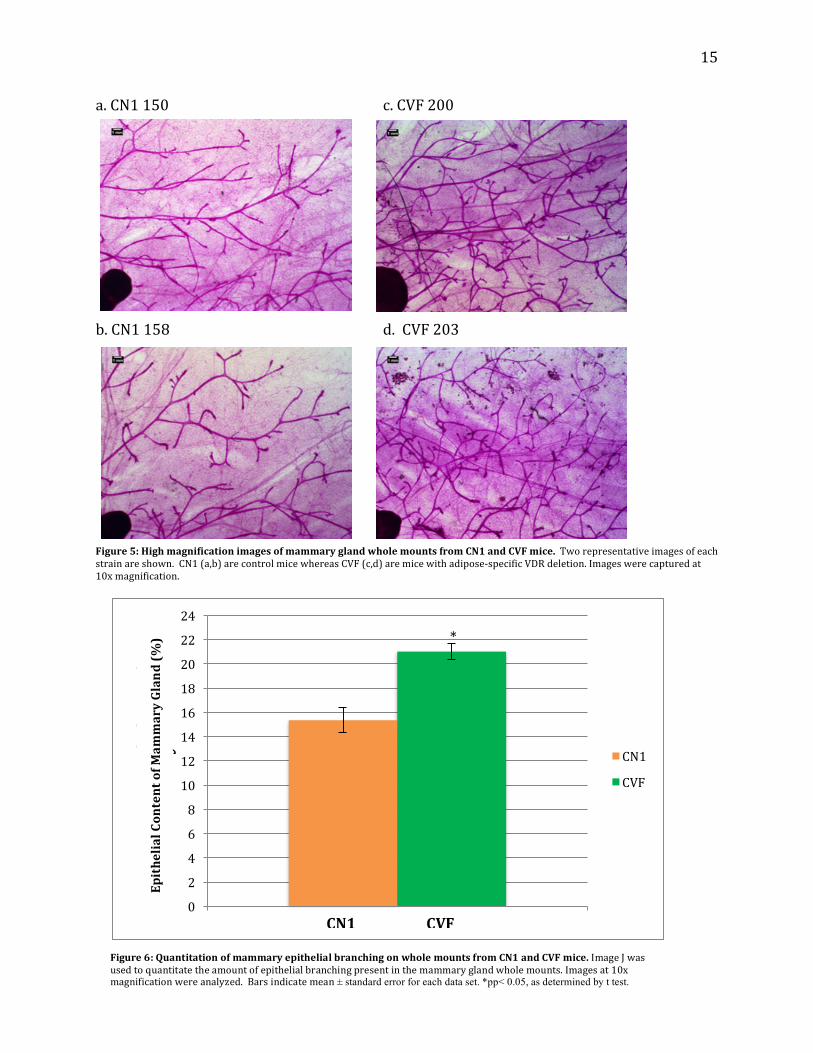
density is evident in CVF mice. Figure 6 represents the quantitation of the 10x magnification
whole mount images of the mammary gland, which confirmed increased epithelial density in the
CVF mice.
a.CN1150 c.CVF200
b.CN1165 d.CVF213Figure4:RepresentativeimagesofmammaryglandwholemountsfromCN1andCVFmice.TworepresentativeimagesforeachstrainareshownCN1(a,b)arecontrolmicewhereasCVF(c,d)aremicewithadipose-specificVDRdeletion.Imageswerecapturedat3.5xmagnification.
15
a.CN1150 c.CVF200 b.CN1158 d.CVF203Figure5:HighmagnificationimagesofmammaryglandwholemountsfromCN1andCVFmice.Tworepresentativeimagesofeachstrainareshown.CN1(a,b)arecontrolmicewhereasCVF(c,d)aremicewithadipose-specificVDRdeletion.Imageswerecapturedat10xmagnification.
Figure6:QuantitationofmammaryepithelialbranchingonwholemountsfromCN1andCVFmice.ImageJwasusedtoquantitatetheamountofepithelialbranchingpresentinthemammaryglandwholemounts.Imagesat10xmagnificationwereanalyzed.Barsindicatemean± standard error for each data set. *pp< 0.05, as determined by t test.
0
2
4
6
8
10
12
14
16
18
20
22
24
�Strain
PercentEpitheliumof
Mam
maryGland
CN1
CVF
*
EpithelialContentofM
ammaryGland(%
)
CN1CVF

16
Histological Assessment of Mammary Gland Morphology in High Fat Diet fed Mice
Mammary gland sections were taken at 5 microns for the CVF and CN1 strains and
stained with Hematoxylin and Eosin Y allowing for routine morphological analysis. Initial
examination indicated that the development of the mammary fat pad was not compromised by
deletion of VDR from mature adipocytes (Figure 7). There were no discernable differences in
adipocyte size or lipid content between the strains, although further quantitative analysis will be
necessary to confirm this initial observation. With respect to the epithelial compartment, tissue
from CVF mice exhibited an increase in epithelial ductal density compared to that of CN1 mice
(Figure 7). Quantitation of the epithelial density by Image J confirmed significantly higher
amounts of epithelial tissue in the CVF mice (Figure 8).
Histological Assessment of Mammary Gland Morphology in Rescue Diet fed Mice Similarly to the high fat diet fed mice, mammary gland sections were taken at 5 microns
for CVF and CN1 strains fed high calcium/lactose rescue diet. Sections were stained with
Hematoxylin and Eosin Y for routine morphological analysis. Figure 7 represents images taken
at 25x magnification. Initial qualitative analysis indicated no obvious discernable differences in
adipocyte density, but confirmed the finding that CVF mice exhibit increased epithelial content.
Quantitation of epithelial density by Image J confirmed significantly higher amounts of epithelial
tissue in the CVF mice. Of note, the rescue diet fed mice exhibited increased epithelial content
compared to adipose content compared to the high fat diet, regardless of strain.

17
a.CN1150Highfat c.CVF200HighFatb.CN1176Rescuediet d.CVF221Rescuediet Figure 8: Comparison of mammary gland histology in CVF and CN1 mice. Hematoxylin and Eosin Y stains were performed on mammary gland sections. Images were gathered at 25x magnification. Image J was used to quantitate epithelial content. CVF mice contained increased amount of epithelial tissue within the mammary gland than the CN1 mice on both high fat and rescue diet. Bars indicate the mean ± standard error for each data set. *pp< 0.05, as determined by t test.
Figure7:Hematoxylinandeosin(H&E)stainedmammarysectionsfromCN1andCVFmiceonhighfatdiet.Representativesectionsofformalinfixed,paraffinembeddedtissuewerestainedwithH&Eandphotographedat25xmagnification.A,B:CN1mice;C,D:CVFmicewithadiposespecificVDRdeletion.
*
*
EpithelialContentofM
ammaryGland(%
)

18
White Adipose Tissue (WAT) Morphology The CVF female mice exhibited significant increase in abdominal WAT mass compared
to CN1 mice on both rescue and high fat diets. In CN1 and CVF males, WAT mass was not
significantly increased in response to diet or genotype (Data not shown).
WAT sections were taken at 5 microns for the CN1 and CVF strains and stained similarly
as the mammary gland samples. Figure 9A compares CN1 and CVF WAT sections on high fat
and rescue diets. This data suggests larger adipocytes in CVF mice versus the CN1 mice fed
rescue diets, but this was not observed in the high fat diet. Further quantitative analysis
confirmed that there were significantly fewer cells per image in CVF mice on rescue diet and
high fat mice of both genotypes when compared to CN1 mice on rescue diet (Figure 9B).
A B
CN1 169 Rescue Diet CN1 156 High Fat Diet CVF 223 Rescue Diet CVF 211 High Fat Diet
Figure 9: Characterization of WAT from CN1 and CVF mice on rescue diet vs. high fat diet. (A) Representative sections of formalin fixed, paraffin embedded WAT were stained with H&E and photographed at 25x and 100x magnification. CN1 and CVF mice fed rescue diet are shown on the left, with CN1 and CVF mice fed high fat diet are shown on the right. (B) Quantitation of adipocyte density was measured on H&E stained sections of WAT imaged at 100x.
0
50
100
150
200
250
300
350
400
450
500
Num
berofAdipocytes/Field
RescueDietHighfatDiet
CN1
CVF
19
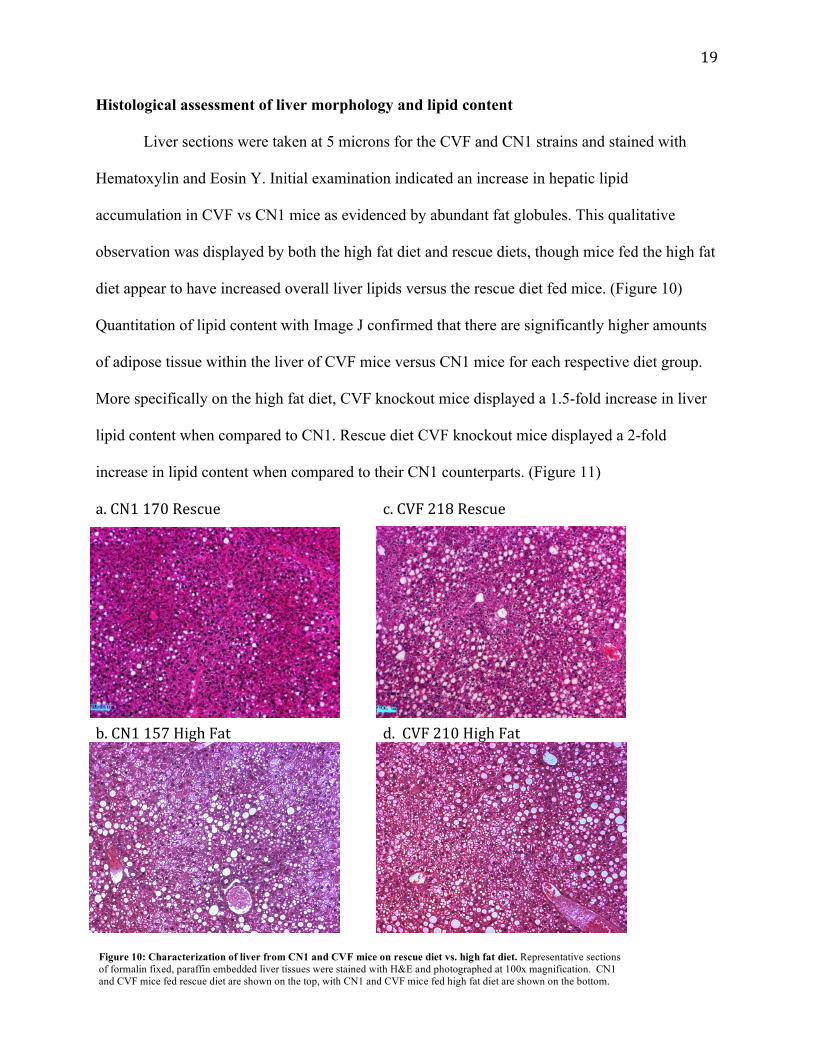
Histological assessment of liver morphology and lipid content Liver sections were taken at 5 microns for the CVF and CN1 strains and stained with
Hematoxylin and Eosin Y. Initial examination indicated an increase in hepatic lipid
accumulation in CVF vs CN1 mice as evidenced by abundant fat globules. This qualitative
observation was displayed by both the high fat diet and rescue diets, though mice fed the high fat
diet appear to have increased overall liver lipids versus the rescue diet fed mice. (Figure 10)
Quantitation of lipid content with Image J confirmed that there are significantly higher amounts
of adipose tissue within the liver of CVF mice versus CN1 mice for each respective diet group.
More specifically on the high fat diet, CVF knockout mice displayed a 1.5-fold increase in liver
lipid content when compared to CN1. Rescue diet CVF knockout mice displayed a 2-fold
increase in lipid content when compared to their CN1 counterparts. (Figure 11)
a.CN1170Rescue c.CVF218Rescue b.CN1157HighFat d.CVF210HighFatFigure 10: Characterization of liver from CN1 and CVF mice on rescue diet vs. high fat diet. Representative sections of formalin fixed, paraffin embedded liver tissues were stained with H&E and photographed at 100x magnification. CN1 and CVF mice fed rescue diet are shown on the top, with CN1 and CVF mice fed high fat diet are shown on the bottom.
20
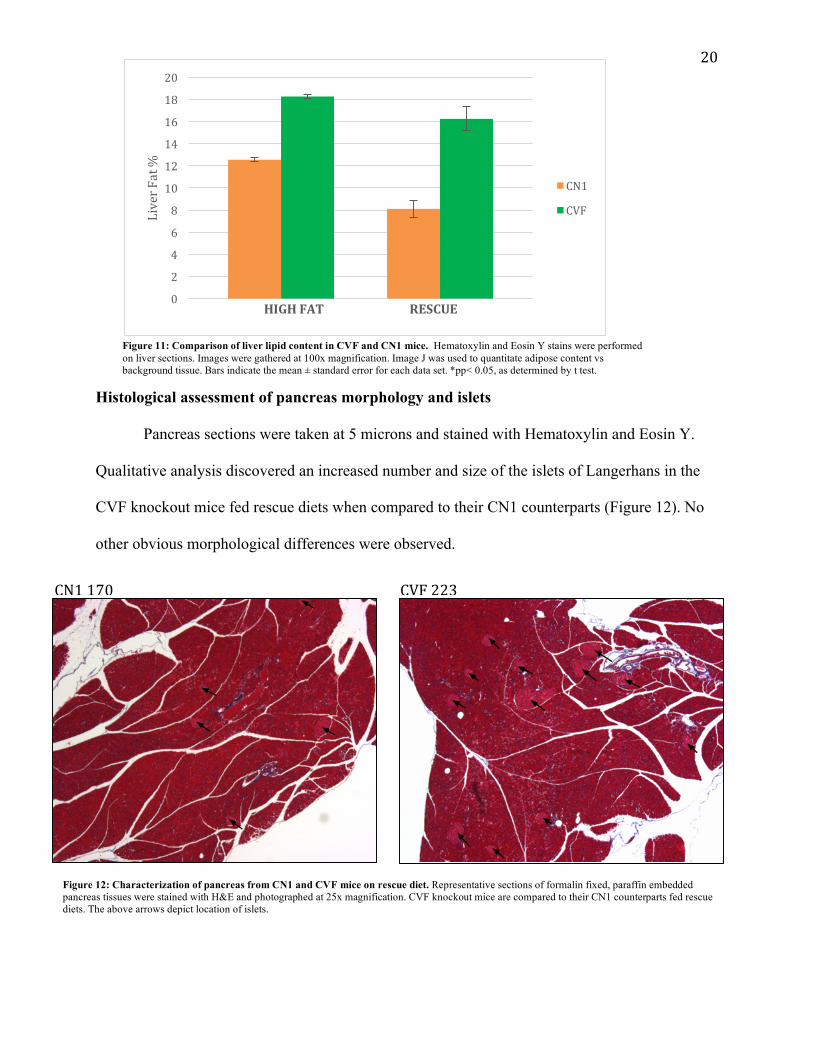
Histological assessment of pancreas morphology and islets Pancreas sections were taken at 5 microns and stained with Hematoxylin and Eosin Y.
Qualitative analysis discovered an increased number and size of the islets of Langerhans in the
CVF knockout mice fed rescue diets when compared to their CN1 counterparts (Figure 12). No
other obvious morphological differences were observed.
0
2
4
6
8
10
12
14
16
18
20
LiverFat%
HIGHFAT RESCUE
CN1
CVF
Figure 11: Comparison of liver lipid content in CVF and CN1 mice. Hematoxylin and Eosin Y stains were performed on liver sections. Images were gathered at 100x magnification. Image J was used to quantitate adipose content vs background tissue. Bars indicate the mean ± standard error for each data set. *pp< 0.05, as determined by t test.
CN1170 CVF223
Figure 12: Characterization of pancreas from CN1 and CVF mice on rescue diet. Representative sections of formalin fixed, paraffin embedded pancreas tissues were stained with H&E and photographed at 25x magnification. CVF knockout mice are compared to their CN1 counterparts fed rescue diets. The above arrows depict location of islets.

21
Masson’strichromeanalysisofpancreaticandlivercollagenandfibrosis Masson’s trichrome stain was utilized to analysis collagen content and fibrosis in
pancreas and liver sections. Qualitative analysis did not reveal any evidence of liver or
pancreatic fibrosis across all mice regardless of strain or diet. Further observation also did not
indicate any increase in overall collagen content in sections nor increased collagen deposits
around ducts. (Figure 13)
CN1170Liver CVF223Liver
CN1170Pancreas CVF223Pancreas
Figure 13: Characterization of liver and pancreas with Masson’s trichrome stain. Representative sections of formalin fixed, paraffin embedded liver tissues were stained with Masson’s trichrome stain and photographed at 25x magnification. CN1/CVF liver sections are shown at the top. Pancreas sections are shown at the bottom. Collagen is stained blue as depicted above.

22
LiClRNAIsolationResults Lithiumchloridewasusedasanadditionalisolationstepafterisopropanolprecipitation.
SamplesweregatheredfromwhiteadiposetissueandanalyzedwithaBioanalyzerforquality.
WiththeexceptionofCN1157andCVF203,allsampleshadsufficientyieldtobeusedfor
cDNAsynthesis,andhadpure,intactRNA(Figure14).GraphsforCN1150andCVF212are
includedinFigure15.AclearadvantageoftheadditionalisolationstepofLiClisthatcleaning
theRNApost-isolationisnolongernecessary,allowingpreservationofyield.
Strain Yield(ng/μl) 28S/18S RINCN1150 231 1.8 7.9CN1157 99 1.4 7.7CN1164 240 1.7 9.2CVF203 78 2.0 9.5CVF209 183 1.5 6.9CVF212 281 1.7 9.5
Figure15:AlternativeMethodforRNAIsolationQCGraphs.AnAgilentBioanalyzerwasusedtomeasurethe28S/18SandRINvaluesforwhiteadiposetissuesamples.Optimal28S/18Svaluesareabove1.7andRINvaluesabove7.Thesegraphswerechosentoberepresentativeofallofthesamples.
Figure14:AlternativeMethodforRNAIsolationQCResults.AnAgilentBioanalyzerwasusedtomeasurethe28S/18SandRINvaluesforwhiteadiposetissuesamples.Optimal28S/18Svaluesareabove1.7andRINvaluesabove7.

23
Discussion Our studies on mice with adipose specific VDR deletion indicate that vitamin D
signaling in the mammary adipose tissue impacts growth of the adjacent mammary epithelium.
RNA was isolated from white adipose tissue samples from CN1 and CVF mice, and
qRT-PCR was run to verify the VDR knockout model. Results showed a significantly lower
expression of VDR in adipose tissue from the CVF mice as compared to the control CN1 mice.
As expected, VDR was detected in adipose tissue of the CVF strain, since the FABP4-cre
activity will only delete VDR in mature adipocytes. Residual VDR expression in adipose tissue
from CVF mice likely represents VDR present in non-differentiated cells including stem cells
and pre-adipocytes. However, the 80% reduction in VDR expression we observed indicated that
the transgene was effective at VDR deletion in the majority of cells within the adipose tissue.
Other studies employing the FaBP4-driven gene deletion model of VDR revealed similar results
through qPCR and western blots of residual VDR expression. (13) Further studies to analyze the
extent of VDR deletion in mammary adipose tissue are warranted.
To provide insight into the impact of VDR signaling in adipocytes on body weight
homeostasis, we compared growth of CVF and CN1 transgenic mice reared on high fat or rescue
diets. As expected, mice fed high fat diets demonstrated increased weight gain compared to those
fed the lower fat rescue diet. Females with adipose-specific VDR ablation exhibited accelerated
body weight gain compared to their control counterparts on both diets. Of note, this weight gain
was a gradual process over a long period of time post-weaning rather than an effect of birth
weight. In the females there were no significant effects of genotype on caloric intake, indicating
that the enhanced weight gain in CVF females was not associated with increased food
consumption suggesting enhanced feed efficiency (data not shown). Strangely, there were no
24
significant differences in weight gain patterns of male mice on either diet. This indicates that
VDR’s function in adipose tissue could be gender-specific.
Interestingly, neither the weight of the mammary gland nor the histological appearance of
the fat pad itself was altered in CVF mice. Thus, vitamin D signaling within mature adipocytes is
not critical for maintenance of adipose tissue integrity. However, using three different methods,
we detected an increase in the amount of adjacent epithelial tissue in the mammary gland of mice
with adipose specific VDR deletion.
Hematoxylin and Eosin Y staining revealed slightly increased levels of ductal growth in
CVF mice compared to their control CN1 counterparts. Quantitation of the epithelium present in
the glands using Image J confirmed this observation, and revealed a significantly greater amount
of epithelium in CVF mice compared to CN1 mice. Whole mounts of the mammary gland also
revealed an increase in primary, secondary, and tertiary branching in the CVF mice, verifying
data from the H+E stains. Quantitation of the epithelium with Image J confirmed a significantly
greater amount of epithelium in CVF mice versus the CN1 mice.
Collectively, these findings indicate that in the absence of VDR, signals from mammary
adipocytes upregulate growth of the adjacent epithelial cells and ducts. Therefore, the vitamin D
pathway is critical for regulation of the cross-talk between the adipose and epithelial
compartments within the mammary gland. In normal mice, the presence of VDR in the adipose
tissue suppresses the growth of epithelial tissue within the ducts. These findings predict that
when this pathway becomes disrupted, for example due to vitamin D deficiency, accelerated
growth in the epithelium will occur. Our findings are consistent with previous studies that
reported an increase in epithelial branching and ductal growth in the pubertal mammary gland of
mice with global VDR deletion. (11) Our data indicate that at least some of the effects of VDR to

25
inhibit epithelial growth are mediated via the adipose tissue.
During the course of this study, our collaborators at the University of Cincinnati
evaluated early mammary gland development in the CVF strain and reported that deletion of
VDR in adipose compartment enhances proliferation of the epithelium during pubertal
development. (13) Our study extends these findings to demonstrate that the enhanced branching
and ductal density persists through adulthood, at least when mice are fed a high fat diet.
Collectively, these data strongly indicate that the vitamin D/VDR complex in adipose tissue
transmits growth inhibitory signals to the epithelium throughout development. Further studies
are needed to identify the specific mediators of this vitamin D-regulated cross talk between the
mammary fat pad and the epithelium.
Abdominal WAT weights were measured and sectioned to allow for morphological
analysis. Mice with VDR ablation exhibited significantly increased abdominal WAT mass on
both rescue and high fat diets when compared to their CN1 counterparts. In fact, the increased
weight of WAT attributed for the majority of the accelerated body weight gain observed as
previously mentioned. Additionally, Hematoxylin and Eosin Y stains revealed significantly
larger adipocytes in CVF knockout mice versus CN1 mice fed a rescue diet. In high fat diets the
difference between adipose tissue morphology was minimal, which was a likely result due to the
nature of the diet itself. Of note, the males did not display any significant differences in WAT
weights or morphology, matching the prior observation that VDR function in adipose tissue
appears to be gender specific. Our results therefore display that Vitamin-D signaling in the
adipose tissue is involved in regulation of WAT mass and morphology.
Strangely, our adipose specific VDR knockout mice do not mimic the global knockouts
with respect to adiposity. Global VDR deletion results in a lean phenotype characterized by

26
reduced adipose tissue and adipocyte size. This is in direct contrast to the adipose specific VDR
knockout mice that displayed increased body weights and increased white adipose depots.
Characterization of liver morphology with Hematoxylin and Eosin Y displayed a
significant increase in adipose content of the liver in CVF mice on both diets. This finding sheds
light onto the metabolic effects of VDR ablation in the adipose tissue within the liver itself. Fatty
liver has been linked to cirrhosis, fibrosis, and diabetes, which may be accelerated by Vitamin D
deficiency.
Hematoxylin and Eosin Y staining revealed an increase in the size and number of
pancreatic islets of Langerhans in mice with VDR deletion. Prior research has shown global
VDR knockout mice to be insulin resistant. (16) As such, it is possible islet hyperplasia may be a
compensatory response to resistance. Since the islets are responsible for insulin production and
secretion, an increased number and size of the islets could represent an attempt to elevate blood-
insulin levels to overcome resistance caused by VDR ablation. These observations lend further
insight into the adipose-specific function of Vitamin-D and diabetes, but further research is
warranted to measure blood-insulin and blood-glucose levels in adipose-specific VDR
knockouts.
Vitamin-D is known to negatively regulate collagen synthesis. Global VDR knockout
mice have been shown to develop hepatic and pancreatic fibrosis. (12,15) By contrast, these tissues
from adipose-specific VDR knockout mice did not exhibit evidence of fibrosis. Additionally, we
saw no no qualitative evidence of increased collagen synthesis or deposits around ducts within
the liver and pancreas. This suggests that VDR deletion specifically in the adipose tissue is not
sufficient to lead to fibrosis or overall increased collagen synthesis. Further studies are warranted
including western blotting to accurately quantify collagen content and hence fibrosis.

27
Quality control results for the use of LiCl as an additional isolation step for RNA
proved to be promising. Past issues in isolating RNA from adipose tissues included low purity,
and low yields prevented the cleaning of samples. Incorporating LiCl as a purifying step after
isopropanol precipitation allowed us to attain pure samples. As expected, RNA yields were still
relatively low, but since they do not require additional steps to enhance purify, the yields were
sufficient for use in cDNA synthesis and qPCR. Further studies comparing PCR results for RNA
isolated with the LiCl protocol will be needed to determine if it is a suitable addition to our
protocols.

28
References [1] U.S. Breast Cancer Statistics. (2014, September 20). In breastcancer.org Retrieved November 29, 2014, http://www.breastcancer.org/symptoms/understand_bc/statistics [2] Breast cancer survival rates by stage. (2014, September 15). Retrieved December 8, 2014, from http://www.cancer.org/cancer/breastcancer/detailedguide/breast-cancer-survival-by-stage [3] What are the risk factors for breast cancer?. (2014, September 25). In American Cancer Society. Retrieved November 29, 2014, from http://www.cancer.org/cancer/breastcancer/detailedguide/breast-cancer-risk-factors [4] Mohr, S. (2005, April 4). Mapping vitamin d deficiency, breast cancer, and colorectal cancer. Retrieved December 8, 2014, from http://proceedings.esri.com/library/userconf/proc05/papers/pap1468.pdf [5] Krishnan, A., Swami, S., & Feldman, D. (2010, February 13). Vitamin D and breast cancer: Inhibition of estrogen synthesis and signaling. Retrieved December 8, 2014, from http://www.ncbi.nlm.nih.gov/pubmed/20156557 [6] Welsh, J. (2012). Vitamin D and cancer: Integration of cellular biology, molecular mechanisms and animal models. Scandinavian Journal of Clinical & Laboratory Investigation, 103-111. [7] Vitamin D (Cholecalciferol, Calcitriol). (2011, October 20). Retrieved December 8, 2014, from http://www.vivo.colostate.edu/hbooks/pathphys/endocrine/otherendo/vitamind.html [8] Drelich, J. A. (2014). The Effect of Vitamin D Treatment on MCF-7 Cells (pp. 1-10). [9] Haussler M, Haussler C, Bartik L, et al. Vitamin D receptor: molecular signaling and actions of nutritional ligands in disease prevention. Nutr Rev. 2008;66(10 Suppl 2):98–112. [10] Zinser, G., Packman, K., & Welsh, J. (2002). Vitamin D3 receptor ablation alters mammary gland morphogenesis. Development, 129, 3067-3076. [11] Welsh J, Zinser LN, Mianecki-Morton L, Martin J, Waltz SE, et al. (2011) Age-Related Changes in the Epithelial and Stromal Compartments of the Mammary Gland in Normocalcemic Mice Lacking the Vitamin D3 Receptor. PLoS ONE 6(1): e16479. doi:10.1371/journal.pone.0016479 [12] Ding N., Yu R. T., Subramaniam N., et al. A vitamin D receptor/SMAD genomic circuit gates hepatic fibrotic response. Cell. 2013;153(3):601–613. doi: 10.1016/j.cell.2013.03.028. [13] Bonventre J. V. Antifibrotic vitamin D analogs. J Clinical Invest. 123, 4570–4573 (2013) [14] Tao Q, Wang B, Zheng Y, Jiang X, Pan Z, Ren J. Vitamin D Prevents the Intestinal Fibrosis Via Induction of Vitamin D Receptor and Inhibition of Transforming Growth Factor-Beta1/Smad3 Pathway. Dig Dis Sci. 2015;60:868–75. [15] Sherman MH, Yu RT, Engle DD, Ding N, Atkins AR, Tiriac H, et al. Vitamin D receptor-mediated stromal reprogramming suppresses pancreatitis and enhances pancreatic cancer therapy. Cell. 2014;159:80–93. [16] Matthews, D. G., D'Angelo, J., Drelich, J., & Welsh, J. (2015). Adipose-specific Vdr deletion alters body fat and enhances mammary epithelial density. The Journal of Steroid Biochemistry and Molecular Biology. doi:doi:10.1016/j.jsbmb.2015.09.035 [17] Couldrey C, et al. Adipose tissue: A vital in vivo role in mammary gland development but not differentiation. Dev Dyn. 2002;223(4):459–468. [18] Giovannucci E. The epidemiology of vitamin D and cancer incidence and mortality: a review (United States). Cancer Causes Control 2005; 16:83–95. [19] Johnson, A., Zinser, G., & Waltz, S. (2014, August 19). Loss of vitamin D receptor signaling from the mammary epithelium or adipose tissue alters pubertal glandular development. Retrieved December 8, 2014, from http://www.ncbi.nlm.nih.gov/pubmed/25139050