phenolic resin-coated porous silicon/carbon microspheres
TRANSCRIPT
Phenolic Resin-coated Porous Silicon/carbonMicrospheres Anode Materials for Lithium-ionBatteriesJingli Liu ( [email protected] )
Jishou University https://orcid.org/0000-0003-2214-4745Xian-ming Wu
Jishou UniversityShang Chen
Jishou UniversityRui-lai Long
Jishou UniversityCai shuo Yin
Jishou UniversityFeng Zhang
Jishou University
Research Article
Keywords: micro-sized, porous silicon/carbon microspheres, Li-ion batteries
Posted Date: April 19th, 2021
DOI: https://doi.org/10.21203/rs.3.rs-362558/v1
License: This work is licensed under a Creative Commons Attribution 4.0 International License. Read Full License
Version of Record: A version of this preprint was published at Silicon on July 19th, 2021. See thepublished version at https://doi.org/10.1007/s12633-021-01240-y.
Phenolic resin-coated porous silicon/carbon microspheres anode materials for Lithium-ion
batteries
Liu Jing-li1· Wu Xian-ming1· Chen shang1· Long Rui-lai1· Yin Cai-shuo1· Zhang Feng1
(1 College of Chemistry and Chemical Engineering, Jishou University, Jishou 416000, Hunan, China
Liu Jing-li [email protected] ORCID: 0000-0003-2214-4745)
Abstract
Porous silicon/carbon (Si/C) anode materials for Lithium-ion batteries was synthesized successfully
by hydrochloric acid etching and calcination method using micron Si-Al alloy as silicon source and
phenolic resin as carbon source. The microstructure and morphology were characterized by XRD, SEM,
TEM, XPS and BET. The electrochemical performance were measured by constant current charge-
discharge test and EIS. The results show that Si/C is porous structure and its pores are distributed between
1-6 nm. The specific discharge specific capacity of Si/C is 1287.0 mAh/g at a current density of 100
mA/g after 50 cycles, corresponding to the capacity retention of 91.0% (for the second cycle). Si/C
delivers a high specific discharge capacity of 605.9 and 359.0 mAh/g at 1 A/g and 2 A/g, respectively.
The lithium ion diffusion coefficient of Si/C is 5.98×10⁻¹¹ cm2 s−1, which is higher than that of 7.57×10-
12 cm2 s−1 for porous Si.
Keywords micro-sized · porous silicon/carbon microspheres · Li-ion batteries
Declarations
Funding: Xiangxi Ores Minerals and New Materials Development and Service Center, Jishou 416000,
Hunan, China
Conflict of Interest: Not applicable
Author contributions: Provision of paper data, research ideas and designers, article writer
Availability of data and material: The data sets supporting the results of this article are included within
the article and its additional files.
Compliance with ethical standards: This article does not contain any studies with human participants
performed by any of the authors.
Consent to participate: Consent.
Consent for Publication: Consent.
Acknowledgments: This work was supported by the National Natural Science Foundation of China.
Introduction
In recent years, Silicon has been widely
concerned as a lithium-ion battery anode material
due to its large specific capacity (~3579 mAh/g),
low discharge potential (∼0.4 V versus Li/Li+)
and natural abundant[1-4]. However, the silicon
has a dramatic volume expansion (~300%) during
charging and discharging, which resulting in
cracking and pulverization, losing of electrical
contact, and forming unstable solid electrolyte
interface (SEI) films, eventually leading to
capacity attenuation[5-8]. To overcome these
defects, many measures have been tried, such as
nanostructure design[9-12], doping[13-15] and
carbon coating[16-21].
Porous silicon can shorten the lithium-ion
diffusion path,alleviate the bulk expansion effect
and improve the electrochemical
performance[22,23] because of its 3D pore
structure. The coated carbon layer on the porous
silicon not only provides buffer for the volume
expansion of silicon, but also enhances the
electrical conductivity of the material[24-30].
Based on above considerations, Si/C composite
was prepared by hydrochloric acid etching and
calcination method using micron Si-Al alloy as
silicon source and phenolic resin as carbon source
in this paper.
Experimental
Al−Si alloy particle with the average size of
around 2μm were added in 4% hydrochloric acid
solution, and mechanical stirred in a water bath at
40 ° C for 12 hours, followed by rinsing with
deionized water until neutral. Then the powder
was placed in a vacuum drying oven at 80 °C for
40 min to prepare porous silicon.
Phenolic resin was added to anhydrous ethanol
and stirred at 40°C until it dissolved completely.
Then different amounts of porous silicon was
added into the solution and stirred for 4 h, then
dried in a vacuum at 80 °C for 40 min to remove
the solvent. The mixture was annealed at 850 °C
for 4h in Ar atmosphere to obtain Si/C composite
with mass ratio of 1:2 (Si: C=1:2), which is
labeled as Si/C.
Weight loss process of phenolic resin was
characterized by thermogravimetric analysis
(TGA). The phase was determined by X-ray
diffraction (XRD) from 10° to 80°. Morphologies
were observed by scanning electron microscopy
(SEM) and transmission electron microscopy
(TEM). N2 adsorption/desorption measurements
of the samples were evaluated with the Brunauer-
Emmett-Teller (BET) method. X-ray
photoelectron spectroscopy (XPS) measurements
were applied to analyze the surface elemental
composition and valence states of the samples.
Active substances (Si/C), acetylene black and
binder PVDF were dissolved in n-methyl
pyrrolidone solvent at a mass ratio of 8:1:1 to
obtain slurry. The slurry was evenly coated on the
Cu foil and dried under vacuum at 60 °C for 4 h.
After drying, take out the sheet and cut it into an
electrode with diameter (d) = 14 mm. The
assembly of CR2023-type cell with lithium sheet
as negative electrode was conducted in a glove
box filled with argon. Microporous
polypropylene film as the diaphragm, and 1M
LiPF6 [V (EMC):V(EC):V(DMC)=1:1:1] was
employed as electrolyte.
Results and discussion
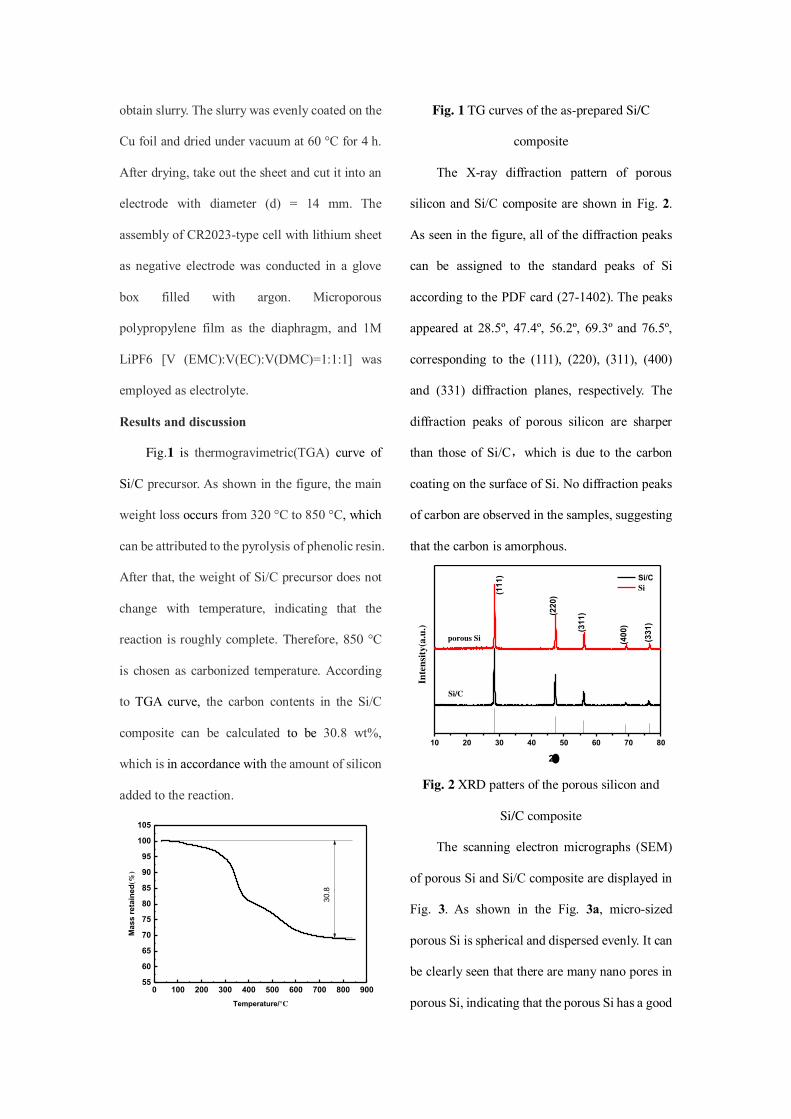
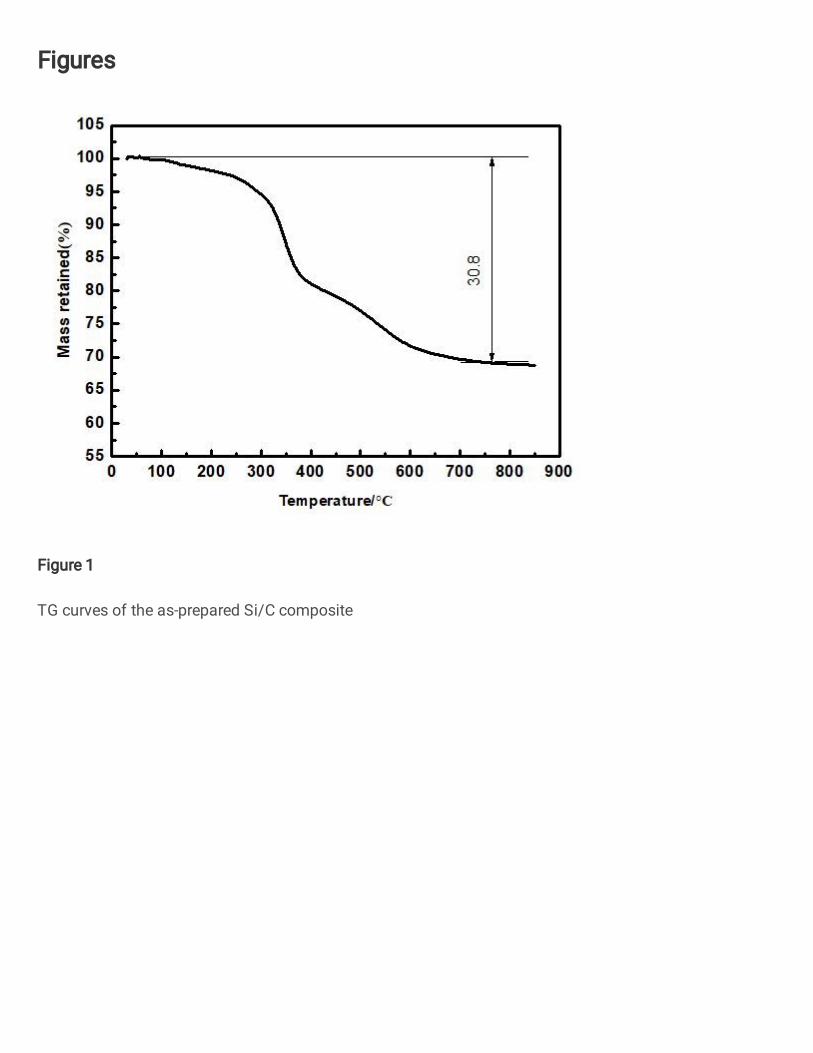
Fig.1 is thermogravimetric(TGA) curve of
Si/C precursor. As shown in the figure, the main
weight loss occurs from 320 °C to 850 °C, which
can be attributed to the pyrolysis of phenolic resin.
After that, the weight of Si/C precursor does not
change with temperature, indicating that the
reaction is roughly complete. Therefore, 850 °C
is chosen as carbonized temperature. According
to TGA curve, the carbon contents in the Si/C
composite can be calculated to be 30.8 wt%,
which is in accordance with the amount of silicon
added to the reaction.
0 100 200 300 400 500 600 700 800 90055
60
65
70
75
80
85
90
95
100
105
Ma
ss
re
tain
ed
(%)
Temperature/°C
30
.8
Fig. 1 TG curves of the as-prepared Si/C
composite
The X-ray diffraction pattern of porous
silicon and Si/C composite are shown in Fig. 2.
As seen in the figure, all of the diffraction peaks
can be assigned to the standard peaks of Si
according to the PDF card (27-1402). The peaks
appeared at 28.5º, 47.4º, 56.2º, 69.3º and 76.5º,
corresponding to the (111), (220), (311), (400)
and (331) diffraction planes, respectively. The
diffraction peaks of porous silicon are sharper
than those of Si/C,which is due to the carbon
coating on the surface of Si. No diffraction peaks
of carbon are observed in the samples, suggesting
that the carbon is amorphous.
10 20 30 40 50 60 70 80
2
Inte
nsi
ty(a
.u.)
(331)
(400)
(311)(2
20)
(11
1)
porous Si
Si/C
Si/C
Si
Fig. 2 XRD patters of the porous silicon and
Si/C composite
The scanning electron micrographs (SEM)
of porous Si and Si/C composite are displayed in
Fig. 3. As shown in the Fig. 3a, micro-sized
porous Si is spherical and dispersed evenly. It can
be clearly seen that there are many nano pores in
porous Si, indicating that the porous Si has a good
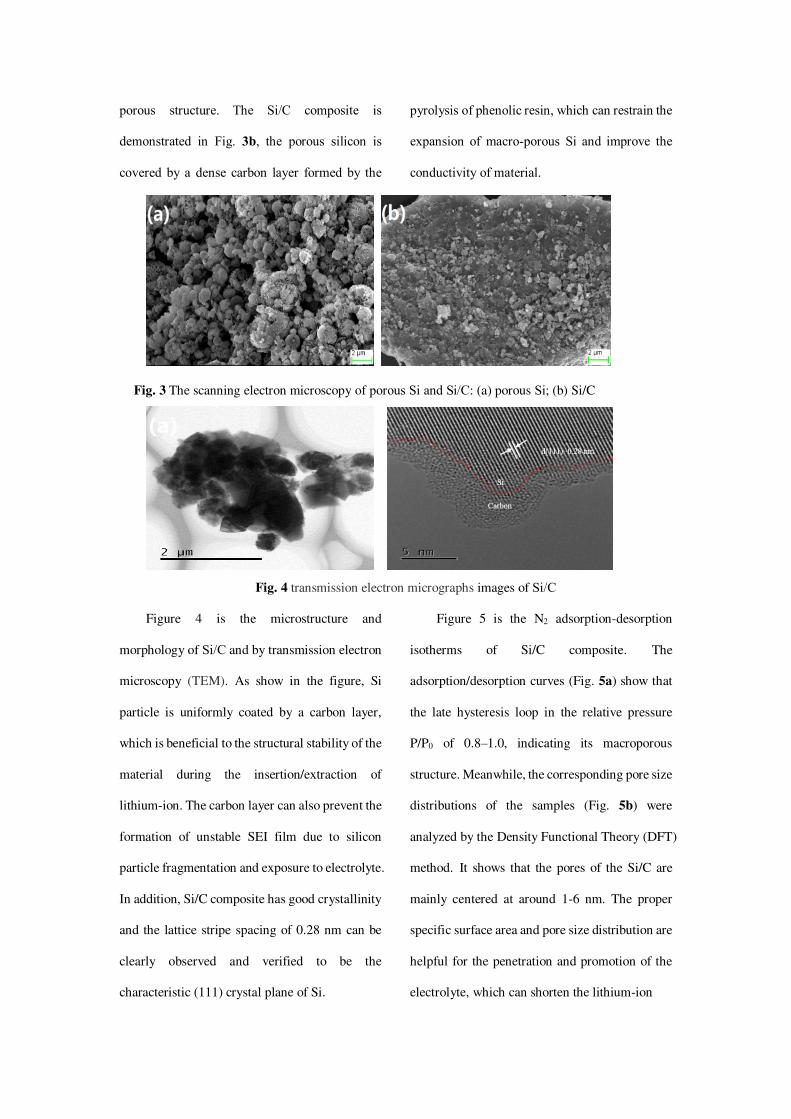
porous structure. The Si/C composite is
demonstrated in Fig. 3b, the porous silicon is
covered by a dense carbon layer formed by the
pyrolysis of phenolic resin, which can restrain the
expansion of macro-porous Si and improve the
conductivity of material.
Fig. 3 The scanning electron microscopy of porous Si and Si/C: (a) porous Si; (b) Si/C
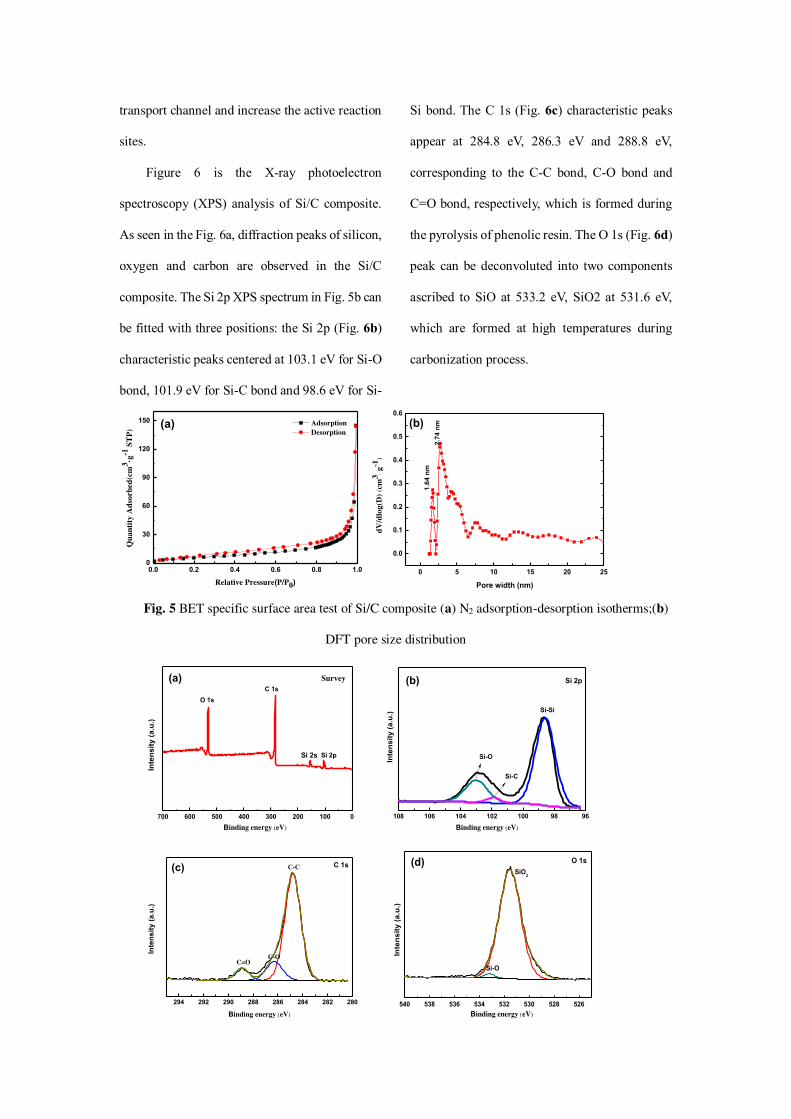
Fig. 4 transmission electron micrographs images of Si/C
Figure 4 is the microstructure and
morphology of Si/C and by transmission electron
microscopy (TEM). As show in the figure, Si
particle is uniformly coated by a carbon layer,
which is beneficial to the structural stability of the
material during the insertion/extraction of
lithium-ion. The carbon layer can also prevent the
formation of unstable SEI film due to silicon
particle fragmentation and exposure to electrolyte.
In addition, Si/C composite has good crystallinity
and the lattice stripe spacing of 0.28 nm can be
clearly observed and verified to be the
characteristic (111) crystal plane of Si.
Figure 5 is the N2 adsorption-desorption
isotherms of Si/C composite. The
adsorption/desorption curves (Fig. 5a) show that
the late hysteresis loop in the relative pressure
P/P0 of 0.8–1.0, indicating its macroporous
structure. Meanwhile, the corresponding pore size
distributions of the samples (Fig. 5b) were
analyzed by the Density Functional Theory (DFT)
method. It shows that the pores of the Si/C are
mainly centered at around 1-6 nm. The proper
specific surface area and pore size distribution are
helpful for the penetration and promotion of the
electrolyte, which can shorten the lithium-ion
transport channel and increase the active reaction
sites.
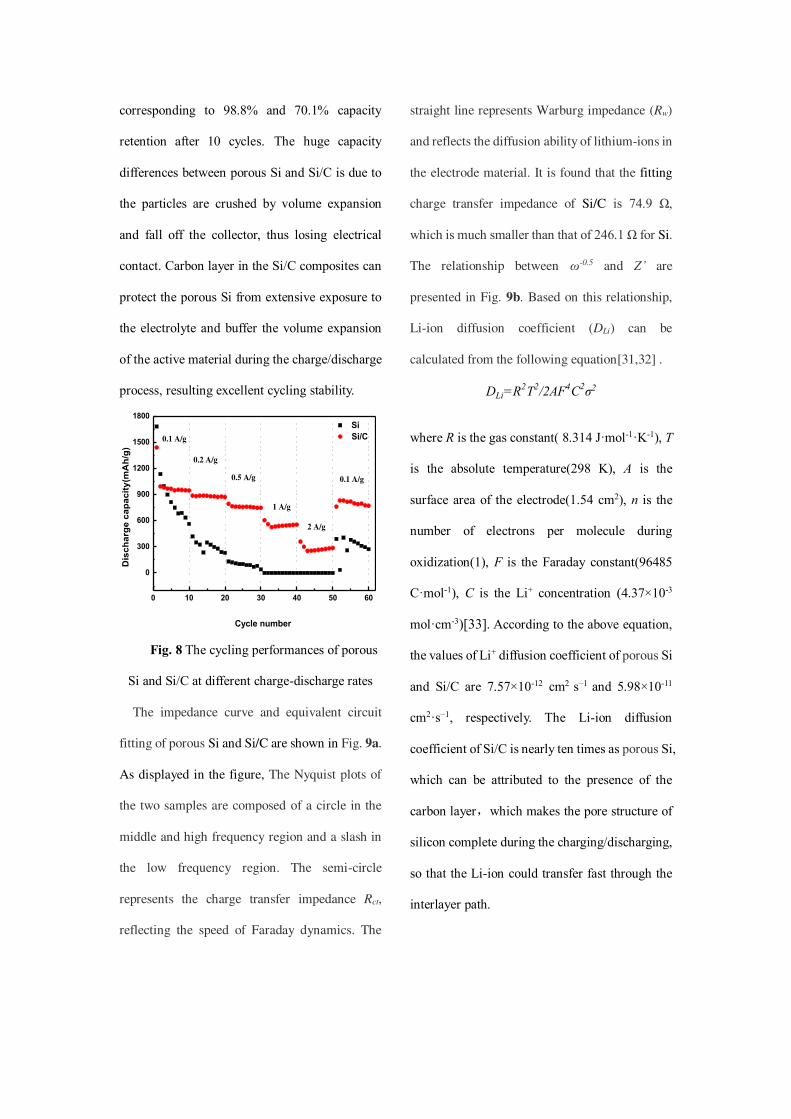
Figure 6 is the X-ray photoelectron
spectroscopy (XPS) analysis of Si/C composite.
As seen in the Fig. 6a, diffraction peaks of silicon,
oxygen and carbon are observed in the Si/C
composite. The Si 2p XPS spectrum in Fig. 5b can
be fitted with three positions: the Si 2p (Fig. 6b)
characteristic peaks centered at 103.1 eV for Si-O
bond, 101.9 eV for Si-C bond and 98.6 eV for Si-
Si bond. The C 1s (Fig. 6c) characteristic peaks
appear at 284.8 eV, 286.3 eV and 288.8 eV,
corresponding to the C-C bond, C-O bond and
C=O bond, respectively, which is formed during
the pyrolysis of phenolic resin. The O 1s (Fig. 6d)
peak can be deconvoluted into two components
ascribed to SiO at 533.2 eV, SiO2 at 531.6 eV,
which are formed at high temperatures during
carbonization process.
0.0 0.2 0.4 0.6 0.8 1.00
30
60
90
120
150 (a)
Relative Pressure(P/P0)
Adsorption
Desorption
Qu
an
tity
Ad
sorb
ed(c
m3
·g-1
ST
P)
0 5 10 15 20 25
0.0
0.1
0.2
0.3
0.4
0.5
0.6
Pore width (nm)
dV
/dlo
g(D
) (c
m3 g
-1)
2.7
4 n
m
1.6
4 n
m(b)
Fig. 5 BET specific surface area test of Si/C composite (a) N2 adsorption-desorption isotherms;(b)
DFT pore size distribution
700 600 500 400 300 200 100 0
(a)
Inte
ns
ity
(a
.u.)
Binding energy eV
Survey
Si 2pSi 2s
C 1s
O 1s
108 106 104 102 100 98 96
Inte
ns
ity
(a
.u.)
Binding energy eV
Si 2p
Si-O
(b)
Si-C
Si-Si
294 292 290 288 286 284 282 280
(c) C-C
C-O
Inte
ns
ity
(a
.u.)
Binding energy eV
C=O
C 1s
540 538 536 534 532 530 528 526
(d)
Inte
ns
ity
(a
.u.)
Binding energy eV
Si-O
SiO2
O 1s
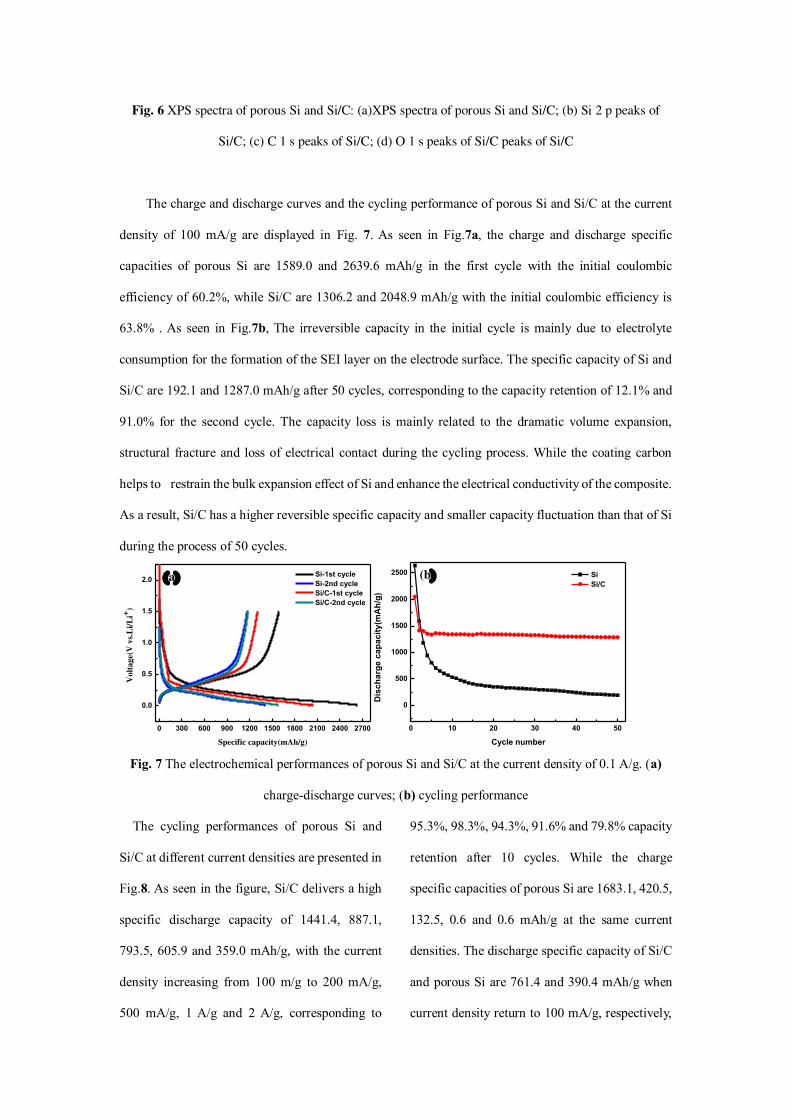
Fig. 6 XPS spectra of porous Si and Si/C: (a)XPS spectra of porous Si and Si/C; (b) Si 2 p peaks of
Si/C; (c) C 1 s peaks of Si/C; (d) O 1 s peaks of Si/C peaks of Si/C
The charge and discharge curves and the cycling performance of porous Si and Si/C at the current
density of 100 mA/g are displayed in Fig. 7. As seen in Fig.7a, the charge and discharge specific
capacities of porous Si are 1589.0 and 2639.6 mAh/g in the first cycle with the initial coulombic
efficiency of 60.2%, while Si/C are 1306.2 and 2048.9 mAh/g with the initial coulombic efficiency is
63.8% . As seen in Fig.7b, The irreversible capacity in the initial cycle is mainly due to electrolyte
consumption for the formation of the SEI layer on the electrode surface. The specific capacity of Si and
Si/C are 192.1 and 1287.0 mAh/g after 50 cycles, corresponding to the capacity retention of 12.1% and
91.0% for the second cycle. The capacity loss is mainly related to the dramatic volume expansion,
structural fracture and loss of electrical contact during the cycling process. While the coating carbon
helps to restrain the bulk expansion effect of Si and enhance the electrical conductivity of the composite.
As a result, Si/C has a higher reversible specific capacity and smaller capacity fluctuation than that of Si
during the process of 50 cycles.
0 300 600 900 1200 1500 1800 2100 2400 2700
0.0
0.5
1.0
1.5
2.0 a
Vo
lta
ge(
V v
s.L
i/L
i+)
Specific capacity(mAh/g)
Si-1st cycle
Si-2nd cycle
Si/C-1st cycle
Si/C-2nd cycle
0 10 20 30 40 50
0
500
1000
1500
2000
2500 (b
Dis
ch
arg
e c
ap
ac
ity
(mA
h/g
)
Cycle number
Si
Si/C
Fig. 7 The electrochemical performances of porous Si and Si/C at the current density of 0.1 A/g. (a)
charge-discharge curves; (b) cycling performance
The cycling performances of porous Si and
Si/C at different current densities are presented in
Fig.8. As seen in the figure, Si/C delivers a high
specific discharge capacity of 1441.4, 887.1,
793.5, 605.9 and 359.0 mAh/g, with the current
density increasing from 100 m/g to 200 mA/g,
500 mA/g, 1 A/g and 2 A/g, corresponding to
95.3%, 98.3%, 94.3%, 91.6% and 79.8% capacity
retention after 10 cycles. While the charge
specific capacities of porous Si are 1683.1, 420.5,
132.5, 0.6 and 0.6 mAh/g at the same current
densities. The discharge specific capacity of Si/C
and porous Si are 761.4 and 390.4 mAh/g when
current density return to 100 mA/g, respectively,
corresponding to 98.8% and 70.1% capacity
retention after 10 cycles. The huge capacity
differences between porous Si and Si/C is due to
the particles are crushed by volume expansion
and fall off the collector, thus losing electrical
contact. Carbon layer in the Si/C composites can
protect the porous Si from extensive exposure to
the electrolyte and buffer the volume expansion
of the active material during the charge/discharge
process, resulting excellent cycling stability.
0 10 20 30 40 50 60
0
300
600
900
1200
1500
1800
0.1 A/g
2 A/g
1 A/g
0.5 A/g
0.2 A/g
0.1 A/g
Cycle number
Dis
ch
arg
e c
ap
ac
ity
(mA
h/g
)
Si
Si/C
Fig. 8 The cycling performances of porous
Si and Si/C at different charge-discharge rates
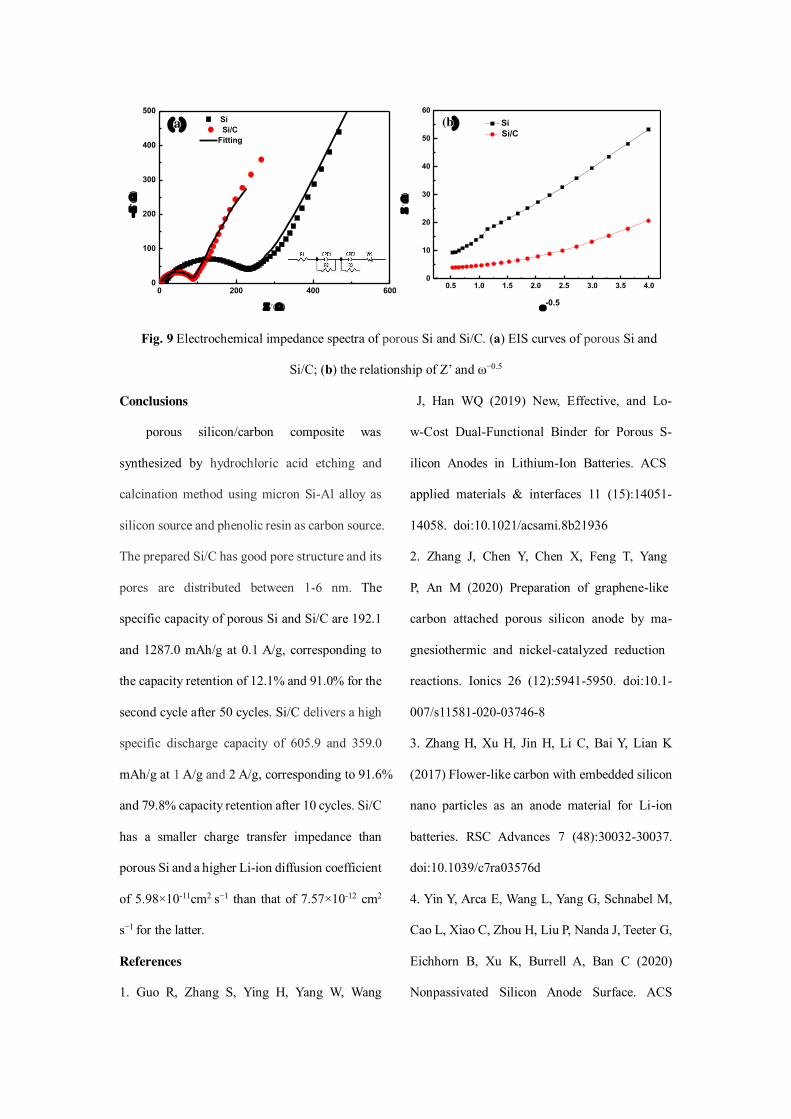
The impedance curve and equivalent circuit
fitting of porous Si and Si/C are shown in Fig. 9a.
As displayed in the figure, The Nyquist plots of
the two samples are composed of a circle in the
middle and high frequency region and a slash in
the low frequency region. The semi-circle
represents the charge transfer impedance Rct,
reflecting the speed of Faraday dynamics. The
straight line represents Warburg impedance (Rw)
and reflects the diffusion ability of lithium-ions in
the electrode material. It is found that the fitting
charge transfer impedance of Si/C is 74.9 Ω,
which is much smaller than that of 246.1 Ω for Si.
The relationship between ω-0.5 and Z’ are
presented in Fig. 9b. Based on this relationship,
Li-ion diffusion coefficient (DLi) can be
calculated from the following equation[31,32] .
DLi=R2T2/2AF4C2σ2
where R is the gas constant( 8.314 J·mol-1·K-1), T
is the absolute temperature(298 K), A is the
surface area of the electrode(1.54 cm2), n is the
number of electrons per molecule during
oxidization(1), F is the Faraday constant(96485
C·mol-1), C is the Li+ concentration (4.37×10⁻³
mol·cm-3)[33]. According to the above equation,
the values of Li+ diffusion coefficient of porous Si
and Si/C are 7.57×10⁻¹² cm2 s−1 and 5.98×10⁻¹¹
cm2·s−1, respectively. The Li-ion diffusion
coefficient of Si/C is nearly ten times as porous Si,
which can be attributed to the presence of the
carbon layer,which makes the pore structure of
silicon complete during the charging/discharging,
so that the Li-ion could transfer fast through the
interlayer path.
0 200 400 6000
100
200
300
400
500
)
)
Si
Si/C
Fitting
a
0.5 1.0 1.5 2.0 2.5 3.0 3.5 4.00
10
20
30
40
50
60
)
Si
Si/C
-0.5
(b
Fig. 9 Electrochemical impedance spectra of porous Si and Si/C. (a) EIS curves of porous Si and
Si/C; (b) the relationship of Z’ and ω−0.5
Conclusions
porous silicon/carbon composite was
synthesized by hydrochloric acid etching and
calcination method using micron Si-Al alloy as
silicon source and phenolic resin as carbon source.
The prepared Si/C has good pore structure and its
pores are distributed between 1-6 nm. The
specific capacity of porous Si and Si/C are 192.1
and 1287.0 mAh/g at 0.1 A/g, corresponding to
the capacity retention of 12.1% and 91.0% for the
second cycle after 50 cycles. Si/C delivers a high
specific discharge capacity of 605.9 and 359.0
mAh/g at 1 A/g and 2 A/g, corresponding to 91.6%
and 79.8% capacity retention after 10 cycles. Si/C
has a smaller charge transfer impedance than
porous Si and a higher Li-ion diffusion coefficient
of 5.98×10⁻¹¹cm2 s−1 than that of 7.57×10⁻¹² cm2
s−1 for the latter.
References
1. Guo R, Zhang S, Ying H, Yang W, Wang
J, Han WQ (2019) New, Effective, and Lo-
w-Cost Dual-Functional Binder for Porous S-
ilicon Anodes in Lithium-Ion Batteries. ACS
applied materials & interfaces 11 (15):14051-
14058. doi:10.1021/acsami.8b21936
2. Zhang J, Chen Y, Chen X, Feng T, Yang
P, An M (2020) Preparation of graphene-like
carbon attached porous silicon anode by ma-
gnesiothermic and nickel-catalyzed reduction
reactions. Ionics 26 (12):5941-5950. doi:10.1-
007/s11581-020-03746-8
3. Zhang H, Xu H, Jin H, Li C, Bai Y, Lian K
(2017) Flower-like carbon with embedded silicon
nano particles as an anode material for Li-ion
batteries. RSC Advances 7 (48):30032-30037.
doi:10.1039/c7ra03576d
4. Yin Y, Arca E, Wang L, Yang G, Schnabel M,
Cao L, Xiao C, Zhou H, Liu P, Nanda J, Teeter G,
Eichhorn B, Xu K, Burrell A, Ban C (2020)
Nonpassivated Silicon Anode Surface. ACS
applied materials & interfaces 12 (23):26593-
26600. doi:10.1021/acsami.0c03799
5. Guan P, Li J, Lu T, Guan T, Ma Z, Peng Z, Zhu
X, Zhang L (2018) Facile and Scalable Approach
To Fabricate Granadilla-like Porous-Structured
Silicon-Based Anode for Lithium Ion Batteries.
ACS applied materials & interfaces 10
(40):34283-34290. doi:10.1021/acsami.8b12071
6. Wang CM, Li X, Wang Z, Xu W, Liu J,
Gao F, Kovarik L, Zhang JG, Howe J, Burt-
on DJ, Liu Z, Xiao X, Thevuthasan S, Baer
DR (2012) In situ TEM investigation of co-
ngruent phase transition and structural evolut-
ion of nanostructured silicon/carbon anode f-
or lithium ion batteries. Nano Lett 12 (3):1-6
24-1632. doi:10.1021/nl204559u
7. Tesfaye AT, Gonzalez R, Coffer JL, Djenizian
T (2015) Porous Silicon Nanotube Arrays as
Anode Material for Li-Ion Batteries. ACS applied
materials & interfaces 7 (37):20495-20498.
doi:10.1021/acsami.5b05705
8. Wang J, Wang C, Zhu Y, Wu N, Tian W (2014)
Electrochemical stability of optimized Si/C
composites anode for lithium-ion batteries. Ionics
21 (2):579-585. doi:10.1007/s11581-014-1331-9
9. Ge M, Lu Y, Ercius P, Rong J, Fang X,
Mecklenburg M, Zhou C (2014) Large-scale
fabrication, 3D tomography, and lithium-ion
battery application of porous silicon. Nano letters
14 (1):261-268. doi:10.1021/nl403923s
10. Guo S, Hu X, Hou Y, Wen Z (2017) Tunable
Synthesis of Yolk-Shell Porous Silicon@Carbon
for Optimizing Si/C-Based Anode of Lithium-Ion
Batteries. ACS Appl Mater Interfaces 9
(48):42084-42092. doi:10.1021/acsami.7b13035
11. Li S, Qin X, Zhang H, Wu J, He Y-B, Li B,
Kang F (2014) Silicon/carbon composite
microspheres with hierarchical core–shell
structure as anode for lithium ion batteries.
Electrochemistry Communications 49:98-102.
doi:10.1016/j.elecom.2014.10.013
12. Xi F, Zhang Z, Wan X, Li S, Ma W, C
-hen X, Chen R, Luo B, Wang L (2020) Hi-
gh-Performance Porous Silicon/Nanosilver A-
nodes from Industrial Low-Grade Silicon for
Lithium-Ion Batteries. ACS applied materials
& interfaces 12 (43):49080-49089. doi:10.10-
21/acsami.0c14157
13. Liu X, Wang Z, Guo H, Li X, Zhou R,
Zhou Y (2017) Chitosan: A N-doped carbon
source of silicon-based anode material for li-
thium ion batteries. Ionics 23 (9):2311-2318.
doi:10.1007/s11581-017-2073-2
14. Shen K, Chen H, Hou X, Wang S, Qin
H, Gao Y, Shen J (2020) Mechanistic insigh-
t into the role of N-doped carbon matrix in
electrospun binder-free Si@C composite ano-
de for lithium-ion batteries. Ionics 26 (7):32-
97-3305. doi:10.1007/s11581-020-03484-x
15. Zhang H, Xu H, Lou X, Jin H, Zong P, Li S,
Bai Y, Ma F (2019) Micro-structured
Si@Cu3Si@C ternary composite anodes for
high-performance Li-ion batteries. Ionics 25
(10):4667-4673. doi:10.1007/s11581-019-03043-
z
16. Zhang X, Zhou L, Huang M, Yang C, Xu Y,
Huang J (2018) Synthesis of porous Si/C by
pyrolyzing toluene as anode in lithium-ion
batteries with excellent lithium storage
performance. Ionics 25 (5):2093-2102.
doi:10.1007/s11581-018-2601-8
17. Zhou R, Fan R, Tian Z, Zhou Y, Guo
H, Kou L, Zhang D (2016) Preparation and
characterization of core–shell structure Si/C
composite with multiple carbon phases as an
ode materials for lithium ion batteries. Journ-
al of Alloys and Compounds 658:91-97. doi:
10.1016/j.jallcom.2015.10.217
18. Xu R, Zhang K, Wei R, Yuan M, Zhang
Y, Liang F, Yao Y (2019) High-capacity fl-
our-based nano-Si/C composite anode materi-
als for lithium-ion batteries. Ionics 26 (1):1-
11. doi:10.1007/s11581-019-03224-w
19. Xu Q, Li J-Y, Sun J-K, Yin Y-X, Wan L-J, Guo
Y-G (2017) Watermelon-Inspired Si/C
Microspheres with Hierarchical Buffer Structures
for Densely Compacted Lithium-Ion Battery
Anodes. Advanced Energy Materials 7
(3):1601481. doi:10.1002/aenm.201601481
20. Deng Y, Kang T, Ma Z, Tan X, Song X, Wang
Z, Pang P, Shu D, Zuo X, Nan J (2019) Safety
influences of the Al and Ti elements modified
LiCoO2 materials on LiCoO2/graphite batteries
under the abusive conditions. Electrochimica
Acta 295:703-709
21. Wang J, Zhang L, Zhang H (2018) Effe-
cts of electrolyte additive on the electroche-
mical performance of Si/C anode for lithium-
ion batteries. Ionics 24 (11):3691-3698. doi:
10.1007/s11581-018-2682-4
22. Ge M, Rong J, Fang X, Zhou C (2012) Porous
doped silicon nanowires for lithium ion battery
anode with long cycle life. Nano letters 12
(5):2318-2323. doi:10.1021/nl300206e
23. Yan L, Yong W, Zou Y, Zheng J, Wu M (2010)
Macroporous Co 3O 4 platelets with excellent
rate capability as anodes for lithium ion batteries.
Electrochemistry Communications 12 (1):101105
24. Tang J, Dysart AD, Kim DH, Saraswat
R, Shaver GM, Pol VG (2017) Fabrication
of Carbon/Silicon Composite as Lithium-ion
Anode with Enhanced Cycling Stability. Ele-
ctrochimica Acta 247:626-633. doi:10.1016/j.
electacta.2017.06.178
25. Su M, Wang Z, Guo H, Li X, Huang S,
Gan L (2013) Silicon, flake graphite and p-
henolic resin-pyrolyzed carbon based Si/C c-
omposites as anode material for lithium-ion
batteries. Advanced Powder Technology 24
(6):921-925. doi:10.1016/j.apt.2013.01.002
26. Luo J, Ma B, Peng J, Wu Z, Luo Z, Wang X
(2019) Modified Chestnut-Like Structure Silicon
Carbon Composite as Anode Material for
Lithium-Ion Batteries. ACS Sustainable
Chemistry & Engineering 7 (12):10415-10424.
doi:10.1021/acssuschemeng.9b00616
27. Liang J, Zhang Z, Yang W, Liu Y, Zhang X,
Javid M, Jung Y, Dong X (2020) Three-
dimensional porous carbon skeleton supporting Si
nanosheets as anode for high-performance
lithium ion batteries. Ionics 26 (5):2233-2245.
doi:10.1007/s11581-019-03409-3
28. Kwon HJ, Hwang JY, Shin HJ, Jeong M
G, Chung KY, Sun YK, Jung HG (2020) N-
ano/Microstructured Silicon-Carbon Hybrid
Composite Particles Fabricated with Corn St-
arch Biowaste as Anode Materials for Li-Ion
Batteries. Nano letters 20 (1):625-635. doi:10.
1021/acs.nanolett.9b04395
29. Jaumann T, Herklotz M, Klose M, Pinkert K,
Oswald S, Eckert J, Giebeler L (2014) Tailoring
Hollow Silicon–Carbon Nanocomposites As
High-Performance Anodes in Secondary
Lithium-Based Batteries through Economical
Chemistry. Chemistry of Materials 27 (1):37-43.
doi:10.1021/cm502520y
30. Huang X, Cen D, Wei R, Fan H, Bao Z (2019)
Synthesis of Porous Si/C Composite Nanosheets
from Vermiculite with a Hierarchical Structure as
a High-Performance Anode for Lithium-Ion
Battery. ACS applied materials & interfaces 11
(30):26854-26862. doi:10.1021/acsami.9b06976
31. Wang H-g, Yuan C, Zhou R, Duan Q, L
i Y (2017) Self-sacrifice template formation
of nitrogen-doped porous carbon microtubes
towards high performance anode materials in
lithium ion batteries. Chemical Engineering
Journal 316:1004-1010. doi:10.1016/j.cej.2017.
02.059
32. Zhang SS, Xu K, Jow TR (2006) EIS study on
the formation of solid electrolyte interface in Li-
ion battery. Electrochimica Acta 51 (8-9):1636-
1640. doi:10.1016/j.electacta.2005.02.137
33. Shi Q, Wu X, Chen S, Wu X, Liu J, Long R
(2020) Carbon-nitrogen quantum dots
modification of Li4Ti5O12 anode material for
lithium-ion batteries. Ionics 26 (7):3325-3331.
doi:10.1007/s11581-020-03516-6
Figures
Figure 1
TG curves of the as-prepared Si/C composite
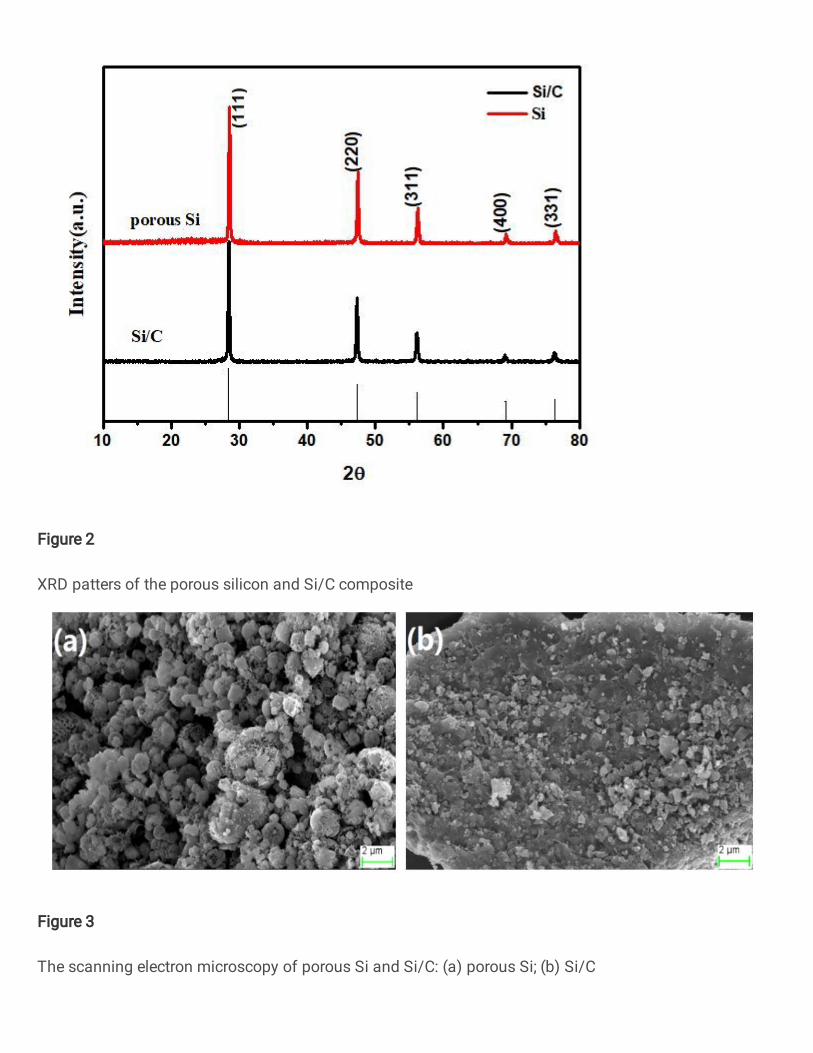
Figure 2
XRD patters of the porous silicon and Si/C composite
Figure 3
The scanning electron microscopy of porous Si and Si/C: (a) porous Si; (b) Si/C
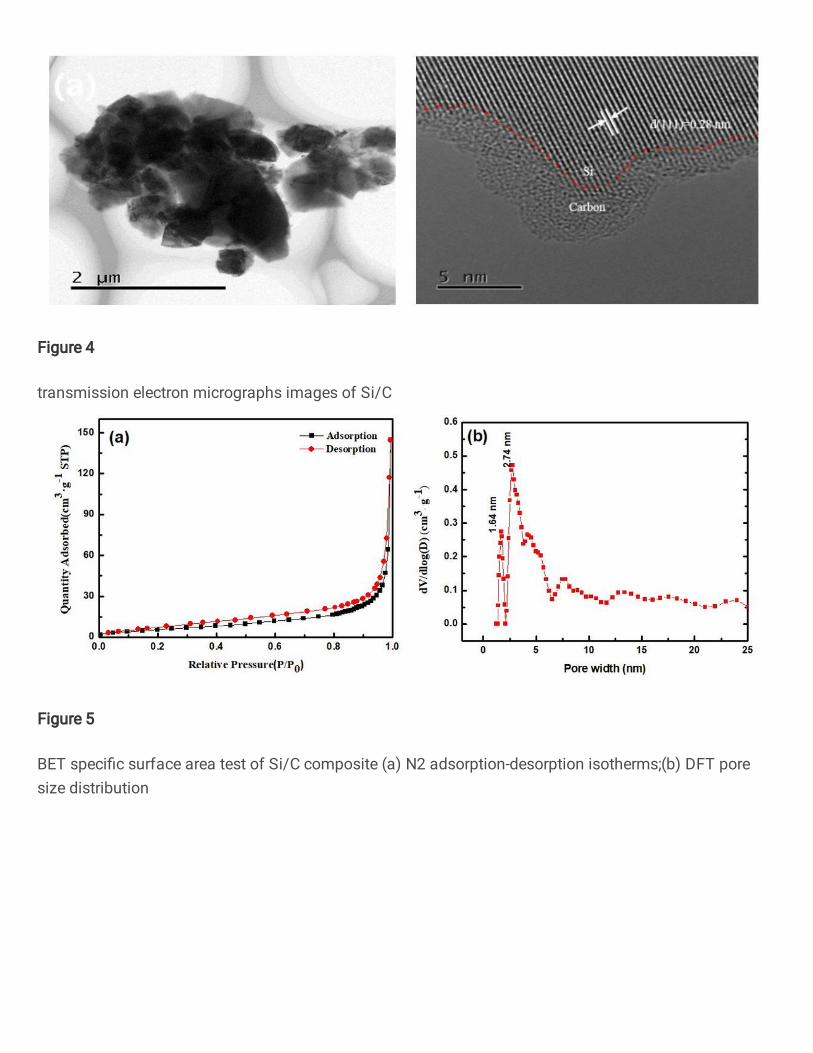
Figure 4
transmission electron micrographs images of Si/C
Figure 5
BET speci�c surface area test of Si/C composite (a) N2 adsorption-desorption isotherms;(b) DFT poresize distribution
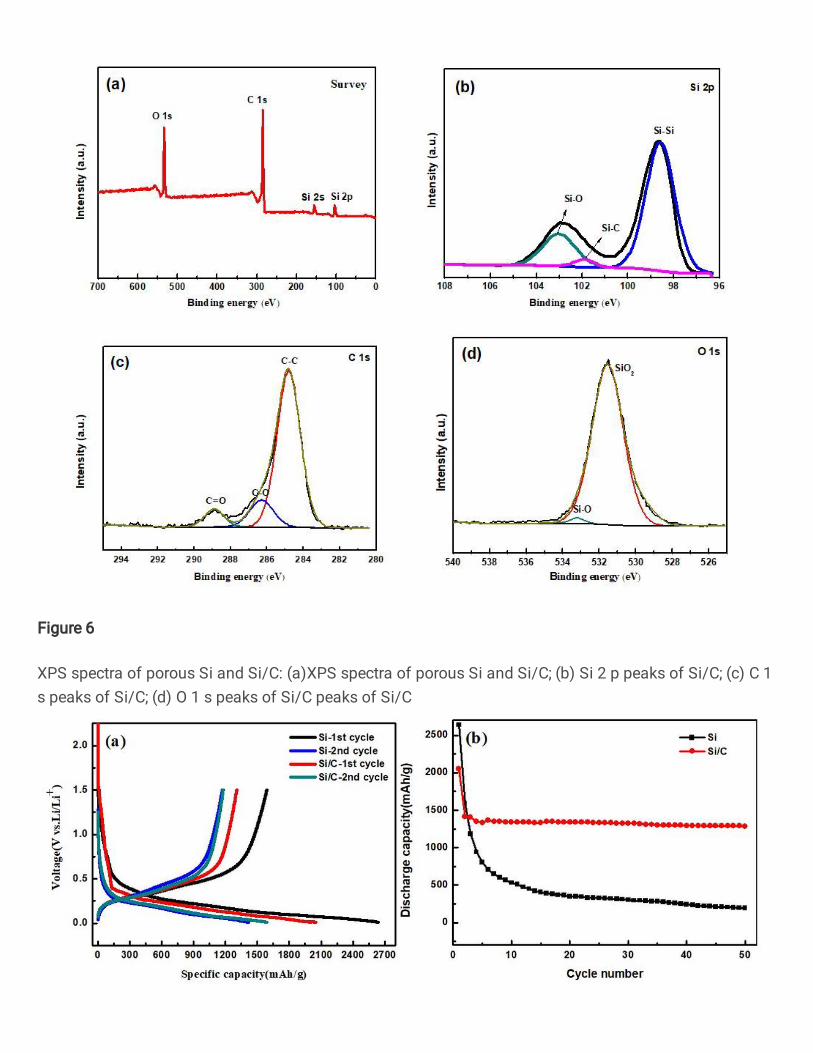
Figure 6
XPS spectra of porous Si and Si/C: (a)XPS spectra of porous Si and Si/C; (b) Si 2 p peaks of Si/C; (c) C 1s peaks of Si/C; (d) O 1 s peaks of Si/C peaks of Si/C
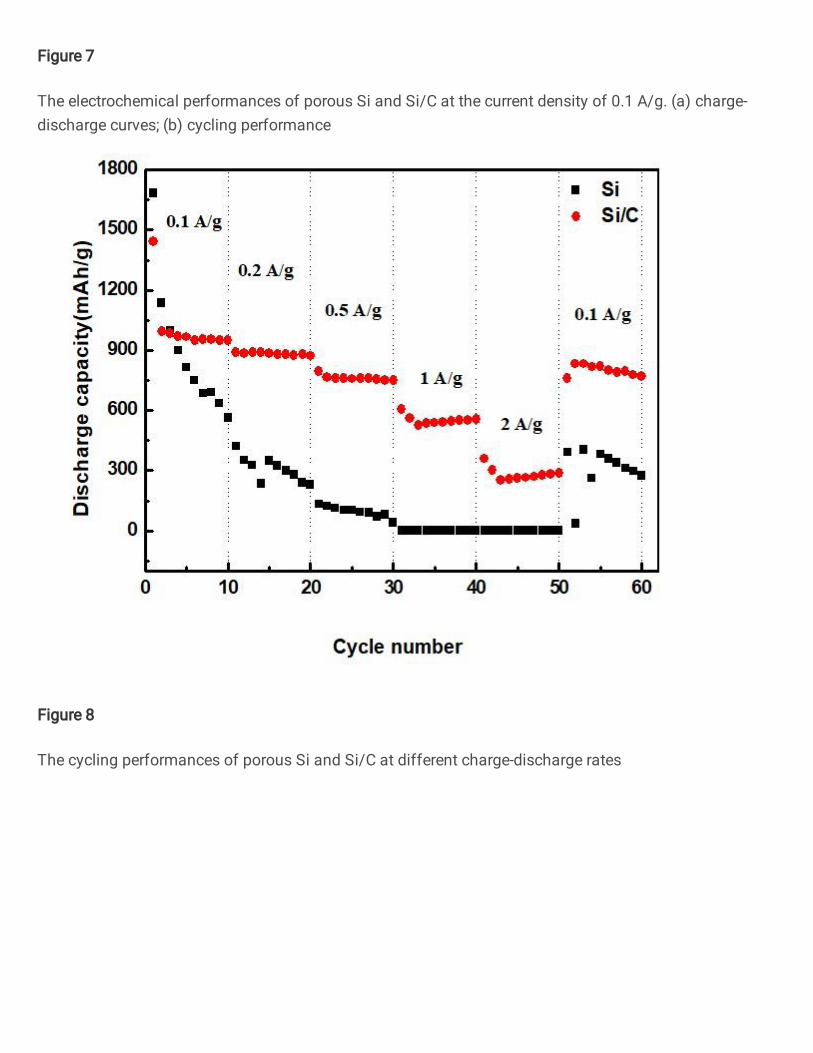
Figure 7
The electrochemical performances of porous Si and Si/C at the current density of 0.1 A/g. (a) charge-discharge curves; (b) cycling performance
Figure 8
The cycling performances of porous Si and Si/C at different charge-discharge rates
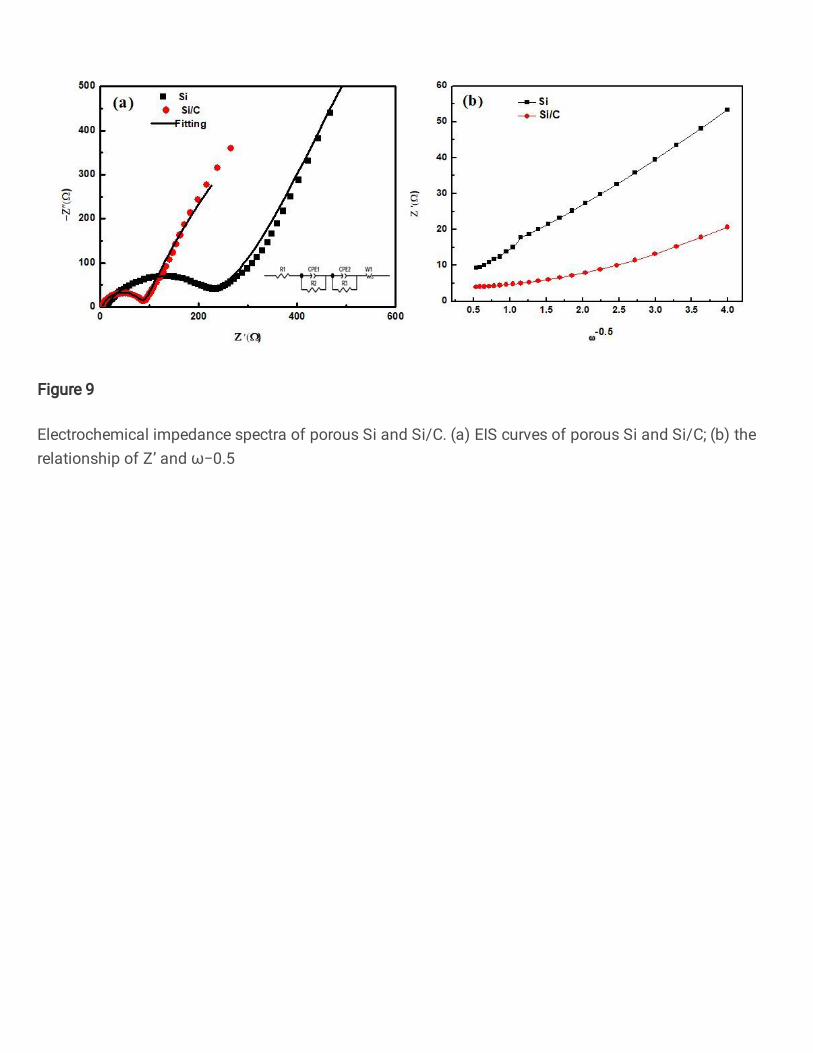
Figure 9
Electrochemical impedance spectra of porous Si and Si/C. (a) EIS curves of porous Si and Si/C; (b) therelationship of Z’ and ω−0.5