phenolic compounds measurement in red wines using the ... · phenolic compounds measurement in red...
TRANSCRIPT
Benefits• Increased throughput compared
to traditional cuvette-based methods
• Automated data analysis with SoftMax Pro Software
• PathCheck Sensor for normalized absorbance readings in microplate wells
Phenolic compounds measurement in red wines using the SpectraMax Plus 384 Microplate Reader
IntroductionMeasurement of tannin, iron-reactive phenolics, anthocyanin and polymeric pigment in red wine is an important part of quality control in the wine industry. Precise and reliable measurement of phenolic compounds in wine is critical for making decisions during fermentation, maceration, pressing and blending. Harbertsonet al. developed a comprehensive red wine phenolics assay in 2003.1 Traditionally this assay is performed using a cuvette-based UV-vis spectrophotometer. It is a time-consuming and laborious process of reading individual samples in separate cuvettes, recording the results, and analyzing the data. Identifying the need for a rapid and cost-effective way of performing the assay, Heredia et al. adapted the assay for a microplate platform. This approach increases the throughput with respect to labor, time andsample volume. The assay widens the capacity to monitor the fermentations for extraction of phenolic compounds in an average-sized winery. Here we describe the use of Molecular Devices SpectraMax® Plus 384 Microplate Reader and SoftMax® Pro Software to efficiently collect and analyze the data for this assay.
Some of the unique features of the SpectraMax Plus 384 Microplate Reader are:
• Wavelength Range: 190–1000 nm in 1-nm increments
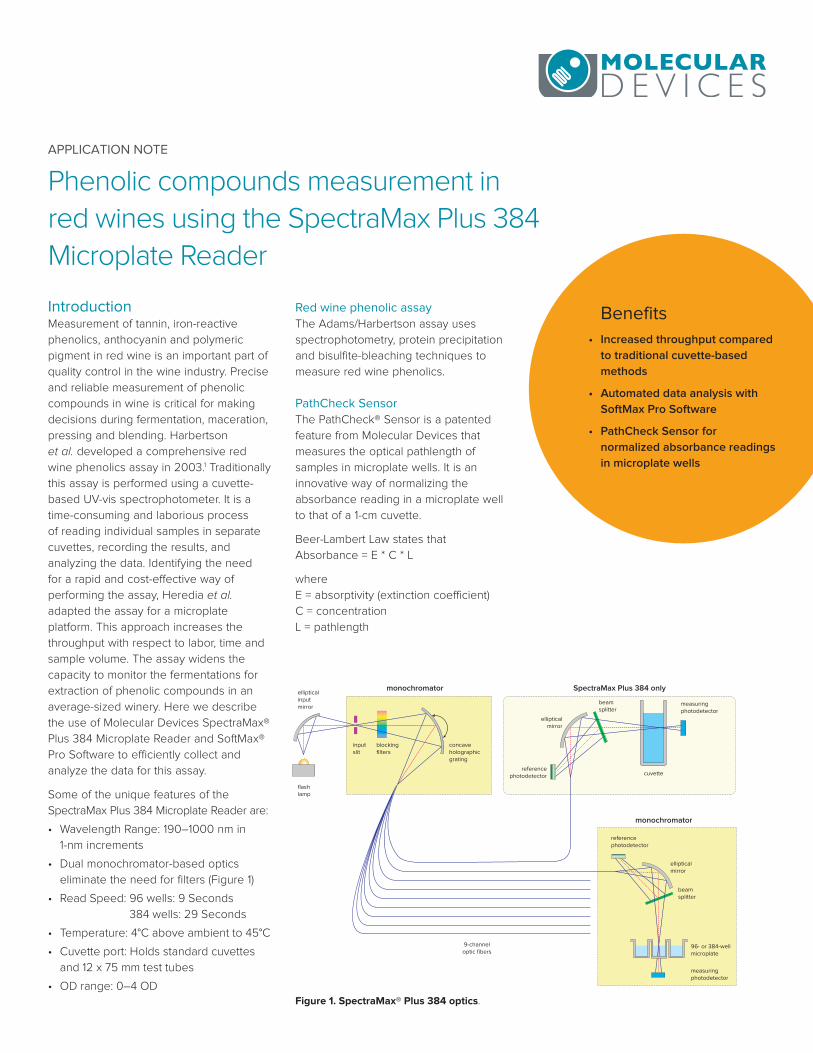
• Dual monochromator-based optics eliminate the need for filters (Figure 1)
• Read Speed: 96 wells: 9 Seconds 384 wells: 29 Seconds
• Temperature: 4°C above ambient to 45°C
• Cuvette port: Holds standard cuvettes and 12 x 75 mm test tubes
• OD range: 0–4 OD
APPLICATION NOTE
Red wine phenolic assayThe Adams/Harbertson assay usesspectrophotometry, protein precipitation and bisulfite-bleaching techniques to measure red wine phenolics.
PathCheck SensorThe PathCheck® Sensor is a patented feature from Molecular Devices that measures the optical pathlength of samples in microplate wells. It is an innovative way of normalizing the absorbance reading in a microplate well to that of a 1-cm cuvette.
Beer-Lambert Law states thatAbsorbance = E * C * L
where E = absorptivity (extinction coefficient) C = concentration L = pathlength
monochromator
monochromator
SpectraMax Plus 384 onlyellipticalinputmirror
flashlamp
blockingfilters
measuringphotodetector
beamsplitter
96- or 384-wellmicroplate
ellipticalmirror
concaveholographicgrating
inputslit
referencephotodetector
9-channeloptic fibers
measuringphotodetector
beamsplitter
cuvette
ellipticalmirror
referencephotodetector
Figure 1. SpectraMax® Plus 384 optics.
In the case of a cuvette, the optical path ishorizontal. Hence the pathlength is fixed and is equal to 1 cm. But in the case of a microplate, the optical path is vertical. So, the pathlength depends on the volume of the sample (Figure 2). The PathCheck Sensor corrects for the discrepancy.
SoftMax Pro SoftwareThe software controls the instrument, collects the data, and provides complete data analysis. Customized protocols with appropriate instrument settings and calculations can be pre-written and saved. The end user can conveniently open a preconfigured protocol and obtain complete results and analysis with no protocol setup time.
Materials• Wine samples: Pinot noir (Sonoma Coast)
• Maleic acid (Fisher Scientific cat. #03417-500)
• Bovine serum albumin (Sigma cat. #A3803-10G)
• Triethanolamine (Sigma cat.#T1377-100 mL)
• Ferric chloride hexahydrate (Sigma cat.#236489-100G)
• (+)-Catechin (Sigma cat. #C1251-5G)
• Acetic acid (Sigma cat. #242853-2.5KG)
• Sodium chloride (Fisher Scientific cat. #S271-3)
• Sodium hydroxide (Fisher Scientific cat. #S318-500)
• Ethanol (Acros cat. #61509-0040)
• Potassium bitartrate (Sigma cat. #243531- 500G)
Instruments and accessories
• SpectraMax Plus 384 Microplate Reader (Molecular Devices cat. #PLUS 384)
• UV transparent 96-well microplates (Costar cat. #3635)
• Transferpette micropipette (Drummond Scientific cat. #2704174, 2705402, 2705412, 2704180; Drummond Digital Microdispenser cat. #3-000-510)
• Microtips for the micropipettes (Eppendorf cat. #epT.I.P.S.; Reloads cat. #022491539, 022491512, 022491547)
• Centrifuge for microfuge tubes (Eppendorf cat. #5424)
• Microfuge tubes 1.5 mL capacity (Eppendorf cat. #022364111, 022363557, 022363514, 2236357-3)
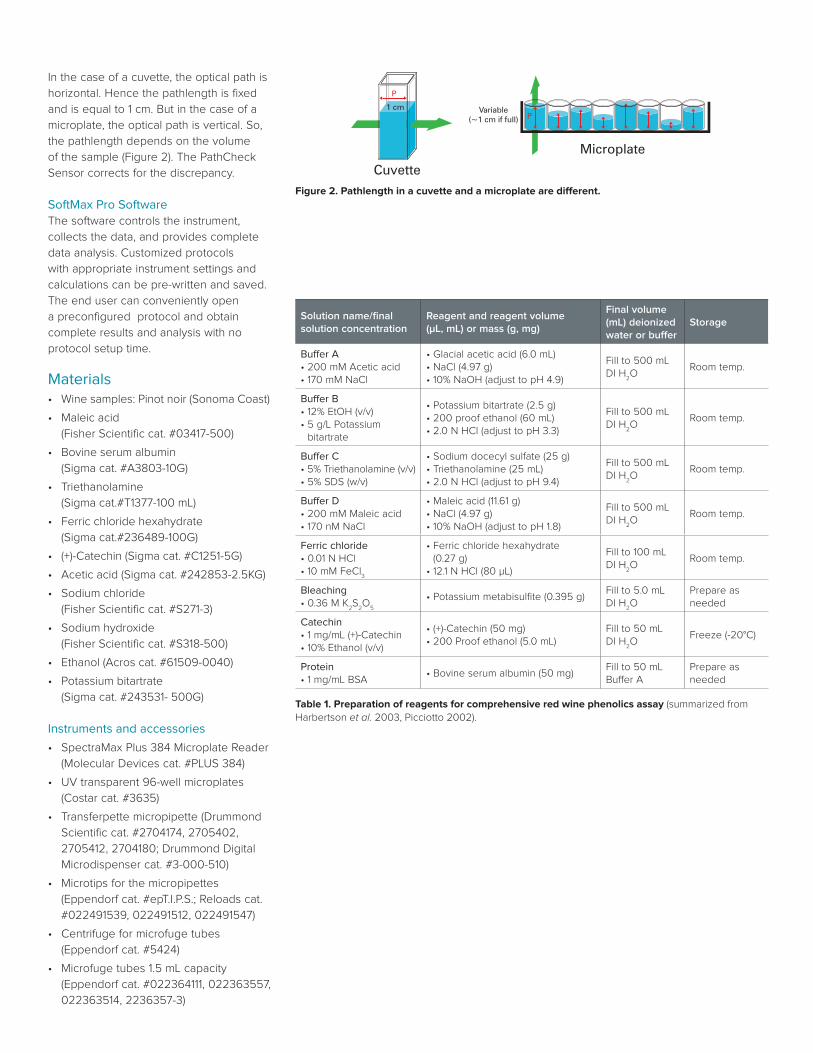
Solution name/final solution concentration
Reagent and reagent volume (µL, mL) or mass (g, mg)
Final volume (mL) deionized water or buffer
Storage
Buffer A• 200 mM Acetic acid• 170 mM NaCl
• Glacial acetic acid (6.0 mL)• NaCl (4.97 g)• 10% NaOH (adjust to pH 4.9)
Fill to 500 mL DI H
2O
Room temp.
Buffer B• 12% EtOH (v/v) • 5 g/L Potassium
bitartrate
• Potassium bitartrate (2.5 g)• 200 proof ethanol (60 mL)• 2.0 N HCl (adjust to pH 3.3)
Fill to 500 mL DI H
2O
Room temp.
Buffer C• 5% Triethanolamine (v/v)• 5% SDS (w/v)
• Sodium docecyl sulfate (25 g)• Triethanolamine (25 mL)• 2.0 N HCl (adjust to pH 9.4)
Fill to 500 mL DI H
2O
Room temp.
Buffer D• 200 mM Maleic acid• 170 nM NaCl
• Maleic acid (11.61 g)• NaCl (4.97 g)• 10% NaOH (adjust to pH 1.8)
Fill to 500 mL DI H
2O
Room temp.
Ferric chloride• 0.01 N HCl• 10 mM FeCl
3
• Ferric chloride hexahydrate (0.27 g)
• 12.1 N HCl (80 µL)
Fill to 100 mL DI H
2O
Room temp.
Bleaching• 0.36 M K
2S
2O
5
• Potassium metabisulfite (0.395 g)Fill to 5.0 mL DI H
2O
Prepare as needed
Catechin• 1 mg/mL (+)-Catechin• 10% Ethanol (v/v)
• (+)-Catechin (50 mg)• 200 Proof ethanol (5.0 mL)
Fill to 50 mL DI H
2O
Freeze (-20°C)
Protein• 1 mg/mL BSA
• Bovine serum albumin (50 mg)Fill to 50 mL Buffer A
Prepare as needed
Figure 2. Pathlength in a cuvette and a microplate are different.
Microplate
Variable(~1 cm if full)
1 cm
Cuvette
P
P
Table 1. Preparation of reagents for comprehensive red wine phenolics assay (summarized from Harbertson et al. 2003, Picciotto 2002).
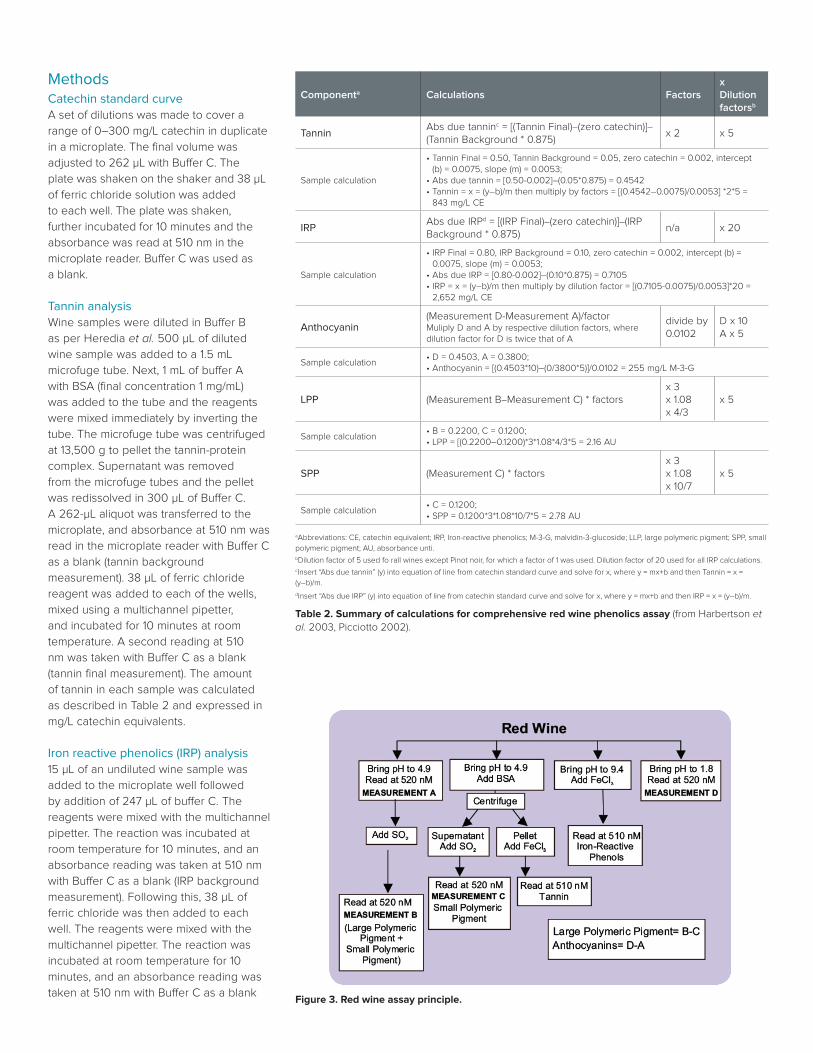
MethodsCatechin standard curveA set of dilutions was made to cover a range of 0–300 mg/L catechin in duplicate in a microplate. The final volume was adjusted to 262 µL with Buffer C. The plate was shaken on the shaker and 38 µL of ferric chloride solution was added to each well. The plate was shaken, further incubated for 10 minutes and the absorbance was read at 510 nm in themicroplate reader. Buffer C was used as a blank.
Tannin analysisWine samples were diluted in Buffer B as per Heredia et al. 500 µL of diluted wine sample was added to a 1.5 mL microfuge tube. Next, 1 mL of buffer A with BSA (final concentration 1 mg/mL) was added to the tube and the reagents were mixed immediately by inverting the tube. The microfuge tube was centrifuged at 13,500 g to pellet the tannin-protein complex. Supernatant was removed from the microfuge tubes and the pellet was redissolved in 300 µL of Buffer C. A 262-µL aliquot was transferred to the microplate, and absorbance at 510 nm was read in the microplate reader with Buffer Cas a blank (tannin background measurement). 38 µL of ferric chloride reagent was added to each of the wells, mixed using a multichannel pipetter, and incubated for 10 minutes at room temperature. A second reading at 510 nm was taken with Buffer C as a blank (tannin final measurement). The amount of tannin in each sample was calculated as described in Table 2 and expressed in mg/L catechin equivalents.
Iron reactive phenolics (IRP) analysis15 µL of an undiluted wine sample was added to the microplate well followed by addition of 247 µL of buffer C. The reagents were mixed with the multichannel pipetter. The reaction was incubated at room temperature for 10 minutes, and an absorbance reading was taken at 510 nm with Buffer C as a blank (IRP background measurement). Following this, 38 µL of ferric chloride was then added to each well. The reagents were mixed with the multichannel pipetter. The reaction was incubated at room temperature for 10 minutes, and an absorbance reading was taken at 510 nm with Buffer C as a blank
Componenta Calculations Factorsx Dilution factorsb
TanninAbs due tanninc = [(Tannin Final)–(zero catechin)]–(Tannin Background * 0.875)
x 2 x 5
Sample calculation
• Tannin Final = 0.50, Tannin Background = 0.05, zero catechin = 0.002, intercept (b) = 0.0075, slope (m) = 0.0053;
• Abs due tannin = [0.50-0.002]–(0.05*0.875) = 0.4542• Tannin = x = (y–b)/m then multiply by factors = [(0.4542–0.0075)/0.0053] *2*5 =
843 mg/L CE
IRPAbs due IRPd = [(IRP Final)–(zero catechin)]–(IRP Background * 0.875)
n/a x 20
Sample calculation
• IRP Final = 0.80, IRP Background = 0.10, zero catechin = 0.002, intercept (b) = 0.0075, slope (m) = 0.0053;
• Abs due IRP = [0.80-0.002]–(0.10*0.875) = 0.7105• IRP = x = (y–b)/m then multiply by dilution factor = [(0.7105-0.0075)/0.0053]*20 =
2,652 mg/L CE
Anthocyanin(Measurement D-Measurement A)/factorMuliply D and A by respective dilution factors, where dilution factor for D is twice that of A
divide by 0.0102
D x 10 A x 5
Sample calculation• D = 0.4503, A = 0.3800;• Anthocyanin = [(0.4503*10)–(0/3800*5)]/0.0102 = 255 mg/L M-3-G
LPP (Measurement B–Measurement C) * factorsx 3x 1.08x 4/3
x 5
Sample calculation• B = 0.2200, C = 0.1200;• LPP = [(0.2200–0.1200)*3*1.08*4/3*5 = 2.16 AU
SPP (Measurement C) * factorsx 3x 1.08x 10/7
x 5
Sample calculation• C = 0.1200;• SPP = 0.1200*3*1.08*10/7*5 = 2.78 AU
aAbbreviations: CE, catechin equivalent; IRP, Iron-reactive phenolics; M-3-G, malvidin-3-glucoside; LLP, large polymeric pigment; SPP, small polymeric pigment; AU, absorbance unti.bDilution factor of 5 used fo rall wines except Pinot noir, for which a factor of 1 was used. Dilution factor of 20 used for all IRP calculations.cInsert “Abs due tannin” (y) into equation of line from catechin standard curve and solve for x, where y = mx+b and then Tannin = x = (y–b)/m.dInsert “Abs due IRP” (y) into equation of line from catechin standard curve and solve for x, where y = mx+b and then IRP = x = (y–b)/m.
Table 2. Summary of calculations for comprehensive red wine phenolics assay (from Harbertson et al. 2003, Picciotto 2002).
Figure 3. Red wine assay principle.
(IRP final measurement). The amount of IRP in each sample was calculated as described in Table 2 and expressedin mg/L catechin equivalents.
Anthocyanin analysisWine samples were diluted in Buffer B as per Heredia et al. 500 µL of a diluted wine sample was added to a 1.5 mL microfuge tube. Next, 1 mL of buffer A was added to the tube and the reagents were mixed immediately by inverting the tube. A 300 µL aliquot was transferred to the microplate well in duplicate and incubated for 10 minutes at room temperature. Measurement A was obtained at 520 nm with Buffer A as blank.
A volume of 50 µL of a diluted wine sample was added per well, followed by the addition of 50 µL of Buffer B. To this reaction mixture, 200 µL of Buffer D was added and mixed with multichannel pipetter. The reaction was incubated for 10 minutes at room temperature, followed by measurement of absorbance at 520 nm (measurement D). The amount of anthocyanin in each wine sample was calculated as described in Table 2 and expressed as mg/L malvidin-3-glucoside (M-3-G) units (Picciotto, E.A., et al.).
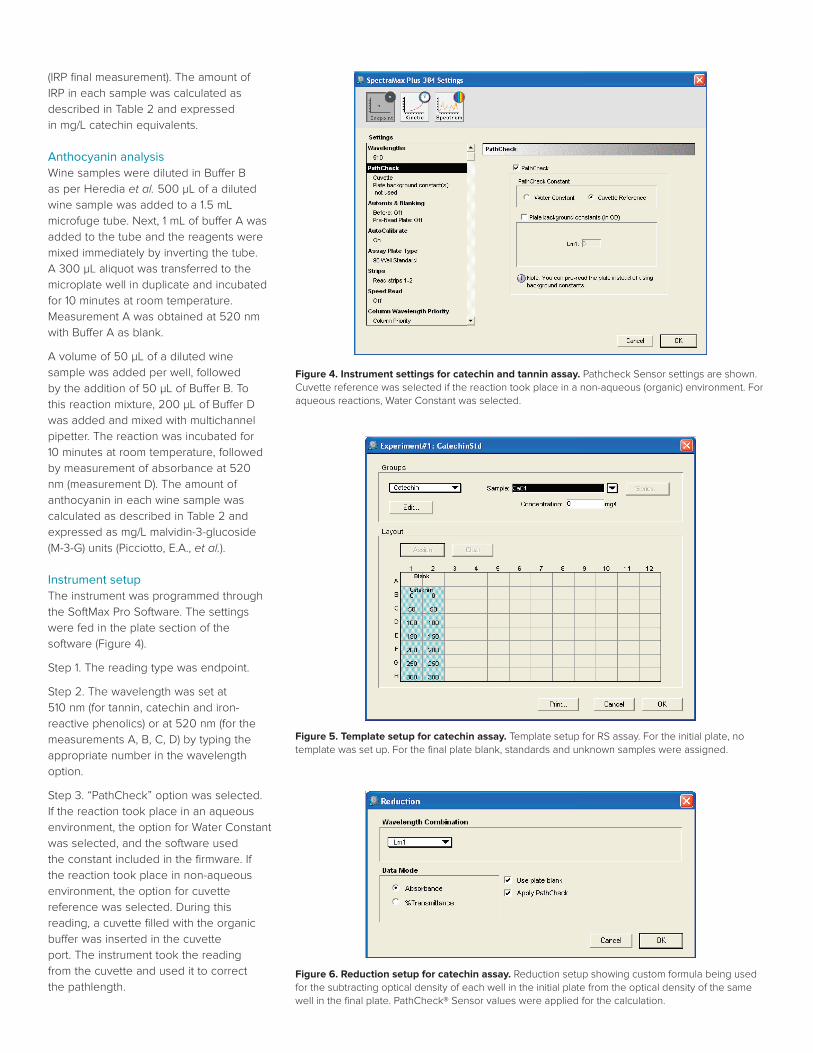
Instrument setupThe instrument was programmed through the SoftMax Pro Software. The settings were fed in the plate section of the software (Figure 4).
Step 1. The reading type was endpoint.
Step 2. The wavelength was set at 510 nm (for tannin, catechin and iron-reactive phenolics) or at 520 nm (for the measurements A, B, C, D) by typing the appropriate number in the wavelength option.
Step 3. “PathCheck” option was selected.If the reaction took place in an aqueousenvironment, the option for Water Constantwas selected, and the software used the constant included in the firmware. If the reaction took place in non-aqueous environment, the option for cuvette reference was selected. During this reading, a cuvette filled with the organic buffer was inserted in the cuvette port. The instrument took the reading from the cuvette and used it to correct the pathlength.
Figure 5. Template setup for catechin assay. Template setup for RS assay. For the initial plate, no template was set up. For the final plate blank, standards and unknown samples were assigned.
Figure 4. Instrument settings for catechin and tannin assay. Pathcheck Sensor settings are shown. Cuvette reference was selected if the reaction took place in a non-aqueous (organic) environment. For aqueous reactions, Water Constant was selected.
Figure 6. Reduction setup for catechin assay. Reduction setup showing custom formula being used for the subtracting optical density of each well in the initial plate from the optical density of the same well in the final plate. PathCheck® Sensor values were applied for the calculation.
Step 4. Automixing was not selected.
Step 5. With autocalibration, the instrument calibrated itself for the selected wavelength.
Step 6. Appropriate plate format and wells to be read were selected.
Template setupA template was set up in the software to denote placement of the series of concentrations in the appropriate wells. Flexible template layout allows easy addition of more samples and replicates.
Figure 5 is an example of a template setup for the catechin standard curve. Appropriate templates were set up for the rest of the analyses.
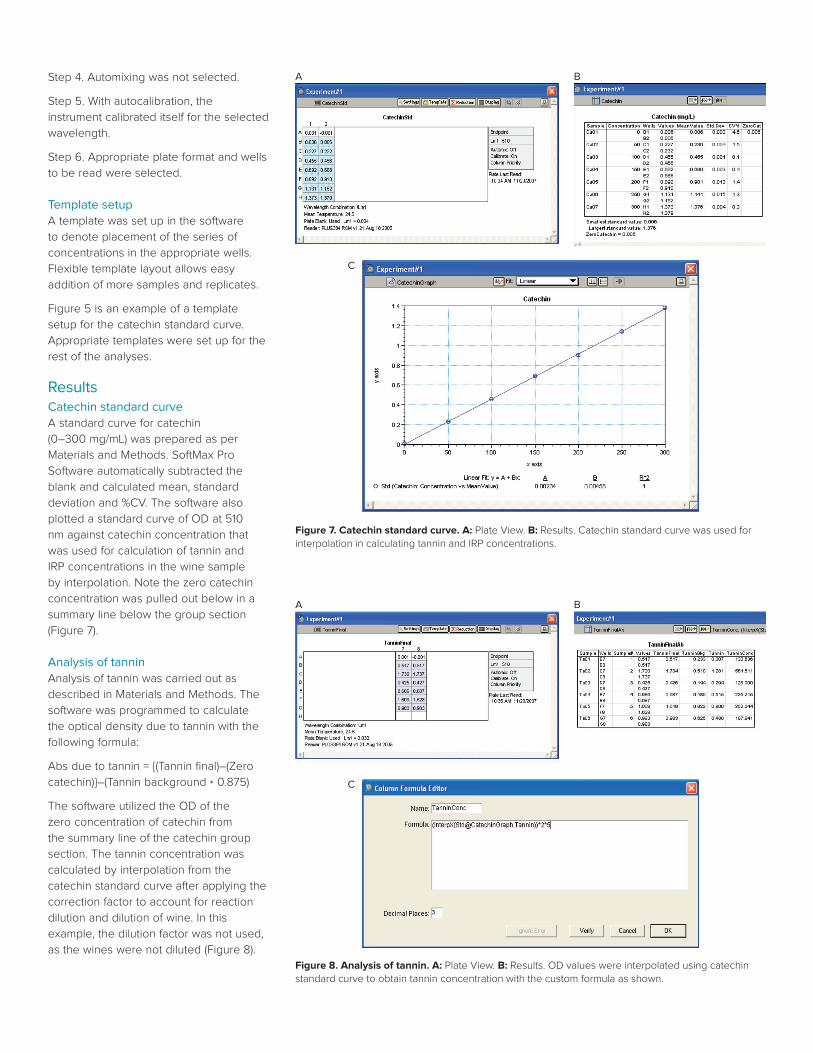
ResultsCatechin standard curveA standard curve for catechin (0–300 mg/mL) was prepared as per Materials and Methods. SoftMax Pro Software automatically subtracted the blank and calculated mean, standard deviation and %CV. The software also plotted a standard curve of OD at 510 nm against catechin concentration that was used for calculation of tannin and IRP concentrations in the wine sample by interpolation. Note the zero catechin concentration was pulled out below in a summary line below the group section (Figure 7).
Analysis of tanninAnalysis of tannin was carried out as described in Materials and Methods. The software was programmed to calculate the optical density due to tannin with the following formula:
Abs due to tannin = {(Tannin final)–(Zero catechin)}–(Tannin background * 0.875)
The software utilized the OD of the zero concentration of catechin from the summary line of the catechin group section. The tannin concentration was calculated by interpolation from the catechin standard curve after applying the correction factor to account for reaction dilution and dilution of wine. In this example, the dilution factor was not used, as the wines were not diluted (Figure 8).
Figure 7. Catechin standard curve. A: Plate View. B: Results. Catechin standard curve was used for interpolation in calculating tannin and IRP concentrations.
A B
C
Figure 8. Analysis of tannin. A: Plate View. B: Results. OD values were interpolated using catechin standard curve to obtain tannin concentration with the custom formula as shown.
A B
C
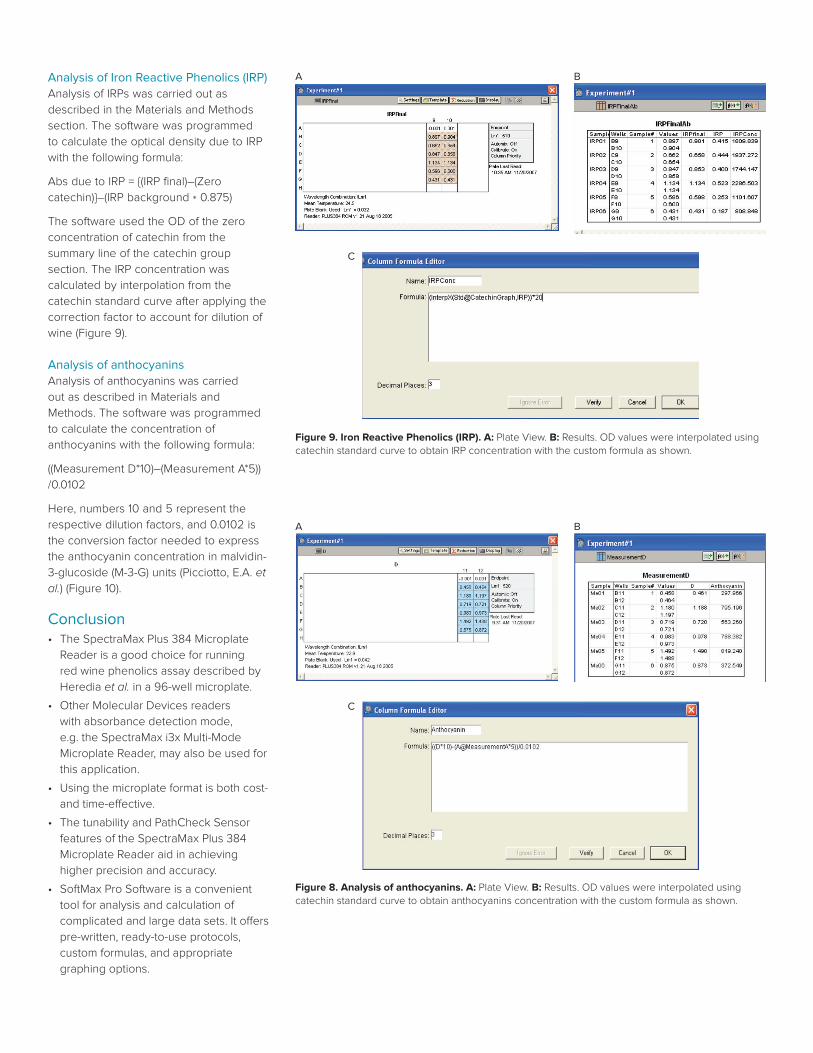
Analysis of Iron Reactive Phenolics (IRP)Analysis of IRPs was carried out as described in the Materials and Methods section. The software was programmed to calculate the optical density due to IRP with the following formula:
Abs due to IRP = {(IRP final)–(Zero catechin)}–(IRP background * 0.875)
The software used the OD of the zero concentration of catechin from the summary line of the catechin group section. The IRP concentration was calculated by interpolation from the catechin standard curve after applying the correction factor to account for dilution ofwine (Figure 9).
Analysis of anthocyaninsAnalysis of anthocyanins was carried out as described in Materials and Methods. The software was programmed to calculate the concentration of anthocyanins with the following formula:
((Measurement D*10)–(Measurement A*5))/0.0102
Here, numbers 10 and 5 represent the respective dilution factors, and 0.0102 is the conversion factor needed to express the anthocyanin concentration in malvidin-3-glucoside (M-3-G) units (Picciotto, E.A. et al.) (Figure 10).
Conclusion• The SpectraMax Plus 384 Microplate
Reader is a good choice for running red wine phenolics assay described by Heredia et al. in a 96-well microplate.
• Other Molecular Devices readers with absorbance detection mode, e.g. the SpectraMax i3x Multi-Mode Microplate Reader, may also be used for this application.
• Using the microplate format is both cost- and time-effective.
• The tunability and PathCheck Sensor features of the SpectraMax Plus 384 Microplate Reader aid in achieving higher precision and accuracy.
• SoftMax Pro Software is a convenient tool for analysis and calculation of complicated and large data sets. It offers pre-written, ready-to-use protocols, custom formulas, and appropriate graphing options.
Figure 9. Iron Reactive Phenolics (IRP). A: Plate View. B: Results. OD values were interpolated using catechin standard curve to obtain IRP concentration with the custom formula as shown.
A B
C
Figure 8. Analysis of anthocyanins. A: Plate View. B: Results. OD values were interpolated using catechin standard curve to obtain anthocyanins concentration with the custom formula as shown.
A B
C
Contact Us
Phone: +1-800-635-5577Web: www.moleculardevices.comEmail: [email protected] our website for a current listing of worldwide distributors.
The trademarks used herein are the property of Molecular Devices, LLC or their respective owners. Specifications subject to change without notice. Patents: www.moleculardevices.com/productpatents FOR RESEARCH USE ONLY. NOT FOR USE IN DIAGNOSTIC PROCEDURES.
©2017 Molecular Devices, LLC 6/17 1476EPrinted in USA
• For increased throughput requirements, Molecular Devices StakMax® Microplate Handling System integrates with SpectraMax readers and enables automated processing of batches of 20, 40, or 50 microplates.
References1. Harbertson J F et al.; (2002) Am J Enol Vitic
53: 54-59.
2. Harbertson J F et al.; (2003) Am J Enol Vitic 54: 301-306.
3. Harbertson J F et al.; (2004) Am J Enol Vitic 55: 295A.
4. Heredia T M et al.; (2006) Am J Enol Vitic 57: 497-502.
5. Picciotto E A et al.; (2002) Thesis, University of California, Davis.