phenolic composition and antioxidant activity of - lsu
TRANSCRIPT

PHENOLIC COMPOSITION AND ANTIOXIDANT ACTIVITY OF SWEETPOTATOES [IPOMOEA BATATAS (L.) LAM]
A Dissertation
Submitted to the Graduate Faculty of the Louisiana State University and
Agricultural and Mechanical College in partial fulfillment of the
requirements for the degree of Doctor of Philosophy
in
The Department of Horticulture
by Malkeet Singh Padda
B.S., Punjab Agricultural University, 1998 M.S., Punjab Agricultural University, 2001
May 2006

ACKNOWLEDGMENTS
I am deeply grateful to Dr. David Picha for his patience, perfection, guidance, and
encouragement. I would also like to thank my committee, Dr. Don Labonte, Dr. Paul
Wilson, Dr. Charles Johnson, Dr. Jack Losso, Dr. Zhimin Xu for their useful input during
my research. My special thanks to Gloria McClure for her technical assistance,
suggestions, and motivation to achieve my goal.
Exceptional thanks to my wife ‘Kamal’ for all her love, support, and
understanding. Thanks for being such a wonderful person in my life. I would also like to
thank my family in India for their continue encouragement and best wishes.
Thanks to all my friends, in particular Gillz, Bazwaz, Josanz, and Kahlonz, for
their support at every moment of life. Especially, I would like to thank Mehak, Aman,
and Jatinder for such a wonderful surprise celebration after my defense.
Above all, I want to thank my parents for all their hard work, sacrifices and
prayers for my success. I can never repay all they have done for me.
ii

TABLE OF CONTENTS
ACKNOWLEDGMENTS .................................................................................................. ii
LIST OF TABLES............................................................................................................. vi
LIST OF FIGURES ......................................................................................................... viii
ABSTRACT........................................................................................................................ x
CHAPTER 1. INTRODUCTION ....................................................................................... 1 NUTRITIONAL IMPORTANCE .................................................................................. 2 PHENOLICS IN SWEETPOTATO ............................................................................... 3 REFERENCES ............................................................................................................... 6
CHAPTER 2. METHOD DEVELOPMENT...................................................................... 9 INTRODUCTION .......................................................................................................... 9 MATERIALS AND METHODS.................................................................................. 12
Reagents .................................................................................................................... 12 Plant Material............................................................................................................ 12 Sample Preparation and Tissue Extraction ............................................................... 12 Total Phenolics.......................................................................................................... 13 Individual Phenolic Acids......................................................................................... 14 Statistical Analysis.................................................................................................... 15
RESULTS AND DISCUSSION................................................................................... 15 Extraction Solvents ................................................................................................... 15 Total Phenolics.......................................................................................................... 15 Individual Phenolic Acids......................................................................................... 17 Method Validation .................................................................................................... 25
REFERENCES ............................................................................................................. 26
CHAPTER 3. ANTIOXIDANT ACTIVITY AND PHENOLIC COMPOSITION CHANGES IN SWEETPOTATO ROOT AND LEAF TISSUE AT DIFFERENT GROWTH STAGES......................................................................................................... 28
INTRODUCTION ........................................................................................................ 28 MATERIALS AND METHODS.................................................................................. 29
Reagents .................................................................................................................... 29 Plant Material............................................................................................................ 30 Tissue Preparation..................................................................................................... 30 Tissue Extraction ...................................................................................................... 30 Total Phenolics.......................................................................................................... 31 Antioxidant Activity ................................................................................................. 31 Individual Phenolic Acids......................................................................................... 32 Statistical Analysis.................................................................................................... 32
RESULTS AND DISCUSSION................................................................................... 33 Total Phenolics.......................................................................................................... 33 Antioxidant Activity ................................................................................................. 35 Individual Phenolic Acids......................................................................................... 36
CONCLUSIONS .......................................................................................................... 39
iii

REFERENCES ............................................................................................................. 39
CHAPTER 4. PHENOLIC ACID COMPOSITION AND ANTIOXIDANT ACTIVITY OF PROCESSED SWEETPOTATOES........................................................................... 42
INTRODUCTION ........................................................................................................ 42 MATERIALS AND METHODS.................................................................................. 44
Reagents .................................................................................................................... 44 Plant Material............................................................................................................ 44 Tissue Preparation and Extraction ............................................................................ 44 Total Phenolics.......................................................................................................... 45 Antioxidant Activity ................................................................................................. 45 Individual Phenolic Acids......................................................................................... 46 Statistical Analysis.................................................................................................... 46
RESULTS AND DISCUSSION................................................................................... 47 Total Phenolics.......................................................................................................... 47 Antioxidant Activity ................................................................................................. 48 Individual Phenolic Acids......................................................................................... 49
CONCLUSIONS .......................................................................................................... 51 REFERENCES ............................................................................................................. 52
CHAPTER 5. EFFECT OF LOW TEMPERATURE STORAGE ON PHENOLIC COMPOSITION AND ANTIOXIDANT ACTIVITY OF SWEETPOTATOES............ 55
INTRODUCTION ........................................................................................................ 55 MATERIALS AND METHODS.................................................................................. 56
Reagents .................................................................................................................... 56 Plant Material............................................................................................................ 57 Tissue Preparation and Extraction ............................................................................ 57 Total Phenolics.......................................................................................................... 58 Antioxidant Activity ................................................................................................. 58 Individual Phenolic Acids......................................................................................... 59 Statistical Analysis.................................................................................................... 60
RESULTS AND DISCUSSION................................................................................... 60 Total Phenolics.......................................................................................................... 60 Antioxidant Activity ................................................................................................. 63 Individual Phenolic Acids......................................................................................... 65
CONCLUSIONS .......................................................................................................... 68 REFERENCES ............................................................................................................. 69
CHAPTER 6. PHENOLIC COMPOSITION AND ANTIOXIDANT ACTIVITY OF MINIMALLY PROCESSED SWEETPOTATOES......................................................... 71
INTRODUCTION ........................................................................................................ 71 MATERIALS AND METHODS.................................................................................. 72
Reagents .................................................................................................................... 72 Tissue Preparation..................................................................................................... 73 Headspace Gas Composition .................................................................................... 73 Tissue Extraction ...................................................................................................... 73 Total Phenolics.......................................................................................................... 74 Antioxidant Activity ................................................................................................. 74
iv

Individual Phenolic Acids......................................................................................... 75 Statistical Analysis.................................................................................................... 75
RESULTS AND DISCUSSION................................................................................... 76 Headspace Gas Composition .................................................................................... 76 Total Phenolics.......................................................................................................... 77 Antioxidant Activity ................................................................................................. 79 Individual Phenolic Acids......................................................................................... 80
CONCLUSIONS .......................................................................................................... 82 REFERENCES ............................................................................................................. 82
CHAPTER 7. PHENOLIC COMPOSITION AND ANTIOXIDANT ACTIVITY OF SWEETPOTATO CULTIVARS...................................................................................... 85
INTRODUCTION ........................................................................................................ 85 MATERIALS AND METHODS.................................................................................. 86
Reagents .................................................................................................................... 86 Plant Material............................................................................................................ 86 Tissue Preparation and Extraction ............................................................................ 86 Total Phenolics.......................................................................................................... 87 Antioxidant Activity ................................................................................................. 87 Individual Phenolic Acids......................................................................................... 88 Statistical Analysis.................................................................................................... 89
RESULTS AND DISCUSSION................................................................................... 89 Total Phenolics and Antioxidant Activity................................................................. 89 Individual Phenolic Acids......................................................................................... 90
CONCLUSIONS .......................................................................................................... 92 REFERENCES ............................................................................................................. 93
CHAPTER 8. SUMMARY............................................................................................... 95
VITA................................................................................................................................. 98
v

LIST OF TABLES
Table 2.1. Comparison of different solvents for extraction of total phenolics in sweetpotato root tissue.......................................................................................... 16
Table 2.2. The effect of number of extraction steps (using 80% methanol as solvent) on recovery of total phenolics in sweetpotato root tissue. ...................... 16
Table 2.3. Analytical characteristics and method validation data for HPLC using a Gemini 5 µm, 4.6 × 250 mm column.................................................................... 25
Table 2.4. Analytical characteristics and method validation data for HPLC using a Gemini 3 µm, 4.6 × 150 mm column.................................................................... 26
Table 3.1. Mean values of weight and size (diameter) of five sweetpotato roots at different growth stages.......................................................................................... 30
Table 3.2. Individual phenolic acid content in sweetpotato root tissues at different growth stages. ....................................................................................................... 38
Table 3.3. Individual phenolic acid content in sweetpotato leaf tissues at different growth stages. ....................................................................................................... 38
Table 4.1. Total phenolics in raw and processed sweetpotato root tissues....................... 47
Table 4.2. Antioxidant activity in raw and processed sweetpotato root tissues. .............. 48
Table 4.3. Individual phenolic acid content in raw and processed sweetpotato skin tissue. .................................................................................................................... 50
Table 4.4. Individual phenolic acid content in raw and processed sweetpotato cortex tissue. ......................................................................................................... 50
Table 4.5. Individual phenolic acid content in raw and processed sweetpotato pith tissue. .................................................................................................................... 50
Table 5.1. Total phenolics in different tissues of non-cured sweetpotato roots at different intervals of storage at 5 °C, including transfer to ambient temperature (22 °C) for an additional 3 days (d). ................................................. 62
Table 5.2. Antioxidant activity in different tissues of non-cured sweetpotato roots at different intervals of storage at 5 °C, including transfer to ambient temperature (22 °C) for an additional 3 days (d). ................................................. 64
Table 5.3. Chlorogenic acid content in different tissues of non-cured roots sweetpotato roots at different intervals of storage at 5 °C, including transfer to ambient temperature (22 °C) for an additional 3 days (d)................... 67
vi

Table 5.4. Caffeic acid content in different tissues of non-cured roots sweetpotato roots at different intervals of storage at 5 °C, including transfer to ambient temperature (22 °C) for an additional 3 days (d). ................................................. 67
Table 5.5. 4,5-dicaffeoylquinic acid content in different tissues of non-cured roots sweetpotato roots at different intervals of storage at 5 °C, including transfer to ambient temperature (22 °C) for an additional 3 days (d)................... 67
Table 5.6. 3,5-dicaffeoylquinic acid content in different tissues of non-cured roots sweetpotato roots at different intervals of storage at 5 °C, including transfer to ambient temperature (22 °C) for an additional 3 days (d)................... 68
Table 5.7. 3,4-dicaffeoylquinic acid content in different tissues of non-cured roots sweetpotato roots at different intervals of storage at 5 °C, including transfer to ambient temperature (22 °C) for an additional 3 days (d)................... 68
Table 6.1. Total phenolics and antioxidant activity in minimally processed sweetpotatoes stored at 0 and 5 °C for 4 and 8 days............................................. 78
Table 6.2. Individual phenolic acid accumulation during storage of minimally processed sweetpotatoes. ...................................................................................... 81
Table 7.1. Total phenolics and antioxidant activity of different sweetpotato cultivars and breeding lines. ................................................................................. 89
Table 7.2. Individual phenolic acid content of different sweetpotato cultivars and breeding lines. ....................................................................................................... 91
vii
LIST OF FIGURES
Figure 1.1. Biosynthetic pathways for production of chlorogenic acid and isochlorogenic acid (Friedman, 1997). ................................................................... 4
Figure 1.2. Molecular structures of phenolic compounds in sweetpotato tissues (cv. Ayamurasaki). diCQA: dicaffeoylquinic acid; triCQA: tricaffeoylquinic acid (Islam et al., 2003). .............................................................. 5
Figure 2.1. Absorbance of standard solutions measured with FDR (Folin-Denis reagent) and FCR (Folin-Ciocalteu reagent)......................................................... 17
Figure 2.2. A representative chromatogram for a 20 µl sweetpotato extract analyzed with a Gemini C18, 5 µm, 4.6 × 250 mm column using a mobile phase consisting acetonitrile: 10 mM K2HPO4 (20:80), pH 2.6; flow rate: 0.75 ml/min, temperature: 30 °C, UV detection at 320 nm. ................................. 19
Figure 2.3. A representative chromatogram for a 20 µl sweetpotato extract analyzed with a Gemini C18, 5 µm, 4.6 × 250 mm column using a mobile phase consisting methanol: 33 mM phosphate buffer (40:60), pH 3.0; flow rate: 0.75 ml/min, temperature: 30 °C, UV detection at 320 nm. ......................... 20
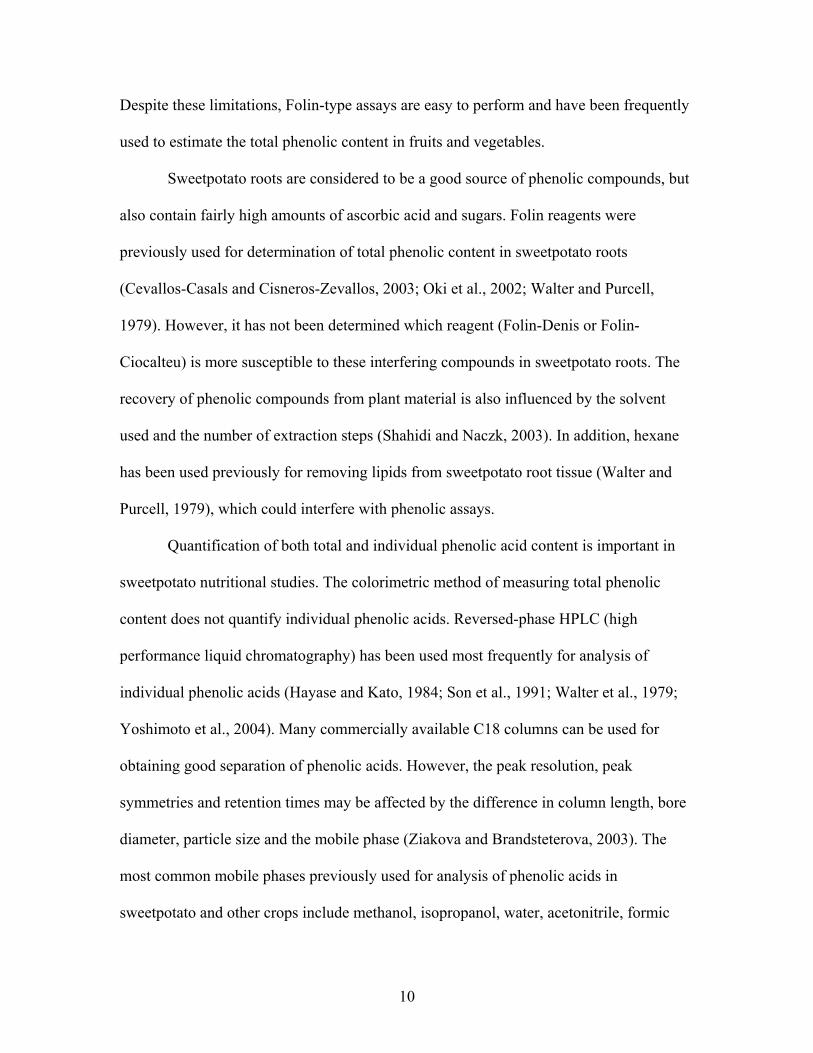
Figure 2.4. A representative chromatogram for a 20 µl sweetpotato extract analyzed with a Gemini C18, 5 µm, 4.6 × 250 mm column using a mobile phase consisting 1% (v/v) formic acid in aqueous solution: acetonitrile: 2-propanol (70:22:8), pH 2.5; flow rate: 0.75 ml/min, temperature: 30 °C, UV detection at 320 nm. ....................................................................................... 21
Figure 2.5. A representative chromatogram for a 20 µl sweetpotato extract analyzed with a Gemini C18, 3 µm, 4.6 × 150 mm column using a mobile phase consisting 1% (v/v) formic acid in aqueous solution: acetonitrile: 2-propanol (70:22:8), pH 2.5; flow rate: 0.75 ml/min, temperature: 30 °C, UV detection at 320 nm. ....................................................................................... 22
Figure 2.6. A representative chromatogram for a 20 µl sweetpotato extract analyzed with an Alltima C18 Rocket, 3 µm, 7 × 53 mm column using a mobile phase consisting 1% (v/v) formic acid in aqueous solution: acetonitrile: 2-propanol (70:22:8), pH 2.5; flow rate: 0.75 ml/min, temperature: 30 °C, UV detection at 320 nm........................................................ 23
Figure 2.7. A representative HPLC chromatogram for a 20 µl sweetpotato extract analyzed with a Novapak C18, 4 µm, 3.9 × 150 mm column using a mobile phase consisting 1% (v/v) formic acid in aqueous solution: acetonitrile: 2-propanol (70:22:8), pH 2.5; flow rate: 0.75 ml/min, temperature: 30 °C, UV detection at 320 nm........................................................ 24
Figure 3.1. Total phenolics in sweetpotato root tissues at different growth stages. ......... 33
viii

Figure 3.2. Total phenolics and antioxidant activity of sweetpotato leaf tissue at different growth stages.......................................................................................... 34
Figure 3.3. Antioxidant activity in sweetpotato root tissues at different growth stages..................................................................................................................... 35
Figure 3.4. Comparison of HPLC chromatograms for individual phenolic acids isolated from young leaf tissue and cortex tissue (stage I). .................................. 37
Figure 4.1. Correlation between antioxidant activity and total phenolics in sweetpotato root tissues. ....................................................................................... 49
Figure 5.1. Total phenolics in cured and non-cured sweetpotato roots at different intervals of storage at 5 °C.................................................................................... 61
Figure 5.2. Antioxidant activity of cured and non-cured sweetpotato roots at different intervals of storage at 5 °C. .................................................................... 63
Figure 5.3. Correlation between total phenolics (TP) and antioxidant activity (AA) in non-cured sweetpotato roots during 4 weeks of storage at 5 °C....................... 65
Figure 6.1. Changes in headspace O2 levels in minimally processed sweetpotatoes stored during storage at 0 °C (A) and 5 °C (B)..................................................... 76
Figure 6.2. Changes in headspace CO2 levels in minimally processed sweetpotatoes stored during storage at 0 °C (A) and 5 °C (B). ............................ 77
ix
ABSTRACT
The influence of numerous factors on sweetpotato phenolic content and
antioxidant activity was determined. Simplified, robust, and rapid methodologies were
developed to quantify total phenolics and individual phenolic acids in sweetpotatoes.
Quantification of total phenolic content using Folin-Denis reagent provided more reliable
results than Folin-Ciocalteu reagent. Individual phenolic acids were quantified by
reversed-phase high performance liquid chromatography (HPLC) and the best separation
was achieved using a 5-µm, 4.6 × 250 mm column with a mobile phase of 1% (v/v)
formic acid aqueous solution: acetonitrile: 2-propanol (70:22:8), pH 2.5. Methanol and
ethanol provided higher phenolic extraction efficiency than acetone. In general,
chlorogenic and 3,5-dicaffeoylquinic acid were the most prominent phenolics acids in
sweetpotato root and leaf tissues. Immature roots and leaves at the initial stages of growth
had the highest concentration of phenolics and antioxidant activity. In a comparison of
plant parts, sweetpotato leaves had a significantly higher phenolic content and antioxidant
activity than roots. Thermal processing of sweetpotato storage roots resulted in a
significant loss of phenolic content and antioxidant activity. The outer skin tissue (raw or
processed) contained the highest amounts of phenolic acids but also exhibited higher
losses than cortex or pith tissue. After a 4 week exposure to 5 °C, the rate of increase in
phenolic content and antioxidant activity in non-cured sweepotatoes was significantly
higher than in cured roots. An ambient temperature exposure following low temperature
storage accentuated the increase in phenolics and antioxidant activity. Minimally
processed sweetpotatoes held at 5 °C accumulated more phenolic compounds and had a
higher antioxidant activity than sweetpotatoes held at 0 °C. The increase in total phenolic
x

content and antioxidant activity after 8 days was higher than 4 days. No fresh-cut tissue
browning was observed after 8 days and the products were considered to be marketable.
Sweetpotato genotypes differ in their phenolic content and antioxidant activity. A purple-
fleshed breeding line was found to have higher total phenolic content and antioxidant
activity than orange-fleshed and white-fleshed cultivars.
xi
CHAPTER 1. INTRODUCTION
Sweetpotato [Ipomoea batatas (L.) Lam.] is a dicotyledonous plant, which
belongs to the Convolvulaceae family. The origin of sweetpotato is thought to be Central
or South America but it is now grown worldwide in tropical and subtropical regions.
Sweetpotato plants produce underground storage roots, which are typically ready to
harvest 3-4 months after planting. The freshly harvested roots can potentially be stored
for many months using proper postharvest care. Curing of the roots at approximately 32
°C and 90-95% relative humidity for 7 ± 2 days facilitates healing of the wounds incurred
during harvest and extends the postharvest life of the roots. Also, curing of sweetpotatoes
reduces moisture loss and microbial decay during long-term storage (Picha, 1986).
Based on the production volume, sweetpotato ranks as seventh and fifth most
important food crops in the world and developing countries, respectively (CIP, 2006).
The sweetpotato can play an important role in solving the global problem of food and
energy availability (Kozai et al., 1996). In 2002, the annual per capita consumption of
sweetpotato roots was estimated at: China, 43 kg; Japan, 7 kg; U.S., 2 kg; and Europe,
0.1 kg (FAOSTAT, 2005). Despite its high nutritional value, the consumption of
sweetpotato is very low in U.S. and Europe. Exploring the health beneficial properties of
sweetpotatoes may increase consumer awareness of the positive attributes of this
vegetable and help to increase consumption of sweetpotatoes worldwide.
The total world production of sweetpotato is approximately 130 million tons
(FAOSTAT, 2005). It is estimated that 98% of the total world sweetpotato production
and utilization is in the developing countries (Scott, 1998). Asia is the world’s largest
sweetpotato-producing region with 125 million metric tons of annual production. China
1

alone produces 106 million metric tons and contributes almost 90% of worldwide
sweetpotato production. In 2005, the annual production of sweetpotatoes in the U.S. was
estimated as 714, 000 metric tons with a value at an estimated $ 309 million (NASS,
2005). The sweetpotato is the leading vegetable crop produced in Louisiana, with a
production value estimated at $ 46 million (NASS, 2005). Louisiana ranks second in the
U.S. after North Carolina in sweetpotato production. The sweetpotato cv. Beauregard is
the leading cultivar grown in Louisiana and other parts of the U.S.
NUTRITIONAL IMPORTANCE
Sweetpotato roots are rich sources of crude protein, minerals and carotenoids
(Picha, 1985). The high beta carotene content of orange-fleshed roots may help to prevent
vitamin A deficiency in developing countries. Besides these components, sweetpotatoes
contain phenolic compounds, which may act as antioxidants to safeguard the human body
from certain chronic diseases (Hayase and Kato, 1984). In terms of total phenolic content
on a fresh weight basis, sweetpotato ranked eighth among 23 most commonly consumed
vegetables in the world (Vinson et al., 1998). The term antioxidant is generally used for
those compounds that scavenge the free radicals or reactive oxygen species formed in the
human body. The human body has a defense mechanism against free radicals, but
excessive production of free radicals can cause oxidative damage in cells (Silalahi, 2001).
Free radicals impair the biological activity of biomolecules such as DNA, lipids, and
protein, causing diseases such as neurodegentrative disorders, aging, cancer, and
atherosclerosis (Ames, 1983; Aruoma, 1998). Phenolic compounds may play an
important role in preventing chronic illnesses such as cardiovascular diseases, certain
type of cancers, neurodegenerative diseases, and diabetes (Surh, 2003; Scalbert et al.,
2

3
2005). The antioxidant properties of phenolic compounds have been implicated in
suppressing various health related disorders, including melanogenesis in mice
(Shimozono et al., 1996), hepatoma invasion (Yagasaki et al., 2000), and human
immunodeficiency virus (HIV) replication (Mahmood et al., 1993; Zhu et al., 1999).
Recently, Rabah et al. (2004) showed that extracts from baked sweetpotato had potential
chemopreventive properties. Juice extracted from purple-fleshed sweetpotatoes had an
ameliorative effect against carbon tetrachloride induced liver injury in rats (Suda et al.,
1997). Huang et al. (2004) reported that the inhibition of cancer cell proliferation by
sweetpotato could be attributed to synergistic effect of phenolics with other
phytochemicals.
PHENOLICS IN SWEETPOTATO
Phenolics are compounds having an aromatic ring with one or more hydroxyl
groups and functional derivatives (Shahidi and Naczk, 2003). Phenolic compounds are
secondary metabolites in plants that are involved in a number of metabolic pathways.
They are produced from the aromatic amino acids phenylalanine or tyrosine via the
phenylpropanoid pathway. In plants, these metabolites and their derivatives play an
important role in cell wall integrity and defense against pathogen attack (Faulds and
Williamson, 1999). The two major classes of phenolic compounds include flavonoids and
phenolic acids. The biosynthetic pathway for synthesis of the most abundant phenolic
acids in sweetpotato (chlorogenic acid and isochlorogenic acid) is shown in Figure 1.1.
Rudkin and Nelson (1947) were the first to isolate phenolic acids from
sweetpotato and revealed the presence of chlorogenic acid in the roots. Sweetpotato
peelings were reported to contain chlorogenic acid, isochlorogenic acid, caffeic acid,

Figure 1.1. Biosynthetic pathways for production of chlorogenic acid and isochlorogenic acid (Friedman, 1997).
4

neochlorogenic acid, and an unidentified band (Sondheimer, 1958). Walter et al., (1979)
were the first to use the high performance liquid chromatography (HPLC) to identify and
quantify the individual phenolic acids in different sweetpotato cultivars. In contrast to
Sondheimer (1958), caffeic acid was found to be absent in sweetpotato root tissue.
Sweetpotato leaves are consumed as a leafy vegetable in many parts of the world
and can be harvested many times during a season (Villareal et al., 1982; Islam et al.,
2002). Islam et al. (2002) identified six major phenolic acids in sweetpotato leaf tissue
(Figure 1.2.). Previous reports indicated the sweetpotato leaves had a higher antioxidant
potential than root tissue (Islam et al., 2003).
Figure 1.2. Molecular structures of phenolic compounds in sweetpotato tissues (cv. Ayamurasaki). diCQA: dicaffeoylquinic acid; triCQA: tricaffeoylquinic acid (Islam et al., 2003).
5

Despite the health beneficial properties, little is known about the factors that
influence the concentration of phenolic compounds and antioxidant activity in
sweetpotatoes. This work was initiated to determine the factors affecting the phenolic
composition and antioxidant activity in sweetpotatoes. In addition, our goal was to
establish simple, rapid, and reliable methodologies to quantify phenolic acids in
sweetpotatoes.
REFERENCES
Ames, B.N. 1983. Dietary carcinogens and anticarcinogens - oxygen radicals and degenerative diseases. Science. 221: 1256-1264.
Aruoma, O.I. 1998. Free radicals, oxidative stress, and antioxidants in human health and disease. J Am Oil Chem Soc. 75: 199-212.
CIP, 2006. International Potato Center.Available from: http://www.cipotato.org. Accessed Feb 20
FAOSTAT, 2005. Food and Agricultural Statistical Database. Available from: http://faostat.fao.org. Accessed Feb 15.
Faulds, C.B. and G. Williamson. 1999. The role of hydroxycinnamates in the plant cell wall. J Sci Food Agric. 79: 393-395.
Friedman, M. 1997. Chemistry, biochemistry, and dietary role of potato polyphenols. A review. J Agric Food Chem. 45: 1523-1540.
Hayase, F. and H. Kato. 1984. Antioxidative components of sweet-potatoes. J Nutr Sci Vitaminol. 30: 37-46.
Huang, D.J., C.D. Lin, H.J. Chen, and Y.H. Lin. 2004. Antioxidant and antiproliferative activities of sweet potato [Ipomoea batatas (L.) Lam 'Tainong 57] constituents. Bot Bull Acad Sinica. 45: 179-186.
Islam, M.S., M. Yoshimoto, K. Ishiguro, S. Okuno, and O. Yamakawa. 2003a. Effect of artificial shading and temperature on radical scavenging activity and polyphenolic composition in sweetpotato (Ipomoea batatas L.) leaves. J Am Soc Hort Sci. 128: 182-187.
6

Islam, M.S., M. Yoshimoto, S. Yahara, S. Okuno, K. Ishiguro, and O. Yamakawa. 2002. Identification and characterization of foliar polyphenolic composition in sweetpotato (Ipomoea batatas L.) genotypes. J Agric Food Chem. 50: 3718-3722.
Kozai, T., C. Kubota, and Y. Kitaya. 1996. Sweetpotato technology for solving the global issues on food, energy, natural resources and environmental in 21st century. Environ Control Biol. 34: 105-114.
Mahmood, N., P.S. Moore, N. Detommasi, F. Desimone, S. Colman, A.J. Hay, and C. Pizza. 1993. Inhibition of HIV-infection by caffeoylquinic acid-derivatives. Antiviral Chem Chemother. 4: 235-240.
NASS, 2005. USDA: National Agricultural Statistics Service. Available from: http://www.nass.usda.gov. Accessed Feb 15
Picha, D.H. 1985. Crude protein, minerals, and total carotenoids in sweetpotatoes. J Food Sci. 50: 1768-1769.
Picha, D.H. 1986. Weight loss in sweetpotatoes during curing and storage: contribution of transpiration and respiration. J Am Soc Hort Sci. 111: 889-892.
Rabah, I.O., D.X. Hou, S.I. Komine, and M. Fujii. 2004. Potential chemopreventive properties of extract from baked sweet potato (Ipomoea batatas Lam. cv. Koganesengan). J Agric Food Chem. 52: 7152-7157.
Rudkin, G.O. and J.M. Nelson. 1947. Chlorogenic acid and respiration of sweet potatoes. J Am Chem Soc. 69: 1470-1475.
Sahidi, F. and M. Naczk. 2003. Phenolics in food and nutraceuticals. CRC Press LLC, Boca Raton, Florida.
Scalbert, A., C. Manach, C. Morand, C. Remesy, and L. Jimenez. 2005. Dietary polyphenols and the prevention of diseases. Crit Rev Food Sci Nutr. 45: 287-306.
Scott, G.J. and L. Maldonado. 1998. Sweetpotato for the new millennium: Trends in production and utilization in developing countries. CIP program report, Lima, Peru, pp 329-335.
Shimozono, H., M. Kobori, H. Shinmoto, and T. Tsushida. 1996. Suppression of the melanogenesis of mouse melanoma B 16 cells by sweet potato extract. J Jap Soc Food Sci Tech. 43: 313-317.
7
Silalahi, J. 2001. Free radicals and antioxidant vitamins in degenerative disease. J Indo Med Assoc. II. 1-13.
Sondheimer, E. 1958. On the distribution of caffeic acid and the chlorogenic acid isomers in plants. Arch Biochem Biophys. 74: 131-138.
Suda, I., S. Furuta, Y. Nishiba, O. Yamakawa, K. Matsugano, and K. Sugita. 1997. Reduction of liver injury induced by carbon tetrachloride in rats administered purple-colored sweetpotato juice. J Jap Soc Food Sci Tech. 44: 315-318.
Surh, Y.J. 2003. Cancer chemoprevention with dietary phytochemicals. Nature Rev Cancer. 10: 768-780.
Villareal, R.L., S.C. Tsou, H.F. Lo, and S.C. Chiu. 1982. Sweetpotato tips as vegetables. In: In Sweetpotato: Proceedings of the first International Symposium; Villareal, R.L. and T.D. Griggs (eds.) AVRDC: Shanhua, Taiwan, pp 313-320.
Vinson, J.A., Y. Hao, X. Su, and L. Zubik. 1998. Phenol antioxidant quantity and quality in foods: vegetables. J Agric Food Chem. 46: 3630-3634.
Walter, W.M. Jr., A.E. Purcell, and G.K. McCollum. 1979. Use of high-pressure liquid chromatography for analysis of sweet potato phenolics. J Agric Food Chem. 27: 938–941.
Yagasaki, K., Y. Miura, R. Okauchi, and T. Furuse. 2000. Inhibitory effects of chlorogenic acid and its related compounds on the invasion of hepatoma cells in culture. Cytotechnol. 33: 229-235.
Zhu, K., M.L. Cordeiro, J. Atienza, W.E. Robinson, and S.A. Chow. 1999. Irreversible inhibition of human immunodeficiency virus type 1 integrase by dicaffeoylquinic acids. J Virol. 73: 3309-3316.
8

CHAPTER 2. METHOD DEVELOPMENT
INTRODUCTION
Phenolic acids are naturally occurring antioxidant compounds found in different
kinds of food materials. Their potential benefits in reducing certain human health related
disorders are becoming increasingly apparent. Therefore, simple and robust
methodologies for quantifying both total and individual phenolic acids are needed. Due to
the heterogenicity of phenolic compounds, several types of reagents have been used for
total phenolic content determination in plant extracts. A number of spectrophotometric
methods have been developed for quantification of total phenolic content. Folin-type
assays (Folin-Denis and Folin-Ciocalteu reagents) are commonly used for quantifying
total phenolic compounds in fruits and vegetables. These reagents measure the ability of
any mixture to reduce phosphomolybdic and phosphotungstic acids to a blue complex
(Swain and Hillis, 1959). The presence of ascorbic acid or other very easily oxidized
substances, not considered to be phenolic compounds, may also result in formation of
blue color with Folin-Ciocalteu reagent, causing an overestimation of total phenolic
content (Shahidi and Naczk, 2003; Singleton et al., 1999). It has been argued that Folin
reagents may be inappropriate for plant extracts with high levels of other easily
oxidizable substances such as sugars and ascorbic acid (Appel et al., 2001; Escarpa and
Gonzalez, 2001). High sugar levels may react appreciably with Folin-Ciocalteu reagent
resulting in overestimation of total phenolic content. However, low levels of sugar
content may not interfere with total phenolic analysis. Also, the reaction of Folin-
Ciocalteu reagent with fructose was shown to be more intense compared to other sugars.
9
Despite these limitations, Folin-type assays are easy to perform and have been frequently
used to estimate the total phenolic content in fruits and vegetables.
Sweetpotato roots are considered to be a good source of phenolic compounds, but
also contain fairly high amounts of ascorbic acid and sugars. Folin reagents were
previously used for determination of total phenolic content in sweetpotato roots
(Cevallos-Casals and Cisneros-Zevallos, 2003; Oki et al., 2002; Walter and Purcell,
1979). However, it has not been determined which reagent (Folin-Denis or Folin-
Ciocalteu) is more susceptible to these interfering compounds in sweetpotato roots. The
recovery of phenolic compounds from plant material is also influenced by the solvent
used and the number of extraction steps (Shahidi and Naczk, 2003). In addition, hexane
has been used previously for removing lipids from sweetpotato root tissue (Walter and
Purcell, 1979), which could interfere with phenolic assays.
Quantification of both total and individual phenolic acid content is important in
sweetpotato nutritional studies. The colorimetric method of measuring total phenolic
content does not quantify individual phenolic acids. Reversed-phase HPLC (high
performance liquid chromatography) has been used most frequently for analysis of
individual phenolic acids (Hayase and Kato, 1984; Son et al., 1991; Walter et al., 1979;
Yoshimoto et al., 2004). Many commercially available C18 columns can be used for
obtaining good separation of phenolic acids. However, the peak resolution, peak
symmetries and retention times may be affected by the difference in column length, bore
diameter, particle size and the mobile phase (Ziakova and Brandsteterova, 2003). The
most common mobile phases previously used for analysis of phenolic acids in
sweetpotato and other crops include methanol, isopropanol, water, acetonitrile, formic
10

acid and potassium phosphate buffer combinations (Careri et al., 2003; Hayase and Kato,
1984; Son et al., 1991; Walter et al., 1979; Yoshimoto et al., 2004). The use of phosphate
buffer resulted in peak broadening and co-elution of some phenolic standards (Tsao and
Yang, 2003). Thus, optimization of the mobile phase with a specific column remains an
important step in the development of HPLC methodology. Both isocratic and gradient
elution has been used for isolating phenolic acids in sweetpotato extracts. A satisfactory
resolution could be achieved through isocratic elution by adjusting one or more
components of the mobile phase (Robards, 2003). The total analysis time reported for
individual phenolic acid quantification in sweetpotato roots ranged from 20-45 minutes
(Hayase and Kato, 1984; Son et al., 1991; Walter and Schadel 1981; Yoshimoto et al.,
2004). Along with better resolution, a relatively short analysis time is an obvious
advantage in quantifying the major phenolic acids in sweetpotato. Despite several studies,
a rapid, robust and simple isocratic method for the separation and quantification of
individual phenolic acids in sweetpotato roots has yet to be developed.
The objectives of this study were three fold: 1) to determine optimum extraction
conditions, 2) to determine the optimal Folin-type reagent to minimize the effect of
interfering compounds on quantification of total phenolic content in sweetpotato roots,
and 3) to develop a rapid, simple, and robust HPLC methodology using isocratic
conditions for individual phenolic acid quantification in sweetpotatoes. C18 columns of
different lengths, bore diameters and particle size were compared. The optimal mobile
phase was determined after testing various eluent combinations.
11

MATERIALS AND METHODS
Reagents
Chlorogenic and caffeic acid standards, and Folin reagents (Folin-Denis and
Folin-Ciocalteu reagents) were purchased from Sigma-Aldrich (St. Louis, MO).
Standards of three isomers (4,5-dicaffeoylquinic acid; 3,5-dicaffeoylquinic acid; and 3,4-
dicaffeoylquinic acid ) of dicaffeoylquinic acid were kindly provided by Dr. Makoto
Yoshimoto (Department of Upland Farming, Kyushu National Agricultural Experiment
Station, Miyakonojo, Miyazaki, Japan). HPLC grade solvents were used for elution of
individual phenolic acids.
Plant Material
Sweetpotatoes [Ipomoea batatas (L.) Lam.] cv. Beauregard roots were harvested
in early October, 2004 from the LSU AgCenter Sweetpotato Research Station in Chase,
LA. They were immediately cured after harvest at 30 °C and 90% relative humidity for 7
days and then stored at 15 °C until analyzed. Randomly selected sound roots,
approximately 300 g in weight, were obtained from storage, washed with tap water and
hand peeled prior to tissue extraction.
Sample Preparation and Tissue Extraction
The peeled roots were blended using a Cuisinart Model DLC-2AR food processor
(Cuisinart Inc., Windsor, NJ). The blended tissue was passed through a 1 mm sieve.
Exactly 1 g of sieved tissue was placed in 15 ml Falcon centrifuge tube and
approximately 8 ml of the extraction solvent (80% solution of methanol, ethanol or
acetone) was added to the tube. The tubes were capped and immersed in a water bath at
80 °C for 10 minutes. After vigorously shaking the heated samples by hand, the tubes
12

were cooled and centrifuged at 4,500 g for 15 minutes. The final volume of clear
supernatant was made to 10 ml and was used for total phenolics and individual phenolic
acid analysis. The addition of hexane to the supernatant from methanol-extracted samples
was tested to remove polar lipids and other interfering compounds. The alcoholic
supernatant was evaporated under vacuum at 50 °C and the viscous pellet left in the tube
was dissolved in 10 ml of water. This solution was extracted with equal volumes of
hexane and the aqueous phase was used for analysis.
Total Phenolics
The effect of potentially interfering substances on quantification of total phenolic
content was determined by spectrophotometric analysis using Folin-Denis (Swain and
Hillis, 1959) and Folin-Ciocalteu assays (Singleton and Rossi, 1965), with slight
modifications. Standard solutions of the potentially interfering compounds were prepared
in high concentrations (0.05% ascorbic acid, 4% sucrose, 2% fructose, 2% glucose and
10% maltose) previously reported in sweetpotatoes. All solutions were prepared in 80%
methanol and also contained 100 µg/ml of chlorogenic acid. Exactly 0.5 ml of standard
solution was placed in a 25 ml test tube and mixed with 8 ml of Megapure water
(Barnstead MP-12A, Haverhill, MA) followed by the addition of 0.5 ml of Folin-Denis
reagent. After 3 minutes, 1 ml of 1 N Na2CO3 was added and the solution was allowed to
stand for 2 hours at ambient temperature (~21 °C). Absorbance of the resulting blue
complex was then measured at 750 nm using a Beckman DU-65 spectrophotometer
(Beckman Instruments, Inc., Fullerton, CA). A solution of 80% methanol added to a test
tube was used as the blank and 100 µg/ml of chlorogenic acid was used as the control. To
perform the Folin-Ciocalteu assay, the Folin-Denis reagent was replaced with 0.25 N
13

Folin-Ciocalteu reagent. Two separate standard curves for each Folin-reagent were
plotted using a linear range of chlorogenic acid concentrations (50-300 µg/ml).
Sweetpotato samples with total phenolic concentrations beyond the linear range were
diluted before analyzed. The absorbance measured from each solution was presented in
terms of chlorogenic acid using the standard curves. Both Folin-reagents were used
separately to compare the total phenolic content in the sweetpotato samples. Total
phenolic content was expressed as mg chlorogenic acid equivalent/100 g fresh weight.
Individual Phenolic Acids
An aliquot of the supernatant from the sweetpotato extract was filtered through a
0.45 µm Nylaflo membrane filter paper (Pall Corp., East Hills, NY). Individual phenolic
acids were separated with four reversed-phase HPLC columns of different length, bore
diameter and particle size. The four C18 columns tested were an Alltima Rocket, 3 µm, 7
× 53 mm (Alltech Assoc. Inc., Deerfield, IL), a NovaPak, 4 µm, 3.9 × 150 mm (Waters
Corp., Milford, MA), a Gemini long column, 5 µm, 4.6 × 250 mm (Phenomenex Inc.,
Torrance, CA) and a Gemini short column, 3 µm, 4.6 × 150 mm (Phenomenex Inc.). The
column temperature was maintained at 30 °C. A 20 µl aliquot of sample was injected on
to each column using a Waters 717 plus autosampler connected to a Waters 600 pump
(Waters Corp., Milford, MA). In addition, three different mobile phases were tested. The
first mobile phase consisted of 1% (v/v) formic acid in aqueous solution: acetonitrile: 2-
propanol (70:22:8), pH 2.5; the second mobile phase contained acetonitrile: 10 mM
K2HP04 (20:80), pH 2.6; and the third mobile phase consisted of methanol: 33 mM
phosphate buffer (40:60), pH 3.0. A flow rate of 0.75 ml/min was determined to be best
suited for all columns, as it provided optimal separation and reasonable low backpressure.
14

Peaks were detected with a Waters 2487 dual wavelength UV absorbance detector at 320
nm. The detected peaks were identified and quantified by comparing the retention time
with that of known standards.
Statistical Analysis
Statistical analysis was performed using SAS (Statistical Analysis Software,
version 9.0, Cary, NC). Analysis of variance using procedure Mixed of SAS was
performed and means were separated by Tukey’s test (P<0.05).
RESULTS AND DISCUSSION
Extraction Solvents
Several commonly used solvents were compared for effectiveness of phenolic
acid extraction from sweetpotato tissue. Among the extraction solvents tested, acetone
gave lower amounts of total phenolics than either methanol or ethanol (Table 2.1). There
was no significant difference in phenolic acid extraction effectiveness between methanol
and ethanol. Both methanol and ethanol have hydroxyl groups which may form
intramolecular hydrogen bonding with hydroxyl groups present in phenolic compounds
and increase their solubility (Silla et al., 2001). Hexane, used previously to remove polar
lipids (Walter and Purcell, 1979), did not offer any advantage in removing potential
interfering compounds in sweetpotato root tissue (Table 2.1). Increasing the number of
tissue extractions did not have a significant affect on the amount of phenolics extracted
(Table 2.2).
Total Phenolics
Folin-type assays may overestimate the total phenolic content due to reaction with
interfering compounds like sugars and ascorbic acid. Our results indicated the Folin-
15

Table 2.1. Comparison of different solvents for extraction of total phenolics in sweetpotato root tissue. Solvent Total phenolics* 80% Methanol 88.6a 80% Ethanol 88.7a 80% Acetone 77.8b 80% Methanol + Hexane 86.7a Mean values with the same letters are not significantly different at P<0.05 (Tukey’s test). * Data expressed as mg of chlorogenic acid equivalents per 100 g of fresh weight. Table 2.2. The effect of number of extraction steps (using 80% methanol as solvent) on recovery of total phenolics in sweetpotato root tissue. Number of extraction steps Total phenolics* 1 78.2a 2 80.0a 3 81.1a Mean values with the same letters are not significantly different at P<0.05 (Tukey’s test). * Data expressed as mg of chlorogenic acid equivalents per 100 g of fresh weight.
Ciocalteu reagent was more sensitive to interfering compounds than the Folin-Denis
reagent. This may cause overestimation of total phenolic content in sweetpotatoes with
high reducing sugar and ascorbic acid content. The extent to which sugars and ascorbic
acid affect the results for total phenolic content in sweetpotato tissue might depend on the
concentration of interfering compounds. As a consequence, ascorbic acid and fructose
resulted in an overestimation of the total phenolic content measured with Folin-Ciocalteu
reagent but not with Folin-Denis reagent (Figure 2.1). The Folin-Ciocalteu assay was less
affected by other sugars. However, the Folin-Denis reagent was best suited reagent for
quantification of total phenolics in sweetpotato, since it was less affected by interfering
compounds such as fructose and ascorbic acid. Our results are consistent with other
reports indicating the Folin-Ciocalteu reagent resulted in overestimation of total phenolic
content by reacting with other non-phenolic compounds (Escarpa and Gonzalez, 2001;
Singleton et al., 1999). However, the Folin-Ciocalteu reagent can still be used for
16

quantifying phenolics in sweetpotatoes, but with a correction factor for the interferences
caused by ascorbic acid and sugars.
00.050.1
0.150.2
0.250.3
0.35
a b c d e f
FCR FDR
Abs
orba
nce
units
Standard solutions
Figure 2.1. Absorbance of standard solutions measured with FDR (Folin-Denis reagent) and FCR (Folin-Ciocalteu reagent). a: 100 µg/ml chlorogenic acid; b: a + 0.05% ascorbic acid; c: a + 4% sucrose; d: a + 2% fructose; e: a + 2% glucose; f: a +10% maltose. Vertical bars represent standard error of the mean (n=5) and, if absent, covered by the symbol.
The average total phenolic acid content in sweetpotato roots, stored at 15 °C for 8
months, was 60.9 mg/100 g fresh weight using the Folin-Denis reagent and 74.6 mg/100
g fresh weight using the Folin-Ciocalteu reagent. The higher amount of total phenolic
content with the Folin-Ciocalteu assay may be due to the higher absorbance resulting
from reaction with fructose and ascorbic acid.
Individual Phenolic Acids
The optimal mobile phase and flow rate was initially determined for each C18
column. The mobile phase consisting of 1% (v/v) formic acid in aqueous solution:
acetonitrile: 2-propanol (70:22:8), pH 2.5 at a flow rate of 0.75 ml/min gave rapid and
better baseline resolution of chlorogenic acid (ChlA), caffeic acid (CafA), and three
isomers of dicaffeoylquinic acid (diCQA) compared to the other two previously
17

described mobile phases (Figures 2.2-2.4). Presence of isomers of diCQA in sweetpotato
tissue has been documented (Son et al., 1991; Walter and Purcell, 1979). However, the
identification and quantification of each isomer of diCQA in sweetpotato cv. Beauregard
is reported for the first time.
The four analytical columns were compared using the optimal mobile phase
consisting of 1% (v/v) formic acid in aqueous solution: acetonitrile: 2-propanol (70:22:8),
pH 2.5. The Gemini C18 columns, irrespective of length and particle size, gave
significantly better baseline separation and peak symmetry of individual phenolic acids
than the other two columns (Figures 2.4-2.7). However, the total analysis time for
individual phenolic acids with the Gemini C18, 3 µm, 4.6 × 150 mm column was 6
minutes compared to 9 minutes in Gemini C18, 5 µm, 4.6 × 250 mm column. A short
analysis time helps to save mobile phase and decrease cost in multiple sample analysis.
The analysis times are substantially less than the reported run times (20-45 minutes) by
other researchers (Hayase and Kato, 1984; Son et al., 1991; Walter and Schadel, 1981;
Yoshimoto et al., 2004). An isocratic flow rate of 0.75 ml/min was used for each column,
which provides a robust and simplified methodology. No significant interfering
impurities were detected and insignificant peak tailing was observed.
The five individual phenolic acids quantified were: ChlA, CafA, 4,5-diCQA, 3,5-
diCQA, 3,4-diCQA (Figure 2.4). The phenolic acids profile from all columns indicated
chlorogenic acid is the predominant phenolic acid found in sweetpotato roots. The
highest peak area for chlorogenic acid was detected using the Novapak C18 column
(Figure 2.7). This may be due to co-elution of several small peaks, which are more
clearly separated by the Gemini C18 columns (Figures 2.4 and 2.5). The Alltima Rocket
18

A
bsor
banc
e un
its
1
2
3
Time (minutes) Figure 2.2. A representative chromatogram for a 20 µl sweetpotato extract analyzed with a Gemini C18, 5 µm, 4.6 × 250 mm column using a mobile phase consisting acetonitrile: 10 mM K2HPO4 (20:80), pH 2.6; flow rate: 0.75 ml/min, temperature: 30 °C, UV detection at 320 nm. Peaks: (1) unknown, (2) chlorogenic acid, (3) caffeic acid.
19

Time (minutes)
Abs
orba
nce
units
2
20
Figure 2.3. A representative chromatogram for a 20 µl sweetpotato extract analyzed with
V
1
3
4
5
6
7
a Gemini C18, 5 µm, 4.6 × 250 mm column using a mobile phase consisting methanol: 33 mM phosphate buffer (40:60), pH 3.0; flow rate: 0.75 ml/min, temperature: 30 °C, Udetection at 320 nm. Peaks: (1&4) unknown, (2) chlorogenic acid, (3) caffeic acid, (5) 4,5-dicaffeoylquinic acid, (6) 3,5-dicaffeoylquinic acid, (7) 3,4-dicaffeoylquinic acid.
Time (minutes)
Abs
orba
nce
units
2
3
4
5 6
1
7
8
Figure 2.4. A representative chromatogram for a 20 µl sweetpotato extract analyzed with a Gemini C18, 5 µm, 4.6 × 250 mm column using a mobile phase consisting 1% (v/v) formic acid in aqueous solution: acetonitrile: 2-propanol (70:22:8), pH 2.5; flow rate: 0.75 ml/min, temperature: 30 °C, UV detection at 320 nm. Peaks: (1) methanol, (2&4) unknown, (3) chlorogenic acid, (5) caffeic acid, (6) 4,5-dicaffeoylquinic acid, (7) 3,5-dicaffeoylquinic acid, (8) 3,4-dicaffeoylquinic acid.
Figure 2.4. A representative chromatogram for a 20 µl sweetpotato extract analyzed with a Gemini C18, 5 µm, 4.6 × 250 mm column using a mobile phase consisting 1% (v/v) formic acid in aqueous solution: acetonitrile: 2-propanol (70:22:8), pH 2.5; flow rate: 0.75 ml/min, temperature: 30 °C, UV detection at 320 nm. Peaks: (1) methanol, (2&4) unknown, (3) chlorogenic acid, (5) caffeic acid, (6) 4,5-dicaffeoylquinic acid, (7) 3,5-dicaffeoylquinic acid, (8) 3,4-dicaffeoylquinic acid.
21

Time (minutes)
Abs
orba
nce
units
Time (minutes)
Abs
orba
nce
units
1 2
3
4
6
7
8
5
Figure 2.5. A representative chromatogram for a 20 µl sweetpotato extract analyzed with a Gemini C18, 3 µm, 4.6 × 150 mm column using a mobile phase consisting 1% (v/v) formic acid in aqueous solution: acetonitrile: 2-propanol (70:22:8), pH 2.5; flow rate: 0.75 ml/min, temperature: 30 °C, UV detection at 320 nm. Peaks: (1) methanol, (2&4) unknown, (3) chlorogenic acid, (5) caffeic acid, (6) 4,5-dicaffeoylquinic acid, (7) 3,5-dicaffeoylquinic acid, (8) 3,4-dicaffeoylquinic acid.
Figure 2.5. A representative chromatogram for a 20 µl sweetpotato extract analyzed with a Gemini C18, 3 µm, 4.6 × 150 mm column using a mobile phase consisting 1% (v/v) formic acid in aqueous solution: acetonitrile: 2-propanol (70:22:8), pH 2.5; flow rate: 0.75 ml/min, temperature: 30 °C, UV detection at 320 nm. Peaks: (1) methanol, (2&4) unknown, (3) chlorogenic acid, (5) caffeic acid, (6) 4,5-dicaffeoylquinic acid, (7) 3,5-dicaffeoylquinic acid, (8) 3,4-dicaffeoylquinic acid.
22

8
Time
1
3
4 5
6
7
(minutes)
Abs
orba
nce
units
2
Figure 2.6. A representative chromatogram for a 20 µl sweetpotato extract analyzed with an Alltima C18 Rocket, 3 µm, 7 × 53 mm column using a mobile phase consisting 1% (v/v) formic acid in aqueous solution: acetonitrile: 2-propanol (70:22:8), pH 2.5; flow rate: 0.75 ml/min, temperature: 30 °C, UV detection at 320 nm. Peaks: (1) methanol, (3) unknown, (2) chlorogenic acid, (4) caffeic acid, (5) 4,5-dicaffeoylquinic acid, (6) 3,5-dicaffeoylquinic acid, (7) 3,4-dicaffeoylquinic acid.
23

Time (minutes)
Abs
orba
nce
units
Time (minutes)
Abs
orba
nce
units
1
2
3 4
5
Figure 2.7. A representative HPLC chromatogram for a 20 µl sweetpotato extract analyzed with a Novapak C18, 4 µm, 3.9 × 150 mm column using a mobile phase consisting 1% (v/v) formic acid in aqueous solution: acetonitrile: 2-propanol (70:22:8), pH 2.5; flow rate: 0.75 ml/min, temperature: 30 °C, UV detection at 320 nm. Peaks: (1) methanol, (2) chlorogenic acid, (3) caffeic acid, (4) 3,5-dicaffeoylquinic acid, (5) unknown.
Figure 2.7. A representative HPLC chromatogram for a 20 µl sweetpotato extract analyzed with a Novapak C18, 4 µm, 3.9 × 150 mm column using a mobile phase consisting 1% (v/v) formic acid in aqueous solution: acetonitrile: 2-propanol (70:22:8), pH 2.5; flow rate: 0.75 ml/min, temperature: 30 °C, UV detection at 320 nm. Peaks: (1) methanol, (2) chlorogenic acid, (3) caffeic acid, (4) 3,5-dicaffeoylquinic acid, (5) unknown.
24

C18 column gave a faster and better separation of phenolic acids and reduced peak tailing
compared to the NovaPak C18 column (Figures 2.6 and 2.7). As a consequence, the
Alltima Rocket C18 column can be used for separation and quantification of chlorogenic
acid and caffeic acid with a short analysis time of under four minutes. Also, the Alltima
Rocket column back-pressure was substantially lower (500-600 psi) compared to 1000-
1100 psi, 1200-1300 psi, and 2400-2500 psi back pressure in the Novapak, Gemini long,
and Gemini short columns, respectively. The low backpressure is an important
consideration in the life of a HPLC pump.
The unidentified peaks may be isomers of chlorogenic acid, which need further
confirmation. No standards were available for the isomers of chlorogenic acid.
Method Validation
Recovery and precision studies were done for both Gemini columns. Sweetpotato
samples were spiked with known amounts of each individual phenolic acid and subjected
to the entire extraction procedure. Recoveries for individual phenolic acids ranged from
97% to 102% (Tables 2.3 and 2.4). Precision or repeatability of retention times and peak
areas from five standards was calculated using percent relative standard deviation (%
RSD) and is presented in Tables 2.3 and 2.4. Relative standard deviation of retention
Table 2.3. Analytical characteristics and method validation data for HPLC using a Gemini 5 µm, 4.6 × 250 mm column. Phenolic Acid Linearity
range (µg/ml)
r2 Detection limit
(µg/ml)
RSD % (Retention
time)
RSD % (Peak area)
Recovery (%)
Chlorogenic 0.1-100 1 0.01 0.12 1.55 101 Caffeic 0.1-50 0.99 0.01 0.11 1.94 102 4,5-diCQA 0.1-100 1 0.01 0.11 1.81 99 3,5-diCQA 0.1-100 1 0.01 0.12 2.13 103 3,4-dCQA 0.1-100 1 0.05 0.10 1.72 98 r2: coefficient of correlation, RSD %: percent relative standard deviation.
25

Table 2.4. Analytical characteristics and method validation data for HPLC using a Gemini 3 µm, 4.6 × 150 mm column. Phenolic Acid Linear
range (µg/ml)
r2 Detection limit
(µg/ml)
RSD % (Retention
time)
RSD % (Peak Area)
Recovery (%)
Chlorogenic 0.1-100 1 0.01 0.12 0.94 101 Caffeic 0.1-50 0.99 0.01 0.16 2.93 98 4,5-diCQA 0.1-100 1 0.05 0.29 3.12 100 3,5-diCQA 0.1-100 1 0.05 0.33 1.29 99 3,4-dCQA 0.1-100 1 0.05 0.36 2.84 99 r2: coefficient of correlation, RSD %: percent relative standard deviation. times was less than 0.4% and that of peak areas ranged from 0.94 to 3.12%. Linearity of
the detector response and limits of detection were tested using different concentrations of
each phenolic acid standard. The results are summarized in Tables 2.3 and 2.4.
REFERENCES
Appel, H.M., H.L. Governor, M.D. Ascenzo, E. Siska, and J.C. Schultz. 2001. Limitations of Folin assays of foliar phenolics in ecological studies. J Chem Ecol. 27: 761-778.
Careri, M., C. Corradini, L. Elviri, I. Nicoletti, and I. Zagnoni. 2003. Direct HPLC analysis of quercetin and trans-resveratrol in red wine, grape, and winemaking byproducts. J Agric Food Chem. 51: 5226-5231.
Cevallos-Casals, B.A. and L. Cisneros-Zevallos. 2003. Stoichiometric and kinetic studies of phenolic antioxidants from Andean purple corn and red fleshed-sweetpotato. J Agric Food Chem. 51: 3313-3319.
Escarpa, A. and M.C. Gonzalez. 2001. Approach to the content of total extractable phenolic compounds from different food samples by comparison of chromatographic and spectrophotometric methods. Anal Chim Acta. 427: 119-127.
Hayase, F. and H. Kato. 1984. Antioxidative components of sweetpotatoes. J Nutr Sci Vitaminol. 30: 37-46.
Oki, T., M. Masuda, S. Furuta, Y. Nishiba, N. Terahara, and I. Suda. 2002. Involvement of anthocyanins and other phenolic compound in radical-scavenging activity of purple-fleshed sweetpotato cultivars. J Food Sci. 67: 1752-1756.
Robards, K. 2003. Strategies for the determination of bioactive phenols in plants, fruit and vegetables. J Chromatogr. A. 1000: 657-691.
26

Sahidi, F. and M. Naczk. 2003. Methods of Analysis and Quantification of Phenolic Compounds. In “Phenolics in food and nutraceuticals”, 2nd edition; CRC Press: Boca Raton, FL, pp 490.
Silla, E., A. Arnau, and I. Tunon. 2001. Solvent effects on chemical systems. In “Handbook of solvents”, Wypych G. (ed.); ChemTec Publishing: Toronto, Ontario, pp 15-16.
Singleton, V.L. and J.A. Rossi. 1965. Colorimetry of total phenolics with phosphomolybdic-phosphotungstic acid. Am J Enol Vitic. 16: 155-158.
Singleton, V.L., R. Orthofer, and R.M. Lamuela-Raventos. 1999. Analysis of total phenols and other oxidation substrates and antioxidants by means of Folin-Ciocalteu reagent. Methods Enzymol. 299: 152-178.
Son, K.C., R.F. Severson, M.E. Snook, and S.J. Kays. 1991. Root carbohydrates, organic acids, and phenolic chemistry in relation to sweetpotato weevil resistant. HortScience 26: 1305-1308.
Swain, T. and W.E. Hillis. 1959. The phenolic constituents of Prunus domestica. I. The quantitative analysis of phenolic constituents. J Sci Food Agric. 10: 63-68.
Tsao, R. and R. Yang. 2003. Optimization of a new mobile phase to know the complex and real polyphenolic composition: towards a total phenolic index using high-performance liquid chromatography. J Chromatogr. A. 1018: 29-40.
Walter, W.M. and A.E. Purcell. 1979. Evaluation of several methods for analysis of sweet potato phenolics. J Agric Food Chem. 27: 942-946.
Walter, W.M. and W.E. Schadel. 1981. Distribution of phenols in ‘Jewel’ sweet potato [Ipomoea batatas (L.) Lam.] roots. J Agric Food Chem. 29: 904-906.
Walter, W.M., A.E. Purcell, and G.K. McCollum. 1979. Use of high-pressure liquid chromatography for analysis of sweet potato phenolics. J Agric Food Chem. 27: 938-941.
Yoshimoto, M., R. Kurata-Azuma, M. Fujii, D. Hou, K. Ikeda, T. Yoshidome, and M Osako. 2004. Phenolic composition and radical scavenging activity of sweetpotato-derived Shochu distillery by-products treated with koji. Biosci Biotechnol Biochem. 68: 2477-2483.
Ziakova, A. and E. Brandsteterova. 2003. Validation of HPLC determination of phenolic acids presents in some Laminaceae family plants. J Liq Chromatogr Relat Technol. 26: 443-453.
27
CHAPTER 3. ANTIOXIDANT ACTIVITY AND PHENOLIC COMPOSITION CHANGES IN SWEETPOTATO ROOT AND LEAF
TISSUE AT DIFFERENT GROWTH STAGES
INTRODUCTION
Numerous epidemiological and biomedical studies indicated the consumption of
fruits and vegetables may help to protect the human body against many chronic diseases
such as diabetes, cancer and cardiovascular ailments (Ames et al., 1993; Scalbert et al.,
2005). This may be due to various naturally occurring nutraceutical compounds present
in fresh produce. Phenolics are one class of naturally occurring bioactive compounds
present in many fruits and vegetables with nutraceutical properties. Phenolic compounds
are antioxidants known to function as singlet and triplet oxygen quenchers and can also
scavenge other free radicals. The antioxidant properties of phenolic compounds have
been implicated in suppressing various health related disorders, including skin cancer in
mice (Kaul and Khanduja, 1998), hepatoma invasion (Yagasaki et al., 2000), and human
immunodeficiency virus (HIV) replication (Mahmood et al., 1993; Zhu et al., 1999). The
phenolic acids such as chlorogenic acid (ChlA); 3,5-dicaffeoylquinic acid (3,5-diCQA);
3,4-dicaffeoylquinic acid (3,4-diCQA); and 4,5-dicaffeoylquinic acid (4,5-diCQA)
extracted from steamed sweetpotato suppressed melanogenesis in mice (Shimozono et al.,
1996). The chemopreventive properties of extract from baked sweetpotato have been
reported recently (Rabah et al., 2004).
The sweetpotato [Ipomoea batatas (L.) Lam.] root is a major staple food widely
consumed in developing countries and ranks as the seventh most important food crop in
the world (FAOSTAT, 2005). Also, sweetpotato leaves are consumed as a leafy
vegetable in many parts of the world (Villareal et al., 1982). Unlike most other
28
vegetables, sweetpotato leaves can be harvested many times during a season and have a
high yield (Islam et al., 2002). In some tropical regions of the world, sweetpotatoes can
be grown during the monsoon season and may be the only available green vegetable after
a flood or other natural disasters. Both sweetpotato roots and leaves are considered to be
rich sources of phenolic compounds (Walter et al., 1979; Islam et al., 2002). Antioxidant
activity, antimutagenicity, and free radical scavenging activity of both sweetpotato roots
and leaves has been well documented and reported to be higher than other plant materials
(Yoshimoto et al., 1999; Yoshimoto et al., 2002; Islam et al., 2003b; Huang et al., 2004).
However, these previous studies provided no information on phenolic composition and
antioxidant properties of sweetpotato leaves and root tissues at different growth stages.
Like other plants, the phenolic content and antioxidant activity of sweetpotato roots and
leaves may vary according to the stage of tissue development. A decrease in total
phenolic content and antioxidant activity was reported with increased potato tuber weight
(Reyes et al., 2004). The objective of this study was to determine the effect of growth
stage on phenolic composition and antioxidant activity of sweetpotato root and leaf
tissue.
MATERIALS AND METHODS Reagents
Chlorogenic and caffeic acid standards and Folin-Denis reagent were purchased
from Sigma-Aldrich (St. Louis, MO). Standards of three isomers (4,5-dicaffeoylquinic
acid; 3,5-dicaffeoylquinic acid; and 3,4-dicaffeoylquinic acid) of isochlorogenic acid
were kindly provided by Dr. Makoto Yoshimoto (Department of Upland Farming,
Kyushu National Agricultural Experiment Station, Miyakonojo, Miyazaki, Japan).
29

Plant Material
Sweetpotatoes [Ipomoea batatas (L.) Lam.] cv. ‘Beauregard’ were obtained from
plants grown under commercial conditions at the Burden Research Center, Baton Rouge,
LA, in the 2005 growing season. Roots were harvested approximately after four months
of planting and grouped into 4 different growth stages: I to IV, depending on root weight
and size (Table 3.1). Five sound roots from each growth stage were selected for analysis.
For leaf analysis, healthy leaf blades were obtained from sweetpotato vines at three
different locations: young unfolded leaves from the top of the vine, fully expanded
mature leaves from the middle part of the vine, and oldest but fully green leaves near the
lower part of the vine. Petioles separated from the old leaves were also analyzed.
Table 3.1. Mean values of weight and size (diameter) of five sweetpotato roots at different growth stages. Growth stage Weight (g) Diameter (cm) I 4 1.2 II 26 2.6 III 70 3.8 IV 263 6.1 Tissue Preparation
The selected roots were washed and dried at ambient temperature before tissue
preparation. The outer periderm layer was gently removed and the retained inner portion
was separated into two tissue types: 1) cortex (the tissue external to the cambium layer)
and 2) pith (the tissue internal to the cortex). Both root tissue and leaf tissue were
immediately frozen at -45 °C, lyophilized, and powdered for further extraction.
Tissue Extraction
Exactly 0.5 g of lyophilized tissue (root or leaf) was placed in a 15 ml Falcon
centrifuge tube. Approximately 8 ml of 80% methanol was added to the centrifuge tube.
30

The tubes were capped and immersed in a water bath at 80 °C for 10 minutes. After
vigorously shaking the heated samples manually for 30 seconds, the tubes were cooled
and centrifuged at 4,500 g for 15 minutes. The clear supernatant was decanted and
brought to a final volume of 10 ml and analyzed for total phenolic content, individual
phenolic acids content, and antioxidant activity.
Total Phenolics
Total phenolic content was determined by modification of the Folin-Denis method
(Swain and Hillis, 1959). Exactly 0.5 ml of supernatant was placed in a 25 ml test tube
and mixed with 8 ml of Megapure water (Barnstead MP-12A, Haverhill, MA) followed
by the addition of 0.5 ml of Folin-Denis reagent. After 3 minutes, 1 ml of 1 N Na2CO3
was added and the solution was allowed to stand for 2 hours at ambient temperature (~22
°C). Absorbance of the resulting blue complex was measured at 750 nm using a Lambda
35 UV/Vis spectrophotometer (PerkinElmer Instruments, Norwalk, CT). A standard
curve of chlorogenic acid (50-300 µg/ml concentration) was plotted. The total phenolic
content was expressed as mg ChlA equivalent/g dry weight.
Antioxidant Activity
The antioxidant activity was measured according to method developed by Brand-
Williams et al. (1995), with slight modifications. DPPH (1, 1-diphenyl-2-picrylhydazyl)
was used as the source of free radicals. The absorbance of free radicals at 520 nm
disappears upon their reduction by an antioxidant. In this study, Trolox (6-hydroxy-2, 5,
7, 8-tetramethyl-chroman-2-carboxylic acid) was used as the standard antioxidant
compound. An aliquot (300 μl) of sweetpotato extract was placed in a 1.5 ml amber
colored centrifuge tube. Then 600 μl of 0.1M 2-(N-morpholine) ethanesulfonic acid
31

(MES) (pH 6.0) and 300 μl of 0.4 mM of DPPH solution were added to the centrifuge
tube. The resultant mixture was shaken and held in the dark for 2 minutes. The decrease
in DPPH absorbance was measured at 520 nm using a Lambda 35 UV/Vis
spectrophotometer (PerkinElmer Instruments, Norwalk, CT). The sweetpotato extract
was replaced with 80% methanol in the control sample. A solution of 80% methanol
without DPPH was used as blank. The antioxidant activity was calculated from a standard
curve made with known concentrations of Trolox and expressed in terms of mg Trolox
equivalent/g dry weight.
Individual Phenolic Acids
Separation of individual phenolic acids was accomplished using reversed-phase
HPLC with a Gemini C18, 5 µm, 4.6 × 250mm column (Phenomenex, Torrance, CA). An
aliquot of the supernatant was filtered through a 0.45 µm Nylaflo membrane filter (Pall
Corp., East Hills, NY). A sample volume of 20 µl was injected onto the column using a
Waters 717 autosampler connected to a Waters 600E pump (Waters Corp., Milford, MA).
Phenolic acids were eluted using a mobile phase consisting 1% (v/v) formic acid in
aqueous solution: acetonitrile: 2-propanol (70:22:8), pH 2.5, with an isocratic flow rate of
0.75 ml/min. Peaks detected were identified and quantified by comparing the retention
time and peak area to that of known standards. Quantification was based on absorbance at
320 nm using a Waters 2487 dual wavelength UV absorbance detector.
Statistical Analysis
A completely randomized design was used with five replications. Each root was
considered a replication. Data was analyzed by SAS procedure MIXED (SAS Institute
Inc., Cary, NC). Analysis of variance using procedure was performed and significance of
32

differences between means were determined by Tukey’s test (p<0.05). A Pearson
correlation was used to determine the relationship between total phenolics content and
antioxidant activity.
RESULTS AND DISCUSSION
Total Phenolics
The small roots at growth stage I had a significantly higher (P<0.05) total
phenolic content (10.3 mg/g dry weight in cortex and 9.0 mg/g dry weight in pith) than
fully developed roots at stage IV (Figure 3.1). Total phenolic content decreased in root
tissue as they continued to enlarge. A decrease in concentration of total phenolic content
with development of potato tuber was attributed to a dilution effect due to increase in
bbcb
a
ddcd
a
0
2
4
6
8
10
12
Stage I Stage II Stage III Stage IV
Growth stage
Cortex Pith
Tota
l phe
nolic
s*
(mg/
g dr
y w
eigh
t)
Figure 3.1. Total phenolics in sweetpotato root tissues at different growth stages. Means with different letters are significantly different at P<0.05 (Tukey’s test).*Data expressed as mg of chlorogenic acid equivalents per g of dry weight. tuber weight (Reyes et al., 2004). It has been speculated that young roots may have high
auxin level facilitating accumulation of more phenolic compounds (Liu et al., 1996). As
33
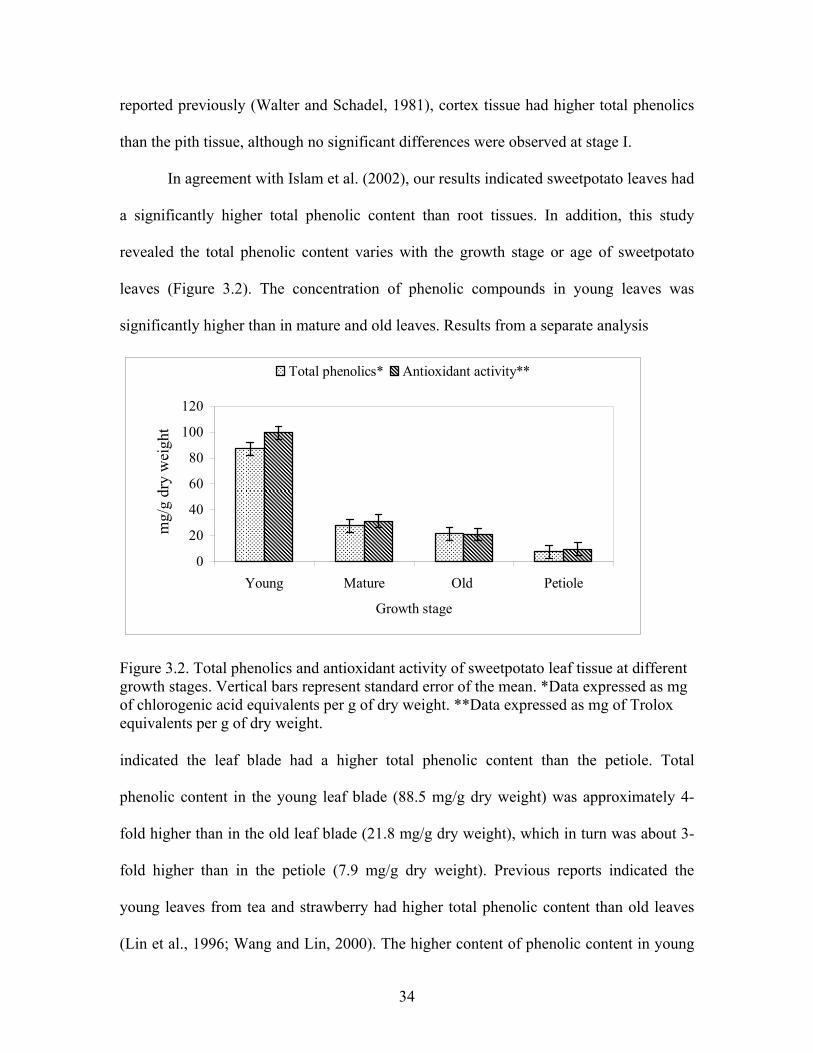
reported previously (Walter and Schadel, 1981), cortex tissue had higher total phenolics
than the pith tissue, although no significant differences were observed at stage I.
In agreement with Islam et al. (2002), our results indicated sweetpotato leaves had
a significantly higher total phenolic content than root tissues. In addition, this study
revealed the total phenolic content varies with the growth stage or age of sweetpotato
leaves (Figure 3.2). The concentration of phenolic compounds in young leaves was
significantly higher than in mature and old leaves. Results from a separate analysis
0
20
40
60
80
100
120
Young Mature Old Petiole
Growth stage
Total phenolics* Antioxidant activity**
mg/
g dr
y w
eigh
t
Figure 3.2. Total phenolics and antioxidant activity of sweetpotato leaf tissue at different growth stages. Vertical bars represent standard error of the mean. *Data expressed as mg of chlorogenic acid equivalents per g of dry weight. **Data expressed as mg of Trolox equivalents per g of dry weight.
indicated the leaf blade had a higher total phenolic content than the petiole. Total
phenolic content in the young leaf blade (88.5 mg/g dry weight) was approximately 4-
fold higher than in the old leaf blade (21.8 mg/g dry weight), which in turn was about 3-
fold higher than in the petiole (7.9 mg/g dry weight). Previous reports indicated the
young leaves from tea and strawberry had higher total phenolic content than old leaves
(Lin et al., 1996; Wang and Lin, 2000). The higher content of phenolic content in young
34

tissue may be due to higher auxin levels. Studies on other crops indicated the phenolic
compounds regulate auxin transport and accumulate in tissues with high auxin production
(Faivre-Rampant et al., 2000).
Antioxidant Activity
The changes in antioxidant activity of developing root and leaf tissues of
sweetpotato paralleled that of total phenolic content. Roots at growth stage I had
significantly higher antioxidant activity (9.7 mg/g dry weight in cortex and 9.2 mg/g dry
weight in pith) than roots in the other three stages (Figure 3.3). Similar to the total
phenolic content, the antioxidant activity of sweetpotato roots decreased with the increase
in root size. Cortex tissue always had higher antioxidant activity than the pith tissue,
bcbb
a
dcdbc
a
0
2
4
6
8
10
12
Stage I Stage II Stage III Stage IV
Grwoth stage
Cortex Pith
Ant
ioxi
dant
act
ivity
* (m
g/g
dry
wei
ght)
Figure 3.3. Antioxidant activity in sweetpotato root tissues at different growth stages. Means with different letters are significantly different at P<0.05 (Tukey’s test).*Data expressed as mg of Trolox equivalents per g of dry weight. although no significant difference was found at stage I and II. The pith tissue of fully
developed roots at stage IV had the lowest antioxidant activity (1.2 mg/g dry weight).
35

Wang and Lin (2000) reported the small green stage in a developing strawberry fruit had
the highest antioxidant activity.
The antioxidant activity of sweetpotato leaves was significantly higher than the
root tissues. The highest antioxidant activity (99.6 mg/g dry weight) found in young
leaves was almost 10 times higher than the highest root tissue antioxidant activity (9.7
mg/g dry weight in cortex tissue of roots at stage I). The antioxidant activity of
sweetpotato leaves was also significantly affected by leaf age. Antioxidant activity of
immature young leaves (99.6 mg/g dry weight) was significantly higher than mature
(31.1 mg/g dry weight) and old leaves (21.0 mg/g dry weight) (Figure 3.2). Concomitant
with the lowest total phenolic content, the petiole also had the lowest antioxidant activity
(9.6 mg/g dry weight). Wang and Lin (2000) also reported the young leaves from berry
crops had higher antioxidant activity than older leaves.
The correlation coefficients (r2) between antioxidant activity and total phenolic
content of root and leaf tissue at different growth stages were 0.979 and 0.998,
respectively. Strong correlation coefficients indicate that antioxidant activity of
sweetpotato root and leaf tissue increases with increased total phenolic content.
Previously, Islam et al. (2003a) reported a positive correlation between antioxidant
activity and total phenolic content in sweetpotato leaves.
Individual Phenolic Acids
Typical HPLC chromatograms from sweetpotato roots (stage I) and old leaves are
shown in Figure 3.4. Five different individual phenolic acids (ChlA; CafA; 4,5-diCQA;
3,5-diCQA; 3,4-diCQA) were identified in both sweetpotato root and leaf tissues. As
indicated in previous reports, the unknown peaks were assumed to be isomers of
36

chlorogenic acid and 3,4,5-tricaffeoylquinic acid but need further confirmation (Islam et
al. 2002; Walter et al. 1979). Results for individual phenolic acids content in sweetpotato
roots and leaves at different growth stages are summarized in Tables 3.2 and 3.3.
Chlorogenic acid was the most abundant phenolic acid in root tissue, followed by 3,5-
diCQA. The trend of change in individual phenolic acids paralleled the total phenolic
content. Islam et al. (2003b) reported a positive correlation between caffeoylquinic acid
Abs
orba
nce
units
Time (minutes)
4,5-
diC
QA
Chl
A
Caf
A
3,5-
diC
QA
3,4-
diC
QA
Young leaf tissue Cortex tissue (stage I)
Figure 3.4. Comparison of HPLC chromatograms for individual phenolic acids isolated from young leaf tissue and cortex tissue (stage I). ChlA: chlorogenic acid; CafA: caffeic acid; 4,5-diCQA: 4,5-dicaffeoylquinic acid; 3,5-diCQA: 3,5-dicaffeoylquinic acid; 3,4-diCQA: 3,4-dicaffeoylquinic acid. derivatives and total phenolic content of sweetpotato leaves. In general, roots in the initial
stages of development had higher amounts of individual phenolic acids, which decreased
with increasing root size. The amounts of all identified individual phenolic acids, except
4,5-diCQA and 3,4-diCQA, were significantly higher in roots at stage I compared to
stage IV. Both cortex and pith tissue at stage I had significantly higher amounts of caffeic
acid than the other stages of development. At all stages of development, cortex tissue had
37

higher amounts of individual phenolic acids (although not always significant) than the
pith tissue. A recent report indicated chlorogenic acid in young pear fruit was
significantly higher than in fully mature ripe fruit (Cui et al., 2005). Buta and Spaudling
(1997) reported the decline in chlorogenic acid content during growth and development
of tomato fruit paralleled the decline in indole-3-acetic acid level.
Table 3.2. Individual phenolic acid content in sweetpotato root tissues at different growth stages.
ChlA CafA 4,5-diCQA 3,5-diCQA 3,4-diCQA Growth stage Tissue Type (mg/100 g dry weight) Cortex 164.2a 2.7a 72.1a 157.6a 10.4ab Stage I Pith 141.9ab 2.3a 69.3ab 136.0a 27.7a Cortex 98.9bc 0.5b 27.9bc 62.9b 6.0b Stage II Pith 54.6cd 0.4b 14.6bc 28.6bcd 4.9ab Cortex 87.8c 0.6b 17.3c 59.7bc 6.8b Stage III Pith 38.4d 0.4b 7.6bc 20.4cd 3.4ab Cortex 89.4c 0.6b 21.9bc 53.4bc 6.7b Stage IV Pith 34.4d 0.3b 5.8bc 14.3d 2.3b
ChlA:chlorogenic acid; CafA:caffeic acid; 4,5-diCQA:4,5-dicaffeoylquinic acid; 3,5-diCQA:3,5-dicaffeoylquinic acid; 3,4-dicaffeoylquinic acid. Mean values (n=5) with same letters in the same column are not significantly different at P<0.05 (Tukey’s test). Table 3.3. Individual phenolic acid content in sweetpotato leaf tissues at different growth stages.
ChlA CafA 4,5-diCQA 3,5-diCQA 3,4-diCQA Growth stage (mg/100 g dry weight)
Young 632.0a 120.2a 140.9bc 2998.7a 2890.8a Mature 444.9b 16.3b 319.3a 354.8b 342.3b Old 300.1c 8.4b 209.3b 112.6c 139.6c Petiole 114.8d 2.7b 103.6c 114.0c 54.0c ChlA:chlorogenic acid; CafA:caffeic acid; 4,5-diCQA:4,5-dicaffeoylquinic acid; 3,5-diCQA:3,5-dicaffeoylquinic acid; 3,4-dicaffeoylquinic acid. Mean values (n=5) with same letters in the same column are not significantly different at P<0.05 (Tukey’s test).
Individual phenolic acid content in sweetpotato leaves was significantly higher
than in root tissue, which was consistent with a previous report (Islam et al., 2002). Our
results also indicated the leaf phenolic acid profile varied according to the leaf age. In
general, young leaves had higher amounts of individual phenolic acids than mature and
38

old leaves, except 4,5-diCQA, which was significantly lower in young leaves than mature
and old leaves. Petiole tissue had lower amounts of phenolic acids than leaf blade. The
most abundant phenolic acid in young leaves was 3,5-diCQA, whereas ChlA was the
major phenolic acid in mature and old leaves. Previously, the 3,5-diCQA had been
reported as the most abundant phenolic acid in sweetpotato leaves (Islam et al., 2002).
This inconsistency in results may be due to genotype differences or age of leaves used for
analysis. Considering the high antioxidant properties of caffeoylquinic acids,
consumption of young sweetpotato leaves may be more beneficial than mature and old
leaves.
CONCLUSIONS
This study may have useful implications for the functional food industry. Results
indicated that immature root and leaf tissues may be potentially used as concentrated
sources of nutarceutical compounds. Consumption of functional foods originating from
immature sweetpotato root and leaf tissues high in phenolic content may have significant
positive health benefits. Also, these tissues may be potentially concentrated sources of
caffeoylquinic acids, useful to the pharmaceutical industry. Further research to elucidate
the mechanisms involved in higher phenolic synthesis in immature tissues would be
useful to enhance the nutraceutical value of sweetpotatoes.
REFERENCES
FAOSTAT, 2005. Food and Agricultural Statistical Database. Available from: http://faostat.fao.org. Accessed Feb 15.
Ames, B.M., M.K. Shigena, and T.M. Hagen. 1993. Oxidants, antioxidants and the degenerative diseases of aging. Proc Natl Acad Sci. 90: 7915-7922.
Brand-Williams, W., M.E. Cuvelier, and C. Berset. 1995. Use of free radical method to evaluate antioxidant activity. Lebensm Wiss Technol. 28: 25-30.
39

Buta, J.G. and D.W. Spaulding. 1997. Endogenous levels of phenolics in tomato fruit during growth and maturation. J Plant Growth Regul. 16: 43-46.
Cui, T., K. Nakamura, L. Ma, J.Z. Li, and H. Kayahara. 2005. Analyses of arbutin and chlorogenic acid, the major phenolic constituents in oriental pear. J Agric Food Chem. 53: 3882-3887.
Faiver-Rampant, O., C. Kevers, and T. Gasper. 2000. IAA-oxidase activity and auxin protectors in nonrooting, rac, mutant shoots of tobacco in vitro. Plant Sci. 153: 73-80.
Huang, D.J., C.D. Lin, H.J. Chen, and Y.H. Lin. 2004. Antioxidant and antiproliferative activities of sweet potato [Ipomoea batatas (L.) Lam ‘Tainong 57’] constituents. Bot Bull Acad Sin. 45: 179-186.
Islam, M.S., M. Yoshimoto, K. Ishiguro, S. Okuno, and O. Yamakawa. 2003a. Effect of artificial shading and temperature on radical scavenging activity and polyphenolic composition in sweetpotato (Ipomoea batatas L.) leaves. J Am Soc Hort Sci. 128: 182-187.
Islam M.S., M. Yoshimoto, and O. Yamakawa. 2003b. Distribution and physiological functions of caffeoylquinic acid derivatives in leaves of sweetpotato genotypes. J Food Sci. 68: 111-116.
Islam, M.S., M. Yoshimoto, S. Yahara, S. Okuno, K. Ishiguro, and O. Yamakawa. 2002. Identification and charachterization of foliar polyphenolic composition in sweetpotato (Ipomoea batatas L.) genotypes. J Agric Food Chem. 50: 3718-3722.
Kaul, A. and K.L. Khanduja. 1998. Polyphenols inhibit promotional phase of tumeriogenesis: relevance of superoxide radicals. Nutr Cancer. 32: 81-85.
Lin, Y.L., I.M. Juan, Y.L. Chen, Y.C. Liang, and J.K. Lin. 1996. Composition of polyphenols in fresh tea leaves and associations of their oxygen-radical-absorbing capacity with antiproliferative actions in fibroblast cells. J Agric Food Chem. 44: 1387-1394.
Mahmood, N., P.S. Moore, N. De Tommasi, F. De Simone, S. Coiman, A.J. Hay, and C. Pizza. 1993. Inhibition of HIV infection by caffeoylquinic acid derivatives. Antiviral Chem Chemother. 4: 235-240.
Rabah, I.O., D.X. Hou, S.I. Komine, and M. Fujii. 2004. Potential chemopreventive properties of extract from baked sweet potato (Ipomoea batatas Lam. cv. Koganesengan). J Agric Food Chem. 52: 7152-7157.
40

Reyes, L.F., J.C. Miller, and L. Cisneros-Zevallos. 2004. Environmental conditions influence the content and yield of anthocyanins and total phenolics in purple- and red-flesh potatoes during tuber development. Am J Pot Res. 81: 187-193.
Scalbert, A., C. Manach, C. Morand, C. Remesy, and L. Jimenez. 2005. Dietary polyphenols and the prevention of diseases. Crit Rev Food Sci Nutr. 45: 287-306.
Shimozono, H., M. Kobori, H. Shinmoto, and T. Tsushida. 1996. Suppression of the melanogenesis of mouse melanoma B16 cells by sweet potato extract. J Jap Soc Food Sci Tech. 43: 313-317.
Swain, T., and W.E. Hillis. 1959. The phenolic constituents of Prunus domestica. I. The quantitative analysis of phenolic constituents. J Sci Food Agri. 10: 63-68.
Villareal, R.L., S.C. Tsou, , H.F. Lo, and S.C. Chiu 1982. Sweetpotato tips as vegetables. In Sweetpotato: Proceedings of the First International Symposium; Villareal R.L., Griggs T.D. (Eds.), AVRDC: Shanhua, Taiwan, pp 313-320.
Walter, W.M., A.E. Purcell, and G.K. McCollum. 1979. Use of high-pressure liquid chromatography for analysis of sweet potato phenolics. J Agric Food Chem. 27: 938-941.
Walter, W.M. and W.E Schadel. 1981. Distribution of phenols in ‘Jewel’ sweet potato [Ipomoea batatas (L.) Lam.] roots. J Agric Food Chem. 29: 904-906.
Wang, S.Y. and H.S. Lin. 2000. Antioxidant activity in fruits and leaves of blackberry, raspberry, and strawberry varies with cultivar and developmental stage. J Agric Food Chem. 48: 140-146.
Yagasaki, K., Y. Miura, R. Okauchi, and T. Furuse 2000. Inhibitory effects of chlorogenic acid and its related compounds on invasion of hepatoma cells in culture. Cytotechnology. 33: 229-235.
Yoshimoto, M., S. Okuno, M. Yashinaga, O. Yamakawa, M. Yamaguchi, and J. Yamada. 1999. Antimutagenicity of sweetpotato (Ipomoea batatas) roots. Biosci Biotechnol Biochem. 63: 537-541.
Yoshimoto, M., S. Yahara, S. Okuno, M.S. Islam, K. Ishiguro, and O. Yamakawa. 2002. Antimutagenicity of mono-, di-, and tricaffeoylquinic acid derivatives isolated from sweetpotato (Ipomoea batatas L.) leaf. Biosci Biotechnol Biochem. 66: 2336-2341.
Zhu, K., M.L. Cordeiro, J. Atienza, W.E. Robinson, and S.A. Chow. 1999. Irreversible inhibition of human immunodeficiency virus type 1 integrase by dicaffeoylquinic acids. J Virol. 73: 3309–3316.
41

CHAPTER 4. PHENOLIC ACID COMPOSITION AND ANTIOXIDANT ACTIVITY OF PROCESSED SWEETPOTATOES
INTRODUCTION
Sweetpotato [Ipomoea batatas (L.) Lam.] is a major food crop in developing
countries with a total world production of approximately 130 million tons (FAOSTAT
2005). It ranks as the world’s seventh most important food crop. Phenolic compounds are
important secondary metabolites present in sweetpotatoes. Their antioxidant properties
have been implicated in suppressing various health related disorders, including
melanogenesis (Shimozono et al., 1996), hepatoma invasion (Yagasaki et al., 2000), and
human immunodeficiency virus (HIV) replication (Mahmood et al., 1993; Zhu et al.,
1999). The antioxidant potential of phenolic compounds in sweetpotato root tissue has
been evaluated and reported to be higher than in many vegetables (Yamakawa and
Yoshimoto, 2002; Cevallos-Casalas and Cisneros-Zevallos, 2002).
Sweetpotato phenolics were first isolated by Rudkin and Nelson (1947), who
identified chlorogenic acid as the major phenolic acid in the root tissue. Chlorogenic acid,
caffeic acid, and isomers of dicaffeoylquinic acid were identified as the main phenolic
acids in several different sweetpotato cultivars (Walter and Schadel, 1981; Son et al.,
1991). These individual acids have been reported to possess a strong antimutagenic and
antioxidative activity against free radicals (Yamada and Tomita, 1996; Yoshimoto et al.,
1999). Recently, the antioxidant activity of several sweetpotato cultivars was found to be
highly correlated with the phenolic acids such as chlorogenic acid and isochlorogenic
acid (Oki et al., 2002; Huang et al., 2004).
Although the sweetpotato may be considered as a rich source of these antioxidant
compounds, distribution of phenolics in the root varies depending on tissue location and
42

type such as periderm (outer skin), cambium layer, and inner pith tissue. Antioxidant
activity and total phenolic compounds in sweetpotato skin tissue were found to be higher
than in internal root tissue (Walter and Schadel, 1981; Cevallos-Casalas and Cisneros-
Zevallos, 2002; Truong et al., 2004). Harrison et al. (2003) reported much lower levels of
caffeic acid in cortex tissue as compared to periderm tissue. The high phenolic content in
skin tissue may have implications in utilization of waste peelings from processed
sweetpotatoes.
In addition to tissue level differences, processing conditions may affect the
phenolic content in the edible product. Microwaving, conventional oven baking, and
boiling are the most widely used methods of sweetpotato processing at home and in food-
service establishments. Phenolic compounds were found to be destroyed during heating
(Philpott et al., 2003). The loss of chlorogenic acid during heating of potato has also been
reported (Dao and Friedman, 1992). Caffeic acid derivatives in potato were reported to be
better retained by steam cooking compared to other cooking methods (Tudela et al.,
2002). Total phenolic content and individual phenolic acid composition of raw
sweetpotato roots has been previously reported. However, in most parts of the world,
sweetpotato is consumed after some type of cooking method. Little information is
available on the changes in phenolic composition and antioxidant activity of
sweetpotatoes during processing. The objective of this study was to determine the effect
of processing method on phenolic content and antioxidant activity in sweetpotato tissue.
43

MATERIALS AND METHODS
Reagents
Chlorogenic and caffeic acid standards, Folin-Denis reagent, and DPPH (1, 1-
diphenyl-2-picrylhydazyl) reagent were purchased from Sigma-Aldrich (St. Louis, MO).
Standards of three isomers (4,5-dicaffeoylquinic acid; 3,5-dicaffeoylquinic acid; and 3,4-
dicaffeoylquinic acid) of isochlorogenic acid were kindly provided by Dr. Makoto
Yoshimoto (Department of Upland Farming, Kyushu National Agricultural Experiment
Station, Miyakonojo, Miyazaki, Japan).
Plant Material
‘Beauregard’ sweetpotato [Ipomoea batatas (L.) Lam.] roots were harvested in
early October, 2004 from the LSU AgCenter Sweetpotato Research Station in Chase, La.
They were immediately cured after harvest at 30 °C and 90% relative humidity for 7 days
and then stored at 15 °C until analyzed. Randomly selected sound roots, approximately
300 g in weight, were obtained from storage, washed, and allowed to dry at ambient
temperature (~21 °C).
Tissue Preparation and Extraction
Individual sweetpotato roots were cut in half longitudinally, followed by
transversely into four sections about 3-4 cm thick. One section was used for raw tissue
analysis and the remaining three sections were subjected to three heat processing
methods: (a) microwaving at 1500 Watts for 10 minutes; (b) baking in a conventional
oven at 190 °C for 45 minutes; (c) boiling at 100 °C in water for 25 minutes. Each section
was further divided into 3 tissue types: outer skin tissue, cortex, and central pith tissue.
Exactly 1 g of tissue was obtained from each tissue type by excision with a scalpel. The
44

tissue was put into a 15 ml Falcon tube and homogenized in 80% methanol using a
VirTishear homogenizer (Virtis Co., Gardiner, NY). Approximately 8 ml of 80%
methanol was added and the capped tubes were heated at 80 °C for 10 minutes. After
vigorously shaking the heated samples by hand, the tubes were cooled and centrifuged at
4,500 g for 15 minutes. The supernatant was decanted and volumes were adjusted to 10
ml prior to analyses of total phenolic content and individual phenolic acids.
Total Phenolics
Total phenolic content was determined by modification of the Folin-Denis method
(Swain and Hillis, 1959). Exactly 0.5 ml of supernatant was placed in a 25 ml test tube
and mixed with 8 ml of Megapure water (Barnstead MP-12A, Haverhill, MA) followed
by the addition of 0.5 ml of Folin-Denis reagent. After 3 minutes, 1 ml of 1 N Na2CO3
was added and the solution was allowed to stand for 2 hours at ambient temperature (~21
°C). Absorbance of the resulting blue complex was measured at 750 nm using a Lambda
35 UV/Vis spectrophotometer (PerkinElmer Instruments, Norwalk, CT). A standard
curve of chlorogenic acid (50-300 µg/ml concentration) was plotted. The total phenolic
content was expressed as mg chlorogenic acid equivalent/g dry weight.
Antioxidant Activity
The antioxidant activity was measured according to Brand-Williams et al. (1995),
with slight modifications. DPPH (1, 1-diphenyl-2-picrylhydazyl) was used as the source
of free radicals. The absorbance of free radicals at 520 nm disappears upon their
reduction by an antioxidant. In this study, Trolox (6-hydroxy-2, 5, 7, 8-tetramethyl-
chroman-2-carboxylic acid) was used as the standard antioxidant compound. An aliquot
(300 μl) of sweetpotato extract was placed in a 1.5 ml amber colored centrifuge tube.
45

Then 600 μl of 0.1 M MES [2-(N-morpholine) ethanesulfonic acid, pH 6.0] and 300 μl of
0.4 mM of DPPH solution were added to the centrifuge tube. The resultant mixture was
shaken and held in the dark for 2 minutes. The decrease in DPPH absorbance was
measured at 520 nm using a Lambda 35 UV/Vis spectrophotometer. The sweetpotato
extract was replaced with 80% methanol in the control samples. For the blank, 80%
methanol without DPPH was used. The antioxidant activity was calculated from a
standard curve made with known concentrations of Trolox and expressed in terms of mg
Trolox equivalent/g dry weight.
Individual Phenolic Acids
Separation of individual phenolic acids was accomplished using reversed-phase
HPLC with a Gemini C18, 5 µm, 4.6 × 250 mm (Phenomenex Inc., Torrance, CA)
column. An aliquot of the supernatant was filtered through a 0.45 µm Nylaflo membrane
filter (Pall Corp., East Hills, NY). Twenty µl of filtrate was injected onto the column
using a Waters 717 autosampler connected to a Waters 600E pump (Waters Corp.,
Milford, MA). Phenolic acids were eluted using a mobile phase consisting 1% (v/v)
formic acid in aqueous solution: acetonitrile: 2-propanol (70:22:8), pH 2.5, with an
isocratic flow rate of 0.75 ml/min. Peaks detected were identified and quantified by
comparing the retention time and peak area to that of known standards. Quantification
was based on absorbance at 320 nm using a Waters 2487 dual wavelength UV
absorbance detector.
Statistical Analysis
A completely randomized design was used with five replications per treatment.
Each root was considered a replication. Data was analyzed by SAS procedure MIXED
46

(SAS Institute Inc., Cary, NC). A Pearson correlation was used to determine the
relationship between total phenolic content and antioxidant activity of sweetpotato root
tissues.
RESULTS AND DISCUSSION
Total Phenolics
Total phenolic content was highest in the skin tissue (raw or processed) compared
to the other tissue types. The raw sweetpotato skin tissue had the highest total phenolic
content (17.7 mg/g dry weight) (Table 4.1). This was consistent with a previous report
with ‘Jewel’ sweetpotatoes (Walter and Schadel, 1981). However, our results indicated
Table 4.1. Total phenolics in raw and processed sweetpotato root tissues. Total phenolics* Treatment Skin Cortex Pith Raw 17.7a 3.7c 2.1c Microwaved 10.3b 3.0c 1.8c Boiled 11.0b 3.8c 1.6c Baked 7.9b 4.2c 2.1c Mean values (n=5) with same letters are not significantly different at P<0.05. *Data expressed as mg of chlorogenic acid equivalents per g of dry weight.
that thermal processing of the sweetpotato skin resulted in a significant loss of total
phenolic content. The lowest total phenolic content was observed in boiled pith tissue
(1.6 mg/g dry weight), although differences were not significant. Total phenolic content
in sweetpotato skin tissue was reduced by 42% after microwaving, 55% after
conventional oven baking, and 37% after boiling. Differences in total phenolic content
among the three processing methods were not significant. No significant loss of total
phenolic content was observed due to heat processing of cortex and pith tissue. Among
various potato processing methods, baking resulted in the greatest loss of chlorogenic
acid (Dao and Friedman, 1992). It is not known whether heat breaks down the phenolics
47

or whether they form larger macromolecules with other compounds present in the
sweetpotato tissue. Heating may disrupt the intra-cellular separation of the phenolic acids
and oxidative enzymes (polyphenoloxidases), resulting in degradation of the phenolic
acids.
Antioxidant Activity
The results presented in Table 4.2 indicated the antioxidant activity was highest in
raw skin tissue (22.9 mg/g dry weight). The conventional oven baked skin tissue had a
significantly lower antioxidant potential compared to microwaved or boiled tissue. This
may be due to the lower total phenolic content in conventional oven baked skin tissue. No
significant difference was detected in the antioxidant potential of microwaved and boiled
skin tissue. None of the processing treatments resulted in a significant loss of antioxidant
activity in cortex and pith tissue. Boiled pith tissue contained the lowest antioxidant
activity (1.7 mg/g dry weight), although no significant differences were observed.
Table 4.2. Antioxidant activity in raw and processed sweetpotato root tissues.
Antioxidant activity* Treatment Skin Cortex Pith Raw 22.9a 5.5c 2.3c Microwaved 13.7b 5.7c 1.9c Boiled 14.1b 4.3c 1.7c Baked 6.3c 3.8c 1.9c Mean values (n=5) with same letters are not significantly different at P<0.05. *Data expressed as mg of Trolox equivalents per g of dry weight.
Our results are consistent with the findings of Philpott et al. (2003) who reported
baking and boiling of sweetpotato skin tissue resulted in a higher reduction of antioxidant
activity than in raw skin tissue. This study indicated the pattern of change in antioxidant
activity of sweetpotato root tissue paralleled that of total phenolic content. A strong
48

correlation (r2=0.98) existed between total phenolic content and antioxidant activity
(Figure 4.1).
y = 1.3106x - 0.6283r2 = 0.9776
0
5
10
15
20
25
0 5 10 15 20
Ant
ioxi
dant
act
ivity
**
(mg/
g dr
y w
eigh
t)
Total phenolics* (mg/g dry weight)
Figure 4.1. Correlation between antioxidant activity and total phenolics in sweetpotato root tissues. *Data expressed as mg of chlorogenic acid equivalents per g of dry weight. **Data expressed as mg of Trolox equivalents per g of dry weight.
Individual Phenolic Acids
Chlorogenic acid, caffeic acid, and three isomers of the dicaffeoylquinic acids (3,
4-dicaffeoylquinic; 3,5-dicaffeoylquinic; and 4,5-dicaffeoylquinic acid) were identified
as the principal phenolic acids in sweetpotato root tissue. The results for individual
phenolic acid content in processed sweetpotato tissues presented in Tables 4.3-4.5. The
outer skin tissue (raw or processed) had the highest amount of individual phenolic acids
followed by the cortex tissue. The pith tissue had the lowest content of individual
phenolic acids.
Chlorogenic acid was the most abundant individual phenolic acid present in
sweetpotato root tissues, consistent with the previous finding of Walter et al. (1979). We
found that thermal processing resulted in significant loss of phenolic acids present in
49

sweetpotato skin tissue. Raw skin tissue was found to contain a significantly higher
amount (4.64 mg/g dry weight) of chlorogenic acid compared to microwaved (2.58 mg/g
dry weight), baked (1.34 mg/g dry weight) and boiled (1.60 mg/g dry weight) skin tissue
Table 4.3. Individual phenolic acid content in raw and processed sweetpotato skin tissue. ChlA CafA 4,5-diCQA 3,5-diCQA 3,4-diCQA Treatment
mg/g dry weight Raw 4.64a 0.91a 0.78a 1.78a 1.44a
Microwaved 2.58b 0.16b 0.66a 1.08b 1.02a
Boiled 1.60c 0.07b 0.68a 0.59b 1.48a
Baked 1.34c 0.08b 0.41b 0.41b 0.86a
Mean values (n=5) with same letters in a column are not significantly different at P<0.05. Table 4.4. Individual phenolic acid content in raw and processed sweetpotato cortex tissue.
ChlA CafA 4,5-diCQA 3,5-diCQA 3,4-diCQA Treatment mg/g dry weight
Raw 0.95a 0.02a 0.16a 0.57a 0.60a Microwaved 1.67a 0.07a 0.50a 0.53a 0.83a Boiled 0.71a 0.02a 0.24a 0.19a 0.50a Baked 0.76a 0.03a 0.23a 0.18a 0.47a Mean values (n=5) with same letters in a column are not significantly different at P<0.05. Table 4.5. Individual phenolic acid content in raw and processed sweetpotato pith tissue.
ChlA CafA 4,5-diCQA 3,5-diCQA 3,4-diCQA Treatment mg/g dry weight
Raw 0.46a 0.01a 0.04a 0.16a 0.21a Microwaved 0.34a 0.01a 0.06a 0.06a 0.13a Boiled 0.20a 0.01a 0.04a 0.03a 0.09a Baked 0.26a 0.01a 0.04a 0.03a 0.09a Mean values (n=5) with same letters in a column are not significantly different at P<0.05.
(Table 4.3). None of the heat processing methods had a significant effect on chlorogenic
acid content in the cortex or pith tissue (Tables 4.4 and 4.5). An unidentified peak eluted
immediately before chlorogenic acid and was assumed to be an isomer of chlorogenic
acid. The size of this unknown peak increased significantly after heat processing. A
decrease in chlorogenic acid and concomitant increase in the unknown isomer suggest
50

that heating might have caused conversion of some chlorogenic acid to this unknown
isomer.
Among all the individual phenolic acids identified, caffeic acid was present in the
lowest concentration, except in the skin tissue, where concentration of caffeic acid was
higher than 4,5-dicaffeoylquinic acid. The caffeic acid content of raw skin tissue (0.91
mg/g dry weight) was significantly higher than in the cortex (0.02 mg/g dry weight) and
pith tissue (0.01 mg/g dry weight). This is consistent with the results of Harrison and
others (2003), who reported the periderm and cortex tissue of ‘Beauregard’ sweetpotato
had an average caffeic acid content of 0.66 mg and 0.01 mg/g dry weight, respectively.
The higher level of caffeic acid in the skin tissue was thought to be a chemical defense
mechanism against fungal pathogens. Our results indicated a significant loss of caffeic
acid due to heat processing of skin tissue.
The average concentrations of the three isomers of dicaffeoylquinic acid in raw
sweetpotato skin tissue were: 3,5-diCQA (1.78 mg/g); 3,4-diCQA (1.44 mg/g); and 4,5-
diCQA (0.78 mg/g). Skin tissue had significantly higher amounts of dicaffeolquinic acids
than the other tissue types. No significant difference was observed among cortex and pith
tissue. Heat processing tended to decrease the content of dicaffeoylquinic acids. A
significant loss of 3,5-dicaffeoylquinic acid occurred in boiled or baked skin tissue.
Individual phenolic acids in cortex and pith tissues were less affected by the type of
processing.
CONCLUSIONS
Heat processing decreased the phenolic acid content and antioxidant activity of
sweetpotato root tissues. Conventional baking resulted in the greatest loss of total
51

phenolic content and antioxidant activity in skin tissue, although differences were not
signifcicant for total phenolic content. Sweetpotato skin tissue, processed or raw, had the
highest phenolic acid content and antioxidant potential among three tissue types.
Sweetpotato skin may be a potentially good source of nutraceutical compounds important
in reducing the incidence of certain human health-related illnesses.
REFERENCES
Brand-Williams, W., M.E. Cuvelier, and C. Berset. 1995. Use of free radical method to evaluate antioxidant activity. Lebensm Wiss Technol. 28: 25-30.
Cevallos-Casalas, B.A. and L.A. Cisneros-Zevallos. 2002. Bioactive and functional properties of purple sweetpotato (Ipomoea batatas (L.) Lam). Acta Hort. 583: 195-203.
Dao, L. and M. Friedman. 1992. Chlorogenic acid content of fresh and processed potatoes determined by ultraviolet spectrophotometry. J Agric Food Chem. 40: 2152-2158.
FAOSTAT, 2005. Food and Agricultural Statistical Database. Available from: http://faostat.fao.org. Accessed Feb 15.
Harrison, H.F., J.K. Peterson, M.E. Snook, J.R. Bohac, and D.M. Jackson. 2003. Quantity and potential biological activity of caffeic acid in sweet potato [Ipomoea batatas (L.) Lam.] storage root periderm. J Agric Food Chem. 51: 2843-2848.
Huang, D.J., C.D. Lin, H.J. Chen, and Y.H. Lin. 2004. Antioxidant and antiproliferative activities of sweet potato [Ipomoea batatas (L.) Lam ‘Tainong 57’] constituents. Bot Bull Acad Sin. 45: 179-186.
Mahmood, N., P.S. Moore, N. De Tommasi, F. De Simone, S. Coiman, A.J. Hay, and C. Pizza. 1993. Inhibition of HIV infection by caffeoylquinic acid derivatives. Antiviral Chem Chemother. 4: 235-240.
Oki, T., M. Masuda, S. Furuta, Y. Nishiba, N. Terahara, and I. Suda. 2002. Involvement of anthocyanins and other phenolic compounds in radical-scavenging activity of purple-fleshed sweet potato cultivars. J Food Sci. 67: 1752–1756.
Philpott, M., K.S. Gould, K.R. Markham, S.L. Lewthwaite, and L.R. Ferguson. 2003. Enhanced coloration reveals high antioxidant potential in new sweetpotato cultivars. J Sci Food Agric. 83: 1076-1082.
52

Rudkin, G.O. and J.M. Nelson. 1947. Chlorogenic acid and respiration in sweetpotato. J Am Soc Chem. 69: 1470-1475.
Shimozono, H., M. Kobori, H. Shinmoto, and T. Tsushida. 1996. Suppression of the melanogenesis of mouse melanoma B16 cells by sweet potato extract. J Jap Soc Food Sci Tech. 43: 313-317.
Son, K.C., R.F. Severson, M.E. Snook, and S.J. Kays. 1991. Root carbohydrate, organic acids and phenolic chemistry in relation to sweetpotato weevil resistance. HortScience. 26: 1305-1308.
Swain, T. and W.E. Hillis. 1959. The phenolic constituents of Prunus domestica. I. The quantitative analysis of phenolic constituents. J Sci Food Agric 10: 63-68.
Troung, V.D., R.L. Thompson, R.F. McFeeters, and M.M. Lanier. 2004. Phenolic compounds and antioxidant activity of commercial sweetpotato cultivars [abstract]. In: IFT Annual Meeting Book of Abstracts; June 22-26, 2004; New Orleans, La. Chicago III.: Inst. of Food Technologists. Abstract nr 49F-27.
Tudela, J.A., E. Cantos, J.C. Espin, F.A. Tomas-Barberan, and M.I. Gil. 2002. Induction of antioxidant flaonol biosynthesis in fresh-cut potatoes. Effect of domestic cooking. J Agric Food Chem. 50: 5925-5931.
Walter, W.M. and W.E. Schadel. 1981. Distribution of phenols in ‘Jewel’ sweet potato [Ipomoea batatas (L.) Lam.] roots. J Agric Food Chem. 29: 904-906.
Walter, W.M., A.E. Purcell, and G.K. McCollum. 1979. Use of high-pressure liquid chromatography for analysis of sweet potato phenolics. J Agric Food Chem. 27: 938-941.
Yagasaki, K, Y. Miura, R. Okauchi, and T. Furuse. 2000. Inhibitory effects of chlorogenic acid and its related compounds on invasion of hepatoma cells in culture. Cytotechnol. 33: 229-235.
Yamada, J. and Y. Tomita. 1996. Antimutagenic activity of caffeic acid and related compounds. Biosci Biotechnol Biochem. 60: 328–329.
Yamakawa, O. and M. Yoshimoto. 2002.Sweetpotato as food material with physiological functions. Acta Hort. 583: 179-184.
Yoshimoto, M., S. Okuno, M. Yoshinaga, O. Yamakawa, M. Yamaguchi, and J. Yamada. 1999. Antimutagenicity of sweet potato (Ipomoea batatas) roots. Biosci Biotechnol Biochem. 63: 537–541.
53

Zhu, K., M.L. Cordeiro, J. Atienza, W.E. Robinson, and S.A. Chow. 1999. Irreversible inhibition of human immunodeficiency virus type 1 integrase by dicaffeoylquinic acids. J Virol. 73:3309–3316.
54

CHAPTER 5. EFFECT OF LOW TEMPERATURE STORAGE ON PHENOLIC COMPOSITION AND ANTIOXIDANT ACTIVITY OF
SWEETPOTATOES
INTRODUCTION
Sweetpotato is indigenous to tropical regions and suffers from chilling injury
when subjected to low temperature storage. Chilling injury may occur during on-farm
storage, during long distance transport, in wholesale and retail storage facilities, in
supermarket display racks, and in consumer refrigerators. Long-term exposure to low
temperature results in internal tissue darkening of sweetpotato roots, which has been
attributed to an increased content of phenolic compounds (Lieberman et al., 1958;
Lieberman et al., 1959; Porter et al., 1976). A significant increase in chlorogenic acid
content and polyphenols was reported in chilled ‘Porto Rico’ sweetpotato roots
(Lieberman et al., 1958). However, Minamikawa et al. (1961) found no significant
increase in chlorogenic acid content or polyphenols in ‘Okinawa No. 100’ sweetpotato
roots stored at 0 °C. These apparent contradictions indicate chilling injury and phenolic
content in sweetpotatoes is influenced by cultivar and other pre- and/or postharvest
conditions. Cantwell et al. (2002) reported an accelerated buildup of phenolics when
jicama roots were transferred to 20 °C after 2 weeks of storage at 10 °C. They suggested
that a transfer to warmer temperature intensifies the changes induced by low temperature
storage. The extent of chilling injury symptoms is influenced by curing, duration of
exposure to low temperature, and the specific exposure temperature. Picha (1987)
reported external chilling injury symptoms and internal tissue darkening was greater in
non-cured than cured sweetpotato roots.
55

The change in phenolic compound metabolism in response to low temperature
depends on the tissue sensitivity. Yamaki and Uritani (1972) reported vacuolar membrane
degradation in some regions of the sweetpotato root tissue. This may have resulted in a
greater influx of phenolic compounds into the cytosol from their vacuolar storage
location. Phenolic compounds build up gradually as a result of chilling and are oxidized
in presence of air to form dark pigments (Lieberman et al., 1958). Recently, phenolic
compounds have attracted attention due to their antioxidant properties and ability to
protect the human body from oxidative stress (Kaul and Khanduja, 1998). Thus an
increase in phenolic compounds due to low temperature exposure may enhance the
nutraceutical value of sweetpotato roots. However, an extended period of low
temperature exposure may result in chilling injury, which decreases the market value of
sweetpotato roots. No information exists on the use of limited low temperature exposure
times for enhancement of nutraceutical value in sweetpotato roots. The objective of this
study was to determine the effect of low temperature storage on phenolic acid
composition in different tissues of cured and non-cured sweetpotato roots.
MATERIALS AND METHODS
Reagents
Chlorogenic acid and caffeic acid standards, Folin-Denis reagent and DPPH (1, 1-
diphenyl-2-picrylhydazyl) reagent were purchased from Sigma-Aldrich (St. Louis, MO).
Standards of three isomers of dicaffeoylquinic acid (4,5-diCQA, 3,5-diCQA, 3,4-diCQA)
were kindly provided by Dr. Makoto Yoshimoto (Department of Upland Farming,
Kyushu National Agricultural Experiment Station, Miyakonojo, Miyazaki, Japan).
56
Plant Material
‘Beauregard’ sweetpotatoes were grown at the LSU AgCenter Sweetpotato
Research Station in Chase, LA in 2004. The roots were harvested during the first week of
October and divided into two lots. One lot was cured at 30 °C and 90% relative humidity
for 7 days and then stored at 5 °C and 15 °C. The second lot was stored at 5 °C without
curing. The roots were sampled at harvest, after curing, and at specified intervals during a
4-week exposure to low temperature.
Tissue Preparation and Extraction
In an initial experiment, cured and non-cured sweetpotato roots were analyzed for
total phenolic content at weekly intervals during a 4-week storage period at 5 °C.
Randomly selected roots were washed and allowed to dry at ambient temperature before
tissue preparation. Roots were blended using a Cuisinart model DLC-2AR food processor
(Cuisinart Inc., Windsor, NJ). Blended tissue was passed through a 1 mm sieve and
exactly 1 g of sieved tissue was placed in a 15 ml Falcon centrifuge tube. Approximately
8 ml of 80% methanol was added to the centrifuge tube. The tubes were capped and
immersed in a water bath at 80 °C for 10 minutes. After vigorously shaking the heated
samples manually for 30 seconds, the tubes were cooled and centrifuged at 4,500 g for 15
minutes. The final volume of clear supernatant was made to 10 ml with 80% methanol
and analyzed for total phenolic content.
A second experiment was initiated to study the effect of chilling temperature on
total phenolic content and individual phenolic acid content in different root tissues in
non-cured roots. Chilled roots were analyzed after 2 and 4 weeks at 5 °C. At each
sampling, some of the chilled roots were held at 22 °C for an additional 3 days. The four
57

tissue types analyzed at each sampling were: skin (periderm), cortex, cambium, and pith.
Exactly 1 g of tissue, excised with a scalpel, was obtained from each tissue type from the
same root. The individual tissues were put in 15 ml Falcon tubes and homogenized in
80% methanol using a VirTishear homogenizer (Virtis Co., Gardiner, NY).
Approximately 8 ml of 80% methanol was added to the tubes. The capped tubes were
immersed in a water bath at 80 °C for 10 minutes and manually shaken for 30 seconds.
The supernatant was collected after centrifugation and analyzed for total phenolic content
and individual phenolic acids.
Total Phenolics
Total phenolic content was determined by modification of the Folin-Denis method
(Swain and Hillis, 1959). Exactly 0.5 ml of supernatant was placed in a 25 ml test tube
and mixed with 8 ml of Megapure water (Barnstead MP-12A, Haverhill, MA) followed
by the addition of 0.5 ml of Folin-Denis reagent. After 3 minutes, 1 ml of 1 N Na2CO3
was added and the solution was allowed to stand for 2 hr at 22 °C. Absorbance of the
resulting blue color complex was measured at 750 nm using a Lambda 35 UV/Vis
spectrophotometer (PerkinElmer Inst., Norwalk, CT). The total phenolic content was
expressed as mg chlorogenic acid equivalents/100 g fresh weight.
Antioxidant Activity
The antioxidant activity was measured according to the method developed by
Brand-Williams et al. (1995), with slight modifications. DPPH (1, 1-diphenyl-2-
picrylhydazyl) was used as the source of free radicals. The absorbance of free radicals at
520 nm disappears upon their reduction by an antioxidant. In this study, Trolox (6-
hydroxy-2,5,7,8-tetramethyl-chroman-2-carboxylic acid) was used as the standard
58

antioxidant compound. An aliquot (300 μl) with a suitable dilution of sweetpotato extract
was placed in a 1.5 ml amber colored centrifuge tube. Then 600 μl of 0.1 M 2-(N-
morpholine) ethanesulfonic acid (MES) (pH 6.0) and 300 μl of 0.4 mM of DPPH solution
were added to the centrifuge tube. The resultant mixture was shaken and held in the dark
for 2 minutes. The decrease in DPPH absorbance was measured at 520 nm using a
Lambda 35 UV/Vis spectrophotometer (PerkinElmer Inst., Norwalk, CT). The
sweetpotato extract was replaced with 80% methanol in the control samples. For the
blank, 80% methanol without DPPH was used. The antioxidant activity was calculated
from a standard curve made with known concentrations of Trolox and expressed in terms
of mg Trolox equivalents/100 g fresh weight.
Individual Phenolic Acids
Separation, analysis and quantification of individual phenolic acids were
accomplished using reversed-phase HPLC with a Gemini C18, 5 µm, 250 × 4.6 mm
(Phenomenex, Torrance, CA) column. An aliquot of the supernatant was filtered through
a 0.45 µm Nylaflo membrane filter (Pall Corp., East Hills, NY). A sample volume of 20
µl was injected onto the column using a Waters 717 autosampler connected to a Waters
600E pump (Waters Corp., Milford, MA). Phenolic acids were eluted using a mobile
phase consisting of 1% (v/v) formic acid in aqueous solution: acetonitrile: 2-propanol
(70:22:8) at pH 2.5 with an isocratic flow rate of 0.75 ml/min. Peaks detected were
identified and quantified by comparing the retention time and peak area to that of known
standards. Quantification was based on absorbance at 320 nm using a Waters 2487 dual
wavelength UV absorbance detector.
59

Statistical Analysis
A completely randomized design with five replications per treatment was used.
Each root was considered as one replication. Data was analyzed by MIXED procedure
methods (SAS Institute Inc., Cary, NC). Means were separated using Tukey’s test
(P<0.05). A Pearson correlation was used to determine the relationship between total
phenolic content and antioxidant activity of sweetpotato root tissues.
RESULTS AND DISCUSSION
Total Phenolics
A significant increase in total phenolic content of non-cured and cured roots was
observed after 2 and 3 weeks of low temperature exposure, respectively. However, long
term storage (12 months) of cured sweetpotatoes at 15 °C resulted in no significant
change in total phenolic content (data not shown). Our results showed that total phenolic
content increased at a higher rate in non-cured roots than in cured roots during low
temperature storage (Figure 5.1). After each week of low temperature exposure, non-
cured roots had a higher total phenolic content than cured roots. However, a significant
difference was observed only after 4 weeks exposure at 5 °C. Total phenolic content after
4 weeks of low temperature exposure increased from 55.3 mg/100g fresh tissue (at
harvest) to 79.4 mg/100 g fresh tissue in cured roots compared to 125.8 mg /100 g fresh
tissue in non-cured roots. Total phenolic content in non-cured roots exposed to 4 weeks
of chilling was significantly higher than all other treatments. Internal tissue browning in
non-cured roots was apparent after 3 weeks of 5 °C exposure. Non-cured tissue was
noticeably darker than cured tissue. Our results are consistent with Picha (1987), who
reported darkening of the cambium and vascular bundles in non-cured ‘Whitestar’ and
60

‘Rojo Blanco’ sweetpotato roots exposed to 7 °C for 3 weeks. Lieberman et al. (1959)
and Porter et al. (1976) also reported internal tissue browning of sweetpotato roots
bcbcdcdedeff
a
bbc
cdefef
0
40
80
120
160
0 wk 1 wk 2 wk 3 wk 4 wk
Storage interval
Cured Non-cured
Tota
l phe
nolic
s*
(mg/
100
g fr
esh
wei
ght)
Figure 5.1. Total phenolics in cured and non-cured sweetpotato roots at different intervals of storage at 5 °C. Means with different letters are significantly different at P<0.05 (Tukey’s test). *Data expressed as mg of chlorogenic acid equivalents per 100 g of fresh weight.
exposed to chilling temperatures. The darkening of chilled sweetpotato tissue was
attributed to increased content of phenolic compounds.
A second experiment was undertaken to quantify the total phenolic content in
different sweetpotato root tissues. Total phenolic content of freshly harvested roots was
highest in skin tissue (279.7 mg/100 g fresh weight) and lowest in pith tissue (44.9
mg/100 g fresh weight) (Table 5.1). Previously, Walter and Schadel (1981) had reported
the outer skin of sweetpotato contained higher amounts of phenolics compared to inner
pith tissue. The higher amount of phenolics in skin tissue of sweetpotato was attributed to
the natural chemical defense mechanism against diseases and insect pests (Harrison et al.,
2003). Our results indicated the low temperature exposure resulted in an increase in total
phenolic content in all tissue types. Transfer to ambient temperature after 2 and 4 weeks
61

of low temperature storage resulted in increased total phenolic content in all tissue types.
Depending on tissue type, the total phenolic content in freshly harvested non-cured
sweetpotato roots increased two- to three-fold when roots were exposed to 3 days of
warmer temperature after 4 weeks at 5 °C (Table 5.1). However, irrespective of the low
temperature storage duration, skin tissue always had a significantly higher total phenolic
Table 5.1. Total phenolics in different tissues of non-cured sweetpotato roots at different intervals of storage at 5 °C, including transfer to ambient temperature (22 °C) for an additional 3 days (d).
Total phenolics* Storage interval Skin Cortex Cambium Pith
0 wk 279.7c 117.7b 139.4b 44.9b 2 wk 356.4c 151.5b 168.0b 49.0b 2 wk + 3 d 407.7bc 153.6b 157.6b 47.4b 4 wk 507.9ab 195.6ab 234.1ab 64.4ab 4 wk + 3 d 755.1a 280.0a 466.9a 82.9a Means with same letters in a column are not significantly different at P<0.05 (Tukey’s test). *Data expressed as mg of chlorogenic acid equivalents per 100 g of fresh weight.
content than other tissues. No significant difference in phenolic content was observed
between cortex and cambium tissue, whereas, pith had a significantly lower total phenolic
content. A significant increase in total phenolic content of cortex, cambium, and pith
tissue was observed after 3 days of 22 °C exposure following 4 weeks at 5 °C. Cantwell
et al. (2002) also observed similar results is jicama roots, where they reported an
accelerated buildup of phenolics when roots stored at 10 °C for 2 weeks were transferred
to 22 °C. The increase in total phenolic concentration paralleled the increased
phenylalanine ammonia-lyase activity (PAL), an important enzyme in the
phenylpropanoid pathway involved in phenolic synthesis.
Stress induced phenolic compounds may be the result of increased transcription of
genes encoding the corresponding biosynthetic enzymes (Dixon and Paiva, 1995). They
62

suggested the specific heterotetrameric forms of PAL, a tetrametric enzyme encoded by
multiple genes, depends on the type of stress.
Antioxidant Activity
The increase in antioxidant activity of sweetpotato roots with increasing lengths
of exposure to 5 °C was consistent with the trend for total phenolic content. The increase
in antioxidant activity due to low temperature storage was always higher in non-cured
roots than cured roots (Figure 5.2). However, a significant difference was observed only
bcdcdddd
a
bbc
bcdcd
0
50
100
150
200
0 wk 1 wk 2 wk 3 wk 4 wkStorage interval
Cured Non-cured
Ant
ioxi
dant
act
ivity
* (m
g/10
0 g
fres
h w
eigh
t)
Figure 5.2. Antioxidant activity of cured and non-cured sweetpotato roots at different intervals of storage at 5 °C. Mean values with different letters are significantly different at P<0.05 (Tukey’s test). *Data expressed as mg of Trolox equivalents per 100 g of fresh weight.
after 2 weeks of 5 °C storage. Antioxidant activity in freshly harvested roots was 48.5 mg
Trolox equivalent/100 g fresh weight. After 4 weeks of 5 °C storage, antioxidant activity
of non-cured roots increased to 178.4 mg Trolox equivalent/100 g fresh weight compared
to 63.3 mg Trolox equivalent/100 g fresh weight in cured roots. The antioxidant activity
of extract from roots chilled for 4 weeks was significantly higher than all other
treatments.
63

A comparison of different tissues revealed that skin tissue had the highest
antioxidant activity irrespective of low temperature storage duration. The rate of increase
in antioxidant activity in skin tissue was higher than in other tissue types. The antioxidant
activity of freshly harvested root tissue was: skin (257.3 mg Trolox equivalent/100 g
fresh tissue); cortex (77.2 mg Trolox equivalent/100 g fresh tissue); cambium (123.4 mg
Trolox equivalent/100 g fresh tissue); pith (48.8 mg Trolox equivalent/100 g fresh tissue)
(Table 5.2). Our results are consistent with other findings where sweetpotato outer skin
tissue was shown to have a two- to three-fold higher antioxidant activity than the inner
ptih tissue (Troung et al., 2004; Cevallos-Casalas and Cisneros-Zevallos, 2003). Troung
et al. (2004) reported that antioxidant activity of outer (5 mm) layer and inner tissue of
different sweetpotato cultivars ranged from 75 to 175 mg and 50 to 70 mg Trolox
equivalent/100g fresh weight. Our results indicated that none of the tissues showed any
Table 5.2. Antioxidant activity in different tissues of non-cured sweetpotato roots at different intervals of storage at 5 °C, including transfer to ambient temperature (22 °C) for an additional 3 days (d).
Antioxidant activity* (mg/100 g fresh weight) Storage interval Skin Cortex Cambium Pith
0 wk 257.3c 77.2a 123.4b 48.8a 2 wk 303.5c 98.1a 121.8b 45.2a 2 wk + 3 d 480.8b 88.5a 124.3b 48.7a 4 wk 515.3b 102.6a 232.7ab 55.0a 4 wk + 3 d 805.2a 197.4a 270.2a 65.7a Means with the same letters in a column are not significantly different at P<0.05 (Tukey’s test). *Data expressed as mg of Trolox equivalents per 100 g of fresh weight.
significant increase in antioxidant activity during first 2 weeks of 5 °C storage. A three
day exposure to warmer temperature after 2 weeks of 5 °C storage resulted in an increase
in antioxidant activity in all tissues except the pith. The skin tissue had the highest
antioxidant activity (805.2 mg Trolox equivalent/100 g fresh weight) after 4 weeks of 5
°C storage followed by a three day exposure to warmer temperature. The changes in
64

antioxidant activity of sweetpotato root tissue paralleled that of the total phenolic content.
A strong correlation coefficient (r2=0.99) existed between total phenolic content and
antioxidant activity of non-cured roots stored at 5 °C (Figure 5.3).
0
40
80
120
160
200
0 wk 1 wk 2 wk 3 wk 4 wk
Storage interval
0
40
80
120
160
200
TP AA
r2= 0.986
Ant
ioxi
dant
act
ivity
**
mg/
100
g fr
esh
wei
ght)
(
Tota
l phe
nolic
s*
(mg/
100
g fr
esh
wei
ght)
Figure 5.3. Correlation between total phenolics (TP) and antioxidant activity (AA) in non-cured sweetpotato roots during 4 weeks of storage at 5 °C. *Data expressed as mg of chlorogenic acid equivalents per 100 g of fresh weight. **Data expressed as mg of Trolox equivalents per 100 g of fresh weight.
Individual Phenolic Acids
Individual phenolic acids in sweetpotato tissues increased in roots exposed to low
temperature storage. The individual phenolic acids identified in freshly harvested
sweetpotato root tissues were: ChlA; CafA; 4,5-diCQA; 3,5-diCQA; and 3,4-diCQA.
The major phenolic acid quantified was chlorogenic acid, with an average content
ranging from 5.3 mg/100 g in fresh pith tissue to 18.3 mg/100 g in fresh skin tissue. All
individual phenolic acids, except caffeic acid, increased two- to six-fold during low
temperature storage, depending on the tissue location and low temperature storage
duration (Tables 5.3-5.7). A further two-fold increase in dicaffeoylquinic acids (4,5-
diCQA; 3,5-diCQA; and 3,4-diCQA) was observed when roots were transferred to
65

warmer temperature for 3 days. Consistent with our results, an increase in chlorogenic
acid content in ‘Porto Rico’ sweetpotatoes had been previously reported (Lieberman et
al., 1959). A further increase in individual phenolic acid concentration was observed in
roots exposed to 3 days of warmer temperature after 4 weeks of chilling. However,
caffeic acid content was much higher in skin tissue and showed no significant change
with low temperature exposure. Our results agree with Harrison et al. (2003) who
suggested the high periderm caffeic content may be associated with a chemical defense
mechanism in some sweetpotato genotypes.
In general, the rate of increase in chlorogenic acid and dicaffeoylquinic acids
content was highest in the skin tissue followed by the cambium tissue. The pith tissue had
the lowest rate of increase in individual phenolic acids. Transversely sliced sweetpotato
roots exposed to air showed more discoloration in the cambium ring than in the cortex
and pith tissue. This is probably due to the higher phenolic acid content in the cambium
tissue. Further identification of the specific phenolic compounds responsible for chill-
induced discoloration needs to be investigated. Chlorogenic acid was found to be the
most abundant phenolic acid in apples, but catechin was the main contributor to
discoloration (Murata et al., 1995).
The two unidentified peaks immediately after and before chlorogenic acid were
assumed to be isomers of chlorogenic acid, but this needs confirmation. The trend of
increase in most of the individual phenolic acids with increasing duration of low
temperature exposure paralleled the changes in total phenolic content.
66

Table 5.3. Chlorogenic acid content in different tissues of non-cured roots sweetpotato roots at different intervals of storage at 5 °C, including transfer to ambient temperature (22 °C) for an additional 3 days (d).
Chlorogenic acid (mg/100 g fresh weight) Storage interval Skin Cortex Cambium Pith
0 wk 18.3d 10.1b 10.2b 5.3a 2 wk 25.2d 17.3b 18.1b 6.7a 2 wk + 3 d 61.6bc 24.2ab 19.8b 10.7a 4 wk 76.1ab 23.7ab 33.6ab 9.9a 4 wk + 3 d 93.4a 42.0a 59.1a 9.3a Means with the same letters in a column are not significantly different at P<0.05 (Tukey’s test). Table 5.4. Caffeic acid content in different tissues of non-cured roots sweetpotato roots at different intervals of storage at 5 °C, including transfer to ambient temperature (22 °C) for an additional 3 days (d).
Caffeic acid (mg/100 g fresh weight) Storage interval Skin Cortex Cambium Pith
0 wk 9.2a 0.4a 0.3b 0.2a 2 wk 10.7a 0.4a 0.4b 0.2a 2 wk + 3 d 8.6a 0.4a 0.5b 0.4a 4 wk 5.8a 0.7a 1.2ab 0.4a 4 wk + 3 d 6.7a 1.3a 3.9a 0.4a Means with the same letters in a column are not significantly different at P<0.05 (Tukey’s test). Table 5.5. 4,5-dicaffeoylquinic acid content in different tissues of non-cured roots sweetpotato roots at different intervals of storage at 5 °C, including transfer to ambient temperature (22 °C) for an additional 3 days (d).
4,5-dicaffeoylquinic acid (mg/100 g fresh weight) Storage interval Skin Cortex Cambium Pith
0 wk 3.2b 0.5b 1.2b 0.4a 2 wk 3.0b 0.6b 1.3b 0.4a 2 wk + 3 d 10.1b 1.1ab 1.6b 1.5a 4 wk 11.0ab 1.1ab 2.9ab 0.7a 4 wk + 3 d 18.2a 3.8a 13.7a 1.1a Means with the same letters in a column are not significantly different at P<0.05 (Tukey’s test).
67
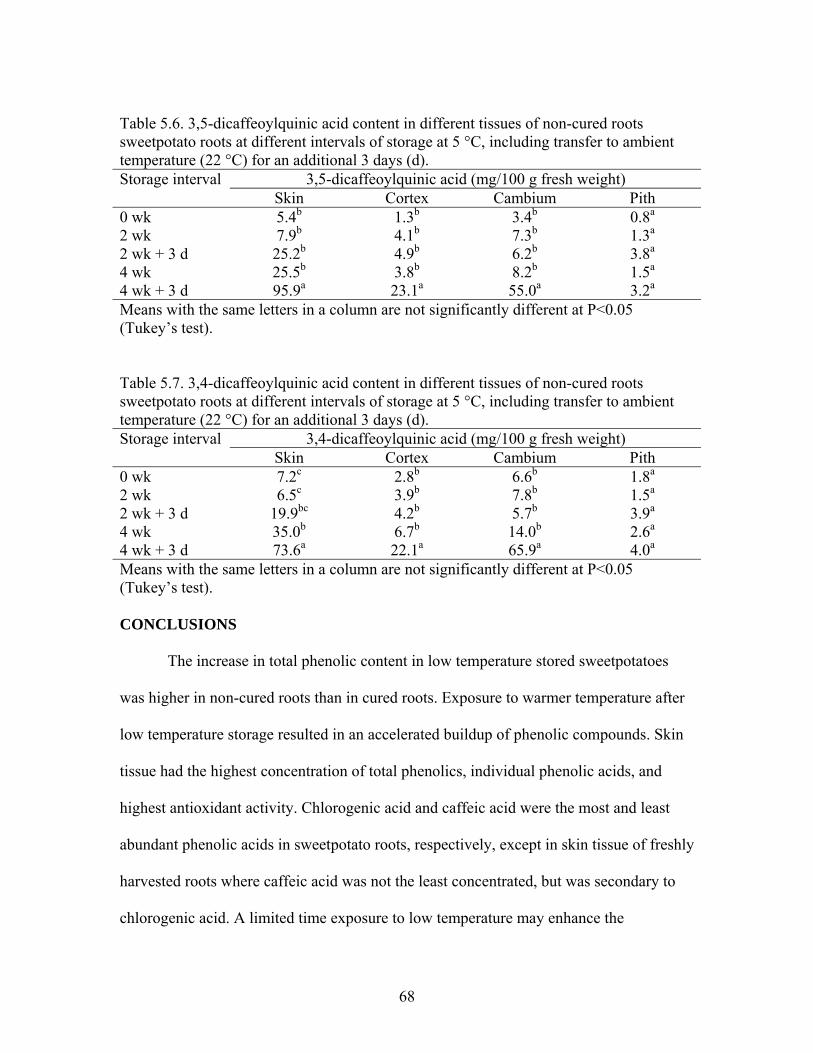
Table 5.6. 3,5-dicaffeoylquinic acid content in different tissues of non-cured roots sweetpotato roots at different intervals of storage at 5 °C, including transfer to ambient temperature (22 °C) for an additional 3 days (d).
3,5-dicaffeoylquinic acid (mg/100 g fresh weight) Storage interval Skin Cortex Cambium Pith
0 wk 5.4b 1.3b 3.4b 0.8a 2 wk 7.9b 4.1b 7.3b 1.3a 2 wk + 3 d 25.2b 4.9b 6.2b 3.8a 4 wk 25.5b 3.8b 8.2b 1.5a 4 wk + 3 d 95.9a 23.1a 55.0a 3.2a Means with the same letters in a column are not significantly different at P<0.05 (Tukey’s test). Table 5.7. 3,4-dicaffeoylquinic acid content in different tissues of non-cured roots sweetpotato roots at different intervals of storage at 5 °C, including transfer to ambient temperature (22 °C) for an additional 3 days (d).
3,4-dicaffeoylquinic acid (mg/100 g fresh weight) Storage interval Skin Cortex Cambium Pith
0 wk 7.2c 2.8b 6.6b 1.8a 2 wk 6.5c 3.9b 7.8b 1.5a 2 wk + 3 d 19.9bc 4.2b 5.7b 3.9a 4 wk 35.0b 6.7b 14.0b 2.6a 4 wk + 3 d 73.6a 22.1a 65.9a 4.0a Means with the same letters in a column are not significantly different at P<0.05 (Tukey’s test). CONCLUSIONS
The increase in total phenolic content in low temperature stored sweetpotatoes
was higher in non-cured roots than in cured roots. Exposure to warmer temperature after
low temperature storage resulted in an accelerated buildup of phenolic compounds. Skin
tissue had the highest concentration of total phenolics, individual phenolic acids, and
highest antioxidant activity. Chlorogenic acid and caffeic acid were the most and least
abundant phenolic acids in sweetpotato roots, respectively, except in skin tissue of freshly
harvested roots where caffeic acid was not the least concentrated, but was secondary to
chlorogenic acid. A limited time exposure to low temperature may enhance the
68
nutraceutical value of sweetpotatoes without any loss of marketable quality.
Sweetpotatoes exposed to low temperature stress for extended periods may be targeted by
the functional food industry as a concentrated source of phenolic antioxidants.
REFERENCES
Brand-Williams, W., M.E. Cuvelier, and C. Berset. 1995. Use of free radical method to evaluate antioxidant activity. Lebensm Wiss Technol. 28: 25-30.
Cantwell, M.I., G. Peiser, and E. Mercado-Silva. 2002. Induction of chilling injury in jicama (Pachyrhizus erosus) roots: changes in texture, color and phenolics. Postharvest Biol Tech. 25: 311-320.
Cevallos-Casalas, B.A. and L.A. Cisneros-Zevallos. 2002. Bioactive and functional properties of purple sweetpotato (Ipomoea batatas (L.) Lam). Acta Hort. 583: 195-203.
Dixon, R.A. and N.L. Paiva 1995. Stress-induced phenylpropanoid metabolism. Plant Cell. 7: 1085-1097.
Harrison, H.F., J.K. Peterson, M.E. Snook, J.R. Bohac, and D.M. Jackson. 2003. Quantity and potential biological activity of caffeic acid in sweet potato [Ipomoea batatas (L.) Lam.] storage root periderm. J Agric Food Chem. 51: 2843-2848.
Kaul, A. and K.L. Khanduja. 1998. Polyphenols inhibit promotional phase of tumeriogensis: relevance of superoxide radicals. Nutr Cancer. 32: 81-85.
Lieberman, M., C.C. Craft, and M.S. Wilcox. 1959. Effect of chilling on the chlorogenic acid and ascorbic acid content of ‘Porto Rico’ sweet potatoes. J Am Soc Hort Sci. 74: 642-648.
Lieberman, M., C.C. Craft, W.V. Audia, and M.S. Wilcox. 1958. Biochemical studies of chilling injury in sweetpotatoes. Plant Physiol. 33: 307-311.
Minamikawa, T., T. Akazawa, and I. Uritani 1961. Mechanism of cold injury in sweet potatoes II. Biocemical mechanism of cold injury with special reference to mitochondrial activities. Plant Cell Physiol. 2: 301-309.
Murata, M., M. Tsurutani, M. Tomita, S. Homma, and K. Kaneko. 1995. Relationship between apple ripening and browning: changes in polyphenol content and polyphenol oxidase. J Agric Food Chem. 43: 1115-1121.
Picha, D.H. 1987. Chilling injury, respiration and sugar changes in sweet potatoes stored at low temperature. J Am Soc Hort Sci. 112: 497-502.
69

Porter, W.C., D.M. Pharr, L.J. Kushman, and D.T. Pope. 1976. Discoloration of chilled sweet potato [Ipomoea batatas (L.) Lam.] roots: Factors related to cultivar differences. J Food Sci. 41: 938-941.
Swain, T. and W.E. Hillis. 1959. The phenolic constituents of Prunus domestica. I. The quantitative analysis of phenolic constituents. J Sci Food Agric. 10: 63-68.
Troung, V.D., R.L. Thompson, R.F. McFeeters, and M.M. Lanier. 2004. Phenolic compounds and antioxidant activity of commercial sweetpotato cultivars. In: IFT Annual Meeting Book of Abstracts; June 22-26, 2004; New Orleans, La. Chicago III.: Inst. of Food Technologists. Abstract nr 49F-27.
Walter, W.M. and W.E. Schadel. 1981. Distribution of phenols in ‘Jewel’ sweet potato [Ipomoea batatas (L.) Lam.] roots. J Agric Food Chem. 29: 904-906.
Yamaki, S. and I. Uritani. 1972. Mechanism of chilling injury in sweet potato. VII. Change in mitochondrial structure during chilling storage. Plant Cell Physiol. 13: 795-805.
70
CHAPTER 6. PHENOLIC COMPOSITION AND ANTIOXIDANT ACTIVITY OF MINIMALLY PROCESSED SWEETPOTATOES
INTRODUCTION
Minimally processed fruits and vegetables are popular value-added convenience
foods widely available worldwide. Consumption of fresh-cut produce has grown at a
rapid pace during the last 10 years and new product development is still occurring
(Garrett, 2002). Fresh-cut products are substituting for frozen items in certain cases. A
wide variety of fresh-cut products are now commercially available for direct consumer
use or for further processing by restaurants and fast-food chains. Many consumers are
looking for convenience, high quality, and healthy choice products.
Controlled abiotic stress treatments such as minimal processing may be used to
enhance the health benefits from fresh-cut produce via an increase in secondary
metabolites, such as phenolics (Cisneros-Zevallos, 2003). An increase in total phenolic
content and antioxidant activity was observed in minimally processed carrots, potato,
jicama roots, escarole, and radicchio (Aquino-Bolanos et al., 2000; Cantos et al., 2002;
Cisneros-Zevallos, 2003; Di Venere et al., 2005). The phenolic compounds act as
antioxidant or free radical scavengers and may help to reduce the risks of certain types of
cancer, diabetes, and cardiovascular disease (Scalbert et al., 2005). The antioxidant
properties of phenolic compounds have been implicated in suppressing hepatoma
invasion (Yagasaki et al., 2000), and human immunodeficiency virus (HIV) replication
(Mahmood et al., 1993). The phenolic acids such as chlorogenic acid (ChlA); 3,5-
dicaffeoylquinic acid (3,5-diCQA); 3,4-dicaffeoylquinic acid (3,4-diCQA); and 4,5-
dicaffeoylquinic acid (4,5-diCQA) extracted from steamed sweetpotato suppressed
melanogenesis in mice (Shimozono et al., 1996). The potential chemopreventive
71

properties of water extract from baked sweetpotatoes had been reported recently (Rabah
et al., 2004).
The sweetpotato [Ipomoea batatas (L.) Lam.] root is a major staple food widely
consumed in developing countries and ranks as the seventh most important food crop in
the world (CIP, 2006). Like other vegetables, sweetpotato can also be minimally
processed and consumed as fresh-cut product. Ready-to-use sweetpotato forms such as
shredded, sliced or French-fry cuts may decrease preparation time for use in restaurants
and other food service facilities. Sweetpotato roots have been reported to contain
phenolic antioxidant compounds (Walter et al., 1979; Oki et al., 2002; Huang et al.,
2004). Abiotic stress, such as wounding of the tissue, may further increase the phenolic
content and nutraceutical value of sweetpotato roots. Kojima and Uritani (1973) reported
that slicing of sweetpotato roots resulted in marked polyphenol production. However, no
information exists pertaining to the antioxidant activity in different types of fresh-cut
sweetpotato products. The objective of this study was to quantify the phenolic
composition and antioxidant activity changes during storage of different style cut
sweetpotatoes.
MATERIALS AND METHODS
Reagents
Chlorogenic acid and caffeic acid standards, Folin-Denis reagent and DPPH (1, 1-
diphenyl-2-picrylhydazyl) reagent were purchased from Sigma-Aldrich (St. Louis, MO).
Standards of three isomers of isochlorogenic acid were kindly provided by Dr. Makoto
Yoshimoto (Department of Upland Farming, Kyushu National Agricultural Experiment
Station, Miyakonojo, Miyazaki, Japan).
72

Tissue Preparation
Sweetpotato roots cv. ‘Beauregard’ were peeled with an abrasive peeler and
minimally processed into shreds (approximately 2 × 20 mm), slices (5 mm thick), and
French-fry cuts (7 × 10 mm). A manual food processor was used for shredding, whereas
the French-fry cut and slices were prepared using a Bron Coucke mandoline (Model No.
20638CHB, Discount Natural Foods Inc., Hooksett, NH). The fresh-cut material was
sanitized by dipping in a 150 mg/l chlorine solution (pH 6.5) for 1 minute. The sanitized
material was spin-dried using a salad spinner (Item No. 32480, Oxo International, New
York, NY) and a random sample of 100 g from each cut was heat sealed in 13 × 20 cm
polyethylene bags. The bags of fresh-cut material were stored at two different
temperatures, 0 and 5 °C, and analyzed after 4 and 8 days of storage. Sweetpotatoes
analyzed immediately after cutting (0 days of storage) served as the control.
Headspace Gas Composition
The gas composition inside the bags was monitored daily using a Model 6600
oxygen/carbon dioxide analyzer (Illinois Instruments, Ingleside, IL). An adhesive septum
was affixed to the plastic bag to avoid any leakage after sampling. To make the gaseous
mixture homogenous, the bags were gently shaken prior to gas analysis.
Tissue Extraction
Following removal from storage, randomly selected tissue from each bag was
lyophilized and powdered using a mortar and pestle. Exactly 0.5 g of tissue was placed in
a 15 ml Falcon centrifuge tube. Approximately 8 ml of 80% methanol was added to the
centrifuge tube. The tubes were capped and immersed in a water bath at 80 °C for 10
minutes. After vigorously shaking the heated samples manually for 30 seconds, the tubes
73
were cooled and centrifuged at 4,500 g for 15 minutes. The final volume of clear
supernatant was made to 10 ml with 80% methanol and analyzed for total phenolic
content, individual phenolic acids, and antioxidant activity.
Total Phenolics
Total phenolic content was determined by a modification of the Folin-Denis
method (Swain and Hillis, 1959). Exactly 0.5 ml of supernatant was placed in a 25 ml test
tube and mixed with 8 ml of Megapure water (Barnstead MP-12A, Haverhill, MA)
followed by the addition of 0.5 ml of Folin-Denis reagent. After 3 minutes, 1 ml of 1N
Na2CO3 was added and the solution was allowed to stand for 2 hours at ambient
temperature (~22 °C). Absorbance of the resulting blue complex was measured at 750 nm
using a Lambda 35 UV/Vis spectrophotometer (PerkinElmer Instruments, Norwalk, CT).
A standard curve of chlorogenic acid (50-300 µg/ml concentration) was plotted. The total
phenolic content was expressed as mg ChlA equivalent/g dry weight.
Antioxidant Activity
The antioxidant activity was measured according to Brand-Williams et al. (1995),
with slight modifications. DPPH (1, 1-diphenyl-2-picrylhydazyl) was used as the source
of free radicals. The absorbance of free radicals at 520 nm disappears upon their
reduction by an antioxidant. In this study, Trolox (6-hydroxy-2, 5, 7, 8-tetramethyl-
chroman-2-carboxylic acid) was used as the standard antioxidant compound. An aliquot
(300 μl) of sweetpotato extract was placed in a 1.5 ml amber colored centrifuge tube.
Then 600 μl of 0.1 M 2-(N-morpholine) ethanesulfonic acid (MES) (pH 6.0) and 300 μl
of 0.4 mM of DPPH solution were added to the centrifuge tube. The resultant mixture
was shaken and held in the dark for 2 minutes. The decrease in DPPH absorbance was
74

measured using a Lambda 35 UV/Vis spectrophotometer (PerkinElmer Instruments,
Norwalk, CT) at 520 nm. The sweetpotato extract replaced with 80% methanol was taken
as control. The spectrophotometer was calibrated using 80% methanol as a blank. The
antioxidant activity was calculated from a standard curve made with known
concentrations of Trolox and expressed in terms of mg Trolox equivalent/g dry weight.
Individual Phenolic Acids
Separation of individual phenolic acids was accomplished using reversed-phase
HPLC (high performance liquid chromatography) with a Gemini C18, 5 µm, 4.6 × 250
mm (Phenomenex, Torrance, CA) column. An aliquot of the supernatant was filtered
through a 0.45 µm Nylaflo membrane filter (Pall Corp., East Hills, NY). A sample
volume of 20 µl was injected onto the column using a Waters 717 autosampler connected
to a Waters 600E pump (Waters Corp., Milford, MA). Phenolic acids were eluted using a
mobile phase consisting 1% (v/v) formic acid in aqueous solution: acetonitrile: 2-
propanol (70:22:8), pH 2.5 with an isocratic flow rate of 0.75 ml/min. The peaks detected
were identified and quantified by comparing the retention time and peak area to that of
known standards. Quantification was based on absorbance at 320 nm using a Waters
2487 dual wavelength UV absorbance detector.
Statistical Analysis
A completely randomized design was used. Each bag was considered as one
replication with five replications per treatment. Data was analyzed by SAS procedure
MIXED (SAS Institute Inc., Cary, NC) and means were separated using Tukey’s test
(P<0.05).
75
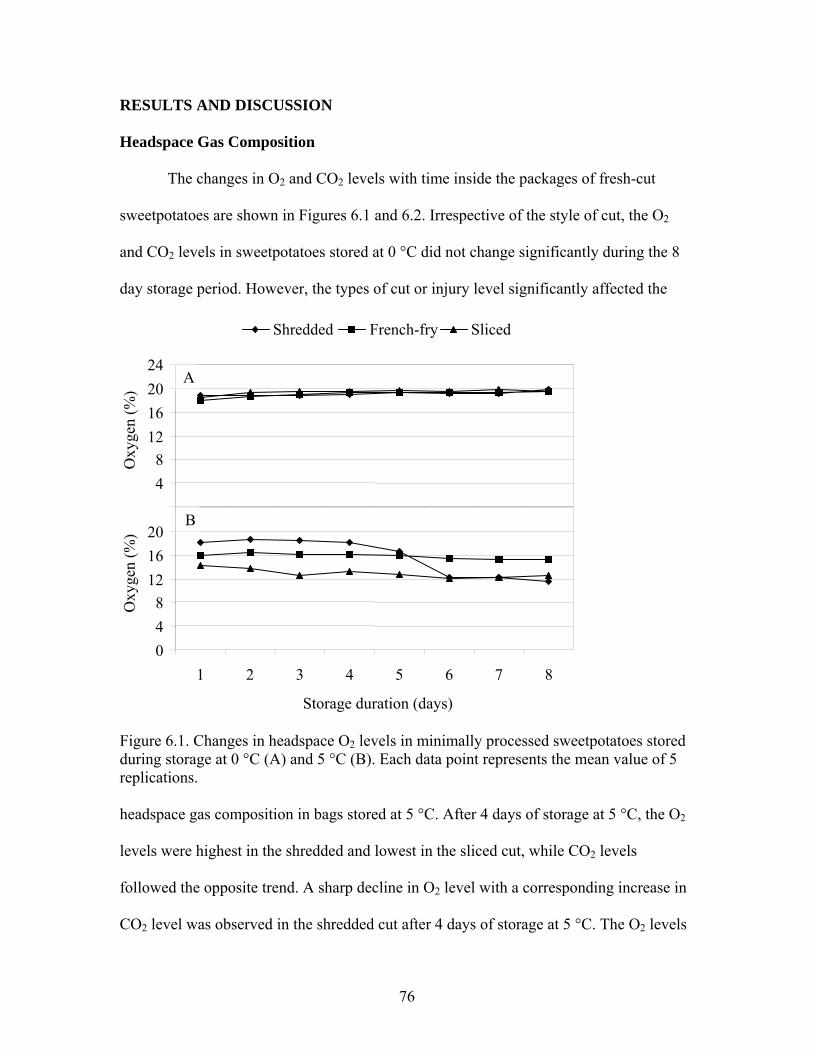
RESULTS AND DISCUSSION
Headspace Gas Composition
The changes in O2 and CO2 levels with time inside the packages of fresh-cut
sweetpotatoes are shown in Figures 6.1 and 6.2. Irrespective of the style of cut, the O2
and CO2 levels in sweetpotatoes stored at 0 °C did not change significantly during the 8
day storage period. However, the types of cut or injury level significantly affected the
4 8
12 16 20 24
Oxy
gen
(%)
0 4 8
12 16 20
1 2 3 4 5 6 7 8
Storage duration (days)
Oxy
gen
(%)
Shredded French-fry Sliced
A
B
Figure 6.1. Changes in headspace O2 levels in minimally processed sweetpotatoes stored during storage at 0 °C (A) and 5 °C (B). Each data point represents the mean value of 5 replications. headspace gas composition in bags stored at 5 °C. After 4 days of storage at 5 °C, the O2
levels were highest in the shredded and lowest in the sliced cut, while CO2 levels
followed the opposite trend. A sharp decline in O2 level with a corresponding increase in
CO2 level was observed in the shredded cut after 4 days of storage at 5 °C. The O2 levels
76

in the bags stored for 8 days were sufficient to avoid anaerobic respiration and no decay
or detectable off-flavor was observed in any of the cuts. Consistent with our results,
previous reports indicated respiration rate of fresh cut jicama roots stored at 5 and 10 °C
increased substantially after 4 and 2 days, respectively (Aquino-Bolanos et al., 2000).
0
1
2
3
4
5
1 2 3 4 5 6 7 8
Storage duration (days)
Car
bon
diox
ide
(%)
1
2
3
4
5
6
Car
bon
diox
ide
(%)
Shredded French-fry Sliced
A
B
Figure 6.2. Changes in headspace CO2 levels in minimally processed sweetpotatoes stored during storage at 0 °C (A) and 5 °C (B). Each data point represents the mean value of 5 replications. Total Phenolics
The initial total phenolic content in sweetpotato root tissue immediately after
cutting (0 days of storage) was 1.3 mg/g dry weight. Minimal processing of
sweetpotatoes followed by low temperature storage resulted in an increase in total
77

phenolic content (Table 6.1). In general, sliced cut sweetpotatoes had a significantly
higher total phenolic content than shredded cut. However, the rates of increase in total
phenolic content with duration of storage depend on storage temperature. The storage of
minimally processed sweetpotatoes at 5 °C resulted in higher total phenolic content than
Table 6.1. Total phenolics and antioxidant activity in minimally processed sweetpotatoes stored at 0 and 5 °C for 4 and 8 days. Processing type Storage
temperature Storage (days)
Total phenolics* Antioxidant activity**
Control 0 1.3d 0.8d 4 1.3d 0.8d 0 °C 8 1.3d 0.8d 4 1.4cd 1.1c
Shredded
5 °C 8 2.2a 1.8b 4 1.4cd 1.0c 0 °C 8 1.5cd 1.1c 4 1.7bc 1.3c
French-fry cut
5 °C 8 2.3a 2.3a 4 1.5bc 1.2c 0 °C 8 1.6bc 1.1c 4 1.8b 1.6b
Sliced
5 °C 8 2.4a 2.4a Means with the same letters in a column are not significantly different at P<0.05 (Tukey’s test).*Data expressed as mg of chlorogenic acid equivalents per g of dry weight. **Data expressed as mg of Trolox equivalents per g of dry weight. at 0 °C. The total phenolic content in sliced tissue (2.4 mg/g dry weight) after 8 days of
storage at 5 °C was approximately two-fold higher than the total phenolic content
immediately after cutting (1.3 mg/g dry weight). Results for total phenolic content in
minimally processed sweetpotatoes were consistent with previous reports on other crops.
Total phenolic content increased when fresh-cut escarole and radicchio were stored for 9
days at 4 °C (Di Venere et al., 2005). The increase in total phenolic content in fresh-cut
jicama root tissue was associated with phenylalanine ammonia-lyase (PAL) activity,
which increased significantly at 10 °C (Aquino-Bolanos et al., 2000). It has been
suggested that the induction of phenolic compounds serves as a chemical defense
78

mechanism to resist pathogen attack after tissue damage (Dixon and Paiva, 1995).
Although phenolic compounds increased after 8 days of storage at 5 °C, no tissue
browning or off-flavor was observed and the products were considered to be marketable.
Previously, no significant correlation was found between the degree of browning and
total phenolic content of fresh-cut potatoes (Cantos et al., 2002). However, the increased
total phenolic content during storage of minimally processed carrots may have
contributed to the chemical defense against pathogen attack (Chubey and Nylund, 1969).
Antioxidant Activity
The trend of change in antioxidant activity paralleled that of total phenolic content
(Table 6.1). The initial antioxidant activity of sweetpotato roots immediately after cutting
(0 days of storage) was 0.78 mg Trolox equivalent/g dry weight. The storage of
minimally processed sweetpotatoes resulted in increased antioxidant activity. During the
storage period of 8 days, sliced cut and shredded cut had the highest and lowest
antioxidant activities, respectively. Irrespective of the style of cut and duration of storage,
the minimally processed roots stored at 5 °C showed higher antioxidant activity than
roots stored at 0 °C. At 5 °C, the fresh cut sweetpotatoes stored for 8 days had
significantly higher antioxidant activity than after 4 days storage. The highest antioxidant
activity (2.4 mg Trolox equivalent/g dry weight) in sliced tissue stored for 8 days at 5 °C
was approximately three-fold higher than the initial antioxidant activity (0.8 mg Trolox
equivalent/g dry weight) of sweetpotatoes analyzed immediately after cutting. The
accumulation of phenolic compounds may be a key factor responsible for increased
antioxidant activity of minimally processed sweetpotatoes. Thus, minimally processing of
sweetpotatoes followed by storage at specific temperature may enhance the antioxidant
79

80
properties of sweetpotatoes. A recent study indicated that increased antioxidant potential
of fresh-cut escarole and radicchio stored for 9 days at 4°C was associated with increased
total phenolic content (Di Venere et al., 2005).
Individual Phenolic Acids
The quantitative results on the pattern of changes in individual phenolic acid
content during storage of minimally processed sweetpotatoes are presented in Table 6.2.
The most abundant phenolic acid in sweeetpotato roots was chlorogenic acid followed by
3,5-dicaffeoylquinic acid. The other identified phenolic acids such as caffeic; 4,5-
dicaffeoylquinic; and 3,4-dicaffeoylquinic acids were present in very low amounts. In
general, the content of the five identified phenolic acids increased many fold, reaching
maximal levels on the eighth day of storage at 5 °C. However, storage temperature and
style of cut significantly affect the accumulation of phenolic acids. The accumulation of
phenolic acids at 5 °C was always higher than at 0 °C. Tomas-Barberan et al. (1997)
reported that due to higher metabolism, the wound induced synthesis of caffeic acid
derivatives in lettuce was higher at 10 than at 5 °C.
After 8 days of storage at 5 °C, the content of all phenolic acids, except 4,5-
dicaffeoylquinic acid, was significantly higher than the initial phenolic acid content in
sweetpotatoes analyzed immediately after cutting. Chlorogenic acid content in sliced cut
stored at 5 °C for 8 days was six-fold higher than immediately after cutting. Consistent
with our results, a dramatic increase in the chlorogenic acid content occurred in fresh-cut
potato strips and shredded carrots stored at 4 °C (Tudela et al., 2002; Babic et al., 1993).
At the end of the storage period, sliced tissue had significantly higher amount of
chlorogenic acid than other style cuts. However, the content of 3,4-dicaffeoylquinic acid

Table 6.2. Individual phenolic acid accumulation during storage of minimally processed sweetpotatoes. Control Shredded French-fry cut Sliced 0 days 4 days 8 days 4 days 8 days 4 days 8 days
Phenolic acid
0 °C 5 °C 0 °C 5 °C 0 °C 5 °C 0 °C 5 °C 0 °C 5 °C 0 °C 5 °C ChlA 88.3g 75.4g 150.6e 97.9fg 306.1c 93.7fg 205.9d 106.9efg 414.1b 104.3efg 261.0c 144.1ef 539.9a CafA 1.4f 2.0ef 5.8c 3.4def 1.2f 3.0def 8.2b 3.8cde 14.5a 3.2def 8.4b 4.8cd 15.8a 4,5-diCQA 5.5ab 2.6c 3.9bc 3.7bc 5.0abc 2.5c 4.5abc 2.6c 5.0abc 3.2bc 6.1ab 7.1a 5.9ab 3,5-diCQA 68.6d 57.2d 91.0bcd 71.9cd 184.1a 80.8bcd 110.0b 88.1bcd 217.4a 75.6bcd 108.5bc 94.1bcd 210.8a 3,4-diCQA 4.3e 3.0e 14.1b 3.3e 17.3a 4.4cde 7.1c 3.6e 12.3b 3.9de 6.3cd 5cde 12.2b Data expressed as µg of individual phenolic acid per g of dry weight. Mean values (n=5) with same letters within a row are not significantly different at P<0.05 (Tukey’s test). ChlA: chlorogenic acid; CafA: caffeic acid; diCQA: dicaffeoylquinic acid.
81

in the shredded cut was significantly higher than other cuts. This study indicated that
specific type or level of tissue injury may induce the production of specific types of
phenolic acids. More information on health benefits imparted by individual phenolic
acids may be helpful in marketing fresh-cut sweetpotatoes as a functional food.
CONCLUSIONS
Minimal processing of sweetpotatoes and subsequent storage can induce the
accumulation of phenolic compounds. Sliced cut sweetpotatoes had a higher total
phenolic and antioxidant activity than the other cuts. The increased phenolic content may
enhance the nutraceutical value and health beneficial properties of sweetpotatoes. In
addition to increased nutraceutical value, no loss in marketable quality was observed
during storage of fresh-cut sweetpotatoes for 8 days at 0 °C or 5 °C. This information
may be useful to the food industry in targeting fresh-cut sweetpotato as a convenience
food with increased health benefits. Further research on the effect of internal O2 and CO2
content on sweetpotato phenolics and antioxidant activity may help to optimize the
conditions which favor a high nutraceutical value and longer shelf life of fresh-cut
sweetpotatoes.
REFERENCES
Aquino-Bolanos, E.N., M.I. Cantwell, G. Peiser, and E. Mercado-Silva. 2000. Changes in the quality of fresh-cut jicama in relation to storage temperatures and controlled atmospheres. J Food Sci. 65: 1238-1243.
Brand-Williams, W., M.E. Cuvelier, and C. Berset. 1995. Use of a free-radical method to evaluate antioxidant activity. Lebensm Wiss Techol. 28: 25-30.
CIP, 2006. International Potato Center. Available from: http://www.cipotato.org. Accessed Feb 20.
82

Cisneros-Zevallos, L. 2003. The use of controlled postharvest abiotic stresses as a tool for enhancing the nutraceutical content and adding-value of fresh fruits and vegetables. J Food Sci. 68: 1560-1565.
Garret, E.H. 2002. Fresh-cut produce: tracks and trends. In “Fresh Cut Fruits and Vegetables, Science, Technology, and Market”, Lamikanra, O., (Ed.); CRC Press: Boca Raton, FL, pp 1-10.
Huang, D.J., C.D. Lin, H.J. Chen, and Y.H. Lin. 2004. Antioxidant and antiproliferative activities of sweet potato (Ipomoea batatas [L.] Lam ‘Tainong 57’) constituents. Bot Bull Acad Sin 45: 179-186.
Kojima, M. and I. Uritani. 1973. Studies on chlorogenic acid biosynthesis in sweet potato root tissue in special reference to isolation of a chlorogenic acid intermediate. Plant Physiol. 51: 768-771.
Mahmood, N., P.S. Moore, N. Detommasi, F. Desimone, S. Colman, A.J. Hay, and C. Pizza. 1993. Inhibition of HIV-infection by caffeoylquinic acid-derivatives. Antiviral Chem Chemother. 4: 235-240.
Oki, T., M. Masuda, S. Furuta, Y. Nishiba, N. Terahara, and I. Suda. 2002. Involvement of anthocyanins and other phenolic compounds in radical-scavenging activity of purple-fleshed sweet potato cultivars. J Food Sci. 67: 1752-1756.
Shimozono, H., M. Kobori, H. Shinmoto, and T. Tsushida. 1996. Suppression of the melanogenesis of mouse melanoma B 16 cells by sweet potato extract. J Jap Soc Food Sci Tech. 43: 313-317.
Swain, T. and W. Hillis.1959. The phenolic constituents of Prunus domestica. I. The quantitative analysis of phenolic constituents. J Sci Food Agric. 10: 63-68.
Tudela, J.A., E. Cantos, J.C. Espin, F.A. Tomas-Barberan, and M.I. Gil. 2002. Induction of antioxidant flavonol biosynthesis in fresh-cut potatoes. Effect of domestic cooking. J Agric Food Chem. 50: 5925-5931.
Di Venere, D., L.V., Sergio L, and V.V. Bianco. 2005. Antioxidant phenolics in escarole and radicchio during storage of fresh-cut 'ready-to-use' product. Acta Hort. 682: 1947-1951.
Walter, W.M., A.E. Purcell, and G.K. McCollum. 1979. Use of high-pressure liquid-chromatography for analysis of sweet-potato phenolics. J Agric Food Chem. 27: 938-941.
Yagasaki, K., Y. Miura, R. Okauchi, and T. Furuse. 2000. Inhibitory effects of chlorogenic acid and its related compounds on the invasion of hepatoma cells in culture. Cytotechnol. 33: 229-235.
83

Dixon, R.A. and N.L. Paiva 1995. Stress-induced phenylpropanoid metabolism. Plant Cell. 7: 1085-1097.
Babic, I., M.J. Amiot, C. Nguyen-The, and S. Aubert. 1993. Changes in phenolic content in fresh ready-to-use shredded carrots during storage. J Food Sci. 58: 351-355.
Tomas-Barberan, F.A., J. Loaize-Velarde, A. Bonfanti, and M.E. Slatveit. 1997. Early wound- and ethylene-induced changes in phenylpropanoid metabolism in harvested lettuce. J Am Soc Hort Sci. 122: 399-404.
Cantos, E., J.A. Tudela, M.I. Gill, and J.C. Espin. 2002. Phenolic compounds and related enzymes are not rate-limiting in browning development of fresh-cut potatoes. J Agric Food Chem. 50: 3015-3023.
Rabah, I.O., D.X. Hou, S.I. Komine, and M. Fujii. 2004. Potential chemopreventive properties of extract from baked sweet potato (Ipomoea batatas Lam. cv. Koganesengan). J Agric Food Chem. 52: 7152-7157.
Scalbert, A., C. Manach, C. Morand, C. Remesy, and L. Jimenez. 2005. Dietary
polyphenols and the prevention of diseases. Crit Rev Food Sci Nutr. 45: 287-306. Chubey, B.B. and R.E. Nylund. 1969. Surface browning in carrots. Can J Plant Sci. 49:
421-426.
84

CHAPTER 7. PHENOLIC COMPOSITION AND ANTIOXIDANT ACTIVITY OF SWEETPOTATO CULTIVARS
INTRODUCTION
The role of polyphenols in preventing many chronic diseases including cancer,
cardiovascular diseases, and diabetes has been well documented (Scalbert et al., 2005).
Recent interest in phenolics and antioxidant compounds has prompted research to explore
the health beneficial properties of many fruits and vegetables. Sweetpotato, an important
food crop of the world, has been reported to be a good source of phenolics and
antioxidants (Walter et al., 1979; Hayase and Kato, 1984). Recent studies have revealed
the potential chemopreventive properties of sweetpotato extracts (Rabah et al., 2004;
Shimozono et al., 1996). Most of the commercially grown sweetpotato cultivars are
orange-fleshed or white-fleshed; however, purple-fleshed cultivars are used as a source of
natural food colorant (Yoshinaga et al., 1999. Purple-fleshed sweetpotatoes were reported
to have higher antioxidant properties than orange or white-fleshed cultivars (Furuta et al.,
1998). In addition to anthocyanins, phenolic acids (i.e. chlorogenic and dicaffeoylquinic
acids) contribute to the antioxidant activity and other heath beneficial effects of purple-
fleshed cultivars (Oki et al., 2002).
Sweetpotato cultivars of different flesh color may differ in their phenolic
composition and antioxidant properties. In addition, cultivars with the same flesh color
may differ in total phenolic content, individual phenolic acid profile, and antioxidant
activity. Among six orange-fleshed cultivars analyzed, the total and individual phenolic
acid content was highest in ‘Australian Canner’ and lowest in ‘Centennial’ (Walter and
Purcell, 1979). Four isomers of caffeoylquinic acid were reported to be present in
fourteen sweetpotato cultivars and breeding lines, although they were not quantified
85

(Thompson, 1981). Harrison et al. (2003) reported caffeic acid content varied greatly
among 24 sweetpotato cultivars and breeding lines. Despite the previous studies, there is
limited information available on phenolic composition and antioxidant properties of the
major sweetpotato cultivars grown and marketed in the U.S. and E.U. (European Union).
This study was initiated to compare the phenolic composition and antioxidant activity of
commercially important sweetpotato cultivars and breeding lines.
MATERIALS AND METHODS
Reagents
Chlorogenic acid and caffeic acid standards, Folin-Denis reagent and DPPH (1, 1-
diphenyl-2-picrylhydazyl) reagent were purchased from Sigma-Aldrich (St. Louis, MO).
Standards of three isomers of dicaffeoylquinic acid (4,5-diCQA; 3,5-diCQA; 3,4-diCQA)
were kindly provided by Dr. Makoto Yoshimoto (Department of Upland Farming,
Kyushu National Agricultural Experiment Station, Miyakonojo, Miyazaki, Japan).
Plant Material
Sweetpotato cv. ‘Beauregard’ and breeding lines 9935 (orange-fleshed), 03-268
(orange-fleshed), 04-10 (white-fleshed) and 02-814 (purple-fleshed) were grown at the
LSU AgCenter Burden Research Center at Baton Rouge, La, in 2005. An additional
twelve most important commercial cultivars in the E.U. market were obtained from
importers in January, 2006.
Tissue Preparation and Extraction
Randomly selected sound roots, approximately 300 g in weight, were washed and
dried at ambient temperature (~22 °C) before tissue preparation. Roots were cut into half
and grated manually. The grated tissue was immediately frozen at -45 °C, lyophilized,
86
and powdered for further extraction. Exactly 0.5 g of lyophilized tissue (root or leaf) was
placed in a 15 ml Falcon centrifuge tube. Approximately 8 ml of 80% methanol was
added to the centrifuge tube. The tubes were capped and immersed in a water bath at 80
°C for 10 minutes. After vigorously shaking the heated samples for 30 seconds, the tubes
were cooled and centrifuged at 4,500 g for 15 minutes. The clear supernatant was
decanted and brought to a final volume of 10 ml using 80% methanol and analyzed for
total phenolic content, individual phenolic acids content and antioxidant activity.
Total Phenolics
Total phenolic content was determined by modification of the Folin-Denis method
(Swain and Hillis 1959). Exactly 0.5 ml of supernatant was placed in a 25 ml test tube
and mixed with 8 ml of Megapure water (Barnstead MP-12A, Haverhill, MA) followed
by the addition of 0.5 ml of Folin-Denis reagent. After 3 minutes, 1 ml of 1 N Na2CO3
was added and the solution was allowed to stand for 2 hours at ambient temperature (~21
°C). Absorbance of the resulting blue complex was measured at 750 nm using a Lambda
35 UV/Vis spectrophotometer (PerkinElmer Instruments, Norwalk, CT) A standard curve
of chlorogenic acid (50-300 µg/ml concentration) was plotted. The total phenolic content
was expressed as mg chlorogenic acid equivalent/g dry weight.
Antioxidant Activity
The antioxidant activity was measured according to Brand-Williams et al. (1995),
with slight modifications. DPPH (1, 1-diphenyl-2-picrylhydazyl) was used as the source
of free radicals. The absorbance of free radicals at 520 nm disappears upon their
reduction by an antioxidant. In this study, Trolox (6-hydroxy-2, 5, 7, 8-tetramethyl-
chroman-2-carboxylic acid) was used as the standard antioxidant compound. An aliquot
87
(300 μl) with a suitable dilution of sweetpotato extract was placed in a 1.5 ml amber
colored centrifuge tube. Exactly 600 μl of 0.1 M 2-(N-morpholine) ethanesulfonic acid
(MES) (pH 6.0) and 300 μl of 0.4 mM of DPPH solution were added to the centrifuge
tube. The resultant mixture was shaken and held in the dark for 2 minutes. The decrease
in DPPH absorbance was measured at 520 nm using a Lambda 35 UV/Vis
spectrophotometer (PerkinElmer Instruments, Norwalk, CT). For the control, the
sweetpotato extract was replaced with 80% methanol. The 80% methanol solution
without DPPH was used to calibrate the spectrophotometer. The antioxidant activity was
calculated from a standard curve made with known concentrations of Trolox and
expressed in terms of mg Trolox equivalent/g dry weight.
Individual Phenolic Acids
Separation of individual phenolic acids was accomplished using reversed-phase
HPLC with a Gemini C18, 5 µm, 4.6 × 250 mm (Phenomenex, Torrance, CA) column.
An aliquot of the supernatant was filtered through a 0.45 µm Nylaflo membrane filter
(Pall Corp., East Hills, NY). A sample volume of 20 µl of was injected onto the column
using a Waters 717 autosampler connected to a Waters 600E pump (Waters Corp.,
Milford, MA). Phenolic acids were eluted using a mobile phase consisting 1% (v/v)
formic acid in aqueous solution: acetonitrile: 2-propanol (70:22:8), pH 2.5 with an
isocratic flow rate of 0.75 ml/min. Peaks detected were identified and quantified by
comparing the retention time and peak area to that of known standards. Quantification
was based on absorbance at 320 nm using a Waters 2487 dual wavelength UV
absorbance detector.
88

Statistical Analysis
A completely randomized design with five replications per cultivar was used.
Each root was considered as one replication. Data was analyzed by SAS procedure
MIXED (SAS Institute Inc., Cary, NC) and means were separated using Tukey’s test
(P<0.05).
RESULTS AND DISCUSSION
Total Phenolics and Antioxidant Activity
Our results indicated that cultivars and breeding lines differed considerably in
total phenolic content and antioxidant activity (Table 7.1). The total phenolic content and
Table 7.1. Total phenolics and antioxidant activity of different sweetpotato cultivars and breeding lines. Cultivar or Breeding line
Source Flesh Color Total phenolics*
Antioxidant activity**
02-814 Louisiana Purple 4.7a 4.6a Jamaican Jamaica White 4.1ab 3.4b Abees Egypt White 3.7ab 3.0bc Rubina Israel Orange 3.4bc 2.5cde Bosbok Honduras White 3.4bcd 1.3g Diane California Orange 3.0bcde 3.6b California Organic California Orange 2.5cdef 2.7bcd Uganda Uganda White 2.4cdef 1.8efg 9935 Louisiana Orange 2.0defg 2.0def Darby California Orange 1.9efg 1.9efg 03-268 Louisiana Orange 1.9efg 1.8fg Beauregard Louisiana Orange 1.8efg 1.8efg Kumara New Zealand White 1.7fg 1.4fg Bosbok Brazil White 1.7fg 1.9def Golden Sweet California Cream 1.6g 1.0g O’Henry Louisiana White 1.4fg 1.3fg 04-10 Louisiana White 1.1g 1.6g *Data expressed as mg of chlorogenic acid equivalents per g of dry weight. **Data expressed as mg of Trolox equivalents per g of dry weight. Mean values (n=5) with the same letters in a column are not significantly different at P<0.05 (Tukey’s test). antioxidant activity of different cultivars and breeding lines ranged from 1.1 to 4.7 mg/g
dry weight and 1.0 to 4.6 mg/g dry weight, respectively. A purple-fleshed breeding line,
89

‘02-814’, had the highest total phenolic content, followed by a Jamaican grown white-
fleshed cultivar. However, the antioxidant activity of the California-grown orange-
fleshed cultivar ‘Diane’ was next highest to the purple-fleshed breeding line. A white-
fleshed breeding line, ‘04-10’, and the California-grown cultivar ‘Golden Sweet’
contained the least amounts of total phenolic content and antioxidant activity,
respectively. In general, there was a trend of increased antioxidant activity with increased
total phenolic content.
In agreement with our results, Furuta et al. (1998) indicated purple-fleshed
sweetpotatoes had higher antioxidant activity than orange- or white-fleshed cultivars. The
high antioxidant activity of purple-fleshed sweetpotato cultivars was due to both
anthocyanin and phenolic acids (Oki et al., 2002). This study indicated that sweetpotato
cultivars vary widely in their antioxidant values and potential use as functional foods.
The information generated from this research may assist breeders interested in increasing
the health beneficial properties of a sweetpotato cultivar while ensuring the specific taste
and flesh color preferred by the consumer. The contribution of phenolic compounds to
sweetpotato taste needs to be further investigated.
Individual Phenolic Acids
Five individual phenolic acids were identified in the sweetpotato genotypes by
comparing the retention time with those of known standards. Those included chlorogenic
acid (ChlA), caffeic acid (CafA), 4,5-dicaffeoylquinic acid (4,5-diCQA), 3,5-
dicaffeoylquinic acid (3,5-diCQA), and 3,4-dicaffeoylquinic acid (3,4-diCQA). Two
unidentified peaks which eluted immediately before and after the chlorogenic acid peak
were tentatively identified as isomers of chlorogenic acid (neochlorogenic and
90

cryptochlorogenic acid). Our results indicated significant differences exist in individual
phenolic acid content among sweetpotato cultivars and breeding lines (Table 7.2). In
general, chlorogenic and 3,5-dicaffeoylquinic acid were the two most abundant phenolic
acids in all cultivars and breeding lines. However, the phenolic profiles of California-
Table 7.2. Individual phenolic acid content of different sweetpotato cultivars and breeding lines.
ChlA CafA 4,5-diCQA
3,5-diCQA
3,4-diCQA
Cultivar or Breeding line
Source Flesh color
µg/g dry weight
02-814 Louisiana Purple 231.6bc 20.5a 284.4a 485.6a 125.6a Jamaican Jamaica White 422.4a 6.2bcd 25.3bcd 431.6a 25.8b Abees Egypt White 183.7cdef 0.5d 12.4bcd 197.7bcd 13.3b Rubina Israel Orange 181.3cde 4.7cd 16.0bcd 268.4b 10.8b Bosbok Honduras White 36.6g 0.4d 4.6cd 46.0d 0.7b Diane California Orange 357.8ab 13.4ab 17.2bcd 177.5bcd 12.3b California Organic
California Orange 167.5cdef 7.2bcd 9.2bcd 85.1cd 1.9b
Uganda Uganda White 168.0cdef 1.4d 9.9bcd 205.4bc 7.8b 9935 Louisiana Orange 169.8cdef 9.4bc 9.4bcd 151.3bcd 5.6b Darby California Orange 113.4cdefg 5.2cd 10.3bcd 56.3cd 5.9b 03-268 Louisiana Orange 197.9cd 12.5b 10.5bcd 138.2bcd 4.9b Beauregard Louisiana Orange 205.5cd 8.9bc 32.4b 148.3bcd 6.7b Kumara New
Zealand White 79.5defg 0.9d 25.2bcd 114.1cd 10.9b
Bosbok Brazil White 37.4g 0.5d 2.5d 50.5d 1.9b Golden Sweet
California Cream 25.9g 4.6cd 31.5bc 81.0cd 8.9b
O’Henry Louisiana White 55.3efg 0.9d 6.7cd 41.2d 2.1b Mean values (n=5) with the same letters in a column are not significantly different at P<0.05 (Tukey’s test). ChlA: chlorogenic acid; CafA: caffeic acid; diCQA: dicaffeoylquinic acid. grown ‘Golden Sweet’, ‘California Organic’, Honduras-grown ‘Bosbok’ and a purple
fleshed breeding line were different from the other cultivars. In these cultivars, a peak
eluting immediately before chlorogenic acid had a higher peak area than chlorogenic acid
peak indicting that an isomer of chlorogenic acid may be the predominant acid in these
cultivars. Caffeic acid was the least abundant phenolic acid in most of the sweetpotato
91

cultivars and breeding lines. The highest content of chlorogenic acid (422.4 µg/g dry
weight) was present in the white-fleshed Jamaican cultivar. However, a purple fleshed
breeding line had the highest amount of 3,5-dicaffeoylquinic acid (485.6 µg/g dry
weight); 4,5-dicaffeoylquinic acid (284.4 µg/g dry weight); 3,4-dicaffeoylquinic acid
(125.6 µg/g dry weight), and caffeic acid (20.5 µg/g dry weight) . Among all orange-
fleshed cultivars and breeding lines, the cultivar ‘Diane’ had the highest content of
individual phenolic acids. Consistent with our results, significant differences were found
in chlorogenic and dicaffeoylquinic acid content of other sweetpotato cultivars and
breeding lines previously analyzed (Son et al., 1991; Walter and Purcell, 1979). The high
caffeic acid content in sweetpotato cultivars was associated with a defense mechanism
against certain pathogen (Harrison et al., 2003). Further research is needed to find a
correlation, if any, between major individual phenolic acids and disease resistance of
specific cultivars.
CONCLUSIONS
A wide variation existed in phenolic content and antioxidant activity among
sweetpotato cultivars and breeding lines. Information on phenolic acid profile and
antioxidant activity of existing sweetpotato cultivars may assist sweetpotato breeders
programs to develop cultivars with superior health benefits and high nutraceutical value.
The extract from cultivars with high phenolic and antioxidant contents may have the
potential for use as natural antioxidants. In addition, further research on the relationship
between individual phenolic acid concentration and sweetpotato disease resistance is
important.
92

REFERENCES
Brand-Williams, W., M.E. Cuvelier, and C. Berset. 1995. Use of free radical method to evaluate antioxidant activity. Lebensm Wiss Technol. 28: 25-30.
Furuta, S., I. Suda, Y. Nishiba, and O. Yamakawa. 1998. High tert-butylperoxyl radical scavenging activities of sweet potato cultivars with purple flesh. Food Sci Technol Int. 4: 33-35.
Harrison, H.F., J.K. Peterson, M.E. Snook, J.R. Bohac, and D.M. Jackson. 2003. Quantity and potential biological activity of caffeic acid in sweet potato [Ipomoea batatas (L.) Lam.] storage root periderm. J Agric Food Chem. 51: 2843-2848.
Oki, T., M. Masuda, S. Furuta, Y. Nishiba, N. Terahara, and I. Suda. 2002. Involvement of anthocyanins and other phenolic compounds in radical-scavenging activity of purple-fleshed sweet potato cultivars. J Food Sci. 67: 1752–1756.
Rabah, I.O., D.X. Hou, S.I. Komine, and M. Fujii. 2004. Potential chemopreventive
properties of extract from baked sweet potato (Ipomoea batatas Lam. cv. Koganesengan). J Agric Food Chem. 52: 7152-7157.
Scalbert, A., C. Manach, C. Morand, C. Remesy, and L. Jimenez. 2005. Dietary
polyphenols and the prevention of diseases. Crit Rev Food Sci Nutr. 45: 287-306.
Shimozono, H., M. Kobori, H. Shinmoto, and T. Tsushida. 1996. Suppression of the melanogenesis of mouse melanoma B16 cells by sweet potato extract. J Jap Soc Food Sci Tech. 43: 313-317.
Son, K.C., R.F. Severson, M.E. Snook, and S.J. Kays. 1991. Root carbohydrate, organic acids and phenolic chemistry in relation to sweetpotato weevil resistance. Hortscience. 26: 1305-1308.
Swain, T. and W.E. Hillis. 1959. The phenolic constituents of Prunus domestica. I. The quantitative analysis of phenolic constituents. J Sci Food Agric. 10: 63-68.
Thompson, D.P. 1981. Chlororgenic acid and other phenolic compounds in fourteen sweet potato cultivars. J Food Sci. 46: 738-740.
Walter, W.M. and A.E. Purcell 1979. Evaluation of several methods for analysis of sweet potato phenolics. J Agric Food Chem. 27: 942-946.
Walter, W.M., A.E. Purcell, and G.K. McCollum. 1979. Use of high-pressure liquid chromatography for analysis of sweet potato phenolics. J Agric Food Chem. 27: 938-941.
93
Yoshinaga, M., Y. Osamu, and N. Makoto. 1999. Genotype diversity of anthocyanin content and composition in purple-fleshed sweetpotato [Ipomoea batatas (L.) Lam]. Breed Sci. 49: 43-47.
94
CHAPTER 8. SUMMARY
Phenolic compounds are important secondary metabolites in sweetpotatoes and
contribute to the nutraceutical value of the edible tissue. The objectives of this study were
to determine the factors affecting the phenolic composition and antioxidant activity in
sweetpotatoes. In addition, methodologies for quantification of total phenolics and
individual phenolic acids in sweetpotatoes were optimized. Among the two most
commonly used procedures for total phenolic assay, Folin-Denis reagent provided more
reliable and accurate results than Folin-Ciocalteu reagent. The best separation of
individual phenolic acids with a short analysis time (< 10 minutes) was based on
reversed-phase HPLC using a 5-µm, 4.6 × 250 mm column with a mobile phase
consisting of 1% (v/v) formic acid aqueous solution: acetonitrile: 2-propanol (70:22:8),
pH 2.5. Methanol and ethanol provided higher phenolic acid extraction efficiency than
acetone, while use of hexane to remove polar lipids provided no advantage. The
antioxidant activity was measured using the 1,1-diphenyl-2-picrylhydazyl (DPPH) free
radical assay.
Many factors influence the concentration of total phenolics, individual phenolic
acids, and antioxidant activity in sweetpotatoes. These factors include growth stage of the
tissue, type of tissue, genotype, and postharvest care (curing, storage temperature,
duration, and processing). Small roots at the initial stages of growth and young immature
leaves contained the highest amounts of phenolic content and antioxidant activity.
Sweetpotato leaf tissue had a significantly higher phenolic content and antioxidant
activity than root tissue. Due to their high phenolic content and antioxidant activity, small
95
immature roots and leaves may be useful plant tissue sources of potential nutraceutical
compounds.
Microwaving, conventional oven baking, and boiling are the most widely used
methods of sweetpotato processing at home and in food-service establishments.
Conventional oven baking of sweetpotatoes resulted in a higher loss of total phenolics,
individual phenolic acids, and antioxidant activity compared to microwaving and boiling.
Among root tissue locations, the outer periderm or skin tissue had the highest phenolic
content and antioxidant potential. Functional food manufacturers interested in using
sweetpotato roots as a concentrated source of phenolic compounds and antioxidants
should focus on utilization of the skin tissue.
Short durations of 4 week storage at low temperature (5 °C) significantly
increased phenolic compound concentration and antioxidant activity in sweetpotatoes.
The concentration of phenolic compounds and antioxidant activity increased significantly
when low temperature stored roots were transferred to ambient temperature (~ 22 °C).
Non-cured roots accumulated a higher phenolic content and antioxidant activity than
cured roots. A brief period (~3 weeks) of low temperature storage may significantly
increase phenolic content and antioxidant activity without causing a loss in root
marketability.
Although sweetpotatoes are well known as a nutritionally rich crop, their use in
the fresh-cut industry is limited. Minimally processing of sweetpotatoes (shredding,
French-fry cut, and slicing) followed by 8 days storage at 5 °C resulted in a significant
increase in phenolic compounds. No tissue browning was observed after 8 days of storage
and the fresh-cut product was considered to be marketable. Another factor affecting the
96

phenolic content and antioxidant activity was the genotype or cultivar. A purple-fleshed
breeding line had the highest concentration of phenolics and antioxidant activity
compared to orange- and white-fleshed cultivars.
In general, chlorogenic acid and 3, 5-dicaffeoylquinic acids were the predominant
individual phenolic acids in sweetpotatoes while caffeic acid was the least abundant.
Other identified phenolic acids included 4,5-dicaffeoylquinic and 3,4-dicaffeoylquinic
acids. Several unidentified peaks occurring in the HPLC separation were speculated to be
isomers of chlorogenic acid and 3,4,5-tricaffeoylquinic acid. Results from this research
indicated the trend of changes in individual phenolic acids generally paralleled that of
total phenolic content.
The understanding of the mechanisms involved in phenolic acid synthesis in
sweetpotato may facilitate the use of appropriate pre- and/or postharvest treatments to
enhance the nutraceutical value of sweetpotatoes. The mechanism of loss in phenolic
compounds during high temperature processing requires further investigation.
97

VITA
Malkeet Padda was born in Punjab, a northern region of India. He attended his
high school in Batala, Punjab. Malkeet received a Bachelor of Science in agriculture
(1998) and Master of Science in horticulture (2001) at Punjab Agricultural University,
Ludhiana, India. He enrolled in the doctoral program in horticulture at Louisiana State
University in Baton Rouge, in 2003. Malkeet is married and blessed with a baby girl
‘Reet’.
98