phdthesis - paul sabatierthesesups.ups-tlse.fr/913/1/he_yongfeng.pdf · phdthesis ’...
TRANSCRIPT

Cotutelle
PhD THESIS
For the obtaining of
JOINT DOCTORAT of the UNIVERSITY
Delivered by: L’Université Toulouse 3 Paul Sabatier (France) & l’Institut d’Hydrobiologie (Wuhan)
Discipline / Speciality : Aquatique Ecology
Presented & defended by: Yongfeng HE
At IHB (Wuhan), 29th May 2010
Structure of endemic fish assemblages in the upper Yangtze River
basin and population differentiation of an endangered endemic
fish (Gobiocypris rarus)
JURY MEMBERS:
Thierry OBERDORFF Research Director, IRD Paris Referee Xinhui LI Professor, PRFRI Guangzhou Referee Sovan LEK Professor, University of Toulouse Director of thesis Sithan LEK-ANG Ass. Professor, University of Toulouse Co-director of thesis Shunping HE Professor, CAS-IHB Wuhan Bangxi XIONG Professor, Huazhong Agricultural University (Wuhan) Huanzhang LIU Professor, CAS-IHB Wuhan Zhongjie LI Professor, CAS-IHB Wuhan
Ecole doctorale : Sciences Ecologiques, Vétérinaires, Agronomiques et Bioingénieries (SEVAB-Toulouse)
Research Units: Evolution & Diversité Biologique (Toulouse) & IHB-CAS (Wuhan)
Director(s) of Thesis: Sovan LEK & Wenxuan CAO

Acknowledgements
I would like to express my gratitude to all those who helped me during my PhD
study. Many people have made invaluable contributions, both directly and indirectly
to my research.
My deepest gratitude goes first and foremost to Professor Sovan LEK, my
supervisor, for his constant encouragement and guidance. Without his consistent and
illuminating instruction, this thesis could not reach its present form. Associate
Professor Sithan LEK-ANG is my co-supervisor. Thank you for your kindness of
looking after me wholeheartedly. Your kindest let me feel the warmth of home when I
am studying in Toulouse.
I would like to express my gratitude to Academician Wenxuan CAO, who led me
into the world of scientific research. His profound knowledge of Ichthyology
stimulates me to loving this beautiful scientific realm.
I am greatly indebted to my supervisor, Professor Jianwei WANG, for his
valuable suggestions and instructions on my thesis. He makes me having more
confidence. I thank him for generously sharing his knowledge and time, for being
patient with my questions. I would like to thank Professor Huanzhang LIU, who had
given me a lot of instructive advices and useful suggestions on my study.
I wish to thank Dr. Simon BLANCHET and Clément TISSEUIL, who gave me
their great help in data analysis and modeling construction. I am deeply grateful of Dr.
Loïc TUDESQUE’s help in collecting data and drawing maps. Special thanks should
go to Dr. Cândida SHINN, who gave me a lot of valuable advices in the English
writing and took care of my daily life during my staying in Toulouse. I owe my
gratitude to my friend, Dr. Apinun SUVARNARAKSHA who gave me his sincere
help during our stay in France. Because of your accompanying, my journey to
European countries is interesting.

I also owe my sincere gratitude to my friends and colleagues who gave me their
care and help during my stay in France. They are Sébastien BROSSE、Gaël
GRENOUILLET、Muriel GEVREY、Géraldine LOOT、Laetitia BUISSON、Roseline
ETIENNE、Dominique GALY、Dominique PANTALACCI. Besides, I wish to thank
all my colleagues in the Lab. “Ecology and Conservation Biology of Freshwater
Fishes” of the Institute of Hydrobiology in Hubei Province of China.
Last my thanks would go to my beloved parents and elder brother for their
whole-hearted support and endless love in me all through these years.
This research was supported by the CTGPC (China Three Gorges Project
Corporation, Compensation Project of National Nature Reserve for the Rare and
Endemic Fishes in the Upper Yangtze River, 071105-04), the NSFC (30670292),
Science Innovation of Chinese Academy of Sciences (KSCX2-SW-125), the
technological fundamental conditions platform program by China Hubei Provincial
Science and Technology Department, the Public Welfare Research Project from the
Ministry of Water Resources of the People’s Republic of China (200901011) and the
French embassy by providing PhD grants for the co-tutelle PhD research.
Résumé
Le fleuve Yangtze (Changjiang en chinois) supporte une très riche biodiversité de
poissons, avec environ 400 espèces au total. Assimilée à une barrière eco-fonctionnelle, la
partie amont du Yangtze présente des conditions environnementales naturelles exceptionnelles,
avec une hétérogeneité bien prononcée des habitats, un système de drainage bien développé,
une abondance en ressources en eau and une biodiversité importante. Ainsi, on dénombre 286
espèces de poissons dans la partie amont du Yangtze, dont 124 endémiques à cette région.
Cependant, cette biodiversité est fortement menacée, notamment du fait de la surexploitation,
de la pollution des eaux, des barrages hydroélectriques, des invasions biologiques et des
modifications environnementales. Il est de ce fait impératif de mesurer les influences de ces
changements environnementaux sur la ressource piscicole, de telle sorte à accélérer la mise en
place de mesures de conservation. En conséquent, cette thèse avait pour objectif d’apporter des
éléments visant à favoriser la conservation des espèces endémiques de poisons dans la partie
amont du fleuve Yangtze.
Dans la première partie de la thèse, l’objectif est d’illustrer les mécanismes de
structuration des assemblages de poissons pour améliorer les connaissances des processus
écologiques de la partie amont du fleuve Yangtze, i.e. déterminer les patrons spatiaux de
distribution des poissons endémiques et les relations avec les variables environnementales
(publications P1 & P2). Nous avons pu définir cinq assemblages de poissons endémiques dans
le haut Yangtze caractérisés par des différences significatives au niveau de la richesse
spécifique. Ces assemblages reflètent le gradient longitudinal de la distribution des espèces et
de richesse avec une forte corrélation avec la topographie et la géomorphologie du fleuve
Yangtze. Chaque assemblage est caractérisé par des espèces endémiques « indicatrices ». Le
patron de distribution des poissons endémiques est significativement corrélé avec les facteurs
environnementaux de l’utilisation du sol du bassin versant et des caractéristiques du fleuve. Des
modèles mixtes utilisant simultanément des paramètres d’utilisation du sol et des
caractéristiques du fleuve permettent d’assurer une meilleure prédiction de l’assemblage des
poissons endémiques du Yangtze, comparés à des modèles utilisant séparément les 2 groupes
de paramètres environnementaux. Enfin, nous suggérons trois points importants pour la
conservation des espèces endémiques de poissons du haut Yangtze: sélection de plusieurs sites
protégés de diverses espèces; maintient d’une partie courante naturelle pour chaque cours d’eau
parmi les affluents; développement de mise en réserve des affluents.
Dans la deuxième partie de la thèse, afin d’obtenir une bonne connaissance d’une espèce

de poisson endémique en danger (Gobiocypris rarus) et fournir des instructions pour la
conservation des autres espèces du haut Yangtze, nous avons utilisé cette espèce comme
exemple d’étude de conservation à l’aide de marqueurs microsatellites et morphologiques
(publications P3, P4 et P5). L’habitat typique de G. rarus était caractérisé par une seule
population stable qui présentait une taille effective relativement large et aucune évidence de
structure cryptique au cours des dix dernières années. Les forces maintenant cette diversité
génetique était principalement les fluctuations environnementales et les traits d’histoire de vie
propres à G. rarus. A une échelle spatiale plus étendue, nous avons trouvé des patrons
significatifs de différentiation entre plusieurs populations de G. rarus, d’un point de vue
génétique mais aussi morphologique. Particulièrement, deux clusters génétiques reflétant la
structure du réseau hydrographique ont été identifiés. L’étude comparée des patrons d’isolation
par la distance nous a permis de conclure que G. rarus était capable de migrer de réseau en
réseau davantage via les canaux d’irrigations que via l’embouchure des rivières. Nous avons
également mis en évidence un dimorphisme sexuel cryptique (i.e. visible uniquement que
quelque trait morphologique continu). Finalement, au vue de cette distribution discontinu (tant
d’un point de vue génétique que morphologique) et étant donné les menaces écologiques
attendu, nous conseillons que la plupart des populations étudiées soit préservées. Plus
particulièrement, les populations T1, T2, Q2, M3 et D2 devraient être prioritaire d’un point de
vue de la conservation, avec une gestion de l’habitat et de l’espèce particulièrement forte dans
ces localités.
Mots-clés: assemblage poisons endémiques, amont fleuve Yangtze, modélisation, variables
environnementales, microsatellites, morphologie, Gobiocypris rarus.
Abstract
The Yangtze River, also called Changjiang, supports rich biodiversity, especially diverse
fish fauna, i.e., about 400 fish species and subspecies. As an eco-functional barrier of the
Yangtze River, the upper Yangtze River exhibits complicated natural environment, pronounced
habitat heterogeneity, well-developed drainage system, abundant water resources and rich
biodiversity. There were 286 fish species and subspecies distributing in the upper Yangtze
River, among which 124 species were endemic. However, these fish resources are experiencing
large threats: overexploitation, water pollution, hydropower projects, invasion by exotic species,
and global environmental changes. It is imperative to evaluate the influences of the changes in
environmental features on the fish resources and to accelerate the progress of conservation
projects. Therefore, two parts of content have been studied in this thesis for the conservation of
endemic fishes in the upper Yangtze River.
Firstly, for the purpose of providing insight into mechanisms structuring fish assemblages
and enhancing knowledge on ecological processes in the upper Yangtze River, spatial pattern
of endemic fishes in the upper Yangtze River basin and their relationship with environmental
features have been studied in P1 and P2 of this thesis. We identified five endemic fish
assemblages in the upper Yangtze River basin. Not only species composition but also endemic
species richness varied significantly among these five assemblages. They not only reflect the
longitudinal gradient pattern but also are closely correlated with the topography and
geomorphology of the Yangtze River. Each endemic fish assemblage has its specific indicator
species. The endemic fish distribution patterns are significantly correlated with environmental
factors such as land-cover features and river characteristics. The mixed models containing both
land-cover features and river characteristics are more effective than any individual one in
explaining complex endemic fish distribution patterns in the upper Yangtze River basin. Finally,
we suggested that three key points for the conservation of endemic fishes in the upper Yangtze
River basin should be paid more attention: selection of several protected sites aiming at various
species; maintenance of at least one flowing reach in each river; developing the conservation of
tributaries.
Secondly, in order to obtain enough background of an endangered endemic fish
(Gobiocypris rarus) and provide guidelines for other species conservation in the upper Yangtze
River basin, the author used this Chinese rare minnow (G. rarus) as an example to do the
studies of conservation biology using microsatellite markers and morphological traits in P3, P4
and P5 of this thesis. The type locality of G. rarus held a single stable and healthy population

with a relatively large Ne and no cryptic structure during nearly ten years. The forces
maintaining their genetic diversity were mainly from environmental fluctuations and life
history traits. In addition, there were significant differentiations among wild populations of G.
rarus not only in genetic markers but also in morphometric traits. Two obvious genetic clusters
were revealed among wild populations of G. rarus, reflecting out water system structure to
some extent. An isolation-by-riparian-distance pattern was identified, indicating that G. rarus
might migrate through some man-made channels of hydropower projects but not through the
mouth of the Minjiang and Tuojiang Rivers to exchange genes. Sexual dimorphism existed in
morphometric traits of G. rarus wild populations. Finally, in the view of discontinuous
distribution, significant genetic and quantitative differentiation of wild populations, and large
threats from human activities, all the studied populations should be protected. Especially,
populations T1, T2, Q2, M3 and D2 should be in prior conservation, and a habitat and species
management area should be established in its type locality (viz. population D2).
Key words: endemic fish assemblage, upper Yangtze River, modeling, environmental
variables, microsatellites, morphology, Gobiocypris rarus.
Part 1: Synthesis 1
1. General Introduction ...............................................................................................2
1-1. Freshwater biodiversity ......................................................................................2
1-2. Distribution of fishes in the upper Yangtze River ..............................................3
1-2-1. The Yangtze River ......................................................................................3
1-2-2. Fishes of the upper Yangtze River basin.....................................................5
1-3. Objectives of this thesis ....................................................................................21
2. General Methodology ............................................................................................22
2-1. Studied sites and data collection.......................................................................22
2-1-1. The Upper Yangtze River .........................................................................22
2-1-2. Data collection...........................................................................................24
2-2. Modeling Methods............................................................................................27
2-2-1. Patterning model .......................................................................................28
2-2-2. Predicting model .......................................................................................30
2-3. Molecular methods ...........................................................................................32
3. Main Results ...........................................................................................................35
3-1. Spatial pattern of endemic fishes and roles of environmental factors in the upper Yangtze River (P1 and P2) ...........................................................................35
3-2. Population differentiation of an endangered endemic fish (Gobiocypris rarus) in the upper Yangtze River (P3, P4 and P5)...........................................................38
4. General Discussion and Conclusion .....................................................................41
4-1. Geographic distribution patterns of endemic fish assemblages in the upper Yangtze River (P1) ..................................................................................................41
4-2. Effects of environmental factors on endemic fishes distribution pattern (P2) .44
4-3. Conservation implications for endemic fishes in the upper Yangtze River basin (P1 and P2)..............................................................................................................45
4-4. Population differentiation of G. rarus (P3, P4 and P5)...................................47
References ...................................................................................................................53

Part 2: Publications 66
P1) He Y., Wang J., Lek S., Cao W. & Lek-Ang S. (2009) Structure of endemic fish
assemblages in the upper Yangtze River Basin. River Research and Applications, doi:
10.1002/rra.1339, in press
P2) He Y., Wang J., Lek-Ang S. & Lek S. (2010) Predicting assemblages and species
richness of endemic fish in the upper Yangtze River. Science of the Total
Environment, accepted
P3) He Y. & Wang J. (2010) Temporal variation in genetic structure of the Chinese
rare minnow (Gobiocypris rarus) in its type locality revealed by microsatellite
markers, Biochemical Genetics, 48: 312-325.
P4) He Y., Wang J., Blanchet S. & Lek S. (2010) Genetic structure of an endangered
endemic fish (Gobiocypris rarus) in the upper Yangtze River, Journal of Fish Biology,
submitted
P5) He Y., Wang J. & Lek S. (2010) Morphological variation among wild
populations of Chinese rare minnow (Gobiocypris rarus) in four river basins. In
preparation.
Structure of endemic fish assemblages and population differentiation of G. rarus in the upper Yangtze River basin
1
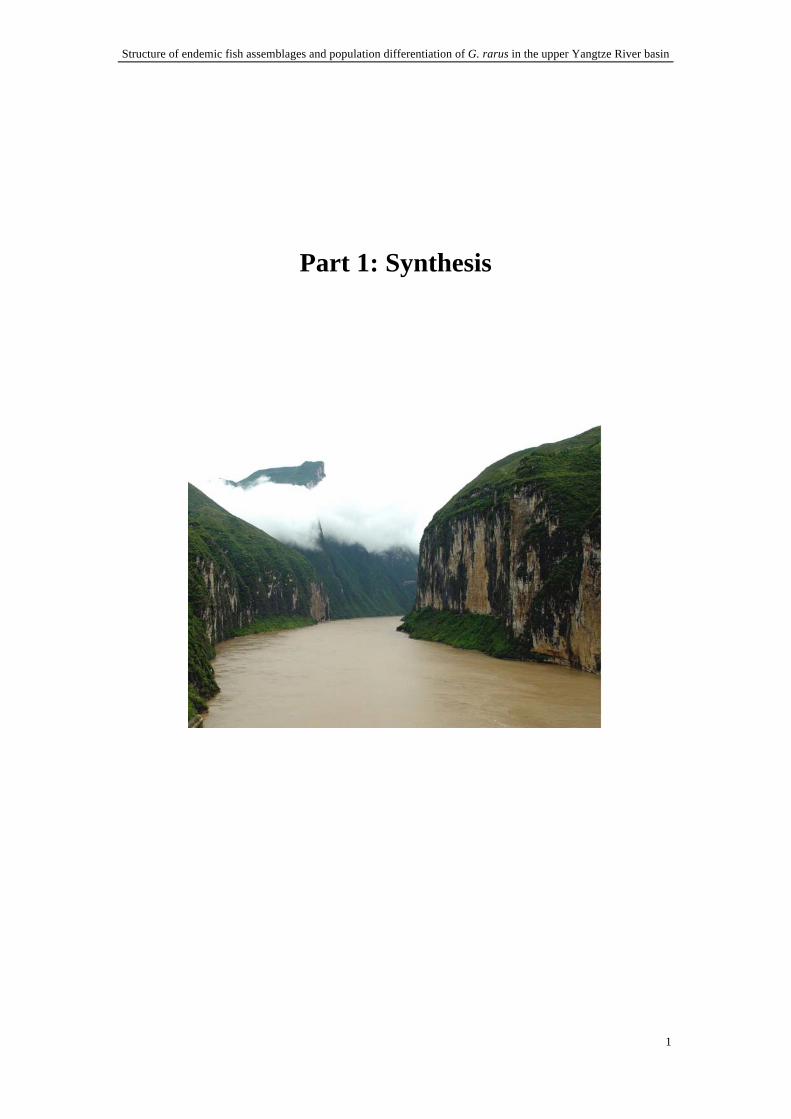
Part 1: Synthesis
Structure of endemic fish assemblages and population differentiation of G. rarus in the upper Yangtze River basin
2
1. General Introduction
1-1. Freshwater biodiversity
Freshwaters make up only around 0.01% of the world’s water and approximately
0.8% of the earth’s surface (Gleick 1996). It yet supports at least 100,000 species out
of approximately 1.8 million, i.e., almost 6% of all described species (Hawksworth &
Kalin-Arroyo 1995). Hence, although fresh water is quantitatively much smaller than
salted marine water, it owns high biodiversity. For instance, Nelson (2006) recorded
that about 11,952 fish species, or 43% of all fish species, belonging to 33 orders, live
exclusively in freshwater lakes and rivers. However, freshwater ecosystems may well
be the most endangered ecosystems in the world and the decline in freshwater
biodiversity is far greater than in most affected terrestrial ecosystems (Sala et al.
2000).
The threats to global freshwater biodiversity are grouped under five interacting
categories: overexploitation, water pollution, flow modification, destruction or
degradation of habitat, and invasion by exotic species (Allan & Flecker 1993; Naiman
et al. 1995; Naiman & Turner 2000; Jackson et al. 2001; Malmqvist & Rundle 2002;
Rahel 2002; Postel & Richter 2003; Revenga et al. 2005; Dudgeon et al. 2006).
Moreover, global environmental changes, such as nitrogen deposition, warming, and
shifts in precipitation and runoff patterns, are superimposed upon these threats (Poff
et al. 2002; Galloway et al. 2004). Overexploitation primarily affects vertebrates,
mainly fishes, reptiles and some amphibians. Although considerable progresses in
reducing water pollution from domestic and industrial point sources have been made,
pollution threats still occur and are growing. Habitat degradation results from direct
effects (e.g., excavation of river sand) and indirect impacts (e.g., forest clearance).
Flow modifications are mainly from human need for flood protection or water storage.
The interacting influences of these threats have resulted in population declines and
range reduction of freshwater biodiversity worldwide. For example, according to the
1996 IUCN Red List of Threatened Animals, 734 species of fish are classified as
threatened, of which 84% are freshwater species (IUCN 1996). Moreover, Harrison &
Stiassny (1999) reported that habitat alteration contributed to 54% of extinctions,
overfishing contributed to 29%, and pollution contributed to 26%. Groombridge &
Jenkins (2000) suggested reductions in numerous wetland and water margin
Structure of endemic fish assemblages and population differentiation of G. rarus in the upper Yangtze River basin
3
vertebrates (19 mammals, 92 birds, 72 reptiles and 44 fish species) from qualitative
data. Chapin et al. (2000) revealed that current extinction rates of species are
estimated to be 100-1,000 times greater than pre-human rates. Globally, about 10,000-
20,000 freshwater species already are extinct or imperiled due to human activities
(Strayer 2006; IUCN 2007).
Nevertheless, freshwater biodiversity conservation came as a distinct field only
recently, after the emergence of conservation ecology as a distinct discipline in the
1980s (Strayer & Dudgeon 2010). The main goal of biodiversity conservation is to
minimize loss of irreplaceable biodiversity. The first step for conservation is to assess
biodiversity and identify its most important components (organization levels). As a
hierarchical concept, biodiversity is defined with three principal organization levels:
genetic, species and ecosystem diversity. Genetic diversity is the variety of alleles and
genotypes present in the group under study (population, species or group of species;
Frankham et al. 2002). It is usually required for populations to evolve and adapt to
environmental change. It has been measured for different traits, e.g., continuously
varying (quantitative) characters, deleterious alleles, proteins, nuclear DNA loci,
mitochondrial DNA (mtDNA), and whole chromosomes. Numerous methods are
available for measuring genetic diversity at the genetic level, with microsatellites
currently being the favored method. Species diversity is the number of species in an
area and their relative abundance, involving species richness (the number of species
present), species evenness (their relative abundances), species composition (the
particular species present), non-additive effects (the interactions among species), and
the spatio-temporal variation in these properties (Chapin et al. 2000). At the highest
level, ecosystems are interacting systems of biotic and abiotic components (Glowka et
al. 1994). Ecosystem diversity stresses the importance of protecting not only
genotypes and species, but also the non-living features of the environment.
1-2. Distribution of fishes in the upper Yangtze River
1-2-1. The Yangtze River
The Yangtze River, also called Changjiang, is the longest river in China and the
third longest river in the world. The first two longest rivers in the world are the Nile
River in Africa (about 6,670 km length and 2.87×10⁶ km2 drainage area) and the
Structure of endemic fish assemblages and population differentiation of G. rarus in the upper Yangtze River basin
4
Amazon River in South America (about 6,436 km length and 6.915×10⁶ km2 drainage
area). The Yangtze River has a length of 6,380 km and drains an area of 1.8×10⁶ km2
(Hydrology Bureau of Changjiang Water Resources Committee 2003). It originates
from the Peak of Geladandong Glacier in the Tanggula cordillera, Qinghai-Xizang
Plateau, and flows eastward through 11 Chinese provinces into the East Sea of China.
The river has more than 7,000 tributaries and 4,000 lakes (Zeng 1990; Hydrology
Bureau of Changjiang Water Resources Committee 2003). It has abundant water
resources with a mean annual discharge of 31,900 m3/s and a mean annual runoff of
9.513×10¹¹ m3. The Yangtze River spans three large topographic platforms of the
Chinese mainland, exhibiting complicated geological structure and natural
environments. Diverse geographical features are also presented in the Yangtze River
basin, including plateaus, mountains, hillies and plains.
The Yangtze River supports a rich biodiversity, especially concerning fish fauna,
i.e., around 400 fish species and subspecies (Chen et al. 2002; Fu et al. 2003; Park et
al. 2003; Yu et al. 2005; Cao 2008, 2009). These species make up around one-third of
the total number of freshwater fishes of China. It represents the highest diversity in
the Palearctic region (Nelson 1994; Matthews 1998). The fish species richness in the
Yangtze River far exceeds that of any other river systems in China. For example, the
Yellow River homes only around 141 species and subspecies of fishes, and the
Helongjiang River around 128 (Ren 1994; Gao et al. 2004). Because of these
characteristics, the World Wildlife Fund (WWF) had listed the Yangtze River basin in
the Global Ecoregion 200 for priority conservation.
The Yangtze River is usually divided into three parts: upstream (from its
headwaters to Yichang City in Hubei Province), middle-stream (from Yichang City to
Hukou City in Jiangxi Province), and downstream (from Hukou City to the river
mouth). The upper Yangtze River has a length of 4,504 km and drains an area of
1.0×10⁶ km2; the middle-stream with 950 km of length and 6.8×10⁵ km2 of drainage
area; the downstream with 930 km of length and 1.2×10⁵ km2 of drainage area
(Hydrology Bureau of Changjiang Water Resources Committee 2003).
Structure of endemic fish assemblages and population differentiation of G. rarus in the upper Yangtze River basin
5
1-2-2. Fishes of the upper Yangtze River basin
Exhibiting pronounced habitat heterogeneity, well-developed drainage system,
abundant water resources, and rich biodiversity, the upper Yangtze River has been
marked as an eco-functional barrier of the Yangtze River and a key area for
ecological restoration (Dong 2003; Sun 2008). It crosses the first and second large
topographic platforms of the Chinese mainland. There are large amount of wild
animals and plants, e.g., accounting for 40% of the plant and wild vertebrate species
of China. Hence, it is an important resource of biodiversity, i.e., possessing abundant
ancient relic plants and high proportions of endemic species. Moreover, the Hengduan
Mountains Region located in the upper Yangtze River basin has been identified as one
of 25 global biodiversity hotspots as well as one of 200 worldwide conservation key
areas (Myers et al. 2000; Sun 2008), showing high species diversity, many different
communities and important ecosystem diversity. The upper Yangtze River basin is
also abundant in land vegetation and forest resources, which is an important factor in
the conservation of water resources.
The main stream of the upper Yangtze River is further divided into three sections.
The first section is the headwater section of the Yangtze River extending from the
Tuotuo River to the Tongtian River. The second section is from Zhimenda City in
Qinghai Province to Yibin City in Sichuan Province and is named the Jinsha River.
The third section from Yibin City in Sichuan Province to Yichang City in Hubei
Province is called “Chuanjiang”.
Investigation and publications
Since the nineteenth centuries, many Chinese and foreign researchers
concentrated on the fishes of China, involving a lot of large water systems (e.g., the
Yangtze River, the Lancang River, the Nujiang River, the Pearl River, the Yellow
River). In order to make clear how many fish species exist, what is the difference
between species, and where they live, large amount of field investigations has been
conducted on the main stream of the upper Yangtze River and its tributaries, such as
Wujiang River, Chishui River, Jialing River, Minjiang River, Tuojiang River, Yalong
River, Dadu River, etc. (e.g., Department of Ichthyology 1976; Agricultural
Regionalization Committee of Sichuan Province 1991; Wu & Wu 1992). Abundant
Structure of endemic fish assemblages and population differentiation of G. rarus in the upper Yangtze River basin
6
literatures have emerged from the results of these investigations, describing fish
species characteristics and their distribution (e.g., Shi et al. 1984; Deng 1985; Ye &
Fu 1987; Chen et al. 2002; Fu et al. 2003; Yu et al. 2005; Ding 2006). Additionally,
several important monographs describing fish morphological traits and distribution
have been completed and been used as references for the ichthyologists (e.g.,
Department of Ichthyology 1976; Chu & Chen 1989; Wu et al. 1989; Chu & Chen
1990; Wu & Wu 1992; Ding 1994; Chen 1998b; Chu et al. 1999; Yue 2000). We will
here overview some of these monographs. The Fishes of the Qinghai-Xizang Plateau
has been published after a long-term (about 30 years) field investigation on the
Qinghai-Xizang Plateau and its adjacent areas by numerous scholars (Wu & Wu
1992). In total, the morphological traits, ecological features, geographical distribution,
and economic values of 152 fish species and subspecies are described in this book,
referring to several large water systems including the Yangtze River, the Yellow
River, the Lancang River, and the Nujiang River. The Fishes of Yunnan refers to the
Lancang River (upper reach of the Mekong River), the Nujiang River, the Pearl River,
and the Yangtze River. It records 220 fish species and subspecies of Cyprinids (Chu
& Chen 1989; Chu & Chen 1990). The Fishes of the Hengduan Mountains Region
describes 237 fish species and subspecies in the upper Yangtze River basin, the
Lancang River basin, the Nujiang River basin and the Yellow River basin (Chen
1998a). The Fishes of Guizhou describes 202 fish species and subspecies, belonging
to 98 genera, 20 families and 6 orders, and living in the Yangtze River basin and the
Pearl River basin (Wu et al. 1989). The Fishes of Sichuan describes 241 fish species
and subspecies in the Sichuan Province, belonging to 107 genera, 20 families and 9
orders (Ding 1994). It mainly refers to the Jinsha River, the Yalong River, the Dadu
River, the Minjiang River, the Tuojiang River, the Jialing River, the Wujiang River,
and the Chishui River within the Yangtze River basin. The Fishes of the Yangtze
River describes the classification and distribution of 206 fish species and subspecies
in the Yangtze River basin (Department of Ichthyology 1976). Finally, Fauna Sinica
(Osteichthyes): Cypriniformes II and III, and Fauna Sinica (Osteichthyes):
Siluriformes, deal with the classification of fish species in China (Chen 1998b; Chu et
al. 1999; Le 2000). They are the major references to determine the relative
effectiveness for the classification of different fish species. These monographs are
also important assets for Laboratory “Ecology and Conservation Biology of
Freshwater Fishes” of the Institute of Hydrobiology in Hubei Province of China,
Structure of endemic fish assemblages and population differentiation of G. rarus in the upper Yangtze River basin
7
providing information to compile the fish distribution data of the upper Yangtze River
basin.
Fish distribution characteristics
Data on the fishes distribution were collected from many sources: Cao et al.
(1998, unpublished), the monitoring data from the Ecological and Environmental
Monitoring System of Three Gorges Reservoir collected since 1997, other research
results conducted by the Lab. “Ecology and Conservation Biology of Freshwater
Fishes” of the Institute of Hydrobiology in Hubei Province of China, and
bibliographic data including the aforementioned monographs (Wu 1964; Wu 1977;
Department of Ichthyology 1976; Institute of Zoology of Shanxi Province et al. 1987;
Chu & Chen 1989; Wu et al. 1989; Chu & Chen 1990; Agricultural Regionalization
Committee of Sichuan Province 1991; Wu & Wu 1992; Ding 1994; Chen 1998a;
Chen 1998b; Chu et al. 1999; Le 2000) and investigation papers (Shi et al. 1984;
Deng 1985; Ye & Fu 1987; Chen et al. 2002; Fu et al. 2003; Park et al. 2003; Yu et al.
2005; Ding 2006). Additionally, the authors also appended species distribution
records, supplemented with newly published species information, and aggregated
them after filtering out controversial species. Here only the main references are listed.
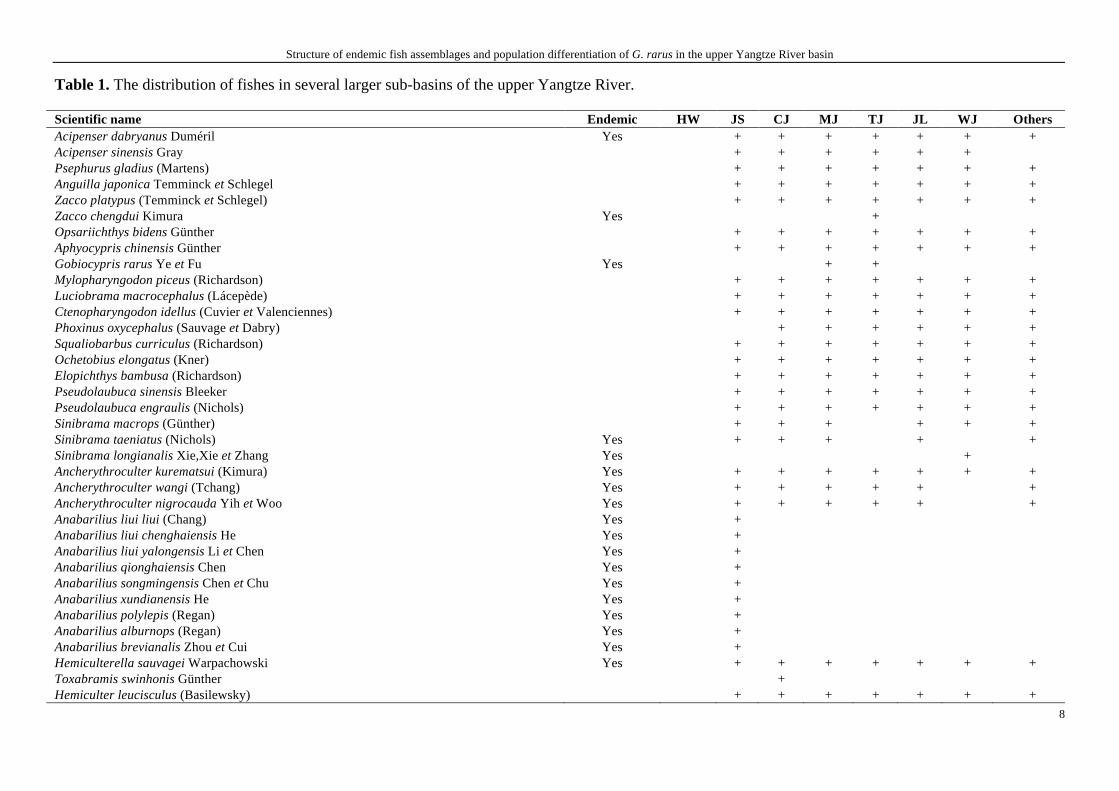
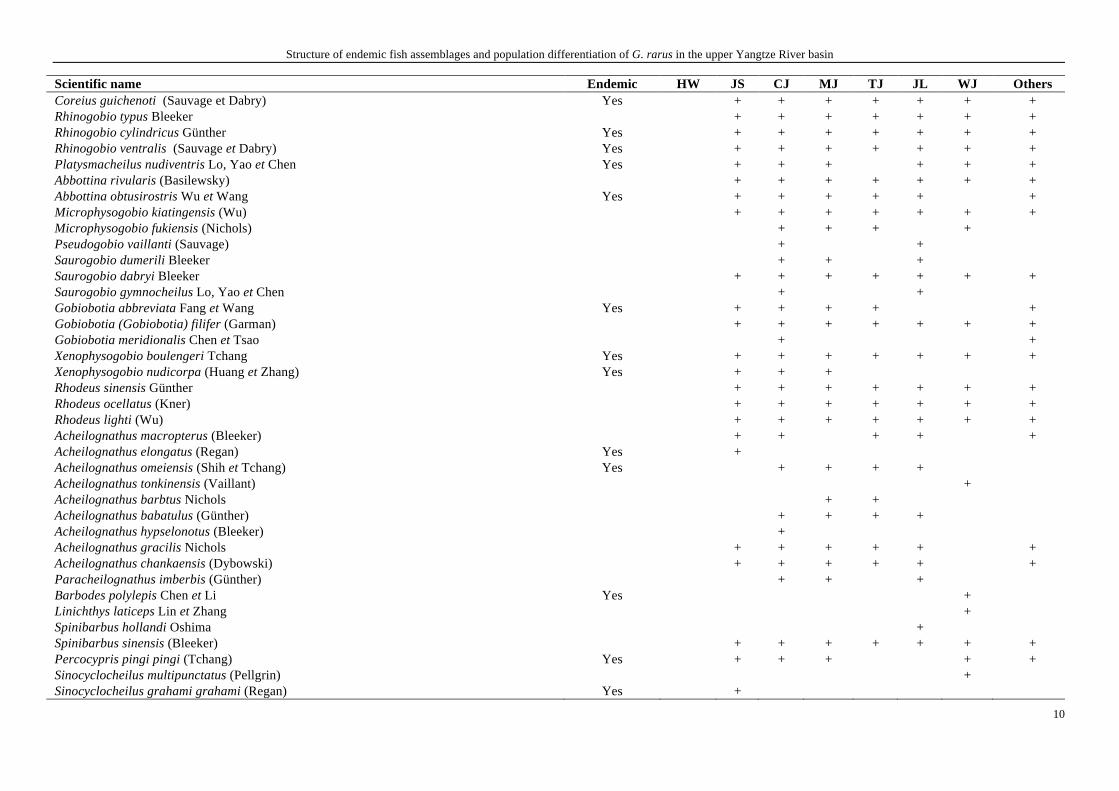
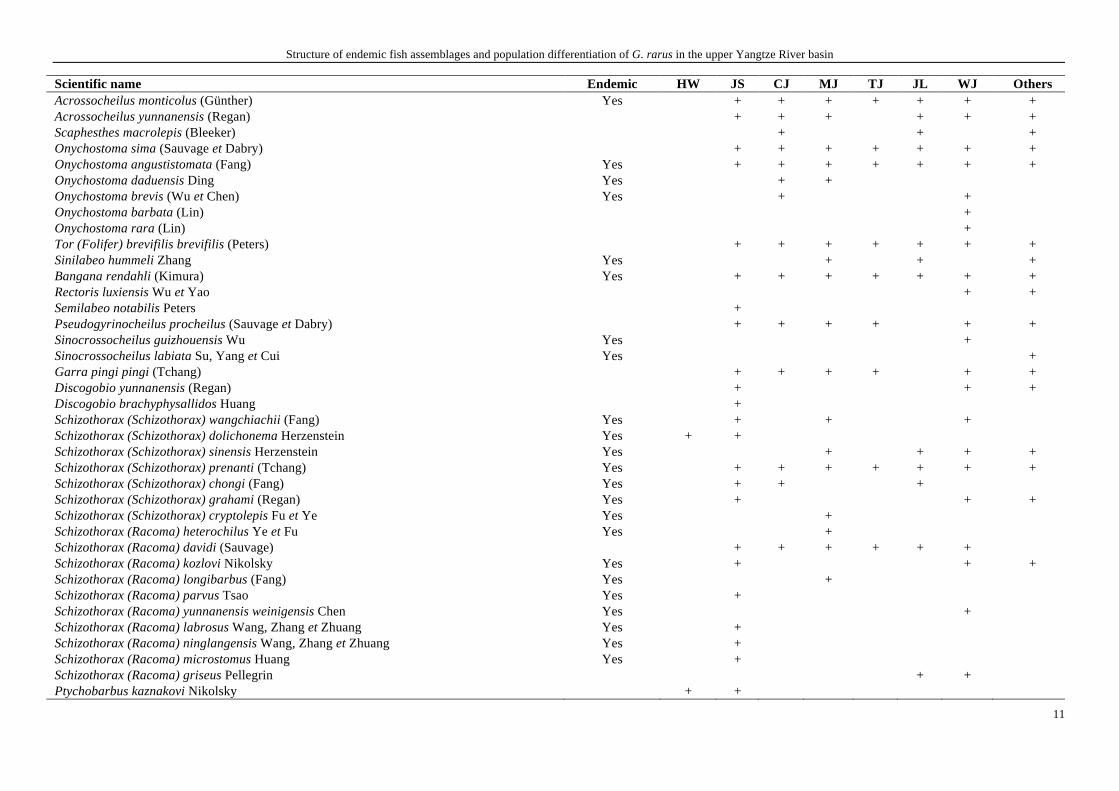
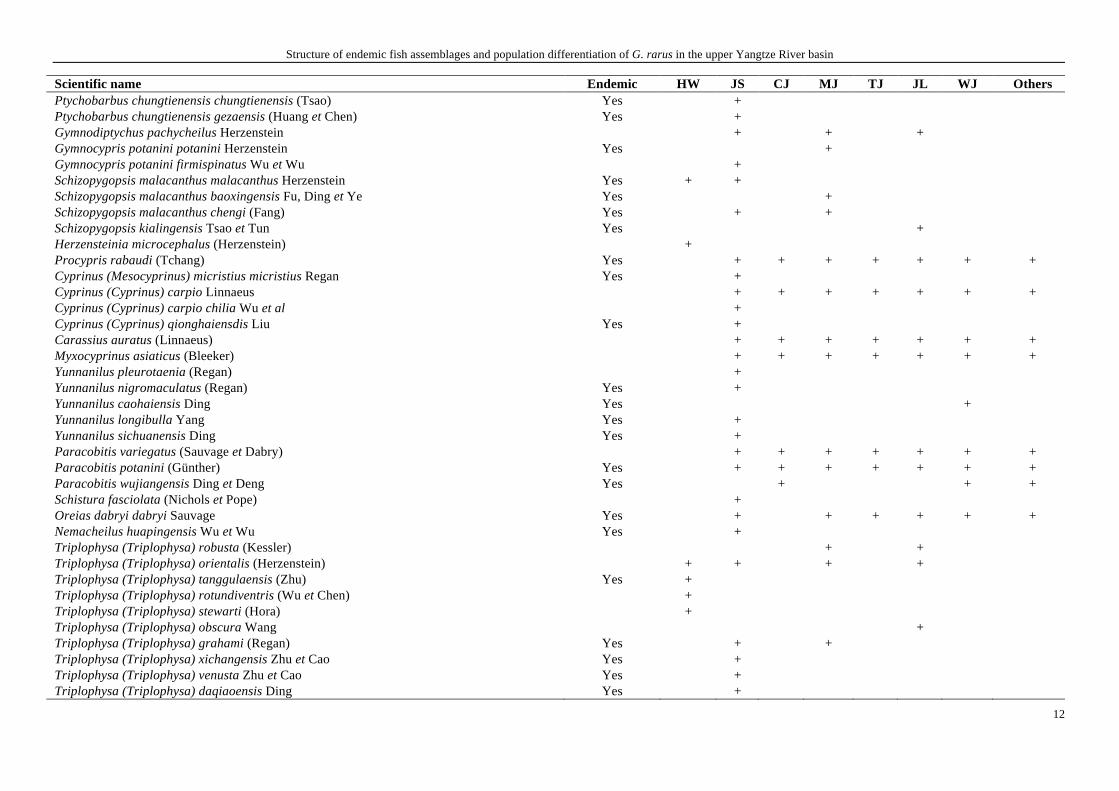
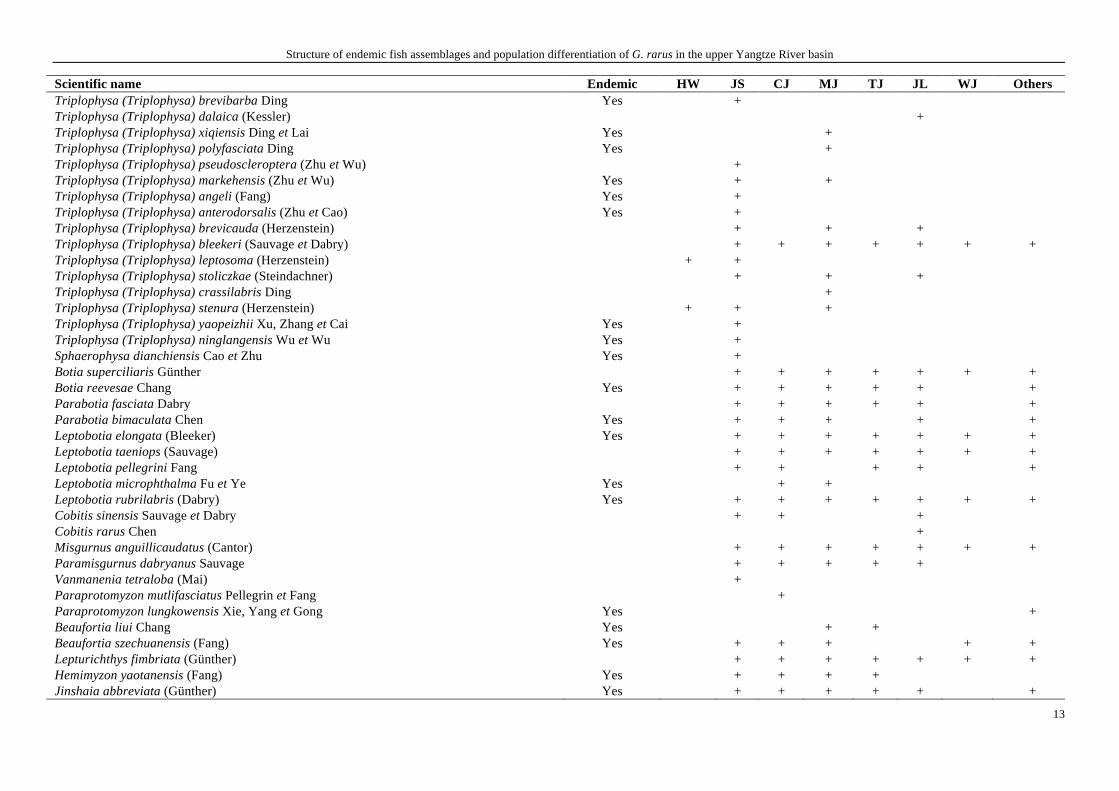
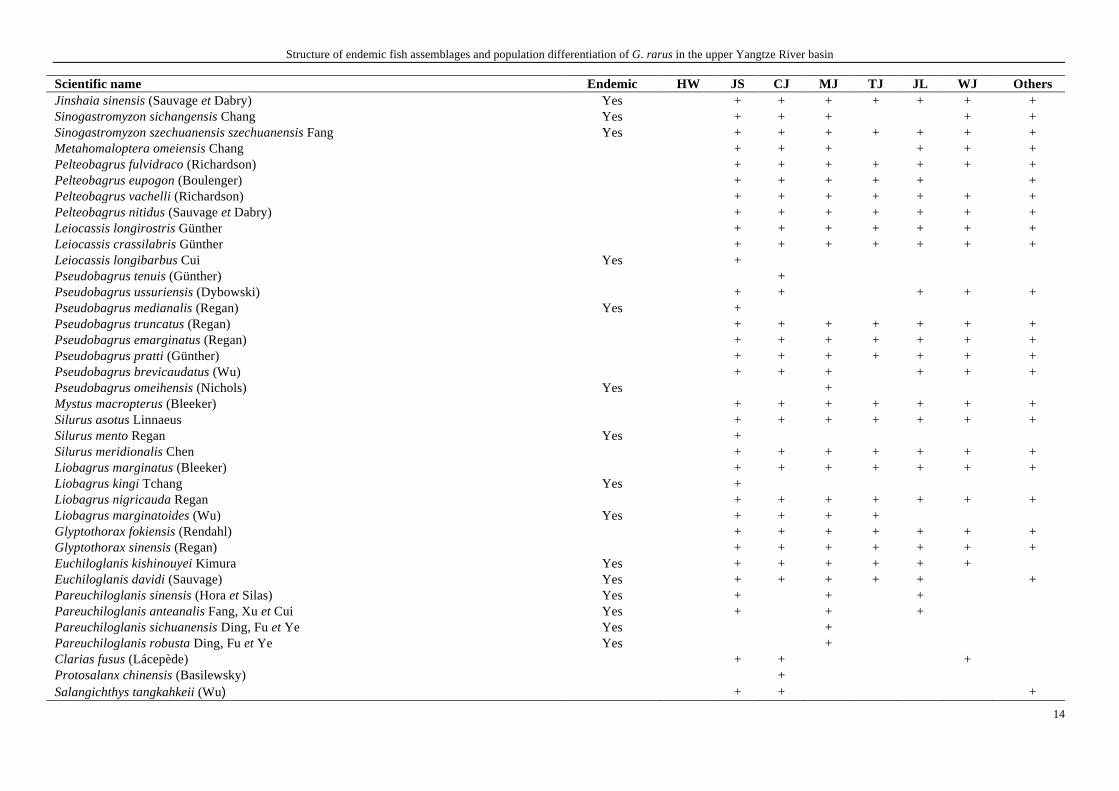
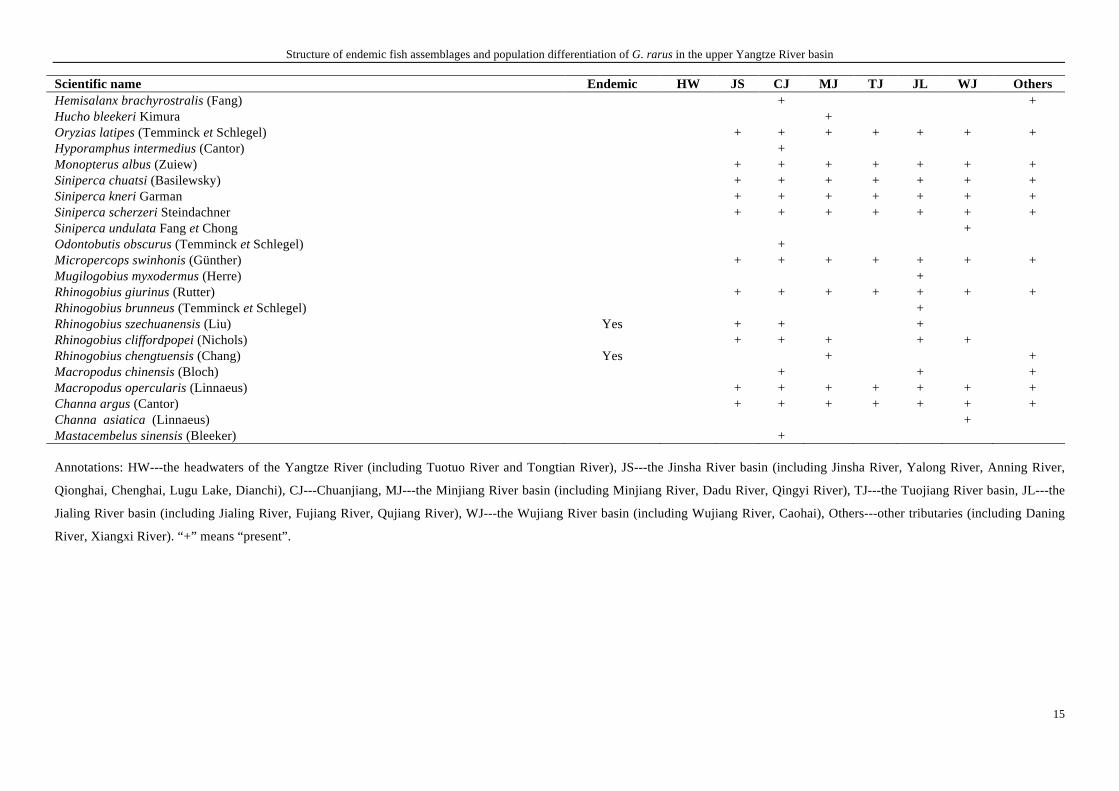
In total, there are 286 fish species and subspecies distributing in the upper Yangtze
River basin. Their distributions in the main stream of the upper Yangtze River and its
main tributaries (sub-basins) are listed in Table 1. Among them, 124 fish species are
endemic to the upper Yangtze River basin.
Structure of endemic fish assemblages and population differentiation of G. rarus in the upper Yangtze River basin
8
Table 1. The distribution of fishes in several larger sub-basins of the upper Yangtze River.
Scientific name Endemic HW JS CJ MJ TJ JL WJ Others Acipenser dabryanus Duméril Yes + + + + + + + Acipenser sinensis Gray + + + + + + Psephurus gladius (Martens) + + + + + + + Anguilla japonica Temminck et Schlegel + + + + + + + Zacco platypus (Temminck et Schlegel) + + + + + + + Zacco chengdui Kimura Yes + Opsariichthys bidens Günther + + + + + + + Aphyocypris chinensis Günther + + + + + + + Gobiocypris rarus Ye et Fu Yes + + Mylopharyngodon piceus (Richardson) + + + + + + + Luciobrama macrocephalus (Lácepède) + + + + + + + Ctenopharyngodon idellus (Cuvier et Valenciennes) + + + + + + + Phoxinus oxycephalus (Sauvage et Dabry) + + + + + + Squaliobarbus curriculus (Richardson) + + + + + + + Ochetobius elongatus (Kner) + + + + + + + Elopichthys bambusa (Richardson) + + + + + + + Pseudolaubuca sinensis Bleeker + + + + + + + Pseudolaubuca engraulis (Nichols) + + + + + + + Sinibrama macrops (Günther) + + + + + + Sinibrama taeniatus (Nichols) Yes + + + + + Sinibrama longianalis Xie,Xie et Zhang Yes + Ancherythroculter kurematsui (Kimura) Yes + + + + + + + Ancherythroculter wangi (Tchang) Yes + + + + + + Ancherythroculter nigrocauda Yih et Woo Yes + + + + + + Anabarilius liui liui (Chang) Yes + Anabarilius liui chenghaiensis He Yes + Anabarilius liui yalongensis Li et Chen Yes + Anabarilius qionghaiensis Chen Yes + Anabarilius songmingensis Chen et Chu Yes + Anabarilius xundianensis He Yes + Anabarilius polylepis (Regan) Yes + Anabarilius alburnops (Regan) Yes + Anabarilius brevianalis Zhou et Cui Yes + Hemiculterella sauvagei Warpachowski Yes + + + + + + + Toxabramis swinhonis Günther + Hemiculter leucisculus (Basilewsky) + + + + + + +
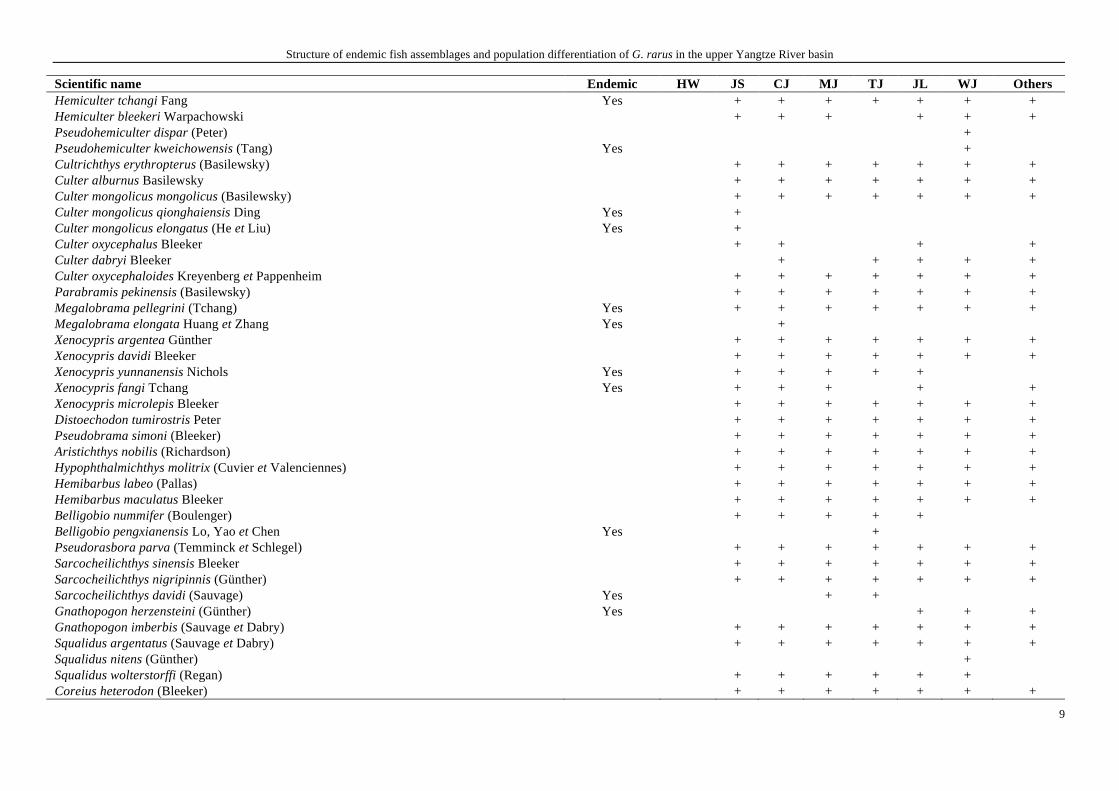
Structure of endemic fish assemblages and population differentiation of G. rarus in the upper Yangtze River basin
9
Scientific name Endemic HW JS CJ MJ TJ JL WJ Others Hemiculter tchangi Fang Yes + + + + + + + Hemiculter bleekeri Warpachowski + + + + + + Pseudohemiculter dispar (Peter) + Pseudohemiculter kweichowensis (Tang) Yes + Cultrichthys erythropterus (Basilewsky) + + + + + + + Culter alburnus Basilewsky + + + + + + + Culter mongolicus mongolicus (Basilewsky) + + + + + + + Culter mongolicus qionghaiensis Ding Yes + Culter mongolicus elongatus (He et Liu) Yes + Culter oxycephalus Bleeker + + + + Culter dabryi Bleeker + + + + + Culter oxycephaloides Kreyenberg et Pappenheim + + + + + + + Parabramis pekinensis (Basilewsky) + + + + + + + Megalobrama pellegrini (Tchang) Yes + + + + + + + Megalobrama elongata Huang et Zhang Yes + Xenocypris argentea Günther + + + + + + + Xenocypris davidi Bleeker + + + + + + + Xenocypris yunnanensis Nichols Yes + + + + + Xenocypris fangi Tchang Yes + + + + + Xenocypris microlepis Bleeker + + + + + + + Distoechodon tumirostris Peter + + + + + + + Pseudobrama simoni (Bleeker) + + + + + + + Aristichthys nobilis (Richardson) + + + + + + + Hypophthalmichthys molitrix (Cuvier et Valenciennes) + + + + + + + Hemibarbus labeo (Pallas) + + + + + + + Hemibarbus maculatus Bleeker + + + + + + + Belligobio nummifer (Boulenger) + + + + + Belligobio pengxianensis Lo, Yao et Chen Yes + Pseudorasbora parva (Temminck et Schlegel) + + + + + + + Sarcocheilichthys sinensis Bleeker + + + + + + + Sarcocheilichthys nigripinnis (Günther) + + + + + + + Sarcocheilichthys davidi (Sauvage) Yes + + Gnathopogon herzensteini (Günther) Yes + + + Gnathopogon imberbis (Sauvage et Dabry) + + + + + + + Squalidus argentatus (Sauvage et Dabry) + + + + + + + Squalidus nitens (Günther) + Squalidus wolterstorffi (Regan) + + + + + + Coreius heterodon (Bleeker) + + + + + + +
Structure of endemic fish assemblages and population differentiation of G. rarus in the upper Yangtze River basin
10
Scientific name Endemic HW JS CJ MJ TJ JL WJ Others Coreius guichenoti (Sauvage et Dabry) Yes + + + + + + + Rhinogobio typus Bleeker + + + + + + + Rhinogobio cylindricus Günther Yes + + + + + + + Rhinogobio ventralis (Sauvage et Dabry) Yes + + + + + + + Platysmacheilus nudiventris Lo, Yao et Chen Yes + + + + + + Abbottina rivularis (Basilewsky) + + + + + + + Abbottina obtusirostris Wu et Wang Yes + + + + + + Microphysogobio kiatingensis (Wu) + + + + + + + Microphysogobio fukiensis (Nichols) + + + + Pseudogobio vaillanti (Sauvage) + + Saurogobio dumerili Bleeker + + + Saurogobio dabryi Bleeker + + + + + + + Saurogobio gymnocheilus Lo, Yao et Chen + + Gobiobotia abbreviata Fang et Wang Yes + + + + + Gobiobotia (Gobiobotia) filifer (Garman) + + + + + + + Gobiobotia meridionalis Chen et Tsao + + Xenophysogobio boulengeri Tchang Yes + + + + + + + Xenophysogobio nudicorpa (Huang et Zhang) Yes + + + Rhodeus sinensis Günther + + + + + + + Rhodeus ocellatus (Kner) + + + + + + + Rhodeus lighti (Wu) + + + + + + + Acheilognathus macropterus (Bleeker) + + + + + Acheilognathus elongatus (Regan) Yes + Acheilognathus omeiensis (Shih et Tchang) Yes + + + + Acheilognathus tonkinensis (Vaillant) + Acheilognathus barbtus Nichols + + Acheilognathus babatulus (Günther) + + + + Acheilognathus hypselonotus (Bleeker) + Acheilognathus gracilis Nichols + + + + + + Acheilognathus chankaensis (Dybowski) + + + + + + Paracheilognathus imberbis (Günther) + + + Barbodes polylepis Chen et Li Yes + Linichthys laticeps Lin et Zhang + Spinibarbus hollandi Oshima + Spinibarbus sinensis (Bleeker) + + + + + + + Percocypris pingi pingi (Tchang) Yes + + + + + Sinocyclocheilus multipunctatus (Pellgrin) + Sinocyclocheilus grahami grahami (Regan) Yes +
Structure of endemic fish assemblages and population differentiation of G. rarus in the upper Yangtze River basin
11
Scientific name Endemic HW JS CJ MJ TJ JL WJ Others Acrossocheilus monticolus (Günther) Yes + + + + + + + Acrossocheilus yunnanensis (Regan) + + + + + + Scaphesthes macrolepis (Bleeker) + + + Onychostoma sima (Sauvage et Dabry) + + + + + + + Onychostoma angustistomata (Fang) Yes + + + + + + + Onychostoma daduensis Ding Yes + + Onychostoma brevis (Wu et Chen) Yes + + Onychostoma barbata (Lin) + Onychostoma rara (Lin) + Tor (Folifer) brevifilis brevifilis (Peters) + + + + + + + Sinilabeo hummeli Zhang Yes + + + Bangana rendahli (Kimura) Yes + + + + + + + Rectoris luxiensis Wu et Yao + + Semilabeo notabilis Peters + Pseudogyrinocheilus procheilus (Sauvage et Dabry) + + + + + + Sinocrossocheilus guizhouensis Wu Yes + Sinocrossocheilus labiata Su, Yang et Cui Yes + Garra pingi pingi (Tchang) + + + + + + Discogobio yunnanensis (Regan) + + + Discogobio brachyphysallidos Huang + Schizothorax (Schizothorax) wangchiachii (Fang) Yes + + + Schizothorax (Schizothorax) dolichonema Herzenstein Yes + + Schizothorax (Schizothorax) sinensis Herzenstein Yes + + + + Schizothorax (Schizothorax) prenanti (Tchang) Yes + + + + + + + Schizothorax (Schizothorax) chongi (Fang) Yes + + + Schizothorax (Schizothorax) grahami (Regan) Yes + + + Schizothorax (Schizothorax) cryptolepis Fu et Ye Yes + Schizothorax (Racoma) heterochilus Ye et Fu Yes + Schizothorax (Racoma) davidi (Sauvage) + + + + + + Schizothorax (Racoma) kozlovi Nikolsky Yes + + + Schizothorax (Racoma) longibarbus (Fang) Yes + Schizothorax (Racoma) parvus Tsao Yes + Schizothorax (Racoma) yunnanensis weinigensis Chen Yes + Schizothorax (Racoma) labrosus Wang, Zhang et Zhuang Yes + Schizothorax (Racoma) ninglangensis Wang, Zhang et Zhuang Yes + Schizothorax (Racoma) microstomus Huang Yes + Schizothorax (Racoma) griseus Pellegrin + + Ptychobarbus kaznakovi Nikolsky + +
Structure of endemic fish assemblages and population differentiation of G. rarus in the upper Yangtze River basin
12
Scientific name Endemic HW JS CJ MJ TJ JL WJ Others Ptychobarbus chungtienensis chungtienensis (Tsao) Yes + Ptychobarbus chungtienensis gezaensis (Huang et Chen) Yes + Gymnodiptychus pachycheilus Herzenstein + + + Gymnocypris potanini potanini Herzenstein Yes + Gymnocypris potanini firmispinatus Wu et Wu + Schizopygopsis malacanthus malacanthus Herzenstein Yes + + Schizopygopsis malacanthus baoxingensis Fu, Ding et Ye Yes + Schizopygopsis malacanthus chengi (Fang) Yes + + Schizopygopsis kialingensis Tsao et Tun Yes + Herzensteinia microcephalus (Herzenstein) + Procypris rabaudi (Tchang) Yes + + + + + + + Cyprinus (Mesocyprinus) micristius micristius Regan Yes + Cyprinus (Cyprinus) carpio Linnaeus + + + + + + + Cyprinus (Cyprinus) carpio chilia Wu et al + Cyprinus (Cyprinus) qionghaiensdis Liu Yes + Carassius auratus (Linnaeus) + + + + + + + Myxocyprinus asiaticus (Bleeker) + + + + + + + Yunnanilus pleurotaenia (Regan) + Yunnanilus nigromaculatus (Regan) Yes + Yunnanilus caohaiensis Ding Yes + Yunnanilus longibulla Yang Yes + Yunnanilus sichuanensis Ding Yes + Paracobitis variegatus (Sauvage et Dabry) + + + + + + + Paracobitis potanini (Günther) Yes + + + + + + + Paracobitis wujiangensis Ding et Deng Yes + + + Schistura fasciolata (Nichols et Pope) + Oreias dabryi dabryi Sauvage Yes + + + + + + Nemacheilus huapingensis Wu et Wu Yes + Triplophysa (Triplophysa) robusta (Kessler) + + Triplophysa (Triplophysa) orientalis (Herzenstein) + + + + Triplophysa (Triplophysa) tanggulaensis (Zhu) Yes + Triplophysa (Triplophysa) rotundiventris (Wu et Chen) + Triplophysa (Triplophysa) stewarti (Hora) + Triplophysa (Triplophysa) obscura Wang + Triplophysa (Triplophysa) grahami (Regan) Yes + + Triplophysa (Triplophysa) xichangensis Zhu et Cao Yes + Triplophysa (Triplophysa) venusta Zhu et Cao Yes + Triplophysa (Triplophysa) daqiaoensis Ding Yes +
Structure of endemic fish assemblages and population differentiation of G. rarus in the upper Yangtze River basin
13
Scientific name Endemic HW JS CJ MJ TJ JL WJ Others Triplophysa (Triplophysa) brevibarba Ding Yes + Triplophysa (Triplophysa) dalaica (Kessler) + Triplophysa (Triplophysa) xiqiensis Ding et Lai Yes + Triplophysa (Triplophysa) polyfasciata Ding Yes + Triplophysa (Triplophysa) pseudoscleroptera (Zhu et Wu) + Triplophysa (Triplophysa) markehensis (Zhu et Wu) Yes + + Triplophysa (Triplophysa) angeli (Fang) Yes + Triplophysa (Triplophysa) anterodorsalis (Zhu et Cao) Yes + Triplophysa (Triplophysa) brevicauda (Herzenstein) + + + Triplophysa (Triplophysa) bleekeri (Sauvage et Dabry) + + + + + + + Triplophysa (Triplophysa) leptosoma (Herzenstein) + + Triplophysa (Triplophysa) stoliczkae (Steindachner) + + + Triplophysa (Triplophysa) crassilabris Ding + Triplophysa (Triplophysa) stenura (Herzenstein) + + + Triplophysa (Triplophysa) yaopeizhii Xu, Zhang et Cai Yes + Triplophysa (Triplophysa) ninglangensis Wu et Wu Yes + Sphaerophysa dianchiensis Cao et Zhu Yes + Botia superciliaris Günther + + + + + + + Botia reevesae Chang Yes + + + + + + Parabotia fasciata Dabry + + + + + + Parabotia bimaculata Chen Yes + + + + + Leptobotia elongata (Bleeker) Yes + + + + + + + Leptobotia taeniops (Sauvage) + + + + + + + Leptobotia pellegrini Fang + + + + + Leptobotia microphthalma Fu et Ye Yes + + Leptobotia rubrilabris (Dabry) Yes + + + + + + + Cobitis sinensis Sauvage et Dabry + + + Cobitis rarus Chen + Misgurnus anguillicaudatus (Cantor) + + + + + + + Paramisgurnus dabryanus Sauvage + + + + + Vanmanenia tetraloba (Mai) + Paraprotomyzon mutlifasciatus Pellegrin et Fang + Paraprotomyzon lungkowensis Xie, Yang et Gong Yes + Beaufortia liui Chang Yes + + Beaufortia szechuanensis (Fang) Yes + + + + + Lepturichthys fimbriata (Günther) + + + + + + + Hemimyzon yaotanensis (Fang) Yes + + + + Jinshaia abbreviata (Günther) Yes + + + + + +
Structure of endemic fish assemblages and population differentiation of G. rarus in the upper Yangtze River basin
14
Scientific name Endemic HW JS CJ MJ TJ JL WJ Others Jinshaia sinensis (Sauvage et Dabry) Yes + + + + + + + Sinogastromyzon sichangensis Chang Yes + + + + + Sinogastromyzon szechuanensis szechuanensis Fang Yes + + + + + + + Metahomaloptera omeiensis Chang + + + + + + Pelteobagrus fulvidraco (Richardson) + + + + + + + Pelteobagrus eupogon (Boulenger) + + + + + + Pelteobagrus vachelli (Richardson) + + + + + + + Pelteobagrus nitidus (Sauvage et Dabry) + + + + + + + Leiocassis longirostris Günther + + + + + + + Leiocassis crassilabris Günther + + + + + + + Leiocassis longibarbus Cui Yes + Pseudobagrus tenuis (Günther) + Pseudobagrus ussuriensis (Dybowski) + + + + + Pseudobagrus medianalis (Regan) Yes + Pseudobagrus truncatus (Regan) + + + + + + + Pseudobagrus emarginatus (Regan) + + + + + + + Pseudobagrus pratti (Günther) + + + + + + + Pseudobagrus brevicaudatus (Wu) + + + + + + Pseudobagrus omeihensis (Nichols) Yes + Mystus macropterus (Bleeker) + + + + + + + Silurus asotus Linnaeus + + + + + + + Silurus mento Regan Yes + Silurus meridionalis Chen + + + + + + + Liobagrus marginatus (Bleeker) + + + + + + + Liobagrus kingi Tchang Yes + Liobagrus nigricauda Regan + + + + + + + Liobagrus marginatoides (Wu) Yes + + + + Glyptothorax fokiensis (Rendahl) + + + + + + + Glyptothorax sinensis (Regan) + + + + + + + Euchiloglanis kishinouyei Kimura Yes + + + + + + Euchiloglanis davidi (Sauvage) Yes + + + + + + Pareuchiloglanis sinensis (Hora et Silas) Yes + + + Pareuchiloglanis anteanalis Fang, Xu et Cui Yes + + + Pareuchiloglanis sichuanensis Ding, Fu et Ye Yes + Pareuchiloglanis robusta Ding, Fu et Ye Yes + Clarias fusus (Lácepède) + + + Protosalanx chinensis (Basilewsky) + Salangichthys tangkahkeii (Wu) + + +
Structure of endemic fish assemblages and population differentiation of G. rarus in the upper Yangtze River basin
15
Scientific name Endemic HW JS CJ MJ TJ JL WJ Others Hemisalanx brachyrostralis (Fang) + + Hucho bleekeri Kimura + Oryzias latipes (Temminck et Schlegel) + + + + + + + Hyporamphus intermedius (Cantor) + Monopterus albus (Zuiew) + + + + + + + Siniperca chuatsi (Basilewsky) + + + + + + + Siniperca kneri Garman + + + + + + + Siniperca scherzeri Steindachner + + + + + + + Siniperca undulata Fang et Chong + Odontobutis obscurus (Temminck et Schlegel) + Micropercops swinhonis (Günther) + + + + + + + Mugilogobius myxodermus (Herre) + Rhinogobius giurinus (Rutter) + + + + + + + Rhinogobius brunneus (Temminck et Schlegel) + Rhinogobius szechuanensis (Liu) Yes + + + Rhinogobius cliffordpopei (Nichols) + + + + + Rhinogobius chengtuensis (Chang) Yes + + Macropodus chinensis (Bloch) + + + Macropodus opercularis (Linnaeus) + + + + + + + Channa argus (Cantor) + + + + + + + Channa asiatica (Linnaeus) + Mastacembelus sinensis (Bleeker) + Annotations: HW---the headwaters of the Yangtze River (including Tuotuo River and Tongtian River), JS---the Jinsha River basin (including Jinsha River, Yalong River, Anning River,
Qionghai, Chenghai, Lugu Lake, Dianchi), CJ---Chuanjiang, MJ---the Minjiang River basin (including Minjiang River, Dadu River, Qingyi River), TJ---the Tuojiang River basin, JL---the
Jialing River basin (including Jialing River, Fujiang River, Qujiang River), WJ---the Wujiang River basin (including Wujiang River, Caohai), Others---other tributaries (including Daning
River, Xiangxi River). “+” means “present”.
Structure of endemic fish assemblages and population differentiation of G. rarus in the upper Yangtze River basin
16
The distribution of fishes in the upper Yangtze River basin has three
characteristics: high species diversity, high proportion of endemic species, and
multiple life history traits.
(1) High species diversity
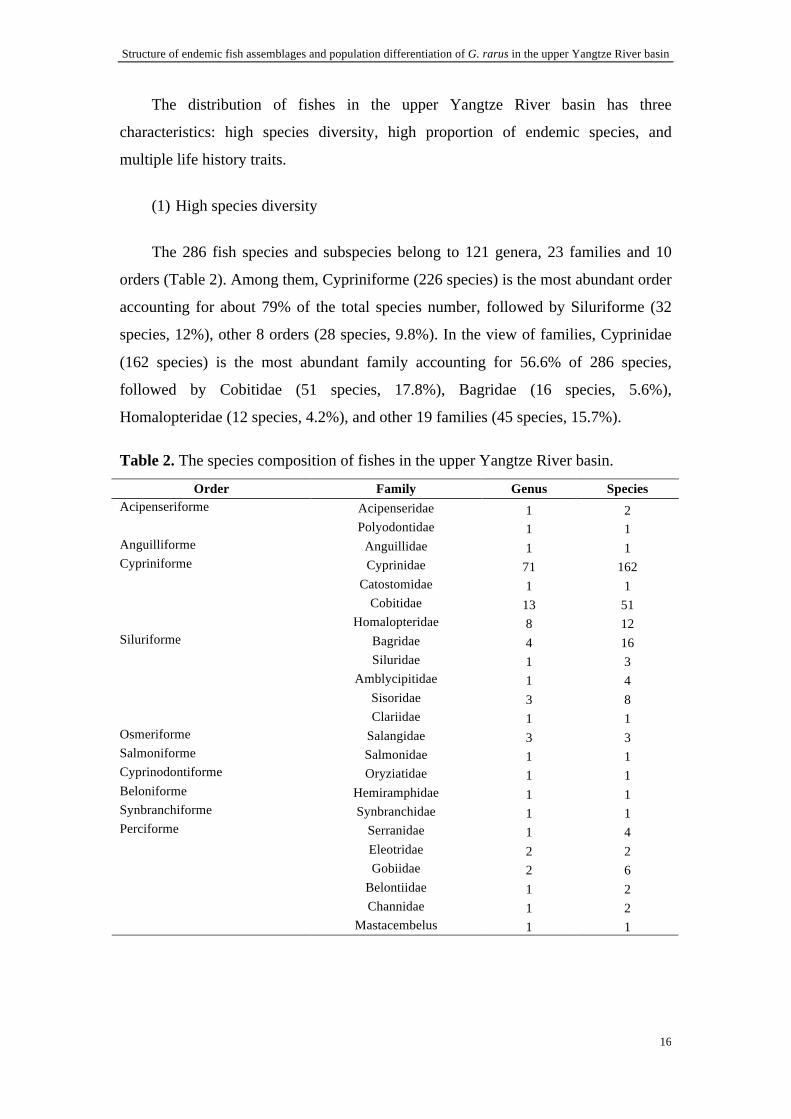
The 286 fish species and subspecies belong to 121 genera, 23 families and 10
orders (Table 2). Among them, Cypriniforme (226 species) is the most abundant order
accounting for about 79% of the total species number, followed by Siluriforme (32
species, 12%), other 8 orders (28 species, 9.8%). In the view of families, Cyprinidae
(162 species) is the most abundant family accounting for 56.6% of 286 species,
followed by Cobitidae (51 species, 17.8%), Bagridae (16 species, 5.6%),
Homalopteridae (12 species, 4.2%), and other 19 families (45 species, 15.7%).
Table 2. The species composition of fishes in the upper Yangtze River basin.
Order Family Genus Species Acipenseridae 1 2 Acipenseriforme Polyodontidae 1 1
Anguilliforme Anguillidae 1 1 Cyprinidae 71 162
Catostomidae 1 1 Cobitidae 13 51
Cypriniforme
Homalopteridae 8 12 Bagridae 4 16 Siluridae 1 3
Amblycipitidae 1 4 Sisoridae 3 8
Siluriforme
Clariidae 1 1 Osmeriforme Salangidae 3 3 Salmoniforme Salmonidae 1 1 Cyprinodontiforme Oryziatidae 1 1 Beloniforme Hemiramphidae 1 1 Synbranchiforme Synbranchidae 1 1
Serranidae 1 4 Eleotridae 2 2 Gobiidae 2 6
Belontiidae 1 2 Channidae 1 2
Perciforme
Mastacembelus 1 1
Structure of endemic fish assemblages and population differentiation of G. rarus in the upper Yangtze River basin
17
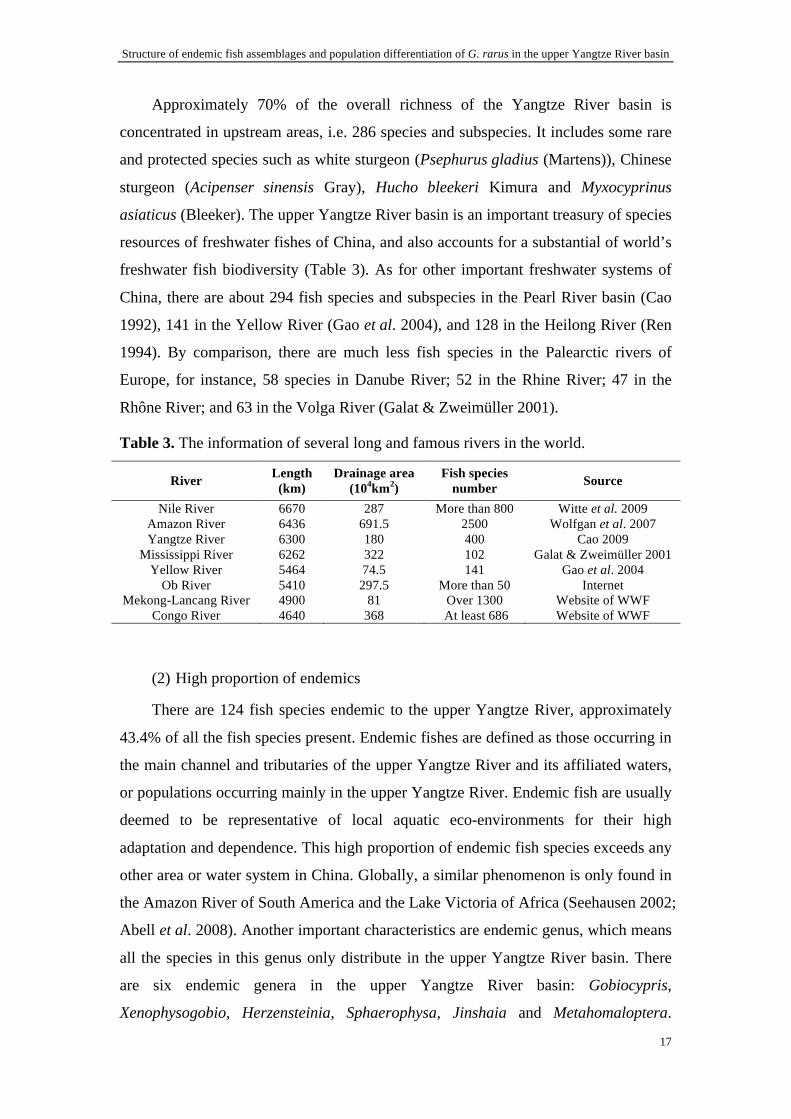
Approximately 70% of the overall richness of the Yangtze River basin is
concentrated in upstream areas, i.e. 286 species and subspecies. It includes some rare
and protected species such as white sturgeon (Psephurus gladius (Martens)), Chinese
sturgeon (Acipenser sinensis Gray), Hucho bleekeri Kimura and Myxocyprinus
asiaticus (Bleeker). The upper Yangtze River basin is an important treasury of species
resources of freshwater fishes of China, and also accounts for a substantial of world’s
freshwater fish biodiversity (Table 3). As for other important freshwater systems of
China, there are about 294 fish species and subspecies in the Pearl River basin (Cao
1992), 141 in the Yellow River (Gao et al. 2004), and 128 in the Heilong River (Ren
1994). By comparison, there are much less fish species in the Palearctic rivers of
Europe, for instance, 58 species in Danube River; 52 in the Rhine River; 47 in the
Rhône River; and 63 in the Volga River (Galat & Zweimüller 2001).
Table 3. The information of several long and famous rivers in the world.
River Length (km)
Drainage area (104km2)
Fish species number Source
Nile River 6670 287 More than 800 Witte et al. 2009 Amazon River 6436 691.5 2500 Wolfgan et al. 2007 Yangtze River 6300 180 400 Cao 2009
Mississippi River 6262 322 102 Galat & Zweimüller 2001 Yellow River 5464 74.5 141 Gao et al. 2004
Ob River 5410 297.5 More than 50 Internet Mekong-Lancang River 4900 81 Over 1300 Website of WWF
Congo River 4640 368 At least 686 Website of WWF
(2) High proportion of endemics
There are 124 fish species endemic to the upper Yangtze River, approximately
43.4% of all the fish species present. Endemic fishes are defined as those occurring in
the main channel and tributaries of the upper Yangtze River and its affiliated waters,
or populations occurring mainly in the upper Yangtze River. Endemic fish are usually
deemed to be representative of local aquatic eco-environments for their high
adaptation and dependence. This high proportion of endemic fish species exceeds any
other area or water system in China. Globally, a similar phenomenon is only found in
the Amazon River of South America and the Lake Victoria of Africa (Seehausen 2002;
Abell et al. 2008). Another important characteristics are endemic genus, which means
all the species in this genus only distribute in the upper Yangtze River basin. There
are six endemic genera in the upper Yangtze River basin: Gobiocypris,
Xenophysogobio, Herzensteinia, Sphaerophysa, Jinshaia and Metahomaloptera.
Structure of endemic fish assemblages and population differentiation of G. rarus in the upper Yangtze River basin
18
These endemic fish species and genera have important scientific, economic, and
biodiversity values.
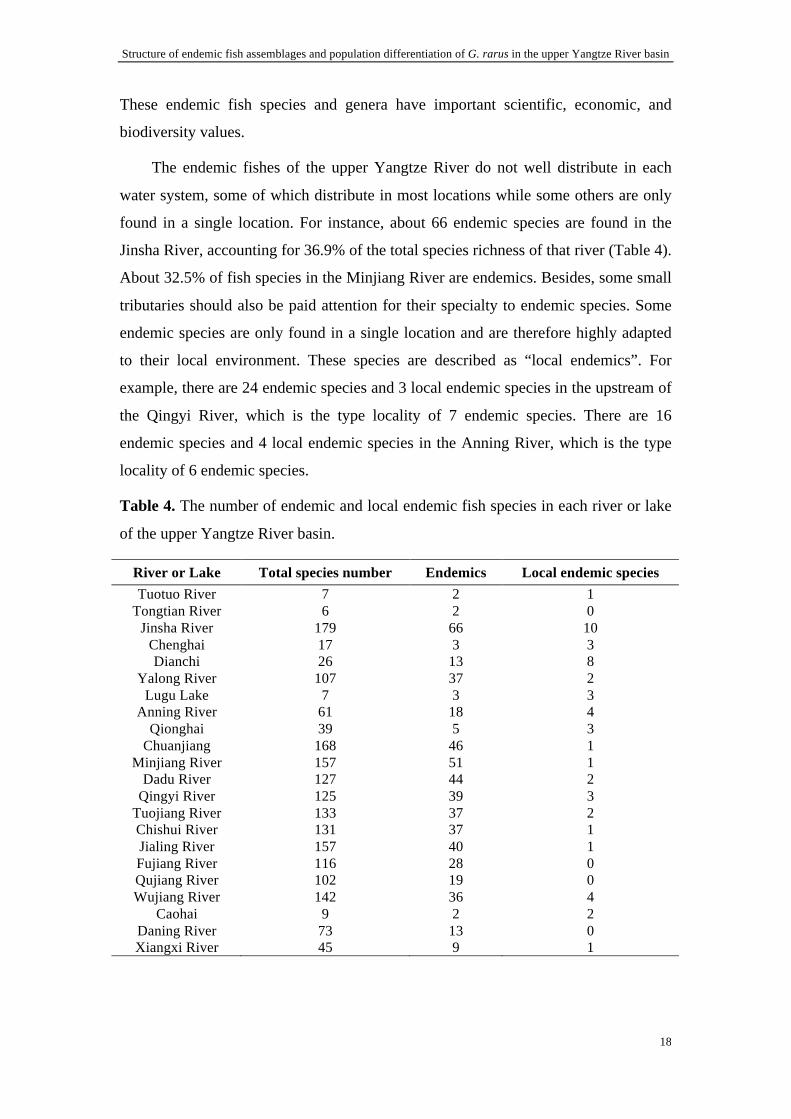
The endemic fishes of the upper Yangtze River do not well distribute in each
water system, some of which distribute in most locations while some others are only
found in a single location. For instance, about 66 endemic species are found in the
Jinsha River, accounting for 36.9% of the total species richness of that river (Table 4).
About 32.5% of fish species in the Minjiang River are endemics. Besides, some small
tributaries should also be paid attention for their specialty to endemic species. Some
endemic species are only found in a single location and are therefore highly adapted
to their local environment. These species are described as “local endemics”. For
example, there are 24 endemic species and 3 local endemic species in the upstream of
the Qingyi River, which is the type locality of 7 endemic species. There are 16
endemic species and 4 local endemic species in the Anning River, which is the type
locality of 6 endemic species.
Table 4. The number of endemic and local endemic fish species in each river or lake
of the upper Yangtze River basin.
River or Lake Total species number Endemics Local endemic species Tuotuo River 7 2 1
Tongtian River 6 2 0 Jinsha River 179 66 10
Chenghai 17 3 3 Dianchi 26 13 8
Yalong River 107 37 2 Lugu Lake 7 3 3
Anning River 61 18 4 Qionghai 39 5 3
Chuanjiang 168 46 1 Minjiang River 157 51 1
Dadu River 127 44 2 Qingyi River 125 39 3
Tuojiang River 133 37 2 Chishui River 131 37 1 Jialing River 157 40 1 Fujiang River 116 28 0 Qujiang River 102 19 0 Wujiang River 142 36 4
Caohai 9 2 2 Daning River 73 13 0 Xiangxi River 45 9 1
Structure of endemic fish assemblages and population differentiation of G. rarus in the upper Yangtze River basin
19
(3) Multiple life history traits
In ecological studies, fish species sharing more or less the same niche are often
grouped into guilds (functional groups) of species that exploit a resource (food or
habitat) in a similar fashion (Bain et al. 1988; Aarts & Nienhuis 2003). Species can be
grouped into guilds on the basis of many different life-history traits, e.g., habitat use,
reproduction, and feeding.
The fish show high adaptability to their habitat environment, while their
morphological and ecological characteristics change correspondingly (Wu & Wu
1992). For instance, Redeke (1941; in Aarts & Nienhuis 2003) revealed that there was
five flow preference guilds of adult fishes in the Netherlands, such as rheophilic
(some or all stages of life history are confined to flowing water), limnophilic (all
stages of life history are confined to lentic waters with macrophytes), eurytopic (all
stages of life history can occur in both lotic and lentic waters), anadromous (adults
migrate upriver to spawn) and catadromous species (adults migrate to sea for
spawning). As the species adaptive to lotic waters, some fishes of Homalopteridae
and Sisoridae in the upper Yangtze River basin have specific body morphology, e.g.,
sucker structure to prevent from being washed away (Wu & Wu 1992).
In the view of reproduction type, the fishes in the upper Yangtze River can be
grouped into three types: drifting eggs, sticky eggs, and demersal eggs. Largemouth
bronze gudgeon (Coreius guichenoti) is usually considered as representative of the
fishes that produce drifting eggs. The embryos develop and hatch out in the wide river
reaches, which are beneficial for dispersal and feeding. Some fish such as rock carp
(Procypris rabaudi) usually lay sticky eggs on the water plants or pebbles. The fish
such as Yangtze sturgeon (Acipenser dabryanus) usually lay demersal eggs into the
gravel bank of upstream river sections. The spawning grounds of Yangtze sturgeon
are located in the downstream of the Jinsha River (the upper part of the Yangtze
River). With a high current velocity, the flow regime of spawning sites usually
complicates embryos dispersal. In addition, gravel banks can protect eggs and
embryos from being eaten by demersal fishes.
There are different classification systems to group fish species into guilds
according to their feeding ecology, such as Allen (1969; invertivores, piscivores, and
herbivores), Van den Brink et al. (1996; parasitic, detritivorous, zoobenthivorous,
Structure of endemic fish assemblages and population differentiation of G. rarus in the upper Yangtze River basin
20
zooplanktivorous, piscivorous, and phytivorous), Berrebi dit Thomas et al. (1998;
invertivores, omnivores, and piscivores), Goldstein & Simon (1999; herbivores,
detritivores, planktivores, invertivores, and carnivores), Aarts & Nienhuis (2003;
zoobenthivorous, piscivores, phytivorous, zooplanktivores, detritivores, parasitic, and
periphytivorous).
In the upper Yangtze River basin, the fishes can be grouped into 6 feeding types:
benthivores, planktivores, piscivores, phytobenthivores, phytivorous and omnivores.
The proportion of benthivores species is high, e.g., almost half of endemic fishes in
the upper Yangtze River are benthivores. The benthivores species are mainly
composed of most species from Cobitidae, Homalopteridae, Amblycipitidae, Bagridae,
Sisoridae and Schizothorax, and some species such as Yangtze sturgeon (Acipenser
dabryanus), Procypris rabaudi, Gymnodiptychus pachycheilus and Ptychonbarbus
kaznakovi. Some small species from Yunnanilus, Anabarilius and Hemiculter are
planktivores. Ancherythroculter, Percoypris pingi pingi and Silurus mento usually
feed on other fishes, being called as piscivores species. Phytobenthivores species such
as some species from Xenocypris, Onychostoma, Schizothorax and Schizopygopis
mainly feed on periphytic algae for their specific mouth morphology. Phytivorous
species such as Ctenopharyngodon idellus mainly feed on aquatic vascular plant.
Omnivores species, such as Coreius guichenoti, Rhinogobio cylindricus Günther, and
Rhinogobio ventralis Sauvage et Dabry, usually live in relatively large rivers, and
feed on both animal diets (e.g., aquatic insects, shrimps, Limnoperna lacustris) and
plant (e.g., algae, seed and residue of plants) diets.
From the distribution, habitat use, reproduction type and feeding type of fishes in
the upper Yangtze River basin, almost all the fishes are highly dependent to the flow
waters and its littoral zone habitat of this ecosystem.
Environmental Threats
The fishes of the upper Yangtze River are experiencing some of the
aforementioned threats to global freshwater biodiversity and therefore tend to
decrease gradually (Dudgeon 2010). The main three issues are overexploitation, water
pollution and hydropower projects. While the yearly catch of natural fishing in the
Yangtze River basin used to reach up to 4.5×10⁵ t in 1954, it has rapidly declined to
Structure of endemic fish assemblages and population differentiation of G. rarus in the upper Yangtze River basin
21
2×10⁵ t during the 1980s, and in recent years, to 1×10⁵ t mainly as a consequence of
overfishing (Chen et al. 2002; Chen 2003). The Yangtze River basin is also
experiencing severe pollution from domestic sewage and industrial wastewater, which
causes further reduction in fishery resources. For example, industrial wastewater
illegally discharged from a chemical plant directly resulted in the 481t loss of fishes
in the upstream portion of Dadu River (Chen 2003). In order to search for energy,
hydropower projects have been carried out worldwide. According to the data
collected by the International Commission on Large Dams in 1950, there are 5268
dams in the world, among which only 22 dams are built in China (Jia et al. 2005).
Until 2005, there are more than 50000 dams higher than 15m in the world. While,
there are around 22000 dams in China, accounting for 44% (Jia et al. 2005). In the
upper Yangtze River, the largest one is the Three Gorges Dam (TGD) located in
Hubei Province. Now completed but not yet operating, the Xiluodu Dam ranks second
in size to the TGD and is located in the downstream portion of Jinsha River (Dudgeon
2010). It belongs to a series of hydropower projects along the Jinsha River. These
dams could block migration, fragment habitats, modify flow regime, and change
water quality, which might cause sharply decreasing of fish resources. Aiming at
reducing the threats and protecting fish resources in the upper Yangtze River basin,
multiple effective conservation measures should be carried out, such as controlling
catch, improving the protection of water resources, setting up natural reserves,
artificial reproduction and release, construction of fishway, etc.
1-3. Objectives of this thesis
The upper Yangtze River basin is experiencing critical changes through multiple
ecological threats, and that its once abundant fishery resource has now decreased
sharply. It is thus imperative to evaluate the impact of the changes in ecosystem’s
features on the observed fishery resource decline and to accelerate the progress of
conservation projects. Therefore, for the purpose of providing insight into
mechanisms structuring fish assemblages and enhancing knowledge on important
ecological processes in the upper Yangtze River, the main objectives of this thesis are
(1) to reveal the spatial pattern of all endemic fishes in the upper Yangtze River basin
and (2) to relate the distribution of these endemic fish species with environmental
features. These contributions form the first and second papers of the present thesis
Structure of endemic fish assemblages and population differentiation of G. rarus in the upper Yangtze River basin
22
(P1 and P2) and are envisioned to provide direction for future conservation and
management efforts for both the fish and its habitat. Furthermore, in order to obtain
enough background of an endangered endemic fish (Gobiocypris rarus) as well as to
provide guidelines for other species conservation in the upper Yangtze River basin,
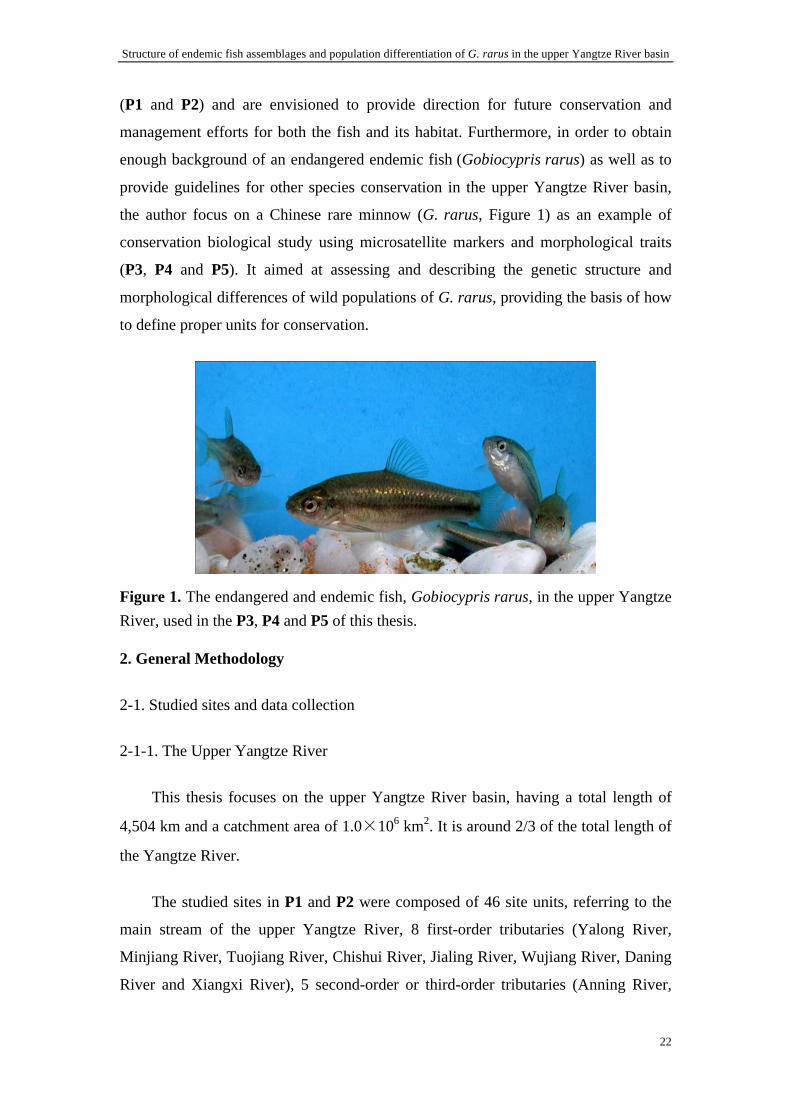
the author focus on a Chinese rare minnow (G. rarus, Figure 1) as an example of
conservation biological study using microsatellite markers and morphological traits
(P3, P4 and P5). It aimed at assessing and describing the genetic structure and
morphological differences of wild populations of G. rarus, providing the basis of how
to define proper units for conservation.
Figure 1. The endangered and endemic fish, Gobiocypris rarus, in the upper Yangtze River, used in the P3, P4 and P5 of this thesis.
2. General Methodology
2-1. Studied sites and data collection
2-1-1. The Upper Yangtze River
This thesis focuses on the upper Yangtze River basin, having a total length of
4,504 km and a catchment area of 1.0×10⁶ km2. It is around 2/3 of the total length of
the Yangtze River.
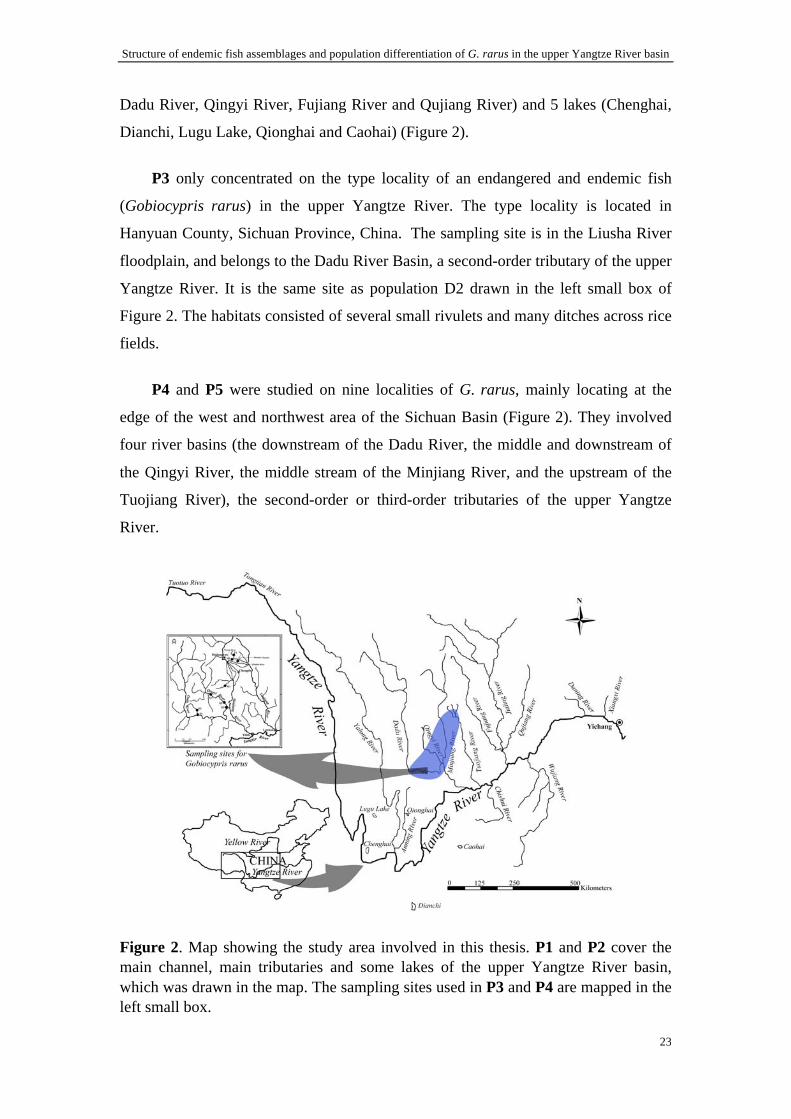
The studied sites in P1 and P2 were composed of 46 site units, referring to the
main stream of the upper Yangtze River, 8 first-order tributaries (Yalong River,
Minjiang River, Tuojiang River, Chishui River, Jialing River, Wujiang River, Daning
River and Xiangxi River), 5 second-order or third-order tributaries (Anning River,
Structure of endemic fish assemblages and population differentiation of G. rarus in the upper Yangtze River basin
23
Dadu River, Qingyi River, Fujiang River and Qujiang River) and 5 lakes (Chenghai,
Dianchi, Lugu Lake, Qionghai and Caohai) (Figure 2).
P3 only concentrated on the type locality of an endangered and endemic fish
(Gobiocypris rarus) in the upper Yangtze River. The type locality is located in
Hanyuan County, Sichuan Province, China. The sampling site is in the Liusha River
floodplain, and belongs to the Dadu River Basin, a second-order tributary of the upper
Yangtze River. It is the same site as population D2 drawn in the left small box of
Figure 2. The habitats consisted of several small rivulets and many ditches across rice
fields.
P4 and P5 were studied on nine localities of G. rarus, mainly locating at the
edge of the west and northwest area of the Sichuan Basin (Figure 2). They involved
four river basins (the downstream of the Dadu River, the middle and downstream of
the Qingyi River, the middle stream of the Minjiang River, and the upstream of the
Tuojiang River), the second-order or third-order tributaries of the upper Yangtze
River.
Figure 2. Map showing the study area involved in this thesis. P1 and P2 cover the main channel, main tributaries and some lakes of the upper Yangtze River basin, which was drawn in the map. The sampling sites used in P3 and P4 are mapped in the left small box.
Structure of endemic fish assemblages and population differentiation of G. rarus in the upper Yangtze River basin
24
2-1-2. Data collection
The long-term presence-absence distribution data of 124 endemic fishes on the
upper Yangtze River were used in P1. These endemic fishes data were selected from
the distribution data of all the fishes in the upper Yangtze River basin, which had
been described and discussed in the “General Introduction” part of this thesis. The
authors also used the proportion data of 18 land-cover classes (needleleaved
evergreen forest-NEF, broadleaved evergreen forest-BEF, broadleaved deciduous
forest-BDF, bush-B, sparse woods-SW, alpine and sub-alpine meadow-ASM,
slope grassland-SG, plain grassland-PG, desert grassland-DG, city-C, river-R,
lake-L, swamp-S, glacier-GL, bare rocks-BR, gravel-GR, farmland-F,
alpine and sub-alpine plain grassland-ASG) for each site unit, extracting from the
China Land Cover map through the Geographical Information System (GIS).
P2 considered endemic fish assemblages and species richness as two response
variables. Five endemic fish assemblages (Ia, Ib, IIa, IIb1, IIb2) were defined in P1,
based on the presence-absence distribution data of 124 endemic fishes in the upper
Yangtze River basin. The species richness per site unit was also calculated from this
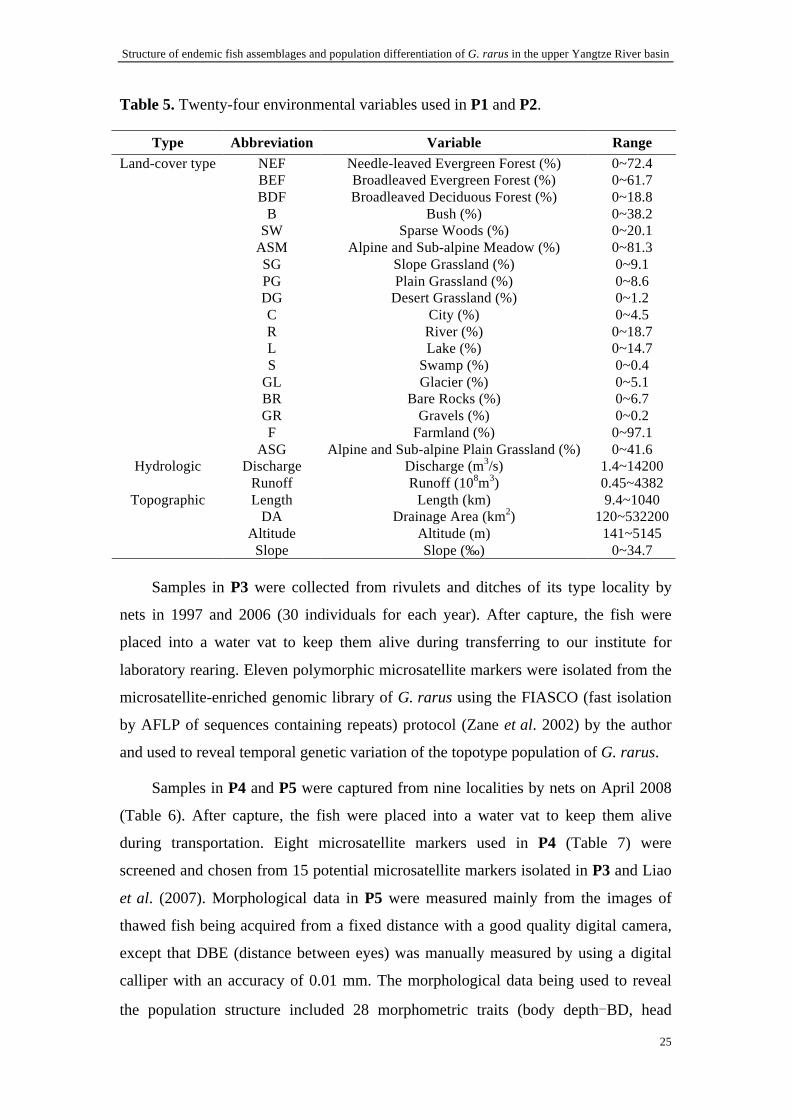
presence-absence endemic fish distribution data. Moreover, 24 environmental
variables were recorded as predictor variables. These environmental variables
included two parts: 18 land-cover features already used in P1 and 6 river
characteristics (length, drainage area, altitude, slope, discharge and runoff) (Table 5).
The river characteristics data for each site unit were mainly collected from the maps
and bibliographies including monographs (Agricultural Regionalization Committee of
Sichuan Province 1991; Ding 1994; Hydrology Bureau of Changjiang Water
Resources Committee 2003) and investigation papers (Shan 1996; Hui et al. 2000;
Huang 2003; Luo & Liu 2003; Fang et al. 2004; Tang et al. 2004; Guo 2005; Wang et
al. 2005; Liu & Shen 2006; Zhou et al. 2006; Zhang et al. 2007).
Structure of endemic fish assemblages and population differentiation of G. rarus in the upper Yangtze River basin
25
Table 5. Twenty-four environmental variables used in P1 and P2.
Type Abbreviation Variable Range NEF Needle-leaved Evergreen Forest (%) 0~72.4 BEF Broadleaved Evergreen Forest (%) 0~61.7 BDF Broadleaved Deciduous Forest (%) 0~18.8
B Bush (%) 0~38.2 SW Sparse Woods (%) 0~20.1
ASM Alpine and Sub-alpine Meadow (%) 0~81.3 SG Slope Grassland (%) 0~9.1 PG Plain Grassland (%) 0~8.6 DG Desert Grassland (%) 0~1.2 C City (%) 0~4.5 R River (%) 0~18.7 L Lake (%) 0~14.7 S Swamp (%) 0~0.4
GL Glacier (%) 0~5.1 BR Bare Rocks (%) 0~6.7 GR Gravels (%) 0~0.2 F Farmland (%) 0~97.1
Land-cover type
ASG Alpine and Sub-alpine Plain Grassland (%) 0~41.6 Discharge Discharge (m3/s) 1.4~14200 Hydrologic
Runoff Runoff (108m3) 0.45~4382 Length Length (km) 9.4~1040
DA Drainage Area (km2) 120~532200 Altitude Altitude (m) 141~5145
Topographic
Slope Slope (‰) 0~34.7
Samples in P3 were collected from rivulets and ditches of its type locality by
nets in 1997 and 2006 (30 individuals for each year). After capture, the fish were
placed into a water vat to keep them alive during transferring to our institute for
laboratory rearing. Eleven polymorphic microsatellite markers were isolated from the
microsatellite-enriched genomic library of G. rarus using the FIASCO (fast isolation
by AFLP of sequences containing repeats) protocol (Zane et al. 2002) by the author
and used to reveal temporal genetic variation of the topotype population of G. rarus.
Samples in P4 and P5 were captured from nine localities by nets on April 2008
(Table 6). After capture, the fish were placed into a water vat to keep them alive
during transportation. Eight microsatellite markers used in P4 (Table 7) were
screened and chosen from 15 potential microsatellite markers isolated in P3 and Liao
et al. (2007). Morphological data in P5 were measured mainly from the images of
thawed fish being acquired from a fixed distance with a good quality digital camera,
except that DBE (distance between eyes) was manually measured by using a digital
calliper with an accuracy of 0.01 mm. The morphological data being used to reveal
the population structure included 28 morphometric traits (body depth-BD, head
Structure of endemic fish assemblages and population differentiation of G. rarus in the upper Yangtze River basin
26
length-HL, snout length-SnL, eye diameter-ED, distance between eyes-DBE,
peduncle length-PL, peduncle height-PH, and 21 truss network distances) and 4
meristic traits (pectoral fin rays-PFR, dorsal fin rays-DFR, ventral fin rays-VFR,
anal fin rays-AFR).
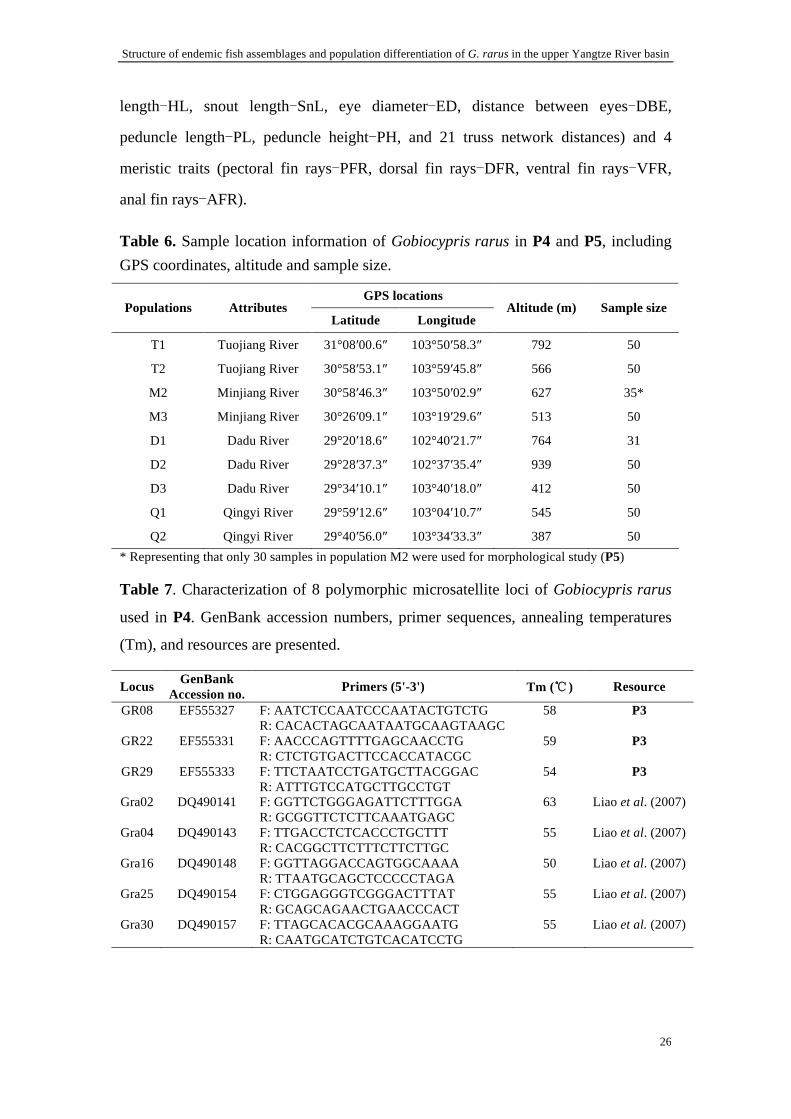
Table 6. Sample location information of Gobiocypris rarus in P4 and P5, including GPS coordinates, altitude and sample size.
GPS locations Populations Attributes
Latitude Longitude Altitude (m) Sample size
T1 Tuojiang River 31°08′00.6″ 103°50′58.3″ 792 50
T2 Tuojiang River 30°58′53.1″ 103°59′45.8″ 566 50
M2 Minjiang River 30°58′46.3″ 103°50′02.9″ 627 35*
M3 Minjiang River 30°26′09.1″ 103°19′29.6″ 513 50
D1 Dadu River 29°20′18.6″ 102°40′21.7″ 764 31
D2 Dadu River 29°28′37.3″ 102°37′35.4″ 939 50
D3 Dadu River 29°34′10.1″ 103°40′18.0″ 412 50
Q1 Qingyi River 29°59′12.6″ 103°04′10.7″ 545 50
Q2 Qingyi River 29°40′56.0″ 103°34′33.3″ 387 50 * Representing that only 30 samples in population M2 were used for morphological study (P5)
Table 7. Characterization of 8 polymorphic microsatellite loci of Gobiocypris rarus
used in P4. GenBank accession numbers, primer sequences, annealing temperatures
(Tm), and resources are presented.
Locus GenBank Accession no. Primers (5'-3') Tm (℃) Resource
GR08 EF555327 F: AATCTCCAATCCCAATACTGTCTG 58 P3 R: CACACTAGCAATAATGCAAGTAAGC
GR22 EF555331 F: AACCCAGTTTTGAGCAACCTG 59 P3 R: CTCTGTGACTTCCACCATACGC
GR29 EF555333 F: TTCTAATCCTGATGCTTACGGAC 54 P3 R: ATTTGTCCATGCTTGCCTGT
Gra02 DQ490141 F: GGTTCTGGGAGATTCTTTGGA 63 Liao et al. (2007) R: GCGGTTCTCTTCAAATGAGC
Gra04 DQ490143 F: TTGACCTCTCACCCTGCTTT 55 Liao et al. (2007) R: CACGGCTTCTTTCTTCTTGC
Gra16 DQ490148 F: GGTTAGGACCAGTGGCAAAA 50 Liao et al. (2007) R: TTAATGCAGCTCCCCCTAGA
Gra25 DQ490154 F: CTGGAGGGTCGGGACTTTAT 55 Liao et al. (2007) R: GCAGCAGAACTGAACCCACT
Gra30 DQ490157 F: TTAGCACACGCAAAGGAATG 55 Liao et al. (2007) R: CAATGCATCTGTCACATCCTG
Structure of endemic fish assemblages and population differentiation of G. rarus in the upper Yangtze River basin
27
2-2. Modeling Methods
Ecological communities are the expression of complex biological and abiotic
processes on various scales of time and space. In order to analyze all these processes
(i.e., to include and understand the relationships between community structure and
abiotic factors) and to characterize their relationships using environmental parameters,
their degree of importance, and their structuring, multiple modeling techniques
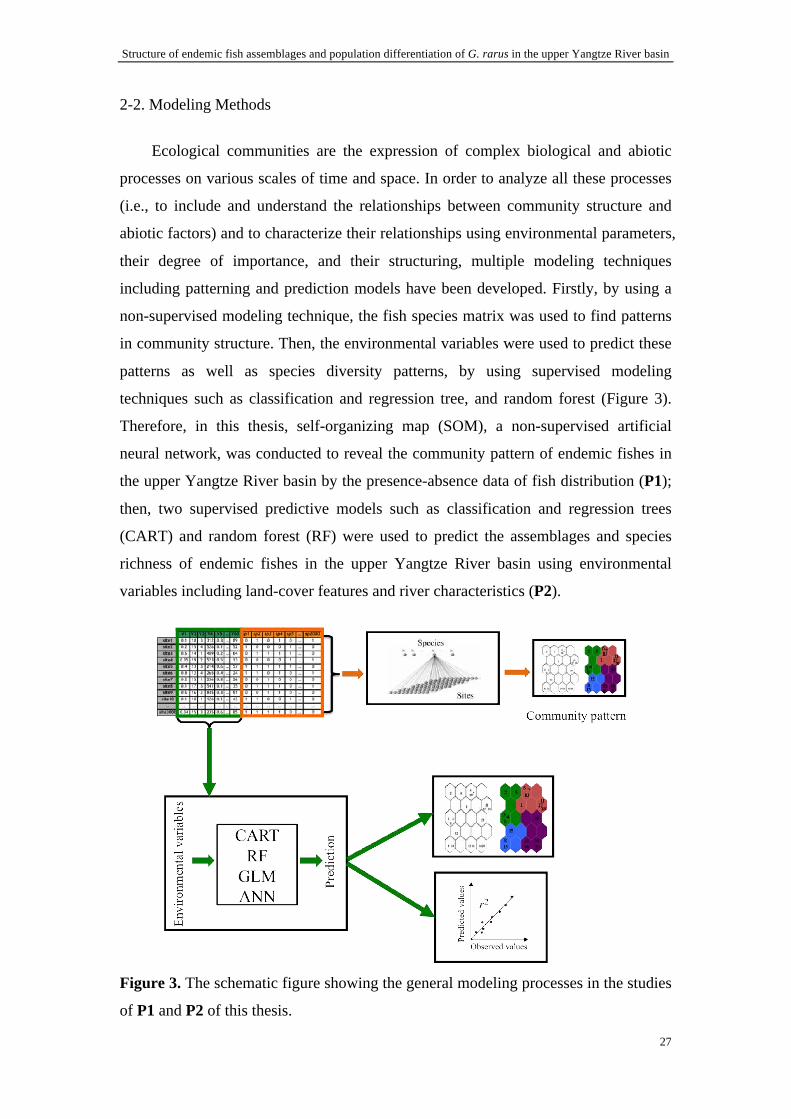
including patterning and prediction models have been developed. Firstly, by using a
non-supervised modeling technique, the fish species matrix was used to find patterns
in community structure. Then, the environmental variables were used to predict these
patterns as well as species diversity patterns, by using supervised modeling
techniques such as classification and regression tree, and random forest (Figure 3).
Therefore, in this thesis, self-organizing map (SOM), a non-supervised artificial
neural network, was conducted to reveal the community pattern of endemic fishes in
the upper Yangtze River basin by the presence-absence data of fish distribution (P1);
then, two supervised predictive models such as classification and regression trees
(CART) and random forest (RF) were used to predict the assemblages and species
richness of endemic fishes in the upper Yangtze River basin using environmental
variables including land-cover features and river characteristics (P2).
Figure 3. The schematic figure showing the general modeling processes in the studies
of P1 and P2 of this thesis.

Structure of endemic fish assemblages and population differentiation of G. rarus in the upper Yangtze River basin
28
2-2-1. Patterning model
The goal of pattern recognition is the classification of objects into a number of
categories or classes. It has been widely applied in fingerprint identification, signature
authentication, text retrieval, and face and gesture recognition (Theodoridis &
Koutroumbas 2006). In recent years, it has grown rapidly in the application of
ecological and environmental sciences (Lek & Guégan 1999; Park et al. 2003; Kangur
et al. 2007; Kruk et al. 2007). It includes two types of patterning: supervised
patterning and unsupervised patterning.
As an unsupervised artificial neural network, the self-organizing map (SOM)
proposed by Kohonen in the early eighties (Kohonen 1982), is an effective and
popular tool for clustering, visualization and abstraction of complex data in terms of a
non-linear projection of multivariate data into lower dimensions (Kohonen 2001; Lek
et al. 2005). There are also other conventional linear ordination methods being used to
simplify the data, e.g., Polar Ordination (PO), Principal Components Analysis (PCA),
Correspondence Analysis (CoA) (Hill & Gauch 1980; Beals 1984; Jongman et al.
1995; Giraudel & Lek 2001). However, for all of them, the limitations are evident:
strong distortions with non-linear species abundance relations, horseshoe effect due to
unimodal species response curves in PCA, and arch effect, outliers, missing data and
disjointed data matrix in CoA. The SOM, perfectly completing these classical
techniques for exploring data and for achieving community ordination (Giraudel &
Lek 2001), has been widely used for classification of communities as well as
prediction of population and community dynamics (Céréghino et al. 2001; Park et al.
2001, 2003, 2006; Kangur et al. 2007; Kruk et al. 2007). Therefore, the SOM was
chosen as the patterning method in our study.
In the P1 of this thesis, the SOM was applied to determine endemic fish
assemblages along the river network of the upper Yangtze River basin, based on
presence-absence data of fish distributions. This study considered sample sites as the
patterning objects, and endemic fish species as the signatures.
The SOM algorithm aims at plotting the sample units (SUs) on a map while
preserving their neighborhood (Figure 4). The SOM consists of two (input and output)
layers: an input layer receiving input values from the data matrix, and an output layer
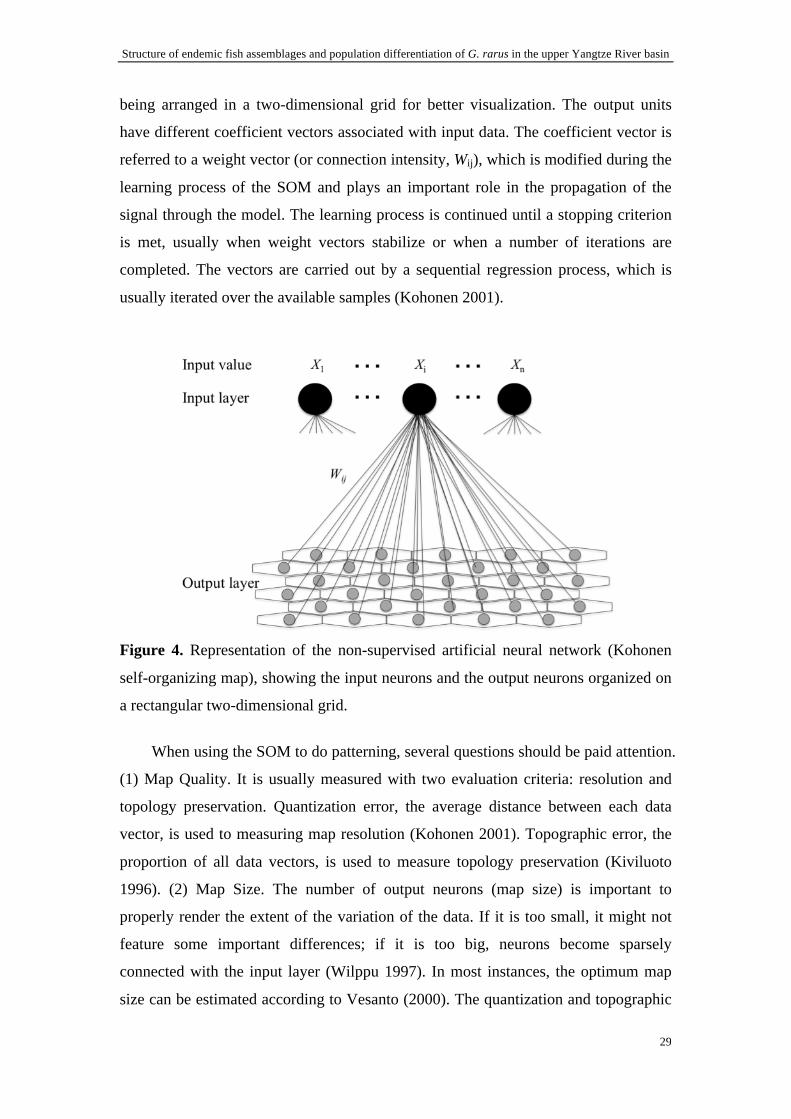
Structure of endemic fish assemblages and population differentiation of G. rarus in the upper Yangtze River basin
29
being arranged in a two-dimensional grid for better visualization. The output units
have different coefficient vectors associated with input data. The coefficient vector is
referred to a weight vector (or connection intensity, Wij), which is modified during the
learning process of the SOM and plays an important role in the propagation of the
signal through the model. The learning process is continued until a stopping criterion
is met, usually when weight vectors stabilize or when a number of iterations are
completed. The vectors are carried out by a sequential regression process, which is
usually iterated over the available samples (Kohonen 2001).
Figure 4. Representation of the non-supervised artificial neural network (Kohonen
self-organizing map), showing the input neurons and the output neurons organized on
a rectangular two-dimensional grid.
When using the SOM to do patterning, several questions should be paid attention.
(1) Map Quality. It is usually measured with two evaluation criteria: resolution and
topology preservation. Quantization error, the average distance between each data
vector, is used to measuring map resolution (Kohonen 2001). Topographic error, the
proportion of all data vectors, is used to measure topology preservation (Kiviluoto
1996). (2) Map Size. The number of output neurons (map size) is important to
properly render the extent of the variation of the data. If it is too small, it might not
feature some important differences; if it is too big, neurons become sparsely
connected with the input layer (Wilppu 1997). In most instances, the optimum map
size can be estimated according to Vesanto (2000). The quantization and topographic
Structure of endemic fish assemblages and population differentiation of G. rarus in the upper Yangtze River basin
30
errors are also the important index for choosing optimum map size. (3) Clustering
SOM Units. It is difficult to distinguish subsets from the trained SOM map because
there is often no clear boundary between possible clusters. Two methods can be used
to divide the trained SOM units into different subgroups. First, the unified distance
matrix algorithm (U-matrix; Ultsch 1993) calculating distances between neighboring
map units is applied. A k-means method was used as complementary method to
confirm the U-matrix clustering (Jain & Dubes 1988). Second, a hierarchical cluster
analysis with a Ward’s linkage method based on Euclidean distance measure in
Matlab was applied (The Mathworks 2001). The Davies-Bouldin index (DBI; Davies
& Bouldin 1979), a relative index of cluster validity, was also calculated in order to
select the best patterning among partitions with different numbers of cluster. The
smaller DBI, the better the clustering.
2-2-2. Predicting model
The analysis of species-environment interaction has always been a central issue
in ecology. The quantification of this interaction represents the core of predictive
modeling in ecology. Commonly, the models are generally based on various
hypotheses as to how environmental factors control the distribution of species and
communities. These models also gained importance as a tool to assess the impact of
accelerated land use and other environmental change on the distribution of organisms,
to test biogeographic hypotheses, or to set up conservation priorities (Margules &
Austin 1994; Mourell & Ezcurra 1996; Guisan & Theurillat 2000).
In recent years, considerable attention has been given to the development of
modeling techniques for exploring data sets. They either overcome the parametric
assumption or identify non-linear relationships among data, e.g., classification and
regression trees (CART), random forest (RF), generalized linear models (GLM),
generalized additive models (GAM), multivariate adaptive regression splines (MARS)
(Breiman et al. 1984; Hastie & Tibshirani 1986; Rumelhart & McClelland 1986;
Guisan & Zimmermann 2000; Breiman 2001). Among all the modeling techniques,
CART and RF are both powerful tools for the analysis of complex ecological data for
their accuracy, efficiency, and robustness over other traditional methods (Breiman et
al. 1984; De'ath & Fabricius 2000; Breiman 2001; Razi & Athappilly 2005; Prasad et
Structure of endemic fish assemblages and population differentiation of G. rarus in the upper Yangtze River basin
31
al. 2006; Cutler et al. 2007; Peters et al. 2007; Perdiguero-Alonso et al. 2008). They
were chosen for the predictive models of this thesis.
In the P2 of this thesis, CART and RF, were used to predict the assemblages and
species richness of endemic fishes in the upper Yangtze River basin by environmental
variables. The capacity of these two modeling techniques was evaluated and the
determinant environmental factors contributing to the models were identified.
CART, known as recursive partitioning regression, has received more recent
attention through Breiman et al. (1984). The response variable is usually either
categorical (classification trees) or numeric (regression trees), and the explanatory
variables can be categorical and/or numeric. The objective is to partition the response
into homogeneous groups. It shows desirable properties including the ability to handle
various types of response (numeric, categorical, censored, multivariate and
dissimilarity matrices), independence to monotonic transformations of the predictors,
and ability to deal with missing values with minimal loss of information. Because of
the recursive-fitting algorithm used, CART models are especially useful for
discovering alternative environmental settings that lead to the same response for many
different data structures (Taverna et al. 2004). CART analysis consists of four basic
steps: tree building, stopping the tree building process, tree “pruning” and optimal
tree selection.
RF, exhibiting performance on the level of boosting and support vector machines,
is one of the most successful ensemble methods and an effective tool in prediction.
RF has some common advantages with CART model. For instance, they are
inherently non-parametric; making no distributional assumptions about the predictor
or response variables; both of them have sophisticated approachs for dealing with
missing values; they provide an easy way to interpret complex results involving
interaction among predictors, graphically. However, random forest improves the
performance of single-tree models by reducing variance and bias (Elith et al. 2008). A
random forest usually consists of a compilation of classification or regression trees
(e.g., 1000 trees in a single random forest) to produce more accurate classifications
and regression models than single-tree models (e.g., CART) (Liaw & Wiener 2002).
The trees are grown to maximum size without pruning and aggregation is by
averaging the trees (Prasad et al. 2006). It selects only the best split among a random

Structure of endemic fish assemblages and population differentiation of G. rarus in the upper Yangtze River basin
32
subset of variables at each node, but not among the sequence of pruned trees. The
Random Forest algorithm does not tend to over-fit, a very useful feature for prediction
capacity of the new dataset. It also does not require guidance.
2-3. Molecular methods
The molecular techniques for studying genetic variation were first developed in
the 1960s, i.e., allozyme electrophoresis (Lewontin & Hubby 1966). Diverse
techniques such as mtDNA sequencing, RAPD, RFLP, AFLP, SSCP, SNP and
microsatellites have been quickly developed along with the advent of the polymerase
chain reaction (PCR) (Table 8). However, they have some shortcomings. For example,
allozyme electrophoresis was previously the dominating technique for studies of
genetic structure of populations, but its requirement for fresh tissue samples and many
loci exhibiting tissue-specific expression limit its applications. However,
microsatellites, or simple sequence repeats (SSRs), are a type of tandem repeated
nuclear DNA sequences, which are abundantly distributed across genomes of
eukaryotes and demonstrate high levels of allele polymorphism (Jarne & Lagoda
1996). These are codominant markers of relatively small size, easily amplified with
the polymerase chain reaction. These features of microsatellites, in compared with
other methods, provide the foundation for their successful application in a wide range
of fundamental and applied studies in various fields of biology and medicine,
including forensics, molecular epidemiology, parasitology, population and
conservation genetics, genetic mapping, and the genetics of complex traits
(Chistiakov et al. 2006). It was chosen to reveal population genetic structure of
Gobiocypris rarus in P3 and P4 of this thesis.
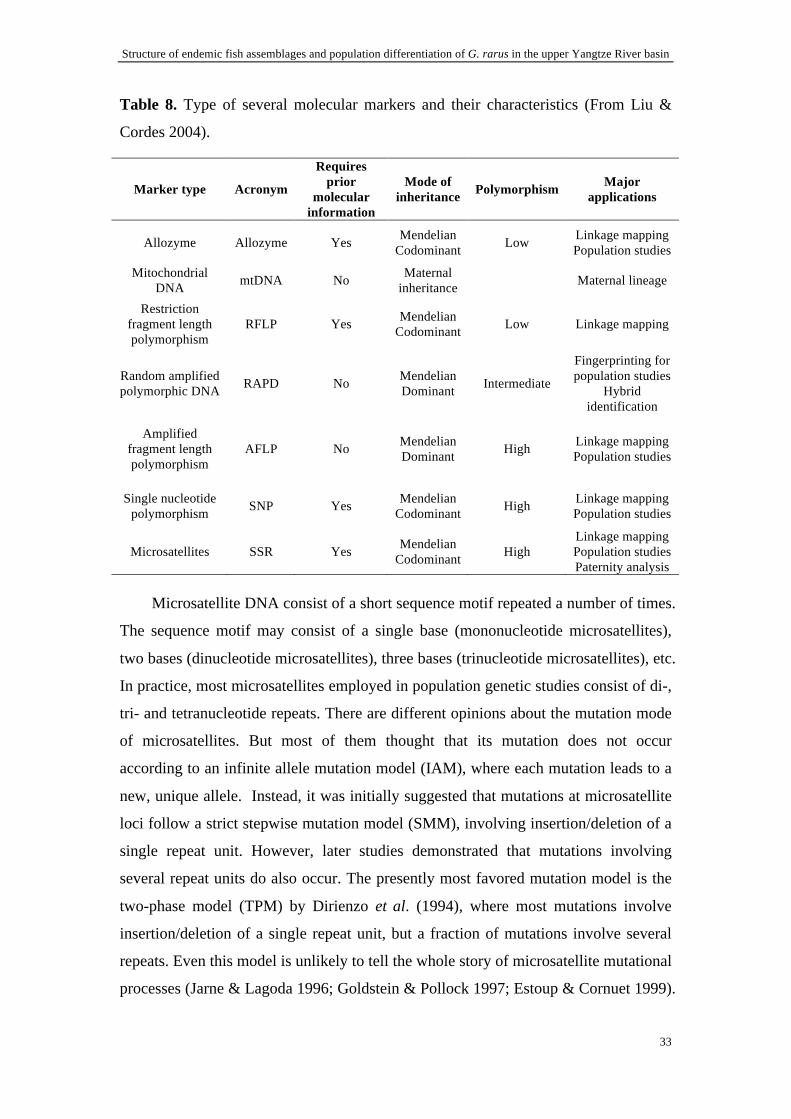
Structure of endemic fish assemblages and population differentiation of G. rarus in the upper Yangtze River basin
33
Table 8. Type of several molecular markers and their characteristics (From Liu &
Cordes 2004).
Marker type Acronym
Requires prior
molecular information
Mode of inheritance Polymorphism Major
applications
Allozyme Allozyme Yes Mendelian Codominant Low Linkage mapping
Population studies
Mitochondrial DNA mtDNA No Maternal
inheritance Maternal lineage
Restriction fragment length polymorphism
RFLP Yes Mendelian Codominant Low Linkage mapping
Random amplified polymorphic DNA RAPD No Mendelian
Dominant Intermediate
Fingerprinting for population studies
Hybrid identification
Amplified fragment length polymorphism
AFLP No Mendelian Dominant High Linkage mapping
Population studies
Single nucleotide polymorphism SNP Yes Mendelian
Codominant High Linkage mapping Population studies
Microsatellites SSR Yes Mendelian Codominant High
Linkage mapping Population studies Paternity analysis
Microsatellite DNA consist of a short sequence motif repeated a number of times.
The sequence motif may consist of a single base (mononucleotide microsatellites),
two bases (dinucleotide microsatellites), three bases (trinucleotide microsatellites), etc.
In practice, most microsatellites employed in population genetic studies consist of di-,
tri- and tetranucleotide repeats. There are different opinions about the mutation mode
of microsatellites. But most of them thought that its mutation does not occur
according to an infinite allele mutation model (IAM), where each mutation leads to a
new, unique allele. Instead, it was initially suggested that mutations at microsatellite
loci follow a strict stepwise mutation model (SMM), involving insertion/deletion of a
single repeat unit. However, later studies demonstrated that mutations involving
several repeat units do also occur. The presently most favored mutation model is the
two-phase model (TPM) by Dirienzo et al. (1994), where most mutations involve
insertion/deletion of a single repeat unit, but a fraction of mutations involve several
repeats. Even this model is unlikely to tell the whole story of microsatellite mutational
processes (Jarne & Lagoda 1996; Goldstein & Pollock 1997; Estoup & Cornuet 1999).

Structure of endemic fish assemblages and population differentiation of G. rarus in the upper Yangtze River basin
34
Therefore, in most case it assumes a strict stepwise mutation model (SMM), but in
some time it assumes a two-phase model (TPM).
Microsatellite markers are mainly obtained from two methods: isolation from
species itself and cross-species amplification. Although cross-species amplification
has been conducted in some species, it generally provides a small subset of the
available microsatellite markers of a species (Tong et al. 2002; Tong et al. 2005).
There are many different methods to isolate microsatellite markers of species, in
which FIASCO protocol (Fast Isolation by AFLP of Sequences Containing repeats) is
the most popular one in recent years (Zane et al. 2002). It is a fast and effective
method and has been applied in many species (Guo et al. 2005; Zhu et al. 2005; Liao
et al. 2006; Liao et al. 2007). The protocol relies on the extremely efficient digestion-
ligation reaction of the amplified fragment length polymorphism procedure (AFLP;
Vos et al. 1995). DNA is simultaneously digested with MseI and ligated to MseI
AFLP adaptor. The digestion-ligation mixture is directly amplified with AFLP
adaptor-specific primers (MseI-N). The number of cycles in the PCR amplification
needs to be optimized because over-amplification was found to change the average
size of amplified fragments. DNA is then hybridized with a biotinylated probe and
selectively captured by streptavidin-coated beads. The beads-probe-DNA complex is
separated by a magnetic field from the hybridization buffer. Nonspecific DNA is
removed by three nonstringency washes and three stringency washes at room
temperature. DNA is separated from the beads-probe complex by denaturation step
and then amplified with MseI-N primers at optimum cycles. Enriched fragments were
eventually ligated into vectors and transformed into competent cells. Clones with
positive inserts were confirmed by PCR amplification using MseI-N primers and were
then sequenced. Primers were designed for the sequences flanking the repeat regions.
Because of their multi-allelic nature, codominant inheritance, small length,
extensive genome coverage and relative abundance, microsatellites have been
successfully applied in a wide variety of research fields and practical disciplines, e.g.,
genetic mapping, individual DNA identification and parentage assignment, phylogeny,
population and conservation genetics, molecular epidemiology and pathology,
quantitative trait loci mapping, marker-assisted selection (Powel et al. 1996;
Structure of endemic fish assemblages and population differentiation of G. rarus in the upper Yangtze River basin
35
Goldstein et al. 1999; Heath et al. 2001; Woram et al. 2004; Gum et al. 2005; Inami
et al. 2005; Reid et al. 2005).
3. Main Results
3-1. Spatial pattern of endemic fishes and roles of environmental factors in the upper
Yangtze River (P1 and P2)
There were 124 endemic fish species distributed in 46 site units of the upper
Yangtze River basin. Five endemic fish assemblages (Ia, Ib, IIa, IIb1 and IIb2) were
identified in the upper Yangtze River basin based on the similarity of species
composition (Figure 5). Not only species composition but also endemic species
richness varied significantly among these five endemic fish assemblages. The
endemic species richness for each site unit ranged from 2 to 56. Besides, drainage
land-cover features were also significantly differentiated among these assemblages
(Figure 6). These five assemblages were composed of 12, 9, 9, 11 and 5 site units,
respectively. There were in total 43 indicator species in the upper Yangtze River in
different hierarchical levels. The last hierarchical level for subdivision of five
assemblages had various number of indicator species, such as no (0) indicator species
in assemblages Ia and IIb2; 3, 9 and 27 in assemblages Ib, IIa and IIb1, respectively.
The indicator species in assemblage Ib belonged to the fish fauna of the Qinghai-
Xizang Plateau (Euchiloglanis kishinouyei, Euchiloglanis davidi and Oreias dabryi
dabryi), while the plateau and plain indicator species coexisted in assemblage IIa (e.g.,
Pareuchiloglanis sinensis, Pareuchiloglanis anteanalis, Percocypris pingi pingi,
Onychostoma angustistomata), and almost all the indicator species in assemblage IIb1
belonged to the river-plain fish fauna (e.g., Rhinogobio ventralis, Coreius guichenoti,
Leptobotia elongate, Sinogastromyzon szechuanensis szechuanensis).
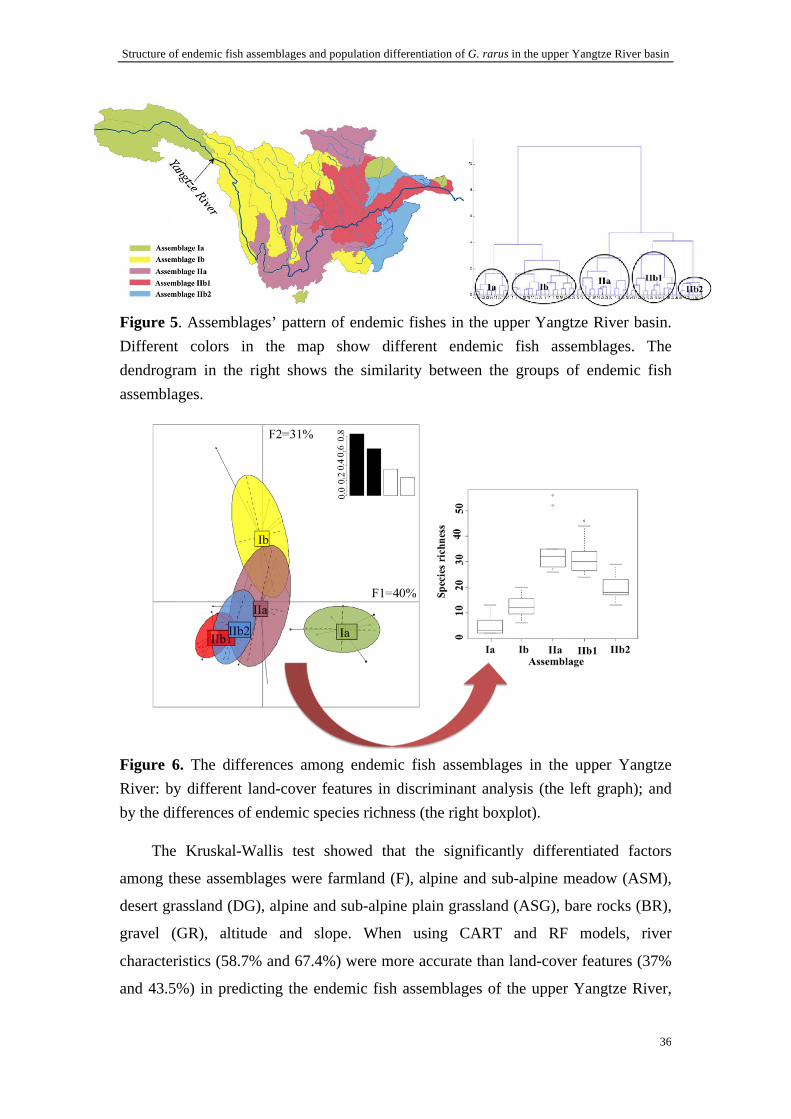
Structure of endemic fish assemblages and population differentiation of G. rarus in the upper Yangtze River basin
36
Figure 5. Assemblages’ pattern of endemic fishes in the upper Yangtze River basin. Different colors in the map show different endemic fish assemblages. The dendrogram in the right shows the similarity between the groups of endemic fish assemblages.
Figure 6. The differences among endemic fish assemblages in the upper Yangtze River: by different land-cover features in discriminant analysis (the left graph); and by the differences of endemic species richness (the right boxplot).
The Kruskal-Wallis test showed that the significantly differentiated factors
among these assemblages were farmland (F), alpine and sub-alpine meadow (ASM),
desert grassland (DG), alpine and sub-alpine plain grassland (ASG), bare rocks (BR),
gravel (GR), altitude and slope. When using CART and RF models, river
characteristics (58.7% and 67.4%) were more accurate than land-cover features (37%
and 43.5%) in predicting the endemic fish assemblages of the upper Yangtze River,
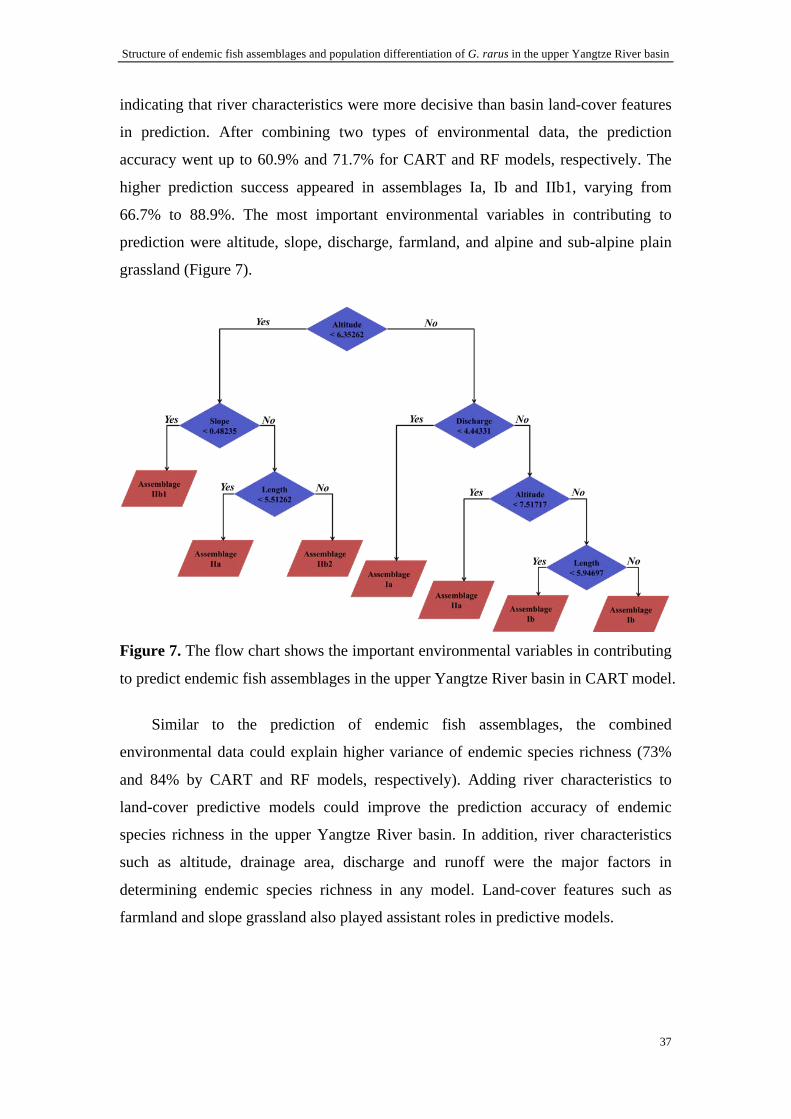
Structure of endemic fish assemblages and population differentiation of G. rarus in the upper Yangtze River basin
37
indicating that river characteristics were more decisive than basin land-cover features
in prediction. After combining two types of environmental data, the prediction
accuracy went up to 60.9% and 71.7% for CART and RF models, respectively. The
higher prediction success appeared in assemblages Ia, Ib and IIb1, varying from
66.7% to 88.9%. The most important environmental variables in contributing to
prediction were altitude, slope, discharge, farmland, and alpine and sub-alpine plain
grassland (Figure 7).
Figure 7. The flow chart shows the important environmental variables in contributing
to predict endemic fish assemblages in the upper Yangtze River basin in CART model.
Similar to the prediction of endemic fish assemblages, the combined
environmental data could explain higher variance of endemic species richness (73%
and 84% by CART and RF models, respectively). Adding river characteristics to
land-cover predictive models could improve the prediction accuracy of endemic
species richness in the upper Yangtze River basin. In addition, river characteristics
such as altitude, drainage area, discharge and runoff were the major factors in
determining endemic species richness in any model. Land-cover features such as
farmland and slope grassland also played assistant roles in predictive models.
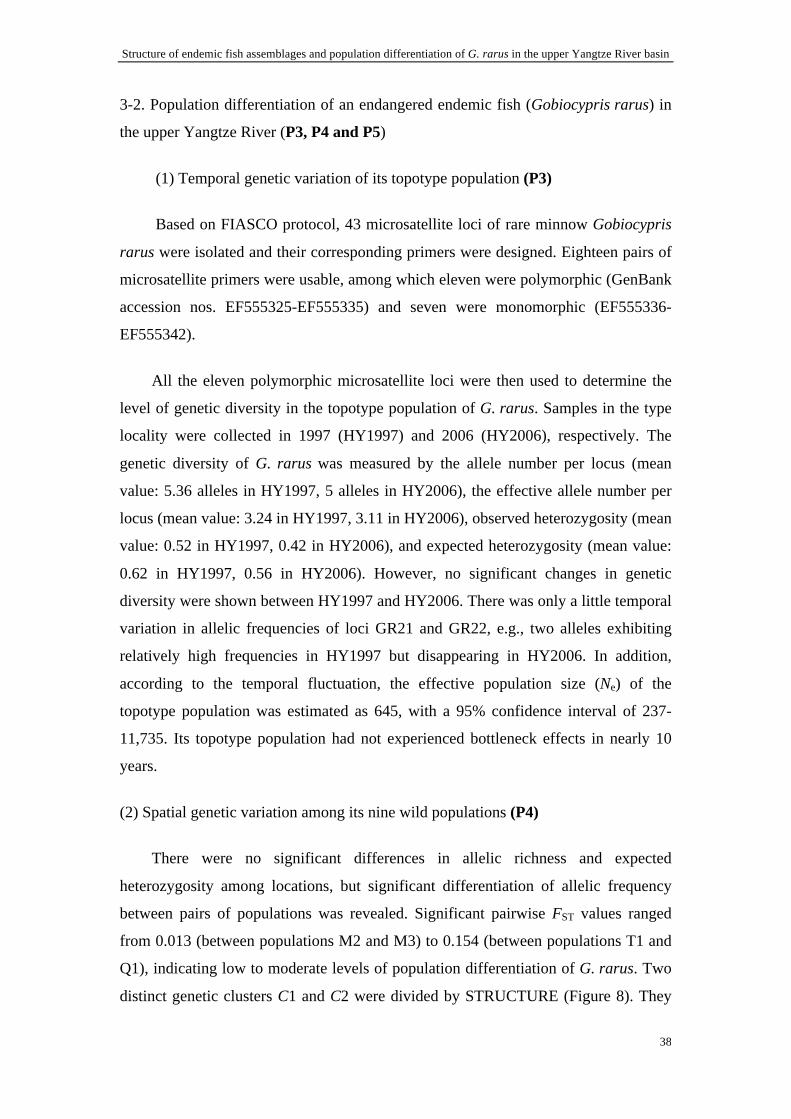
Structure of endemic fish assemblages and population differentiation of G. rarus in the upper Yangtze River basin
38
3-2. Population differentiation of an endangered endemic fish (Gobiocypris rarus) in
the upper Yangtze River (P3, P4 and P5)
(1) Temporal genetic variation of its topotype population (P3)
Based on FIASCO protocol, 43 microsatellite loci of rare minnow Gobiocypris
rarus were isolated and their corresponding primers were designed. Eighteen pairs of
microsatellite primers were usable, among which eleven were polymorphic (GenBank
accession nos. EF555325-EF555335) and seven were monomorphic (EF555336-
EF555342).
All the eleven polymorphic microsatellite loci were then used to determine the
level of genetic diversity in the topotype population of G. rarus. Samples in the type
locality were collected in 1997 (HY1997) and 2006 (HY2006), respectively. The
genetic diversity of G. rarus was measured by the allele number per locus (mean
value: 5.36 alleles in HY1997, 5 alleles in HY2006), the effective allele number per
locus (mean value: 3.24 in HY1997, 3.11 in HY2006), observed heterozygosity (mean
value: 0.52 in HY1997, 0.42 in HY2006), and expected heterozygosity (mean value:
0.62 in HY1997, 0.56 in HY2006). However, no significant changes in genetic
diversity were shown between HY1997 and HY2006. There was only a little temporal
variation in allelic frequencies of loci GR21 and GR22, e.g., two alleles exhibiting
relatively high frequencies in HY1997 but disappearing in HY2006. In addition,
according to the temporal fluctuation, the effective population size (Ne) of the
topotype population was estimated as 645, with a 95% confidence interval of 237-
11,735. Its topotype population had not experienced bottleneck effects in nearly 10
years.
(2) Spatial genetic variation among its nine wild populations (P4)
There were no significant differences in allelic richness and expected
heterozygosity among locations, but significant differentiation of allelic frequency
between pairs of populations was revealed. Significant pairwise FST values ranged
from 0.013 (between populations M2 and M3) to 0.154 (between populations T1 and
Q1), indicating low to moderate levels of population differentiation of G. rarus. Two
distinct genetic clusters C1 and C2 were divided by STRUCTURE (Figure 8). They
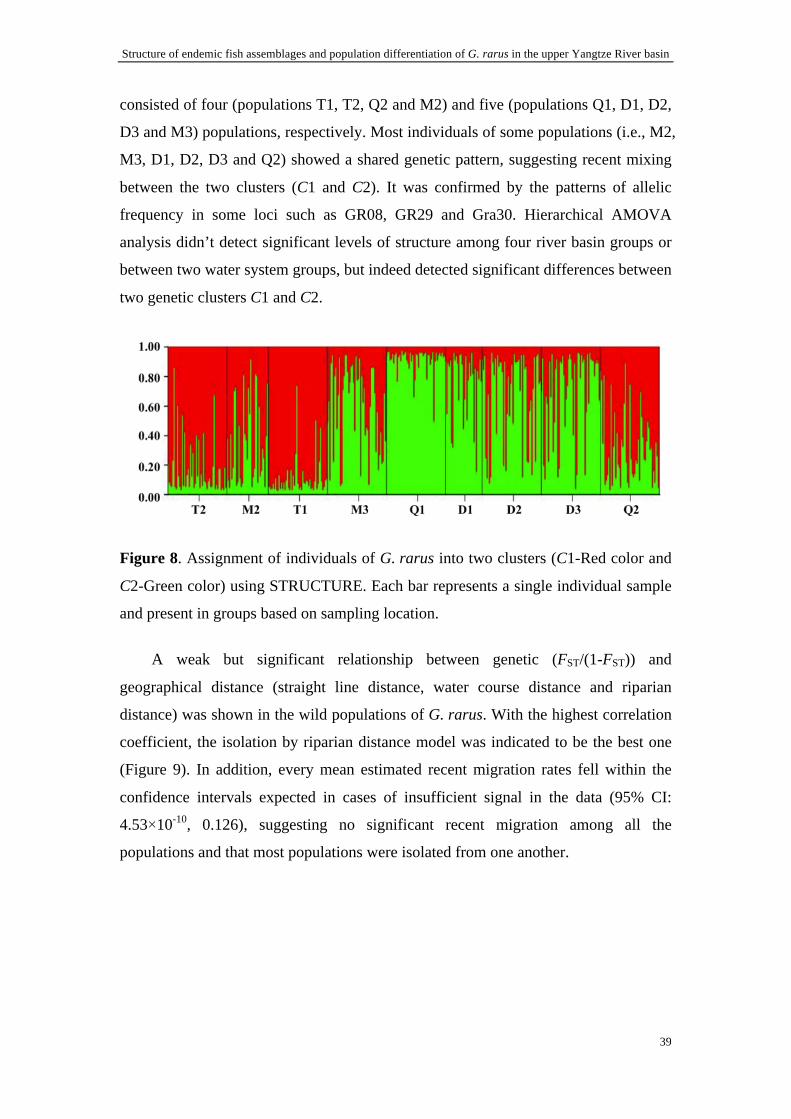
Structure of endemic fish assemblages and population differentiation of G. rarus in the upper Yangtze River basin
39
consisted of four (populations T1, T2, Q2 and M2) and five (populations Q1, D1, D2,
D3 and M3) populations, respectively. Most individuals of some populations (i.e., M2,
M3, D1, D2, D3 and Q2) showed a shared genetic pattern, suggesting recent mixing
between the two clusters (C1 and C2). It was confirmed by the patterns of allelic
frequency in some loci such as GR08, GR29 and Gra30. Hierarchical AMOVA
analysis didn’t detect significant levels of structure among four river basin groups or
between two water system groups, but indeed detected significant differences between
two genetic clusters C1 and C2.
Figure 8. Assignment of individuals of G. rarus into two clusters (C1-Red color and
C2-Green color) using STRUCTURE. Each bar represents a single individual sample
and present in groups based on sampling location.
A weak but significant relationship between genetic (FST/(1-FST)) and
geographical distance (straight line distance, water course distance and riparian
distance) was shown in the wild populations of G. rarus. With the highest correlation
coefficient, the isolation by riparian distance model was indicated to be the best one
(Figure 9). In addition, every mean estimated recent migration rates fell within the
confidence intervals expected in cases of insufficient signal in the data (95% CI:
4.53×10⁻¹⁰, 0.126), suggesting no significant recent migration among all the
populations and that most populations were isolated from one another.
Structure of endemic fish assemblages and population differentiation of G. rarus in the upper Yangtze River basin
40
Figure 9. Isolation-by-distance pattern among G. rarus wild populations. The best correlation model between FST/(1-FST) and ln (riparian geographical distance, km) is shown.
(3) Morphological variation among nine wild populations of G. rarus (P5)
There were no significant differences between sexes or among populations in
meristic characters. The ranges of meristic counts widely overlapped, and their modes
were equal or close to each other among populations.
After removing size effect, there were still statistical differences in
morphometric characters between male and female samples. There were significant
sexual differences in 18 of all the standardized morphometric traits, such as BD, DBE,
PL, PH, D1_2, D4_3, D3_1, D2_3, D4_6, D5_3, D3_6, D4_5, D6_8, D7_5, D10_9,
D9_7, D7_10 and D8_9. Thus males and females were separately analyzed in further
analysis. With sex included as a fixed-effect factor, there were significant differences
among populations over all morphometric measurements by MANOVA analysis. The
random Monte Carlo permutation test of a discriminant analysis also showed that all
the studied populations were significantly discriminated based on standardized
morphometric traits (p < 0.001, Figure 10). Most of the morphometric traits in head
size and vertical body shape from males or females (e.g., HL, PH, BD, D4_5, D8_7,
D10_9, D6_7) played most important roles in discriminating different populations.
The accuracy of reassignment of individuals into their original populations was 72.1%
for males, 79.4% for females, and 75.3% for all samples. Pairwise quantitative
divergence (QST) among populations over all morphometric traits varied from 0.039
(between populations T2 and M2) to 0.188 (between populations T1 and D2). In
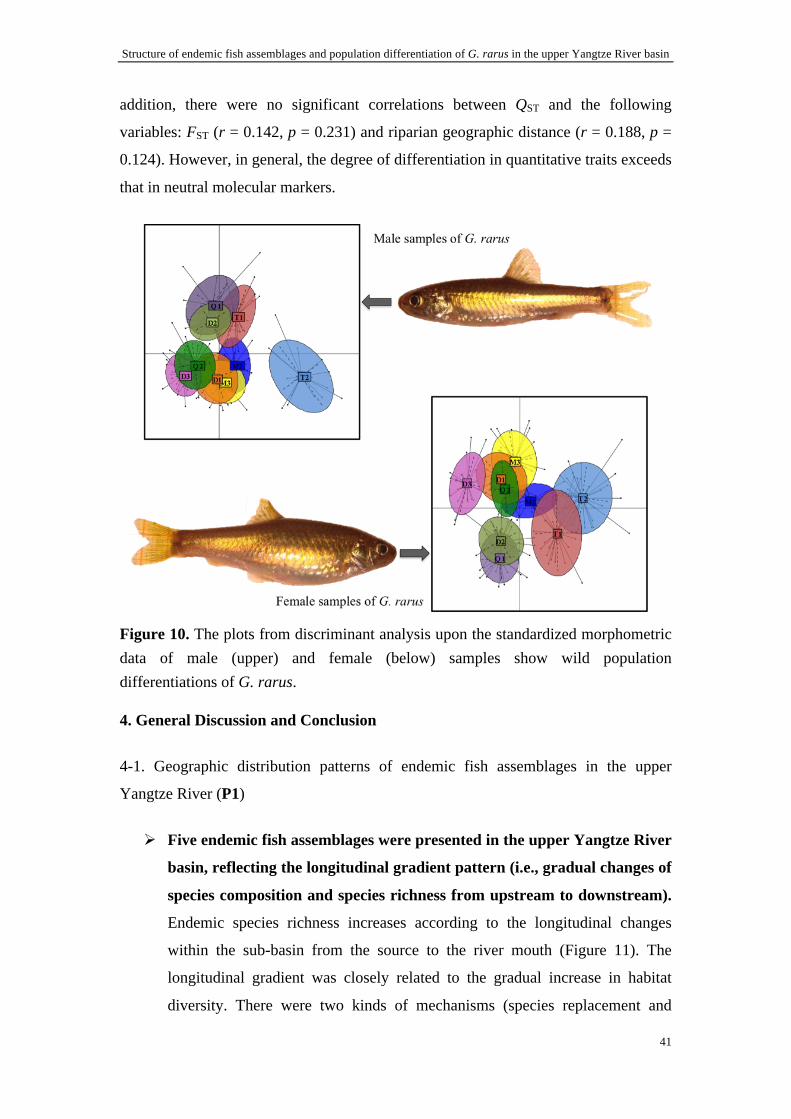
Structure of endemic fish assemblages and population differentiation of G. rarus in the upper Yangtze River basin
41
addition, there were no significant correlations between QST and the following
variables: FST (r = 0.142, p = 0.231) and riparian geographic distance (r = 0.188, p =
0.124). However, in general, the degree of differentiation in quantitative traits exceeds
that in neutral molecular markers.
Figure 10. The plots from discriminant analysis upon the standardized morphometric data of male (upper) and female (below) samples show wild population differentiations of G. rarus.
4. General Discussion and Conclusion
4-1. Geographic distribution patterns of endemic fish assemblages in the upper
Yangtze River (P1)
Five endemic fish assemblages were presented in the upper Yangtze River
basin, reflecting the longitudinal gradient pattern (i.e., gradual changes of
species composition and species richness from upstream to downstream).
Endemic species richness increases according to the longitudinal changes
within the sub-basin from the source to the river mouth (Figure 11). The
longitudinal gradient was closely related to the gradual increase in habitat
diversity. There were two kinds of mechanisms (species replacement and
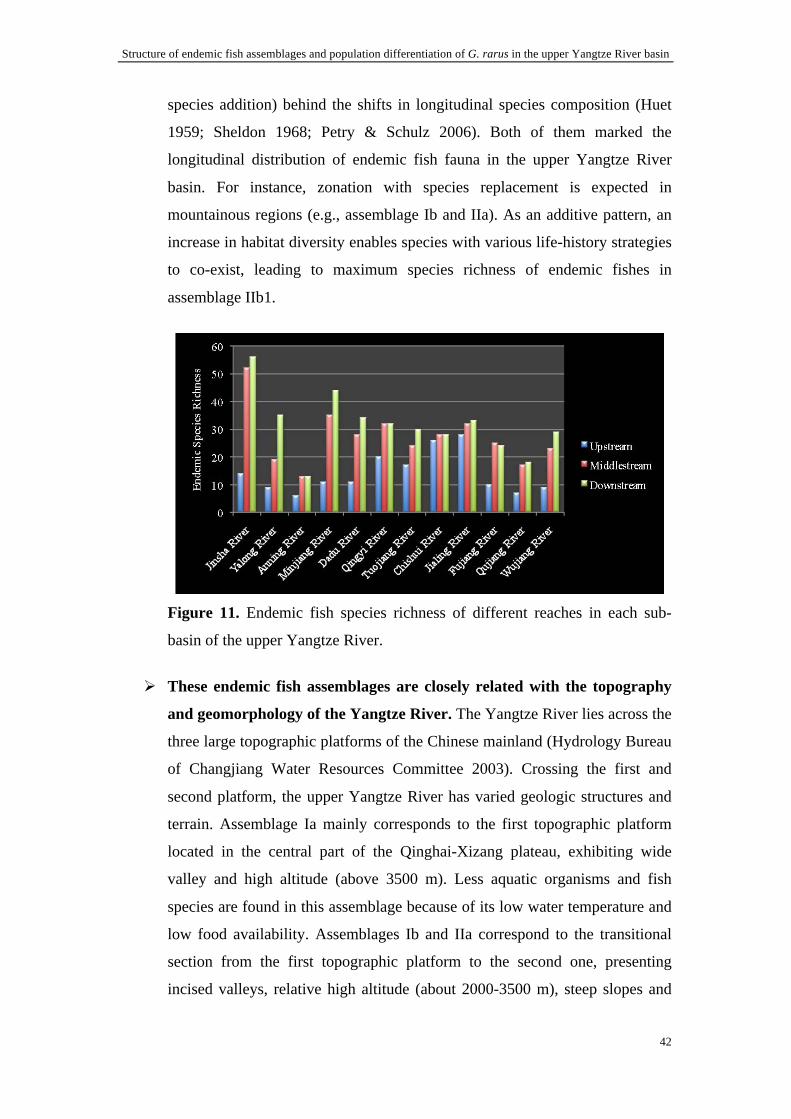
Structure of endemic fish assemblages and population differentiation of G. rarus in the upper Yangtze River basin
42
species addition) behind the shifts in longitudinal species composition (Huet
1959; Sheldon 1968; Petry & Schulz 2006). Both of them marked the
longitudinal distribution of endemic fish fauna in the upper Yangtze River
basin. For instance, zonation with species replacement is expected in
mountainous regions (e.g., assemblage Ib and IIa). As an additive pattern, an
increase in habitat diversity enables species with various life-history strategies
to co-exist, leading to maximum species richness of endemic fishes in
assemblage IIb1.
Figure 11. Endemic fish species richness of different reaches in each sub-
basin of the upper Yangtze River.
These endemic fish assemblages are closely related with the topography
and geomorphology of the Yangtze River. The Yangtze River lies across the
three large topographic platforms of the Chinese mainland (Hydrology Bureau
of Changjiang Water Resources Committee 2003). Crossing the first and
second platform, the upper Yangtze River has varied geologic structures and
terrain. Assemblage Ia mainly corresponds to the first topographic platform
located in the central part of the Qinghai-Xizang plateau, exhibiting wide
valley and high altitude (above 3500 m). Less aquatic organisms and fish
species are found in this assemblage because of its low water temperature and
low food availability. Assemblages Ib and IIa correspond to the transitional
section from the first topographic platform to the second one, presenting
incised valleys, relative high altitude (about 2000-3500 m), steep slopes and
Structure of endemic fish assemblages and population differentiation of G. rarus in the upper Yangtze River basin
43
rapid flows. Fish species in this area are highly adapted to local environments,
and are usually characterized by a strong-swimming body and sticky eggs.
Assemblages IIb1 and IIb2 correspond to the second topographic platform,
characterizing by broad rivers, low altitude, weak slopes, multiple river
regimes (e.g., rapid and slow waters coexisting, shoals and deep pools
coexisting). Many fish species live in this area for the high habitat
heterogeneity.
Each endemic fish assemblage has its specific indicator species. Most
endemic fish species in assemblage Ia are usually the species presenting
stenochoric distribution in their local environments. No indicator species were
identified in this assemblage. Locating in the Qinghai-Xizang and Yunnan-
Guizhou Plateaus, assemblage Ib exhibits the characteristics of Qinghai-
Xizang Plateau Fish Fauna (Wu & Tan 1991). There were three indicator
species (Euchiloglanis kishinouyei, Euchiloglanis davidi and Oreias dabryi
dabryi) in assemblage Ib. These glytosternoid fishes are considered to appear
along with the uplifting of the Qinghai-Xizang Plateau (Wu & Tan 1991;
Chen et al. 1996). The Qinghai-Xizang Plateau and the river-plain fish fauna
coexisted in assemblage IIa, which was dominated by fishes adapted to low
water temperature and rapid flows. There were nine indicator species in
assemblage IIa. Among them, as one of the representatives of the Qinghai-
Xizang Plateau fish fauna, Schizothorax (Schizothorax) prenanti distributes
widely in the rivers with lower altitude. Actually, schizothoracid fishes at
different specialization levels adapt to different levels of altitude. The
indicator species in assemblage IIb1 (27 endemic species) were the most
abundant. Life history and habits of endemic fishes in this assemblage exhibit
high multiplicity and diversity for its complex habitats. Some species (e.g.,
Rhinogobio ventralis, Procypris rabaudi, Coreius guichenoti, Leptobotia
elongate) are dominant in the main channel of the upper Yangtze River, while
some species (e.g., Ancherythroculter nigrocauda, Hemiculterella sauvagei)
prefer its tributaries. Some species (Rhinogobio ventralis, Coreius guichenoti,
Leptobotia elongate) spawn drifting eggs, while some species (Procypris
rabaudi, Hemiculterella sauvagei, Ancherythroculter nigrocauda) lay sticky
eggs. There were no significant indicator species in assemblage IIb2, locating
at the edge of the Yunnan-Guizhou Plateau or east of the Sichuan Basin.
Structure of endemic fish assemblages and population differentiation of G. rarus in the upper Yangtze River basin
44
4-2. Effects of environmental factors on endemic fishes distribution pattern (P2)
The mixed models containing both river characteristics and land-cover
features were more effective than any individual one in explaining
complex endemic fishes distribution patterns in the upper Yangtze River
basin. In general, the relative influence of environmental characteristics on
species distribution, abundance and assemblage composition of aquatic
organisms is highly complex and interrelated (Fitzpatrick et al. 2001). The
structure and processes observed in local fish assemblages are not only
determined by local mechanisms acting within assemblages, but also resulted
from processes operating at larger spatial scales (Ferreira et al. 2007).
Altitude, slope, discharge, runoff and farmland were revealed to be the most
important factors in determining endemic fish assemblages of the upper
Yangtze River basin. Altitude usually influences species occurrence through
water temperature, while slope usually makes a major contribution to the
erosive force acting on the substrate and bed scour in a given area. Variability
in flows (e.g., discharge and runoff) could affect the structure of stream fish
assemblages primarily through its effect on mortality and subsequent
recruitment (Grossman et al. 1998). Land-cover features such as agricultural
land and forest are considered to be the important determinants on the
distribution of fish assemblages through indirect effects (Park et al. 2006;
Gevrey et al. 2009). As agricultural land use increases, inputs of sediments,
nutrients and pesticides also increase, leading to decline in habitat
heterogeneity and water quality, and alteration of flow regimes, and then
impacts on fish community and populations (Jowett et al. 1996; Allan 2004).
Riparian forest was revealed to be associated with a decreased abundance of
benthic fish species, being replaced by sediment-tolerant species (Jones et al.
1999). Moreover, these environmental factors were also important to
determine endemic species richness in the upper Yangtze River basin. The
endemic species richness not only followed the general longitudinal pattern,
but also varied with altitude. Generally the lowest levels of species richness
tend to be found at high altitudes, and the highest levels at intermediate to low
altitudes (Gaston & Blackburn 2000). In addition, species numbers usually
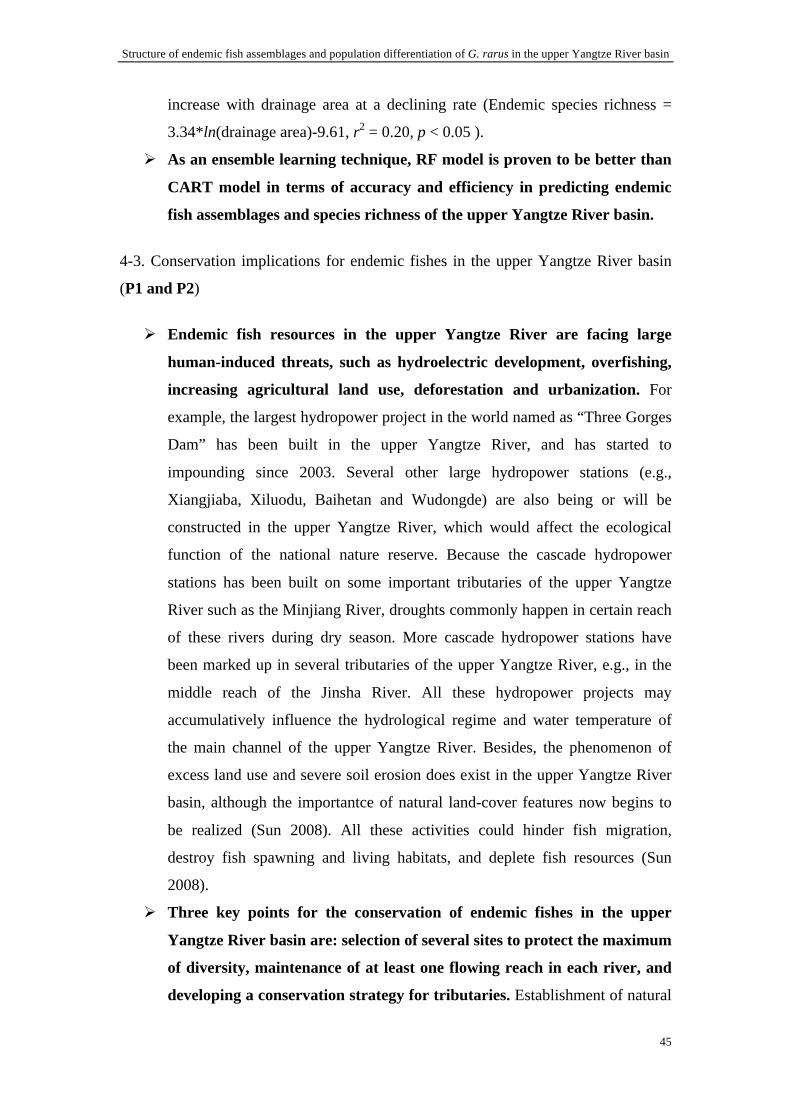
Structure of endemic fish assemblages and population differentiation of G. rarus in the upper Yangtze River basin
45
increase with drainage area at a declining rate (Endemic species richness =
3.34*ln(drainage area)-9.61, r2 = 0.20, p < 0.05 ).
As an ensemble learning technique, RF model is proven to be better than
CART model in terms of accuracy and efficiency in predicting endemic
fish assemblages and species richness of the upper Yangtze River basin.
4-3. Conservation implications for endemic fishes in the upper Yangtze River basin
(P1 and P2)
Endemic fish resources in the upper Yangtze River are facing large
human-induced threats, such as hydroelectric development, overfishing,
increasing agricultural land use, deforestation and urbanization. For
example, the largest hydropower project in the world named as “Three Gorges
Dam” has been built in the upper Yangtze River, and has started to
impounding since 2003. Several other large hydropower stations (e.g.,
Xiangjiaba, Xiluodu, Baihetan and Wudongde) are also being or will be
constructed in the upper Yangtze River, which would affect the ecological
function of the national nature reserve. Because the cascade hydropower
stations has been built on some important tributaries of the upper Yangtze
River such as the Minjiang River, droughts commonly happen in certain reach
of these rivers during dry season. More cascade hydropower stations have
been marked up in several tributaries of the upper Yangtze River, e.g., in the
middle reach of the Jinsha River. All these hydropower projects may
accumulatively influence the hydrological regime and water temperature of
the main channel of the upper Yangtze River. Besides, the phenomenon of
excess land use and severe soil erosion does exist in the upper Yangtze River
basin, although the importantce of natural land-cover features now begins to
be realized (Sun 2008). All these activities could hinder fish migration,
destroy fish spawning and living habitats, and deplete fish resources (Sun
2008).
Three key points for the conservation of endemic fishes in the upper
Yangtze River basin are: selection of several sites to protect the maximum
of diversity, maintenance of at least one flowing reach in each river, and
developing a conservation strategy for tributaries. Establishment of natural
Structure of endemic fish assemblages and population differentiation of G. rarus in the upper Yangtze River basin
46
reserves is one effective approach for preserving endemic fish species (Cao
2000). A national nature reserve for rare and endemic fishes in the upper
Yangtze River Basin has been established since 2000, mainly locating in
assemblage IIb1, but encompassing also a small area (the upstream of the
Chishui River) of assemblage IIa. In 2005, the range of this reserve was
regulated, and now includes 353.16 km of the main channel of the Yangtze
River from Xiangjiaba to Masangxi, 90.1 km section of the downstream of the
Minjiang River, the whole main stream of the Chishui River and branches in
its riverhead, as well as the mouth of several rivers such as the Tuojiang River,
the Yuexi River, the Nanguang River, the Changning River and the Yongning
River (Figure 13). The establishment of that reserve is expected to help
preserve three rare fish species (Psephurus gladius, Acipenser dabryanus and
Myxocyprinus asiaticus) and dozens of endemic fish species inhabiting these
water ecosystems. The Chishui River should be paid special attention: it is a
unique complete river included within that reserve. Strengthening its
protection by monitoring and maintaining its status is urgent. Park et al. (2003)
suggested that three tributaries in the upper Yangtze River (the Chishui,
Tuojiang and Minjiang Rivers) should be considered as potential suitable
reserves for endemic species. However, rather than a single reserve, it is
recommended that a network of conservation units (reserves) be set up to
improve fish diversity in all its manifestations (Bonn & Gaston 2005). In P1,
the Anning River, the upper reach of the Jinsha River and the Dadu River in
assemblage Ib, exhibiting particular endemic fish species composition, were
also suggested to be considered as potential natural reserves (Figure 13). The
Anning River, a small tributary of the Yalong River, is an important habitat
for four local endemic fish species (Yunnanilus sichuanensis, Triplophysa
(Triplophysa) xichangensis, Triplophysa (Triplophysa) daqiaoensis,
Triplophysa (Triplophysa) brevibarba) that are only found in this river. In the
middle reach of the Jinsha River being a hotspot for assemblage IIa, it is thus
necessary to keep certain reaches away from hydroelectric cascade
development (Figure 12).
Structure of endemic fish assemblages and population differentiation of G. rarus in the upper Yangtze River basin
47
Figure 12. Maps showing the existed national nature reserve and other
potential reserves for endemic fishes in the upper Yangtze River.
4-4. Population differentiation of G. rarus (P3, P4 and P5)
Rare minnow, Gobiocypris rarus Ye et Fu, is an endemic cyprinid fish in China
(Chen 1998; Ye & Fu 1983). It is considered as an “endangered” species because of
its narrow distribution and fluctuant habitats. It is now facing large threats mainly
from anthropogenic disturbance, such as pollution from pesticides and sewage,
channelized habitat, disordered water diversion, as well as hydropower project (Le &
Chen 1998; Li et al. 2004; Wang et al. 1998; Wang & Xie 2004; Xiong et al. 2009).
It is only distributed in the western part of China. It lives mainly in small water
systems, such as paddyfields, ditches and loblollies, especially in weedy ditches with
flowing water. Remnant populations were only found in the west region of Sichuan
Province (Chen 1998; Ding 1994; Le & Chen 1998; Wang & Cao 1997). The type
locality, where the topotype population inhabits, is located in Hanyuan County of
Sichuan Province. Additionally, other remnant populations were discovered during a
field investigation conducted by the author in April 2008. All known habitats of rare
minnow are located dozens to hundreds of miles away from one another, exhibiting
discontinuous distribution.
Structure of endemic fish assemblages and population differentiation of G. rarus in the upper Yangtze River basin
48
(1) Temporal genetic variation of the topotype population of G. rarus (P3)
P3 suggested that the type locality of G. rarus held a single stable and
healthy population with a relatively large Ne and no cryptic structure.
During the sampling period (1997-2006), temporal genetic variation was
limited. The main fluctuations were not due to bottlenecks, but may result
from inbreeding to some extent. However, inbreeding did not induce dramatic
depression effects on the topotype population for its observed rate of loss of
heterozygosity per generation (0.48%) is considerably lower than 1% (the
limit for an acceptable level of inbreeding per generation; Franklin 1980;
Frankel & Soulé 1981).
The forces maintaining genetic variation of the topotype population of G.
rarus were mainly from environmental fluctuations and life history traits.
Many studies revealed that both extrinsic factors (i.e., environmental factors)
and intrinsic factors (i.e., biological factors) could mold genetic patterns
(Mitton & Lewis 1989; Scribner et al. 1992; Østergaard et al. 2003; Barcia et
al. 2005; Cena et al. 2006; Lee & Boulding 2007; Rahman et al. 2008). The
habitats of G. rarus are easily influenced by seasonal environmental changes
(drought, floods, rainstorms) and human activities. Besides, G. rarus has the
characteristics such as high fecundity, continuous batch spawning and short
life cycle. In such a case, some batches of offspring of G. rarus may be
endangered when sudden environmental changes occur, yet other batches may
survive and induce effective reproduction. Surviving individuals from
different habitat patches mix together and relocate in the patches where the
habitat change occurred, resulting in greater gene flow within the population.
Thus, habitat fluctuation, relocation of survivors and rapid multiplication may
be the main forces to maintain the relatively genetic stability of G. rarus.
Considering that the topotype population is facing increased habitat loss
and disturbance from human activies, P3 suggests that a habitat and
species management area should be established in its type locality. This
habitat and species management area consists of the floodplain along the
Liusha River from Qianyu village (29°30'8.1" N, 102°35'17.0" E, altitude 996
m) to Fuchun village (29°28'37.3" N, 102°37'35.4" E, altitude 939 m). In this
reserve area, all the habitat-threatening activities such as factory construction,

Structure of endemic fish assemblages and population differentiation of G. rarus in the upper Yangtze River basin
49
intensive land use, fertilizer and pesticide applications should be substantially
reduced, and the dynamics and genetic variation of the topotype population
should be monitored.
(2) Genetic and morphogical differences among nine wild populations of G. rarus (P4
and P5)
The genetic differentiation among wild populations of G. rarus are at low
to moderate level. This genetic differentiation was mainly due to different
allelic frequency distribution patterns of populations. For instance, some of
them were mainly composed of the middle-sized alleles such as population
Q1, but some had extensive allele distribution such as population T2. In
addition, P4 revealed the genetic clustering structure (C1 and C2) of wild
populations of G. rarus. This clustering structure reflects out the water
system structure (e.g., four river basins and two alluvial plains) to some
extent, but it was not exactly clustered just like the water system structure. It
could be explained from the history of the river evolution that usually act as an
important force in explaining the biogeography or distribution of many
freshwater fish species. Several studies have shown that the Qingyi River was
flowing northwards into the Minjiang River at Xinjin County (where Qionghai
River (M3) joined) during the Middle Pleistocene Epoch, and then diverted
southeastwards through Jiajiang County (Q2) into the Dadu River during the
Late Pleistocene Epoch (Li et al. 2006; Li & Guo 2008; Yuan & Tao 2008). It
is conceivable that population Q2 did not belong to the Qingyi River basin
until about 2.5 to 1 million years ago, and that population M3 might belong to
the Qingyi River basin around two million years ago.
G. rarus might migrate through some man-made channels of hydropower
projects rather than through the mouth of the Minjiang and Tuojiang
Rivers. At present, the remnant populations of G. rarus are in discontinuous
distribution. Author revealed that an isolation-by-riparian-distance pattern
might play a role in genetic structure of G. rarus populations. The riparian
distance was calculated along the closest connected water system through the
man-made channels (e.g., Renmin Channel, Puyang River, Qingbai River)
between the Minjiang and Tuojiang Rivers. These man-made channels were

Structure of endemic fish assemblages and population differentiation of G. rarus in the upper Yangtze River basin
50
from the numerous water diversion projects built in the Minjiang River, such
as Dujiangyan Irrigation Project. Besides, up to now, no G. rarus individuals
have been sampled either in the mouth of the Minjiang River at Yibin City or
in the mouth of the Tuojiang River at Luzhou City, where investigations on
fish catches have been usually carried out intensively.
The phenomenon of sexual dimorphism indeed exists in morphometric
traits of wild populations of G. rarus. It could be presented as: females
usually have a larger and fatter body than males; the relative length of their
pectoral fin and ventral fin are usually larger than males; most of
morphometric traits (64%) show significant sexual differences. We also found
that the measurements relating with landmark 3 (viz. the origin of ventral fin)
in the truss network of G. rarus were the most important discriminant features
for sexes (Figure 14). In a word, the thickness and width of the body shape of
G. rarus were mainly responsible for its sexual dimorphism. Information
about sexual dimorphism is essential for understanding the ecology, behavior
and life history of a species, as well as for making morphological comparisons
between populations (Kitano et al. 2007). Many fish species such as walleye
(Stizostedion vitreum vitreum) and threespine stickleback (Gasterosteus
aculeatus) have the phenomenon of sexual dimorphism (Henderson et al.
2003; Kitano et al. 2007).
All the studied populations are significantly differentiated from one
another over all the morphometric traits. Among them, fifteen traits
(namely BD, HL, PH, D4_6, D4_5, D8_7, D6_7, D7_10, D4_3, D2_3, D6_5,
D3_6, D6_8, D5_8 and D10_9) were the most important contribution
variables to discriminate the populations. The truss measurements relating
with landmark 6 (viz. the origin of dorsal fin) and 7 (viz. the posterior end of
anal fin base) played important roles in discriminating the populations (Figure
13). These measurements are closely correlated with traditional traits of body
shape in G. rarus such as the position of dorsal fin, body depth, peduncle
height, and the position of anal fin. Therefore, the morphological
differentiation among populations of G. rarus is mainly reflected by the
change of head morphology and vertical body shape. However, this
quantitative divergence (QST) is not significantly correlated with riparian
geographic distance and genetic differentiation (FST) by Mantel test. Some QST
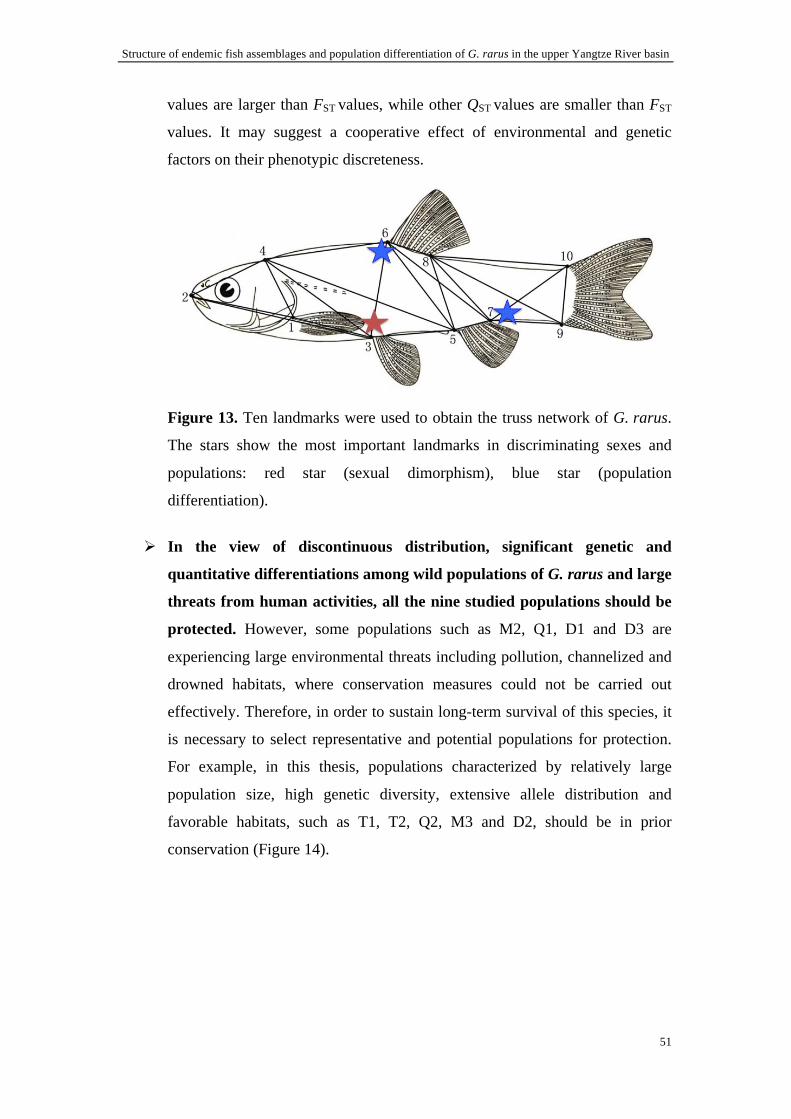
Structure of endemic fish assemblages and population differentiation of G. rarus in the upper Yangtze River basin
51
values are larger than FST values, while other QST values are smaller than FST
values. It may suggest a cooperative effect of environmental and genetic
factors on their phenotypic discreteness.
Figure 13. Ten landmarks were used to obtain the truss network of G. rarus.
The stars show the most important landmarks in discriminating sexes and
populations: red star (sexual dimorphism), blue star (population
differentiation).
In the view of discontinuous distribution, significant genetic and
quantitative differentiations among wild populations of G. rarus and large
threats from human activities, all the nine studied populations should be
protected. However, some populations such as M2, Q1, D1 and D3 are
experiencing large environmental threats including pollution, channelized and
drowned habitats, where conservation measures could not be carried out
effectively. Therefore, in order to sustain long-term survival of this species, it
is necessary to select representative and potential populations for protection.
For example, in this thesis, populations characterized by relatively large
population size, high genetic diversity, extensive allele distribution and
favorable habitats, such as T1, T2, Q2, M3 and D2, should be in prior
conservation (Figure 14).
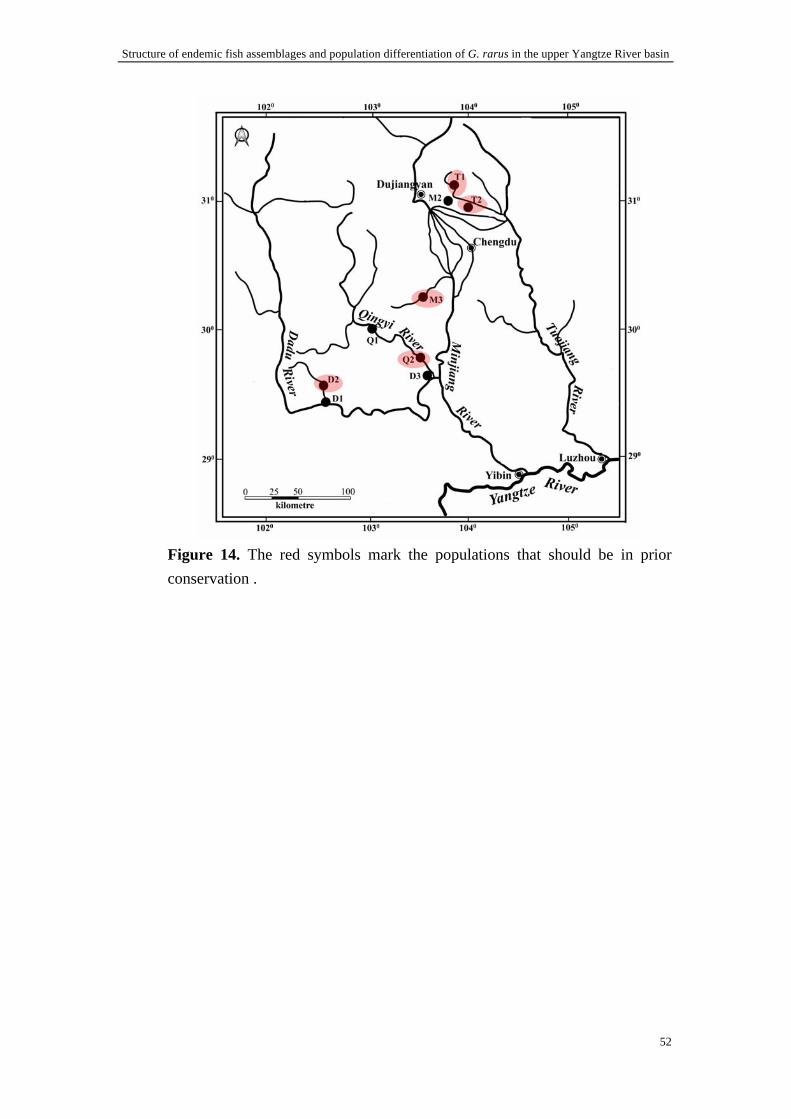
Structure of endemic fish assemblages and population differentiation of G. rarus in the upper Yangtze River basin
52
Figure 14. The red symbols mark the populations that should be in prior conservation .
Structure of endemic fish assemblages and population differentiation of G. rarus in the upper Yangtze River basin
53
References
Aarts BGW, Nienhuis PH (2003) Fish zonations and guilds as the basis for assessment of ecological integrity of large rivers. Hydrobiologia 500: 157-178.
Abell R, Thieme ML, Revenga C, Bryer M, Kottelat M, Bogutskaya N, Coad B, Mandrak N, Balderas SC, Bussing W, et al. (2008) Freshwater ecoregions of the world: a new map of biogeographic units for freshwater biodiversity conservation. BioScience 58: 403-414.
Agricultural Regionalization Committee of Sichuan Province, Editorial Board of “Protection and Utilization of Fish Resources in Sichuan Rivers” (1991) Protection and Utilization of Fish Resources in Sichuan Rivers. Sichuan Science and Technology Press: Chengdu, China. (in Chinese)
Allan JD (2004) Landscapes and riverscapes: the influence of land use on stream ecosystems. Ann Rev Ecol Evol Syst 35: 257-284.
Allan JD, Flecker AS (1993) Biodiversity conservation in running waters. BioScience 43: 32-43.
Bain MB, Finn JT, Booke HE (1988) Streamflow regulation and fish community structure. Ecology 69: 382-392.
Barcia AR, López GE, Hernández D, García-Machado E (2005) Temporal variation of the population structure and genetic diversity of Farfantepenaeus notialis assessed by allozyme loci. Mol Ecol 14: 2933-2942.
Beals EW (1984) Bray-Curtis ordination: an effective strategy for analysis of multivariate ecological data. Adv Ecol Res 14: 1-55
Bonn A, Gaston KJ (2005) Capturing biodiversity: selecting priority areas for conservation using different criteria. Biodivers Conserv 14: 1083-1100.
Breiman L (2001) Random forests. Mach Learn 45: 5-32.
Breiman L, Friedman JH, Olshen RA, Stone CJ (1984) Classification and Regression Trees. Chapman and Hall: New York.
Cao W (1992) Freshwater fish resources of China. In: Liu J and He B (ed.), Cultivation of the Chinese Freshwater Fishes. Science Press: Beijing, China, pp. 30-63. (in Chinese)
Cao WX (2000) The natural reserve construction of endemic fishes in the upper Yangtze River and its related problems. Resour Environ Yangtze Basin 9: 131-132. (in Chinese)

Structure of endemic fish assemblages and population differentiation of G. rarus in the upper Yangtze River basin
54
Cao WX (2008) Concerning with some questions about the conservation of fish resources in the Yangtze River basin. Resour Environ Yangtze Basin 17: 163-164. (in Chinese)
Cao WX (2009) If the Yangtze River can have a rest: discussion about protection of fishes in the Yangtze River. China Three Gorges 148-156 (in Chinese)
Cena CJ, Morgan GE, Malette MD, Heath DD (2006) Inbreeding, outbreeding and environmental effects on genetic diversity in 46 walleye (Sander vitreus) populations. Mol Ecol 15: 303-320.
Céréghino R, Giraudel JL, Compin A (2001) Spatial analysis of stream invertebrates distribution in the Adour-Garonne drainage basin (France), using Kohonen self organizing maps. Ecol Model 146: 167-180.
Chapin FS III, Zavaleta ES, Eviner VT, Naylor RL, Vitousek PM, Reynolds HL, Hooper DU, Lavorel S, Sala OE, Hobbie SE, Mack MC, Diaz S (2000) Consequences of changing biodiversity. Nature 405: 234-242.
Chen DQ (2003) States of fishery resources and their protective measures on reproduction in the Yangtze River. China Fisher 3: 17-19. (in Chinese)
Chen DQ, Duan XB, Liu SP, Shi WG, Wang B (2002) On the dynamics of fishery resources of the Yangtze River and its management. Acta Hydrobiol Sin 26: 687-690. (in Chinese)
Chen YF, Chen YY, He DK (2002) Biodiversity in the Yangtze River— Fauna and distribution of Fishes. J Ichthyol 42: 161-171.
Chen YY (1998a) The Fishes of the Hengduan Mountains Region. Science Press: Beijing. (in Chinese)
Chen YY (1998b) Fauna Sinica (Osteichthyes): Cypriniformes, II. Science Press: Beijing. (in Chinese)
Chen YY, Chen YF, Liu HZ (1996) Studies on the position of the Qinghai-Xizang Plateau region in zoogeographic divisions and its eastern demarcation line. Acta Hydrobiol Sin 20: 97-103. (in Chinese)
Chistiakov DA, Hellemans B, Volckaert FAM (2006) Microsatellites and their genomic distribution, evolution, function and applications: A review with special reference to fish genetics. Aquaculture 255: 1-29.
Chu XL, Chen YR (1989) The Fishes of Yunnan, China: Part I Cyprinidae. Science Press: Beijing, China. (in Chinese)
Chu XL, Chen YR (1990) The Fishes of Yunnan, China: Part II Cyprinidae. Science Press: Beijing, China. (in Chinese)
Structure of endemic fish assemblages and population differentiation of G. rarus in the upper Yangtze River basin
55
Chu XL, Zheng BS, Dai DY (1999) Fauna Sinica (Osteichthyes): Siluriformes. Science Press: Beijing. (in Chinese)
Cutler DR, Edwards TC, Beard KH, Cutler A, Hess KT (2007) Random forests for classification in ecology. Ecology 88: 2783-2792.
Davies DL, Bouldin DW (1979) A cluster separation measure. IEEE Trans Pattern Anal Mach Intell 1: 224-227.
De'ath G, Fabricius KE (2000) Classification and regression trees: A powerful yet simple technique for ecological data analysis. Ecology 81: 3178-3192.
Deng QX (1985) An ichthyological survey in the Yalong River. J Nanchong Teachers College 1: 33-37. (in Chinese)
Department of Ichthyology, Institute of Hydrobiology of Hubei Province (1976) Fishes of the Yangtze River. Science Press: Beijing. (in Chinese)
Ding RH (1994) The Fishes of Sichuan, China. Sichuan Science and Technology Press: Chengdu. (in Chinese)
Ding RH (2006) Notes on fishes from upper Minjiang River and their protection. Sichuan J Zool 25: 819-822. (in Chinese)
Dirienzo AA, Peterson JC, Carza AM, Valdes M, Slatkin M, Freimer NB (1994) Mutational processes of simple-sequence repeat loci in human populations. Proc Natl Acad Sci USA 91: 3166-3170.
Dong ZR (2003) Diversity of river morphology and diversity of biocommunities. J Hydraul Eng 11: 1-6.
Dudgeon D (2010) Requiem for a river: extinctions, climate change and the last of the Yangtze. Aquatic Conserv: Mar Freshw Ecosyst 20: 127-131.
Dudgeon D, Arthington AH, Gessner MO, Kawabata Z, Knowler DJ, Lévêque C, Naiman RJ, Prieur-Richard A, Soto D, Stiassny MLJ, Sullivan CA (2006) Freshwater biodiversity: importance, threats, status and conservation challenges. Biol Rev 81: 163-182.
Elith J, Leathwick JR, Hastie T (2008) A working guide to boosted regression trees. J Anim Ecol 77: 802-813.
Estoup A, Cornuet JM (1999) Microsatellite evolution: inferences from population data. In Microsatellites: Evolution and Applications, edited by DB GOLDSTEIN and C SCHLÖTTERER. Oxford University Press: Oxford. pp. 50-65.
Fang T, Ao HY, Liu JT, Cai QH, Liu YD (2004) The spatio-temporal of water environmental status in Dianchi Lake. Acta Hydrobiol Sin 28: 124-130. (in Chinese)

Structure of endemic fish assemblages and population differentiation of G. rarus in the upper Yangtze River basin
56
Ferreira MT, Sousa L, Santos JM, Reino L, Oliveira J, Almeida PR, Cortes RV (2007) Regional and local environmental correlates of native Iberian fish fauna. Ecol Freshw Fish 16: 504-514.
Fitzpatrick FA, Scudder BC, Lenz BN, Sullivan DJ (2001) Effects of multi-scale environmental characteristics on agricultural stream biota in eastern Wisconsin. J Am Water Resour As 37: 1489-1507.
Frankel OH, Soulé M (1981) Conservation and evolution. Cambridge University Press: Cambridge, England.
Frankham R, Ballou JD, Briscoe DA (2002) Introduction to Conservation Genetics. Cambridge University Press: New York.
Franklin IA (1980) Evolutionary change in small populations. In: Soulé ME, Wilcox BA (eds) Conservation biology: an evolutionary-ecological perspective. Sinauer Associates, Sunderland, MA, pp. 135-150.
Fu CZ, Wu JH, Chen JK, Wu QH, Lei GC (2003) Freshwater fish biodiversity in the Yangtze River basin of China: patterns, threats and conservation. Biodivers Conserv 12: 1649-1685.
Galat DL, Zweimüller I (2001) Conserving large-river fishes: is the highway analogy an appropriate paradigm? J N Am Benthol Soc 20: 266-279.
Galloway JN, Dentener FJ, Capone DG, Boyer EW, Howarth RW, Seitzinger SP, Asner GP, Cleveland CC, Green PA, Holland EA, Karl DM, Michaels AF, Porter JH, Townsend AR, Vörösmarty CJ (2004) Nitrogen cycles: past, present, and future. Biogeochemistry 70: 153-226.
Gao YL, Lian Y, Zhu TQ (2004) Think about the protection of fish resources in the Yellow River. Yellow River 26: 12-14.
Gaston KJ, Blackburn TM (2000) Pattern and process in macroecology. Blackwell Pub.
Gevrey M, Sans-Piche F, Grenouillet G, Tudesque L, Lek S (2009) Modeling the impact of landscape types on the distribution of stream fish species. Can J Fish Aquat Sci 66: 484-495.
Giraudel JL, Lek S (2001) A comparison of self-organizing map algorithm and some con- ventional statistical methods for ecological community ordination. Ecol Model 146: 329-339
Gleick PH (1996) Water resources. In Encyclopedia of Climate and Weather (ed. S. H. Schneider), Oxford University Press: New York, USA. pp. 817-823.
Glowka L, Burhenne-Guilmin F, Synge H, McNeely JA, Gündling L (1994) A guide to the convention on biological diversity. International Union for the Conservation of Nature (IUCN), Gland, Switzerland.

Structure of endemic fish assemblages and population differentiation of G. rarus in the upper Yangtze River basin
57
Goldstein D, Roemer G, Smith D, Reich D, Bergman A, Wayne R (1999) The use of microsatellite variation to infer population structure and demographic history in a natural model system. Genetics 151: 797-801.
Goldstein DB, Pollock DD (1997) Launching microsatellites: a review of mutation processes and methods of phylogenetic inference. J Hered 88: 335-342.
Groombridge B, Jenkins M (2000) Global Biodiversity. Earth’s Living Resources in the 21st Century. World Conservation Monitoring Centre, Cambridge, U.K.
Grossman GD, Ratajczak JRE, Crawford M, Freeman MC (1998) Assemblage organization in stream fishes: effects of environmental variation and interspecific interactions. Ecol Monogr 68: 395-420.
Guisan A, Theurillat J-P (2000) Equilibrium modeling of alpine plant distribution and climate change: how far can we go? Phytocoenologia, special issue 30: 353-384.
Guisan A, Zimmermann NE (2000) Predictive habitat distribution models in ecology.
Ecol Model 135: 147-186.
Gum B, Gross R, Kuehn R (2005) Mitochondrial and nuclear DNA phylogeography of European grayling (Thymallus thymallus): evidence for secondary contact zones in central Europe. Mol Ecol 14: 1707-1725.
Guo W, Wang ZY, Wang YL, Zhang ZP, Gui JF (2005) Isolation and characterization of six microsatellite markers in the large yellow croaker (Pseudosciaena crocea Richardson). Mol Ecol Notes 5: 369-371.
Guo YA (2005) Research on the changing tendency of water resources in Yunnan Dianchi. Yunnan Geogr Environ Res 17: 28-32,61. (in Chinese)
Harrison IJ, Stiassny MLJ (1999) The quiet crisis. A preliminary listing of the freshwater fishes of the world that are extinct or ‘ missing in action ’. In Extinctions in Near Time (ed. R. D. E. MacPhee), Kluwer Academic/ Plenum Publishers: New York, U.S.A. pp. 271-331.
Hastie T, Tibshirani R (1986) Generalized additive models. Stat Sci 297-310.
Hawksworth DJ, Kalin-Arroyo MT (1995) Magnitude and distribution of biodiversity. In Global biodiversity Assessment (ed. VH Heywood), Cambridge University Press: Cambridge, U.K. pp. 107-191.
Heath DD, Pollard S, Herbinger C (2001) Genetic structure and relationships among steelhead trout (Oncorhynchus mykiss) populations in British Columbia. Heredity 86: 618-627.
Henderson BA, Collins N, Morgan GE, Vaillancourt A (2003) Sexual size dimorphism of walleye (Stizostedion vitreum vitreum). Can J Fish Aquat Sci 60: 1345-1352.
Structure of endemic fish assemblages and population differentiation of G. rarus in the upper Yangtze River basin
58
Hill MO, Gauch HG (1980) Detrended correspondence analysis, an improved ordination technique. Vegetation 42: 47-58
Huang ZL (2003) On the development and conservation for the resources and ecology of Chishui River basin. Resour Environ Yangtze Basin 12: 332-339. (in Chinese)
Huet M (1959) Profiles and biology of Western European streams as related to fish management. Trans Am Fish Soc 88: 155-163.
Hui Y, Zhang XH, Chen ZJ (2000) Present situation and strategy about the natural environment of the Xiangxi River basin. Resour Environ Yangtze Basin 9: 27-33. (in Chinese)
Hydrology Bureau of Changjiang Water Resources Committee (2003) Water System. In Compilation Committee of the Yangtze River Chronicles, eds, The Yangtze River Chronicles. Volume 1: Review of Rivers. The Encyclopedia of China Press: Beijing. (in Chinese)
Inami M, Hatanaka A, Mitsuboshi T, Yamada S, Tataushi A, Fukuda H, Sakamoto T (2005) A microsatellite linkage map of red sea bream (Pagrus major) and mapping of QTL markers associated with resistance to red sea bream iridovirus (RSIV). Plant & Animal Genomes XIII Conference. The abstract is available on http://www.intl- pag.org/13/abstracts/PAG13_P607.html.
Institute of Zoology of Shanxi Province, Institute of Hydrobiology in Chinese Academy of Science, Biological Department of Lanzhou University (1987) The Fishes of Qinling. Science Press: Beijing, China. (in Chinese)
IUCN (International Union for Conservation of Nature and Natural Resources) (1996) 1996 IUCN Red List of Threatened Animals. IUCN, Gland, Switzerland.
IUCN (International Union for Conservation of Nature and Natural Resources) (2007) 2007 IUCN Red List of threatened species. International Union for Conservation of Nature and Natural Resources, Cambridge, UK. (Available from: www. iucnredlist.org)
Jackson RB, Carpenter SR, Dahm CN, Mcknight DM, Naiman RJ, Postel SL & Running SW (2001) Water in a changing world. Ecol Appl 11: 1027-1045.
Jain AK, Dubes RC (1988) Algorithms for clustering data. Prentice Hall, Englewood Cliffs, New Jersey.
Jarne P, Lagoda PJL (1996) Microsatellites, from molecules to populations and back. Trends Ecol Evol 11: 424-429.
Jia J, Yuan Y, Ma Z (2005) World and China register of dams in 2005. International Commission on Large Dams.
Structure of endemic fish assemblages and population differentiation of G. rarus in the upper Yangtze River basin
59
Jones EBD, Helfman GS, Harper JO, Bolstad PV (1999) Effects of riparian forest removal on fish assemblages in southern Appalachian streams. Conserv Biol 13: 1454-1465.
Jongman RHG, ter Braak CJF, van Tongeren OFR (eds) (1995) Data analysis in community and landscape ecology. Cambridge University Press: Cambridge.
Jowett IG, Richardson J, McDowall RM (1996) Relative effects of in-stream habitat and land use on fish distribution and abundance in tributaries of the Grey River, New Zealand. N Z J Mar Freshw Res 30: 463-475.
Kangur K, Park Y-S, Kangur A, Kangur P, Lek S (2007) Patterning long-term changes of fish community in large shallow Lake Peipsi. Ecol Model 23:34-44.
Kitano J, Mori S, Peichel CL (2007) Sexual dimorphism in the external morphology of the threespine stickleback (Gasterosteus aculeatus). Copeia 2: 336-349.
Kiviluoto K (1996) Topology preservation in self-organizing maps. In: Pro. ICNN’96, IEE Int Conf on Neural Networks. IEEE Service Center, Piscataway pp. 294-299
Kohonen T (1982) Self-organized formation of topologically correct feature maps. Biol Cybern 43: 59-69.
Kohonen T (2001) Self-organizing maps. Springer: Berlin.
Kruk A, Lek S, Park Y-S, Penczak T (2007) Fish assemblages in the large lowland Narew River system (Poland): application of the self-organizing map algorithm. Ecol Model 203: 45-61.
Le PQ (2000) Fauna Sinica (Osteichthyes): Cypriniformes, III. Science Press: Beijing. (in Chinese)
Le PQ, Chen YY (1998) China red data book of endangered animals: Pisces. Science Press: Beijing. pp. 170-172. (in Chinese)
Lee HJ, Boulding EG (2007) Mitochondrial DNA variation in space and time in the northeastern Pacific gastropod, Littorina keenae. Mol Ecol 16: 3084-3103.
Lek S, Guégan JF (1999) Artificial neural networks as a tool in ecological modelling, an introduction. Ecol Model 120: 65-73
Lek S, Scardi M, Verdonschot PFM, Descy JP, Park YS (2005) Modelling community structure in freshwater ecosystems. Springer Verlag.
Lewontin RC, Hubby JL (1966) A molecular approach to the study of genic heterozygosity in natural populations. II. Amount of variation and degree of heterozygosity in natural populations of Drosophila pseudoobscura. Genetics 54: 595-609.
Structure of endemic fish assemblages and population differentiation of G. rarus in the upper Yangtze River basin
60
Li L, Ma TW, Wu ZB (2004) Toxic effect of domestic sewage on rare minnow (Gobiocypris rarus). Acta Hydrobiol Sin 28: 40-44. (in Chinese)
Li Y, Li B, Steffen D, Densmore AL, Richardson NJ, Zhou RJ, Ellis MA, Zhang Y (2006) Provenance analysis and drainage evolution in Late Cenozoic Chengdu Basin on eastern margin of Tibetan Plateau. Acta Sedimentol Sin 24: 309-320. (in Chinese)
Li YZ, Guo B (2008) Cenozonic tectonics of Chengdu Plain, Sichuan, China. J Chengdu Univ Technol (Science & Technology Edition) 35: 371-376. (in Chinese)
Liao XL, Wang D, Yu XM, Li WT, Cheng L, Wang JW, Tong JG (2007) Characterization of novel microsatellite loci in rare minnow (Gobiocypris rarus) and amplification in closely related species in Gobioninae. Conserv Genet 8: 1003-1007
Liao XL, Zhu B, Yu XM, Tan DQ, Chang JB, Tong JG (2006) Isolation and characterization of polymorphic microsatellites in a Yangtze River fish, brass gudgeon (Coreius heterodon Bleeker). Mol Ecol Notes 6: 393-395.
Liaw A, Wiener M (2002) Classification and regression by randomForest. Resampling Methods in R: The boot Package 18-22.
Liu RM, Shen ZY (2006) Integrated assessment and changes of ecological environment in Daning River watershed. J Beijing Normal Univ (Natural Science) 42: 200-203. (in Chinese)
Liu ZJ, Cordes JF (2004) DNA marker technologies and their applications in aquaculture genetics. Aquaculture 238: 1-37.
Luo Q, Liu Q (2003) The existing situation of environmental pollution in Qionghai and its counter-measures. J Chongqing Normal Univ (Natural Science Edition) 20: 52-55. (in Chinese)
Malmqvist B, Rundle S (2002) Threats to the running water ecosystems of the world. Environ Conserv 29: 134-153.
Margules CR, Austin MP (1994) Biological models for monitoring species decline: the construction and use of data bases. Philos Trans R Soc Lond B Biol Sci 344: 69-75.
Matthews WJ (1998) Patterns in freshwater fish ecology. Chapman and Hall: New York.
Mitton JB, Lewis WM Jr (1989) Relationships between genetic variability and life-history features of bony fishes. Evolution 43: 1712-1723.
Mourell C, Ezcurra E (1996) Species richness of Argentine cacti: a test of biogeographic hypotheses. J Veg Sci 7: 667-680.
Myers N, Mittermeier RA, Mittermeier CG, da Fonseca GAB, Kent J (2000) Biodiversity hotspots for conservation priorities. Nature 403: 853-858.
Structure of endemic fish assemblages and population differentiation of G. rarus in the upper Yangtze River basin
61
Naiman RJ, Magnuson JJ, Mcknight DM, Stanford JA (1995) The Freshwater Imperative: A Research Agenda. Island Press: Washington DC, U.S.A.
Naiman RJ, Turner MG (2000) A future perspective on North America’s freshwater ecosystems. Ecol Appl 10: 958-970.
Nelson JS (1994) Fishes of the world. Wiley: New York.
Nelson JS (2006) Fishes of the World: Fourth Edition. John Wiley & Sons, Inc., Hoboken, New Jersey.
Østergaard S, Hansen MM, Loeschcke V, Nielsen EE (2003) Long-term temporal changes of genetic composition in brown trout (Salmo trutta L.) populations inhabiting an unstable environment. Mol Ecol 12: 3123-3135.
Park Y-S, Chang JB, Lek S, Cao WX, Brosse S (2003) Conservation strategies for endemic fish species threatened by the three Gorges Dam. Conserv Biol 17: 1748-1758.
Park Y-S, Grenouillet G, Esperance B, Lek S (2006) Stream fish assemblages and basin land cover in a river network. Sci Total Environ 365: 140-153.
Park Y-S, Kwak IS, Chon TS, Kim JK, Jørgensen SE (2001) Implementation of artificial neural networks in patterning and prediction of exergy in response to temporal dynamics of benthic macroinvertebrate communities in streams. Ecol Model 146: 143-157.
Perdiguero-Alonso D, Montero FE, Kostadinova A, Raga JA, Barrett J (2008) Random forests, a novel approach for discrimination of fish populations using parasites as biological tags. Int J Parasit 38: 1425-1434.
Peters J, De Baets B, Verhoest NEC, Samson R, Degroeve S, De Becker P, Huybrechts W (2007) Random forests as a tool for ecohydrological distribution modelling. Ecol Model 207: 304-318.
Petry AC, Schulz UH (2006) Longitudinal changes and indicator species of the fish fauna in the subtropical Sinos River, Brazil. J Fish Biol 69: 272-290.
Poff NL, Brinson MM, Day JW JR (2002) Aquatic ecosystems and global climate change. Technical Report, Pew Center on Global Climate Change, Arlington, USA.
Postel S, Richter B (2003) Rivers for Life: Managing Water for People and Nature. Island Press: Washington DC, U.S.A.
Powel W, Machray GC, Provan J (1996) Polymorphism revealed by simple sequence repeats. Trends Plant Sci 1: 215-222.
Prasad AM, Iverson LR, Liaw A (2006) Newer classification and regression tree techniques: Bagging and random forests for ecological prediction. Ecosystems 9: 181-199.
Structure of endemic fish assemblages and population differentiation of G. rarus in the upper Yangtze River basin
62
Rahel FJ (2002) Homogenization of freshwater faunas. Ann Rev Ecol Syst 33: 291-315.
Rahman S, Zakaria-Ismail M, Tang PY, Muniandy S (2008) Microsatellite analysis of wild and captive populations of Asian arowana (Scleropages formosus) in Peninsular Malaysia. J Biol Sci 8: 517-525.
Razi MA, Athappilly K (2005) A comparative predictive analysis of neural networks (NNs), nonlinear regression and classification and regression tree (CART) models. Expert Syst Appl 29: 65-74.
Redeke HC (1941) Fauna van Nederland X (Pisces). Sijthoff’s, Leiden. (in Dutch)
Reid DP, Szanto A, Glebe B, Danzmann RG, Ferguson MM (2005) QTL for body weight and condition factor in Atlantic salmon (Salmo salar): comparative analysis with rainbow trout (Oncorhynchus mykiss) and Arctic charr (Salvelinus alpinus). Heredity 94: 166-172.
Ren ML (1994) Ichthyofauna of the Heilongjiang River. Chinese J Fisher 7: 1-13.
Revenga C, Campbell I, Abell R, De Villiers P, Bryer M (2005) Prospects for monitoring freshwater ecosystems towards the 2010 targets. Philos Trans Royal Soc B Biol Sci 360: 397-413.
Rumelhart DE, McClelland JL (1986) Parallel distributed processing: Explorations in the microstructure of cognition, Vol. 1: Foundations: MIT Press Cambridge: MA, USA.
Sala OE, Chapin FS, Armesto JJ, Berlow R, Bloomfield J, Dirzo R, Huber-Sanwald E, Huenneke LF, Jackson RB, Kinzig A, Leemans R, Lodge D, Mooney HA, Oesterheld M, Poff NL, Sykes MT, Walker BH, Walker M, Wall DH (2000) Global biodiversity scenarios for the year 2100. Science 287: 1770-1774.
Scribner KT, Wooten MC, Smith MH, Kennedy PK, Rhodes OE Jr (1992) Variation in life history and genetic traits of Hawaiian mosquitofish populations. J Evol Biol 5: 267-288.
Seehausen O (2002) Patterns in fish radiation are compatible with Pleistocene desiccation of Lake Victoria and 14600 year history for its cichlid species flock. Proc R Soc Lond 269: 491-497.
Shan ZG (1996) Studies on the hydrochemistry of Chenghai Lake during 1992. J Yunnan Normal Univ 16: 21-28. (in Chinese)
Sheldon AL (1968) Species diversity and longitudinal succession in stream fishes. Ecology 49: 194-198.
Shi BN, He XF, Deng QX (1984) Distribution of fish in the downstream of the Wujiang River. J Sichuan Teachers College 5: 50-59. (in Chinese)
Structure of endemic fish assemblages and population differentiation of G. rarus in the upper Yangtze River basin
63
Strayer DL (2006) Challenges for freshwater invertebrate conservation. J N Am Benthol Soc 25: 271–287.
Strayer DL, Dudgeon D (2010) Freshwater biodiversity conservation: recent progress and future challenges. J N Am Benthol Soc 29: 344-358.
Sun HL (2008) Ecological and environmental problems in the upper Yangtze River. China Environmental Science Press: Beijing. (in Chinese)
Tang T, Qu XD, Cai QH, Liu JK (2004) River ecosystem management-a case study of Xiangxi River. Resour Environ Yangtze Basin 13: 594-598. (in Chinese)
Taverna K, Urban DL, McDonald RI (2004) Modeling landscape vegetation pattern in response to historic land-use: a hypothesis-driven approach for the North Carolina Piedmont, USA. Landscape Ecol 20: 689-702.
The Mathworks Inc (2001) MATLAB, Version 6.1. The Mathworks, Inc., Massachusetts.
Theodoridis S, Koutroumbas K (2006) Pattern Recognition: Third Edition. Academic Press: San Diego, USA.
Tong JG, Wang ZW, Wu QJ, Yu XM, Chu KH (2002) Cross-species amplification in silver carp and bighead carp with microsatellite primers of common carp. Mol Ecol Notes 2: 245-248.
Tong JG, Yu XM, Liao XL (2005) Characterization of a highly conserved microsatellite marker with utility potentials in cyprinid fishes. J Appl Ichthyol 21: 232-235.
Ultsch A (1993) Self-organizing neural networks for visualization and classification. In: Opitz O, Lausen B, Klar R (eds) Information and classification. Springer-Verlag: Berlin pp. 307-313.
Vesanto J (2000) Neural network tool for data mining: SOM Toolbox. Proceedings of Symposium on Tool Environments and Development Methods for Intelligent Systems (TOOLMET2000). Oulun yliopistopaino, Oulu, Finland. pp184-196.
Vos P, Hogers R, Bleeker M, Reijans M, van de Lee T, Hornes M, Frijters A, Pot J, Peleman J, Kuiper M, Zabeau M (1995) AFLP: a new technique for DNA fingerprinting. Nucleic Acids Res 23(21): 4407-4414.
Wang JW, Cao WX (1997) Gobiocypris rarus and fishes as laboratory animals. Trans Chinese Ichthyol Soc 6:144-152. (in Chinese)
Wang LJ, Guo HC, Liu Y, Dai YL, Wang JH (2005) Ecological fragility of Qionghai Lake basin and its assessment. Chinese J Ecol 24: 1192-1196. (in Chinese)
Wang S, Xie Y (eds) (2004) China species red list: red list, vol 1. Higher Education Press: Beijing. pp. 154. (in Chinese)
Structure of endemic fish assemblages and population differentiation of G. rarus in the upper Yangtze River basin
64
Wang ZH, Yin YW, Xu ZN, Zhou J, Zhang Q, Zhang DP (1998) Acute and subchronic toxicity of pyrethroid insecticides to Gobiocypris rarus. Chinese Appl Environ Biol 4: 379-382. (in Chinese)
Wilppu E (1997) The visualisation capability of self-organizing maps to detect deviations in distribution control. TUCS Technical Report No 153, Turku Centre for Computer Science, Turku.
Witte F, van Oijen MJP, Sibbing FA (2009) Fish fauna of the Nile. In HJ Dumont (ed). The Nile: Origin, Environments, Limnology and Human Use. Springer Science+Business Media. pp. 647-675.
Wolfgang JJ, Soares MGM, Bayley PB (2007) Freshwater fishes of the Amazon River basin: their biodiversity, fisheries and habitats. Aquatic Ecosyst Health Manag 10: 153-173.
Woram RA, McGowan C, Stout JA, Gharbi K, Ferguson MM, Hoyheim B, Davidson EA, Davidson WS, Rexroad C, Danzmann RG (2004) A genetic linkage map for Arctic char (Salvelinus alpinus): evidence for higher recombination rates and segregation distortion in hybrid versus pure strain mapping parents. Genome 47: 304-315.
Wu L, Zheng JZ, Lu KQ, Xie JH, Luo ZQ, Li DJ, Zhao ZF (1989) The Fishes of Guizhou. Guizhou People’s Press: Guiyang. (in Chinese)
Wu XW (1964) Cyprinidae Fishes of China: Part I. Shanghai Science and Technology Press: Shanghai, China. (in Chinese)
Wu XW (1977) Cyprinidae Fishes of China: Part II. Shanghai People’s Press: Shanghai, China. (in Chinese)
Wu YF, Tan QJ (1991) Characteristics of the fish-fauna of Qinghai-Xizang Plateau and its geological distribution and formation. Acta Zool Sin 37: 135-152. (in Chinese)
Wu YF, Wu CZ (1992) The Fishes of the Qinghai-Xizang Plateau. Sichuan Science and Technology Press: Chengdu. (in Chinese)
Xiong DM, Xie CX, Xia L (2009) Threatened fishes of the world: Gobiocypris rarus Ye and Fu, 1983 (Cyprinidae). Environ Biol Fish 86: 107-108.
Ye MR, Fu TY (1983) Description of a new genus and species of Danioninae from China (Cypriniformes: Cyprinidae). Acta Zootaxon Sin 8: 434-437. (in Chinese)
Ye MR, Fu TY (1987) The fish species resources of Dadu River in Sichuan Province. Resour Dev Conserv 3: 37-40. (in Chinese)
Yu XD, Luo TH, Zhou HZ (2005) Large-scale patterns in species diversity of fishes in the Yangtze River Basin. Biodivers Sci 13: 473-495. (in Chinese)
Structure of endemic fish assemblages and population differentiation of G. rarus in the upper Yangtze River basin
65
Yuan JJ, Tao XF (2008) The features of gravel bed and drainage evolution in the Qingyi River valley in the Mingshan-Danling Region, Sichuan. Acta Geol Sin 28: 6-12. (in Chinese)
Zane L, Bargelloni L, Patarnello T (2002) Strategies for microsatel¬lite isolation: a review. Mol Ecol 11: 1-16
Zeng X (ed.) (1990) Fishery Resources of the Yangtze River Basin. Marine Press: Beijing, China. (in Chinese)
Zhang BL, Zhang SM, Zhou QG, Zhou WC (2007) Dynamics in land use and ecosystem service-a case of Daning River watershed in Three Gorges Reservoir area. Resour Environ Yangtze Basin 16: 181-185. (in Chinese)
Zhou SL, Yang WF, Xue ZB (2006) Health assessments on the Hydrophytic ecosystem of Qionghai Lake. Environ Monit China 22: 78-81. (in Chinese)
Zhu B, Liao X, Shao Z, Rosenthal H, Chang J (2005) Isolation and characterization of microsatellites in Chinese sturgeon, Acipenser sinensis. Mol Ecol Notes 5: 888-892.

66
Part 2: Publications

P1
Structure of endemic fish assemblages in the upper Yangtze River Basin
He Y., Wang J., Lek S., Cao W. & Lek-Ang S. (2009)
River Research and Applications, doi: 10.1002/rra.1339
(In press)

STRUCTURE OF ENDEMIC FISH ASSEMBLAGES IN THE UPPER YANGTZERIVER BASIN
YONGFENG HE,a,b,c JIANWEI WANG,a* SOVAN LEK,c WENXUAN CAOa and SITHAN LEK-ANGc
a Institute of Hydrobiology, Chinese Academy of Sciences, Wuhan, Hubei 430072, Chinab Graduate University of Chinese Academy of Sciences (GUCAS), Beijing 100039, China
c Universite Paul Sabatier, Lab. Evolution & Diversite Biologique, UMR 5174, CNRS – 118, route de Narbonne – 31062 Toulouse, Cedex 4, France
ABSTRACT
This study focused on characterizing the endemic fish assemblages in the upper Yangtze River Basin and identifying the relativeinfluences of catchment land-cover variables on observed fish patterns in order to suggest a conservation strategy. A model based on aself-organizing map was applied to determine endemic fish assemblages along the river network, based on presence/absence data for124 endemic species. Five fish assemblages (Ia, Ib, IIa, IIb1, IIb2) were described. These assemblages varied significantly in terms ofindividual species patterns as well as species richness. Indicator species were identified for each class of community (0, 3, 9, 27, 0species for cluster Ia, Ib, IIa, IIb1, IIb2, respectively). Structure of the endemic fish assemblages in the upper Yangtze River was highlycorrelated with local topographic and geomorphic characteristics. Simultaneously, the catchment land cover features also reflected outthis endemic fish distribution structure. Among 18 land-cover types, alpine and sub-alpine meadow, together with farmland, wererevealed to be the most important factors both in discriminating the endemic fish assemblages and in correlating species distributionsby using discriminant analysis and co-inertia analysis. Finally, in order to preserve the rare and endemic fish in the upper YangtzeRiver, reserve networks, rather than a single national nature reserve, should be established. Copyright# 2009 JohnWiley& Sons, Ltd.
key words: classification model; fish assemblage; indicator species; land cover; Yangtze River; conservation implication
Received 17 January 2009; Revised 5 October 2009; Accepted 1 November 2009
INTRODUCTION
Biodiversity conservation is an important global environ-mental topic. Many species have been eliminated from areasdominated by human influences, and extinctions areoccurring at an unnaturally rapid rate, estimated to be100–1000 times greater than pre-human rates (Lawton andMay, 1995; Pimm et al., 1995). The widespread changes inbiodiversity alter ecosystem processes and change theresilience of ecosystems (Chapin et al., 2000). Therefore,the dramatic loss of biodiversity (Chapin et al., 2000; Abell,2002; Saunders et al., 2002) implies conservation of naturalresources and biodiversity is a focus for managers. For thispurpose, minimizing the loss of biodiversity may act as aconservative strategy for maintaining the global values ofecosystem services.
Changes in species richness, relative abundances andspecies composition at various spatio-temporal levels havecontributed to the loss of biodiversity in river systemsbecause of human various activities. In aquatic ecosystemmanagement, spatial characterization of riverine fishcommunities is an important element. Fish assemblages
have been recognized as sensitive and reliable indicators ofaquatic ecosystem health (Ibarra et al., 2003; Rashleigh,2004). In fish ecology, the structure of fish assemblagesdepends on many interacting factors and can be quantifiedby summarizing species richness, composition and feedingguilds (Karr, 1981). Classification of sites (or areas) basedon fish species assemblages has been elaborated for manylotic systems (Konan et al., 2006; Park et al., 2006; Kruket al., 2007; Lasne et al., 2007). Modelling the compositionof fish assemblages on the basis of biotic and abioticenvironmental descriptors is an important aspect of themanagement of aquatic ecosystems.
Studies in the last decade have shown that variation incatchment land cover plays an important role in thedistribution and movement of fish across different aquaticecosystems (Hanchet, 1990; Sutherland et al., 2002; Strayeret al., 2003; Allan, 2004; Singkran and Meixler, 2008).These may indirectly affect fish assemblage distributions byaltering fish habitats in terms of light intensity, organicmatter, nutrients or sediment load, and directly by theinteractions with other anthropogenic drivers (e.g. climatechange, invasive species, dams) (Sutherland et al., 2002;Strayer et al., 2003). Quantifying and understanding howfish assemblages respond to changes in catchment land coverare important for managing the preservation and restorationof aquatic ecosystems (Park et al., 2006).
RIVER RESEARCH AND APPLICATIONS
River. Res. Applic. (2009)
Published online in Wiley InterScience(www.interscience.wiley.com) DOI: 10.1002/rra.1339
*Correspondence to: Jianwei Wang, Institute of Hydrobiology, ChineseAcademy of Sciences, 7# Donghu South Road, Wuhan, Hubei 430072,China. E-mail: [email protected]
Copyright # 2009 John Wiley & Sons, Ltd.
The Yangtze River is the third largest river in the world,with a length of 6 380 km and drains an area of 1.8! 106
km2 (Hydrology Bureau of Changjiang Water ResourcesCommittee, 2003). It spans three large topographic plat-forms of the Chinese mainland. From its origins at PeakGeladandong in the Tanggula cordillera, Qinghai-XizangPlateau, it flows through 11 Chinese provinces receiving onits way more than a hundred large or small tributaries. Ithas abundant water resources with a mean annualdischarge of 31 900m3/s and a mean annual runoff of9.513! 1011 m3. The upper Yangtze River, from itsheadwaters to Yichang in Hubei Province, exhibitspronounced habitat heterogeneity across its reaches as aresult of its meteorological, hydrological, physiographicaland geological differences (Dong, 2003). With its compli-cated natural environment, well-developed drainage system,abundant water resources and rich biodiversity, the upperYangtze River has been marked as an eco-functional barrierof the Yangtze River and a key area for ecological restoration(Sun, 2008).The Hengduan Mountains Region located in the upper
Yangtze River Basin has been identified as one of 25 globalbiodiversity hotspots (Myers et al., 2000; Sun, 2008). It isrich in species resources and has a high species diversity,abundant communities and general ecosystem diversity. TheYangtze River supports about 350 freshwater fish species(Chen et al., 2002; Fu et al., 2003; Park et al., 2003; Yu et al.,2005), representing the highest diversity in the Palearcticregion (Nelson, 1994; Matthews, 1998). Approximately80% of the species (including 124 endemic ones) occur inthe upper Yangtze River. In conjunction with abundantbiodiversity, the upper Yangtze River basin is also abundantin land vegetation and forest resources, which is animportant factor in the conservation of water resources.Currently, the upper Yangtze River Basin is experiencing
critical changes to its ecosystems through multipleecological threats (e.g. grassland degradation, serious soiland water loss, glacier retreat and frozen ground shrinkage,reduction of river run-off) (Sun, 2008). Combined with asharp decrease in forest coverage, the increased area and theintensity of soil erosion are the most urgent issues in thebasin, and the natural ecology has been subjected to asignificant damage. For instance, the total area of soilerosion in the upper Yangtze River has increased to3.55! 105 km2, accounting for 62.6% of the whole basin(EIADCAS and RIPYWR, 1995).The upper Yangtze River is an essential base for water
power resources in China. More than 1000 hydropowerstations with installed capacities ranging from dozens ofkilowatts to 10 million kilowatts have been built or are underconstruction, on almost all the trunk streams and tributaries.Even more hydropower stations are planned to build (Sun,2008). These hydroelectric developments may induce
universal, comprehensive and permanent eco-environmentalproblems especially including adverse impacts to fishresources. Thus, close attention should be paid onharmonizing hydroelectric developments with fish resourcesconservation. It is imperative to accelerate the progress ofconservation projects.Close relationships between fish distributions and
different catchment land-covers have been shown indifferent river systems in Europe and America (Sutherlandet al., 2002; Park et al., 2006; Singkran and Meixler, 2008).As a part of aquatic ecosystem conservation in the upperYangtze River, evaluation of the influence of changes inland-cover features on the fish distributions is required. Inthe present study, the 124 endemic fishes in the upperYangtze River were selected for patterning. Endemic fish aredefined as those occurring in the main channel andtributaries of the upper Yangtze River and its affiliatedwaters, or populations occurring mainly in the upperYangtze River. Endemic fish are usually deemed to berepresentative of local aquatic eco-environments for theirhigh adaptation and dependence.The objectives of this study were to determine the patterns
in endemic fish assemblages and identify land-cover factorsrelated to their composition in the upper Yangtze RiverBasin. The findings not only provide insight into mechan-isms structuring fish assemblages but also enhance knowl-edge on ecological processes in the upper Yangtze River. Indoing so, it will also help direct conservation and manage-ment activities for both species and their habitats.
MATERIALS AND METHODS
Study area
The Upper Yangtze River has a total length of 4 500 km,i.e. around 2/3 of the total length of the Yangtze River, and acatchment area of 1.0! 106 km2. Its main stream is mainlycomposed of three sections. The headwater section of theYangtze River extends from the Tuotuo River to the TongtianRiver. The second section is from Zhimenda in QinghaiProvince to Yibin in Sichuan Province and is named theJinsha River. The third section from Yibin in SichuanProvince to Yichang in Hubei Province is called ‘Chuan-jiang’. With numerous tributaries, the upper Yangtze River ischaracterized by well-developed water systems. Amongthem, six larger main tributaries (Yalong River, MinjiangRiver, Tuojiang River, Chishui River, Jialing River andWujiang River), along with seven tributaries (Anning River,Dadu River, Qingyi River, Fujiang River, Qujiang River,Daning River and Xiangxi River) and five lakes (Chenghai,Dianchi, Lugu Lake, Qionghai and Caohai) were included inthe present study (Figure 1).
Copyright # 2009 John Wiley & Sons, Ltd. River. Res. Applic. (2009)
DOI: 10.1002/rra
Y. HE ET AL.

Data set
In this study, long-term presence-absence endemic fishdistribution data on the upper Yangtze River basin wereused. These data were mainly based on the fish distributiondata collected by Cao et al. (1998, unpublished), monitoringdata from the Ecological and Environmental MonitoringSystem of Three Gorges Reservoir collected since 1997,other research results conducted by the Lab. Ecology andConservation Biology of Freshwater Fishes in the Instituteof Hydrobiology, and bibliographic data including mono-graphs (Wu et al., 1989; Wu and Wu, 1992; Ding, 1994;Chen, 1998a; Chen, 1998b; Zheng and Dai, 1999; Yue,2000) and investigation papers (Shi et al., 1984; Deng, 1985;Ye and Fu, 1987; Chen et al., 2002; Fu et al., 2003; Parket al., 2003; Yu et al., 2005; Ding, 2006). The authorsappended species distribution records, supplemented withnewly published species information, and aggregated themafter filtering out the controversial species.
The long-term fish distribution data set was used under theassumption that fish assemblages did not significantly
change during the study period. The data set encompassed46 sites and 124 species, with a site representing one river orone reach of a river. Specific site details are given in Figure 1and Table I. All the fish species used in the present study areendemic to the upper Yangtze River. Despite the simplicityof presence-absence data, they provide reliable informationfor analyzing fish assemblage patterns (Ibarra et al., 2005;Park et al., 2006).
The proportion (%) of different land cover types foreach site in the basin was extracted from the China LandCover map through the Geographical Information System(GIS). The land cover map is based on a simpleclassification system consisting of 24 land cover classes.Only 18 classes were used in the study area: needleleavedevergreen forest (NEF), broadleaved evergreen forest(BEF), broadleaved deciduoud forest (BDF), bush (B),sparse woods (SW), alpine and sub-alpine meadow(ASM), slope grassland (SG), plain grassland (PG), desertgrassland (DG), city (C), river (R), lake (L), swamp (S),glacier (GL), bare rocks (BR), gravel (GR), farmland (F),alpine and sub-alpine plain grassland (ASG). The
Figure 1. Geographical distribution of sampling sites in the upper Yangtze River basin. Assemblage types (clusters) are indicated with different symbols. Thenumbers (1–46) correspond to the middle point of each site, the detail information of which was listed in Table I
Copyright # 2009 John Wiley & Sons, Ltd. River. Res. Applic. (2009)
DOI: 10.1002/rra
STRUCTURE OF ENDEMIC FISH ASSEMBLAGES
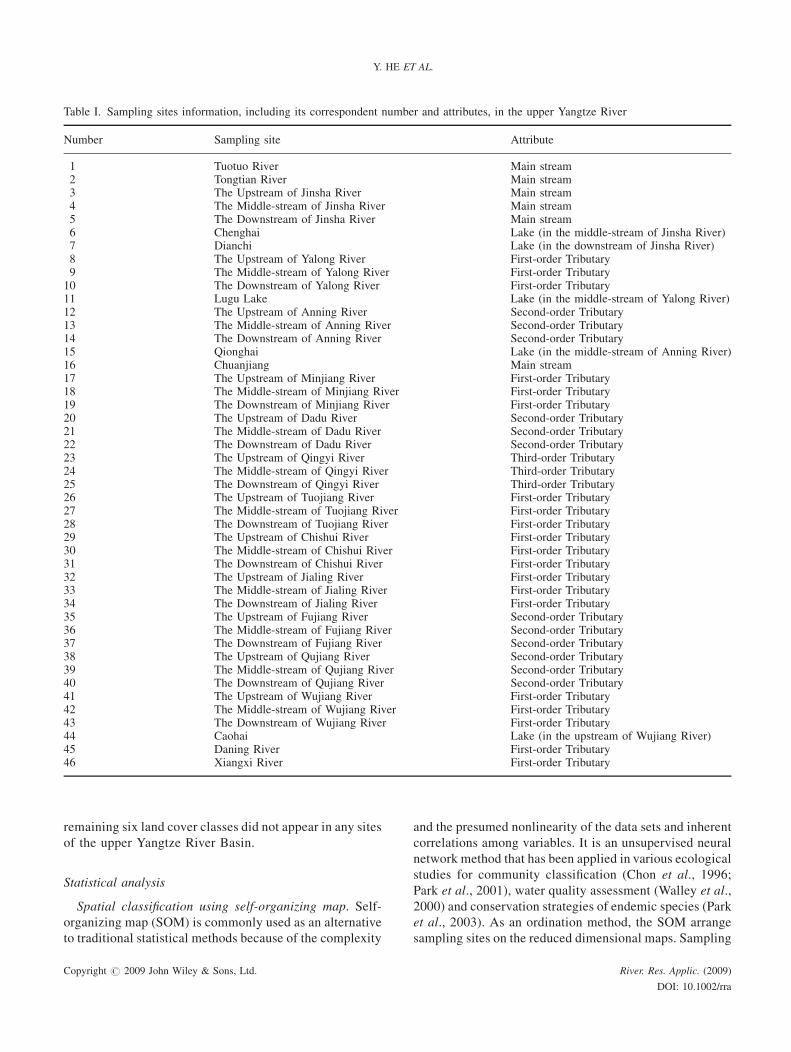
remaining six land cover classes did not appear in any sitesof the upper Yangtze River Basin.
Statistical analysis
Spatial classification using self-organizing map. Self-organizing map (SOM) is commonly used as an alternativeto traditional statistical methods because of the complexity
and the presumed nonlinearity of the data sets and inherentcorrelations among variables. It is an unsupervised neuralnetwork method that has been applied in various ecologicalstudies for community classification (Chon et al., 1996;Park et al., 2001), water quality assessment (Walley et al.,2000) and conservation strategies of endemic species (Parket al., 2003). As an ordination method, the SOM arrangesampling sites on the reduced dimensional maps. Sampling
Table I. Sampling sites information, including its correspondent number and attributes, in the upper Yangtze River
Number Sampling site Attribute
1 Tuotuo River Main stream2 Tongtian River Main stream3 The Upstream of Jinsha River Main stream4 The Middle-stream of Jinsha River Main stream5 The Downstream of Jinsha River Main stream6 Chenghai Lake (in the middle-stream of Jinsha River)7 Dianchi Lake (in the downstream of Jinsha River)8 The Upstream of Yalong River First-order Tributary9 The Middle-stream of Yalong River First-order Tributary10 The Downstream of Yalong River First-order Tributary11 Lugu Lake Lake (in the middle-stream of Yalong River)12 The Upstream of Anning River Second-order Tributary13 The Middle-stream of Anning River Second-order Tributary14 The Downstream of Anning River Second-order Tributary15 Qionghai Lake (in the middle-stream of Anning River)16 Chuanjiang Main stream17 The Upstream of Minjiang River First-order Tributary18 The Middle-stream of Minjiang River First-order Tributary19 The Downstream of Minjiang River First-order Tributary20 The Upstream of Dadu River Second-order Tributary21 The Middle-stream of Dadu River Second-order Tributary22 The Downstream of Dadu River Second-order Tributary23 The Upstream of Qingyi River Third-order Tributary24 The Middle-stream of Qingyi River Third-order Tributary25 The Downstream of Qingyi River Third-order Tributary26 The Upstream of Tuojiang River First-order Tributary27 The Middle-stream of Tuojiang River First-order Tributary28 The Downstream of Tuojiang River First-order Tributary29 The Upstream of Chishui River First-order Tributary30 The Middle-stream of Chishui River First-order Tributary31 The Downstream of Chishui River First-order Tributary32 The Upstream of Jialing River First-order Tributary33 The Middle-stream of Jialing River First-order Tributary34 The Downstream of Jialing River First-order Tributary35 The Upstream of Fujiang River Second-order Tributary36 The Middle-stream of Fujiang River Second-order Tributary37 The Downstream of Fujiang River Second-order Tributary38 The Upstream of Qujiang River Second-order Tributary39 The Middle-stream of Qujiang River Second-order Tributary40 The Downstream of Qujiang River Second-order Tributary41 The Upstream of Wujiang River First-order Tributary42 The Middle-stream of Wujiang River First-order Tributary43 The Downstream of Wujiang River First-order Tributary44 Caohai Lake (in the upstream of Wujiang River)45 Daning River First-order Tributary46 Xiangxi River First-order Tributary
Copyright # 2009 John Wiley & Sons, Ltd. River. Res. Applic. (2009)
DOI: 10.1002/rra
Y. HE ET AL.
sites with similar species composition and structure wereclassified into the same neuron or into neighbouringneurons.
In the present study, the endemic fish species distributionpatterns in the upper Yangtze River were described by SOM.The sequential algorithm and the Euclidean distancecoefficient were used for training the SOM in the presentstudy. The number of nodes was determined as 5! (numberof samples)! (Vesanto, 2000), and then based on theminimum values of quantization and topographic errors, theoutput layer of the SOM in the present study consists of 56neurons (virtual units) arranged into a 8! 7 hexagonallattice to provide better visualization. According to thesimilarity of the weight vectors of the neurons, a hierarchicalcluster analysis with a Ward’s linkage method can furthersubdivide the cells of the map into different groups. Thedefinition of the group numbers is mainly based on thedegree of dissimilarity of each SOM cell in the hierarchicalclustering. The unified distance matrix (U-matrix; Ultsch,1993) and Davies-Bouldin index (Davies and Bouldin,1979) were also applied to reinforce the group definition. Allthese analyses were done in the Matlab environment (TheMathworks, 2001) using the SOM toolbox (Alhoniemi et al.,2000).
In order to assess the effectiveness of the hierarchicalclustering, the cophenetic correlation coefficient (Sneathand Sokal, 1973) was calculated using R software (Ihaka andGentleman, 1996). The contributions of each inputcomponent with respect to cluster structures were obtainedfrom weight vectors of the SOM and then visualized by box-plot. The Kruskall-Wallis test was conducted to comparedifferences of species richness among clusters in the Rsoftware. After Kruskall-Wallis test, multiple comparisontests were also conducted in the R software using ‘pgirmess’package (Giraudoux, 2006).
Identification of indicator species for each assembla-ge. The IndVal method was used to identify indicatorspecies, which were defined as the most characteristicspecies of each group. This was found mostly in a singlegroup of the typology and present in the majority of the sitesbelonging to that group, for summarizing the assemblagepatterns (Dufrene and Legendre, 1997). Based on the fidelityand the specificity of species for each cluster, INDVAL 2.0was used to identify indicator species of different fishassemblages in the upper Yangtze River. The formula is asfollows: IndValij"Aij!Bij! 100, where Aij"Nsitesij/Nsitesi and Bij"Nsitesij/Nsitesj. Here the formula of Aij isonly for presence-absence data. Only significant and greaterthan 25 IndVal have been taken into account, in that itimplies that a characteristic species is present in at least 50%of one site’s group and that its relative abundance in thatgroup reaches at least 50%. Dufrene and Legendre (1997)suggested that the level for which a species had its highest
IndVal value was considered as the best classification levelfor that indicator species. However, lower IndVal values mayprovide supplementary information on the species distri-bution patterns in different hierarchical levels.
Correspondence between assemblages and land-coverfactors. Co-inertia analysis (CIA) and discriminant analysis(DA) are multivariate methods, commonly applied toidentify the species-environment relationships and theassemblage-environment relationships in ecological studies,respectively (Thioulouse et al., 1997; Culhane et al., 2003).In the present study, we introduced both the speciesdistribution data set and land-cover variables into CIA andDA in the R software using the ‘ade4’ package (Thioulouseet al., 1997). The logic of principal component analysis wasapplied in both CIA and DAmethods because the land-coverfactors related to the distribution of species were supposed tobe limiting (Doledec and Chessel, 1994). The DA wasconducted to determine which land-cover variables dis-criminate between the clusters previously defined by theSOM procedure. Standardized coefficients for each variablein each discriminant function represent the contribution ofthe respective variable to the discrimination betweenclusters. A randomMonte Carlo test with 1000 permutationswas used to reveal the significance of land cover variablesamong clusters. The Kruskall-Wallis test was then carriedout to reveal the difference of land cover variables amongclusters, and then multiple comparison tests were alsoconducted in the R software using ‘pgirmess’ package. Afirst step in the CIA consisted of conducting separateanalyses to interpret both the land-cover structure and thespecies structure. Then the CIA was used to summarize therelationships between species lists and land-cover variables,in which a randomMonte Carlo test with 1000 permutationswas performed to reveal the significance of the co-structureof this CIA. The RV-coefficient is calculated to measure theoverall similarity (Robert and Escoufier, 1976) and this has arange 0 to 1, where a high RV-coefficient indicates a highdegree of co-structure.
RESULTS
Endemic fish assemblages in the upper Yangtze River
The composition of the endemic fish fauna in the presentstudy is shown in Table II. A total of 124 endemic fishesbelonging to 59 genera, 9 families and 4 orders were analyzed.Among these, Cypriniforme (88% of species) were the mostabundant order, followed by Siluriforme (10%), Perciforme(2%) and Acipenseriforme (1%). Cyprinidae (59.7%) werethe most abundant family, followed by Cobitidae (21.8%),Homalopteridae (6.5%), Sisoridae (4.8%), Bagridae (2.4%),Gobiidae (1.6%), Amblycipitidae (1.6%), Acipenseridae(0.8%) and Siluridae (0.8%). The probability of species
Copyright # 2009 John Wiley & Sons, Ltd. River. Res. Applic. (2009)
DOI: 10.1002/rra
STRUCTURE OF ENDEMIC FISH ASSEMBLAGES
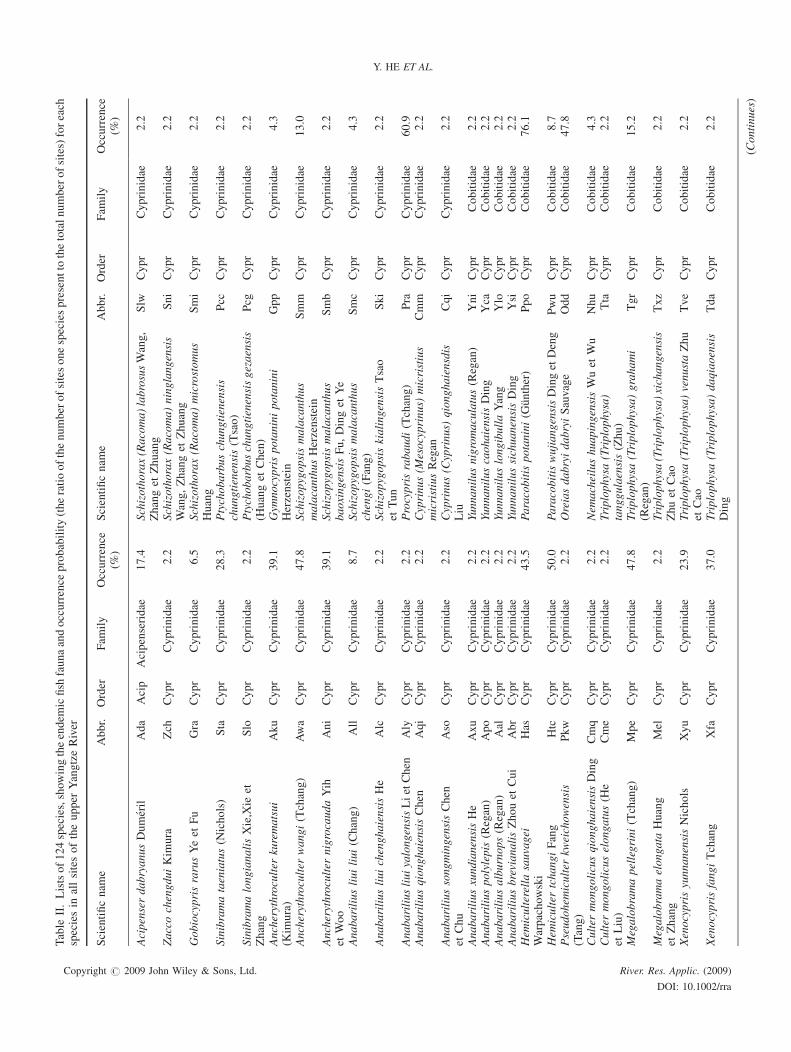
Table
II.Listsof
124species,show
ingtheendemicfish
faun
aandoccurrence
prob
ability(the
ratioof
thenu
mberof
siteson
especiespresentto
thetotalnu
mberof
sites)foreach
speciesin
allsitesof
theup
perYangtze
River
Scientificname
Abb
r.Order
Fam
ily
Occurrence
(%)
Scientificname
Abb
r.Order
Fam
ily
Occurrence
(%)
Acipenser
dabryanu
sDum
eril
Ada
Acip
Acipenseridae
17.4
Schizothorax
(Racom
a)labrosus
Wang,
Zhang
etZhu
ang
Slw
Cyp
rCyp
rinidae
2.2
Zacco
chengd
uiKim
ura
Zch
Cyp
rCyp
rinidae
2.2
Schizothorax
(Racom
a)ning
lang
ensis
Wang,
Zhang
etZhu
ang
Sni
Cyp
rCyp
rinidae
2.2
Gob
iocypris
rarusYeet
Fu
Gra
Cyp
rCyp
rinidae
6.5
Schizothorax
(Racom
a)microstom
usHuang
Smi
Cyp
rCyp
rinidae
2.2
Sinibram
ataeniatus(N
icho
ls)
Sta
Cyp
rCyp
rinidae
28.3
Ptychob
arbuschun
gtienensis
chun
gtienensis
(Tsao)
Pcc
Cyp
rCyp
rinidae
2.2
Sinibram
along
iana
lisXie,Xie
etZhang
Slo
Cyp
rCyp
rinidae
2.2
Ptychob
arbuschun
gtienensisgezaensis
(Huang
etChen)
Pcg
Cyp
rCyp
rinidae
2.2
Ancherythroculter
kurematsui
(Kim
ura)
Aku
Cyp
rCyp
rinidae
39.1
Gym
nocypris
potanini
potanini
Herzenstein
Gpp
Cyp
rCyp
rinidae
4.3
Ancherythroculter
wan
gi(Tchang)
Awa
Cyp
rCyp
rinidae
47.8
Schizopygo
psis
malacan
thus
malacan
thus
Herzenstein
Smm
Cyp
rCyp
rinidae
13.0
Ancherythroculter
nigrocau
daYih
etWoo
Ani
Cyp
rCyp
rinidae
39.1
Schizopygo
psis
malacan
thus
baoxingensis
Fu,
Dinget
Ye
Smb
Cyp
rCyp
rinidae
2.2
Ana
barilius
liui
liui
(Chang
)All
Cyp
rCyp
rinidae
8.7
Schizopygo
psis
malacan
thus
chengi
(Fang)
Smc
Cyp
rCyp
rinidae
4.3
Ana
barilius
liui
chengh
aiensisHe
Alc
Cyp
rCyp
rinidae
2.2
Schizopygo
psis
kialingensis
Tsao
etTun
Ski
Cyp
rCyp
rinidae
2.2
Ana
barilius
liui
yalong
ensisLietChen
Aly
Cyp
rCyp
rinidae
2.2
Procypris
raba
udi(Tchang)
Pra
Cyp
rCyp
rinidae
60.9
Ana
barilius
qion
ghaiensisChen
Aqi
Cyp
rCyp
rinidae
2.2
Cyprinu
s(M
esocyprinu
s)micristius
micristiusRegan
Cmm
Cyp
rCyp
rinidae
2.2
Ana
barilius
song
mingensis
Chen
etChu
Aso
Cyp
rCyp
rinidae
2.2
Cyprinu
s(Cyprinu
s)qion
ghaiensdis
Liu
Cqi
Cyp
rCyp
rinidae
2.2
Ana
barilius
xund
ianensis
He
Axu
Cyp
rCyp
rinidae
2.2
Yunn
anilus
nigrom
aculatus
(Regan)
Yni
Cyp
rCob
itidae
2.2
Ana
barilius
polylepis(Regan)
Apo
Cyp
rCyp
rinidae
2.2
Yunn
anilus
caoh
aiensisDing
Yca
Cyp
rCob
itidae
2.2
Ana
barilius
alburnop
s(Regan)
Aal
Cyp
rCyp
rinidae
2.2
Yunn
anilus
long
ibulla
Yang
Ylo
Cyp
rCob
itidae
2.2
Ana
barilius
breviana
lisZho
uet
Cui
Abr
Cyp
rCyp
rinidae
2.2
Yunn
anilus
sichua
nensis
Ding
Ysi
Cyp
rCob
itidae
2.2
Hem
iculterellasauvag
eiWarpachow
ski
Has
Cyp
rCyp
rinidae
43.5
Paracob
itis
potanini
(Gunther)
Ppo
Cyp
rCob
itidae
76.1
Hem
icultertcha
ngiFang
Htc
Cyp
rCyp
rinidae
50.0
Paracob
itiswujiang
ensisDinget
Deng
Pwu
Cyp
rCob
itidae
8.7
Pseud
ohem
iculterkw
eichow
ensis
(Tang)
Pkw
Cyp
rCyp
rinidae
2.2
Oreiasda
bryi
dabryi
Sauvage
Odd
Cyp
rCob
itidae
47.8
Cultermon
golicusqion
ghaiensisDing
Cmq
Cyp
rCyp
rinidae
2.2
Nem
acheilus
huap
ingensis
Wuet
Wu
Nhu
Cyp
rCob
itidae
4.3
Cultermon
golicuselon
gatus(H
eet
Liu)
Cme
Cyp
rCyp
rinidae
2.2
Triploph
ysa(Triplop
hysa)
tang
gulaensis(Zhu
)Tta
Cyp
rCob
itidae
2.2
Megalob
ramapellegrini
(Tchang)
Mpe
Cyp
rCyp
rinidae
47.8
Triploph
ysa(Triplop
hysa)grah
ami
(Regan)
Tgr
Cyp
rCob
itidae
15.2
Megalob
ramaelon
gata
Huang
etZhang
Mel
Cyp
rCyp
rinidae
2.2
Triploph
ysa(Triplop
hysa)xichan
gensis
Zhu
etCao
Txz
Cyp
rCob
itidae
2.2
Xenocyprisyunn
anensisNicho
lsXyu
Cyp
rCyp
rinidae
23.9
Triploph
ysa(Triplop
hysa)venu
staZhu
etCao
Tve
Cyp
rCob
itidae
2.2
Xenocyprisfang
iTchang
Xfa
Cyp
rCyp
rinidae
37.0
Triploph
ysa(Triplop
hysa)da
qiao
ensis
Ding
Tda
Cyp
rCob
itidae
2.2
(Con
tinu
es)
Copyright # 2009 John Wiley & Sons, Ltd. River. Res. Applic. (2009)
DOI: 10.1002/rra
Y. HE ET AL.
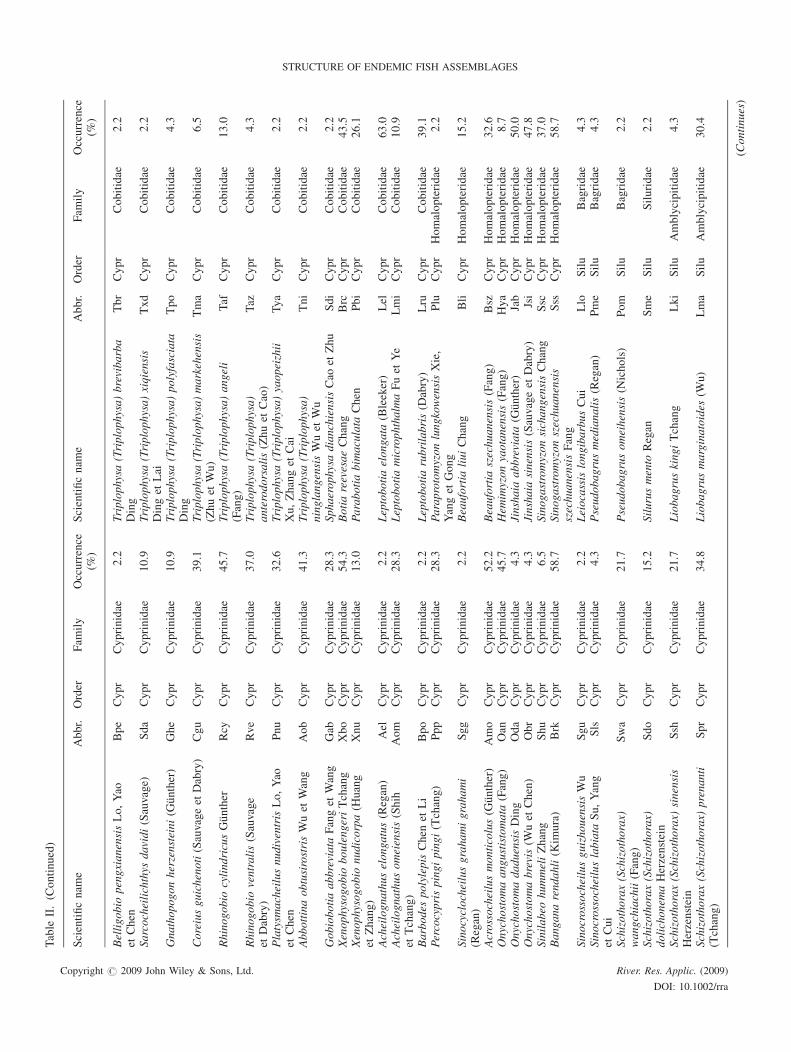
Table
II.(Con
tinu
ed)
Scientificname
Abb
r.Order
Fam
ily
Occurrence
(%)
Scientificname
Abb
r.Order
Fam
ily
Occurrence
(%)
Belligo
biopeng
xian
ensisLo,
Yao
etChen
Bpe
Cyp
rCyp
rinidae
2.2
Triplophysa(Triplophysa)brevibarba
Ding
Tbr
Cyp
rCob
itidae
2.2
Sarcocheilichthysda
vidi
(Sauvage)
Sda
Cyp
rCyp
rinidae
10.9
Triplophysa(Triplophysa)xiqiensis
Dinget
Lai
Txd
Cyp
rCob
itidae
2.2
Gna
thop
ogon
herzensteini
(Gunther)
Ghe
Cyp
rCyp
rinidae
10.9
Triplophysa(Triplophysa)polyfasciata
Ding
Tpo
Cyp
rCob
itidae
4.3
Coreius
guicheno
ti(Sauvage
etDabry)
Cgu
Cyp
rCyp
rinidae
39.1
Triploph
ysa(Triplop
hysa)markehensis
(Zhu
etWu)
Tma
Cyp
rCob
itidae
6.5
Rhino
gobiocylind
ricusGunther
Rcy
Cyp
rCyp
rinidae
45.7
Triplophysa(Triplophysa)angeli
(Fang)
Taf
Cyp
rCob
itidae
13.0
Rhino
gobioventralis(Sauvage
etDabry)
Rve
Cyp
rCyp
rinidae
37.0
Triplophysa(Triplophysa)
anterodo
rsalis
(Zhu
etCao)
Taz
Cyp
rCob
itidae
4.3
Platysm
acheilus
nudiventrisLo,
Yao
etChen
Pnu
Cyp
rCyp
rinidae
32.6
Triplophysa(Triplophysa)yaopeizhii
Xu,
Zhang
etCai
Tya
Cyp
rCob
itidae
2.2
Abb
ottina
obtusirostrisWuet
Wang
Aob
Cyp
rCyp
rinidae
41.3
Triplophysa(Triplophysa)
ning
lang
ensisWuet
Wu
Tni
Cyp
rCob
itidae
2.2
Gob
iobo
tiaab
breviata
Fanget
Wang
Gab
Cyp
rCyp
rinidae
28.3
Spha
erop
hysa
dian
chiensisCao
etZhu
Sdi
Cyp
rCob
itidae
2.2
Xenop
hysogo
biobo
ulengeriTchang
Xbo
Cyp
rCyp
rinidae
54.3
Botia
reevesae
Chang
Brc
Cyp
rCob
itidae
43.5
Xenop
hysogo
bionu
dicorpa(H
uang
etZhang
)Xnu
Cyp
rCyp
rinidae
13.0
Parab
otia
bimaculataChen
Pbi
Cyp
rCob
itidae
26.1
Acheilogn
athu
selon
gatus(Regan)
Ael
Cyp
rCyp
rinidae
2.2
Leptobo
tiaelon
gata
(Bleeker)
Lel
Cyp
rCob
itidae
63.0
Acheilogn
athu
som
eiensis(Shih
etTchang)
Aom
Cyp
rCyp
rinidae
28.3
Leptobo
tiamicroph
thalmaFuet
Ye
Lmi
Cyp
rCob
itidae
10.9
Barbo
despo
lylepisChenet
Li
Bpo
Cyp
rCyp
rinidae
2.2
Leptobo
tiarubrilab
ris(D
abry)
Lru
Cyp
rCob
itidae
39.1
Percocyprisping
iping
i(Tchang)
Ppp
Cyp
rCyp
rinidae
28.3
Parap
rotomyzon
lung
kowensisXie,
Yanget
Gon
gPlu
Cyp
rHom
alop
teridae
2.2
Sino
cyclocheilus
grah
amigrah
ami
(Regan)
Sgg
Cyp
rCyp
rinidae
2.2
Beaufortialiui
Chang
Bli
Cyp
rHom
alop
teridae
15.2
Acrossocheilusmon
ticolus(G
unther)
Amo
Cyp
rCyp
rinidae
52.2
Beaufortiaszechu
anensis(Fang)
Bsz
Cyp
rHom
alop
teridae
32.6
Onychostomaan
gustistomata(Fang)
Oan
Cyp
rCyp
rinidae
45.7
Hem
imyzon
yaotan
ensis(Fang)
Hya
Cyp
rHom
alop
teridae
8.7
Onychostomada
duensisDing
Oda
Cyp
rCyp
rinidae
4.3
Jinsha
iaab
breviata
(Gunther)
Jab
Cyp
rHom
alop
teridae
50.0
Onychostomabrevis
(Wuet
Chen)
Obr
Cyp
rCyp
rinidae
4.3
Jinsha
iasinensis(Sauvage
etDabry)
Jsi
Cyp
rHom
alop
teridae
47.8
Sinilabeohu
mmeliZhang
Shu
Cyp
rCyp
rinidae
6.5
Sino
gastromyzon
sichan
gensisChang
Ssc
Cyp
rHom
alop
teridae
37.0
Ban
gana
rend
ahli(K
imura)
Brk
Cyp
rCyp
rinidae
58.7
Sino
gastromyzon
szechu
anensis
szechu
anensisFang
Sss
Cyp
rHom
alop
teridae
58.7
Sino
crossocheilusgu
izho
uensis
Wu
Sgu
Cyp
rCyp
rinidae
2.2
Leiocassislong
ibarbusCui
Llo
Silu
Bagridae
4.3
Sino
crossocheiluslabiataSu,
Yang
etCui
Sls
Cyp
rCyp
rinidae
4.3
Pseud
obag
rusmediana
lis(Regan)
Pme
Silu
Bagridae
4.3
Schizothorax
(Schizotho
rax)
wan
gchiachii(Fang)
Swa
Cyp
rCyp
rinidae
21.7
Pseud
obag
rusom
eihensis
(Nicho
ls)
Pom
Silu
Bagridae
2.2
Schizothorax
(Schizotho
rax)
dolichon
emaHerzenstein
Sdo
Cyp
rCyp
rinidae
15.2
Silurusmento
Regan
Sme
Silu
Siluridae
2.2
Schizothorax
(Schizotho
rax)
sinensis
Herzenstein
Ssh
Cyp
rCyp
rinidae
21.7
Lioba
grus
king
iTchang
Lki
Silu
Amblycipitidae
4.3
Schizothorax
(Schizotho
rax)
prenan
ti(Tchang)
Spr
Cyp
rCyp
rinidae
34.8
Lioba
grus
margina
toides
(Wu)
Lma
Silu
Amblycipitidae
30.4
(Con
tinu
es)
Copyright # 2009 John Wiley & Sons, Ltd. River. Res. Applic. (2009)
DOI: 10.1002/rra
STRUCTURE OF ENDEMIC FISH ASSEMBLAGES
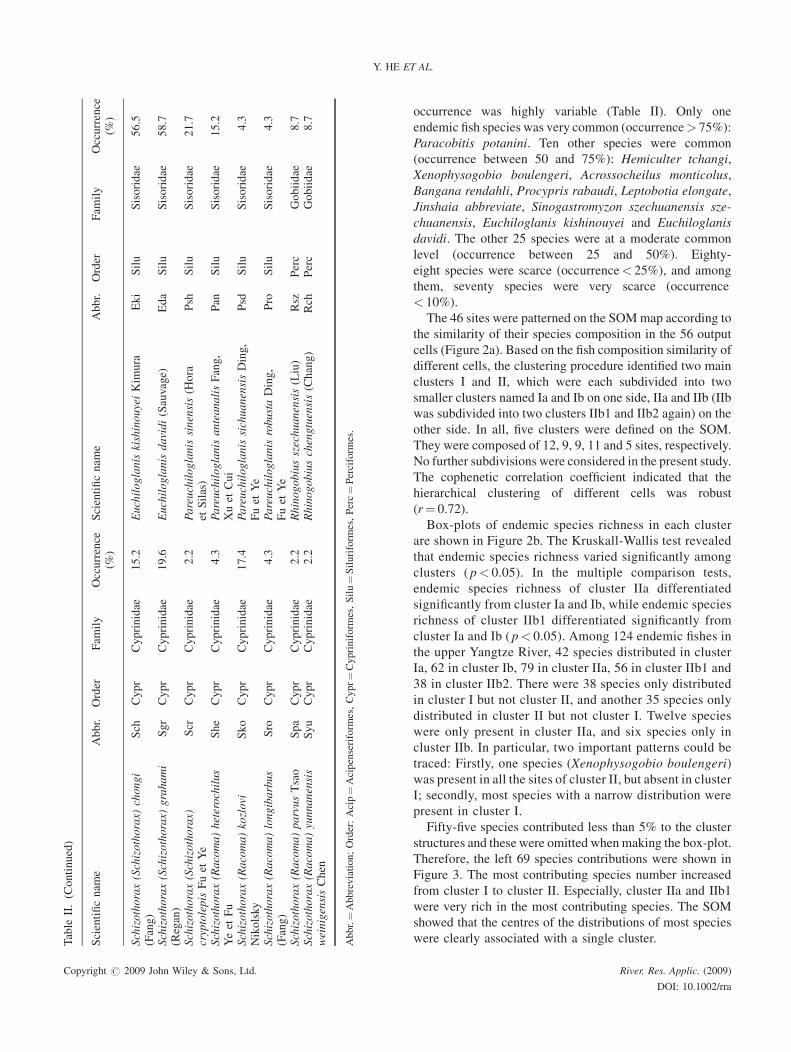
occurrence was highly variable (Table II). Only oneendemic fish species was very common (occurrence> 75%):Paracobitis potanini. Ten other species were common(occurrence between 50 and 75%): Hemiculter tchangi,Xenophysogobio boulengeri, Acrossocheilus monticolus,Bangana rendahli, Procypris rabaudi, Leptobotia elongate,Jinshaia abbreviate, Sinogastromyzon szechuanensis sze-chuanensis, Euchiloglanis kishinouyei and Euchiloglanisdavidi. The other 25 species were at a moderate commonlevel (occurrence between 25 and 50%). Eighty-eight species were scarce (occurrence< 25%), and amongthem, seventy species were very scarce (occurrence< 10%).The 46 sites were patterned on the SOMmap according to
the similarity of their species composition in the 56 outputcells (Figure 2a). Based on the fish composition similarity ofdifferent cells, the clustering procedure identified two mainclusters I and II, which were each subdivided into twosmaller clusters named Ia and Ib on one side, IIa and IIb (IIbwas subdivided into two clusters IIb1 and IIb2 again) on theother side. In all, five clusters were defined on the SOM.They were composed of 12, 9, 9, 11 and 5 sites, respectively.No further subdivisions were considered in the present study.The cophenetic correlation coefficient indicated that thehierarchical clustering of different cells was robust(r" 0.72).Box-plots of endemic species richness in each cluster
are shown in Figure 2b. The Kruskall-Wallis test revealedthat endemic species richness varied significantly amongclusters (p< 0.05). In the multiple comparison tests,endemic species richness of cluster IIa differentiatedsignificantly from cluster Ia and Ib, while endemic speciesrichness of cluster IIb1 differentiated significantly fromcluster Ia and Ib (p< 0.05). Among 124 endemic fishes inthe upper Yangtze River, 42 species distributed in clusterIa, 62 in cluster Ib, 79 in cluster IIa, 56 in cluster IIb1 and38 in cluster IIb2. There were 38 species only distributedin cluster I but not cluster II, and another 35 species onlydistributed in cluster II but not cluster I. Twelve specieswere only present in cluster IIa, and six species only incluster IIb. In particular, two important patterns could betraced: Firstly, one species (Xenophysogobio boulengeri)was present in all the sites of cluster II, but absent in clusterI; secondly, most species with a narrow distribution werepresent in cluster I.Fifty-five species contributed less than 5% to the cluster
structures and thesewere omitted whenmaking the box-plot.Therefore, the left 69 species contributions were shown inFigure 3. The most contributing species number increasedfrom cluster I to cluster II. Especially, cluster IIa and IIb1were very rich in the most contributing species. The SOMshowed that the centres of the distributions of most specieswere clearly associated with a single cluster.T
able
II.(Con
tinu
ed)
Scientificname
Abb
r.Order
Fam
ily
Occurrence
(%)
Scientificname
Abbr.
Order
Fam
ily
Occurrence
(%)
Schizothorax
(Schizotho
rax)
chon
gi(Fang)
Sch
Cyp
rCyp
rinidae
15.2
Euchiloglan
iskishinou
yeiKim
ura
Eki
Silu
Sisoridae
56.5
Schizothorax
(Schizotho
rax)
grah
ami
(Regan)
Sgr
Cyp
rCyp
rinidae
19.6
Euchiloglan
isda
vidi
(Sauvage)
Eda
Silu
Sisoridae
58.7
Schizothorax
(Schizotho
rax)
cryptolepisFuet
Ye
Scr
Cyp
rCyp
rinidae
2.2
Pareuchilog
lanissinensis
(Hora
etSilas)
Psh
Silu
Sisoridae
21.7
Schizothorax
(Racom
a)heterochilus
Yeet
Fu
She
Cyp
rCyp
rinidae
4.3
Pareuchilog
lanisan
tean
alisFang,
Xuet
Cui
Pan
Silu
Sisoridae
15.2
Schizothorax
(Racom
a)kozlovi
Nikolsky
Sko
Cyp
rCyp
rinidae
17.4
Pareuchilog
lanissichua
nensisDing,
Fuet
Ye
Psd
Silu
Sisoridae
4.3
Schizothorax
(Racom
a)long
ibarbus
(Fang)
Sro
Cyp
rCyp
rinidae
4.3
Pareuchilog
lanisrobustaDing,
Fuet
Ye
Pro
Silu
Sisoridae
4.3
Schizothorax
(Racom
a)pa
rvus
Tsao
Spa
Cyp
rCyp
rinidae
2.2
Rhino
gobius
szechu
anensis(Liu)
Rsz
Perc
Gob
iidae
8.7
Schizothorax
(Racom
a)yunn
anensis
weinigensis
Chen
Syu
Cyp
rCyp
rinidae
2.2
Rhino
gobius
chengtuensis(Chang
)Rch
Perc
Gob
iidae
8.7
Abb
r."Abb
reviation;
Order:Acip"Acipenseriformes,Cyp
r"Cyp
riniform
es,Silu"Siluriformes,Perc"Perciform
es.
Copyright # 2009 John Wiley & Sons, Ltd. River. Res. Applic. (2009)
DOI: 10.1002/rra
Y. HE ET AL.
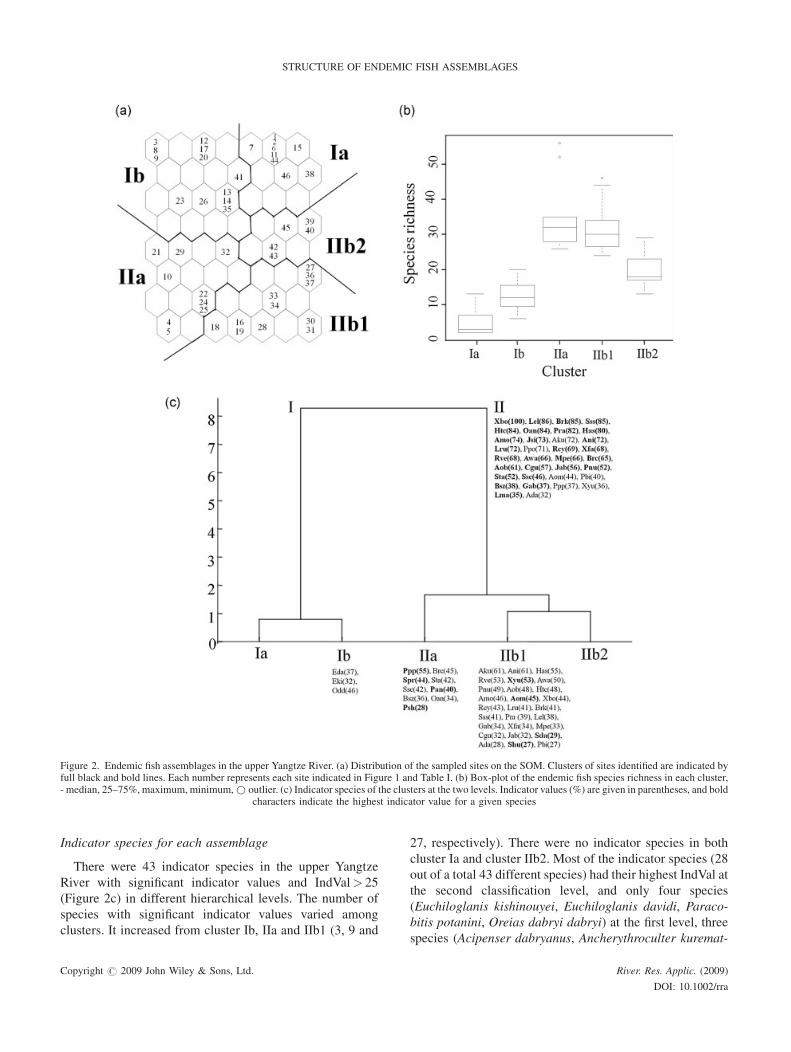
Indicator species for each assemblage
There were 43 indicator species in the upper YangtzeRiver with significant indicator values and IndVal> 25(Figure 2c) in different hierarchical levels. The number ofspecies with significant indicator values varied amongclusters. It increased from cluster Ib, IIa and IIb1 (3, 9 and
27, respectively). There were no indicator species in bothcluster Ia and cluster IIb2. Most of the indicator species (28out of a total 43 different species) had their highest IndVal atthe second classification level, and only four species(Euchiloglanis kishinouyei, Euchiloglanis davidi, Paraco-bitis potanini, Oreias dabryi dabryi) at the first level, threespecies (Acipenser dabryanus, Ancherythroculter kuremat-
Figure 2. Endemic fish assemblages in the upper Yangtze River. (a) Distribution of the sampled sites on the SOM. Clusters of sites identified are indicated byfull black and bold lines. Each number represents each site indicated in Figure 1 and Table I. (b) Box-plot of the endemic fish species richness in each cluster,- median, 25–75%, maximum, minimum,* outlier. (c) Indicator species of the clusters at the two levels. Indicator values (%) are given in parentheses, and bold
characters indicate the highest indicator value for a given species
Copyright # 2009 John Wiley & Sons, Ltd. River. Res. Applic. (2009)
DOI: 10.1002/rra
STRUCTURE OF ENDEMIC FISH ASSEMBLAGES
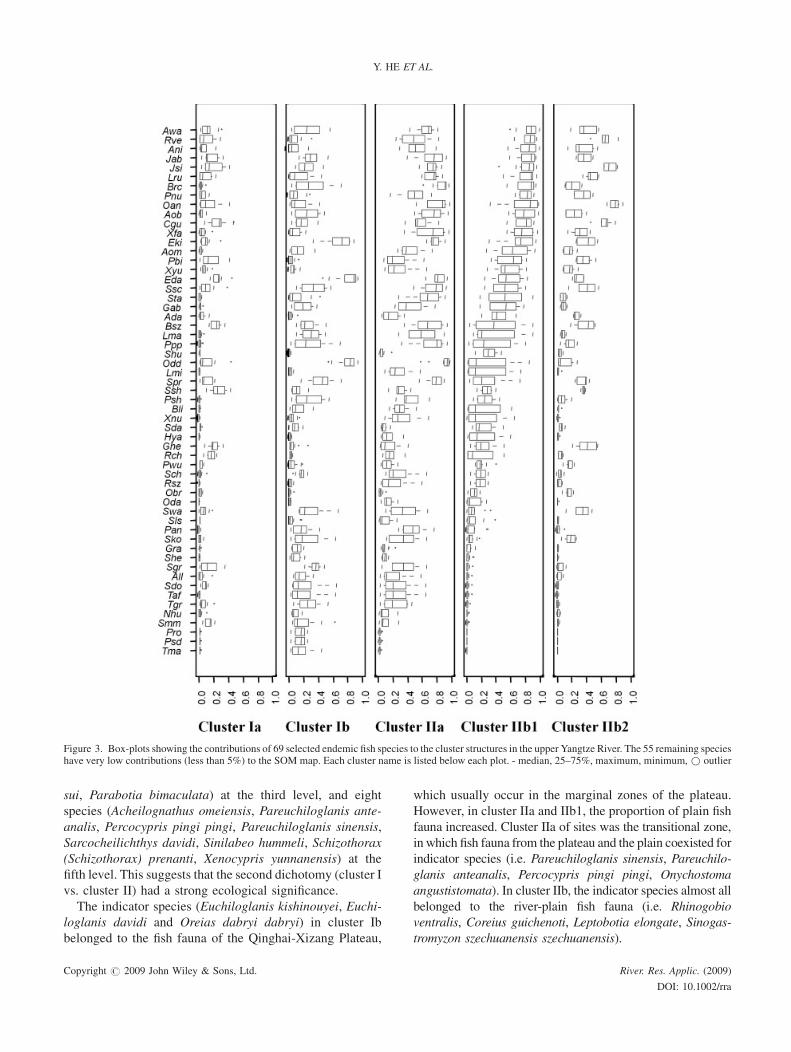
sui, Parabotia bimaculata) at the third level, and eightspecies (Acheilognathus omeiensis, Pareuchiloglanis ante-analis, Percocypris pingi pingi, Pareuchiloglanis sinensis,Sarcocheilichthys davidi, Sinilabeo hummeli, Schizothorax(Schizothorax) prenanti, Xenocypris yunnanensis) at thefifth level. This suggests that the second dichotomy (cluster Ivs. cluster II) had a strong ecological significance.The indicator species (Euchiloglanis kishinouyei, Euchi-
loglanis davidi and Oreias dabryi dabryi) in cluster Ibbelonged to the fish fauna of the Qinghai-Xizang Plateau,
which usually occur in the marginal zones of the plateau.However, in cluster IIa and IIb1, the proportion of plain fishfauna increased. Cluster IIa of sites was the transitional zone,in which fish fauna from the plateau and the plain coexisted forindicator species (i.e. Pareuchiloglanis sinensis, Pareuchilo-glanis anteanalis, Percocypris pingi pingi, Onychostomaangustistomata). In cluster IIb, the indicator species almost allbelonged to the river-plain fish fauna (i.e. Rhinogobioventralis, Coreius guichenoti, Leptobotia elongate, Sinogas-tromyzon szechuanensis szechuanensis).
Figure 3. Box-plots showing the contributions of 69 selected endemic fish species to the cluster structures in the upper Yangtze River. The 55 remaining specieshave very low contributions (less than 5%) to the SOM map. Each cluster name is listed below each plot. - median, 25–75%, maximum, minimum, * outlier
Copyright # 2009 John Wiley & Sons, Ltd. River. Res. Applic. (2009)
DOI: 10.1002/rra
Y. HE ET AL.
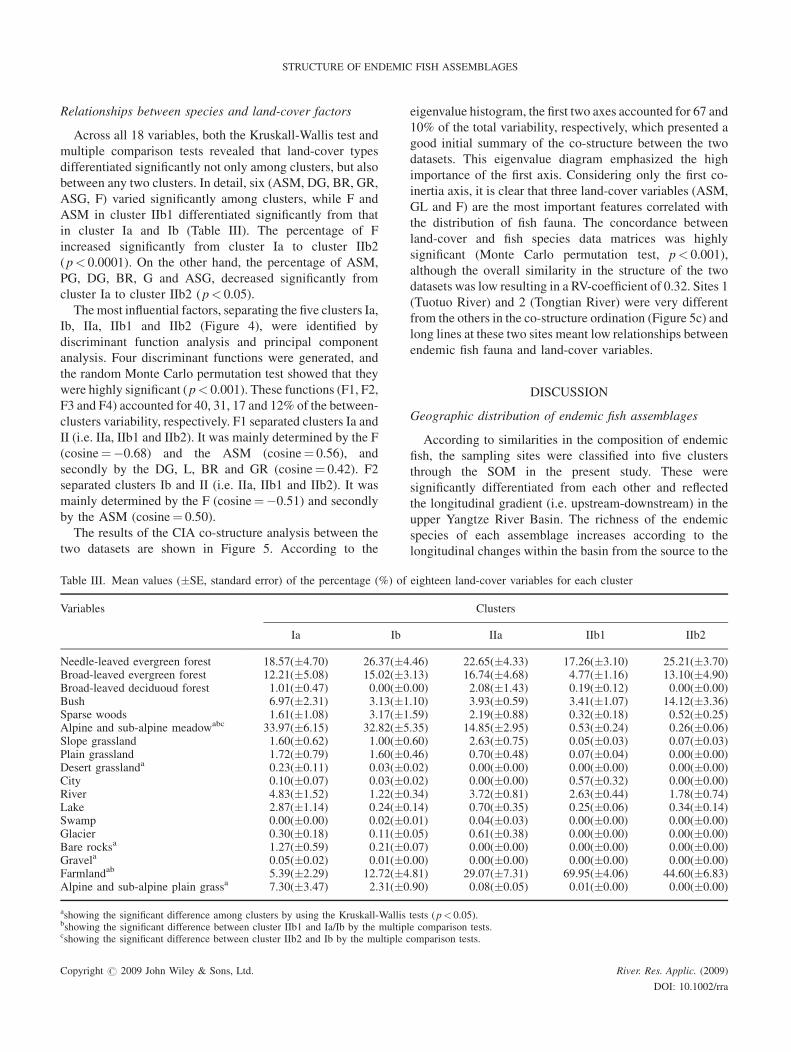
Relationships between species and land-cover factors
Across all 18 variables, both the Kruskall-Wallis test andmultiple comparison tests revealed that land-cover typesdifferentiated significantly not only among clusters, but alsobetween any two clusters. In detail, six (ASM, DG, BR, GR,ASG, F) varied significantly among clusters, while F andASM in cluster IIb1 differentiated significantly from thatin cluster Ia and Ib (Table III). The percentage of Fincreased significantly from cluster Ia to cluster IIb2(p< 0.0001). On the other hand, the percentage of ASM,PG, DG, BR, G and ASG, decreased significantly fromcluster Ia to cluster IIb2 (p< 0.05).
Themost influential factors, separating the five clusters Ia,Ib, IIa, IIb1 and IIb2 (Figure 4), were identified bydiscriminant function analysis and principal componentanalysis. Four discriminant functions were generated, andthe random Monte Carlo permutation test showed that theywere highly significant (p< 0.001). These functions (F1, F2,F3 and F4) accounted for 40, 31, 17 and 12% of the between-clusters variability, respectively. F1 separated clusters Ia andII (i.e. IIa, IIb1 and IIb2). It was mainly determined by the F(cosine"#0.68) and the ASM (cosine" 0.56), andsecondly by the DG, L, BR and GR (cosine" 0.42). F2separated clusters Ib and II (i.e. IIa, IIb1 and IIb2). It wasmainly determined by the F (cosine"#0.51) and secondlyby the ASM (cosine" 0.50).
The results of the CIA co-structure analysis between thetwo datasets are shown in Figure 5. According to the
eigenvalue histogram, the first two axes accounted for 67 and10% of the total variability, respectively, which presented agood initial summary of the co-structure between the twodatasets. This eigenvalue diagram emphasized the highimportance of the first axis. Considering only the first co-inertia axis, it is clear that three land-cover variables (ASM,GL and F) are the most important features correlated withthe distribution of fish fauna. The concordance betweenland-cover and fish species data matrices was highlysignificant (Monte Carlo permutation test, p< 0.001),although the overall similarity in the structure of the twodatasets was low resulting in a RV-coefficient of 0.32. Sites 1(Tuotuo River) and 2 (Tongtian River) were very differentfrom the others in the co-structure ordination (Figure 5c) andlong lines at these two sites meant low relationships betweenendemic fish fauna and land-cover variables.
DISCUSSION
Geographic distribution of endemic fish assemblages
According to similarities in the composition of endemicfish, the sampling sites were classified into five clustersthrough the SOM in the present study. These weresignificantly differentiated from each other and reflectedthe longitudinal gradient (i.e. upstream-downstream) in theupper Yangtze River Basin. The richness of the endemicspecies of each assemblage increases according to thelongitudinal changes within the basin from the source to the
Table III. Mean values ($SE, standard error) of the percentage (%) of eighteen land-cover variables for each cluster
Variables Clusters
Ia Ib IIa IIb1 IIb2
Needle-leaved evergreen forest 18.57($4.70) 26.37($4.46) 22.65($4.33) 17.26($3.10) 25.21($3.70)Broad-leaved evergreen forest 12.21($5.08) 15.02($3.13) 16.74($4.68) 4.77($1.16) 13.10($4.90)Broad-leaved deciduoud forest 1.01($0.47) 0.00($0.00) 2.08($1.43) 0.19($0.12) 0.00($0.00)Bush 6.97($2.31) 3.13($1.10) 3.93($0.59) 3.41($1.07) 14.12($3.36)Sparse woods 1.61($1.08) 3.17($1.59) 2.19($0.88) 0.32($0.18) 0.52($0.25)Alpine and sub-alpine meadowabc 33.97($6.15) 32.82($5.35) 14.85($2.95) 0.53($0.24) 0.26($0.06)Slope grassland 1.60($0.62) 1.00($0.60) 2.63($0.75) 0.05($0.03) 0.07($0.03)Plain grassland 1.72($0.79) 1.60($0.46) 0.70($0.48) 0.07($0.04) 0.00($0.00)Desert grasslanda 0.23($0.11) 0.03($0.02) 0.00($0.00) 0.00($0.00) 0.00($0.00)City 0.10($0.07) 0.03($0.02) 0.00($0.00) 0.57($0.32) 0.00($0.00)River 4.83($1.52) 1.22($0.34) 3.72($0.81) 2.63($0.44) 1.78($0.74)Lake 2.87($1.14) 0.24($0.14) 0.70($0.35) 0.25($0.06) 0.34($0.14)Swamp 0.00($0.00) 0.02($0.01) 0.04($0.03) 0.00($0.00) 0.00($0.00)Glacier 0.30($0.18) 0.11($0.05) 0.61($0.38) 0.00($0.00) 0.00($0.00)Bare rocksa 1.27($0.59) 0.21($0.07) 0.00($0.00) 0.00($0.00) 0.00($0.00)Gravela 0.05($0.02) 0.01($0.00) 0.00($0.00) 0.00($0.00) 0.00($0.00)Farmlandab 5.39($2.29) 12.72($4.81) 29.07($7.31) 69.95($4.06) 44.60($6.83)Alpine and sub-alpine plain grassa 7.30($3.47) 2.31($0.90) 0.08($0.05) 0.01($0.00) 0.00($0.00)
ashowing the significant difference among clusters by using the Kruskall-Wallis tests (p< 0.05).bshowing the significant difference between cluster IIb1 and Ia/Ib by the multiple comparison tests.cshowing the significant difference between cluster IIb2 and Ib by the multiple comparison tests.
Copyright # 2009 John Wiley & Sons, Ltd. River. Res. Applic. (2009)
DOI: 10.1002/rra
STRUCTURE OF ENDEMIC FISH ASSEMBLAGES
river mouth. In addition, fish assemblages are also closelycorrelated with the topography and geomorphology of theYangtze River. The Yangtze River lies across the three largetopographic platforms of the Chinese mainland and theupper Yangtze River crosses the first and second platform.Along with the typical monsoon climate, the upper YangtzeRiver traverses the varied different geologic structures andterrain, and is then divided into three topographic types(Hydrology Bureau of Changjiang Water ResourcesCommittee, 2003). The headwaters of the Yangtze River,including the Tuotuo River and the Tongtian River, flowthrough the first topographic platform in the central part ofthe Qinghai-Xizang plateau and are characterized by thewide valley and the highest altitude (above 3500m). TheHengduan Mountains Region on the marginal areas ofthe Qinghai-Xizang Plateau, including the upper reaches ofthe Jinsha River and its tributaries the Yalong River and theMinjiang River, is the transitional section from the firsttopographic platform to the second one. The rivers in thisregion flow through incised valleys, with high-middlealtitude (from about 2000 to 3500m), steep slopes and rapidflows. The Tiger-Leaping-Gorge of the Jinsha River is animportant boundary of the Qinghai-Xizang Plateau FishFauna in the Yangtze River (Wu and Tan, 1991). Chuanjiang,along with its tributaries the Tuojiang, Jialing, Chishui andWujiang Rivers, flows through the Sichuan Basin into thesecond topographic platform and is characterized by broadrivers and low altitude.The five endemic fish assemblages in the upper Yangtze
River are closely related to the topographic characteristics.
Cluster Ia mainly corresponds to the first topographicplatform, cluster Ib and IIa correspond to the transitionalsection from the first topographic platform to the secondone; cluster IIb1 and IIb2 correspond to the secondtopographic platform.Cluster Ia is mainly composed of the headwaters of the
Yangtze River and of several lakes. The headwaters ofYangtze River are mainly covered by large areas of glacier,frozen ground, alpine meadow and grassland. Because of thehigh altitude, low temperature and poor nutrition, lessaquatic organisms and fish species are found in this area. Thelakes in this cluster are affiliated with the Yangtze River, andcharacterized by high altitude, steep lakeshores and a smallwater area, but high depth. Most fish species in theheadwaters of the Yangtze River or those in the lakes arestenochoric, usually only one species occurs at one site.Therefore, no indicator species were identified in thiscluster.Cluster Ib is mainly composed of the upper parts of the
Jinsha River and the upstream of several tributaries locatedin the Qinghai-Xizang and Yunnan-Guizhou Plateaus andtheir marginal areas (Wu and Wu, 1992). This group ischaracterized by high altitude, steep slopes and rapid waters.Fish species are highly adapted to these kinds ofenvironments, and are biologically characterized by astrong-swimming body and sticky eggs. Most of them areGlyptosternoid, Schizothoracid and Triplophysa fishes,which belong to Qinghai-Xizang Plateau Fish Fauna (Wuand Tan, 1991). Only three indicator species were revealedin this cluster, and Euchiloglanis davidi was deemed as the
Figure 4. DA. a) Axis 1 accounts for 40% and axis 2 for 31% of between-cluster variability, respectively. Each cluster is presented as ellipsoid with differentnumbers in the centre (1, Cluster Ia; 2, Cluster Ib; 3, Cluster IIa; 4, Cluster IIb1; 5, Cluster IIb2). b) Circles showing the contribution of the land-cover variables
to F1 and F2. c) Histogram showing eigenvalues of the DA
Copyright # 2009 John Wiley & Sons, Ltd. River. Res. Applic. (2009)
DOI: 10.1002/rra
Y. HE ET AL.

principal indicator species. It belongs to the Sisoridae, andusually lives in the tributaries and mountain streams withtorrential flows and gravel riverbeds. These glyptosternoidfishes adapt highly to the habitats of this cluster, which occuralong the uplifting of the Qinghai-Xizang Plateau (Wu andTan, 1991; Chen et al., 1996).
Cluster IIa includes mainly the lower parts of the JinshaRiver and the middle-stream and downstream of severaltributaries. With high-middle altitude and rapid flows, it ismainly located at the edge of the Sichuan Basin. Comparedwith other clusters in the present study, the richness of theendemic fish species in cluster IIa is relatively high. Both theQinghai-Xizang Plateau and the river-plain fish faunacoexisted in this cluster (Chen et al., 1986). Nine indicatorspecies were found in this cluster with the two principalindicator species (Percocypris pingi pingi and Schizothorax(Schizothorax) prenanti) being represented. Percocyprispingi pingi belongs to the Barbinae, and is a kind ofcoldwater and savage fish. Schizothoracid fish are the mainrepresentatives of the Qinghai-Xizang Plateau fish fauna,whose origin, evolution and distribution are related to theuplifting of Qinghai-Xizang Plateau (Wu and Tan, 1991).Schizothoracid fish at different specialization levels adapt todifferent levels of altitude. Among them, Schizothorax(Schizothorax) prenanti distributes widely in the rivers withlower altitude; for instance, the downstream of the JinshaRiver, the upper and middle stream of the Minjiang River,
Chuanjiang and the downstream of the Wujiang River. Itmainly feeds on periphytic algae and usually lives in thesault flexural reach of mountainous rivers (Wu and Tan,1991). Overall, this cluster is characterized by the minglingof two different fish faunas, and is dominated by fishadaptive to low water temperatures and rapid flows.
Cluster Ib and IIa are transitional zones between theplateau and basin, whereas cluster IIb1 goes directly into thecentre of the Sichuan Basin. Minjiang River, Tuojiang River,Jialing River, Chishui River and other tributaries flowthrough the Sichuan Basin and pour into the main channel inthis region (Hydrology Bureau of Changjiang WaterResources Committee, 2003). This cluster is characterizedby complicated water systems, multiple river regimes (i.e.rapid and slow waters coexisting, and shoals and deep poolscoexisting), weak slopes and low altitude, which exhibit thehigh heterogeneous habitats of the fish. The richness of theendemic species of cluster IIb1 varies from 24 to 46 and isrelatively high for the basin. The fishes in this cluster mainlybelong to the river-plain fish fauna, but scarcely distribute inthe edge of the Sichuan Basin and Qinghai-Xizang Plateau(Chen et al., 1986). The indicator species in cluster IIb1 (27species) are the most abundant, and the principal indicatorspecies are Rhinogobio ventralis, Procypris rabaudi,Coreius guichenoti, Leptobotia elongate, Ancherythroculternigrocauda and Hemiculterella sauvagei. Because of thecomplex habitats, fish life history and habits also reflect the
Figure 5. Results of Co-inertia analysis processed on the fish-environmental data matrices. a) Canonical weights of each species. b) Canonical weights of eachland-cover variable. c) Relationships between fish species distribution and land-cover variables at each site (the number in each pane is presented as each siteindicated in Figure 1 and Table I). Points and arrows represent the projected co-ordinates of each dataset, and these are joined by a line, where the length of the
line is proportional to the divergence between two datasets. d) Histogram of eigenvalues
Copyright # 2009 John Wiley & Sons, Ltd. River. Res. Applic. (2009)
DOI: 10.1002/rra
STRUCTURE OF ENDEMIC FISH ASSEMBLAGES
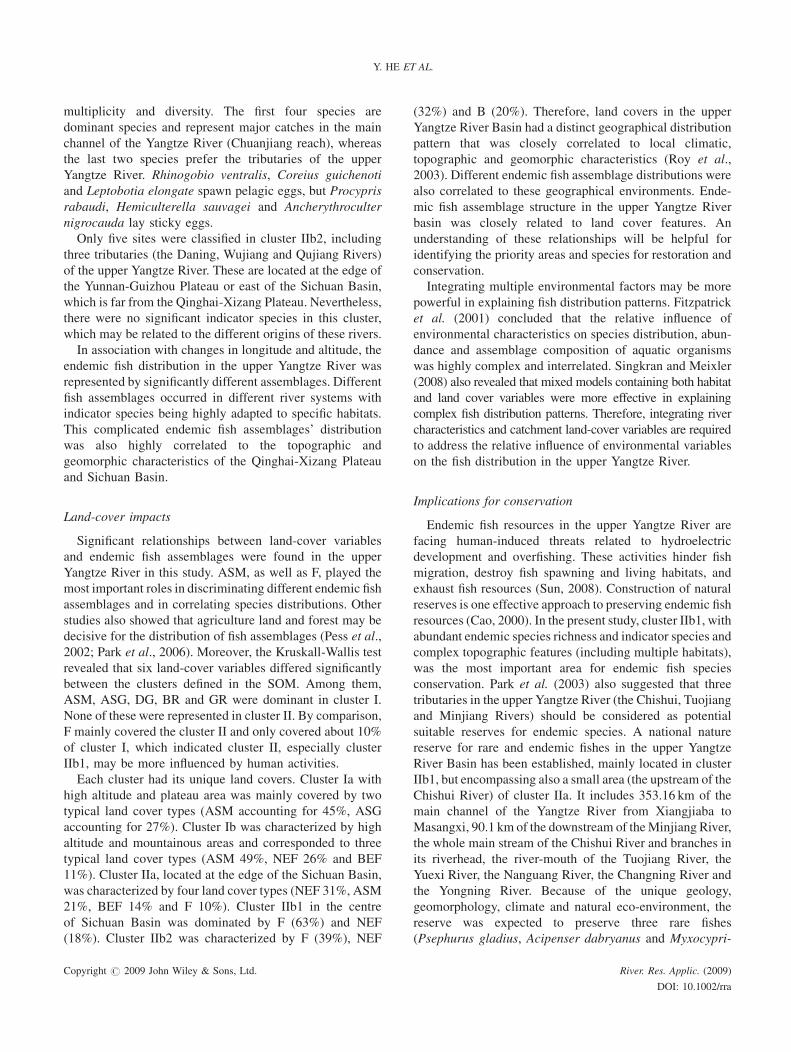
multiplicity and diversity. The first four species aredominant species and represent major catches in the mainchannel of the Yangtze River (Chuanjiang reach), whereasthe last two species prefer the tributaries of the upperYangtze River. Rhinogobio ventralis, Coreius guichenotiand Leptobotia elongate spawn pelagic eggs, but Procyprisrabaudi, Hemiculterella sauvagei and Ancherythroculternigrocauda lay sticky eggs.Only five sites were classified in cluster IIb2, including
three tributaries (the Daning, Wujiang and Qujiang Rivers)of the upper Yangtze River. These are located at the edge ofthe Yunnan-Guizhou Plateau or east of the Sichuan Basin,which is far from the Qinghai-Xizang Plateau. Nevertheless,there were no significant indicator species in this cluster,which may be related to the different origins of these rivers.In association with changes in longitude and altitude, the
endemic fish distribution in the upper Yangtze River wasrepresented by significantly different assemblages. Differentfish assemblages occurred in different river systems withindicator species being highly adapted to specific habitats.This complicated endemic fish assemblages’ distributionwas also highly correlated to the topographic andgeomorphic characteristics of the Qinghai-Xizang Plateauand Sichuan Basin.
Land-cover impacts
Significant relationships between land-cover variablesand endemic fish assemblages were found in the upperYangtze River in this study. ASM, as well as F, played themost important roles in discriminating different endemic fishassemblages and in correlating species distributions. Otherstudies also showed that agriculture land and forest may bedecisive for the distribution of fish assemblages (Pess et al.,2002; Park et al., 2006). Moreover, the Kruskall-Wallis testrevealed that six land-cover variables differed significantlybetween the clusters defined in the SOM. Among them,ASM, ASG, DG, BR and GR were dominant in cluster I.None of these were represented in cluster II. By comparison,F mainly covered the cluster II and only covered about 10%of cluster I, which indicated cluster II, especially clusterIIb1, may be more influenced by human activities.Each cluster had its unique land covers. Cluster Ia with
high altitude and plateau area was mainly covered by twotypical land cover types (ASM accounting for 45%, ASGaccounting for 27%). Cluster Ib was characterized by highaltitude and mountainous areas and corresponded to threetypical land cover types (ASM 49%, NEF 26% and BEF11%). Cluster IIa, located at the edge of the Sichuan Basin,was characterized by four land cover types (NEF 31%, ASM21%, BEF 14% and F 10%). Cluster IIb1 in the centreof Sichuan Basin was dominated by F (63%) and NEF(18%). Cluster IIb2 was characterized by F (39%), NEF
(32%) and B (20%). Therefore, land covers in the upperYangtze River Basin had a distinct geographical distributionpattern that was closely correlated to local climatic,topographic and geomorphic characteristics (Roy et al.,2003). Different endemic fish assemblage distributions werealso correlated to these geographical environments. Ende-mic fish assemblage structure in the upper Yangtze Riverbasin was closely related to land cover features. Anunderstanding of these relationships will be helpful foridentifying the priority areas and species for restoration andconservation.Integrating multiple environmental factors may be more
powerful in explaining fish distribution patterns. Fitzpatricket al. (2001) concluded that the relative influence ofenvironmental characteristics on species distribution, abun-dance and assemblage composition of aquatic organismswas highly complex and interrelated. Singkran and Meixler(2008) also revealed that mixed models containing both habitatand land cover variables were more effective in explainingcomplex fish distribution patterns. Therefore, integrating rivercharacteristics and catchment land-cover variables are requiredto address the relative influence of environmental variableson the fish distribution in the upper Yangtze River.
Implications for conservation
Endemic fish resources in the upper Yangtze River arefacing human-induced threats related to hydroelectricdevelopment and overfishing. These activities hinder fishmigration, destroy fish spawning and living habitats, andexhaust fish resources (Sun, 2008). Construction of naturalreserves is one effective approach to preserving endemic fishresources (Cao, 2000). In the present study, cluster IIb1, withabundant endemic species richness and indicator species andcomplex topographic features (including multiple habitats),was the most important area for endemic fish speciesconservation. Park et al. (2003) also suggested that threetributaries in the upper Yangtze River (the Chishui, Tuojiangand Minjiang Rivers) should be considered as potentialsuitable reserves for endemic species. A national naturereserve for rare and endemic fishes in the upper YangtzeRiver Basin has been established, mainly located in clusterIIb1, but encompassing also a small area (the upstream of theChishui River) of cluster IIa. It includes 353.16 km of themain channel of the Yangtze River from Xiangjiaba toMasangxi, 90.1 km of the downstream of theMinjiang River,the whole main stream of the Chishui River and branches inits riverhead, the river-mouth of the Tuojiang River, theYuexi River, the Nanguang River, the Changning River andthe Yongning River. Because of the unique geology,geomorphology, climate and natural eco-environment, thereserve was expected to preserve three rare fishes(Psephurus gladius, Acipenser dabryanus and Myxocypri-
Copyright # 2009 John Wiley & Sons, Ltd. River. Res. Applic. (2009)
DOI: 10.1002/rra
Y. HE ET AL.
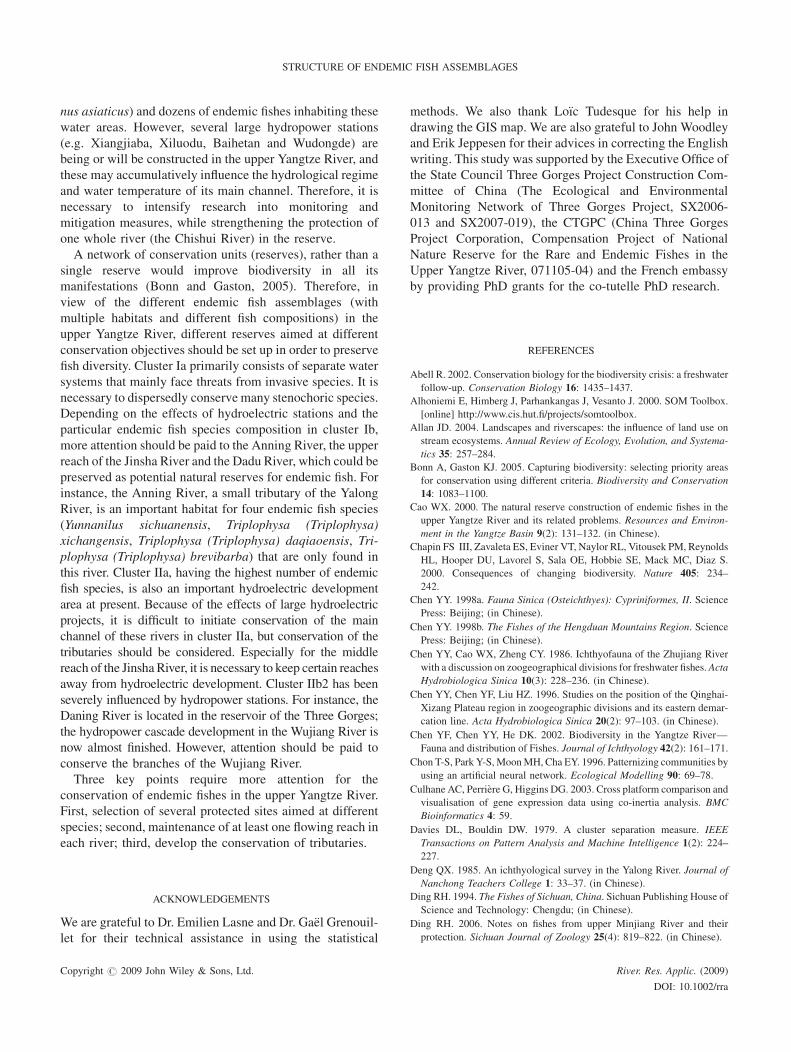
nus asiaticus) and dozens of endemic fishes inhabiting thesewater areas. However, several large hydropower stations(e.g. Xiangjiaba, Xiluodu, Baihetan and Wudongde) arebeing or will be constructed in the upper Yangtze River, andthese may accumulatively influence the hydrological regimeand water temperature of its main channel. Therefore, it isnecessary to intensify research into monitoring andmitigation measures, while strengthening the protection ofone whole river (the Chishui River) in the reserve.
A network of conservation units (reserves), rather than asingle reserve would improve biodiversity in all itsmanifestations (Bonn and Gaston, 2005). Therefore, inview of the different endemic fish assemblages (withmultiple habitats and different fish compositions) in theupper Yangtze River, different reserves aimed at differentconservation objectives should be set up in order to preservefish diversity. Cluster Ia primarily consists of separate watersystems that mainly face threats from invasive species. It isnecessary to dispersedly conserve many stenochoric species.Depending on the effects of hydroelectric stations and theparticular endemic fish species composition in cluster Ib,more attention should be paid to the Anning River, the upperreach of the Jinsha River and the Dadu River, which could bepreserved as potential natural reserves for endemic fish. Forinstance, the Anning River, a small tributary of the YalongRiver, is an important habitat for four endemic fish species(Yunnanilus sichuanensis, Triplophysa (Triplophysa)xichangensis, Triplophysa (Triplophysa) daqiaoensis, Tri-plophysa (Triplophysa) brevibarba) that are only found inthis river. Cluster IIa, having the highest number of endemicfish species, is also an important hydroelectric developmentarea at present. Because of the effects of large hydroelectricprojects, it is difficult to initiate conservation of the mainchannel of these rivers in cluster IIa, but conservation of thetributaries should be considered. Especially for the middlereach of the JinshaRiver, it is necessary to keep certain reachesaway from hydroelectric development. Cluster IIb2 has beenseverely influenced by hydropower stations. For instance, theDaning River is located in the reservoir of the Three Gorges;the hydropower cascade development in the Wujiang River isnow almost finished. However, attention should be paid toconserve the branches of the Wujiang River.
Three key points require more attention for theconservation of endemic fishes in the upper Yangtze River.First, selection of several protected sites aimed at differentspecies; second, maintenance of at least one flowing reach ineach river; third, develop the conservation of tributaries.
ACKNOWLEDGEMENTS
We are grateful to Dr. Emilien Lasne and Dr. Gael Grenouil-let for their technical assistance in using the statistical
methods. We also thank Loıc Tudesque for his help indrawing the GIS map. We are also grateful to John Woodleyand Erik Jeppesen for their advices in correcting the Englishwriting. This study was supported by the Executive Office ofthe State Council Three Gorges Project Construction Com-mittee of China (The Ecological and EnvironmentalMonitoring Network of Three Gorges Project, SX2006-013 and SX2007-019), the CTGPC (China Three GorgesProject Corporation, Compensation Project of NationalNature Reserve for the Rare and Endemic Fishes in theUpper Yangtze River, 071105-04) and the French embassyby providing PhD grants for the co-tutelle PhD research.
REFERENCES
Abell R. 2002. Conservation biology for the biodiversity crisis: a freshwater
follow-up. Conservation Biology 16: 1435–1437.Alhoniemi E, Himberg J, Parhankangas J, Vesanto J. 2000. SOM Toolbox.
[online] http://www.cis.hut.fi/projects/somtoolbox.
Allan JD. 2004. Landscapes and riverscapes: the influence of land use on
stream ecosystems. Annual Review of Ecology, Evolution, and Systema-
tics 35: 257–284.Bonn A, Gaston KJ. 2005. Capturing biodiversity: selecting priority areas
for conservation using different criteria. Biodiversity and Conservation
14: 1083–1100.Cao WX. 2000. The natural reserve construction of endemic fishes in the
upper Yangtze River and its related problems. Resources and Environ-
ment in the Yangtze Basin 9(2): 131–132. (in Chinese).
Chapin FS III, Zavaleta ES, Eviner VT, Naylor RL, Vitousek PM, Reynolds
HL, Hooper DU, Lavorel S, Sala OE, Hobbie SE, Mack MC, Diaz S.2000. Consequences of changing biodiversity. Nature 405: 234–
242.
Chen YY. 1998a. Fauna Sinica (Osteichthyes): Cypriniformes, II. SciencePress: Beijing; (in Chinese).
Chen YY. 1998b. The Fishes of the Hengduan Mountains Region. Science
Press: Beijing; (in Chinese).
Chen YY, Cao WX, Zheng CY. 1986. Ichthyofauna of the Zhujiang River
with a discussion on zoogeographical divisions for freshwater fishes. Acta
Hydrobiologica Sinica 10(3): 228–236. (in Chinese).
Chen YY, Chen YF, Liu HZ. 1996. Studies on the position of the Qinghai-
Xizang Plateau region in zoogeographic divisions and its eastern demar-
cation line. Acta Hydrobiologica Sinica 20(2): 97–103. (in Chinese).
Chen YF, Chen YY, He DK. 2002. Biodiversity in the Yangtze River—
Fauna and distribution of Fishes. Journal of Ichthyology 42(2): 161–171.
Chon T-S, Park Y-S,MoonMH, Cha EY. 1996. Patternizing communities by
using an artificial neural network. Ecological Modelling 90: 69–78.
Culhane AC, Perriere G, Higgins DG. 2003. Cross platform comparison andvisualisation of gene expression data using co-inertia analysis. BMC
Bioinformatics 4: 59.
Davies DL, Bouldin DW. 1979. A cluster separation measure. IEEETransactions on Pattern Analysis and Machine Intelligence 1(2): 224–227.
Deng QX. 1985. An ichthyological survey in the Yalong River. Journal ofNanchong Teachers College 1: 33–37. (in Chinese).
Ding RH. 1994. The Fishes of Sichuan, China. Sichuan Publishing House of
Science and Technology: Chengdu; (in Chinese).
Ding RH. 2006. Notes on fishes from upper Minjiang River and their
protection. Sichuan Journal of Zoology 25(4): 819–822. (in Chinese).
Copyright # 2009 John Wiley & Sons, Ltd. River. Res. Applic. (2009)
DOI: 10.1002/rra
STRUCTURE OF ENDEMIC FISH ASSEMBLAGES
Doledec S, Chessel D. 1994. Co-inertia analysis: an alternative method for
studying species-environment relationships. Freshwater Biology 31:277–294.
Dong ZR. 2003. Diversity of river morphology and diversity of bio-
communities. Journal of Hydraulic Engineering 11: 1–6.Dufrene M, Legendre P. 1997. Species assemblages and indicator species:the need for a more flexible asymmetrical approach. Ecological Mono-
graphs 67: 345–366.EIADCAS and RIPYWR. (The Environmental Impact Assessment Depart-ment, Chinese Academy of Sciences, and the Research Institute for
Protection for Yangtze Water Resources). 1995. Environmental Impact
Statement for the Yangtze Three Gorges Project. Science Press: Beijing.
Fitzpatrick FA, Scudder BC, Lenz BN, Sullivan DJ. 2001. Effects of multi-scale environmental characteristics on agricultural stream biota in eastern
Wisconsin. Journal of the American Water Resources Association 37(6):1489–1507.
Fu CZ, Wu JH, Chen JK, Wu QH, Lei GC. 2003. Freshwater fish biodi-versity in the Yangtze River basin of China: patterns, threats and
conservation. Biodiversity and Conservation 12: 1649–1685.Giraudoux P. 2006. Pgirmess: data analysis in ecology. R package version1.3.8 http://perso.orange.fr/giraudoux/.
Han GL, Liu CQ. 2000. Hydrogeochemistry of Wujiang River water in
Guizhou Province. Carsologica Sinica 19(1): 35–43. (in Chinese).
Hanchet SM. 1990. Effect of land use on the distribution and abundance ofnative fish in tributaries of the Waikato River in the Hakarimata Range,
North Island, New Zealand. New Zealand Journal of Marine and
Freshwater Research 24: 159–171.Hydrology Bureau of ChangjiangWater Resources Committee. 2003.WaterSystem. In Compilation Committee of the Yangtze River Chronicles, eds,
The Yangtze River Chronicles. Volume 1: Review of Rivers. The
Encyclopedia of China Press: Beijing; (in Chinese).Ibarra AA, Gevrey M, Park Y-S, Lim P, Lek S. 2003. Modelling the factors
that influence fish guilds composition using a back-propagation network:
assessment of metrics for indices of biotic integrity. Ecological Model-
ling 160: 281–290.Ibarra AA, Park Y-S, Brosse S, Reyjol Y, Lim P, Lek S. 2005. Nested
patterns of spatial diversity revealed for fish assemblages in a west
European river. Ecology of Freshwater Fish 14: 233–242.Ihaka R, Gentleman R. 1996. R: a language for data analysis and graphics.Journal of Computational and Graphical Statistics 5: 299–314.
Karr JR. 1981. Assessment of biotic integrity using fish communities.
Fisheries 6: 21–27.Kohonen T. 2001. Self-organizing maps. Springer series in informationsciences. Springer: New York; 501.
Konan FK, Leprieur F, Ouattara A, Brosse S, Grenouillet G, Gourene G,
Winterton P, Lek S. 2006. Spatio-temporal patterns of fish assemblages incoastal West African rivers: a self-organizing map approach. Aquatic
Living Resources 19: 361–370.Kruk A, Lek S, Park Y-S, Penczak T. 2007. Fish assemblages in the large
lowland Narew River system (Poland): application of the self-organizingmap algorithm. Ecological Modelling 203: 45–61.
Lasne E, Bergerot B, Lek S, Laffaille P. 2007. Fish zonation and indicator
species for the evaluation of the ecological status of rivers: example of the
Loire basin (France). River Research and Applications 23: 1–14.Lawton JH, May RM. 1995. Extinction Rates. Oxford Univ. Press: Oxford.
MatthewsWJ. 1998. Patterns in freshwater fish ecology. Chapman and Hall:
New York.Myers N, Mittermeier RA, Mittermeier CG, da Fonseca GAB, Kent J. 2000.
Biodiversity hotspots for conservation priorities. Nature 403: 853–858.Nelson JS. 1994. Fishes of the world. Wiley: New York.
Park Y-S, Chon T-S, Kwak IS, Kim J-K, Jørgensen SE. 2001. Implementa-tion of artificial neural networks in patterning and prediction of energy in
response to temporal dynamics of benthic macroinvertebrate commu-
nities in streams. Ecological Modelling 146: 143–157.Park Y-S, Chang JB, Lek S, Cao WX, Brosse S. 2003. Conservation
strategies for endemic fish species threatened by the three Gorges
Dam. Conservation Biology 17(6): 1748–1758.Park Y-S, Grenouillet G, Esperance B, Lek S. 2006. Stream fish assemblagesand basin land cover in a river network. Science of the Total Environment
365: 140–153.Pess GR, Montgomery DR, Steel EA, Bilby RE, Feist BE, Greenberg HM.2002. Landscape characteristics, land use, and coho salmon (Oncor-
hynchus kisutch) abundance, Snohomish River, Wash., U.S.A. Canadian
Journal of Fisheries and Aquatic Sciences 59: 613–623.Pimm SL, Russell GJ, Gittleman JL, Brooks TM. 1995. The future ofbiodiversity. Science 269: 347–350.
Rashleigh B. 2004. Relation of environmental characteristics to fish assem-
blages in the Upper Broad River Basin, North Carolina. Environmental
Monitoring and Assessment 93: 139–156.Robert P, Escoufier Y. 1976. A unifying tool for linear multivariate statistical
methods: the RV-coefficient. Applied Statistics 25: 257–265.Roy AH, Rosemond AD, Paul MJ, Leigh DS, Wallace JB. 2003. Streammacroinvertebrate response to catchment urbanization (Georgia, U.S.A.).
Freshwater Biology 48: 329–346.Saunders DL, Meeuwig JJ, Vincent ACJ. 2002. Freshwater protected areas:
strategies for conservation. Conservation Biology 16: 30–41.Shi BN, He XF, Deng QX. 1984. Distribution of fish in the downstream of
the Wujiang River. Journal of Sichuan Teachers College 5: 50–59. (inChinese).
Singkran N, Meixler MS. 2008. Influences of habitat and land cover on fishdistributions along a tributary to Lake Ontario, New York. Landscape
Ecology 23: 539–551.Sneath PHA, Sokal RR. 1973. Numerical Taxonomy: The Principles andPractice of Numerical Classification. Freeman: San Francisco; 278.
Strayer DL, Beighley RE, Thompson LC, Brooks S, Nilsson C, Pinay G,
Naiman RJ. 2003. Effects of land cover on stream ecosystems: roles of
empirical models and scaling issues. Ecosystems 6: 407–423.Sun HL. 2008. Ecological and environmental problems in the upper Yangtze
River. China Environmental Science Press: Beijing; (in Chinese).
Sutherland AB, Meyer JL, Gardiner EP. 2002. Effects of land cover on
sediment regime and fish assemblage structure in four southern Appa-lachian streams. Freshwater Biology 47: 1791–1805.
The Mathworks Inc. 2001. MATLAB, Version 6.1. The Mathworks, Inc.,
Massachusetts.
Thioulouse J, Chessel D, Doledec S, Olivier JM. 1997. ADE-4: a multi-variate analysis and graphical display software. Statistics and Computing
7: 75–83.Ultsch A. 1993. Self-organizing neural networks for visualization andclassification. In Information and classification, Opitz O, Lausen B,
Klar R (eds). Springer-Verlag: Berlin; 307–313.
Vesanto J. 2000. Neural network tool for data mining: SOM Toolbox.
Proceedings of Symposium on Tool Environments and DevelopmentMethods for Intelligent Systems (TOOLMET2000). Oulun yliopisto-
paino, Oulu, Finland. p 184–196.
Walley WJ, Martin RW, O’Connor MA. 2000. Self-organising maps for the
classification of river quality from biological and environmental data. InEnvironmental software systems: environmental information and decision
support, IFIP Conference Series, Denzer R, Swayne DA, Purvis M,
Schimak G (eds). Kluwer Academic Publishers: Boston; 27–41.Wu YF, Tan QJ. 1991. Characteristics of the fish-fauna of Qinghai-Xizang
Plateau and its geological distribution and formation. Acta Zoologica
Sinica 37(2): 135–152. (in Chinese).
Wu J, Wu MS. 1990. The fish fauna of Jinsha River. Sichuan Journal ofZoology 9(3): 23–26. (in Chinese).
Copyright # 2009 John Wiley & Sons, Ltd. River. Res. Applic. (2009)
DOI: 10.1002/rra
Y. HE ET AL.

Wu YF, Wu CZ. 1992. The Fishes of the Qinghai-Xizang Plateau. Sichuan
Publishing House of Science and Technology: Chengdu; (in Chinese).Wu L, Zheng JZ, Lu KQ, Xie JH, Luo ZQ, Li DJ, Zhao ZF. 1989. The Fishes
of Guizhou. Guizhou People’s Press: Guiyang; (in Chinese).
Ye MR, Fu TY. 1987. The fish species resources of Dadu River in Sichuan
Province. Resources Development and Conservation 3(2): 37–40. (inChinese).
Yu XD, Luo TH, ZhouHZ. 2005. Large-scale patterns in species diversity of
fishes in the Yangtze River Basin. Biodiversity Science 13(6): 473–495.(in Chinese).
Yue PQ. 2000. Fauna Sinica (Osteichthyes): Cypriniformes, III. Science
Press: Beijing; (in Chinese).
Zheng BS, Dai DY. 1999. Fauna Sinica (Osteichthyes): Siluriformes.Science Press: Beijing; (in Chinese).
Copyright # 2009 John Wiley & Sons, Ltd. River. Res. Applic. (2009)
DOI: 10.1002/rra
STRUCTURE OF ENDEMIC FISH ASSEMBLAGES
P2
Predicting assemblages and species richness of endemic fish in the upper
Yangtze River
He Y., Wang J., Lek-Ang S. & Lek S. (2010)
Science of the Total Environment
(Accepted)
Predicting assemblages and species richness of endemic fish
in the upper Yangtze River
Yongfeng He1, 2, 3,*, Jianwei Wang2, Sithan Lek-Ang1, Sovan Lek1
1 Lab. Evolution & Diversité Biologique, UMR 5174, CNRS – Université Toulouse,
118, route de Narbonne, 31062 Toulouse, Cedex 4, France; 2 Institute of
Hydrobiology, Chinese Academy of Sciences, Wuhan, Hubei 430072, China; 3
Graduate University of Chinese Academy of Sciences (GUCAS), Beijing 100039,
China
(*Corresponding author: Phone: +86-27-68780033; Fax: +86-27-68780065; E-mail:
[email protected]; Address: Institute of Hydrobiology, Chinese Academy of
Sciences, 7# Donghu South Road, Wuhan, Hubei 430072, China)
Abstract
The present work describes the ability of two modeling methods, Classification
and Regression Tree (CART) and Random Forest (RF), to predict endemic fish
assemblages and species richness in the upper Yangtze River, and then to identify the
determinant environmental factors contributing to the models. The models included
24 predictor variables and 2 response variables (fish assemblage and species richness)
for a total of 46 site units. The predictive quality of the modeling approaches was
judged with a leave-one-out validation procedure. There was an average success of
60.9% and 71.7% to assign each site unit to the correct assemblage of fish, and 73%
and 84% to explain the variance in species richness, by using CART and RF models,
respectively. RF proved to be better than CART in terms of accuracy and efficiency in
ecological applications. In any case, the mixed models including both land-cover and
river characteristic variables were more powerful than either individual one in
explaining the endemic fish distribution pattern in the upper Yangtze River. For
instance, altitude, slope, length, discharge, runoff, farmland and alpine and sub-alpine
meadow played important roles in driving the observed endemic fish assemblage
structure, while farmland, slope grassland, discharge, runoff, altitude and drainage
area in explaining the observed patterns of endemic species richness. Therefore, the
various effects of human activity on natural aquatic ecosystems, in particular, the flow
modification of the river and the land use changes may have a considerable effect on
the endemic fish distribution patterns on a regional scale.
Keywords: endemic fish, species richness pattern, environmental variables, Yangtze
River, CART, RF
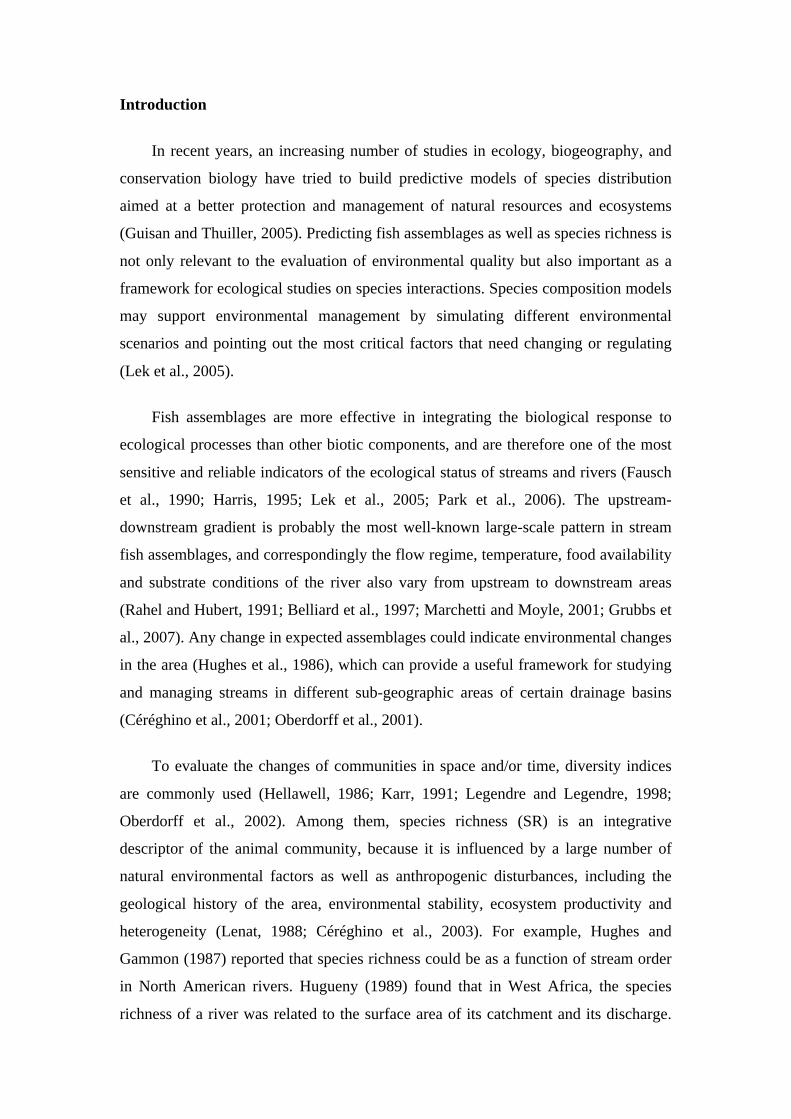
Introduction
In recent years, an increasing number of studies in ecology, biogeography, and
conservation biology have tried to build predictive models of species distribution
aimed at a better protection and management of natural resources and ecosystems
(Guisan and Thuiller, 2005). Predicting fish assemblages as well as species richness is
not only relevant to the evaluation of environmental quality but also important as a
framework for ecological studies on species interactions. Species composition models
may support environmental management by simulating different environmental
scenarios and pointing out the most critical factors that need changing or regulating
(Lek et al., 2005).
Fish assemblages are more effective in integrating the biological response to
ecological processes than other biotic components, and are therefore one of the most
sensitive and reliable indicators of the ecological status of streams and rivers (Fausch
et al., 1990; Harris, 1995; Lek et al., 2005; Park et al., 2006). The upstream-
downstream gradient is probably the most well-known large-scale pattern in stream
fish assemblages, and correspondingly the flow regime, temperature, food availability
and substrate conditions of the river also vary from upstream to downstream areas
(Rahel and Hubert, 1991; Belliard et al., 1997; Marchetti and Moyle, 2001; Grubbs et
al., 2007). Any change in expected assemblages could indicate environmental changes
in the area (Hughes et al., 1986), which can provide a useful framework for studying
and managing streams in different sub-geographic areas of certain drainage basins
(Céréghino et al., 2001; Oberdorff et al., 2001).
To evaluate the changes of communities in space and/or time, diversity indices
are commonly used (Hellawell, 1986; Karr, 1991; Legendre and Legendre, 1998;
Oberdorff et al., 2002). Among them, species richness (SR) is an integrative
descriptor of the animal community, because it is influenced by a large number of
natural environmental factors as well as anthropogenic disturbances, including the
geological history of the area, environmental stability, ecosystem productivity and
heterogeneity (Lenat, 1988; Céréghino et al., 2003). For example, Hughes and
Gammon (1987) reported that species richness could be as a function of stream order
in North American rivers. Hugueny (1989) found that in West Africa, the species
richness of a river was related to the surface area of its catchment and its discharge.
Therefore, species richness is commonly used as an ecological indicator for
ecosystem assessments.
In recent years, considerable attention has been given to the development of
modeling techniques for exploring data sets. These either overcome the parametric
assumption or identify non-linear relationships between the data (Breiman et al., 1984;
Hastie and Tibshirani, 1986; Rumelhart and McClelland, 1986; Breiman, 2001).
Among all the modeling techniques, Classification and Regression Tree (CART), and
Random Forest (RF) were chosen in the present study. CART, known as recursive
partitioning regression, has received more recent attention through Breiman et al.
(1984). RF, showing performance at the level of boosting and support vector
machines, is one of the most successful ensemble methods and an effective tool in
prediction. Recently, both of them have been successfully applied in many fields
including ecology, bio-informatics, genetics and earth science (remote sensing)
(Moisen and Frescino, 2002; Chen and Liu, 2005; Dolan and Parker, 2005; Pal, 2005;
Barker et al., 2006; Cutler et al., 2007; De'ath, 2007; Peters et al., 2007; Elith et al.,
2008; Perdiguero-Alonso et al., 2008).
The Yangtze River is the third largest river in the world, the upper reaches of
which have been marked as an eco-functional barrier and a key area for ecological
restoration (Sun, 2008). Because of its complicated natural environment giving high
diversity of fish habitats, together with a well-developed drainage system and
abundant water resources, the upper Yangtze River supports the richness of
freshwater fish species in the palearctic zone (Nelson, 2006; Sun, 2008). However,
the upper Yangtze River is also the area very impacted by the high density of the
human population that exerts considerable pressure on the environment, e.g. intensive
agricultural practices, excess hydroelectric development, developed industry, and
abundant mineral resources (Chen, 2000; Tian, 2004; Sun, 2008).
In a previous study, five endemic fish community assemblages across the upper
Yangtze River network were defined by a self-organizing map (SOM) model (He et
al., in press). They reflected not only the longitudinal gradient (i.e. upstream-
downstream), but also the topographic and geomorphologic characteristics of the
Yangtze River. The endemic fish distribution pattern was also correlated with land
cover features of the catchment area. However, several studies have shown that a
mixed model containing both fish habitat and land cover variables may be more
effective than any individual model in explaining some of the complex fish
distribution patterns (Fitzpatrick et al., 2001; Singkran and Meixler, 2008). Therefore,
in order to have a better understanding of endemic fish distribution pattern in the
upper Yangtze River, both land-cover and characteristic river variables were
integrated into the modeling in the present study.
In this paper, the capacity of machine learning methods (i.e., CART and RF) to
predict the assemblages types and species richness of endemic fish in the upper
Yangtze River was examined by using 24 environmental variables. In addition, the
present study also aimed to identify the importance of these predictive variables on
the spatial distribution patterns of endemic fish in the models, with a view to their
preservation in the upper Yangtze River.
Material and Methods
Study area
The Upper Yangtze River from its headwaters to Yichang City in Hubei
Province has a total length of 4 500 km, and a catchment area of 1.0×10⁶ km2. Forty-
six site units were encompassed. A site unit here represents one lake or one river or
even one reach of a river (Table 1), and the specific details are shown in He et al. (in
press).
Response variables
In the present study, fish assemblages and species richness (SR) were considered
as two response variables. According to the presence-absence distribution data of 124
endemic fish in the upper Yangtze River basin, five assemblages (Ia, Ib, IIa, IIb1, IIb2)
were defined by He et al. (in press). They were composed of 12, 9, 9, 11 and 5 sites,
respectively. These assemblages varied significantly in terms of individual species
patterns (Table 2, Table 3). The species richness per site unit was also calculated from
the presence-absence distribution data of 124 endemic fish in the upper Yangtze River
basin. Species richness was log (SR+1) transformed before being used in the model,
as its distribution was far from the norm.

Predictor variables
At each site unit, 24 environmental variables were recorded as predictors.
Predictor variables were extracted from several sources: firstly, 18 land-cover classes
from the China Land Cover map through the Geographical Information System (GIS);
secondly, 6 characteristic river variables including hydrologic data (discharge, runoff)
and topographic data (length, drainage area, altitude, slope) from maps and
bibliographies including monographs (Agricultural Regionalization Committee of
Sichuan Province, 1991; Ding, 1994; Hydrology Bureau of Changjiang Water
Resources Committee, 2003) and investigation papers (Shan, 1996; Hui et al., 2000;
Huang, 2003; Luo and Liu, 2003; Fang et al., 2004; Tang et al., 2004; Guo, 2005;
Wang et al., 2005; Liu and Shen, 2006; Zhou et al., 2006; Zhang et al., 2007). A list
of the predictor variables and their descriptions is provided in Table 4.
Table 1. Sampling site units information in the upper Yangtze River basin.
Sampling site Abbreviation Sampling site Abbreviation Tuotuo River TT The Middle-stream of Qingyi River QYM Tongtian River TO The Downstream of Qingyi River QYD The Upstream of Jinsha River JSU The Upstream of Tuojiang River TJU The Middle-stream of Jinsha River JSM The Middle-stream of Tuojiang River TJM The Downstream of Jinsha River JSL The Downstream of Tuojiang River TJD Chenghai CH The Upstream of Chishui River CSU Dianchi DC The Middle-stream of Chishui River CSM The Upstream of Yalong River YLU The Downstream of Chishui River CSD The Middle-stream of Yalong River YLM The Upstream of Jialing River JLU The Downstream of Yalong River YLD The Middle-stream of Jialing River JLM Lugu Lake LG The Downstream of Jialing River JLD The Upstream of Anning River ANU The Upstream of Fujiang River FJU The Middle-stream of Anning River ANM The Middle-stream of Fujiang River FJM The Downstream of Anning River AND The Downstream of Fujiang River FJD Qionghai QH The Upstream of Qujiang River QJU Chuanjiang CJ The Middle-stream of Qujiang River QJM The Upstream of Minjiang River MJU The Downstream of Qujiang River QJD The Middle-stream of Minjiang River MJM The Upstream of Wujiang River WJU The Downstream of Minjiang River MJD The Middle-stream of Wujiang River WJM The Upstream of Dadu River DDU The Downstream of Wujiang River WJD The Middle-stream of Dadu River DDM Caohai CH The Downstream of Dadu River DDD Daning River DN The Upstream of Qingyi River QYU Xiangxi River XX
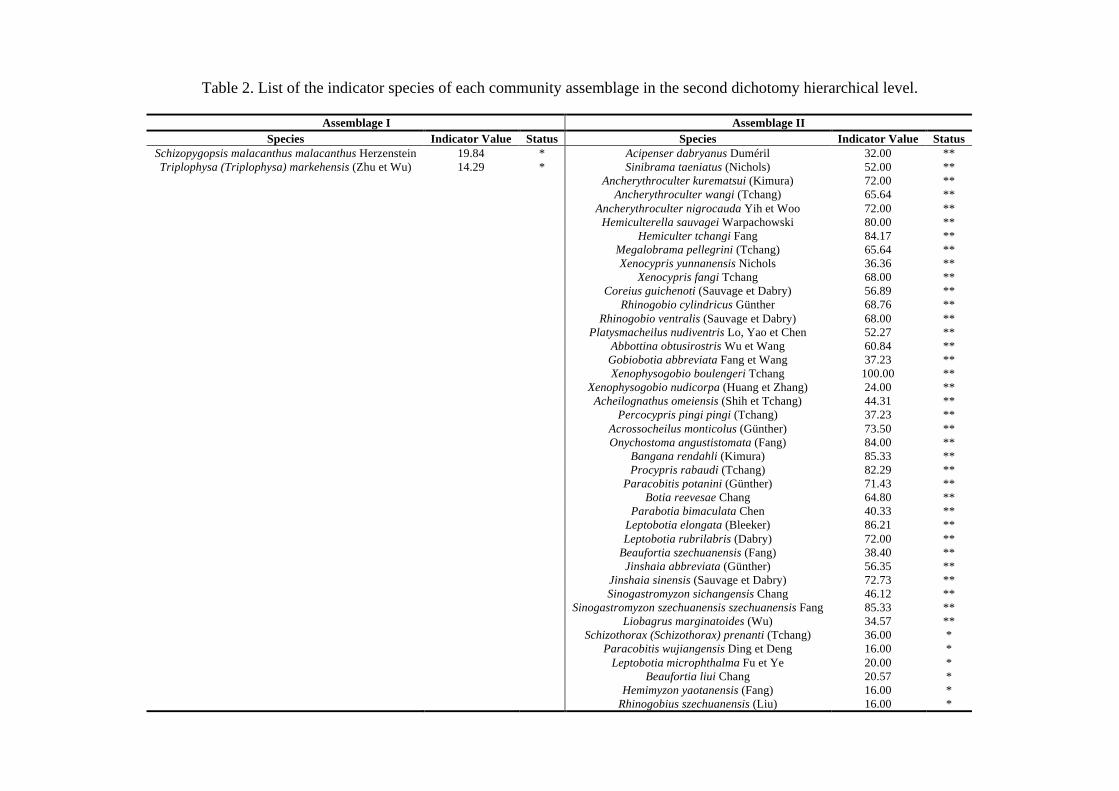
Table 2. List of the indicator species of each community assemblage in the second dichotomy hierarchical level.
Assemblage I Assemblage II Species Indicator Value Status Species Indicator Value Status
Schizopygopsis malacanthus malacanthus Herzenstein 19.84 * Acipenser dabryanus Duméril 32.00 ** Triplophysa (Triplophysa) markehensis (Zhu et Wu) 14.29 * Sinibrama taeniatus (Nichols) 52.00 **
Ancherythroculter kurematsui (Kimura) 72.00 ** Ancherythroculter wangi (Tchang) 65.64 ** Ancherythroculter nigrocauda Yih et Woo 72.00 ** Hemiculterella sauvagei Warpachowski 80.00 ** Hemiculter tchangi Fang 84.17 ** Megalobrama pellegrini (Tchang) 65.64 ** Xenocypris yunnanensis Nichols 36.36 ** Xenocypris fangi Tchang 68.00 ** Coreius guichenoti (Sauvage et Dabry) 56.89 ** Rhinogobio cylindricus Günther 68.76 ** Rhinogobio ventralis (Sauvage et Dabry) 68.00 ** Platysmacheilus nudiventris Lo, Yao et Chen 52.27 ** Abbottina obtusirostris Wu et Wang 60.84 ** Gobiobotia abbreviata Fang et Wang 37.23 ** Xenophysogobio boulengeri Tchang 100.00 ** Xenophysogobio nudicorpa (Huang et Zhang) 24.00 ** Acheilognathus omeiensis (Shih et Tchang) 44.31 ** Percocypris pingi pingi (Tchang) 37.23 ** Acrossocheilus monticolus (Günther) 73.50 ** Onychostoma angustistomata (Fang) 84.00 ** Bangana rendahli (Kimura) 85.33 ** Procypris rabaudi (Tchang) 82.29 ** Paracobitis potanini (Günther) 71.43 ** Botia reevesae Chang 64.80 ** Parabotia bimaculata Chen 40.33 ** Leptobotia elongata (Bleeker) 86.21 ** Leptobotia rubrilabris (Dabry) 72.00 ** Beaufortia szechuanensis (Fang) 38.40 ** Jinshaia abbreviata (Günther) 56.35 ** Jinshaia sinensis (Sauvage et Dabry) 72.73 ** Sinogastromyzon sichangensis Chang 46.12 ** Sinogastromyzon szechuanensis szechuanensis Fang 85.33 ** Liobagrus marginatoides (Wu) 34.57 ** Schizothorax (Schizothorax) prenanti (Tchang) 36.00 * Paracobitis wujiangensis Ding et Deng 16.00 * Leptobotia microphthalma Fu et Ye 20.00 * Beaufortia liui Chang 20.57 * Hemimyzon yaotanensis (Fang) 16.00 * Rhinogobius szechuanensis (Liu) 16.00 *
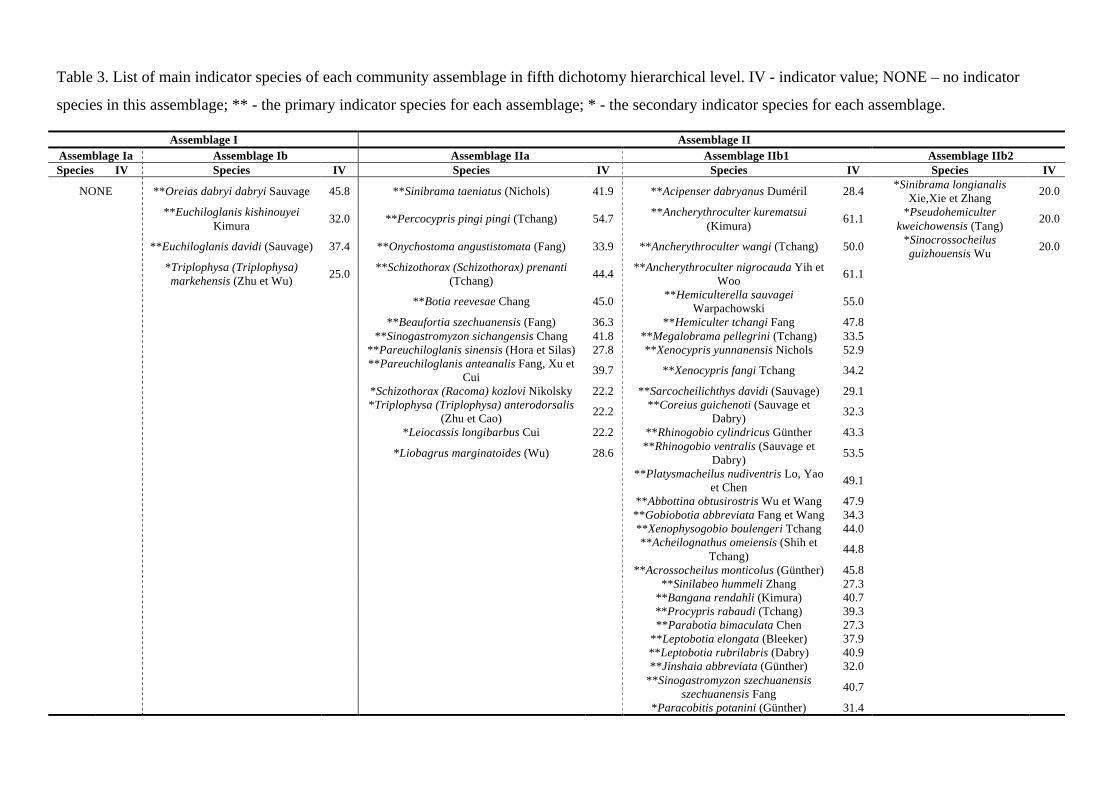
Table 3. List of main indicator species of each community assemblage in fifth dichotomy hierarchical level. IV - indicator value; NONE – no indicator
species in this assemblage; ** - the primary indicator species for each assemblage; * - the secondary indicator species for each assemblage.
Assemblage I Assemblage II Assemblage Ia Assemblage Ib Assemblage IIa Assemblage IIb1 Assemblage IIb2 Species IV Species IV Species IV Species IV Species IV
NONE **Oreias dabryi dabryi Sauvage 45.8 **Sinibrama taeniatus (Nichols) 41.9 **Acipenser dabryanus Duméril 28.4 *Sinibrama longianalis Xie,Xie et Zhang 20.0
**Euchiloglanis kishinouyei Kimura 32.0 **Percocypris pingi pingi (Tchang) 54.7 **Ancherythroculter kurematsui
(Kimura) 61.1 *Pseudohemiculter kweichowensis (Tang) 20.0
**Euchiloglanis davidi (Sauvage) 37.4 **Onychostoma angustistomata (Fang) 33.9 **Ancherythroculter wangi (Tchang) 50.0 *Sinocrossocheilus guizhouensis Wu 20.0
*Triplophysa (Triplophysa) markehensis (Zhu et Wu) 25.0 **Schizothorax (Schizothorax) prenanti
(Tchang) 44.4 **Ancherythroculter nigrocauda Yih et Woo 61.1
**Botia reevesae Chang 45.0 **Hemiculterella sauvagei Warpachowski 55.0
**Beaufortia szechuanensis (Fang) 36.3 **Hemiculter tchangi Fang 47.8 **Sinogastromyzon sichangensis Chang 41.8 **Megalobrama pellegrini (Tchang) 33.5 **Pareuchiloglanis sinensis (Hora et Silas) 27.8 **Xenocypris yunnanensis Nichols 52.9
**Pareuchiloglanis anteanalis Fang, Xu et Cui 39.7 **Xenocypris fangi Tchang 34.2
*Schizothorax (Racoma) kozlovi Nikolsky 22.2 **Sarcocheilichthys davidi (Sauvage) 29.1
*Triplophysa (Triplophysa) anterodorsalis (Zhu et Cao) 22.2 **Coreius guichenoti (Sauvage et
Dabry) 32.3
*Leiocassis longibarbus Cui 22.2 **Rhinogobio cylindricus Günther 43.3
*Liobagrus marginatoides (Wu) 28.6 **Rhinogobio ventralis (Sauvage et Dabry) 53.5
**Platysmacheilus nudiventris Lo, Yao et Chen 49.1
**Abbottina obtusirostris Wu et Wang 47.9 **Gobiobotia abbreviata Fang et Wang 34.3 **Xenophysogobio boulengeri Tchang 44.0
**Acheilognathus omeiensis (Shih et Tchang) 44.8
**Acrossocheilus monticolus (Günther) 45.8 **Sinilabeo hummeli Zhang 27.3 **Bangana rendahli (Kimura) 40.7 **Procypris rabaudi (Tchang) 39.3 **Parabotia bimaculata Chen 27.3 **Leptobotia elongata (Bleeker) 37.9 **Leptobotia rubrilabris (Dabry) 40.9 **Jinshaia abbreviata (Günther) 32.0
**Sinogastromyzon szechuanensis szechuanensis Fang 40.7
*Paracobitis potanini (Günther) 31.4
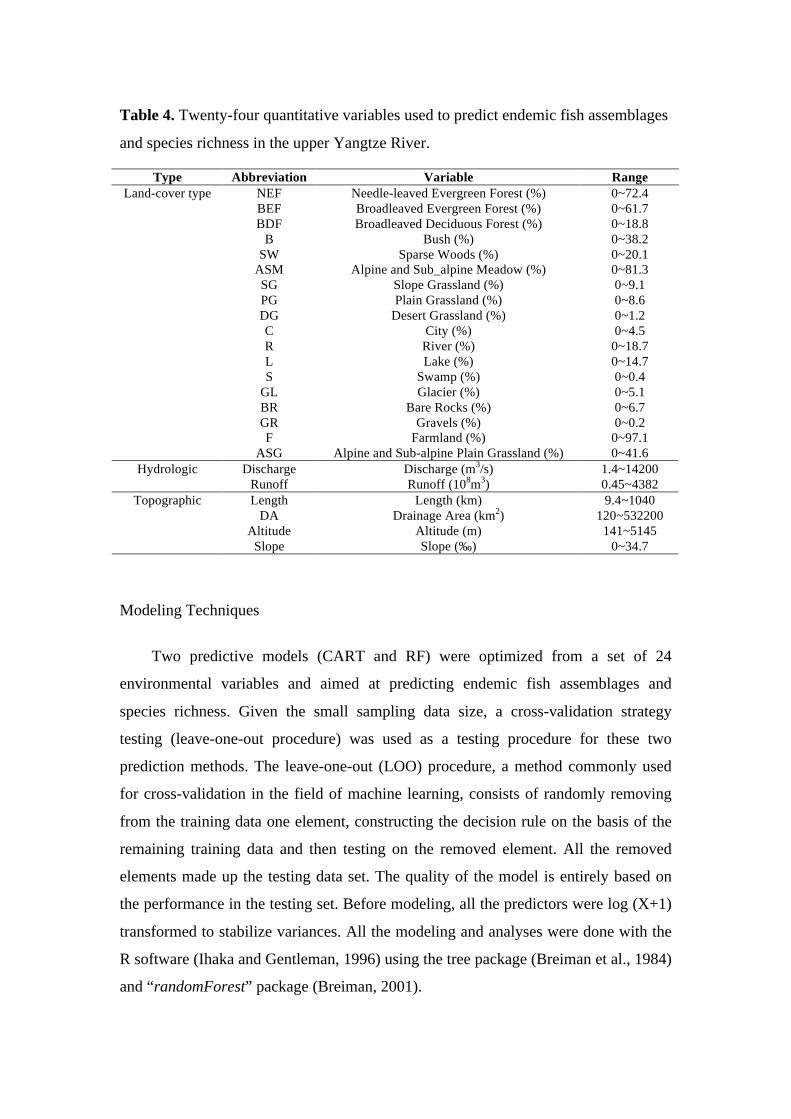
Table 4. Twenty-four quantitative variables used to predict endemic fish assemblages
and species richness in the upper Yangtze River.
Type Abbreviation Variable Range NEF Needle-leaved Evergreen Forest (%) 0~72.4 BEF Broadleaved Evergreen Forest (%) 0~61.7 BDF Broadleaved Deciduous Forest (%) 0~18.8
B Bush (%) 0~38.2 SW Sparse Woods (%) 0~20.1
ASM Alpine and Sub_alpine Meadow (%) 0~81.3 SG Slope Grassland (%) 0~9.1 PG Plain Grassland (%) 0~8.6 DG Desert Grassland (%) 0~1.2 C City (%) 0~4.5 R River (%) 0~18.7 L Lake (%) 0~14.7 S Swamp (%) 0~0.4
GL Glacier (%) 0~5.1 BR Bare Rocks (%) 0~6.7 GR Gravels (%) 0~0.2 F Farmland (%) 0~97.1
Land-cover type
ASG Alpine and Sub-alpine Plain Grassland (%) 0~41.6 Discharge Discharge (m3/s) 1.4~14200 Hydrologic
Runoff Runoff (108m3) 0.45~4382 Length Length (km) 9.4~1040
DA Drainage Area (km2) 120~532200 Altitude Altitude (m) 141~5145
Topographic
Slope Slope (‰) 0~34.7
Modeling Techniques
Two predictive models (CART and RF) were optimized from a set of 24
environmental variables and aimed at predicting endemic fish assemblages and
species richness. Given the small sampling data size, a cross-validation strategy
testing (leave-one-out procedure) was used as a testing procedure for these two
prediction methods. The leave-one-out (LOO) procedure, a method commonly used
for cross-validation in the field of machine learning, consists of randomly removing
from the training data one element, constructing the decision rule on the basis of the
remaining training data and then testing on the removed element. All the removed
elements made up the testing data set. The quality of the model is entirely based on
the performance in the testing set. Before modeling, all the predictors were log (X+1)
transformed to stabilize variances. All the modeling and analyses were done with the
R software (Ihaka and Gentleman, 1996) using the tree package (Breiman et al., 1984)
and “randomForest” package (Breiman, 2001).
CART Model: A classification and regression tree is called a classification tree if the
response variable is qualitative (e.g. fish assemblage) and a regression tree if the
response variable is quantitative (e.g. species richness). CART analysis consists of
four basic steps: tree building, stopping the tree building process, tree “pruning” and
optimal tree selection. During tree building, the initial node on a tree is called the
root. From the root, the model is fitted using binary recursive partitioning. This means
the data are successively broken into left and right branches with the splitting rules
defined by the predictor variable values. Splitting continues down to the terminal
nodes where response values are all the same within a node or data are too sparse for
additional splitting. At the terminal node, the predicted response is given that is the
average or majority of the response values in that node for continuous or discrete
variables, respectively.
RF Model: It implements Breiman’s random forest algorithm in which prediction is
obtained by aggregating classification or regression trees and choosing splits of the
trees (Breiman, 2001). Each tree is constructed using a different bootstrap sample of
the data, and each node is split using the best among a subset of predictors randomly
chosen at that node (Liaw and Wiener, 2002). The Gini index (Breiman et al., 1984) is
used as the splitting criterion. At every split one of the mtry variables (number of
variables randomly selected at each node) is used to form the split and there is a
resulting decrease in the Gini index. The sum of all decreases in the forest due to a
given variable, normalized by the number of trees, forms the Gini measure (Breiman,
2003). In our study the importance of the variables was also estimated by the Gini
criterion, which may be more appropriate for a small sample size (Archer and Kimes,
2008). The Gini importance measures can be interpreted as a variable’s degree of
discriminability between the classes (Oh et al., 2003). The largest tree possible is
grown and is not pruned. The root node of each tree in the forest contains a bootstrap
sample from the original data as the training set. Observations in the original data set
that do not occur in a bootstrap sample are called out-of-bag (OOB) observations. One
can arrive at OOB predictions as follows: for a case in the original data, predict the
outcome by plurality vote involving only those trees that did not contain the case in
their corresponding bootstrap sample. By contrasting these OOB predictions with the
training set outcomes, one can arrive at an estimate of the prediction error rate
referred to as the OOB error rate.
Results
Prediction of endemic fish assemblages
Among all environmental variables, six land-cover variables (alpine and sub-
alpine meadow, desert grassland, bare rocks, gravel, alpine and sub-alpine plain
grassland, and farmland), two hydrologic variables (discharge and runoff), and two
topographic variables (altitude and slope) varied significantly among the five
assemblages when using the Kruskall-Wallis test (p<0.05). All other 14 variables
were not significantly different among fish assemblages (p>0.05).
By using all the 24 variables, the predicted assignment of each site unit to the
correct assemblage had an average success of 60.9% and 71.7% from CART and RF
models respectively, which meant it was possible to predict the assemblages by these
environmental variables. When only river characteristics were considered, the
prediction accuracy of CART and RF models was 58.7% and 67.4%, respectively.
When only land cover features were considered, the prediction accuracy of CART and
RF models decreased dramatically to 37% and 43.5%, respectively. These showed
that river characteristics were more decisive than basin land-cover features in
predicting the endemic fish assemblages of the upper Yangtze River. Overall, the RF
model was more powerful than the CART model in the prediction accuracy of
endemic fish assemblages.
Considering all the data sets, the prediction success was relatively good for
assemblages Ia, Ib, and IIb1 in either model (from 66.7% to 88.9%), but it was lower
for assemblages IIa and IIb2 (from 20% to 55.6%, see detail in Table 5). Moreover,
about 11% and 33% of the sites that had been classified in cluster IIb1 and Ib on the
basis of environmental variables in reality hosted a type IIa assemblage. Similarly,
about 20% and 60% of the sites predicted as belonging to cluster Ia and IIb1 hosted
an assemblage of cluster IIb2. Thus, the assemblage IIb2 was more frequently
observed than expected.
The relative contributions of input variables in the model enabled the variables
driving the assemblages of endemic fishes in the upper Yangtze River to be
understood. In the CART model, altitude, slope, length and discharge are the
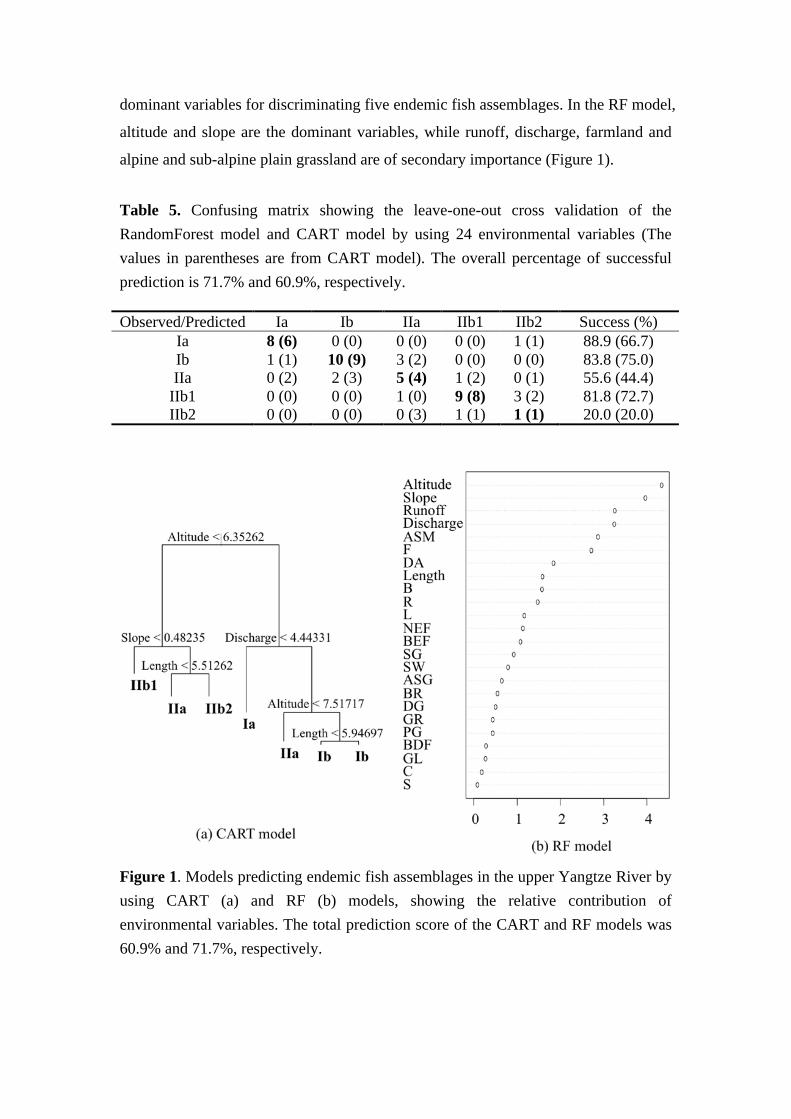
dominant variables for discriminating five endemic fish assemblages. In the RF model,
altitude and slope are the dominant variables, while runoff, discharge, farmland and
alpine and sub-alpine plain grassland are of secondary importance (Figure 1).
Table 5. Confusing matrix showing the leave-one-out cross validation of the RandomForest model and CART model by using 24 environmental variables (The values in parentheses are from CART model). The overall percentage of successful prediction is 71.7% and 60.9%, respectively.
Observed/Predicted Ia Ib IIa IIb1 IIb2 Success (%) Ia 8 (6) 0 (0) 0 (0) 0 (0) 1 (1) 88.9 (66.7) Ib 1 (1) 10 (9) 3 (2) 0 (0) 0 (0) 83.8 (75.0) IIa 0 (2) 2 (3) 5 (4) 1 (2) 0 (1) 55.6 (44.4)
IIb1 0 (0) 0 (0) 1 (0) 9 (8) 3 (2) 81.8 (72.7) IIb2 0 (0) 0 (0) 0 (3) 1 (1) 1 (1) 20.0 (20.0)
Figure 1. Models predicting endemic fish assemblages in the upper Yangtze River by using CART (a) and RF (b) models, showing the relative contribution of environmental variables. The total prediction score of the CART and RF models was 60.9% and 71.7%, respectively.
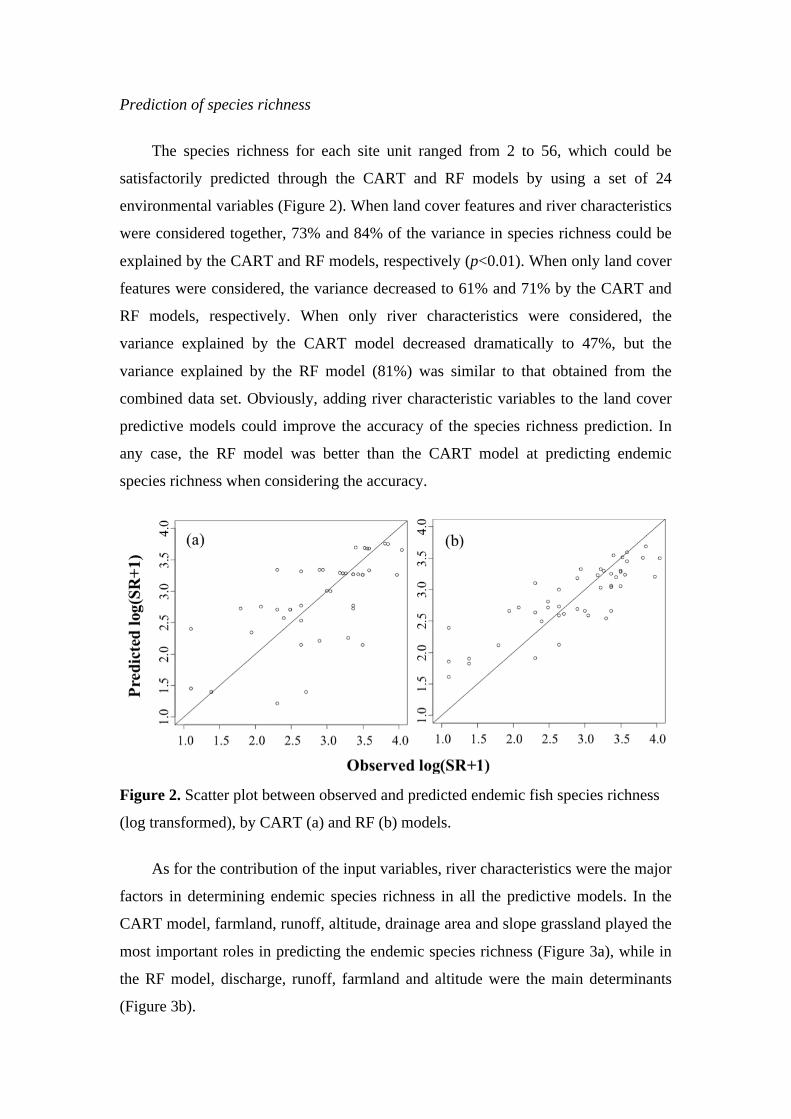
Prediction of species richness
The species richness for each site unit ranged from 2 to 56, which could be
satisfactorily predicted through the CART and RF models by using a set of 24
environmental variables (Figure 2). When land cover features and river characteristics
were considered together, 73% and 84% of the variance in species richness could be
explained by the CART and RF models, respectively (p<0.01). When only land cover
features were considered, the variance decreased to 61% and 71% by the CART and
RF models, respectively. When only river characteristics were considered, the
variance explained by the CART model decreased dramatically to 47%, but the
variance explained by the RF model (81%) was similar to that obtained from the
combined data set. Obviously, adding river characteristic variables to the land cover
predictive models could improve the accuracy of the species richness prediction. In
any case, the RF model was better than the CART model at predicting endemic
species richness when considering the accuracy.
Figure 2. Scatter plot between observed and predicted endemic fish species richness
(log transformed), by CART (a) and RF (b) models.
As for the contribution of the input variables, river characteristics were the major
factors in determining endemic species richness in all the predictive models. In the
CART model, farmland, runoff, altitude, drainage area and slope grassland played the
most important roles in predicting the endemic species richness (Figure 3a), while in
the RF model, discharge, runoff, farmland and altitude were the main determinants
(Figure 3b).
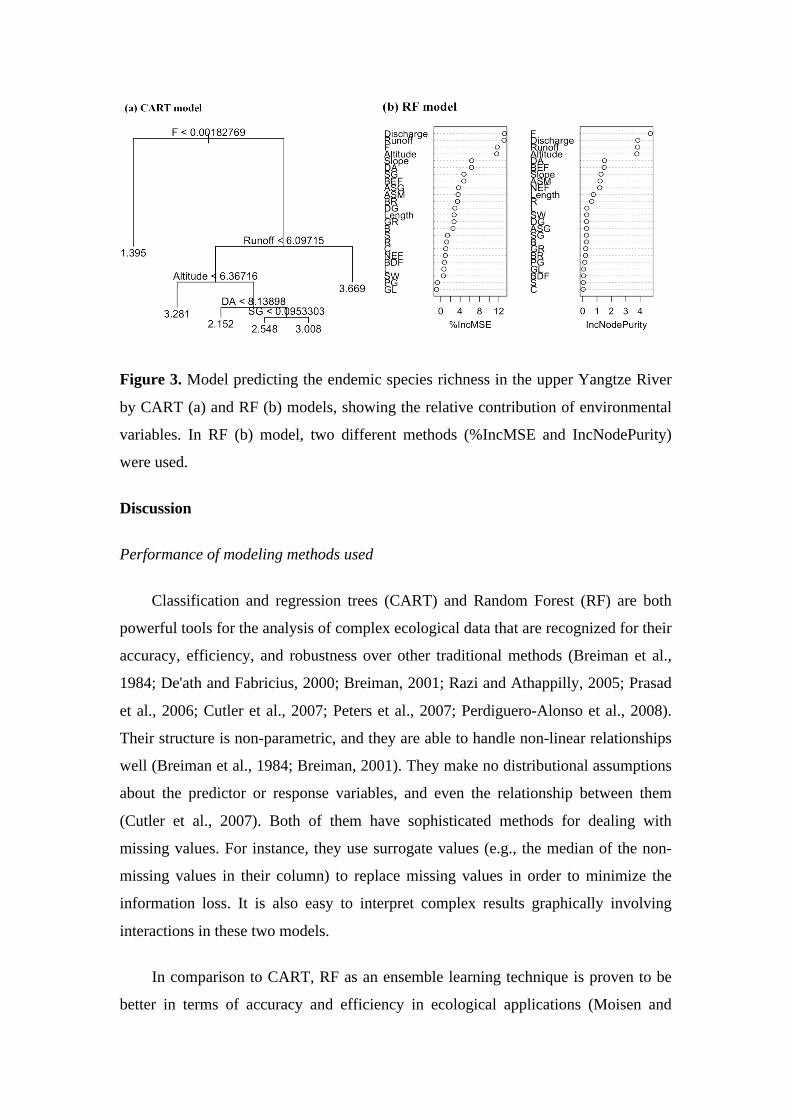
Figure 3. Model predicting the endemic species richness in the upper Yangtze River
by CART (a) and RF (b) models, showing the relative contribution of environmental
variables. In RF (b) model, two different methods (%IncMSE and IncNodePurity)
were used.
Discussion
Performance of modeling methods used
Classification and regression trees (CART) and Random Forest (RF) are both
powerful tools for the analysis of complex ecological data that are recognized for their
accuracy, efficiency, and robustness over other traditional methods (Breiman et al.,
1984; De'ath and Fabricius, 2000; Breiman, 2001; Razi and Athappilly, 2005; Prasad
et al., 2006; Cutler et al., 2007; Peters et al., 2007; Perdiguero-Alonso et al., 2008).
Their structure is non-parametric, and they are able to handle non-linear relationships
well (Breiman et al., 1984; Breiman, 2001). They make no distributional assumptions
about the predictor or response variables, and even the relationship between them
(Cutler et al., 2007). Both of them have sophisticated methods for dealing with
missing values. For instance, they use surrogate values (e.g., the median of the non-
missing values in their column) to replace missing values in order to minimize the
information loss. It is also easy to interpret complex results graphically involving
interactions in these two models.
In comparison to CART, RF as an ensemble learning technique is proven to be
better in terms of accuracy and efficiency in ecological applications (Moisen and

Frescino, 2002; Gislason et al., 2004). In the present study, RF was also shown to be
more accurate than CART in not only fish assemblage reassignment but also in
species richness prediction in the upper Yangtze River basin. A random forest usually
consists of a compilation of classification or regression trees (e.g., 1000 trees in a
single random forest) to produce more accurate classifications and regressions than
single-tree models (i.e., CART) (Liaw and Wiener, 2002). The trees are grown to
maximum size without pruning and aggregation is by averaging the trees (Prasad et
al., 2006). It selects only the best split among a random subset of variables at each
node, but not among the sequence of pruned trees. The Random Forest algorithm does
not tend to over-fit, a very useful feature for the prediction capacity of the new dataset.
It also does not require guidance. In conclusion, this averaging technique improves
the performance of single-tree models by reducing variance (through model averaging)
and bias (through forward stagewise fitting) (Elith et al., 2008).
Determinants of endemic fish assemblages
Different endemic fish assemblages in the upper Yangtze River basin exhibiting
the topographic and geomorphic characteristics were highly adapted to specific
environments. Assemblage Ia, with no indicator species, was mainly composed of
stenochoric fish species (e.g., Anabarilius liui chenghaiensis, Anabarilius
qionghaiensis, Schizothorax (Racoma) ninglangensis, Yunnanilus caohaiensis).
Assemblage Ib, with three indicator species (Euchiloglanis kishinouyei, Euchiloglanis
davidi and Oreias dabryi dabryi), was dominated by the Qinghai-Xizang plateau fish
fauna. Assemblage IIa, the transitional zone, was characterized by the plateau and
plain species (i.e., Percocypris pingi pingi, Schizothorax (Schizothorax) prenanti,
Pareuchiloglanis sinensis). Assemblage IIb1 mainly consisted of plain fish fauna, for
instance, Rhinogobio ventralis, Procypris rabaudi, Coreius guichenoti, Leptobotia
elongate, Ancherythroculter nigrocauda and Hemiculterella sauvagei. There were no
primary indicator species in assemblage IIb2, but three secondary indicator species
(Table 3). Different species composition of different endemic fish assemblages in the
upper Yangtze River reflected the longitudinal river gradient, which was closely
related to the gradual increase in habitat diversity of fish. The mechanisms behind the
shifts in species composition along the longitudinal gradient were mainly of two kinds:
species replacement and species addition (Huet, 1959; Sheldon, 1968; Petry and
Schulz, 2006). In the upper Yangtze River basin, both replacement and addition
processes marked the longitudinal distribution of the endemic fish fauna. For instance,
physicochemical conditions in the headwaters (i.e., assemblage Ia) are more stressful
and fewer fish species adapt to survive in such conditions. Zonation with species
replacement is expected in mountainous regions (i.e., assemblage Ib and IIa).
Assemblage Ib was mainly composed of the Qinghai-Xizang Plateau fish fauna, while
the plateau and plain fish fauna coexisted in assemblage IIa. As an additive pattern, an
increase in the habitat diversity of fish enabled species with various life-history
strategies to co-exist, leading to maximum species richness of endemic fish in
assemblage IIb1. Assemblage IIb2 showed both species replacement and an additive
pattern for it crossed the Sichuan basin and the special Yunnan-Guizhou plateau.
The set of 24 environmental variables used in this study were relatively
successful in predicting and explaining the endemic fish assemblages by using CART
and RF models. Assemblage Ia, Ib, and IIb1 could be predicted accurately by both RF
and CART models with relatively high accuracy (67%-89%). Assemblage IIa had a
low percentage of successful prediction (only around 50%). This poor prediction was
due to the presence of assemblages IIb1 and Ib when they were not expected.
Assemblage IIa was a transitional zone between the plateau and basin, viz., both
plateau and plain fish fauna coexisted in this assemblage. Assemblage Ib was located
in the marginal area of the Qinghai-Xizang Plateau, while assemblage IIb1 was
located in the centre of the Sichuan Basin. Assemblage IIb2 could not be accurately
predicted by these environmental variables, since only one site can be predicted into
the right assemblage. The main error was from assemblage IIb1, which might have
resulted from the fact that assemblage IIb2 was close to assemblage IIb1. Moreover,
the rivers in assemblage IIb2 were from different origins and therefore it may be
difficult to predict.
The structure and processes observed in local fish assemblages are not only
determined by local mechanisms acting within assemblages, but also result from
processes operating at larger spatial scales (Ferreira et al., 2007). In the present study,
altitude, slope, length, discharge, runoff, alpine and sub-alpine meadow and farmland
played important roles in driving the observed endemic fish assemblage structure in
the upper Yangtze River. We can distinguish assemblage II from I by altitude,
assemblage IIb1 from IIa and IIb2 by slope, and assemblage Ia from Ib by discharge.
The upper Yangtze River spans from the Qinghai-Xizang Plateau (assemblage I) to
the Sichuan Basin (assemblage II), viz., from high altitude to low altitude and from
mountainous areas to hilly areas. It is known that altitude influences species
occurrence through water temperature, thus indirectly governing the density of the
fish population via growth and fecundity. Slope usually makes a major contribution to
the erosive force acting on the substrate and bed scour in a given area. Variability in
flows (i.e., discharge and runoff) could affect the structure of many stream fish
assemblages primarily through the effect on mortality and subsequent recruitment
(Grossman et al., 1998). Marchetti and Moyle (2001) strongly suggested that stream
flow influenced fish assemblage composition in a regulated California stream,
particularly at the middle and lower sites. However, hydroelectric projects being
developed in almost all fish assemblages in the upper Yangtze River could modify the
natural flow and thus change the structure of the fish assemblages. It means that
endemic fish assemblages in the upper Yangtze River would be severely influenced
by human activities. Therefore, it is essential to take effective measures to protect
these precious endemic fish resources.
The effects of land-cover on fish community structure have been widely
investigated, and proven to be the important determinants (Park et al., 2006; Gevrey
et al., 2009). The present study also showed the significant importance of alpine and
sub-alpine meadow and farmland on distinguishing different endemic fish
assemblages in the upper Yangtze River, which were influenced by human activities.
Assemblage I had a high percentage cover of alpine and sub-alpine meadow (>30%),
which became low in assemblage IIa (nearly 15%) and even lower in assemblage IIb
(<1%). On the contrary, the highest percentage cover of farmland was located in
assemblage IIb1 (70%), followed by assemblages IIa and IIb2 (30%-45%), and lowest
in assemblage I (13% in assemblage Ib, 5% in assemblage Ia). Human activities on
the landscape such as deforestation and agricultural land use are recognized as a
principal threat to the ecological integrity of river ecosystems, especially on the biota
(Strayer et al., 2003; Allan, 2004). For fish populations, the effects of land use are
usually indirect. As agricultural land use (e.g., farmland) increases, inputs of
sediments, nutrients and pesticides increase, resulting in a decline in the habitat
heterogeneity of fish and water quality, and alteration of flow regimes, and then
impacts on fish community and populations (Jowett et al., 1996; Allan, 2004). Jones
et al. (1999) had shown that riparian forest was associated with a decreased
abundance of benthic fish species, being replaced by sediment-tolerant species. Being
confronted with large population pressures, human activities will certainly increase in
the upper Yangtze River basin, including increasing agricultural land use,
deforestation and urbanization. Although there is a realization of the importance of
different land-covers and the beginning of projects to return farmland to forest, the
phenomenon of excess land use and severe soil erosion still exists (Sun, 2008).
Therefore, more and more efforts should be made to preserve endemic fish resources
in the upper Yangtze River from now on.
Patterns and determinants of endemic species richness
Species richness patterns are important biodiversity indicators. In the present
study, there was different endemic fish species richness in the upper Yangtze River in
the different assemblages (Figure 4). It was high in assemblage II, but low in
assemblage I. Assemblage II crossed from the marginal areas of the Qinghai-Xizang
and Yunnan-Guizhou plateaus to the Sichuan basin, comprising complicated water
systems and multiple river regimes. Assemblages IIa, IIb1 and IIb2, with high
endemic fish species richness, were characterized by middle and low altitudes,
relatively abundant discharge and runoff, and a large drainage area. Assemblage I was
mainly located in the Qinghai-Xizang plateau. Assemblages Ia and Ib, with low
endemic fish species richness, were at high altitude and with a small drainage area.
Besides this assemblage pattern, the endemic fish species richness in the upper
Yangtze River also exhibited a special pattern according to the river sub-basin (Figure
4). For instance, the endemic fish species richness was highest in the middle and
lower reaches of the Jinsha River (52 and 56 species, respectively), viz., 41.9% and
45.2% of the total endemic species. Chuangjiang and the lower reach of the Minjiang
River had the second highest endemic species richness (46 and 44 species,
respectively). The lower reach of the Yalong River, the middle reach of the Minjiang
River, the middle and lower reaches of the Dadu River and the Qingyi River, the
lower reach of the Tuojiang River, the Chishui River, the Jialing River, the lower
reach of the Wujiang River, and the middle reach of the Fujiang River, were
following, with a richness from 20% to 28% of the total endemic species. Although
other sub-basins had the lowest endemic fish species richness, local endemic fish
resources were only found in these sub-basins. For instance, Anabarilius liui
chenghaiensis was only distributed in Chenghai; Schizothorax (Racoma)
ninglangensis only in Lugu Lake; Yunnanilus caohaiensis only in Caohai. The middle
and lower reaches of the Jinsha River, Chuanjiang and the lower reach of the
Minjiang River with high endemic fish species richness are experiencing severe
impacts from large hydroelectric projects (e.g., Xiangjiaba, Three Gorges Dam,
Zipingpu), as do other tributaries of the upper Yangtze River. Hydroelectric
development may directly result in discontinuous river systems and unnatural flow
patterns, e.g., sediment deposition, layered water temperature, and reduced flow reach,
all of which are deadly to the survival of endemic fish in the upper Yangtze River
(Jiang, 2008). In the case of these highly disturbed water systems (e.g., the Jinsha and
Minjiang Rivers) with high endemic fish species richness, more effective protection
measures should be taken to conserve the endemic fish resources. However, for those
water systems that are scarcely disturbed (e.g., Chenghai, Lugu lake and Caohai),
natural reserves should be set up to protect local endemic fish resources.
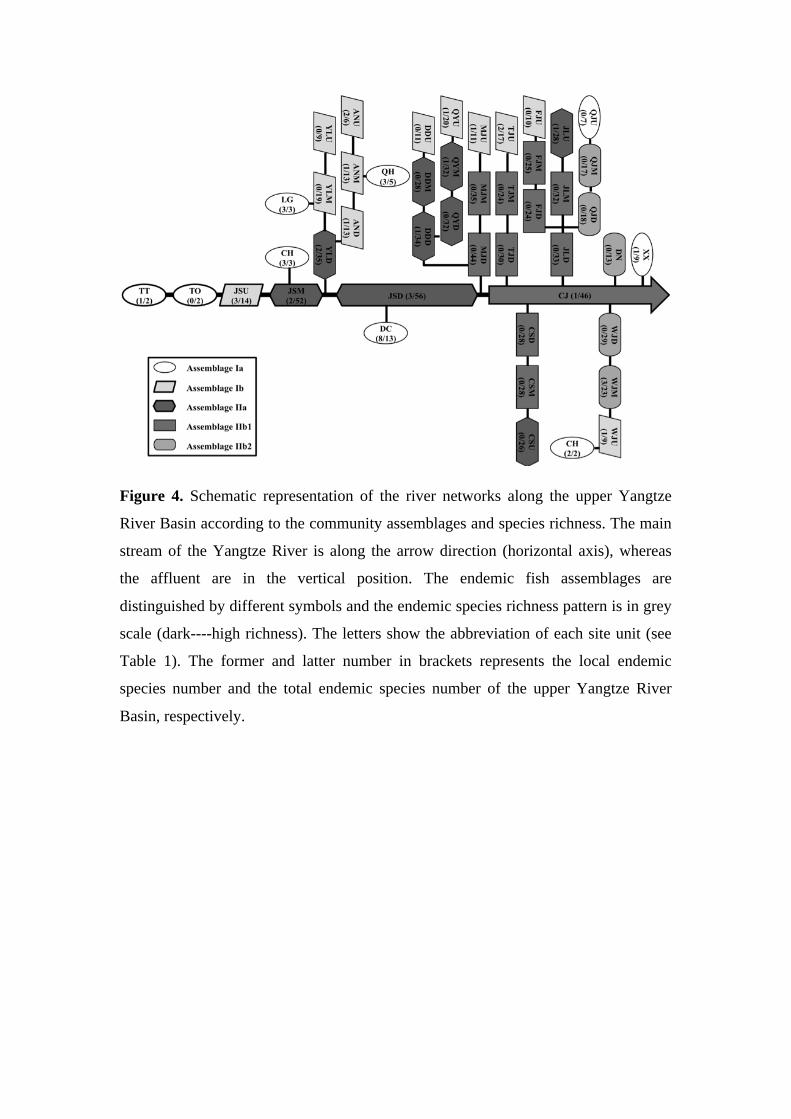
Figure 4. Schematic representation of the river networks along the upper Yangtze
River Basin according to the community assemblages and species richness. The main
stream of the Yangtze River is along the arrow direction (horizontal axis), whereas
the affluent are in the vertical position. The endemic fish assemblages are
distinguished by different symbols and the endemic species richness pattern is in grey
scale (dark----high richness). The letters show the abbreviation of each site unit (see
Table 1). The former and latter number in brackets represents the local endemic
species number and the total endemic species number of the upper Yangtze River
Basin, respectively.
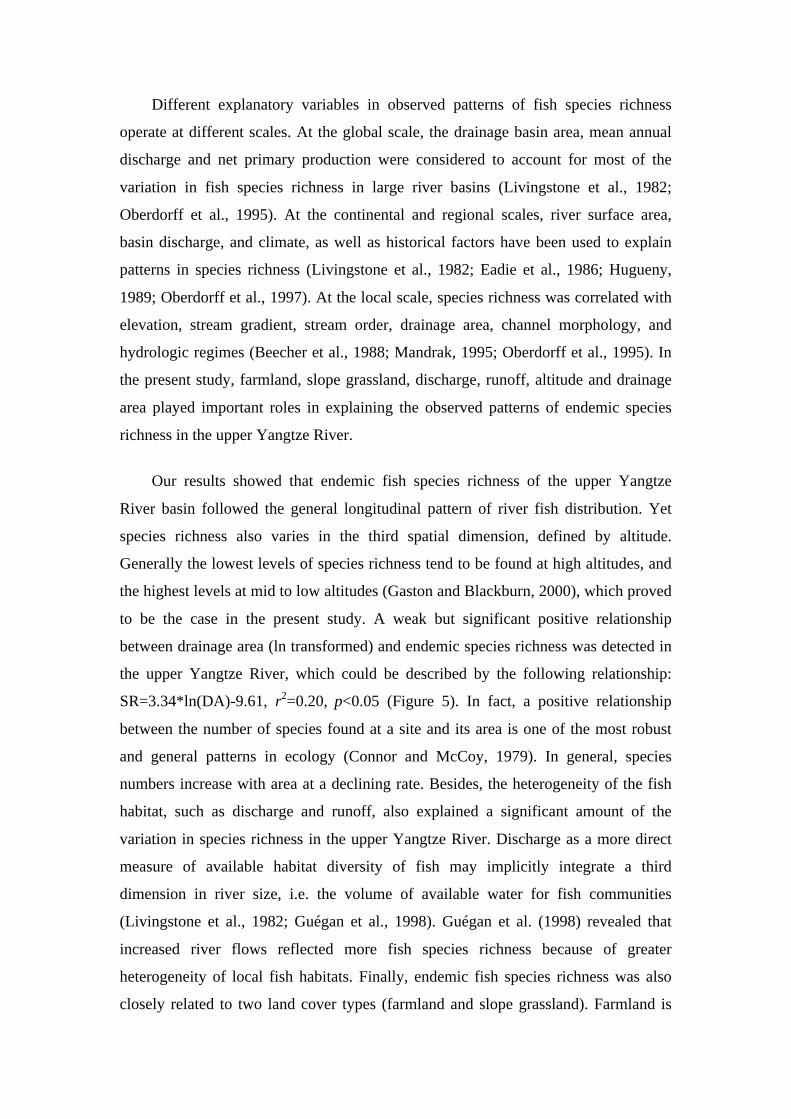
Different explanatory variables in observed patterns of fish species richness
operate at different scales. At the global scale, the drainage basin area, mean annual
discharge and net primary production were considered to account for most of the
variation in fish species richness in large river basins (Livingstone et al., 1982;
Oberdorff et al., 1995). At the continental and regional scales, river surface area,
basin discharge, and climate, as well as historical factors have been used to explain
patterns in species richness (Livingstone et al., 1982; Eadie et al., 1986; Hugueny,
1989; Oberdorff et al., 1997). At the local scale, species richness was correlated with
elevation, stream gradient, stream order, drainage area, channel morphology, and
hydrologic regimes (Beecher et al., 1988; Mandrak, 1995; Oberdorff et al., 1995). In
the present study, farmland, slope grassland, discharge, runoff, altitude and drainage
area played important roles in explaining the observed patterns of endemic species
richness in the upper Yangtze River.
Our results showed that endemic fish species richness of the upper Yangtze
River basin followed the general longitudinal pattern of river fish distribution. Yet
species richness also varies in the third spatial dimension, defined by altitude.
Generally the lowest levels of species richness tend to be found at high altitudes, and
the highest levels at mid to low altitudes (Gaston and Blackburn, 2000), which proved
to be the case in the present study. A weak but significant positive relationship
between drainage area (ln transformed) and endemic species richness was detected in
the upper Yangtze River, which could be described by the following relationship:
SR=3.34*ln(DA)-9.61, r2=0.20, p<0.05 (Figure 5). In fact, a positive relationship
between the number of species found at a site and its area is one of the most robust
and general patterns in ecology (Connor and McCoy, 1979). In general, species
numbers increase with area at a declining rate. Besides, the heterogeneity of the fish
habitat, such as discharge and runoff, also explained a significant amount of the
variation in species richness in the upper Yangtze River. Discharge as a more direct
measure of available habitat diversity of fish may implicitly integrate a third
dimension in river size, i.e. the volume of available water for fish communities
(Livingstone et al., 1982; Guégan et al., 1998). Guégan et al. (1998) revealed that
increased river flows reflected more fish species richness because of greater
heterogeneity of local fish habitats. Finally, endemic fish species richness was also
closely related to two land cover types (farmland and slope grassland). Farmland is
closely bound up with human activities. As it increases, inputs of pollutants and
pesticides increase, resulting in a decline in the habitat heterogeneity of fish and water
quality, and then a decrease in fish species richness (Allan, 2004). Assemblages IIa,
IIb1 and IIb2 were covered by a high percentage of farmland, implying frequent
human influences (i.e. land-use) on the endemic fish species richness in these
assemblages. More attention should be paid to these assemblages and they should be
taken into account for conservation planning.
Figure 5. The relationship between drainage area (km2, ln transformed) and endemic
fish species richness. Different assemblages are distinguished by different symbols
listed in the figure.
According to the patterns and explanations presented here, the various effects of
human activity on natural aquatic ecosystems, in particular, the modification of the
flow of a river (mainly due to widespread reservoir construction and use of water for
agricultural practices), and the land use changes may have a considerable effect on
fish species richness at a regional scale.
Acknowledgement
We are most grateful to John Woodley for correcting the English writing. This
study was supported by the Executive Office of the State Council Three Gorges
Project Construction Committee of China (The Ecological and Environmental
Monitoring Network of Three Gorges Project, SX2007-019 and SX2009-019), the
Public Welfare Research Project from the Ministry of Water Resources of the
People’s Republic of China (200901011) and the French embassy by providing PhD
grants for the co-supervision of PhD research.
Reference
Agricultural Regionalization Committee of Sichuan Province. Fish resources utilization and protection in the rivers of Sichuan Province. Sichuan Science and Technology Press; 1991. (in Chinese)
Allan JD. Landscapes and riverscapes: the influence of land use on stream ecosystems. Annu Rev Ecol Evol S 2004; 35: 257-284.
Archer KJ, Kimes RV. Empirical characterization of random forest variable importance measures. Comput Stat Data Anal 2008; 52: 2249-2260.
Barker LS, Felton GK, Russek-Cohen E. Use of Maryland Biological Stream Survey data to determine effects of agricultural riparian buffers on measures of biological stream health. Environ Monit Assess 2006; 117: 1-19.
Beecher HA, Dott ER, Fernau RF. Fish species richness and stream order in Washington State streams. Environ Biol Fish 1988; 22: 193-209.
Belliard J, Boet P, Tales E. Regional and longitudinal patterns of fish community structure in the Seine River basin, France. Environ Biol Fish 1997; 50: 133-147.
Breiman L, Friedman JH, Olshen RA, Stone CJ. Classification and regression trees. Chapman & Hall; 1984.
Breiman L. Random forests. Mach Learn 2001; 45: 5-32.
Breiman L. Manual on setting up, using and understanding random forests v4.0. 2003. At ftp://ftp.stat.berkeley.edu/pub/users/breiman/.
Céréghino R, Compin A, Park YS, Lek S. Predicting the species richness of aquatic insects in streams using a limited number of environmental variables. J N Am Benthol Soc 2003; 22: 442-456.
Céréghino R, Giraudel JL, Compin A. Spatial analysis of stream invertebrates distribution in the Adour-Garonne drainage basin (France), using Kohonen self organizing maps. Ecol Model 2001; 146: 167-180.
Chen XW, Liu M. Prediction of protein-protein interactions using random decision forest framework. Bioinformatics 2005; 21: 4394-4400.
Chen ZJ. The strategic position and the ecological and environmental function of the upper reaches of the Yangtze River. Journal of Mountain Science 2000; 18(3): 258-262. (in Chinese)
Connor EF, McCoy ED. The statistics and biology of the species-area relationship. Am Nat 1979; 113: 791.
Cutler DR, Edwards TC, Beard KH, Cutler A, Hess KT. Random forests for classification in ecology. Ecology 2007; 88: 2783-2792.
De'ath G, Fabricius KE. Classification and regression trees: A powerful yet simple technique for ecological data analysis. Ecology 2000; 81: 3178-3192.
De'ath G. Boosted trees for ecological modeling and prediction. Ecology 2007; 88: 243-251.
Ding RH. The Fishes of Sichuan, China. Sichuan Publishing House of Science and Technology, Chengdu; 1994. (in Chinese)
Dolan BJ, Parker GR. Ecosystem classification in a flat, highly fragmented region of Indiana, USA. For Ecol Manage 2005; 219: 109-131.
Eadie JMA, Hurly TA, Montgomerie RD, Teather KL. Lakes and rivers as islands: species-area relationships in the fish faunas of Ontario. Environ Biol Fish 1986; 15: 81-89.
Elith J, Leathwick JR, Hastie T. A working guide to boosted regression trees. J Anim Ecol 2008; 77: 802-813.
Fang T, Ao HY, Liu JT, Cai QH, Liu YD. The spatio-temporal of water environmental status in Dianchi Lake. Acta Hydrobiologica Sinica 2004; 28(2): 124-130. (in Chinese)
Fausch KD, Lyons J, Karr JR, Angermeier PL. Fish communities as indicators of environmental degradation. In: S.M. Adams (ed.), Biological indicators of stress in fish. Amer Fish Soc Symp 1990; 8: 123-144.
Ferreira MT, Sousa L, Santos JM, Reino L, Oliveira J, Almeida PR, Cortes RV. Regional and local environmental correlates of native Iberian fish fauna. Eco Freshw Fish 2007; 16(4): 504-514.
Fitzpatrick FA, Scudder BC, Lenz BN, Sullivan DJ. Effects of multi-scale environmental characteristics on agricultural stream biota in Eastern Wisconsin. J Am Water Resour Assoc 2001; 37: 1489-1507.
Gaston KJ, Blackburn TM. Pattern and process in macroecology: Blackwell Pub; 2000.
Gevrey M, Sans-Piche F, Grenouillet G, Tudesque L, Lek S. Modeling the impact of landscape types on the distribution of stream fish species. Can J Fish Aquat Sci 2009; 66: 484-495.
Gislason PO, Benediktsson JA, Sveinsson JR. Random Forests for land cover classification. 3rd Pattern Recognition in Remote Sensing Workshop. 27, Kingston Upon Thames, ENGLAND; 2004. pp. 294-300.
Grossman GD, Ratajczak JRE, Crawford M, Freeman MC. Assemblage organization in stream fishes: effects of environmental variation and interspecific interactions. Ecol Monogr 1998; 68: 395-420.
Grubbs SA, Meier OW, Meier AJ. Longitudinal patterns of fish assemblages in small unregulated subbasins: evaluating reachand watershed-scale parameters. Hydrobiologia 2007; 592: 211-223.
Guégan JF, Lek S, Oberdorff T. Energy availability and habitat heterogeneity predict global riverine fish diversity. Nature 1998; 391: 382-384.
Guisan A, Thuiller W. Predicting species distribution: offering more than simple habitat models. Ecol Lett 2005; 8: 993-1009.
Guo YA. Research on the changing tendency of water resources in Yunnan Dianchi. Yunnan Geographic Environment Research 2005; 17(2): 28-32,61. (in Chinese)
Harris JH. The use of fish in ecological assessments. Austral Ecol 1995; 20: 65-80.
Hastie T, Tibshirani R. Generalized additive models. Stat Sci 1986; 297-310.
He YF, Wang JW, Lek S, Cao WX, Lek-Ang S. Structure of endemic fish assemblages in the upper Yangtze River basin. River Res Appl. In press.
Hellawell JM. Biological indicators of freshwater pollution and environmental management. Elsevier Applied Science Publishers, Washington, DC; 1986.
Huang ZL. On the development and conservation for the resources and ecology of Chishui River basin. Resources and Environment in the Yangtze Basin 2003; 12(4): 332-339. (in Chinese)
Huet M. Profiles and biology of Western European streams as related to fish management. Trans Am Fish Soc 1959; 88: 155-163.
Hughes RM, Gammon JR. Longitudinal changes in fish assemblages and water quality in the Willamette River, Oregon. Trans Am Fish Soc 1987; 116: 196-209.
Hughes RM, Larsen DP, Omernik JM. Regional reference sites: a method for assessing stream potentials. Environ Manage 1986; 10: 629-635.
Hugueny B. West African rivers as biogeographic islands: species richness of fish communities. Oecologia 1989; 79: 236-243.
Hui Y, Zhang XH, Chen ZJ. Present situation and strategy about the natural environment of the Xiangxi River basin. Resources and Environment in the Yangtze Basin 2000; 9(1): 27-33. (in Chinese)
Hydrology Bureau of Changjiang Water Resources Committee. Water System. In: Compilation Committee of the Yangtze River Chronicles eds, The Yangtze River Chronicles. Volume 1: Review of Rivers. The Encyclopedia of China Press, Beijing; 2003. (in Chinese)
Ihaka R, Gentleman R. R: a language for data analysis and graphics. J Comput Graph Stat 1996; 299-314.
Jiang GZ. Large water resources project in the Yangtze River Basin and fishery resources rescue. Yangtze River 2008; 39(23): 62-64. (in Chinese)
Jones EBD, Helfman GS, Harper JO, Bolstad PV. Effects of riparian forest removal on fish assemblages in southern Appalachian streams. Conserv Biol 1999; 13: 1454-1465.
Jowett IG, Richardson J, McDowall RM. Relative effects of in-stream habitat and land use on fish distribution and abundance in tributaries of the Grey River, New Zealand. N Z J Mar Freshw Res 1996; 30: 463-475.
Karr JR. Biological integrity- a long-neglected aspect of water resource management. Ecol Appl 1991; 1: 66-84.
Legendre P, Legendre L. Numerical ecology (2nd English ed). Elsevier Science BV, Amsterdam; 1998.
Lek S, Scardi M, Verdonschot PFM, Descy JP, Park YS. Modelling community structure in freshwater ecosystems: Springer Verlag; 2005.
Lenat DR. Water quality assessment of streams using a qualitative collection method for benthic macroinvertebrates. J N Am Benthol Soc 1988; 222-233.
Liaw A, Wiener M. Classification and regression by randomForest. Resampling Methods in R: The boot Package 2002; 18-22.
Liu RM, Shen ZY. Integrated assessment and changes of ecological environment in Daning River watershed. Journal of Beijing Normal University (Natural Science) 2006; 42(2): 200-203. (in Chinese)
Livingstone DA, Rowland M, Bailey PE. On the Size of African Riverine Fish Faunas. Am Zool 1982; 22: 361-369.
Luo Q, Liu Q. The existing situation of environmental pollution in Qionghai and its counter-measures. Journal of Chongqing Normal University (Natural Science Edition) 2003; 20(2): 52-55. (in Chinese)

Mandrak NE. Biogeographic patterns of fish species richness in Ontario lakes in relation to historical and environmental factors. Can J Fish Aquat Sci 1995; 52: 1462-1474.
Marchetti MP, Moyle PB. Effects of flow regime on fish assemblages in a regulated California stream. Ecol Appl 2001; 11: 530-539.
Moisen GG, Frescino TS. Comparing five modelling techniques for predicting forest characteristics. Ecol Model 2002; 157: 209-225.
Nelson JS. Fishes of the World. Fourth Edition. John Wiley & Sons, Inc. ISBN 0-471-25031-7. 2006.
Oberdorff T, Guégan JF, Hugueny B. Global scale patterns of fish species richness in rivers. Ecography 1995: 345-352.
Oberdorff T, Hugueny B, Guegan JF. Is there an influence of historical events on contemporary fish species richness in rivers? Comparisons between Western Europe and North America. J Biogeogr 1997; 24: 461-467.
Oberdorff T, Pont D, Hugueny B, Chessel D. A probabilistic model characterizing fish assemblages of French rivers: a framework for environmental assessment. Freshw Biol 2001; 46: 399-415.
Oberdorff T, Pont D, Hugueny B, Porcher JP. Development and validation of a fish-based index for the assessment of 'river health' in France. Freshw Biol 2002; 47: 1720-1734.
Oh J, Laubach M, Luczak A. Estimating neuronal variable importance with random forest. Proceedings of the IEEE 29th Annual Northeast Bioengineering Conference 2003. pp. 33-34.
Pal M. Random forest classifier for remote sensing classification. Int J Remote Sens 2005; 26: 217-222.
Park YS, Grenouillet G, Esperance B, Lek S. Stream fish assemblages and basin land cover in a river network. Sci Total Environ 2006; 365: 140-153.
Perdiguero-Alonso D, Montero FE, Kostadinova A, Raga JA, Barrett J. Random forests, a novel approach for discrimination of fish populations using parasites as biological tags. Int J Parasit 2008; 38: 1425-1434.
Peters J, De Baets B, Verhoest NEC, Samson R, Degroeve S, De Becker P, Huybrechts W. Random forests as a tool for ecohydrological distribution modelling. Ecol Model 2007; 207: 304-318.
Petry AC, Schulz UH. Longitudinal changes and indicator species of the fish fauna in the subtropical Sinos River, Brazil. J Fish Biol 2006; 69: 272-290.

Prasad AM, Iverson LR, Liaw A. Newer classification and regression tree techniques: Bagging and random forests for ecological prediction. Ecosystems 2006; 9: 181-199.
Rahel FJ, Hubert WA. Fish assemblages and habitat gradients in a rocky-mountain great-plains stream- biotic zonation and additive patterns of community change. Trans Am Fish Soc 1991; 120: 319-332.
Razi MA, Athappilly K. A comparative predictive analysis of neural networks (NNs), nonlinear regression and classification and regression tree (CART) models. Expert Syst Appl 2005; 29: 65-74.
Rumelhart DE, McClelland JL. Parallel distributed processing: Explorations in the microstructure of cognition, Vol. 1: Foundations: MIT Press Cambridge, MA, USA; 1986.
Shan ZG. Studies on the hydrochemistry of Chenghai Lake during 1992. Journal of Yunnan Normal University 1996; 16(2): 21-28. (in Chinese)
Sheldon AL. Species diversity and longitudinal succession in stream fishes. Ecology 1968: 194-198.
Singkran N, Meixler MS. Influences of habitat and land cover on fish distributions along a tributary to Lake Ontario, New York. Landsc Ecol 2008; 23: 539-551.
Strayer DL, Beighley RE, Thompson LC, Brooks S, Nilsson C, Pinay G, Naiman RJ. Effects of land cover on stream ecosystems: Roles of empirical models and scaling issues. Ecosystems 2003; 6: 407-423.
Sun HL. Ecological and environmental problems in the upper Yangtze River. China Environmental Science Press, Beijing, 2008 (in Chinese)
Tang T, Qu XD, Cai QH, Liu JK. River ecosystem management-a case study of Xiangxi River. Resources and Environment in the Yangtze Basin 2004; 13(6): 594-598. (in Chinese)
Tian SS. Ecological environment degeneration and agriculture soil use in the upper Yangtze River. China Population, Resources and Environment 2004; 14(3): 96-99. (in Chinese)
Wang LJ, Guo HC, Liu Y, Dai YL, Wang JH. Ecological fragility of Qionghai Lake basin and its assessment. Chinese Journal of Ecology 2005; 24(10): 1192-1196. (in Chinese)
Zhang BL, Zhang SM, Zhou QG, Zhou WC. Dynamics in land use and ecosystem service-a case of Daning River watershed in Three Gorges Reservoir area. Resources and Environment in the Yangtze Basin 2007; 16(2): 181-185. (in Chinese)
Zhou SL, Yang WF, Xue ZB. Health assessments on the Hydrophytic ecosystem of Qionghai Lake. Environmental Monitoring in China 2006; 22(5): 78-81. (in Chinese)
P3
Temporal variation in genetic structure of the Chinese rare minnow (Gobiocypris
rarus) in its type locality revealed by microsatellite markers
He Y. & Wang J. (2010)
Biochemical Genetics, 48: 312-325.
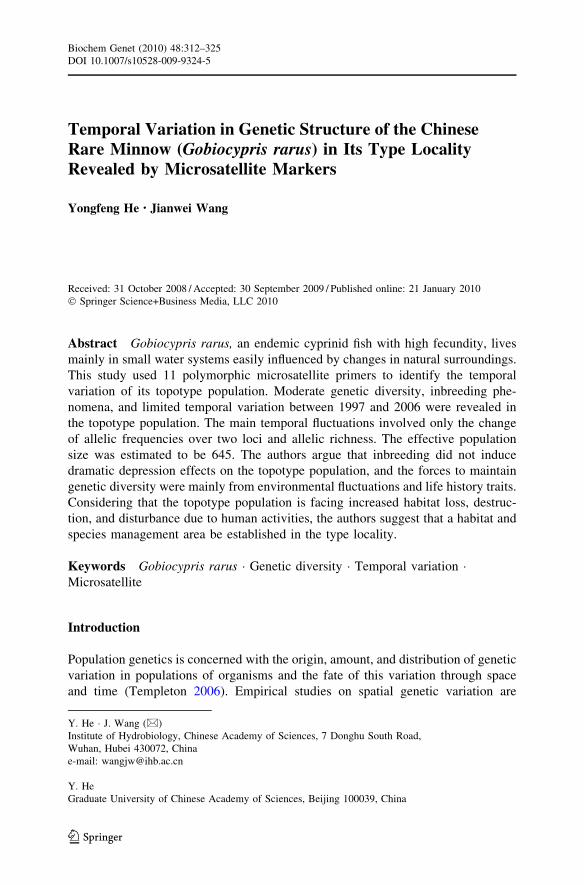
Temporal Variation in Genetic Structure of the ChineseRare Minnow (Gobiocypris rarus) in Its Type LocalityRevealed by Microsatellite Markers
Yongfeng He • Jianwei Wang
Received: 31 October 2008 / Accepted: 30 September 2009 / Published online: 21 January 2010
� Springer Science+Business Media, LLC 2010
Abstract Gobiocypris rarus, an endemic cyprinid fish with high fecundity, lives
mainly in small water systems easily influenced by changes in natural surroundings.
This study used 11 polymorphic microsatellite primers to identify the temporal
variation of its topotype population. Moderate genetic diversity, inbreeding phe-
nomena, and limited temporal variation between 1997 and 2006 were revealed in
the topotype population. The main temporal fluctuations involved only the change
of allelic frequencies over two loci and allelic richness. The effective population
size was estimated to be 645. The authors argue that inbreeding did not induce
dramatic depression effects on the topotype population, and the forces to maintain
genetic diversity were mainly from environmental fluctuations and life history traits.
Considering that the topotype population is facing increased habitat loss, destruc-
tion, and disturbance due to human activities, the authors suggest that a habitat and
species management area be established in the type locality.
Keywords Gobiocypris rarus � Genetic diversity � Temporal variation �Microsatellite
Introduction
Population genetics is concerned with the origin, amount, and distribution of genetic
variation in populations of organisms and the fate of this variation through space
and time (Templeton 2006). Empirical studies on spatial genetic variation are
Y. He � J. Wang (&)
Institute of Hydrobiology, Chinese Academy of Sciences, 7 Donghu South Road,
Wuhan, Hubei 430072, China
e-mail: [email protected]
Y. He
Graduate University of Chinese Academy of Sciences, Beijing 100039, China
123
Biochem Genet (2010) 48:312–325
DOI 10.1007/s10528-009-9324-5

usually performed under the assumption that the observed genetic patterns remain
stable over time (Tessier and Bernatchez 1999). Genetic structure of natural
populations is not always stable over time, however. Recently, many scholars have
paid more attention to the temporal changes in population genetic structure and
discussed the cause of this variation (Østergaard et al. 2003; Barcia et al. 2005;
Florin and Hoglund 2007; Lee and Boulding 2007; Martınez-Cruz et al. 2007).
Significant temporal variation was detected in small populations of gastropods,
shrimp, and fish. Multiple factors, including species’ biological properties and
natural or anthropogenic disturbances, can affect the temporal stability of allele
frequencies in natural populations. For instance, sudden weather changes,
hurricanes, and droughts might create unstable environments that could reduce a
species’ reproductive success. This demographic fluctuation can temporarily or
permanently reduce the population size and sometimes ends with the species’
extinction. Normal natural changes might increase migration levels to some extent,
which could help maintain the species’ genetic variation. Insignificant temporal
fluctuations were also revealed in some populations. This temporal stability can be
explained by the large population size (Nielsen et al. 1997; Tessier and Bernatchez
1999; Blanco et al. 2005). Consequently, performing genetic analyses of temporal
replicates to estimate the extent of the variation may be required to ensure the
reliability of estimates of population structure.
The rare minnow, Gobiocypris rarus Ye et Fu, is an endemic cyprinid fish in China
(Ye and Fu 1983; Chen 1998). It is attractive as an aquatic laboratory animal because
it is sensitive to chemicals, small (adult, 3–8 cm), eurythermal (0–35�C), and easily
reared in the laboratory; it produces a large number of eggs every several days and is a
continuous batch spawner; its embryonic development is of short duration (72 h at
26�C), and it has a short life cycle (about 4 months; Wang and Cao 1997; Wang 1992,
1996, 1999). In its natural habitat, the rare minnow is considered endangered (Le and
Chen 1998; Wang and Xie 2004; Xiong et al. 2007). The type locality is near the town
of Jiuxiang, Hanyuan County, Sichuan Province, in the middle Dadu River basin. The
fish also inhabits several counties along the lower Dadu River basin, the upper Tuo
River basin, and the middle Min River basin. According to published bibliographies
(Ding 1994; Wang and Cao 1997; Chen 1998; Le and Chen 1998) and our
investigations, the rare minnow lives mainly in small water systems, such as paddy
fields, ditches, and loblollies, especially in weedy ditches with flowing water. All
known habitats of the rare minnow are dozens to hundreds of miles from one another,
isolated or separated by large rivers. Thus, large rivers could be a prominent cause of
the species’ discontinuous distribution.
Various factors have led to the endangerment of G. rarus. The habitats of this fish
are easily influenced by environmental changes, such as drought, rainstorms, floods,
and local agricultural activities (Le and Chen 1998). Moreover, the rare minnow is
sensitive to chemicals. Lethal or sublethal effects were observed when the species
was exposed to low concentrations of heavy metals, industrial pollution, pesticides,
and domestic wastewater (Zhou et al. 1995; Wang et al. 1998; Wu et al. 2000; Lu
and Shen 2002; Li et al. 2004). As a result, rare minnow populations have declined
in recent years as anthropogenic disturbance of their habitats increased and pesticide
contamination became widespread. Except for the type locality, which the topotype
Biochem Genet (2010) 48:312–325 313
123
population occupies, only small numbers of G. rarus are present at other sites.
Therefore, the topotype population is the key for the long-term survival of this
species.
In addition to the factors mentioned above, settlements in the reservoir area of the
Pubugou hydropower station, in the main stream of the Dadu River, seem to be
increasing the environmental pressures on the type locality. Thousands of people
have settled in the type locality since 2004. Their activities, which include factory
construction, land use modification, river regulation, and farmland water conser-
vancy, may directly or indirectly destroy the habitat. The purpose of the present
study is to assess the temporal stability of the genetic structure of a G. rarus wild
population from its type locality by analyzing 11 polymorphic microsatellite loci
over a 10-year period and to discuss the possible factors that might contribute to the
observed patterns.
Materials and Methods
Samples
The sampling site is in the Liusha River floodplain, where the type specimens were
collected from 1979 to 1981 (Ye and Fu 1983). The habitats consisted of several
small rivulets and many ditches across rice fields. The rivulets, originating from
springs, were typically 0.8–1 m wide, with stone banks. The ditches, which
connected the rivulets to the rice fields, were narrower, with either pebble or clay
banks. Some of the ditches were seasonal. The nearest distribution site to the type
locality was about 20 km away, in the mouth of the Liusha River.
In 1997 and 2006, hundreds of G. rarus were collected from rivulets and ditches
of the type locality and then transferred to our institute for laboratory use. Before
transportation, 30 individuals were randomly sampled (i.e., HY1997 and HY2006)
from the total catch of each year. In addition, a laboratory-reared family, consisting
of the parents and their offspring, was utilized to examine the inheritance of each
usable microsatellite marker. Muscle tissue was collected from each individual and
stored in 95% ethanol at -20�C until further analysis. Genomic DNA was then
extracted from the tissue, using a salt extraction protocol outlined by Aljanabi and
Martinez (1997).
Development of Microsatellite Loci
A microsatellite-enriched genomic library was constructed using the FIASCO (fast
isolation by AFLP of sequences containing repeats) protocol (Zane et al. 2002) with
some modifications. To further maximize the likelihood of polymorphism, DNA
from six wild individuals was pooled prior to library construction. Genomic DNA
extracted from fin clips, using a traditional phenol–chloroform protocol with RNase
treatment, was digested with MseI and ligated to the MseI AFLP adapter.
Five hundred nanograms of newly amplified DNA was mixed with 100 pmol of a
30-biotinylated oligonucleotide probe (GATA)n, in a total volume of 100 lL
314 Biochem Genet (2010) 48:312–325
123
(4.29 SSC, 0.07% SDS) at 95�C for 15 min, then 56�C for 30 min. After several
nonstringency and stringency washes at room temperature, an additional high-
stringency wash was performed in 0.29 SSC, 0.1% SDS, at 45�C for 10 min to
discard the nonspecific DNA in the beads-probe-DNA complex. Enriched fragments
were eventually ligated into pGEM-T vectors (Promega) and transformed into
DH5a competent cells. Clones with positive inserts were confirmed by PCR
amplification using MseI-N primers and were then sequenced. Primers were
designed for the sequences flanking the repeat regions. Polymerase chain reaction
conditions were optimized for each primer set using five unrelated G. rarus wild
individuals.
Amplification of Microsatellite Loci
Polymerase chain reaction conditions for revealing the temporal genetic variation
were as follows. A 10 lL reaction volume contained 1.5 mM MgCl2, 2.5 mM
dNTP, 0.5 U Taq DNA polymerase, 1 lL 10 9 Taq polymerase buffer, 5 pmol
each of forward and reverse primer, and 20–50 ng genomic DNA template.
Amplification was performed in a TGradient AmpCycler (Biometra), programmed
for an initial denaturation of 5 min at 94�C followed by 35 cycles of 30 s at 94�C,
40 s at annealing temperature (Table 1), and 40 s at 72�C, with a final extension of
10 min at 72�C. The amplified products were separated on 10% standard
nondenaturing polyacrylamide gels stained with ethidium bromide. pBR322
DNA/MspI was used as a size marker for the microsatellite alleles.
Data Analysis
Genetic diversity was quantified in terms of heterozygosity, number of alleles per
locus, and allelic frequencies observed in the topotype population. Expected and
observed heterozygosities (He, Ho) were estimated with the program Arlequin
version 2.000 (Schneider et al. 2000). Allele frequency was computed using the
Genepop version 3.3 package (Raymond and Rousset 1995). Since rare alleles may
be generated by drift or variation in sample size, the effective number of alleles (Ae)
was calculated with the formula Ae = 1/P
pi2, where pi represents each allele
frequency (Frankham et al. 2002). Genepop was also used to estimate departures
from Hardy–Weinberg equilibrium at each locus and globally over all loci. This
involved the use of the Markov chain method (Guo and Thompson 1992), with
1,000 dememorization steps, 100 batches, and 1,000 iterations per batch, in order to
test the alternative hypotheses of deficiency or excess of heterozygotes. The
significance of genotypic linkage disequilibrium between pairs of loci was tested
with Fstat version 2.9.3 (Goudet 2001), based on 1,100 permutations. Fis per locus
and over all loci was calculated according to Weir and Cockerham (1984) and tested
for significance with the Fstat software. All multiple tests were corrected with the
sequential Bonferroni procedure (Rice 1989).
The expected frequency of null alleles (r; Brookfield 1996, Eq. 4) was used to
calculate the expected frequency of null homozygotes (r2). Expected counts were
Biochem Genet (2010) 48:312–325 315
123
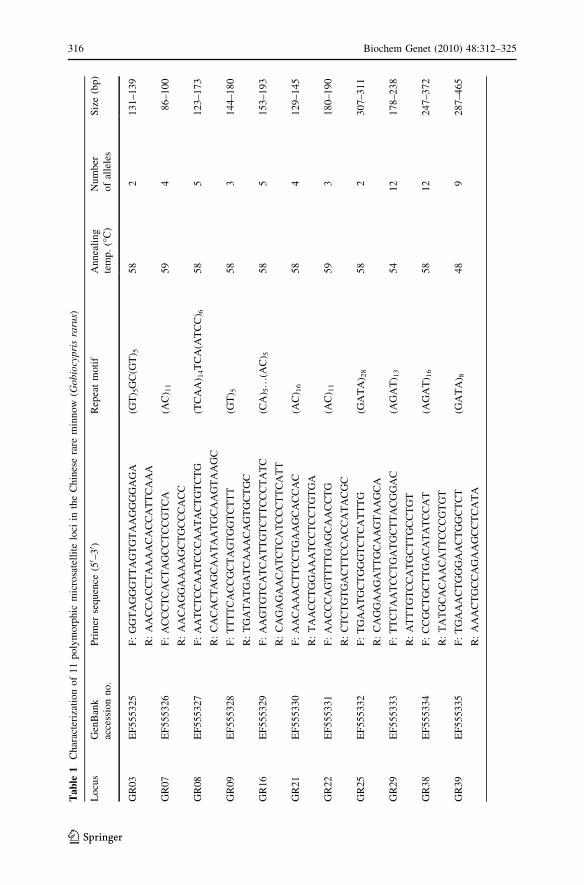
Tab
le1
Ch
arac
teri
zati
on
of
11
po
lym
orp
hic
mic
rosa
tell
ite
loci
inth
eC
hin
ese
rare
min
now
(Go
bio
cyp
ris
raru
s)
Lo
cus
Gen
Ban
k
acce
ssio
nno.
Pri
mer
sequen
ce(50 –
30 )
Rep
eat
mo
tif
An
nea
lin
g
tem
p.
(�C
)
Nu
mb
er
of
alle
les
Siz
e(b
p)
GR
03
EF
555325
F:
GG
TA
GG
GT
TA
GT
GT
AA
GG
GG
AG
A(G
T) 5
GC
(GT
) 55
82
13
1–1
39
R:
AA
CC
AC
CT
AA
AA
CA
CC
AT
TC
AA
A
GR
07
EF
55
532
6F
:A
CC
CT
CA
CT
AG
CC
TC
CG
TC
A(A
C) 1
15
94
86
–10
0
R:
AA
CA
GG
AA
AA
GC
TG
CC
CA
CC
GR
08
EF
555327
F:
AA
TC
TC
CA
AT
CC
CA
AT
AC
TG
TC
TG
(TC
AA
) 14T
CA
(AT
CC
) 65
85
12
3–1
73
R:
CA
CA
CT
AG
CA
AT
AA
TG
CA
AG
TA
AG
C
GR
09
EF
55
532
8F
:T
TT
TC
AC
CG
CT
AG
TG
GT
CT
TT
(GT
) 55
83
14
4–1
80
R:
TG
AT
AT
GA
TC
AA
AC
AG
TG
CT
GC
GR
16
EF
555329
F:
AA
GT
GT
CA
TC
AT
TG
TC
TT
CC
CT
AT
C(C
A) 5
…(A
C) 5
58
51
53
–1
93
R:
CA
GA
GA
AC
AT
CT
CA
TC
CC
TT
CA
TT
GR
21
EF
55
533
0F
:A
AC
AA
AC
TT
CC
TG
AA
GC
AC
CA
C(A
C) 1
65
84
12
9–1
45
R:
TA
AC
CT
GG
AA
AT
CC
TC
CT
GT
GA
GR
22
EF
555331
F:
AA
CC
CA
GT
TT
TG
AG
CA
AC
CT
G(A
C) 1
15
93
18
0–1
90
R:
CT
CT
GT
GA
CT
TC
CA
CC
AT
AC
GC
GR
25
EF
55
533
2F
:T
GA
AT
GC
TG
GG
TC
TC
AT
TT
G(G
AT
A) 2
85
82
30
7–3
11
R:
CA
GG
AA
GA
TT
GC
AA
GT
AA
GC
A
GR
29
EF
55
533
3F
:T
TC
TA
AT
CC
TG
AT
GC
TT
AC
GG
AC
(AG
AT
) 13
54
12
17
8–2
38
R:
AT
TT
GT
CC
AT
GC
TT
GC
CT
GT
GR
38
EF
55
533
4F
:C
CG
CT
GC
TT
GA
CA
TA
TC
CA
T(A
GA
T) 1
65
81
22
47
–3
72
R:
TA
TG
CA
CA
AC
AT
TC
CC
GT
GT
GR
39
EF
555335
F:
TG
AA
AC
TG
GG
AA
CT
GG
CT
CT
(GA
TA
) 84
89
28
7–4
65
R:
AA
AC
TG
CC
AG
AA
GC
CT
CA
TA
316 Biochem Genet (2010) 48:312–325
123
then compared with observed counts in the data set. If the observed counts were
lower than the expected, it was concluded that null alleles were not an influencing
factor. Micro-Checker (van Oosterhout et al. 2003) was then used to test for
stuttering and large allele dropout.
The Wahlund effect may occur if breeding subunits are present inside the studied
population. To test for this effect we used the maximum likelihood method in the
PartitionML program (Castric et al. 2002), which addresses the issues of detecting
hidden population structure and assigning individuals to their population of origin.
The chi-square test was used to assess the significance of the partition.
The degree of genetic differentiation between HY1997 and HY2006 was
evaluated by analysis of molecular variance (AMOVA, Excoffier et al. 1992) with
Arlequin version 2.000, and another Fst analog, h (Weir and Cockerham 1984),
with the Fstat software. The Fst analog (h) was tested for significance after
Bonferroni corrections, and its variances were determined by jackknifing over loci.
Differences in observed heterozygosity, expected heterozygosity, and number of
alleles per locus between two temporal samples were determined with a
nonparametric Wilcoxon signed-rank test. Fisher’s exact test was used to perform
pairwise comparison of allele frequencies at individual loci between HY1997 and
HY2006. To test whether bottlenecks (i.e., drastic reductions in the number of
effective breeders) had occurred in the topotype population during the sampling
period, we used the Bottleneck software (Cornuet and Luikart 1996).
The effective population size (Ne) is an important parameter of conservation
biology because it determines the potential for genetic drift in populations. Genetic
drift influences the rate of loss of genetic diversity, the rate of fixation of deleterious
alleles, and the efficiency of natural selection at maintaining beneficial alleles
(Berthier et al. 2002). We used the traditional moment estimator of Waples (1989,
Eqs. 8, 11) to obtain a temporal estimation of Ne in the G. rarus topotype
population, based on the temporal allele frequencies. A key assumption of this
technique is that systematic forces (selection, mutation, and migration) are
unimportant, relative to genetic drift, in changing allele frequencies. Here we
assumed that sample collection occurred according to plan 2 (Nei and Tajima 1981;
Waples 1989) and that effective population size was stable during the sampling
period. Confidence intervals (95%) for Ne were calculated using equation 16 in
Waples (1989). The number of generations between sampling periods was
calculated, using two generations per year as a basis (Wang 1992), even though
overlapping generations of G. rarus may exist.
Results
Microsatellite Isolation
Of all isolated microsatellites, 45.7% had tetranucleotide repeats, which were
mainly GATA, AGAT, and ATCT motifs. Many of them presented abundant
repeats, such as 13, 28, and 38 times. According to the flanking regions of these
microsatellite loci, 43 pairs of microsatellite primers were designed. Eighteen usable
Biochem Genet (2010) 48:312–325 317
123

microsatellite loci, of which 11 were polymorphic (GenBank accession nos.
EF555325-EF555335) and seven monomorphic (EF555336-EF555342), were
obtained by constructing the microsatellite-enriched genomic library. When the
inheritance of each usable marker within a family was examined, all alleles
observed in both parents were found to segregate in a codominant Mendelian
fashion among the offspring. Among the 18 usable microsatellite loci, six loci
presented tetranucleotide repeats. The polymorphic primer information and
GenBank accession numbers are listed in Table 1.
Measures of Genetic Diversity
Eleven polymorphic microsatellite loci were used to determine the level of genetic
diversity within the G. rarus topotype population. The number of alleles per locus
ranged from 2 to 12, and the sizes ranged from 86 to 465 bp (Table 1). Overall 61
alleles were obtained, 59 in HY1997 and 55 in HY2006 (mean number of alleles,
5.36 and 5.00, respectively; Table 2). Genetic diversity was also evaluated by the
number of effective alleles for each locus (Table 2). The number of effective alleles
was lower than the number of observed alleles for all loci except three (GR03,
GR09, and GR25).
Sequential Bonferroni correction revealed no significant linkage disequilibrium
between any of the locus pairs. Significant departures from Hardy–Weinberg
equilibrium were detected, however, in the two temporal samples after the
Table 2 Genetic variation of microsatellites in two temporal samples, HY1997 and HY2006, of
Gobiocypris rarus
Locus HY1997 HY2006
A Ae Ho He Fis (W&C) A Ae Ho He Fis (W&C)
GR03 2 1.43 0.23 0.33 0.237 2 1.83 0.30 0.46 0.356
GR07 4 3.38 0.70 0.72 0.023 4 2.64 0.27* 0.66 0.582
GR08 5 4.31 0.73 0.79 0.062 5 3.93 0.83 0.76 -0.101
GR09 2 1.99 0.23* 0.54 0.545 3 2.12 0.23* 0.56 0.571
GR16 5 1.93 0.50 0.51 -0.019 4 1.37 0.27 0.30 0.021
GR21 4 1.46 0.13* 0.35 0.590 2 1.10 0.10 0.13 -0.036
GR22 3 2.42 0.60* 0.61 -0.006 2 1.60 0.30 0.38 0.216
GR25 2 2.00 0.40 0.51 0.216 2 1.99 0.27* 0.54 0.477
GR29 12 5.47 0.83 0.84 -0.003 12 6.67 0.73 0.86 0.154
GR38 12 8.37 0.83 0.90 0.071 12 8.70 0.87 0.91 0.038
GR39 8 2.84 0.53 0.67 0.194 7 2.29 0.40 0.59 0.305
Mean 5.36 3.24 0.52 0.62 0.135 5.00 3.11 0.42 0.56 0.240
Note: HY1997 represents the samples (30 individuals) collected from the type locality in 1997; HY2006
represents the samples (30 individuals) collected from the type locality in 2006. A, number of alleles; Ae,
number of effective alleles; Fis (W&C), estimator of F-statistics following Weir and Cockerham 1984;
Ho, observed heterozygosity; He, expected heterozygosity
* Significant deviation from Hardy–Weinberg equilibrium
318 Biochem Genet (2010) 48:312–325
123
sequential Bonferroni correction. Three loci deviated from Hardy–Weinberg
equilibrium in each temporal sample (Table 2). These loci showed a significant
deficiency of heterozygotes, with the exception of locus GR22 in HY1997.
Heterozygote deficiency was also indicated by the Fis values. Across loci, the Fis
values were 0.135 for HY1997 and 0.240 for HY2006 and showed borderline
significance.
The range of observed heterozygosity was 0.13–0.83 (mean, 0.52) in HY1997
and 0.10–0.87 (mean, 0.42) in HY2006 (Table 2). The range of expected
heterozygosity was 0.33–0.90 (mean, 0.62) in HY1997 and 0.13–0.91 (mean,
0.56) in HY2006 (Table 2).
Following Brookfield’s equation, the expected number of null homozygotes was
greater than the actual number observed in 9 of the 11 loci, allowing us to reject the
possibility of nulls. For loci GR07 and GR09, null alleles could not be rejected.
Using Micro-Checker, no stuttering or large allele dropout was found for any of the
loci. None of the partition log-likelihood values deviated significantly from the null
distribution of a homogeneous population by chi-square test, which therefore argued
against a Wahlund effect.
Temporal Genetic Variation
No genetic diversity estimates, including observed heterozygosity, expected heter-
ozygosity, and number of alleles per locus, showed any significant changes between
HY1997 and HY2006 (Wilcoxon: P [ 0.05). F-statistics also revealed no differences
between the two temporal samples (Fst = 0.01117, P [ 0.05; h = 0.008 ± 0.006,
P [ 0.05). Similarly, no significant differences were observed in pairwise compar-
isons of allele frequency distributions over most loci between the two temporal
samples (Fisher’s exact test: P [ 0.05), with the exception of loci GR21 and GR22
(P \ 0.05). These exceptions may be induced by two alleles (145 in locus GR21 and
180 in GR22), which exhibited relatively high frequencies in HY1997 but disappeared
in HY2006. In addition, four other alleles with low frequencies in HY1997 (153 in
locus GR16, 139 in locus GR21, and 453 and 465 in locus GR39) were not detected in
HY2006. Two new alleles with low frequencies (180 in locus GR09 and 285 in locus
GR39) were detected in HY2006, underlining the temporal fluctuation. No significant
heterozygosity excess was revealed during the sampling period at mutation-drift
equilibrium (P [ 0.05), which indicated that the G. rarus topotype population had not
experienced bottleneck effects in nearly 10 years. Based on the temporal fluctuations
of the 11 microsatellite loci, Ne for the topotype population was 645, with a 95%
confidence interval of 237–11,735.
Discussion
Diversity Within the Topotype Population
Our study revealed relatively high levels of intrapopulation diversity in the G. rarustopotype population. The results resembled those reported by Liao et al. (2007) and
Biochem Genet (2010) 48:312–325 319
123
Shao et al. (2009), in which the He of the G. rarus topotype population was 0.65 in
1997 and 0.57 in 2006, though different sample individuals and different
microsatellite primers were used.
In comparison with other cyprinid fishes in the Yangtze River, G. rarus had an
expected heterozygosity similar to that of Ctenopharyngodon idellus (He = 0.48–
0.65; Liao et al. 2005) and Coreius heterodon (He = 0.51; Liao et al. 2006), but a
little higher than that of Aristichthys nobilis (He = 0.42–0.45; Geng et al. 2006) and
lower than that of Coreius guichenoti (He = 0.73; Xu et al. 2007). Dewoody and
Avise (2000) summarized the genetic variation of 13 species with 75 microsatellites
and found that the average heterozygosity per freshwater fish species across loci was
0.54 ± 0.25. Consequently, the level of genetic diversity in the G. rarus topotype
population was moderate.
In the present study, heterozygote deficiency was found in several loci, and
relatively high global Fis values for each sample tended to indicate the existence of
heterozygote deficits within the topotype population. This result was similar to that
of Liao et al. (2007), which also found a relatively high Fis value in G. rarus.
Generally, heterozygote deficits may be linked to multiple causes: genotyping
artifacts, the Wahlund effect, nonrandom mating, and natural selection (Castric
et al. 2002; Morand et al. 2002). In our study, genotyping artifacts may be excluded
because of the following findings: (1) null alleles were not a factor in most loci; (2)
no stuttering or large allele dropout was found; and (3) reamplification tests of some
loci did not decrease the number of observed homozygotes. The Wahlund effect
may be another important cause of the heterozygote deficiency (Johnson and Black
1984; Castric et al. 2002; Morand et al. 2002), but no significant hidden population
structure was detected in the G. rarus topotype population, which argues against the
Wahlund effect as a systematic explanation for the observed deficiency. After
genotyping artifacts and the Wahlund effect were ruled out, inbreeding appeared to
be the major source of the observed deficits. As mentioned earlier, G. rarus lives in
groups in small water systems such as paddy fields, rivulets, ditches, and loblollies
(Ye and Fu 1983; Wang 1992). In such habitats (for instance, in a ditch), large
numbers of offspring reproduced by a few parents may compose the main part of the
small stock, and therefore inbreeding occurs more frequently than random mating
within the stock. Natural selection, which usually acts on long-term evolutionary
processes, was also considered as a possible cause of heterozygote deficiency. In
this study, however, it is difficult to confirm whether natural selection played an
important role throughout the sampling period.
Maintenance of Genetic Variation
The forces maintaining genetic variation among natural populations are still poorly
understood and are the subject of much debate. Many studies widely supported a
role for environmental variability in the maintenance of genetic variation, since
unstable environments tended to select life history traits that could increase the
intrinsic rates of population growth and genetic variation (Mitton and Lewis 1989).
For example, this role has been supported by a study of mosquitofish. Heterozy-
gosities were higher in this species when populations originated from fluctuating
320 Biochem Genet (2010) 48:312–325
123
reservoirs rather than stable ones in Hawaii, suggesting that environmental
fluctuations played an important role in genetic variation (Scribner et al. 1992).
Other studies have also concluded that extrinsic factors (i.e., unstable environmental
conditions) might promote changes in the genetic structure of natural populations of
some species (Garant et al. 2000; Roark et al. 2001; Østergaard et al. 2003; Barcia
et al. 2005; Huang et al. 2005; Cena et al. 2006). Besides environmental factors,
biological factors such as genetic drift and natural selection could also mold genetic
patterns (Alam and Islam 2005; Barcia et al. 2005; Crispo et al. 2006; Makinen et al.
2006; Gutierrez-Rodrıguez et al. 2007; Lee and Boulding 2007; Rahman et al.
2008). Genetic drift is most important in small populations, while natural selection
is more effective in larger populations and could be enhanced by unstable
environments (Frankham et al. 2002).
Our data suggested that the type locality of G. rarus held a single population with
a relatively large Ne and no cryptic structure. During the sampling period, temporal
genetic variation was limited. The main fluctuations were expressed via changes of
allelic frequencies over two loci, a loss of six alleles, and the appearance of two new
alleles. The topotype population had not experienced a bottleneck effect, so genetic
fluctuations in our study were not due to bottlenecks. At the same time, inbreeding
not only was considered to be the main cause of the observed heterozygote deficits
but also may have been responsible for the change in allelic richness and even the
change in allelic frequencies over some loci. Nevertheless, genetic diversity and
allelic frequencies over most loci did not vary significantly during the sampling
period. Thus, the topotype population might maintain its genetic stability in the near
future.
The effective population size, living habit preferences, and habitat properties of
G. rarus seem to be taken into account as possible causes of genetic variation and its
maintenance, although this is difficult to test with the present data. The effective
size of the topotype population was estimated to be 645. When an effective
population size is larger than 500, it can be preserved to sustain long-term
evolutionary potential; thus inbreeding and genetic drift may have limited influence
on the decline of genetic diversity (Frankham et al. 2002). The observed rate of loss
of heterozygosity in the G. rarus topotype population was 9.7% within 20
generations, or about a 0.48% reduction for each generation. This rate is
considerably lower than 1%, the rate that is often regarded as the limit for an
acceptable level of inbreeding per generation (Franklin 1980; Frankel and Soule
1981), indicating that natural selection is expected to offset inbreeding depression.
Consequently, inbreeding did not induce dramatic depression effects on the
topotype population, although it actually existed in each temporal sample.
The habitats of G. rarus fluctuate and are easily influenced by seasonal
environmental changes (drought, floods, rainstorms) and human activities. If the
habitat variation is not tremendous, the population magnitude effect could be
recruited rapidly due to the species’ short life cycle (mature at about 4 months old)
and high fecundity. The rare minnow is a continuous batch spawner. During a long
breeding season, a mature female can lay hundreds of eggs in intervals of several
days (Wang 1992). In such a case, some batches of offspring may be endangered
when sudden environmental changes occur, yet other batches may survive and
Biochem Genet (2010) 48:312–325 321
123
induce effective reproduction. This mechanism is beneficial for maintaining a large
Ne. Simultaneously, surviving individuals from different habitat patches mix
together and relocate in the patches where the habitat change occurred, resulting in
greater gene flow within the population. Therefore, habitat fluctuation, relocation of
survivors, and rapid multiplication may be the main natural and biological forces
that maintain the stability of G. rarus gene frequencies, even though inbreeding
exists in stocks within the topotype population.
In conclusion, the G. rarus topotype population was healthy and stable,
exhibiting moderate genetic diversity, limited temporal variation, relatively large
effective population size, and no subpopulation structure. Under the habitat
conditions and anthropogenic disturbances in the past years, the topotype population
tended to maintain long-term evolutionary potential. The present study indicates
that inbreeding may exist in some small fishes like G. rarus, which live in small
water systems within a narrow habitat. Species that live in fluctuant habitat usually
have high fecundity. Extrinsic factors (i.e., environmental changes) and life history
traits are thus the main forces that maintain genetic diversity. To some extent,
habitat fluctuation is beneficial for maintaining genetic diversity if the fluctuation
does not cause a dramatic change in demography.
Conservation Implications
It is helpful for us to propose conservation measures for the G. rarus topotype
population after understanding the status of its genetic structure and the ecological
mechanism behind diversity maintenance. The type locality has suffered greater
anthropogenic disturbances in recent years, and their effects did not tend to
diminish. Along with the aggravation of habitat destruction and disturbance in the
type locality, population size or the number of effective breeders may decline.
Considering the wide 95% confidence interval range and the estimation error of Ne,
the actual effective population size may be lower than the estimated size. If the
effective population size drops to a certain level, such as 500 or fewer, the
population would become demographically unstable. Meanwhile, bottleneck effects,
genetic drift, and even inbreeding would eventually reduce genetic diversity, further
threatening population viability.
We suggest the establishment of a habitat and species management area consisting
of the floodplain along the Liusha River from Qianyu village (29�3008.100 N,
102�35017.000 E, altitude 996 m) to Fuchun village (29�28037.300 N, 102�37035.400 E,
939 m). In this reserve area, habitat destruction should be intensely reduced, including
avoidance of factory construction, management of fertilizer and pesticide applica-
tions, restriction of land use, and so on. Meanwhile, G. rarus population dynamics and
genetic structure should be monitored to help with the management of the topotype
population and its type locality.
Acknowledgments The authors are most grateful to Zhu B, Que YF, Xiang W, and Cheng L for their
technical assistance. We also thank Professors Tong JG and Zhang FT for discussing the manuscript with
us and Dr. Candida Shinn for assisting with English phrasing. This research was supported by funds from
the NSFC (30670292), Science Innovation of Chinese Academy of Sciences (KSCX2-SW-125), and the
322 Biochem Genet (2010) 48:312–325
123
technological fundamental conditions platform program by China Hubei Provincial Science and
Technology Department.
References
Alam MS, Islam MS (2005) Population genetic structure of Catla catla (Hamilton) revealed by
microsatellite DNA markers. Aquaculture 246:151–160
Aljanabi SM, Martinez I (1997) Universal and rapid salt-extraction of high quality genomic DNA for
PCR-based techniques. Nucleic Acids Res 25:4692–4693
Barcia AR, Lopez GE, Hernandez D, Garcıa-Machado E (2005) Temporal variation of the population
structure and genetic diversity of Farfantepenaeus notialis assessed by allozyme loci. Mol Ecol
14:2933–2942
Berthier P, Beaumont MA, Cornuet J, Luikart G (2002) Likelihood-based estimation of the effective
population size using temporal changes in allele frequencies: a genealogical approach. Genetics
160:741–751
Blanco G, Ramos MD, Vazquez E, Sanchez JA (2005) Assessing temporal and spatial variation in wild
populations of Atlantic salmon with particular reference to Asturias (northern Spain) rivers. J Fish
Biol 67(Suppl. A):169–184
Brookfield JFY (1996) A simple method for estimating null allele frequency from heterozygote
deficiency. Mol Ecol 5:453–455
Castric V, Bernatchez L, Belkhir K, Bonhomme F (2002) Heterozygote deficiencies in small lacustrine
populations of brook charr Salvelinus fontinalis Mitchill (Pisces, Salmonidae): a test of alternative
hypothesis. Heredity 89:27–35
Cena CJ, Morgan GE, Malette MD, Heath DD (2006) Inbreeding, outbreeding and environmental effects
on genetic diversity in 46 walleye (Sander vitreus) populations. Mol Ecol 15:303–320
Chen YY (1998) Fauna Sinica, Osteichthyes, Cypriniformes II. Science Press, Beijing, China, pp 51–52
(in Chinese)
Cornuet JM, Luikart G (1996) Description and power analysis of two tests for detecting recent population
bottlenecks from allele frequency data. Genetics 144:2001–2014
Crispo E, Bentzen P, Reznick DN, Kinnison MT, Hendry AP (2006) The relative influence of natural
selection and geography on gene flow in guppies. Mol Ecol 15:49–62
Dewoody JA, Avise JC (2000) Microsatellite variation in marine, freshwater and anadromous fishes
compared with other animals. J Fish Biol 56:461–473
Ding RH (1994) The fishes of Sichuan, China. Sichuan Publishing House of Science and Technology,
Chengdu (in Chinese)
Excoffier L, Smouse PE, Quattro JM (1992) Analysis of molecular variance inferred from metric distance
among DNA haplotypes: application to human mitochondrial DNA restriction data. Genetics
131:479–491
Florin A, Hoglund J (2007) Absence of population structure of turbot (Psetta maxima) in the Baltic Sea.
Mol Ecol 16:115–126
Frankel OH, Soule M (1981) Conservation and evolution. Cambridge University Press, Cambridge,
England
Frankham R, Ballou JD, Briscoe DA (2002) Introduction to conservation genetics. Cambridge University
Press, New York
Franklin IA (1980) Evolutionary change in small populations. In: Soule ME, Wilcox BA (eds)
Conservation biology: an evolutionary-ecological perspective. Sinauer Associates, Sunderland, MA,
pp 135–150
Garant D, Dodson JJ, Bernatchez L (2000) Ecological determinants and temporal stability of the within-
river population structure in Atlantic salmon (Salmo salar L.). Mol Ecol 9:615–628
Geng B, Sun XW, Liang LQ, Ouyang HS, Tong JG (2006) Microsatellite analysis of genetic diversity of
Aristichthys nobilis in China. Hereditas 28(6):683–688
Goudet J (2001) Fstat, a program to estimate and test gene diversities and fixation indices (version 2.9.3).
http://www2.unil.ch/popgen/softwares/fstat.htm
Guo S, Thompson E (1992) Performing the exact test of Hardy–Weinberg proportion for multiple alleles.
Biometrics 48:361–372
Biochem Genet (2010) 48:312–325 323
123
Gutierrez-Rodrıguez C, Morris MR, Dubois NS, De Queiroz K (2007) Genetic variation and
phylogeography of the swordtail fish Xiphophorus cortezi (Cyprinodontiformes, Poeciliidae). Mol
Phylogenet Evol 43:111–123
Huang Z, Liu N, Zhou T, Ju B (2005) Effects of environmental factors on the population genetic structure
in chukar partridge (Alectoris chukar). J Arid Environ 62:427–434
Johnson MS, Black R (1984) The Wahlund effect and the geographical scale of variation in the intertidal
limpet Siphonaria sp. Mar Biol 79:295–302
Le PQ, Chen YY (1998) China red data book of endangered animals: Pisces. Science Press, Beijing,
pp 170–172 (in Chinese)
Lee HJ, Boulding EG (2007) Mitochondrial DNA variation in space and time in the northeastern Pacific
gastropod, Littorina keenae. Mol Ecol 16:3084–3103
Li L, Ma TW, Wu ZB (2004) Toxic effect of domestic sewage on rare minnow (Gobiocypris rarus). Acta
Hydrobiol Sin 28(1):40–44 (in Chinese)
Liao XL, Yu XM, Tan DQ, Tong JG (2005) Microsatellite DNA analysis of genetic diversity of grass
carp in Yangtze River system. Acta Hydrobiol Sin 29(2):113–119 (in Chinese)
Liao XL, Zhu B, Yu XM, Tan DQ, Chang JB, Tong JG (2006) Isolation and characterization of
polymorphic microsatellites in a Yangtze River fish, brass gudgeon (Coreius heterodon Bleeker).
Mol Ecol Notes 6:393–395
Liao XL, Wang D, Yu XM, Li WT, Cheng L, Wang JW, Tong JG (2007) Characterization of novel
microsatellite loci in rare minnow (Gobiocypris rarus) and amplification in closely related species in
Gobioninae. Conserv Genet 8:1003–1007
Lu L, Shen YW (2002) Acute toxicity of phenol, alkyl benzene, nitrobenzene and water sample to sword
fish (Xiphophorus helleri) and rare minnow (Gobiocypris rarus). Res Environ Sci 15(4):57–59 (in
Chinese)
Makinen HS, Cano JM, Merila J (2006) Genetic relationships among marine and freshwater populations
of the European three-spined stickleback (Gasterosteus aculeatus) revealed by microsatellites. Mol
Ecol 15:1519–1534
Martınez-Cruz B, Godoy JA, Negro JJ (2007) Population fragmentation leads to spatial and temporal
genetic structure in the endangered Spanish imperial eagle. Mol Ecol 16:477–486
Mitton JB, Lewis WM Jr (1989) Relationships between genetic variability and life-history features of
bony fishes. Evolution 43:1712–1723
Morand M-E, Brachet S, Rossignol P, Dufour J, Frascaria-Lacoste N (2002) A generalized heterozygote
deficiency assessed with microsatellites in French common ash populations. Mol Ecol 11:377–385
Nei M, Tajima F (1981) Genetic drift and estimation of effective population size. Genetics 98:625–640
Nielsen EE, Hansen MM, Loeschcke V (1997) Analysis of microsatellite DNA from old scale samples of
Atlantic salmon Salmo salar: a comparison of genetic composition over 60 years. Mol Ecol 6:487–
492
Østergaard S, Hansen MM, Loeschcke V, Nielsen EE (2003) Long-term temporal changes of genetic
composition in brown trout (Salmo trutta L.) populations inhabiting an unstable environment. Mol
Ecol 12:3123–3135
Rahman S, Zakaria-Ismail M, Tang PY, Muniandy S (2008) Microsatellite analysis of wild and captive
populations of Asian arowana (Scleropages formosus) in Peninsular Malaysia. J Biol Sci 8(3):517–
525
Raymond M, Rousset F (1995) GENEPOP (version 1.2): population genetics software for exact tests and
ecumenicism. J Hered 86:248–249
Rice WR (1989) Analysing tables of statistical tests. Evolution 43:223–225
Roark SA, Andrews JF, Guttman SI (2001) Population genetic structure of the Western mosquitofish,
Gambusia affinis, in a highly channelized portion of the San Antonio River in San Antonio, TX.
Ecotoxicology 10:223–227
Schneider S, Roessli D, Excoffier L (2000) Arlequin ver. 2.000: a software for population genetics data
analysis. Genetics and Biometry Laboratory, University of Geneva, Switzerland
Scribner KT, Wooten MC, Smith MH, Kennedy PK, Rhodes OE Jr (1992) Variation in life history and
genetic traits of Hawaiian mosquitofish populations. J Evol Biol 5:267–288
Shao Y, Wang JW, He YF, Cao WX, Tong JG (2009) The application of microsatellite markers on
genetic quality control of an inbred strain of Gobiocypris rarus. Acta Hydrobiol Sin 33(4):649–655
(in Chinese)
Templeton AR (2006) Population genetics and microevolutionary theory. John Wiley & Sons, Hoboken,
NJ
324 Biochem Genet (2010) 48:312–325
123
Tessier N, Bernatchez L (1999) Stability of population structure and genetic diversity across generations
assessed by microsatellites among sympatric populations of landlocked Atlantic salmon (Salmosalar L.). Mol Ecol 8:169–179
van Oosterhout C, Hutchinson B, Wills D, Shipley P (2003) Micro-Checker, microsatellite data checking
software. http://www.microchecker.hull.ac.uk/
Wang JW (1992) Reproductive biology of Gobiocypris rarus. Acta Hydrobiol Sin 16(2):165–174 (in
Chinese)
Wang JW (1996) Studies on critical temperature of Gobiocypris rarus. Sichuan Zool 15(4):153–155 (in
Chinese)
Wang JW (1999) Spawning performance and development of oocytes in Gobiocypris rarus. Acta
Hydrobiol Sin 23(2):161–166 (in Chinese)
Wang JW, Cao WX (1997) Gobiocypris rarus and fishes as laboratory animals. Trans Chinese Ichthyol
Soc 6:144–152 (in Chinese)
Wang S, Xie Y (eds) (2004) China species red list: red list, vol 1. Higher Education Press, Beijing, p 154
(in Chinese)
Wang ZH, Yin YW, Xu ZN, Zhou J, Zhang Q, Zhang DP (1998) Acute and subchronic toxicity of
pyrethroid insecticides to Gobiocypris rarus. Chinese Appl Environ Biol 4(4):379–382 (in Chinese)
Waples RS (1989) A generalized approach for estimating effective population size from temporal
changes in allele frequency. Genetics 121:379–391
Weir BS, Cockerham CC (1984) Estimating F-statistics for the analysis of population structure. Evolution
38:1358–1370
Wu GQ, Sun XB, Chen JP, Xu LH, Wu ZB (2000) Acute toxicity of domestic detergents on fishes. Acta
Hydrobiol Sin 24(4):396–398 (in Chinese)
Xiong DM, Xie CX, Xia L (2007) Threatened fishes of the world: Gobiocypris rarus Ye and Fu, 1983
(Cyprinidae). Environ Biol Fish. doi:10.1007/s10641-007-9284-8
Xu SY, Zhang Y, Wang DQ, Li ZH, Chen DQ (2007) Genetic diversity in largemouth bronze gudgeon
(Coreius guichenoti Sauvage et Dabry) from Yibin section of Yangtze River based on sequence of
microsatellite DNA. Freshw Fish 37(3):76–79 (in Chinese)
Ye MR, Fu TY (1983) Description of a new genus and species of Danioninae from China (Cypriniformes:
Cyprinidae). Acta Zootaxon Sin 8(4):434–437 (in Chinese)
Zane L, Bargelloni L, Patarnello T (2002) Strategies for microsatellite isolation: a review. Mol Ecol 11:1–
16
Zhou YX, Cheng SP, Hu W (1995) The Gobiocypris rarus seven-day subchronic toxicity test. Acta Sci
Circum 15(3):375–380 (in Chinese)
Biochem Genet (2010) 48:312–325 325
123

P4
Genetic structure of an endangered endemic fish (Gobiocypris rarus) in the upper
Yangtze River
He Y., Wang J., Blanchet S. & Lek S. (2010)
Journal of Fish Biology
(Submitted)

Genetic structure of an endangered endemic fish (Gobiocypris rarus)
in the upper Yangtze River
Yongfeng He1, 2, Jianwei Wang1, *, Simon Blanchet2, 3, Sovan Lek2
1 Institute of Hydrobiology, Chinese Academy of Sciences, Wuhan, Hubei 430072,
China; 2 Université de Toulouse, Lab. Evolution & Diversité Biologique, UMR 5174,
CNRS – 118, route de Narbonne – 31062 Toulouse, Cedex 4, France; 3 Station
d’Ecologie Expérimental du CNRS à Moulis, Lab. USR 2936, 09 100 Moulis, France
(*Corresponding author: Phone: +86-27-68780033; Fax number: +86-27-68780065;
E-mail: [email protected]; Address: Institute of Hydrobiology, Chinese Academy of
Sciences, 7# Donghu South Road, Wuhan, Hubei 430072, China)
ABSTRACT
The goal of this study was to examine the genetic diversity and structure of wild
populations of rare minnow (Gobiocypris rarus) in the Sichuan Basin (the upper
Yangtze River, China). Individuals from nine sites were sampled and genotyped at
eight microsatellite markers. There were no significant differences between sites
concerning the allelic richness and expected heterozygosity, while highly significant
differences in allelic frequencies were found. Our results further suggested significant
levels of site differentiation (FST: 0.0130-0.1537). Specifically, two distinct genetic
clusters (C1 and C2) were highlighted using the STRUCTURE software. The analysis
of the frequency distribution of alleles between clusters revealed a possible
introgression from one cluster (C1) into the other (C2). In addition, we found a weak
but significant isolation-by-distance pattern that was best explained by riparian
distance through man-made channels rather than by water course distance and straight
line distance. Although no significant recent migration event was found between the
two clusters, our result suggested that fish might use man-made channels for
migration. Therefore, this study highlights the need to consider the genetic
specificities of G. rarus for protecting and sustaining long-term survival of this
species.
Key words: genetic differentiation, gene flow, Gobiocypris rarus, conservation
implications
INTRODUCTION
The topic of how genetic diversity is spatially structured, either within or
between populations, has focused the attention of many studies (Kraaijeveld-Smit et
al., 2005; Bergl & Vigilant, 2007; Björklund et al., 2007; Zamudio & Wieczorek,
2007; Zayed & Packer, 2007; Aspi et al., 2009; Devillard et al., 2009). This
information is crucial for understanding the evolutionary history and population
dynamics of species. In addition, understanding the genetic structure of threatened
species in degraded or fragmented habitats is a key point for their effective
conservation (Frankham et al., 2002). For instance, the accurate identification of
populations with the greatest allelic variation and hence evolutionary potential
provide basic knowledge for suggesting the priority areas to be protected (Moritz,
1994; Frankham et al., 2002).
Genetic differentiation among populations is a key component of genetic
diversity. In order to determine overall population structure, it is necessary to know
the level of both intra- and inter- population variation, to understand the underlying
processes driving this variation (Frankham et al., 2002). Genetic markers and their
analytical approaches available for inferring population structure have become highly
developed in recent decades (Ciofi & Bruford, 1999; Paetkau et al., 1999; Aspi et al.,
2006; Devillard et al., 2009). Among all molecular markers, microsatellites in the
nuclear genome have been widely applied because they usually provide the most
comprehensive description of the effects of subdivision upon the genetic variation of
populations and have the potential to estimate contemporary migrations (Selkoe &
Toonen, 2006). In microsatellite data analysis, although a conventional approach such
as Wright’s F-statistics has been commonly used (Wright, 1978), individual-based
Bayesian approaches have recently developed as a complementary approach due to
their greater precision (Stow et al., 2001; Manel et al., 2003; Beaumont & Rannala,
2004; Pearse & Crandall, 2004; Zamudio & Wieczorek, 2007; Aspi et al., 2009). In
addition, instead of direct methods such as capture-mark-recapture (CMR), indirect
methods have been employed and applied extensively to estimate recent migration
and gene flow from molecular marker data by overcoming the limitation of study
areas and samplings (Koenig et al., 1996; Pritchard et al., 2000; Wilson & Rannala,
2003; Piry et al., 2004; Zamudio & Wieczorek, 2007; Aspi et al., 2009; Schlosser et
al., 2009).
The genetic structuring of populations may be due to a variety of factors, e.g.,
environmental barriers, historical processes, life histories (mating systems) and
geographical isolation (Gerlach & Musolf, 2000; Johnson, 2000; Björklund et al.,
2007). These factors are usually related to evolutionary processes, i.e., gene flow,
genetic drift, selection and to a lesser extent mutation (Frankham et al., 2002). The
relationships between dispersal, gene flow and population genetic structure have been
the subject of many studies during recent decades (Slatkin, 1985; Bohonak, 1999;
Stow et al., 2001; Kraaijeveld-Smit et al., 2005; Zamudio & Wieczorek, 2007; Aspi
et al., 2009; Floyd et al., 2009). Especially in the management of endangered species,
one of the most important issues is inferring individual movements between
populations, and predicting their consequences on population genetic structures and
evolutionary potential (Crandall et al., 2000; Fraser & Bernatchez, 2001; Frankham et
al., 2002; Schlosser et al., 2009). Therefore, populations in different habitat fragments
may be totally isolated, partially isolated, effectively a single population, or a meta-
population, depending on the extent of gene flow (Frankham et al., 2002).
Rare minnow, Gobiocypris rarus Ye et Fu, is an endemic cyprinid fish in China
(Chen, 1998; Ye & Fu, 1983). It has been used as an aquatic laboratory animal and
extensively applied in toxicology, fish pathology, developmental biology and genetics
(Wang, 1992; Wang et al., 1994; Wang, 1996; Wang & Cao, 1997; Wang, 1999; Jia
et al., 2002; Zhong et al., 2005; Pei et al., 2008; Su et al., 2008). Meanwhile, rare
minnow is considered as an “endangered” species, mainly resulting from
anthropogenic disturbance, for instance, pollution from pesticides and sewage, and
water conservancy for farmland including channelized habitat and disordered water
diversion (Le & Chen, 1998; Wang et al., 1998; Li et al., 2004; Wang & Xie, 2004;
Xiong et al., 2009).
G. rarus lives mainly in small water systems, such as paddyfields and ditches.
Remnant populations were only identified in the west region of Sichuan Province of
China (Ding, 1994; Wang & Cao, 1997; Chen, 1998; Le & Chen, 1998). Specifically,
important remnant populations were discovered during a field investigation conducted
by some of the authors (Y He and J Wang) on a relatively large scale in April 2008.
All known habitats of rare minnow are located dozens to hundreds of miles away
from one another, exhibiting discontinuous distribution.
In this study, our primary objective was to assess and describe the genetic
structure of wild populations of G. rarus on a relatively large spatial scale. To do this,
we used eight microsatellite markers for quantifying genetic diversity (allelic
richness, heterozygosity) of G. rarus originating from remnant populations located in
the Sichuan Basin. In addition, we used a variety of tools (Isolation-by-distance,
BAYESASS) to estimate gene flow and recent migration events within these
populations.
MATERIAL AND METHODS
SAMPLING LOCATION, TISSUE COLLECTION AND DNA EXTRACTION
Rare minnow were sampled from nine localities containing enough samples to be
used in genetic populations’ studies. They were mainly located at the edge of the west
and northwest area of the Sichuan Basin (Fig. 1). Four river basins (the downstream
of the Dadu River, the middle and downstream of the Qingyi River, the middle stream
of the Minjiang River, the upstream of the Tuojiang River) were involved in these
locations (Fig. 1). All the rivers concerned are tributaries of the upper Yangtze River.
They were sampled from the 12th to the 30th April 2008.
We used nets to sample a total of 416 individuals, i.e., 30-50 individuals per site
(Table I). After capture, the fish were placed into a water vat to keep them alive
during transportation. To obtain genetic material, a piece of fin was removed and
stored in 95% ethanol at -20 ºC until further analysis.
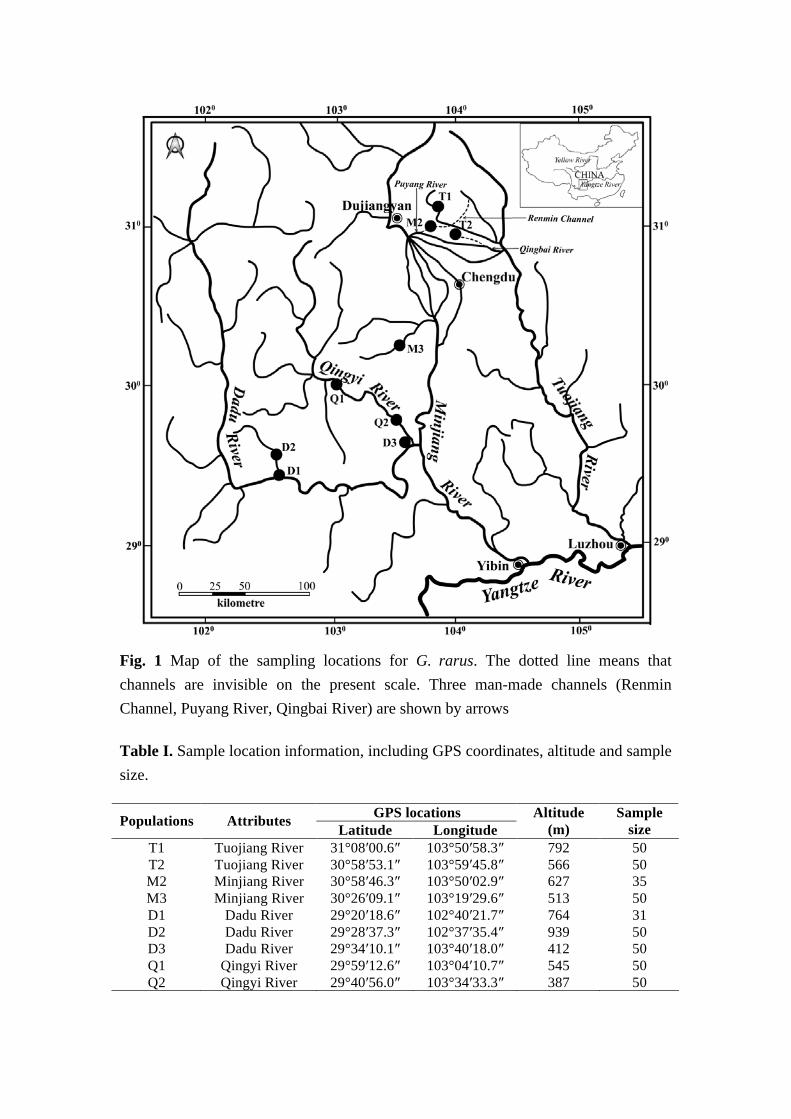
Fig. 1 Map of the sampling locations for G. rarus. The dotted line means that channels are invisible on the present scale. Three man-made channels (Renmin Channel, Puyang River, Qingbai River) are shown by arrows
Table I. Sample location information, including GPS coordinates, altitude and sample size.
GPS locations Populations Attributes Latitude Longitude Altitude
(m) Sample
size T1 Tuojiang River 31°08′00.6″ 103°50′58.3″ 792 50 T2 Tuojiang River 30°58′53.1″ 103°59′45.8″ 566 50 M2 Minjiang River 30°58′46.3″ 103°50′02.9″ 627 35 M3 Minjiang River 30°26′09.1″ 103°19′29.6″ 513 50 D1 Dadu River 29°20′18.6″ 102°40′21.7″ 764 31 D2 Dadu River 29°28′37.3″ 102°37′35.4″ 939 50 D3 Dadu River 29°34′10.1″ 103°40′18.0″ 412 50 Q1 Qingyi River 29°59′12.6″ 103°04′10.7″ 545 50 Q2 Qingyi River 29°40′56.0″ 103°34′33.3″ 387 50

MICROSATELLITE ANALYSES
Genomic DNA of each sample was extracted using a salt extraction protocol
outlined by Aljanabi & Martinez (1997). Microsatellite primers were developed as
described in Liao et al. (2007) and He & Wang (2010). We screened 15 potential
microsatellite primer pairs and found 8 polymorphic loci (GR08, GR22, GR29,
Gra02, Gra04, Gra16, Gra25, and Gra30) to be with distinct bands. These eight
primers were chosen in the present study. The polymerase chain reaction was carried
out according to the procedure as the author described in He & Wang (2010). The
annealing temperature for each primer was described in He & Wang (2010) and Liao
et al. (2007).
GENETIC VARIATION WITHIN POPULATIONS
Observed and expected heterozygosities for each microsatellite locus and each
population were calculated using MSA 4.05 (Dieringer & Schlotterer, 2003). Allelic
richness, number of alleles, departures from the Hardy-Weinberg equilibrium, and
genotypic linkage disequilibrium were calculated using FSTAT v.2.9.3 (Goudet,
2001). Allelic richness was the number of alleles independent of the sample size.
Significance levels were adjusted for multiple comparisons using the standard
Bonferroni procedure (Rice, 1989). The difference of allelic richness and expected
heterozygosity among populations were estimated using the Kruskall-Wallis test.
Multiple comparison tests between populations were done using the pgirmess library
of the R software (Ihaka & Gentleman, 1996). Allelic frequencies and their
differences among populations were calculated and evaluated by Fisher’s exact test
using Genepop v. 4.0 (Raymond & Rousset, 1995).
GENETIC STRUCTURE AMONG POPULATIONS
Four complementary approaches were used to measure the population genetic
structure of G. rarus.
Firstly, FST between pairs of population were calculated using MSA (Dieringer
& Schlotterer, 2003). The statistical significance of pairwise FST was tested by 10000
permutations and the significant level was also adjusted by the Bonferroni procedure
(α = 0.0014). We also estimated G’ST, a standardized measure of global genetic
differentiation that is independent of the amount of genetic variation observed at the
examined loci, to facilitate comparisons with other studies (Hedrick, 2005). G’ST was
estimated using MSA and its significance was estimated using 10000 permutations.
Secondly, as an alternative to traditional FST methods, the Bayesian clustering
method in STRUCTURE ver. 2 (Pritchard et al., 2000; Falush et al., 2003) was used
to measure the population structure of microsatellite variation. Without regard to
sampling locations, this program assigns genotypes to a number of genetic clusters
(K), so as to minimize deviations from linkage and the Hardy-Weinberg equilibrium
within clusters. Using the admixture model and correlated allele frequency
parameters, ten replicates of each run from K = 1 to K = 9 were performed. Each
replicate was run for 20,000 Markov chain Monte Carlo (MCMC) generations with an
initial burn-in of 20,000 generations. This was used to estimate the posterior
probabilities L(K). Commonly, the K with the highest likelihood is considered as the
optimal number of genetic clusters. Alternatively, rather than using L(K), (Evanno et
al., 2005) recently proposed a new criteria ∆K, a measure of the second order rate of
change in the likelihood of K, to select the most likely number of clusters K. The
modal value of the distribution ∆K was found to be more similar to the real K number
of populations in the simulation study of (Evanno et al., 2005). As recommended by
these researchers, we used the height of this modal value as the signal for the
uppermost hierarchical level of genetic structure in the data set. STRUCTURE also
calculated the fractional membership of each individual in each cluster (q) (Pritchard
et al., 2000). We arbitrarily differentiated two types of populations: (1) populations
that have a q higher than 75% for a given cluster were considered to be strongly
attached with one cluster and (2) populations that have no q higher than 75% were
considered as shared membership between clusters.
Thirdly, a hierarchical analysis of molecular variance (AMOVA) (Excoffier et
al., 1992), as implemented in ARLEQUIN 2.000 (Schneider et al., 2000), attempts to
partition the total variance in gene frequencies into components due to the following
sources of structure: among groups, among populations within groups and within
populations. In order to probe the relationship between genetic differentiation and
water systems, here we used three different group divisions: 1) According to different
river basins, four groups were divided: Group M (M2, M3) belongs to the Minjiang
River; Group T (T1, T2) belongs to the Tuojiang River; Group Q (Q1, Q2) belongs to
the Qingyi River; Group D (D1, D2 and D3) belongs to the Dadu River (Fig. 1); 2)
According to the structure of the water systems, these four river basin groups are
divided into two groups: Group MT (M2, M3, T1 and T2) belonging to the Minjiang
and Tuojiang Rivers, Group QD (Q1, Q2, D1, D2 and D3) belonging to the Qingyi
and Dadu Rivers (Fig. 1); 3) We planned a comparison accounting for the groups
defined according to the outputs of the STRUCTURE software described above.
Finally, a phylogenetic (Neighbor-Joining) tree was built to visualize grouping
patterns among populations in the software POPULATIONS version 1.2.30
(Langella, 1999) by using the Nei’s genetic distance (Nei et al., 1983; Takezaki &
Nei, 2008) and 10,000 bootstraps on individuals. This phylogenetic tree was
displayed using TreeView (Page, 1996).
GENE FLOW AND MIGRATION RATE AMONG POPULATIONS
We investigated gene flow among populations using two approaches. Firstly, we
measured the relationship between the genetic distance and the geographical distance
among populations. The genetic distance measure (Slatkin, 1985) was regressed on
the geographical distance (ln km), by calculating Pearson correlation coefficients (r)
and using a Mantel (1967) permutation procedure (10,000 permutations) to establish
95% confidence intervals for r. This test was performed using the vegan library
(Oksanen et al., 2008) of the R software (Ihaka & Gentleman, 1996). Here, three
different geographical distance measurements were used: straight line distance (SLD),
water course distance (WCD) and riparian distance (RD). SLD was calculated
through the online distance calculator between each two GPS coordinates, while
WCD was calculated along the river networks in the Google Earth version 5.0. RD
was calculated along the closest connected water system (e.g. through man-made
channels between the Minjiang and Tuojiang Rivers, Fig. 1) in the Google Earth
version 5.0. Finally, to differentiate between the multiple regression models, Akaike
Information Criterion (AIC; Burnham & Anderson, 2002) was calculated through glm
function (Dobson, 1990) in the R software. Then ∆i (∆i = AICi - AICmin) was used to
rescale AIC, where AICmin is the minimum of different AICi values. This
transformation forces the best model to have ∆i = 0. Secondly, the migration rates
between populations within the past few generations were estimated using
BAYESASS 1.3 (Wilson & Rannala, 2003). Contrary to indirect estimators of long-
term gene flow, this non-equilibrium approach does not assume Hardy-Weinberg
equilibrium within populations. This model uses a Markov chain Monte Carlo
technique to estimate the proportion of immigrants into a population and their
confidence intervals (CI). BAYESASS also estimates the mean migration rate (and
CI) for data with insufficient information for estimating migration (Wilson &
Rannala, 2003), to serve as a control or comparison for values estimated from
empirical data. This study performed a total of 3×10⁶ iterations (discarding the first
106 iterations as burn-in) and a sampling frequency of 2000. Various delta values for
migration rate (m), allele frequencies (P), and inbreeding values (F) were compared.
A realistic output (when the accepted numbers of proposed changes are between 40%
and 60%) was obtained with m=0.15, P=0.15 and F=0.15.
RESULTS
GENETIC DIVERSITY
After adjusting for multiple comparisons, no significant linkage disequilibrium
was found in any pairs of loci, while significant departures from Hardy-Weinberg
equilibrium were found for several loci in some populations (Table II). However,
those loci did no show consistent deviations across all populations. Therefore, we
assumed that processes causing this non-equilibrium were specific to those
populations, and continued to include those loci in subsequent analyses. The number
of alleles detected at a locus ranged from four (locus GR22, Gra04 and Gra25) to 18
(locus GR29), averaging 7.9 over all loci. A total of 63 microsatellite alleles were
observed among all geographic locations for rare minnow across eight loci, ranging
from a maximum of 61 alleles in T2 to a minimum of 41 alleles in Q1. Allelic
richness across all loci varied from 4.8 (Q1) to 7.3 (T2). The observed heterozygosity
ranged from 0.485 to 0.675, with a mean of 0.593 across all loci and populations. The
expected heterozygosity ranged between 0.678 and 0.782, with a mean of 0.730 over
all loci and populations (Table II).
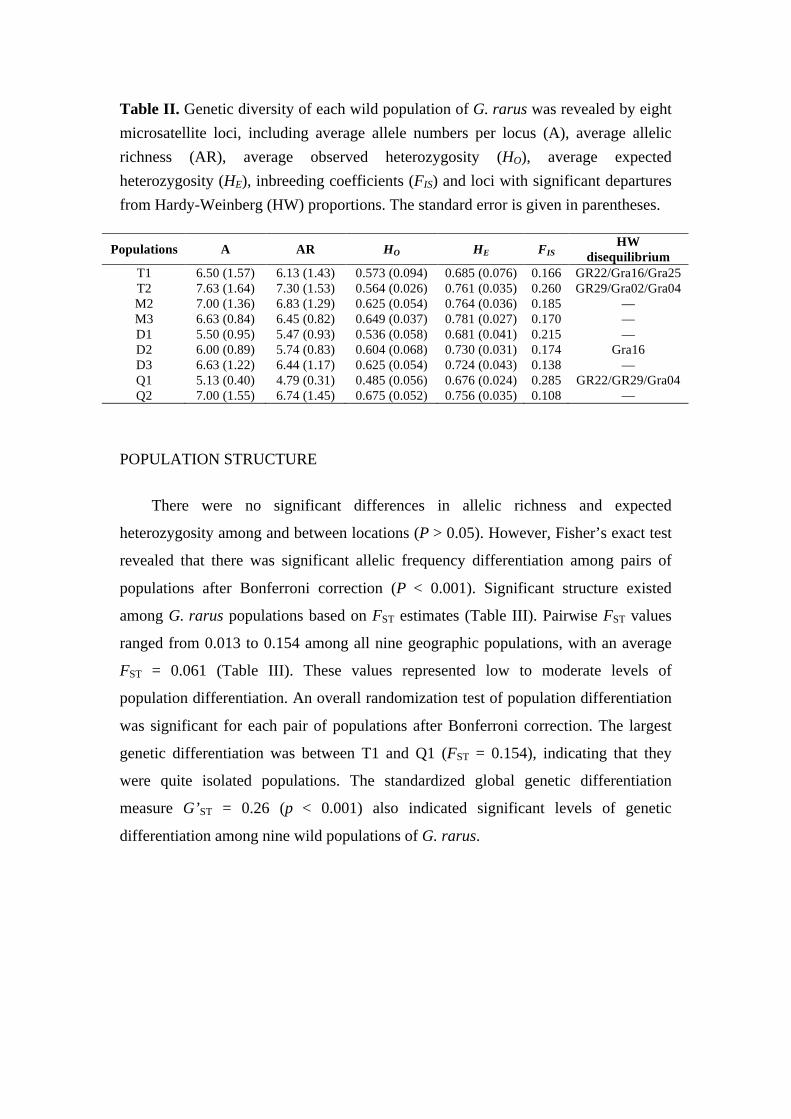
Table II. Genetic diversity of each wild population of G. rarus was revealed by eight microsatellite loci, including average allele numbers per locus (A), average allelic richness (AR), average observed heterozygosity (HO), average expected heterozygosity (HE), inbreeding coefficients (FIS) and loci with significant departures from Hardy-Weinberg (HW) proportions. The standard error is given in parentheses.
Populations A AR HO HE FIS HW disequilibrium
T1 6.50 (1.57) 6.13 (1.43) 0.573 (0.094) 0.685 (0.076) 0.166 GR22/Gra16/Gra25 T2 7.63 (1.64) 7.30 (1.53) 0.564 (0.026) 0.761 (0.035) 0.260 GR29/Gra02/Gra04 M2 7.00 (1.36) 6.83 (1.29) 0.625 (0.054) 0.764 (0.036) 0.185 — M3 6.63 (0.84) 6.45 (0.82) 0.649 (0.037) 0.781 (0.027) 0.170 — D1 5.50 (0.95) 5.47 (0.93) 0.536 (0.058) 0.681 (0.041) 0.215 — D2 6.00 (0.89) 5.74 (0.83) 0.604 (0.068) 0.730 (0.031) 0.174 Gra16 D3 6.63 (1.22) 6.44 (1.17) 0.625 (0.054) 0.724 (0.043) 0.138 — Q1 5.13 (0.40) 4.79 (0.31) 0.485 (0.056) 0.676 (0.024) 0.285 GR22/GR29/Gra04 Q2 7.00 (1.55) 6.74 (1.45) 0.675 (0.052) 0.756 (0.035) 0.108 —
POPULATION STRUCTURE
There were no significant differences in allelic richness and expected
heterozygosity among and between locations (P > 0.05). However, Fisher’s exact test
revealed that there was significant allelic frequency differentiation among pairs of
populations after Bonferroni correction (P < 0.001). Significant structure existed
among G. rarus populations based on FST estimates (Table III). Pairwise FST values
ranged from 0.013 to 0.154 among all nine geographic populations, with an average
FST = 0.061 (Table III). These values represented low to moderate levels of
population differentiation. An overall randomization test of population differentiation
was significant for each pair of populations after Bonferroni correction. The largest
genetic differentiation was between T1 and Q1 (FST = 0.154), indicating that they
were quite isolated populations. The standardized global genetic differentiation
measure G’ST = 0.26 (p < 0.001) also indicated significant levels of genetic
differentiation among nine wild populations of G. rarus.
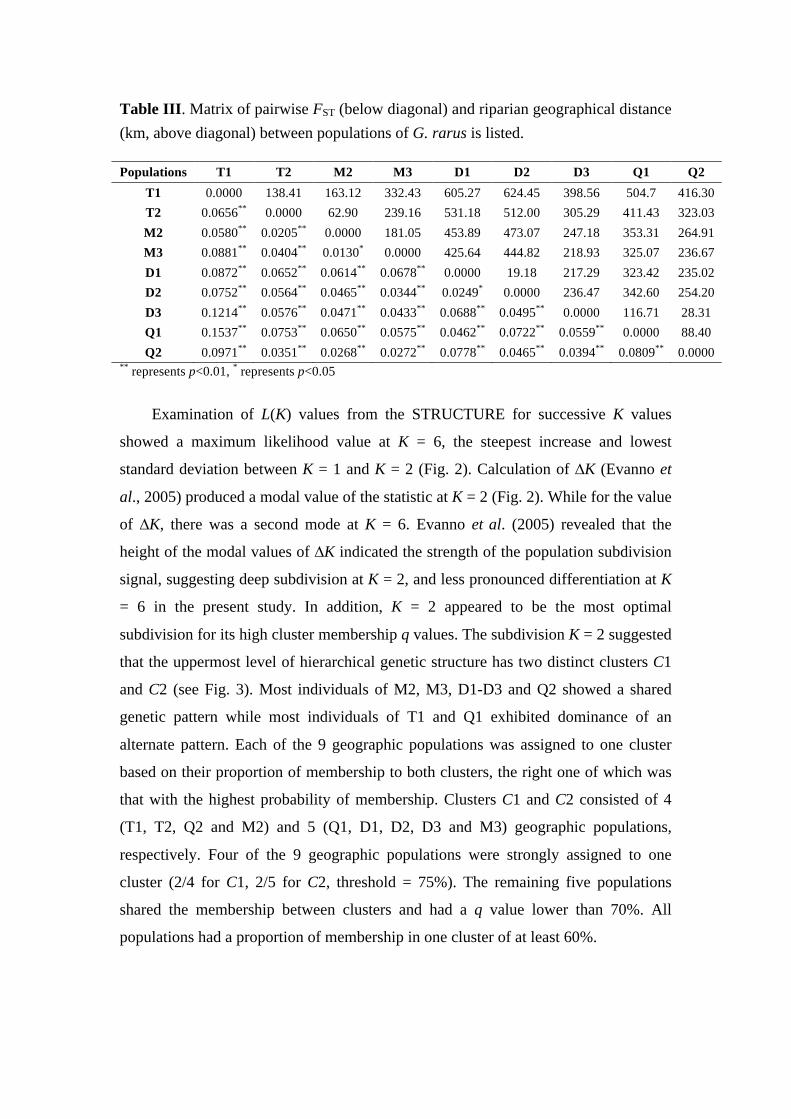
Table III. Matrix of pairwise FST (below diagonal) and riparian geographical distance (km, above diagonal) between populations of G. rarus is listed.
Populations T1 T2 M2 M3 D1 D2 D3 Q1 Q2 T1 0.0000 138.41 163.12 332.43 605.27 624.45 398.56 504.7 416.30 T2 0.0656** 0.0000 62.90 239.16 531.18 512.00 305.29 411.43 323.03 M2 0.0580** 0.0205** 0.0000 181.05 453.89 473.07 247.18 353.31 264.91 M3 0.0881** 0.0404** 0.0130* 0.0000 425.64 444.82 218.93 325.07 236.67 D1 0.0872** 0.0652** 0.0614** 0.0678** 0.0000 19.18 217.29 323.42 235.02 D2 0.0752** 0.0564** 0.0465** 0.0344** 0.0249* 0.0000 236.47 342.60 254.20 D3 0.1214** 0.0576** 0.0471** 0.0433** 0.0688** 0.0495** 0.0000 116.71 28.31 Q1 0.1537** 0.0753** 0.0650** 0.0575** 0.0462** 0.0722** 0.0559** 0.0000 88.40 Q2 0.0971** 0.0351** 0.0268** 0.0272** 0.0778** 0.0465** 0.0394** 0.0809** 0.0000
** represents p<0.01, * represents p<0.05
Examination of L(K) values from the STRUCTURE for successive K values
showed a maximum likelihood value at K = 6, the steepest increase and lowest
standard deviation between K = 1 and K = 2 (Fig. 2). Calculation of ∆K (Evanno et
al., 2005) produced a modal value of the statistic at K = 2 (Fig. 2). While for the value
of ∆K, there was a second mode at K = 6. Evanno et al. (2005) revealed that the
height of the modal values of ∆K indicated the strength of the population subdivision
signal, suggesting deep subdivision at K = 2, and less pronounced differentiation at K
= 6 in the present study. In addition, K = 2 appeared to be the most optimal
subdivision for its high cluster membership q values. The subdivision K = 2 suggested
that the uppermost level of hierarchical genetic structure has two distinct clusters C1
and C2 (see Fig. 3). Most individuals of M2, M3, D1-D3 and Q2 showed a shared
genetic pattern while most individuals of T1 and Q1 exhibited dominance of an
alternate pattern. Each of the 9 geographic populations was assigned to one cluster
based on their proportion of membership to both clusters, the right one of which was
that with the highest probability of membership. Clusters C1 and C2 consisted of 4
(T1, T2, Q2 and M2) and 5 (Q1, D1, D2, D3 and M3) geographic populations,
respectively. Four of the 9 geographic populations were strongly assigned to one
cluster (2/4 for C1, 2/5 for C2, threshold = 75%). The remaining five populations
shared the membership between clusters and had a q value lower than 70%. All
populations had a proportion of membership in one cluster of at least 60%.
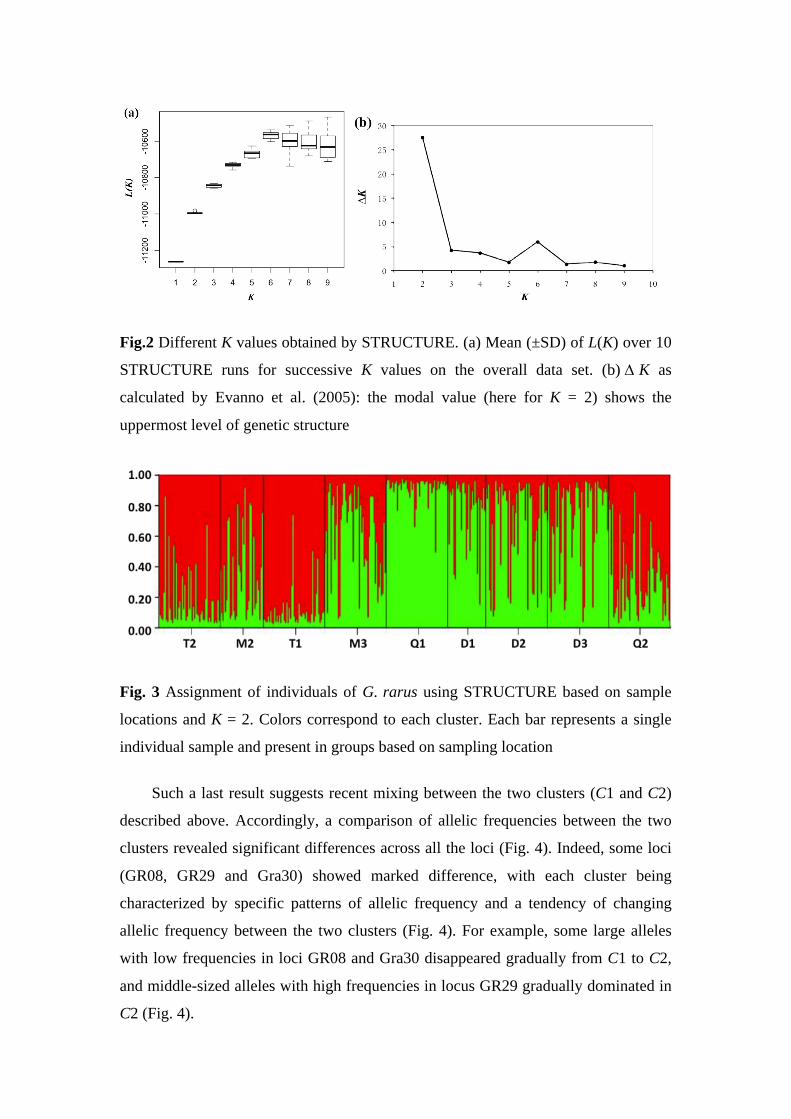
Fig.2 Different K values obtained by STRUCTURE. (a) Mean (±SD) of L(K) over 10
STRUCTURE runs for successive K values on the overall data set. (b) ∆ K as
calculated by Evanno et al. (2005): the modal value (here for K = 2) shows the
uppermost level of genetic structure
Fig. 3 Assignment of individuals of G. rarus using STRUCTURE based on sample
locations and K = 2. Colors correspond to each cluster. Each bar represents a single
individual sample and present in groups based on sampling location
Such a last result suggests recent mixing between the two clusters (C1 and C2)
described above. Accordingly, a comparison of allelic frequencies between the two
clusters revealed significant differences across all the loci (Fig. 4). Indeed, some loci
(GR08, GR29 and Gra30) showed marked difference, with each cluster being
characterized by specific patterns of allelic frequency and a tendency of changing
allelic frequency between the two clusters (Fig. 4). For example, some large alleles
with low frequencies in loci GR08 and Gra30 disappeared gradually from C1 to C2,
and middle-sized alleles with high frequencies in locus GR29 gradually dominated in
C2 (Fig. 4).
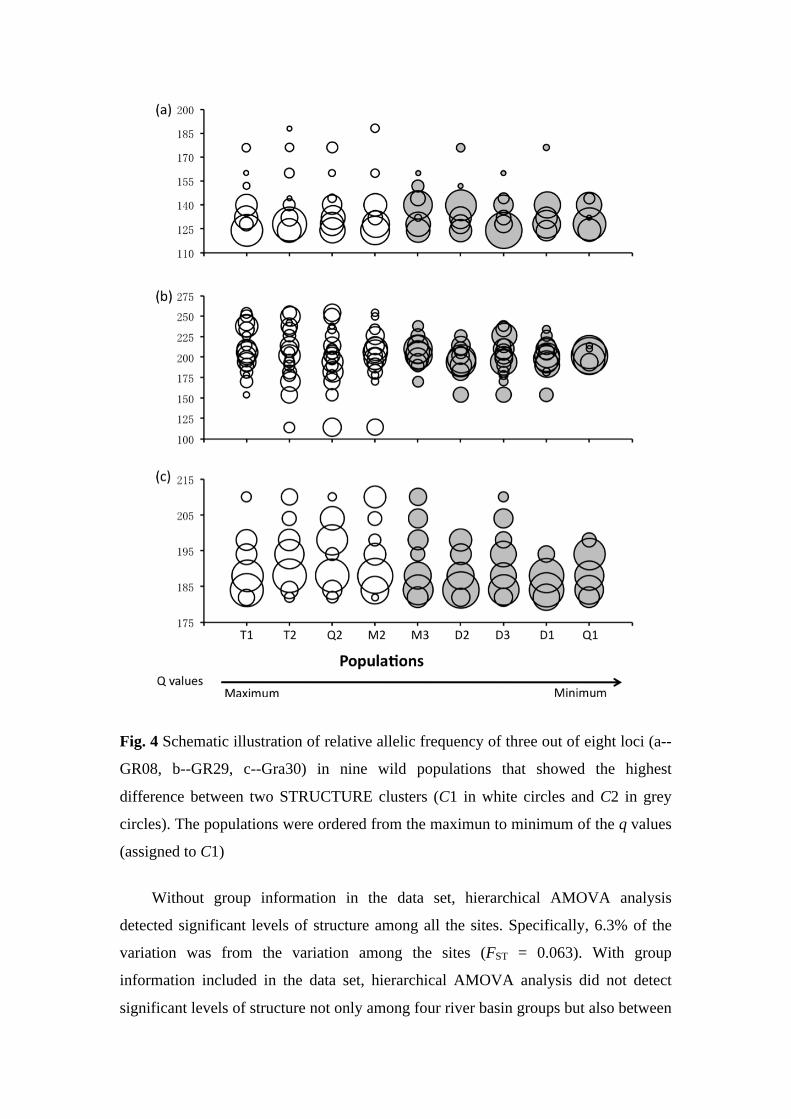
Fig. 4 Schematic illustration of relative allelic frequency of three out of eight loci (a--
GR08, b--GR29, c--Gra30) in nine wild populations that showed the highest
difference between two STRUCTURE clusters (C1 in white circles and C2 in grey
circles). The populations were ordered from the maximun to minimum of the q values
(assigned to C1)
Without group information in the data set, hierarchical AMOVA analysis
detected significant levels of structure among all the sites. Specifically, 6.3% of the
variation was from the variation among the sites (FST = 0.063). With group
information included in the data set, hierarchical AMOVA analysis did not detect
significant levels of structure not only among four river basin groups but also between
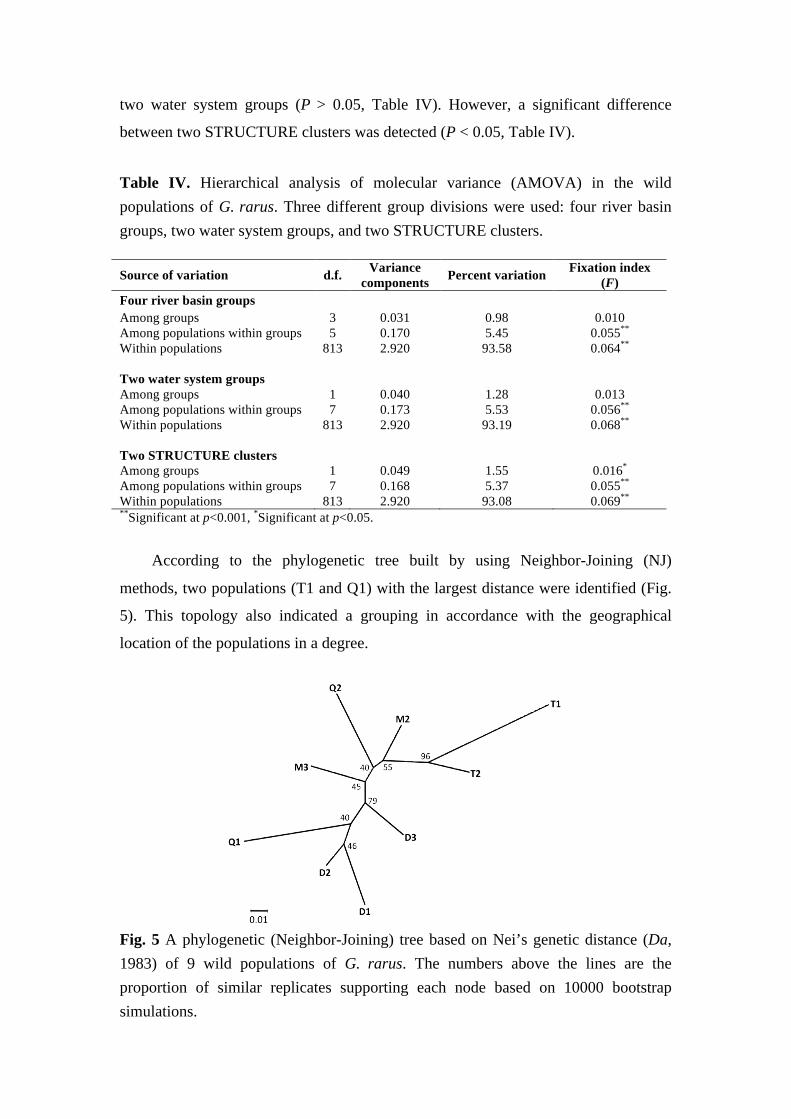
two water system groups (P > 0.05, Table IV). However, a significant difference
between two STRUCTURE clusters was detected (P < 0.05, Table IV).
Table IV. Hierarchical analysis of molecular variance (AMOVA) in the wild populations of G. rarus. Three different group divisions were used: four river basin groups, two water system groups, and two STRUCTURE clusters.
Source of variation d.f. Variance components Percent variation Fixation index
(F) Four river basin groups Among groups 3 0.031 0.98 0.010 Among populations within groups 5 0.170 5.45 0.055** Within populations 813 2.920 93.58 0.064** Two water system groups Among groups 1 0.040 1.28 0.013 Among populations within groups 7 0.173 5.53 0.056** Within populations 813 2.920 93.19 0.068** Two STRUCTURE clusters Among groups 1 0.049 1.55 0.016* Among populations within groups 7 0.168 5.37 0.055** Within populations 813 2.920 93.08 0.069** **Significant at p<0.001, *Significant at p<0.05.
According to the phylogenetic tree built by using Neighbor-Joining (NJ)
methods, two populations (T1 and Q1) with the largest distance were identified (Fig.
5). This topology also indicated a grouping in accordance with the geographical
location of the populations in a degree.
Fig. 5 A phylogenetic (Neighbor-Joining) tree based on Nei’s genetic distance (Da, 1983) of 9 wild populations of G. rarus. The numbers above the lines are the proportion of similar replicates supporting each node based on 10000 bootstrap simulations.
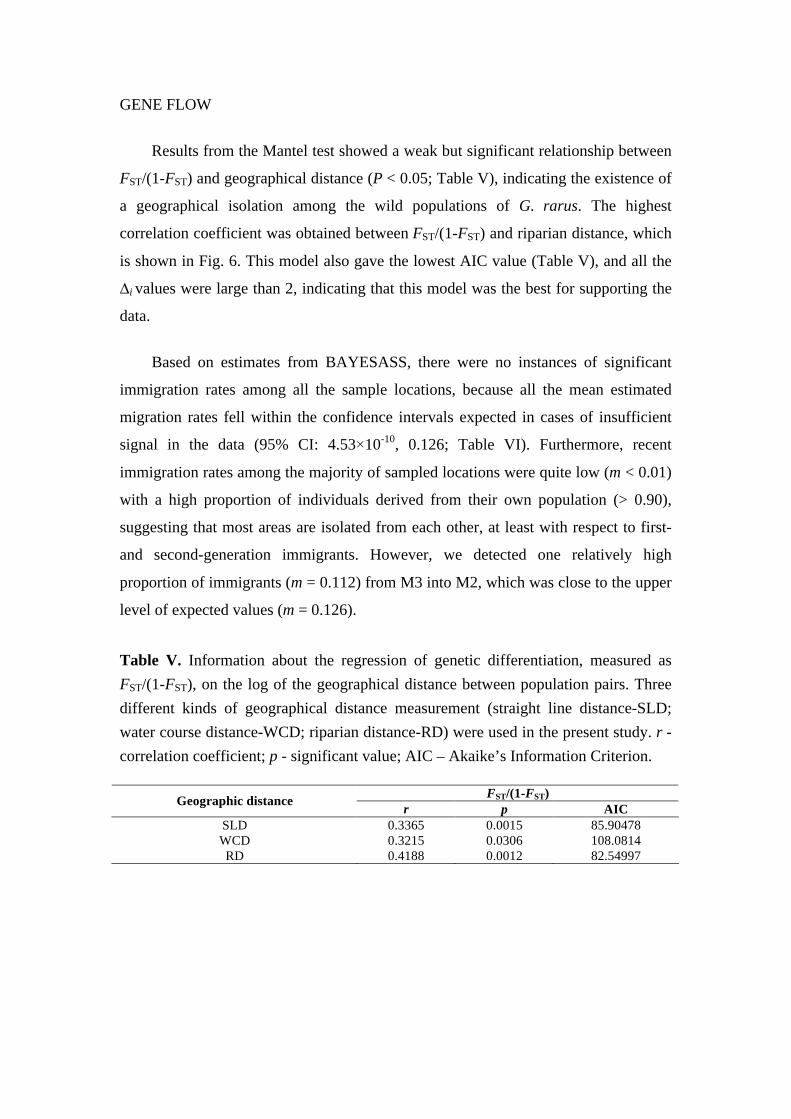
GENE FLOW
Results from the Mantel test showed a weak but significant relationship between
FST/(1-FST) and geographical distance (P < 0.05; Table V), indicating the existence of
a geographical isolation among the wild populations of G. rarus. The highest
correlation coefficient was obtained between FST/(1-FST) and riparian distance, which
is shown in Fig. 6. This model also gave the lowest AIC value (Table V), and all the
∆i values were large than 2, indicating that this model was the best for supporting the
data.
Based on estimates from BAYESASS, there were no instances of significant
immigration rates among all the sample locations, because all the mean estimated
migration rates fell within the confidence intervals expected in cases of insufficient
signal in the data (95% CI: 4.53×10⁻¹⁰, 0.126; Table VI). Furthermore, recent
immigration rates among the majority of sampled locations were quite low (m < 0.01)
with a high proportion of individuals derived from their own population (> 0.90),
suggesting that most areas are isolated from each other, at least with respect to first-
and second-generation immigrants. However, we detected one relatively high
proportion of immigrants (m = 0.112) from M3 into M2, which was close to the upper
level of expected values (m = 0.126).
Table V. Information about the regression of genetic differentiation, measured as FST/(1-FST), on the log of the geographical distance between population pairs. Three different kinds of geographical distance measurement (straight line distance-SLD; water course distance-WCD; riparian distance-RD) were used in the present study. r - correlation coefficient; p - significant value; AIC – Akaike’s Information Criterion.
FST/(1-FST) Geographic distance r p AIC SLD 0.3365 0.0015 85.90478 WCD 0.3215 0.0306 108.0814 RD 0.4188 0.0012 82.54997
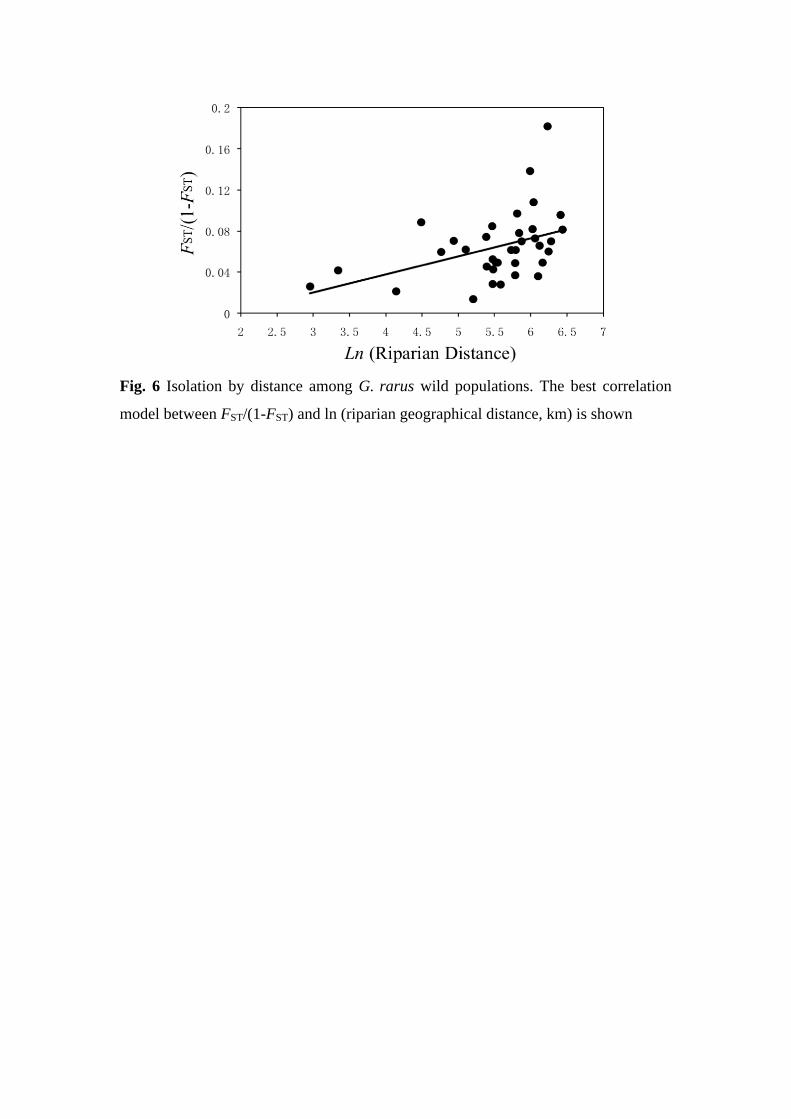
Fig. 6 Isolation by distance among G. rarus wild populations. The best correlation
model between FST/(1-FST) and ln (riparian geographical distance, km) is shown
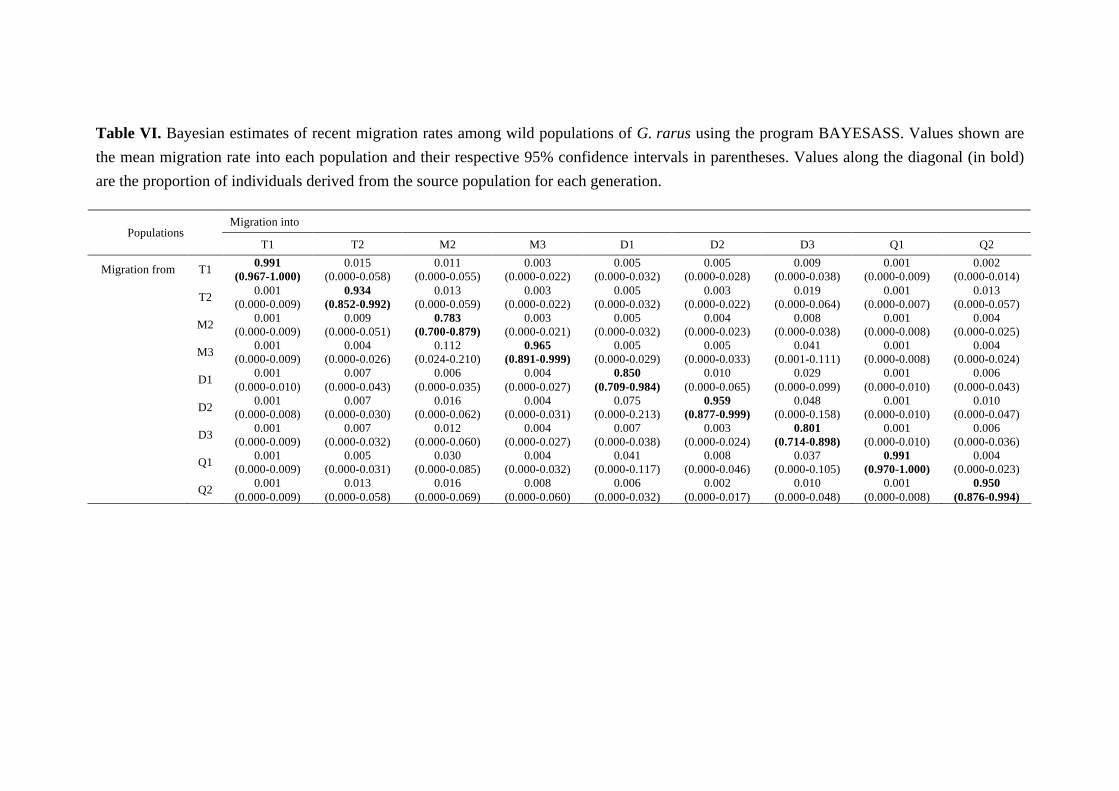
Table VI. Bayesian estimates of recent migration rates among wild populations of G. rarus using the program BAYESASS. Values shown are the mean migration rate into each population and their respective 95% confidence intervals in parentheses. Values along the diagonal (in bold) are the proportion of individuals derived from the source population for each generation.
Migration into Populations
T1 T2 M2 M3 D1 D2 D3 Q1 Q2
Migration from T1 0.991 (0.967-1.000)
0.015 (0.000-0.058)
0.011 (0.000-0.055)
0.003 (0.000-0.022)
0.005 (0.000-0.032)
0.005 (0.000-0.028)
0.009 (0.000-0.038)
0.001 (0.000-0.009)
0.002 (0.000-0.014)
T2 0.001 (0.000-0.009)
0.934 (0.852-0.992)
0.013 (0.000-0.059)
0.003 (0.000-0.022)
0.005 (0.000-0.032)
0.003 (0.000-0.022)
0.019 (0.000-0.064)
0.001 (0.000-0.007)
0.013 (0.000-0.057)
M2 0.001 (0.000-0.009)
0.009 (0.000-0.051)
0.783 (0.700-0.879)
0.003 (0.000-0.021)
0.005 (0.000-0.032)
0.004 (0.000-0.023)
0.008 (0.000-0.038)
0.001 (0.000-0.008)
0.004 (0.000-0.025)
M3 0.001 (0.000-0.009)
0.004 (0.000-0.026)
0.112 (0.024-0.210)
0.965 (0.891-0.999)
0.005 (0.000-0.029)
0.005 (0.000-0.033)
0.041 (0.001-0.111)
0.001 (0.000-0.008)
0.004 (0.000-0.024)
D1 0.001 (0.000-0.010)
0.007 (0.000-0.043)
0.006 (0.000-0.035)
0.004 (0.000-0.027)
0.850 (0.709-0.984)
0.010 (0.000-0.065)
0.029 (0.000-0.099)
0.001 (0.000-0.010)
0.006 (0.000-0.043)
D2 0.001 (0.000-0.008)
0.007 (0.000-0.030)
0.016 (0.000-0.062)
0.004 (0.000-0.031)
0.075 (0.000-0.213)
0.959 (0.877-0.999)
0.048 (0.000-0.158)
0.001 (0.000-0.010)
0.010 (0.000-0.047)
D3 0.001 (0.000-0.009)
0.007 (0.000-0.032)
0.012 (0.000-0.060)
0.004 (0.000-0.027)
0.007 (0.000-0.038)
0.003 (0.000-0.024)
0.801 (0.714-0.898)
0.001 (0.000-0.010)
0.006 (0.000-0.036)
Q1 0.001 (0.000-0.009)
0.005 (0.000-0.031)
0.030 (0.000-0.085)
0.004 (0.000-0.032)
0.041 (0.000-0.117)
0.008 (0.000-0.046)
0.037 (0.000-0.105)
0.991 (0.970-1.000)
0.004 (0.000-0.023)
Q2 0.001 (0.000-0.009)
0.013 (0.000-0.058)
0.016 (0.000-0.069)
0.008 (0.000-0.060)
0.006 (0.000-0.032)
0.002 (0.000-0.017)
0.010 (0.000-0.048)
0.001 (0.000-0.008)
0.950 (0.876-0.994)
DISCUSSION
GENETIC DIFFERENTIATION AMONG POPULATIONS
Our analyses revealed significant genetic differentiation among wild populations
of G. rarus, as we detected significant pairwise FST comparisons. According to the
interpretation of FST in Balloux & Lugon-Moulin (2002), the genetic differentiation of
wild populations of G. rarus were at the low to moderate level. Among them, fifteen
comparisons were considered as a low level of differentiation, twenty as moderate
level, and only one (between populations T1 and Q1, FST = 0.1537) as considerable
differentiation. Specifically, the genetic differentiation between T1 and any other
populations were in the moderate range. A similar phoenomenon was found in
population Q1. Actually, a low level of genetic differentiation does not mean a
negligible differentiation (Wright, 1978; Charlesworth, 1998; Nagylaki, 1998;
Hedrick, 1999; Balloux & Lugon-Moulin, 2002), which was confirmed in the present
study. The genetic differentiation of G. rarus was mainly due to significant allelic
frequency differences among populations. Different populations of G. rarus exhibited
different allelic frequency distribution patterns over different loci. Some of them were
mainly composed of the middle-sized alleles such as population Q1, but some had
extensive allele distribution such as population T2 (Fig. 4). In addition, no significant
recent migration rate between any two populations was revealed by BAYESASS,
indicating very limited recent gene flow among G. rarus populations. According to
Hutchison & Templeton (1999), a weak but significant isolation-by-distance pattern,
as seen in the present study, also showed that there was a regional equilibrium
between genetic drift and gene flow, indicating that these two mechanisms drive the
genetic structure of G. rarus.
GENETIC CLUSTERS
Except for significant population differentiation, the present study revealed the
genetic clustering structure of wild populations of G. rarus. STRUCTURE revealed
two obvious genetic clusters (C1 and C2) that were significantly different by
AMOVA analyses. The phylogenetic tree also indicated a grouping in accordance
with the geographical locations. Although different clusters were obtained from
different methods, overall the clustering structure was similar.
This clustering structure may be highly correlated with the structure of the water
systems. All the sampling sites in the present study were located in the western area
of the Sichuan Basin and its margins, either in the Chengdu Plain or its neighboring
area. From the point of view of the water system structure, all the sampling sites were
from four river basins (Minjiang River, Tuojiang River, Qingyi River, Dadu River).
While from the point of view of the formation of the Chengdu Plain, they were from
two alluvial plains (Qian & Tang, 1997). One was from the Minjiang and Tuojiang
Rivers (MT), and another was from the Qingyi and Dadu Rivers (QD). Actually,
AMOVA analyses revealed that there were no significant differences among these
four river basin groups or the two alluvial plain groups (Table IV). Compared with the
component of the two alluvial plain groups, STRUCTURE clusters were similar but
with a little difference, i.e., Q2 was clustered into MT and M3 into QD by
STRUCTURE. Actually, the analysis of the frequency distribution of alleles revealed
a possible introgression from one cluster (C1) into the other (C2).
Since there were no detectable recent migrations, this clustering structure could
be explained from the histories of the river evolution that usually act as an important
force in the biogeography or distribution of many freshwater fish species. Yuan &
Tao (2008) showed that the drainage evolution of the Qingyi River consisted mainly
of four stages. During the Middle Pleistocene Epoch, the Qingyi River flowed
northwards into the Minjiang River at Xinjin County, where Qionglai River (M3)
joined. However, along with the arrival of the Late Pleistocene Epoch, the Qingyi
River went southeastwards through Jiajiang County (Q2) into the Dadu River at
Leshan City (Li et al., 2006; Li & Guo, 2008; Yuan & Tao, 2008). It was deduced
that Q2 did not belong to the Qingyi River basin until about 2.5 to 1 million years
ago, and M3 might have belonged to the Qingyi River basin around two million years
ago. Therefore, the population genetic structure pattern of G. rarus could be highly
correlated with the structure of the water systems and its history.
ISOLATION BY DISTANCE
Understanding dispersal and its effects on genetic structure is essential to many
fields of research including population genetics, population ecology and conservation
biology (Kraaijeveld-Smit et al., 2005; Bergl & Vigilant, 2007; Björklund et al.,
2007; Aspi et al., 2009; Schlosser et al., 2009). In view of the present distribution and

differentiation of G. rarus, we can surmise that rare minnow was widely dispersed
along with the evolution of the Minjiang and Tuojiang Rivers in history. The
floodplain and the complicate water networks of the Sichuan Basin have been the
distribution site and the migration path. However, due to the construction of
hydropower projects, a large number of rare minnow habitats were lost so that the
remnant populations are in discontinuous distribution at present. Dispersal might have
happened to some extent through the man-made channels of hydropower projects,
which would be consistent with limited gene flow among populations revealed in the
present study.
In the present study, three different geographical distances were used to reveal
the isolation-by-distance (IBD) pattern. The best fitted regression model was between
FST and the riparian distance, since it had the lowest AIC value. However, it is
generally important to know which model is the second best. The simple rules used in
assessing the relative merits of the models were: models having ∆i ≤ 2 have
substantial support; those in which 4 ≤ ∆i ≤ 7 have considerably less support, and
models having ∆i > 10 have essentially no support (Burnham & Anderson, 2004). All
the ∆i values in the present study were greater than 2, indicating models from straight
line distance and water course distance have less support and even essentially no
support. Therefore, we hypothesized that isolation-by-distance played a role in
genetic structure of G. rarus because a slightly significant positive relationship
between FST and the riparian geographical distance was detected (Fig. 6).
As we described in the Material and Methods, the riparian distance (RD) was
calculated along the closest connected water system through the man-made channels
between the Minjiang and Tuojiang Rivers, but not through the mouth of these two
rivers (e.g. WCD). To some extent, it reflected the most likely dispersal route of G.
rarus through these complicate man-made channels. This could be true because no
rare minnow were sampled either in the mouth of the Minjiang River at Yibin City or
in the mouth of the Tuojiang River at Luzhou City up until now, where high
intensities of investigations into fish catches were usually carried out.
These man-made channels were from the numerous water diversion projects
built in the Minjiang River. The upper Minjiang River is abundant in water resources,
but accompanied with frequent flooding (Liu et al., 2006). These projects were built
to prevent floods, and for irrigation and municipal water use. Among them, the most
famous one is the Dujiangyan Irrigation Project located in Dujiangyan City that was
built in the main stream of the Minjiang River around 2 300 years ago. To date, it is
the only existing and oldest large project in the world characterized by water
diversion without dams. It has been acting as the most important diversion and
irrigation system for agriculture in the Chengdu Plain, irrigating over 5 300 km2 of
land in that region. In fact, these water diversion projects constitute a complicated
water network in the Chengdu Plain, while some of them (e.g., Renmin Channel,
Puyang River, Qingbai River, Fig. 1) connect the Minjiang River with the Tuojiang
River. G. rarus might migrate through these connective channels to exchange genes.
CONSERVATION IMPLICATION
Rare minnow generally have a spotted distribution. The geographic distance
between populations studied here are quite large, usually dozens to hundreds of
kilometers away from each other. There could be much less probability of rare
minnow individuals migrating from site to site, which was confirmed by the limited
recent gene flow detected in the present study. In addition, the present Chengdu Plain
region is not suitable for G. rarus to survive due to human activities, including
channelization, water diversion and pollution. Rare minnow only survive in narrow
areas with fewer anthropogenic disturbances, especially at the edge of the Chengdu
Plain.
Since all the sampling sites in the present study were significantly differentiated
from each other, there should be protection measures for all the nine populations of G.
rarus. However, some populations (e.g., M2, Q1, D1 and D3) in both clusters C1 and
C2 are experiencing major environmental threats, where conservation measures could
not be carried out effectively.
Considering these present conditions, it is necessary to select representative and
potential populations in each STRUCTURE cluster to protect, to sustain long-term
survival of the species. The populations characterized by large population size, high
genetic diversity, extensive allele distribution and favorable habitats, such as T1, T2
and Q2 in cluster C1, M3 and D2 in cluster C2, should be in prior conservation. In
comparison with the total allele number (=63) over all eight loci, population T2 in
cluster C1 has 61 alleles, thus only lacking two of the alleles. These two alleles could
be found in low frequencies in populations T1 and Q2, respectively. All these three
populations also showed relatively high genetic diversity and large population size,
and thus they were selected as populations of high priority for the conservation of
cluster C1. However, they have been more or less influenced by human activities in
recent years. For instance, the habitat originating from the spring had been suitable for
population T2 to survive in the 19th century. However, the population size was found
to be decreasing in recent years by the authors’ field investigation in 2006 and 2008,
which may be mainly due to human activities, such as increasing pesticide pollution.
Moreover, populations M3 and D2 were selected as the representatives of cluster C2
because of their relatively high genetic diversity and large population size. These two
populations covered most of the studied alleles, i.e., 56 alleles distributed. They are
also facing major threats, such as hydropower construction. For instance, the Pubugou
hydroelectric station, some dozens of kilometers away from the topotype population
D2 of G. rarus, had been built in the main stream of the Dadu River. Its reservoir
settlements include building factories, altering land use, river regulation and farmland
water conservancy, are deteriorating the ecological environment of population D2.
Fortunately, as the topotype population of G. rarus, D2 has a large population size,
relatively high genetic diversity, and suitable habitats. He & Wang (2010) also
revealed that the topotype population of G. rarus was healthy and stable, and
suggested that a reserve area be set up to help the management of its type locality.
Consequently, it is urgent to carry on useful and effective protection measures for
these prior populations to avoid further deterioration of habitats and to sustain the
wild species resources of G. rarus.
Determining the conservation units (e.g., evolutionarily significant units, ESUs)
for an endangered species is controversial but widely applied in many studies (Moritz,
1994; Parker et al., 1999; Hedrick et al., 2001; Holycross & Douglas, 2007;
Krabbenhoft et al., 2008; Morgan et al., 2008). Different definitions of ESUs have
varied from author to author. Based on genetic criteria, Moritz (1994) defined ESUs
as being reciprocally monophyletic for mitochondrial DNA (mtDNA) alleles and
show significant divergence of allele frequencies at nuclear loci. Waples (1991)
provided a more general definition “An ESU is a population (or group of populations)
that (1) is substantially reproductively isolated from other conspecific populations,
and (2) represents an important component in the evolutionary legacy of the species”.
Based on whatever criterion, it is difficult to determine ESUs in the present study,
although significant differentiations of allele frequencies at microsatellite loci were
revealed between pairs of populations. Further studies, such as mtDNA analyses and
morphological studies, should be carried out in the future in order to make clearer the
population structure of G. rarus.
ACKNOWLEDGEMENT
The authors are most grateful to F. Wang for his technical assistance. We also
thank Dr. E. Quéméré and Prof. O. Langella for their kind help in using the software
STRUCTURE and POPULATIONS. This research was supported by funds from the
National Natural Science Foundation of China (NSFC, 30670292), the Chinese
Academy of Sciences (CZBZX-1), the Ministry of Environmental Protection of China
(2009ZX07527-005) and the French embassy by providing PhD grants for the co-
supervision of the PhD research.
REFERENCE
Aljanabi, S.M. & Martinez, I. (1997). Universal and rapid salt-extraction of high quality genomic DNA for PCR-based techniques. Nucleic Acids Research 25, 4692-4693.
Aspi, J., Roininen, E., Kiiskila, J., Ruokonen, M., Kojola, I., Bljudnik, L., Danilov, P., Heikkinen, S. & Pulliainen, E. (2009). Genetic structure of the northwestern Russian wolf populations and gene flow between Russia and Finland. Conservation Genetics 10, 815-826.
Aspi, J., Roininen, E., Ruokonen, M., Kojola, I. & Vila, C. (2006). Genetic diversity, population structure, effective population size and demographic history of the Finnish wolf population. Molecular Ecology 15, 1561-1576.
Balloux, F. & Lugon-Moulin, N. (2002). The estimation of population differentiation with microsatellite markers. Molecular Ecology 11, 155-165.
Beaumont, M.A. & Rannala, B. (2004). The Bayesian revolution in genetics. Nature Reviews Genetics 5, 251-261.
Bergl, R.A. & Vigilant, L. (2007). Genetic analysis reveals population structure and recent migration within the highly fragmented range of the Cross River gorilla (Gorilla gorilla diehli). Molecular Ecology 16, 501-516.
Björklund, M., Aho, T. & Larsson, L.C. (2007). Genetic differentiation in pikeperch (Sander lucioperca): the relative importance of gene flow, drift and common history. Journal of Fish Biology 71, 264-278.
Bohonak, A.J. (1999). Dispersal, gene flow, and population structure. Quarterly Review of Biology 74, 21-45.
Burnham, K.P. & Anderson, D.R. (2002). Model selection and multimodel inference: a practical information-theoretic approach. 2nd ed. New York: Springer.
Burnham, K.P. & Anderson, D.R. (2004). Multimodel inference - understanding AIC and BIC in model selection. Sociological Methods & Research 33, 261-304.
Charlesworth, B. (1998). Measures of divergence between populations and the effect of forces that reduce variability. Molecular Biology and Evolution 15, 538-543.
Chen, Y.Y. (1998). Fauna Sinica, Osteichthyes, Cypriniformes II. Beijing: Science Press. pp. 51-52. (in Chinese)
Ciofi, C. & Bruford, M.W. (1999). Genetic structure and gene flow among Komodo dragon populations inferred by microsatellite loci analysis. Molecular Ecology 8, S17-S30.
Crandall, K.A., Bininda-Emonds, O.R.P., Mace, G.M. & Wayne, R.K. (2000). Considering evolutionary processes in conservation biology. Trends in Ecology & Evolution 15, 290-295.
Devillard, S., Jombart, T. & Pontier, D. (2009). Revealing cryptic genetic structuring in an urban population of stray cats (Felis silvestris catus). Mammalian Biology 74, 59-71.
Dieringer, D. & Schlotterer, C. (2003). Microsatellite analyser (MSA): a platform independent analysis tool for large microsatellite data sets. Molecular Ecology Notes 3, 167-169.
Ding, R.H. (1994). The Fishes of Sichuan, China. Chengdu: Sichuan Science and Technology Press. (in Chinese)
Dobson, A.J. (1990). An introduction to generalized linear models. London: Chapman and Hall.
Evanno, G., Regnaut, S. & Goudet, J. (2005). Detecting the number of clusters of individuals using the software STRUCTURE: a simulation study. Molecular Ecology 14, 2611-2620.
Excoffier, L., Smouse, P.E. & Quattro, J.M. (1992). Analysis of molecular variance inferred from metric distances among DNA haplotypes - application to human mitochondrial-DNA restriction data. Genetics 131, 479-491.
Falush, D., Stephens, M. & Pritchard, J.K. (2003). Inference of population structure using multilocus genotype data: Linked loci and correlated allele frequencies. Genetics 164, 1567-1587.
Floyd, C.H., Flores-Martínez, J.J., Herrera-M, L.G., Mejía, O. & May, B. (2009). Conserving the endangered Mexican fishing bat (Myotis vivesi): genetic variation indicates extensive gene flow among islands in the Gulf of California. Conservation Genetics doi: 10.1007/s10592-009-9902-4.
Frankham, R., Ballou, J.D. & Briscoe, D.A. (2002). Introduction to Conservation Genetics. New York: Cambridge University Press.
Fraser, D.J. & Bernatchez, L. (2001). Adaptive evolutionary conservation: towards a unified concept for defining conservation units. Molecular Ecology 10, 2741-2752.
Gerlach, G. & Musolf, K. (2000). Fragmentation of landscape as a cause for genetic subdivision in bank voles. Conservation Biology 14, 1066-1074.
Goudet, J. (2001). FSTAT, a program to estimate and test gene diversities and fixation indices (version 2.9.3). Available from http://www.unil.ch/izea/softwares/fstat.html.
He, Y.F. & Wang, J.W. (2010). Temporal variation in genetic structure of the Chinese rare minnow (Gobiocypris rarus) in its type locality revealed by microsatellite markers. Biochemical Genetics 48, 312-325.
Hedrick, P.W. (1999). Perspective: Highly variable loci and their interpretation in evolution and conservation. Evolution 53, 313-318.
Hedrick, P.W. (2005). A standardized genetic differentiation measure. Evolution 59, 1633-1638.
Hedrick, P.W., Parker, K.M. & Lee, R.N. (2001). Using microsatellite and MHC variation to identify species, ESUs, and MUs in the endangered Sonoran topminnow. Molecular Ecology 10, 1399-1412.
Holycross, A.T. & Douglas, M.E. (2007). Geographic isolation, genetic divergence, and ecological non-exchangeability define ESUs in a threatened sky-island rattlesnake. Biological Conservation 134, 142-154.
Hutchison, D.W. & Templeton, A.R. (1999). Correlation of pairwise genetic and geographic distance measures: Inferring the relative influences of gene flow and drift on the distribution of genetic variability. Evolution 53, 1898-1914.
Ihaka, R. & Gentlemen, R. (1996). R: a language for data analysis and graphics. Journal of Computational and Graphical Statistics 5, 299-314.
Jia, F.J., Wang, J.W. & Wu, Q.J. (2002). Gynogenetic rare minnow (Gobiocypris rarus) induced by heterogeneous sperms. Acta Hydrobiologica Sinica 26(3), 246-252. (in Chinese)
Johnson, M.S. (2000). Measuring and interpreting genetic structure to minimize the genetic risks of translocations. Aquaculture Research 31, 133-143.
Koenig, W.D., VanVuren, D. & Hooge, P.N. (1996). Detectability, philopatry, and the distribution of dispersal distances in vertebrates. Trends in Ecology & Evolution 11, 514-517.
Kraaijeveld-Smit, F.J.L., Beebee, T.J.C., Griffiths, R.A., Moore, R.D. & Schley, L. (2005). Low gene flow but high genetic diversity in the threatened Mallorcan midwife toad Alytes muletensis. Molecular Ecology 14, 3307-3315.
Krabbenhoft, T.J., Rohde, F.C., Leibman, A.N. & Quattro, J.M. (2008). Concordant mitochondrial and nuclear DNA partitions define evolutionarily significant units in the imperiled pinewoods darter, Etheostoma mariae (Pisces: Percidae). Copeia 4, 909-915.
Langella, O. (1999). Populations version 1.2.30. Distributed by the author, CNRS UPR9034, France.
Le, P.Q. & Chen, Y.Y. (1998). China Red Data Book of Endangered Animals: Pisces. Beijing: Science Press. pp. 170-172. (in Chinese)
Li, L., Ma, T.W. & Wu, Z.B. (2004). Toxic effect of domestic sewage on rare minnow (Gobiocypris rarus). Acta Hydrobiologica Sinica 28(1), 40-44. (in Chinese)
Li, Y., Li, B., Steffen, D., Densmore, A.L., Richardson, N.J., Zhou, R.J., Ellis, M.A. & Zhang, Y. (2006). Provenance analysis and drainage evolution in Late Cenozoic Chengdu Basin on eastern margin of Tibetan Plateau. Acta Sedimentologica Sinica 24(3), 309-320. (in Chinese)
Li, Y.Z. & Guo, B. (2008). Cenozonic tectonics of Chengdu Plain, Sichuan, China. Journal of Chengdu University of Technology (Science & Technology Edition) 35(4), 371-376. (in Chinese)
Liao, X.L., Wang, D., Yu, X.M., Li, W.T., Cheng, L., Wang, J.W. & Tong, J.G. (2007). Characterization of novel microsatellite loci in rare minnow (Gobiocypris rarus) and amplification in closely related species in Gobioninae. Conservation Genetics 8, 1003-1007.
Liu, X.L., Su, C.J., Xu, Y. & Zhang, J.Y. (2006). Water resource problem and sustainable utilization in the upper reaches of Minjiang River. Research of Soil and Water Conservation 13(3), 189-191. (in Chinese)
Manel, S., Schwartz, M.K., Luikart, G. & Taberlet, P. (2003). Landscape genetics: combining landscape ecology and population genetics. Trends in Ecology & Evolution 18, 189-197.
Mantel, N. (1967). The detection of disease clustering and a generalized regression approach. Cancer Research 27, 209-220.
Morgan, M.J., Hunter, D., Pietsch, R., Osborne, W. & Keogh, J.S. (2008). Assessment of genetic diversity in the critically endangered Australian corroboree frogs, Pseudophryne corroboree and Pseudophryne pengilleyi, identifies four evolutionarily significant units for conservation. Molecular Ecology 17, 3448-3463.
Moritz, C. (1994). Defining evolutionarily-significant-units for conservation. Trends in Ecology & Evolution 9, 373-375.
Nagylaki, T. (1998). Fixation indices in subdivided populations. Genetics 148, 1325-1332.
Nei, M., Tajima, F. & Tateno, Y. (1983). Accuracy of estimated phylogenetic trees from molecular data. Journal of Molecular Evolution 19, 153-170.
Oksanen, J., Kindt, R., Legendre, P., O’Hara, B., Simpson, G.L., Solymos, P., Stevens, M.H.H. & Wagner, H. (2008). Vegan: Community Ecology Package. R package version 1.15-0. http://cran.r-project.org/, http://vegan.r-forge.r-project.org/.
Paetkau, D., Amstrup, S.C., Born, E.W., Calvert, W., Derocher, A.E., Garner, G.W., Messier, F., Stirling, I., Taylor, M.K., Wiig, O. & Strobeck, C. (1999). Genetic structure of the world's polar bear populations. Molecular Ecology 8, 1571-1584.
Page, R.D.M. (1996). TreeView: An application to display phylogenetic trees on personal computers. Computer Applications in the Biosciences 12, 357-358.
Parker, K.M., Sheffer, R.J. & Hedrick, P.W. (1999). Molecular variation and evolutionarily significant units in the endangered Gila topminnow. Conservation Biology 13, 108-116.
Pearse, D.E. & Crandall, K.A. (2004). Beyond FST: Analysis of population genetic data for conservation. Conservation Genetics 5, 585-602.
Pei, D.S., Sun, Y.H. & Zhu, Z.Y. (2008). Construction of cytoplasmic molecular markers distinguishing Danio rerio from Gobiocypris rarus at high identity domains based on MP-PCR strategy and Sybr Green I detection. Molecular Biology Reports 35(1), 45-50.
Piry, S., Alapetite, A., Cornuet, J.M., Paetkau, D., Baudouin, L. & Estoup, A. (2004). GENECLASS2: A software for genetic assignment and first-generation migrant detection. Journal of Heredity 95, 536-539.
Pritchard, J.K., Stephens, M. & Donnelly, P. (2000). Inference of population structure using multilocus genotype data. Genetics 155, 945-959.
Qian, H. & Tang, R.C. (1997). On the formation and evolution of the Chengdu Plain. Earthquake Research in Sichuan 3, 1-7. (in Chinese)
Raymond, M. & Rousset, F. (1995). GENEPOP (Version-1.2) - Population genetics software for exact tests and ecumenicism. Journal of Heredity 86, 248-249.
Rice, W.R. (1989). Analyzing tables of statistical tests. Evolution 43, 223-225.
Ridenhour, B.J. & Brodie, E.D. (2007). Patterns of genetic differentiation in Thamnophis and Taricha from the Pacific Northwest. Journal of Biogeography 34, 724-735.
Schlosser, J.A., Dubach, J.M., Garner, T.W.J., Araya, B., Bernal, M., Simeone, A., Smith, K.A. & Wallace, R.S. (2009). Evidence for gene flow differs from observed dispersal patterns in the Humboldt penguin, Spheniscus humboldti. Conservation Genetics 10, 839-849.
Schneider, S., Roessli, D. & Excoffier, L. (2000). Arlequin ver.2.000: A software for population genetics data analysis. Genetics and Biometry Laboratory, University of Geneva, Switzerland.
Selkoe, K.A. & Toonen, R.J. (2006). Microsatellites for ecologists: a practical guide to using and evaluating microsatellite markers. Ecology Letters 9, 615-629.
Slatkin, M. (1985). Gene flow in natural populations. Annual Review of Ecology and Systematics 16, 393-430.
Stow, A.J., Sunnucks, P., Briscoe, D.A. & Gardner, M.G. (2001). The impact of habitat fragmentation on dispersal of Cunningham's skink (Egernia cunninghami): evidence from allelic and genotypic analyses of microsatellites. Molecular Ecology 10, 867-878.
Su, J.G., Zhu, Z.Y. & Wang, Y.P. (2008). Molecular cloning, characterization and expression analysis of the PKZ gene in rare minnow Gobiocypris rarus. Fish and Shellfish Immunology 25(1-2), 106-113.
Takezaki, N. & Nei, M. (2008). Empirical tests of the reliability of phylogenetic trees constructed with microsatellite DNA. Genetics 178, 385-392.
Wang, J.W. (1992). Reproductive biology of Gobiocypris rarus. Acta Hydrobiologica Sinica 16(2), 165-174. (in Chinese)
Wang, J.W. (1996). Studies on critical temperature of Gobiocypris rarus. Sichuan Journal of Zoology 15(4), 153-155. (in Chinese)
Wang, J.W. (1999). Spawning performance and development of oocytes in Gobiocypris rarus. Acta Hydrobiologica Sinica 23(2), 161-166. (in Chinese)
Wang, J.W. & Cao W.X. (1997). Gobiocypris rarus and fishes as laboratory animals. Transaction of the Chinese Ichthyological Society 6, 144-152. (in Chinese)
Wang, S. & Xie, Y. (eds) (2004). China species red list, vol. 1. Red List. Beijing: Higher Education Press. pp. 154. (in Chinese)
Wang, T.H., Liu, P.L., Chen, H.X., Liu, H.Q., Yi, Y.L. & Guo, W. (1994). Preliminary study on the susceptibility of Gobiocypris rarus to Hemorrhagic Virus of Grass Carp (GCHV). Acta Hydrobiologica Sinica 18(2), 144-149. (in Chinese)
Wang, Z.H., Yin, Y.W., Xu, Z.N., Zhou, J., Zhang, Q. & Zhang, D.P. (1998). Acute and subchronic toxicity of pyrethroid insecticides to Gobiocypris rarus. Chinese Journal of Applied and Environmental Biology 4(4), 379-382. (in Chinese)
Waples, R.S. (1991). Pacific Salmon, Oncorhynchus spp. and the definition of species under the endangered species act. Marine Fisheries Review 53, 11-22.
Wilson, G.A. & Rannala, B. (2003). Bayesian inference of recent migration rates using multilocus genotypes. Genetics 163, 1177-1191.
Wright, S. (1978). Evolution and the Genetics of Population, Variability Within and Among Natural Populations. Chicago: The University of Chicago Press.
Xiong, D.M., Xie, C.X. & Xia, L. (2009). Threatened fishes of the world: Gobiocypris rarus Ye and Fu, 1983 (Cyprinidae). Environmental Biology of Fishes 86, 107-108.
Ye, M.R. & Fu, T.Y. (1983). Description of a new genus and species of Danioninae from China (Cypriniformes: Cyprinidae). Acta Zootaxon Sinica 8(4), 434-437. (in Chinese)
Yuan, J.J. & Tao, X.F. (2008). The features of gravel bed and drainage evolution in the Qingyi River valley in the Mingshan-Danling Region, Sichuan. Acta Geologica Sinica 28(1), 6-12. (in Chinese)
Zamudio, K.R. & Wieczorek, A.M. (2007). Fine-scale spatial genetic structure and dispersal among spotted salamander (Ambystoma maculatum) breeding populations. Molecular Ecology 16, 257-274.
Zayed, A. & Packer, L. (2007). The population genetics of a solitary oligolectic sweat bee, Lasioglossum (Sphecodogastra) oenotherae (Hymenoptera : Halictidae). Heredity 99, 397-405.
Zhong, X.P., Xu, Y., Liang, Y., Liao, T. & Wang, J.W. (2005). The Chinese rare minnow (Gobiocypris rarus) as an in vivo model for endocrine disruption in freshwater teleosts: a full life-cycle test with diethylstilbestrol. Aquatic Toxicology 71, 85-95.
P5
Morphological variation among wild populations of Chinese rare minnow
(Gobiocypris rarus) in four river basins
He Y., Li R., Wang J., Blanchet S. & Lek S. (2010)
In preparation

Morphological variation among wild populations of Chinese rare minnow
(Gobiocypris rarus) in four river basins
Yongfeng HE1, 2, Rui LI, Jianwei WANG1, *, Simon BLANCHET2, 3, Sovan LEK2
1 Institute of Hydrobiology, Chinese Academy of Sciences, Wuhan, Hubei 430072,
China; 2 Université Paul Sabatier, Lab. Evolution & Diversité Biologique, UMR 5174,
CNRS – 118, route de Narbonne – 31062 Toulouse, Cedex, France; 3 Station
d’Ecologie Expérimental du CNRS à Moulis, Lab. USR 2936, 09 100 Moulis, France
(*Corresponding author: Phone: +86-27-68780033; Fax number: +86-27-68780065;
E-mail: [email protected]; Address: Institute of Hydrobiology, Chinese Academy of
Sciences, 7# Donghu South Road, Wuhan, Hubei 430072, China)
Abstract
The morphological variation of wild populations of Gobiocypris rarus was
studied based on morphometric and meristic analyses of samples collected in the
Dadu River basin, Qingyi River basin, Minjiang River basin and Tuojiang River basin.
There were no significant meristic differences between sexes and among populations.
However, there were significant morphometric differences not only between sexes but
also among populations. In discriminant function analysis, the first four discriminant
functions explained 70.4% and 73.4% of the between-population morphometric
variation for males and females, respectively. Fifteen of all the morphometric traits
showed the most important contribution to discriminate populations, mainly reflecting
the differences of head morphology and vertical body shape. By using all the
morphometric traits, the overall random assignments of individuals into their original
population were 72.1% and 79.4% for males and females, respectively. In addition,
the degree of differentiation in quantitative traits (QST) exceeds that in neutral
molecular markers (FST). However, no significant correlations between QST and FST
or riparian geographic distance were revealed. It may suggest a cooperative effect of
environmental and genetic factors on phenotypic discreteness.
Keywords: Gobiocypris rarus, population differentiation, morphology, quantitative
divergence
Introduction
Studies of the population structure of threatened fishes are of theoretical interest
to evolutionary biologists and of practical value to fishery managers. Quantitative
variations of morphological and genetic characters have been extensively used to
describe the population structure in many fish species, and been of greatest concern in
conservation biology (Murta 2000; Frankham 2002; Silva 2003; Leinonen et al. 2006;
Turan et al. 2006; Clabaut et al. 2007).
Morphological variation in fishes may provide a good record of short-term
population structuring. It is often environmentally induced for aquatic environments
can exhibit great spatial or temporal variability in both abiotic and biotic habitat
parameters (Lowe-McConnell 1987; Thompson 1991; Kinsey et al. 1994; Langerhans
et al. 2003; Langerhans et al. 2007). While stable differences in shape between groups
of fish may reveal different growth, mortality or reproductive rates that are relevant
for the definition of stocks (Cadrin 2000).
Morphometrics and meristics are the two types of morphological characters,
providing useful results for identifying fish stocks and describing their spatial
distributions (Ihssen et al. 1981). Morphometric characters describing aspects of body
shape are continuous, while meristic characters fixed in embryos or larvae are discrete,
serially repeated and countable. Traditionally morphometric data are measurements of
lengths, depths and widths. They are primarily longitudinal and focused on the head
and tail. Such a data set contains relatively little information about shape because
many of the measurements overlap or run in similar directions (Maderbacher et al.,
2008). Thus, as an alternative, Strauss & Bookstein (1982) proposed a box-truss
network between landmarks as a more comprehensive representation of form. Several
researchers have compared the performance of traditional measurements to box-truss
distances of finfish, and found that truss data resulted in more accurate classification
of individuals (Strauss & Bookstein 1982; Winans 1987; Schweigert 1990; Roby et al.
1991). Comparison to traditional measurements, these landmark-based techniques
pose no restriction on the directions of variation and localization of shape changes,
and are very effective in capturing meaningful information about the shapes of
organisms (Cavalcanti et al. 1999; Clabaut et al. 2007). When combined with
multivariate statistical procedures, they offer the most powerful tool for testing and
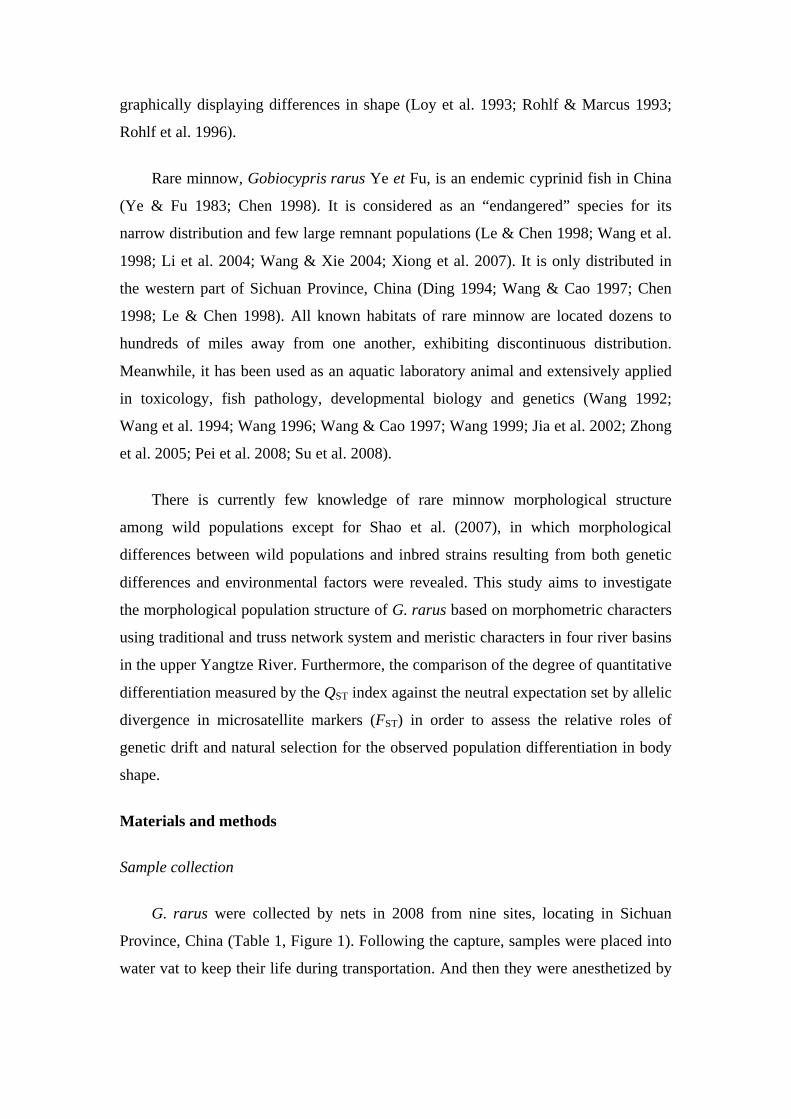
graphically displaying differences in shape (Loy et al. 1993; Rohlf & Marcus 1993;
Rohlf et al. 1996).
Rare minnow, Gobiocypris rarus Ye et Fu, is an endemic cyprinid fish in China
(Ye & Fu 1983; Chen 1998). It is considered as an “endangered” species for its
narrow distribution and few large remnant populations (Le & Chen 1998; Wang et al.
1998; Li et al. 2004; Wang & Xie 2004; Xiong et al. 2007). It is only distributed in
the western part of Sichuan Province, China (Ding 1994; Wang & Cao 1997; Chen
1998; Le & Chen 1998). All known habitats of rare minnow are located dozens to
hundreds of miles away from one another, exhibiting discontinuous distribution.
Meanwhile, it has been used as an aquatic laboratory animal and extensively applied
in toxicology, fish pathology, developmental biology and genetics (Wang 1992;
Wang et al. 1994; Wang 1996; Wang & Cao 1997; Wang 1999; Jia et al. 2002; Zhong
et al. 2005; Pei et al. 2008; Su et al. 2008).
There is currently few knowledge of rare minnow morphological structure
among wild populations except for Shao et al. (2007), in which morphological
differences between wild populations and inbred strains resulting from both genetic
differences and environmental factors were revealed. This study aims to investigate
the morphological population structure of G. rarus based on morphometric characters
using traditional and truss network system and meristic characters in four river basins
in the upper Yangtze River. Furthermore, the comparison of the degree of quantitative
differentiation measured by the QST index against the neutral expectation set by allelic
divergence in microsatellite markers (FST) in order to assess the relative roles of
genetic drift and natural selection for the observed population differentiation in body
shape.
Materials and methods
Sample collection
G. rarus were collected by nets in 2008 from nine sites, locating in Sichuan
Province, China (Table 1, Figure 1). Following the capture, samples were placed into
water vat to keep their life during transportation. And then they were anesthetized by
MS222 in order to do weighting and measuring. Sample size varied between 30 and
50, where (Reist 1985) recommended at least 25 samples for morphological analysis.
Table 1. Sampling details of Gobiocypris rarus used in this study.
Sampling sites Abbr. Location Sample size Sex (M/F) MSL Haiwozi T1 the Tuojiang River basin 50 27/23 44.40(6.36) Penzhou City T2 the Tuojiang River basin 50 17/33 34.81(6.10) Lichun Town M2 the Minjiang River basin 30 18/12 38.00(6.71) Qionglai City M3 the Minjiang River basin 50 17/33 38.40(3.76) Yaan City Q1 the Qingyi River basin 50 23/27 37.15(5.75) Jiajiang County Q2 the Qingyi River basin 50 40/10 31.65(5.26) Liusha River mouth D1 the Dadu River basin 31 23/8 37.17(6.35) Jiuxiang Town D2 the Dadu River basin 50 16/34 34.21(4.56) Leshan City D3 the Dadu River basin 50 25/25 41.50(4.68) Abbr. = Abbreviation. MSL represents mean standard length (mm) of each site. Standard deviations of MSL are given in parentheses.
Figure 1. Map showing the sampling sites of G. rarus in the upper Yangtze River basin.
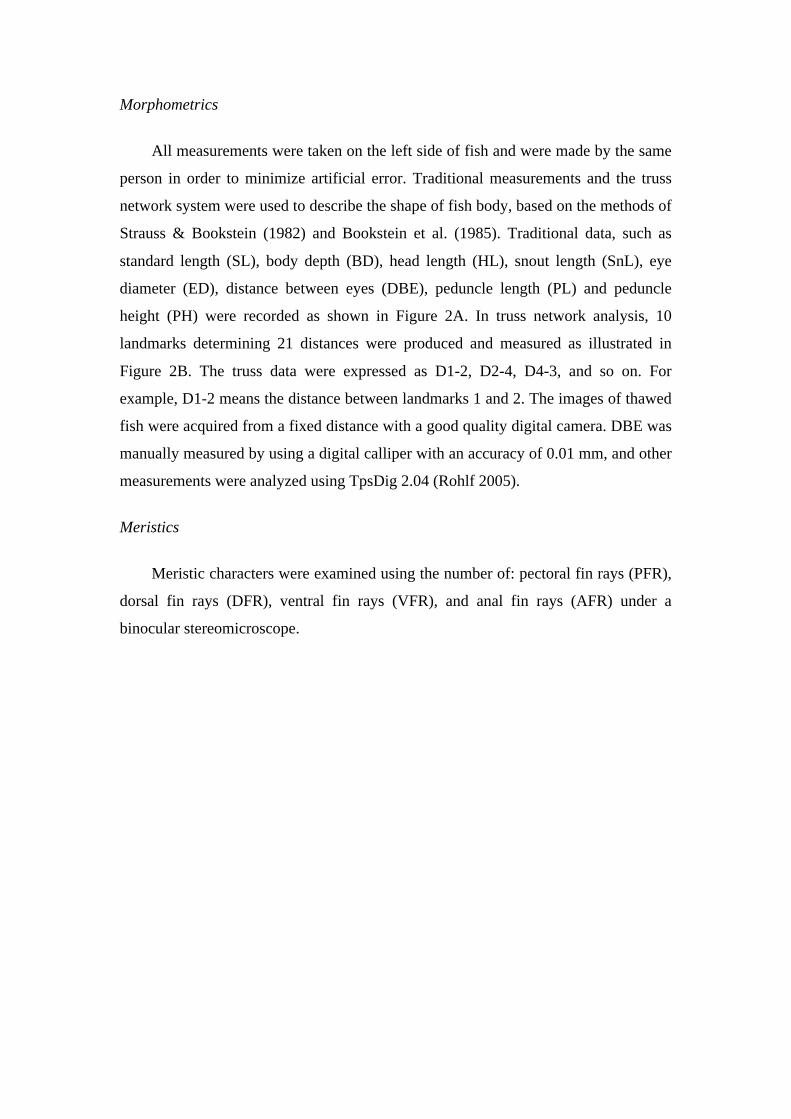
Morphometrics
All measurements were taken on the left side of fish and were made by the same
person in order to minimize artificial error. Traditional measurements and the truss
network system were used to describe the shape of fish body, based on the methods of
Strauss & Bookstein (1982) and Bookstein et al. (1985). Traditional data, such as
standard length (SL), body depth (BD), head length (HL), snout length (SnL), eye
diameter (ED), distance between eyes (DBE), peduncle length (PL) and peduncle
height (PH) were recorded as shown in Figure 2A. In truss network analysis, 10
landmarks determining 21 distances were produced and measured as illustrated in
Figure 2B. The truss data were expressed as D1-2, D2-4, D4-3, and so on. For
example, D1-2 means the distance between landmarks 1 and 2. The images of thawed
fish were acquired from a fixed distance with a good quality digital camera. DBE was
manually measured by using a digital calliper with an accuracy of 0.01 mm, and other
measurements were analyzed using TpsDig 2.04 (Rohlf 2005).
Meristics
Meristic characters were examined using the number of: pectoral fin rays (PFR),
dorsal fin rays (DFR), ventral fin rays (VFR), and anal fin rays (AFR) under a
binocular stereomicroscope.
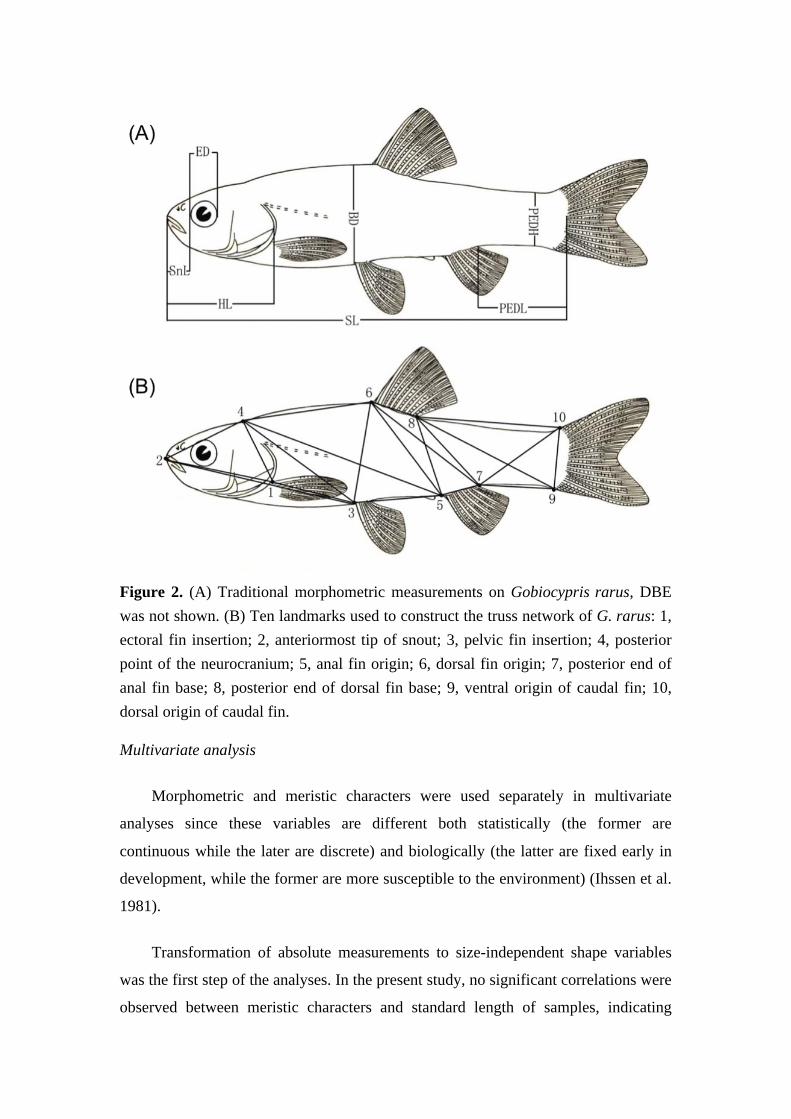
Figure 2. (A) Traditional morphometric measurements on Gobiocypris rarus, DBE was not shown. (B) Ten landmarks used to construct the truss network of G. rarus: 1, ectoral fin insertion; 2, anteriormost tip of snout; 3, pelvic fin insertion; 4, posterior point of the neurocranium; 5, anal fin origin; 6, dorsal fin origin; 7, posterior end of anal fin base; 8, posterior end of dorsal fin base; 9, ventral origin of caudal fin; 10, dorsal origin of caudal fin.
Multivariate analysis
Morphometric and meristic characters were used separately in multivariate
analyses since these variables are different both statistically (the former are
continuous while the later are discrete) and biologically (the latter are fixed early in
development, while the former are more susceptible to the environment) (Ihssen et al.
1981).
Transformation of absolute measurements to size-independent shape variables
was the first step of the analyses. In the present study, no significant correlations were
observed between meristic characters and standard length of samples, indicating
meristic characters were independent of fish size and the original meristic data were
not transformed. Difference of the meristic data between male and female samples
was revealed by non-parametric Kruskal-Wallis test. To identify whether there were
any statistically significant differences in meristic characters among populations, the
non-parametric Kruskal-Wallis test was also performed. After Kruskall-Wallis test,
multiple comparison tests between populations were conducted using ‘pgirmess’
package in the R software (Giraudoux 2006).
However, significant correlations were observed between morphometric
characters and standard length of samples. Therefore, in order to eliminate any
variation resulting from allometric growth, all morphometric measurements were
standardized according to Reist (1985). The formula is Madj = log M - b (log Ls - log
Lo), where Madj is the size adjusted measurement, M the original morphometric
measurement, Ls the overall mean of standard length for all fish from all samples and
Lo the standard length of fish. The parameter b was estimated for each character from
the observed data as the slope of the regression of log M on log Lo, using all
specimens. Correlation coefficients between transformed variables and standard
length were calculated to check if the data transformation was effective in removing
the effect of size in the data. The standardized truss measurements showed no
significant correlation with standard length, which indicated the size effect had been
successfully removed with the allometric transformation.
Following size-correction, the differences in morphometric variables between
male and female samples were determined using multivariate analysis of variance
(MANOVA). If there were significant sex differences, male and female samples
should be analyzed separately. To identify whether there were any statistically
significant differences among populations, both MANOVA and analysis of variance
(ANOVA) were performed with sex included as a fixed-effect factor. Afterwards,
discriminant analysis (DA) was conducted to determine which morphometric
variables discriminate among populations. Standardized coefficients for each variable
in each discriminant function represent the contribution of the respective variable to
the discrimination among populations. A random Monte Carlo test with 1000
permutations was used to reveal the significance of morphometric variables among
populations. A holdout procedure (i.e., 2/3 of the data as the training set and the
remaining 1/3 as the test set) was performed to test the ability of the model to
discriminate between populations, so that the proportion of individuals correctly re-
allocated was obtained.
Cluster analysis was performed on the mean values of standardized
morphometric data from nine populations using Euclidean distance method and
average clustering algorithm. All statistical analyses were performed using the R
software (Ihaka & Gentleman 1996).
Correlating morphology and genetics
The genetic divergence in neutral markers measured by FST values was obtained
from eight microsatellite markers in our previously paper (He et al. unpublished). The
sample size used in microsatellite analyses was similar with the present study, except
for a little difference from populations M2 and D1 (Table 1; He et al. unpublished).
The riparian geographical distance (RD), being proved to be best correlated with FST
in our previously paper (He et al. unpublished), was calculated along the closest
connected water system in the Google Earth 5.0.
A dimensionless measure of differentiation for quantitative traits, analogous to
Wright’s (1951) FST, can be defined as QST = σ b2/(σb
2+2σw2) (Spitze 1993; Storz
2002). The partitioning of phenotypic variance within and between populations of G.
rarus was assessed using a two-way ANOVA with sex included as a fixed-effects
factor. A within-population variance (σw2) was estimated by equating observed
within-population mean squares (MSwithin) to their expectations. The added variance
component attributable to differences between populations (σb2) was estimated as σb
2
= (MSbetween-MSwithin)/n0, where MSbetween is an unbiased estimate of the between-
population variance and n0 is the average sample size (Sokal & Rohlf 1995). For each
comparison, the average sample size n0 was calculated as
n0 = 1/(α-1)*(
€
ni
α
∑ -
€
ni2
α
∑ /
€
ni
α
∑ ),
where α = number of populations compared and n = number of individuals in the ith
population sample. CIs for QST were estimated by 1000 bootstrap replicates.
To test whether levels of quantitative divergence, genetic divergence and riparian
geographic distance were correlated, we calculated and tested the correlations
between pairwise QST, FST and riparian geographic distance with a simple Mantel test
module (Mantel 1967). Then the partial Mantel test was used to test correlations
between pairwise QST and FST after control for riparian geographic distance. All these
analyses were conducted using library vegan in the R software.
Results
Meristics
No significant sex dimorphism was revealed in meristics characters. The non-
parametric Kruskal-Wallis test showed no significant differences among populations
for all meristic characters. The ranges of all meristic counts widely overlapped, and
the modes of meristic characters were equal or close to each other among populations
of G. rarus.
Morphometrics
After size-adjustment calculations, no significant correlation coefficients
between transformed variables and standard length were revealed, indicating that the
size effect had been successfully removed with the allometric transformation.
Therefore, none of the variables was discarded from the following analysis.
Statistical differences between males and females for morphometric variables
were revealed (p < 0.001). There were significant sexual differences in 18 of all 28
morphometric traits, such as BD, DBE, PL, PH, D1_2, D4_3, D3_1, D2_3, D4_6,
D5_3, D3_6, D4_5, D6_8, D7_5, D10_9, D9_7, D7_10 and D8_9. Therefore, males
and females were separately analyzed in further analysis. With sex included as a
fixed-effects factor, MANOVA showed that morphological differences among
populations were significant over all morphometric measurements, while ANOVA
revealed that 20 of all 28 morphometric measurements were significantly different
among populations (Table 2).
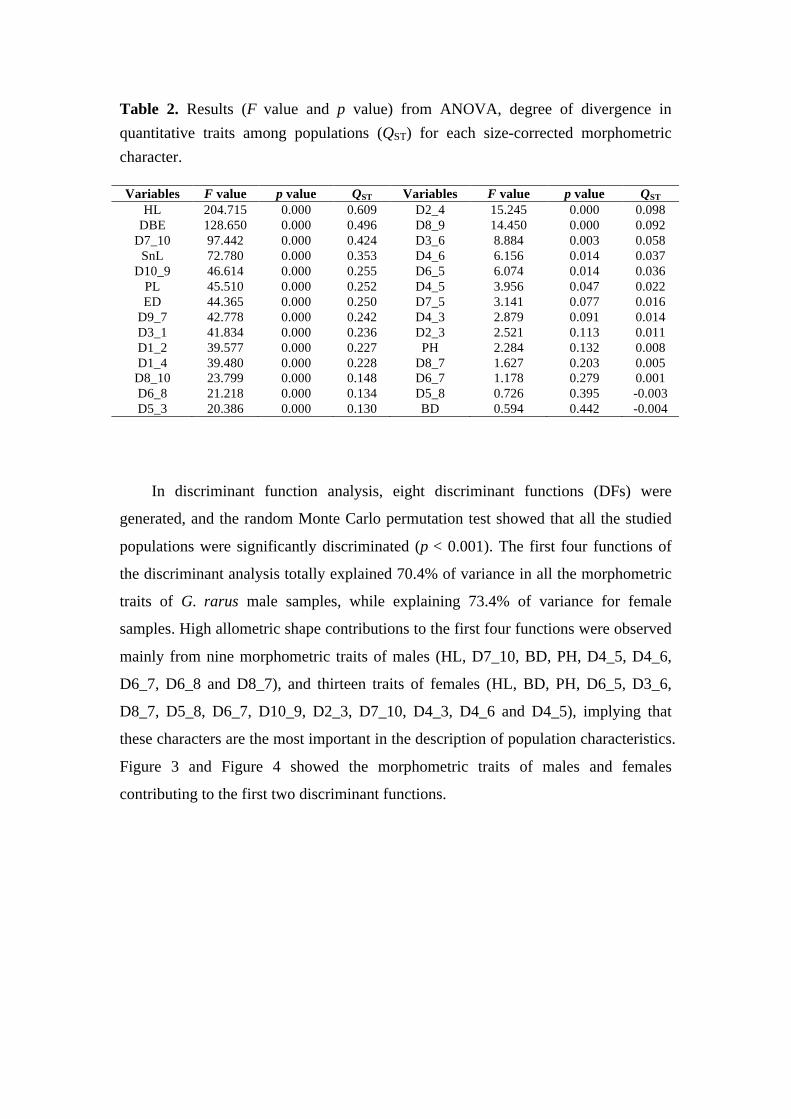
Table 2. Results (F value and p value) from ANOVA, degree of divergence in quantitative traits among populations (QST) for each size-corrected morphometric character.
Variables F value p value QST Variables F value p value QST HL 204.715 0.000 0.609 D2_4 15.245 0.000 0.098
DBE 128.650 0.000 0.496 D8_9 14.450 0.000 0.092 D7_10 97.442 0.000 0.424 D3_6 8.884 0.003 0.058
SnL 72.780 0.000 0.353 D4_6 6.156 0.014 0.037 D10_9 46.614 0.000 0.255 D6_5 6.074 0.014 0.036
PL 45.510 0.000 0.252 D4_5 3.956 0.047 0.022 ED 44.365 0.000 0.250 D7_5 3.141 0.077 0.016
D9_7 42.778 0.000 0.242 D4_3 2.879 0.091 0.014 D3_1 41.834 0.000 0.236 D2_3 2.521 0.113 0.011 D1_2 39.577 0.000 0.227 PH 2.284 0.132 0.008 D1_4 39.480 0.000 0.228 D8_7 1.627 0.203 0.005
D8_10 23.799 0.000 0.148 D6_7 1.178 0.279 0.001 D6_8 21.218 0.000 0.134 D5_8 0.726 0.395 -0.003 D5_3 20.386 0.000 0.130 BD 0.594 0.442 -0.004
In discriminant function analysis, eight discriminant functions (DFs) were
generated, and the random Monte Carlo permutation test showed that all the studied
populations were significantly discriminated (p < 0.001). The first four functions of
the discriminant analysis totally explained 70.4% of variance in all the morphometric
traits of G. rarus male samples, while explaining 73.4% of variance for female
samples. High allometric shape contributions to the first four functions were observed
mainly from nine morphometric traits of males (HL, D7_10, BD, PH, D4_5, D4_6,
D6_7, D6_8 and D8_7), and thirteen traits of females (HL, BD, PH, D6_5, D3_6,
D8_7, D5_8, D6_7, D10_9, D2_3, D7_10, D4_3, D4_6 and D4_5), implying that
these characters are the most important in the description of population characteristics.
Figure 3 and Figure 4 showed the morphometric traits of males and females
contributing to the first two discriminant functions.
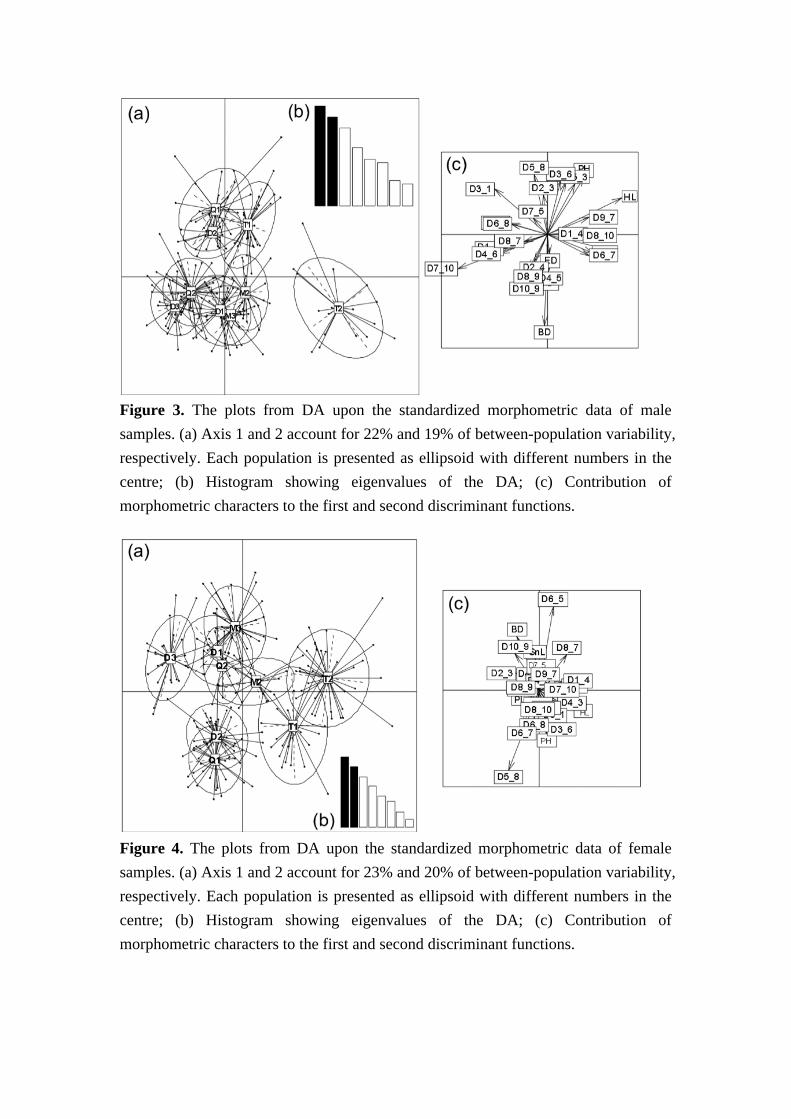
Figure 3. The plots from DA upon the standardized morphometric data of male samples. (a) Axis 1 and 2 account for 22% and 19% of between-population variability, respectively. Each population is presented as ellipsoid with different numbers in the centre; (b) Histogram showing eigenvalues of the DA; (c) Contribution of morphometric characters to the first and second discriminant functions.
Figure 4. The plots from DA upon the standardized morphometric data of female samples. (a) Axis 1 and 2 account for 23% and 20% of between-population variability, respectively. Each population is presented as ellipsoid with different numbers in the centre; (b) Histogram showing eigenvalues of the DA; (c) Contribution of morphometric characters to the first and second discriminant functions.

When separating male and female samples, the overall random assignment of
individuals into their original population were 72.1% for males and 79.4% for females
by hold-out procedure (results not shown). When male and female samples were
pooled, the overall proportion of correct classification was similar (75.3%, Table 3).
The proportion of correctly classified the Q2 samples to their original group were
highest (100%). In contrary, the lowest correct classification was found in populations
D1 and M2, 56.2% and 60%, respectively.
Table 3. Percentage of individuals classified correctly into their original population for the morphometric characters by using hold-out procedure.
Population T1 T2 M2 M3 D1 D2 D3 Q1 Q2 T1 0.65 0.05 0.10 0.00 0.06 0.00 0.00 0.07 0.00 T2 0.06 0.85 0.00 0.00 0.00 0.00 0.00 0.00 0.00 M2 0.06 0.10 0.60 0.07 0.00 0.00 0.00 0.00 0.00 M3 0.06 0.00 0.00 0.80 0.06 0.00 0.12 0.00 0.00 D1 0.00 0.00 0.10 0.13 0.56 0.00 0.00 0.00 0.00 D2 0.00 0.00 0.20 0.00 0.06 0.87 0.00 0.27 0.00 D3 0.00 0.00 0.00 0.00 0.13 0.00 0.76 0.00 0.00 Q1 0.06 0.00 0.00 0.00 0.06 0.13 0.00 0.67 0.00 Q2 0.12 0.00 0.00 0.00 0.06 0.00 0.12 0.00 1.00
The clustering results were presented as dendrograms in Figure 5. The nine
populations formed three groups based on male or female samples. For male samples,
the first group consisted of population T2, the second comprised populations M2, M3
and D1, and the left five populations (T1, Q1, Q2, D2, D3) were comprised of the
third group (Figure 5A). Whereas for female samples, the first group consisted of
populations T2 and M3, the second comprised populations T1 and Q2, and the left
five populations (M2, D1, D2, D3, Q1) were comprised of the third group (Figure 5B).
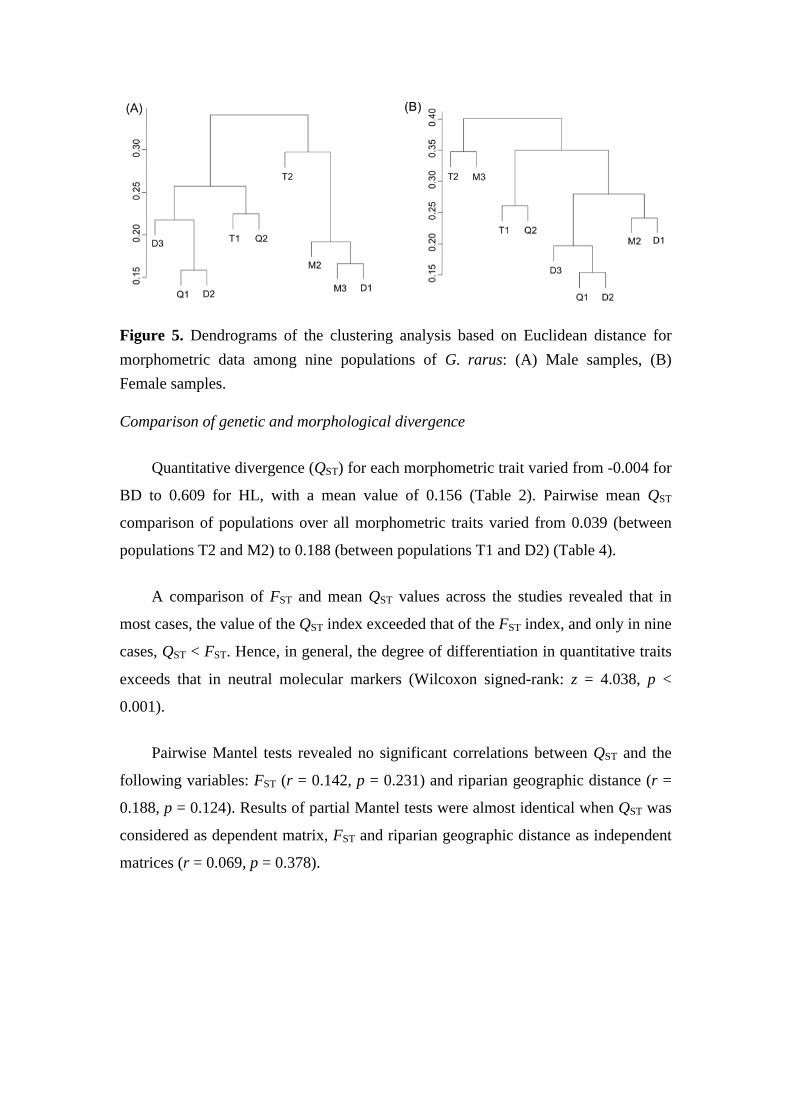
Figure 5. Dendrograms of the clustering analysis based on Euclidean distance for morphometric data among nine populations of G. rarus: (A) Male samples, (B) Female samples.
Comparison of genetic and morphological divergence
Quantitative divergence (QST) for each morphometric trait varied from -0.004 for
BD to 0.609 for HL, with a mean value of 0.156 (Table 2). Pairwise mean QST
comparison of populations over all morphometric traits varied from 0.039 (between
populations T2 and M2) to 0.188 (between populations T1 and D2) (Table 4).
A comparison of FST and mean QST values across the studies revealed that in
most cases, the value of the QST index exceeded that of the FST index, and only in nine
cases, QST < FST. Hence, in general, the degree of differentiation in quantitative traits
exceeds that in neutral molecular markers (Wilcoxon signed-rank: z = 4.038, p <
0.001).
Pairwise Mantel tests revealed no significant correlations between QST and the
following variables: FST (r = 0.142, p = 0.231) and riparian geographic distance (r =
0.188, p = 0.124). Results of partial Mantel tests were almost identical when QST was
considered as dependent matrix, FST and riparian geographic distance as independent
matrices (r = 0.069, p = 0.378).

Table 4. Pairwise QST values of wild populations of G. rarus, using all size-corrected morphometric variables
Population T1 T2 M2 M3 D1 D2 D3 Q1 Q2 T1 T2 0.099 M2 0.074 0.039 M3 0.083 0.078 0.053 D1 0.061 0.077 0.046 0.041 D2 0.188 0.149 0.109 0.160 0.111 D3 0.119 0.147 0.108 0.117 0.053 0.080 Q1 0.139 0.159 0.114 0.133 0.111 0.047 0.056 Q2 0.076 0.119 0.091 0.101 0.092 0.133 0.102 0.126
Discussion
Sexual dimorphism
Information about sexual dimorphism is essential for understanding the ecology,
behavior and life history of a species, as well as for making morphological
comparisons between populations (Kitano et al. 2007). Sexual dimorphism is the
difference in morphology between male and female members of the same species,
including differences in size, coloration, or body structure between the sexes. Roff
(1983) had proposed that males are usually smaller than females in fish because the
males eat less to avoid predation. Some fish species such as walleye (Stizostedion
vitreum vitreum) and threespine stickleback (Gasterosteus aculeatus) confirmed this
kind of phenomenon (Henderson et al. 2003; Kitano et al. 2007). Actually, there are
indeed some differences in the body shape of mature individuals of G. rarus, which
were visible by eyes. For example, females usually have plump abdomen and
relatively large body size, while males are usually slender and smaller than females.
This phenomenon has been described in Wang (1992). He pointed out that the
differences of the relative length of pectoral fin and ventral fin were one of the most
important traits to discriminate males from females of G. rarus. That is, the distance
between the end of pectoral fin rays and the origin of ventral fin in female samples are
about the distance of three to five scales, longer than that in male samples (one to two
scales distance); the distance between the end of ventral fin rays and the cloacal
aperture are about the distance of one to three scales, longer than that in male samples
(about half of scale distance, and sometimes the end of ventral fin rays could reach
the cloacal aperture).
The present study revealed that the phenomenon of sexual dimorphism indeed
existed in G. rarus for there were significant sexual differences in about 64% of
morphometric traits. The differences of these morphometric traits such as DBE
(distance between eyes), BD (body depth), PH (peduncle height) and D5_3 were in
accordance with Wang (1992). From the distribution of these morphometric variables,
it was found that the measurements relating with landmark 3 in the truss network of G.
rarus were the most important discriminant features for sexes because all the
distances from this landmark such as D2_3, D3_1, D4_3, D3_6 and D5_3 were
significantly differentiated between males and females. In a word, it reflected out the
thickness and width of the body shape of G. rarus were mainly responsible for its
sexual dimorphism.
Population differentiation
All the studied populations were significantly differentiated from each other over
all the morphometric traits. However, they are not completely different from each
other. For instance, some of them such as populations T1, Q1 and D2 overlapped each
other and showed a certain degree of isolation from other populations. This could be
confirmed by the clustering results. Among them, fifteen traits such as BD, HL, PH,
D4_6, D4_5, D8_7, D6_7, D7_10, D4_3, D2_3, D6_5, D3_6, D6_8, D5_8 and
D10_9 were the most important contribution variables to discriminate different
populations. It can be seen that the truss measurements relating with the landmark 6
and 7 play important roles in discriminating the populations. These measurements are
closely correlated with traditional traits of body shape in G. rarus: the landmark 6
mainly correlates with the changes of body depth and the origin of dorsal fin; the
landmark 7 mainly correlates with peduncle length, peduncle height, and the position
of anal fin. Actually, these traditional traits such as head length (HL), body depth (BD)
and peduncle height (PH) were revealed to be most important contribution variables
in discriminating different populations. In a word, the morphometric differentiation
among wild populations of G. rarus is mainly reflected by the change of head
morphology and vertical body shape.
However, population differentiations are related not only with morphological
traits but also with neutral genetic markers. Comparison between neutral genetic
differentiation amongst populations (FST) and quantitative variation (QST) are
increasingly being used in many studies (Merilä & Crnokrak 2001; Leinonen et al.
2006; Johansson et al. 2007; Chapuis et al. 2008; Jensen et al. 2008). There are
usually three possible interpretations for these comparison: QST > FST, directional
natural selection must be involved to achieve the differentiation; QST = FST, the
observed quantitative differentiation could be obtained by genetic drift alone; QST <
FST, the observed degree of differentiation is actually expected on the basis of
selection favoring the same phenotype in different populations (Merilä & Crnokrak
2001). Actually, these possible explanations of such comparison rest on many
assumptions; otherwise, they are problematic (Pujol et al. 2008). For instance, the
critical premise is that local environments differ enough to allow selection acting on
additive genetic variation to drive phenotypic divergence of populations. Therefore,
Pujol et al. (2008) concluded that it should be caution to interpret the QST-FST
comparison results in the wild populations.
In the present study, the detected non-significant correlation between the riparian
geographical distance and the quantitative divergence (QST) for morphometric data of
G. rarus may indicate that geographic distance is not a limiting factor for migration
between populations. In addition, there was no significant correlation between QST
and FST, which may suggest a cooperative effect of environmental and genetic factors
on phenotypic discreteness. The value of the QST index exceeded the FST index
between some populations, but they were smaller than the FST index between other
populations. To a certain degree, it reflected out environmental factors may play
important bidirectional roles on the degree of phenotypic divergence between G.
rarus populations. Just like the discussion in He & Wang (2010), if environmental
changes are not tremendous, the population magnitude effect could be recruited
rapidly due to the species’ short life cycle and high fecundity. That is, appropriate
environmental changes could be beneficial for exchanges between populations and
may reduce the degree of phenotypic divergence, and vice versa. In general, many
scholars revealed that fishes demonstrating greater variance in morphological traits
than other vertebrates were more susceptible to environmental factors (Allendorf
1988; Thompson 1991; Turan et al. 2006; Langerhans et al. 2007). Environmental
influences on traits can arise via genetically based responses to selection as well as
potentially nonadaptive effects of environment on phenotype (Pigliucci 2001; DeWitt
& Scheiner 2004; Langerhans et al. 2007). The relationship between environment and
phenotype is complex for the interplay of direct and indirect effects on traits, which is
consistent with the present study.
Acknowledgement
The authors are grateful to DE Gu for his technical assistance in measuring. This
research was supported by funds from the National Natural Science Foundation of
China (NSFC, 30670292), the technological fundamental conditions platform
program by China Hubei Provincial Science and Technology Department, the Chinese
Academy of Sciences (CZBZX-1), and the Ministry of Environmental Protection of
China (2009ZX07527-005).
Reference
Allendorf FW (1988) Conservation biology of fishes. Conserv Biol 2: 145-148.
Bookstein FL, Chernoff B, Elder R, Humphries J, Smith G, Strauss R (1985) Morphometrics in evolutionary biology. Special Publication 15. The Academy of Natural Sciences of Philadelphia pp. 277.
Cadrin SX (2000) Advances in morphometric analysis of fish stock structure. Rev Fish Biol Fish 10: 91-112.
Cavalcanti MJ, Monteiro LR, Lopes PRD (1999) Landmark-based morphometric analysis in selected species of serranid fishes (Perciformes: Teleostei). Zoological Studies 38(3): 287-294.
Chapuis E, Martin G, Goudet J (2008) Effects of selection and drift on G matrix evolution in a heterogeneous environment: a multivariate QST-FST test with the freshwater snail Galba truncatula. Genetics 180: 2151-2161.
Chen YY (1998) Fauna Sinica, Osteichthyes, Cypriniformes II. Science Press, Beijing, China, pp. 51-52. (in Chinese)
Clabaut C, Bunje PME, Salzburger W, Meyer A (2007) Geometric morphometric analyses provide evidence for the adaptive character of the Tanganyikan cichlid fish radiations. Evolution 61(3): 560-578.
DeWitt TJ, Scheiner SM (2004) Phenotypic Plasticity. Functional and Conceptual Approaches. Oxford University Press, New York.
Ding RH (1994) The Fishes of Sichuan, China. Sichuan Publishing House of Science and Technology, Chengdu. (in Chinese)
Frankham R, Ballou JD, Briscoe DA (2002) Introduction to Conservation Genetics. Cambridge University Press, New York.
Giraudoux P (2006) Pgirmess: data analysis in ecology. R package version 1.3.8 http://perso.orange.fr/giraudoux/.
He YF, Wang JW (2010) Temporal variation in genetic structure of the Chinese rare minnow (Gobiocypris rarus) in its type locality revealed by microsatellite markers. Biochem Genet 48: 312-325.
He YF, Wang JW, Blanchet S, Lek S. Genetic structure of an endangered endemic fish (Gobiocypris rarus) in the upper Yangtze River. Unpublished.
Henderson BA, Collins N, Morgan GE, Vaillancourt A (2003) Sexual size dimorphism of walleye (Stizostedion vitreum vitreum). Can J Fish Aquat Sci 60: 1345-1352.
Ihaka R, Gentleman R (1996) R: a language for data analysis and graphics. Journal of Computational and Graphical Statistics 299-314.
Ihssen PE, Booke HE, Casselman JM, McGlade JM, Payne NR, Utter FM (1981) Stock identification: materials and methods. Canadian Journal of Fisheries and Aquatic Sciences 38: 1838-1855.
Jensen LF, Hansen MM, Pertoldi C, Holdensgaard G, Mensberg KLD, Loeschcke V (2008) Local adaptation in brown trout early life-history traits: implications for climate change adaptability. Proceedings of the Royal Society B doi:10.1098/rspb.2008.0870.
Jia FJ, Wang JW, Wu QJ (2002) Gynogenetic rare minnow (Gobiocypris rarus) induced by heterogeneous sperms. Acta Hydrobiol Sin 26(3): 246-252. (in Chinese)
Johansson M, Primmer CR, Merilä J (2007) Does habitat fragmentation reduce fitness and adaptability? A case study of the common frog (Rana temporaria). Molecular Ecology 16: 2693-2700.
Kinsey ST, Orsoy T, Bert TM, Mahmoudi BB (1994) Population structure of the Spanish sardine Sardinella aurita: natural morphological variation in a genetically homogeneous population. Marine Biology 118: 309-317.
Kitano J, Mori S, Peichel CL (2007) Sexual dimorphism in the external morphology of the threespine stickleback (Gasterosteus aculeatus). Copeia 2: 336-349.
Langerhans RB, Chapman LJ, Dewitt TJ (2007) Complex phenotype-environment associations revealed in an East African cyprinid. Journal of Evolutionary Biology 20(3): 1171-1181.
Langerhans RB, Layman CA, Langerhans AK, Dewitt TJ (2003) Habitat-associated morphological divergence in two Neotropical fish species. Biological Journal of the Linnean Society 80(4): 689-698.

Le PQ, Chen YY (1998) China Red Data Book of Endangered Animals: Pisces, pp. 170-172. Science Press, Beijing. (in Chinese)
Leinonen T, Cano JM, Mäkinen H, Merilä J (2006) Contrasting patterns of body shape and neutral genetic divergence in marine and lake populations of threespine sticklebacks. Journal of Evolutionary Biology 19(6): 1803-1812.
Li L, Ma TW, Wu ZB (2004) Toxic effect of domestic sewage on rare minnow (Gobiocypris rarus). Acta Hydrobiol Sin 28(1): 40-44 (in Chinese)
Lowe-McConnell RH (1987) Ecological studies in tropical fish communities. London: Cambridge University Press.
Loy A, Corti M, Marcus LF (1993) Landmark data: size and shape analysis in systematics. A case study on Old World Talpidae (Mammalia, Insectivora). In LF Marcus, E Bello, A García-Valdecasas, eds. Contributions to morphometrics. Madrid: Museo Nacional de Ciencias Naturales, pp. 213-240.
Maderbacher M, Bauer C, Herler J, Postl L, Makasa L, Sturmbauer C (2008) Assessment of traditional versus geometric morphometrics for discriminating populations of the Tropheus moorii species complex (Teleostei: Cichlidae), a Lake Tanganyika model for allopatric speciation. J Zool Syst Evol Res 46(2): 153-161.
Mantel N (1967) The detection of disease clustering and a generalized regression approach. Cancer Res 27: 209-220.
Merilä J, Crnokrak P (2001) Comparison of genetic differentiation at marker loci and quantitative traits. J Evol Biol 14: 892-903.
Murta AG (2000) Morphological variation of horse mackerel (Trachurus trachurus) in the Iberian and North Africa Atlantic: implications for stock identification. ICES J Mar Sci 57: 1240-1248.
Pei DS, Sun YH, Zhu ZY (2008) Construction of cytoplasmic molecular markers distinguishing Danio rerio from Gobiocypris rarus at high identity domains based on MP-PCR strategy and Sybr Green I detection. Mol Biol Rep 35(1): 45-50.
Pigliucci M (2001) Phenotypic Plasticity. Beyond Nature and Nature. Johns Hopkins University Press, Baltimore, MD.
Pujol B, Wilson J, Ross RIC, Pannell JR (2008) Are QST-FST comparisons for natural populations meaningful? Molecular Ecology 17: 4782-4785.
Reist JD (1985) An empirical evaluation of several univariate methods that adjust for size variation in morphometric data. Canadian Journal of Zoology 63: 1429-1439.
Roby D, Lambert JD, Sevigny JM (1991) Morphometric and electrophoretic approaches to discrimination of capelin (Mallotus villosus) populations in the estuary and Gulf of Saint Lawrence. Can J Fish Aquat Sci 48: 2040-2050.
Roff D (1983) An allocation model of growth and reproduction in fish. Can J Fish Aquat Sci 40: 1395-1404.
Rohlf FJ (2005) tpsDig, digitize landmarks and outlines, version 2.04. Department of Ecology and Evolution, State Univesity of New York at Stony Brook.
Rohlf FJ, Loy A, Corti M (1996) Morphometric analysis of Old World Talpidae (Mammalia, Insectivora) using partial-warp scores. Syst Biol 45: 344-362.
Rohlf FL, Marcus LF (1993) A revolution in morphometrics. Trends in Ecology and Evolution 8: 129-132.
Schweigert J (1990) Comparison of morphometric and meristic data against truss networks for describing Pacific herring stocks. Am. Fish. Soc. Symp. 7, 47–62.
Shao Y, Wang JW, Qiao Y, He YF, Cao WX (2007) Morphological variability between wild populations and inbred stocks of a Chinese Minnow, Gobiocypris rarus. Zoological Science 24: 1094-1102.
Silva A (2003) Morphometric variation among sardine (Sardina pilchardus) populations from the northeastern Atlantic and the western Mediterranean. ICES J Mar Sci 60: 1352-1360.
Sokal RR, Rohlf FJ (1995) Biometry. W. H. Freeman, New York.
Spitze K (1993) Population structure in Daphhnia obtusa: quantitative genetic and allozymic variation. Genetics 135: 367-374.
Storz JF (2002) Contrasting patterns of divergence in quantitative traits and neutral DNA markers: analysis of clinal variation. Molecular Ecology 11: 2537-2551.
Strauss RE, Bookstein FL (1982) The truss: body form reconstructions in morphometrics. Systematic Zoology 113-135.
Su JG, Zhu ZY, Wang YP (2008) Molecular cloning, characterization and expression analysis of the PKZ gene in rare minnow Gobiocypris rarus. Fish Shellfish Immun 25(1-2): 106-113.
Thompson JD (1991) Phenotypic plasticity as a component of evolutionary change. Trends Ecol Evol 6: 246-249.
Turan C, Oral M, Öztürk B, Düzgünes E (2006) Morphometric and meristic variation between stocks of Bluefish (Pomatomus saltatrix) in the Black, Marmara, Aegean and northeastern Mediterranean Seas. Fisheries Research 79: 139-147.
Wang JW (1992) Reproductive biology of Gobiocypris rarus. Acta Hydrobiol Sin 16(2): 165-174. (in Chinese)
Wang JW (1996) Studies on critical temperature of Gobiocypris rarus. Sichuan Zool 15(4): 153-155. (in Chinese)
Wang JW (1999) Spawning performance and development of oocytes in Gobiocypris rarus. Acta Hydrobiol Sin 23(2): 161-166. (in Chinese)
Wang JW, Cao WX (1997) Gobiocypris rarus and fishes as laboratory animals. Trans Chinese Ichthyol Soc 6: 144-152. (in Chinese)
Wang S, Xie Y (eds) (2004) China species red list, vol. 1. Red List. Higher Education Press, Beijing, pp. 154. (in Chinese)
Wang TH, Liu PL, Chen HX, Liu HQ, Yi YL, Guo W (1994) Preliminary study on the susceptibility of Gobiocypris rarus to Hemorrhagic Virus of Grass Carp (GCHV). Acta Hydrobiol Sin 18(2): 144-149. (in Chinese)
Wang ZH, Yin YW, Xu ZN, Zhou J, Zhang Q, Zhang DP (1998) Acute and subchronic toxicity of pyrethroid insecticides to Gobiocypris rarus. Chinese Appl Environ Biol 4(4): 379-382. (in Chinese)
Winans GA (1987) Using morphometric and meristic characters for identifying stocks of fish. In: Kumpf HE, Vaught RN, Grimes CB, Johnson AG and Nakamura EL eds. Proceedings of the Stock Identification Workshop. NOAA Tech. Mem. NMFS-SEFC 199: 135-146.
Wright S (1951) The genetical structure of populations. Annals of Eugenics 15: 323-354.
Xiong DM, Xie CX, Xia L (2007) Threatened fishes of the world: Gobiocypris rarus Ye and Fu, 1983 (Cyprinidae). Environ Biol Fish doi: 10.1007/s10641-007-9284-8.
Ye MR, Fu TY (1983) Description of a new genus and species of Danioninae from China (Cypriniformes: Cyprinidae). Acta Zootaxon Sin 8(4): 434-437. (in Chinese)
Zhong XP, Xu Y, Liang Y, Liao T, Wang JW (2005) The Chinese rare minnow (Gobiocypris rarus) as an in vivo model for endocrine disruption in freshwater teleosts: a full life-cycle test with diethylstilbestrol. Aquat Toxicol 71: 85-95.