phase i summary report for detroit lead · pdf filedetroit lead assessment project industrial...
TRANSCRIPT

PHASE I SUMMARY REPORT FOR
DETROIT LEAD ASSESSMENT PROJECT INDUSTRIAL SMELTING – 19430 MT ELLIOTT STREET
DETROIT, WAYNE COUNTY, MICHIGAN
Prepared for
MICHIGAN DEPARTMENT OF ENVIRONMENTAL QUALITY REMEDIATION AND REDEVELOPMENT DIVISION
Detroit Field Office – Cadillac Place Suite 2-300
3058 West Grand Boulevard Detroit, Michigan 48202
Prepared by
WESTON SOLUTIONS OF MICHIGAN, INC. 2501 Jolly Road
Suite 100 Okemos, MI 48864
March 2004
W.O. No: 20083.028.001


Weston Solutions, Inc. MDEQ - Phase I Summary Report Industrial Smelting – 19430 Mt. Elliott
ES-1 03/05/04
EXECUTIVE SUMMARY
Weston Solutions of Michigan, Inc. (WESTON) was contracted by the Michigan Department of
Environmental Quality (MDEQ) Remediation and Redevelopment Division (RRD) to conduct
off-site sampling for the Detroit Lead Assessment Project (the project) in Detroit, Wayne
County, Michigan. This Summary Report addresses sampling that was conducted in the vicinity
of the former Industrial Smelting Company (the Facility), 19430 Mt. Elliott Street, Detroit,
Wayne County, Michigan.
The presence of lead identified on properties adjacent to or nearby the Facility, was evaluated
against predominant atmospheric conditions, spatial distribution, and statistical analysis to
determine if the lead at adjacent or nearby properties was indicative of aerial deposition from the
Facility.
On 11 November and 8 December 2003 WESTON collected 24 soil samples for lead analysis at
locations upwind and downwind of the Facility. Review of the data concluded that the lead
detected is consistent with deposition resulting from aerial releases and suggested that such
releases occurred from the Facility during historic smelting operations. However, the levels
detected were all below the screening level (400 milligrams per kilogram) set in the Quality
Assurance Sampling Plan (QASP). To assure that the conclusions are based on sufficient data it
is recommended that additional work be performed at the Facility including:
• Obtain access to the Facility for:
° Review of existing information related to property transfer (Phase I, Phase II, and
development planning):
° Interview past employees regarding historical Facility operations;
° Perform a Facility walk through to determine existing conditions;
° Collect on-site soil samples to determine the presence, concentration, and extent of
lead on the Facility (related to the location of former structures, if possible); and
• Collect soil samples from additional downwind properties to confirm and/or determine the
extent of downwind contamination.

Weston Solutions, Inc. MDEQ - Phase I Summary Report Industrial Smelting – 19430 Mt. Elliott
ES-2 03/05/04
This page intentionally left blank

Weston Solutions, Inc. MDEQ - Phase I Summary Report Industrial Smelting – 19430 Mt. Elliott
iii 03/05/04
TABLE OF CONTENTS
Section Page
ES EXECUTIVE SUMMARY……………………………………………………..… ES-1 1 INTRODUCTION.......................................................................................................... 1-1 2 SITE INFORMATION.................................................................................................. 2-1 2.1 Site Description.................................................................................................... 2-1 2.1.1 Site Location .............................................................................................. 2-1 2.1.2 Site History ................................................................................................ 2-1 2.2 Site Concerns ....................................................................................................... 2-2 3 FIELD ACTIVITIES AND PROCEDURES............................................................... 3-1 3.1 Overview of Sampling Activities......................................................................... 3-1 3.2 Field Activities..................................................................................................... 3-2 4 PHASE I ANALYTICAL RESULTS .......................................................................... 4-1 4.1 Summary of Analysis........................................................................................... 4-1 4.2 Atmospheric Conditions ...................................................................................... 4-1 4.3 Spatial Analysis ................................................................................................... 4-2 4.4 Statistical Analysis............................................................................................... 4-3 4.5 Conclusions.......................................................................................................... 4-3 5 RECOMMENDATIONS............................................................................................... 5-1

Weston Solutions, Inc. MDEQ - Phase I Summary Report Industrial Smelting – 19430 Mt. Elliott
iv 03/05/04
LIST OF APPENDICES
Title
Attachment A Figures Attachment B Tables Attachment C Wind Rose Plot Attachment D Photographs of Sampling Locations Attachment E Concentration Graph Attachment F Statistical Distribution

Weston Solutions, Inc. MDEQ - Phase I Summary Report Industrial Smelting – 19430 Mt. Elliott
1-1 03/05/04
SECTION 1
INTRODUCTION
Weston Solutions of Michigan, Inc. (WESTON) was contracted by the Michigan Department of
Environmental Quality (MDEQ) Remediation and Redevelopment Division (RRD) to conduct
off-site sampling for the Detroit Lead Assessment Project (the project) in Detroit, Wayne
County, Michigan. This Summary Report addresses sampling that was conducted in the vicinity
of the former Industrial Smelting (the Facility), 19430 Mt. Elliott Street, Detroit, Wayne County,
Michigan. The overall objectives, technical basis, and general sampling protocols for this work
are described in the Comprehensive Phase I Sampling Summary Report for the Detroit Lead
Assessment Project (Comprehensive Summary).
This Phase I Summary Report for Industrial Smelting has been organized in a format that is
intended to facilitate and effectively meet the objectives of the Phase I investigation. The
Summary Report is organized into the following sections:
• Section 1 - Introduction;
• Section 2 - Site Information;
• Section 3 - Field Activities and Procedures;
• Section 4 - Phase I Analytical Results; and
• Section 5 – Recommendations
Attachments to this Summary Report include the following:
• Attachment A Figures
• Attachment B Tables
• Attachment C Wind Rose Plot
• Attachment D Photographs of Sampling Locations
• Attachment E Concentration Graph
• Attachment F Statistical Distribution

Weston Solutions, Inc. MDEQ - Phase I Summary Report Industrial Smelting – 19430 Mt. Elliott
1-2 03/05/04
This page intentionally left blank
Weston Solutions, Inc. MDEQ - Phase I Summary Report Industrial Smelting – 19430 Mt. Elliott
2-1 03/05/04
SECTION 2
SITE INFORMATION
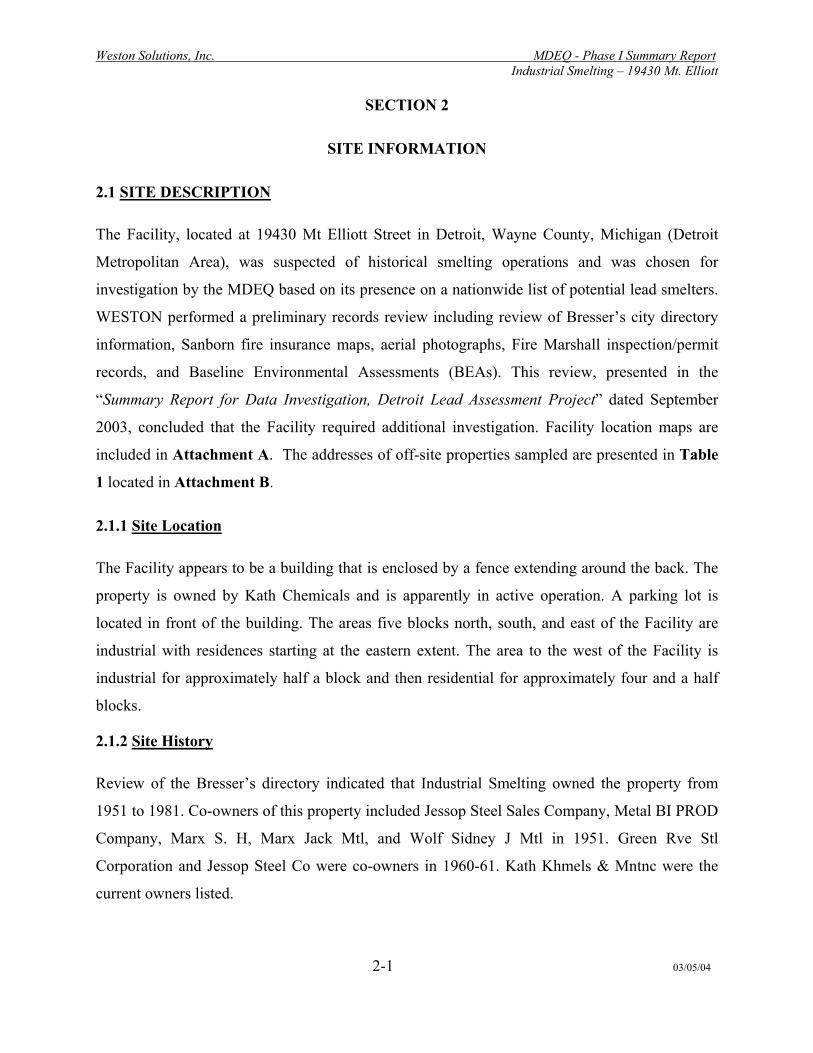
2.1 SITE DESCRIPTION
The Facility, located at 19430 Mt Elliott Street in Detroit, Wayne County, Michigan (Detroit
Metropolitan Area), was suspected of historical smelting operations and was chosen for
investigation by the MDEQ based on its presence on a nationwide list of potential lead smelters.
WESTON performed a preliminary records review including review of Bresser’s city directory
information, Sanborn fire insurance maps, aerial photographs, Fire Marshall inspection/permit
records, and Baseline Environmental Assessments (BEAs). This review, presented in the
“Summary Report for Data Investigation, Detroit Lead Assessment Project” dated September
2003, concluded that the Facility required additional investigation. Facility location maps are
included in Attachment A. The addresses of off-site properties sampled are presented in Table
1 located in Attachment B.
2.1.1 Site Location
The Facility appears to be a building that is enclosed by a fence extending around the back. The
property is owned by Kath Chemicals and is apparently in active operation. A parking lot is
located in front of the building. The areas five blocks north, south, and east of the Facility are
industrial with residences starting at the eastern extent. The area to the west of the Facility is
industrial for approximately half a block and then residential for approximately four and a half
blocks.
2.1.2 Site History
Review of the Bresser’s directory indicated that Industrial Smelting owned the property from
1951 to 1981. Co-owners of this property included Jessop Steel Sales Company, Metal BI PROD
Company, Marx S. H, Marx Jack Mtl, and Wolf Sidney J Mtl in 1951. Green Rve Stl
Corporation and Jessop Steel Co were co-owners in 1960-61. Kath Khmels & Mntnc were the
current owners listed.

Weston Solutions, Inc. MDEQ - Phase I Summary Report Industrial Smelting – 19430 Mt. Elliott
2-2 03/05/04
Review of the Sanborn maps for this address show that from 1967 through 2002 Steel
Warehouse and Smelting rooms are present.
The aerial photograph review indicated the immediate area surrounding this address was
industrialized from 1957 to the present. However, heavy residential settings occur one block
west of the facility and two blocks east. Structures identified from the most recent aerial
photograph (2003 GlobeXplorerTM) include a building in the center of the property with
undeveloped space to the east and west. Review of the drive by information indicates that land
use is consistent with the aerial photograph and Sanborn maps.
During the investigation of the Fire Records, three building permits were located for the
additions to a smelting plant.
Review of the BEA for nearby “17403 Mt. Elliott Street”, dated August 2002, prepared by
Superior Environmental for Hantz Group Inc, indicates that lead was detected on the site but the
levels were not specified.
2.2 SITE CONCERNS
The primary concern associated with the Facility is the off-site release of smelter-related metals,
specifically lead, to soils in the surrounding neighborhood through aerial deposition.

Weston Solutions, Inc. MDEQ - Phase I Summary Report Industrial Smelting – 19430 Mt. Elliott
3-1 03/05/04
SECTION 3
FIELD ACTIVITIES AND PROCEDURES
3.1 OVERVIEW OF SAMPLING ACTIVITIES
The goal of the Phase I sampling was to determine if lead concentrations consistent with smelter-
related releases were present off-site and could be attributed to the Facility. The general
sampling protocol presented in Section 2 of the Comprehensive Summary was followed during
the Phase I evaluation of the Facility. Due to the development around the Facility, samples could
not be collected within the 1000 foot radius stated in the Quality Assurance Sampling Plan
(QASP), so the radius was increased for this Facility.
Prior to sample collection, upwind and downwind sampling areas were established, within 2500
and 1800 feet (ft.) from the Facility, respectively. These areas were established based on mean
wind direction from 1984 to 1991 for the Detroit metropolitan area. A copy of the wind rose plot
is provided in Attachment C. Soil samples were collected from City and/or State owned
properties located within these established areas.
The City and/or State owned parcels identified for sampling were those closest to the average
wind direction and at varying distances from the Facility. Where individual City and/or State
owned parcels were not available, rights-of-way, utility corridors, and alleyways ('greenways')
were used and have been identified on the figures included in Attachment A. Photographs of the
sampling locations have been included in Attachment D. Exposure units and appropriate
sample grids were established in accordance with the QASP to guide the sampling activities.
Sampling activities (sample collection, record keeping, photo documentation) were conducted as
described in the Comprehensive Summary. WESTON collected samples from 11 City and/or
State owned parcels and one greenway near the Facility. Five City and/or State owned parcels
and one greenway parcel were sampled in the downwind direction and six City and/or State
owned parcels were sampled in the upwind direction. Two composite samples were collected
from each of the 6 downwind parcels and six of the upwind parcels. A total of 24 composite

Weston Solutions, Inc. MDEQ - Phase I Summary Report Industrial Smelting – 19430 Mt. Elliott
3-2 03/05/04
samples were collected from the area upwind and downwind of the Facility and are shown on the
sample sketches included in Attachment A.
3.2 FIELD ACTIVITIES
WESTON personnel conducted field sampling on 11 November and 8 December 2003. Since 12
City and/or State owned parcels were not available, WESTON selected one greenway, prior to
the sampling event, and submitted the location of the greenway to the City of Detroit to obtain
their approval and access. Because the greenway was not located on the same street as the
mailing address of the nearest building, the number of the building was used in conjunction with
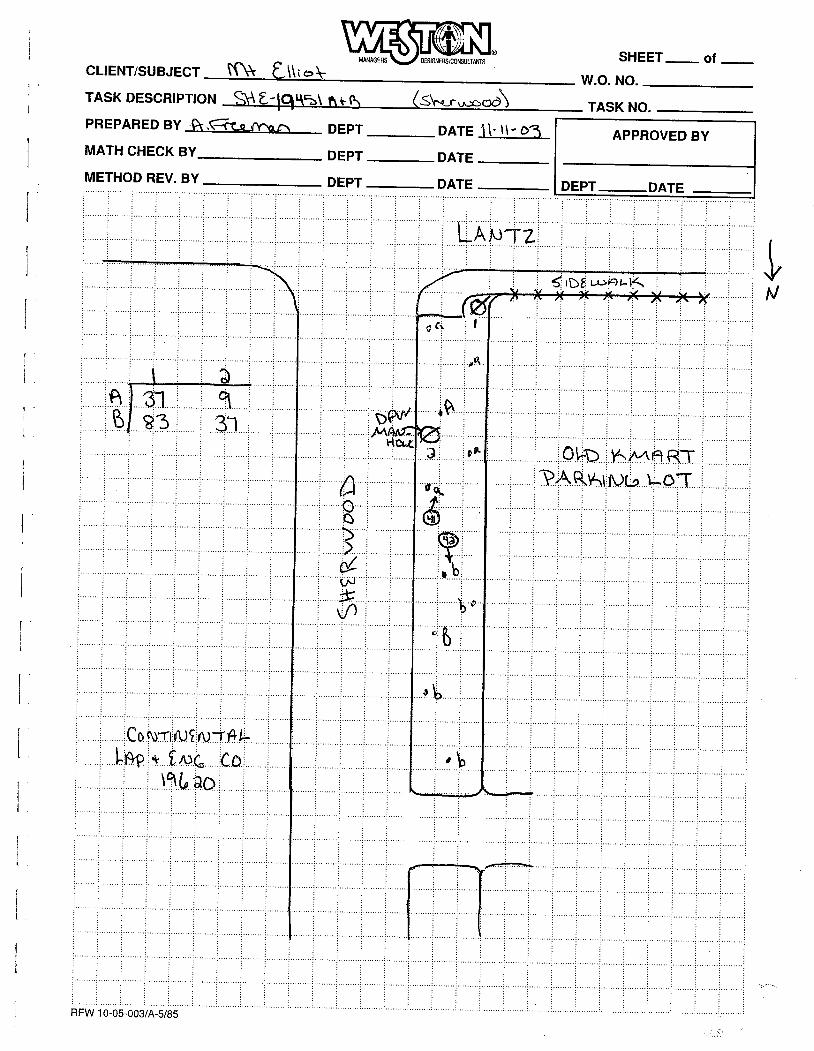
the street of the greenway. For example, a parcel at 3900 E Outer Drive with an adjacent
greenway located across the street from a building with a visible address of 19451 Sherwood
Street, would be identified SHE – 19451. These changes were noted in the logbook and can be
viewed in the “Summary Table For Sample Properties” (located in Attachment E) and on the
sample sketches (located in Attachment A).
WESTON collected two samples from each of the six upwind City and/or State owned parcels
for a total of 12 samples. Also, two samples were collected from each of the five downwind City
and/or State owned parcels and of the one greenway for a total of 12 downwind samples.
Twenty four soil samples were submitted for analysis. Five samples were designated as matrix
spike/matrix spike duplicates (MS/MSD) in accordance with the QASP.
Weston Solutions, Inc. MDEQ - Phase I Summary Report Industrial Smelting – 19430 Mt. Elliott
4-1 03/05/04
SECTION 4
PHASE I ANALYTICAL RESULTS
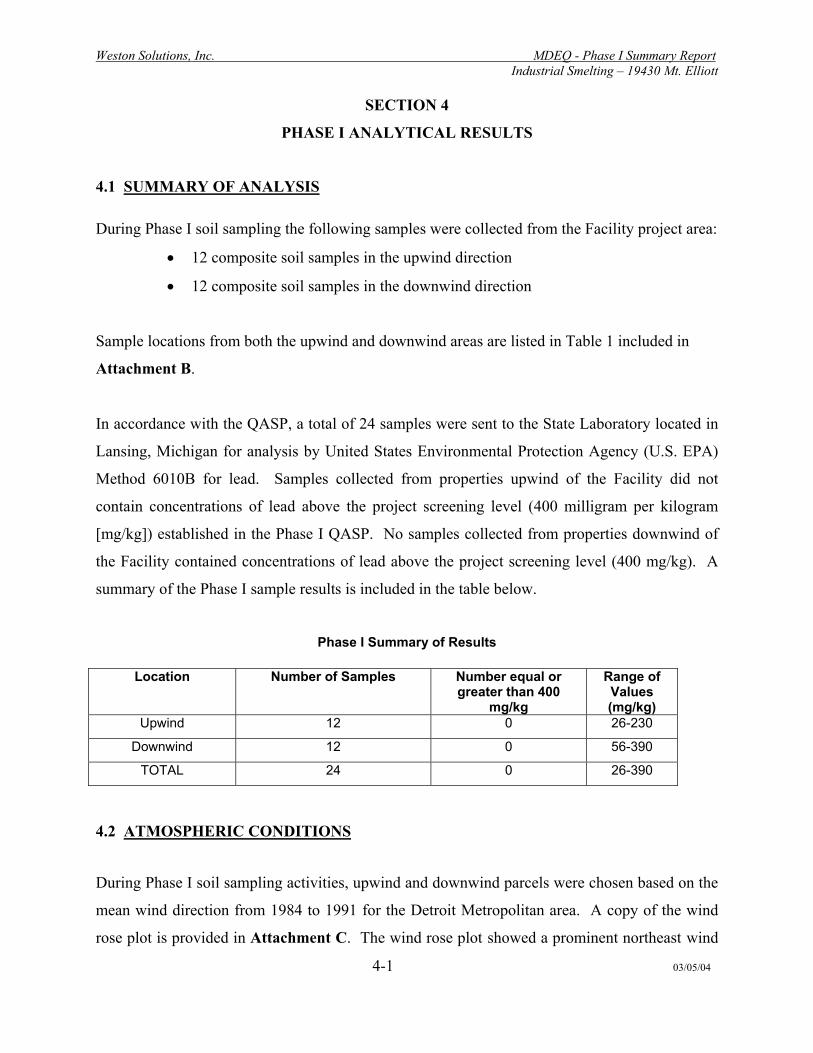
4.1 SUMMARY OF ANALYSIS
During Phase I soil sampling the following samples were collected from the Facility project area:
• 12 composite soil samples in the upwind direction
• 12 composite soil samples in the downwind direction
Sample locations from both the upwind and downwind areas are listed in Table 1 included in
Attachment B.
In accordance with the QASP, a total of 24 samples were sent to the State Laboratory located in
Lansing, Michigan for analysis by United States Environmental Protection Agency (U.S. EPA)
Method 6010B for lead. Samples collected from properties upwind of the Facility did not
contain concentrations of lead above the project screening level (400 milligram per kilogram
[mg/kg]) established in the Phase I QASP. No samples collected from properties downwind of
the Facility contained concentrations of lead above the project screening level (400 mg/kg). A
summary of the Phase I sample results is included in the table below.
Phase I Summary of Results
Location Number of Samples
Number equal or greater than 400
mg/kg
Range of Values (mg/kg)
Upwind 12 0 26-230
Downwind 12 0 56-390
TOTAL 24 0 26-390
4.2 ATMOSPHERIC CONDITIONS
During Phase I soil sampling activities, upwind and downwind parcels were chosen based on the
mean wind direction from 1984 to 1991 for the Detroit Metropolitan area. A copy of the wind
rose plot is provided in Attachment C. The wind rose plot showed a prominent northeast wind

Weston Solutions, Inc. MDEQ - Phase I Summary Report Industrial Smelting – 19430 Mt. Elliott
4-2 03/05/04
direction in the city of Detroit Metropolitan area. If smelting operations occurred, lead in soil
resulting from aerial deposition would be detected downwind in the northeast direction from the
Facility. Parcels ranging from 1125 ft. to 2475 ft. were chosen southwest in the upwind direction
of the Facility. Parcels ranging from 975 ft. to 1800 ft. were chosen northeast, as close to the
mean downwind direction of the Facility due to the presence of residential properties. Low level
lead concentrations were detected in both the downwind and upwind direction from the Facility.
A detailed analysis of upwind and downwind concentrations is contained in Section 4.4 Spatial
Analysis.
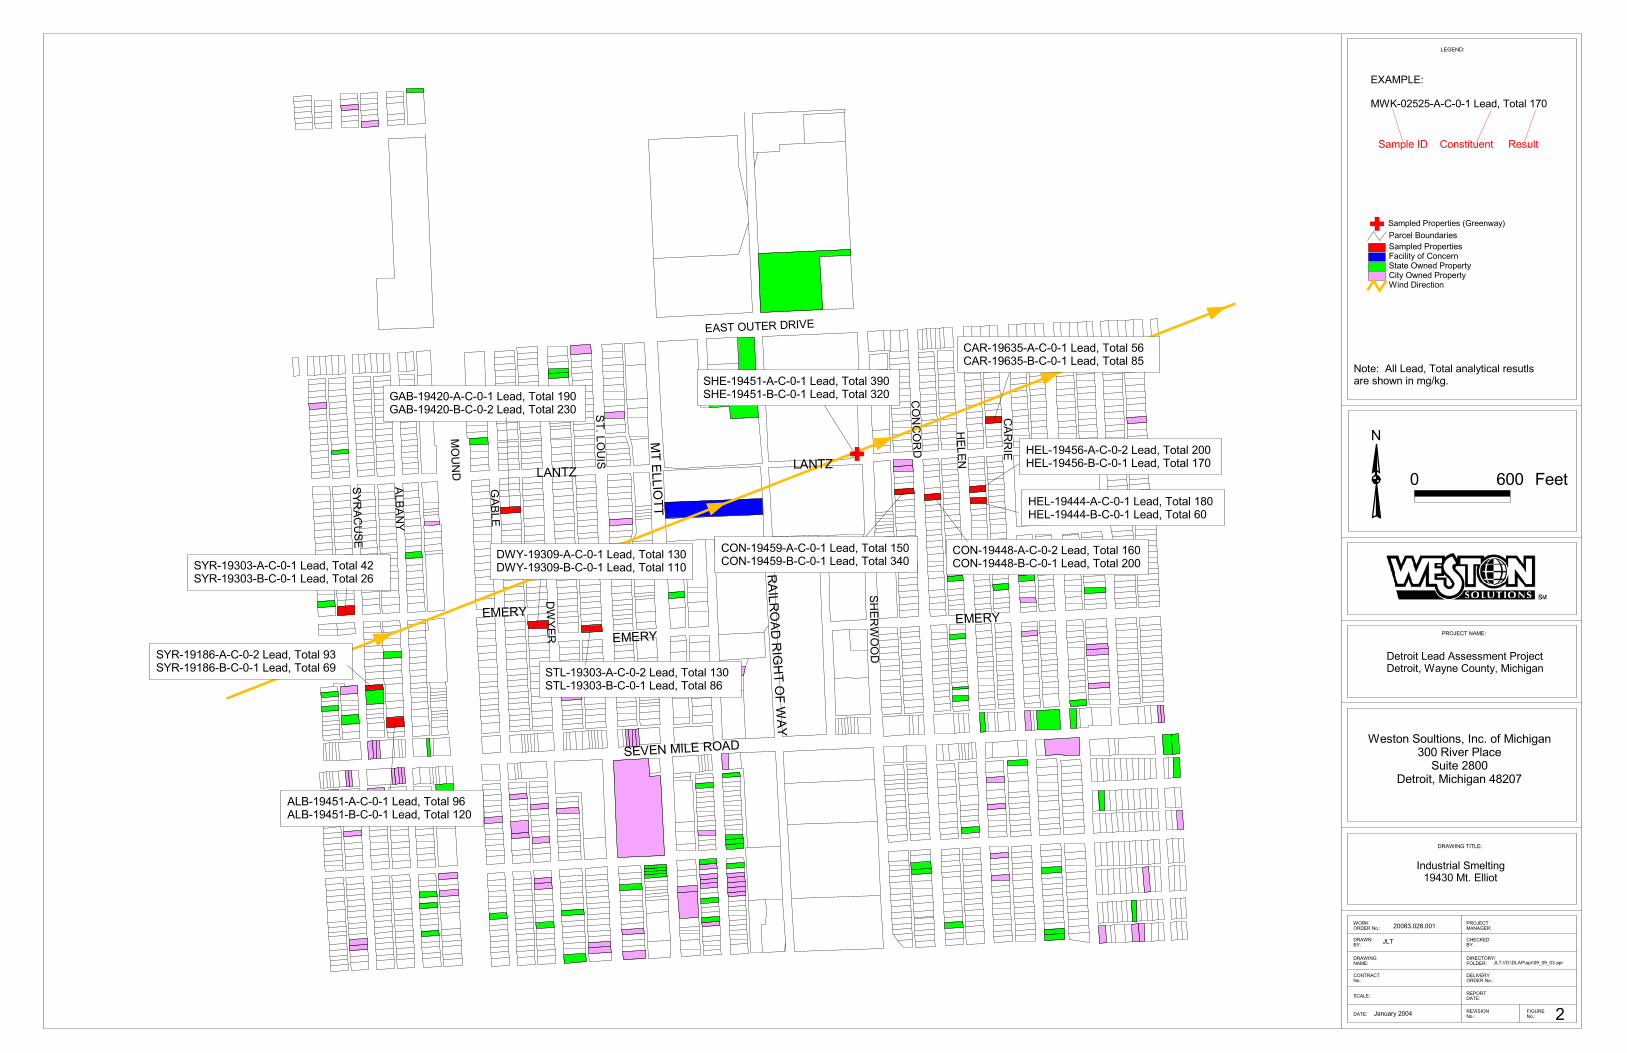
4.3 SPATIAL ANALYSIS
Where air-transport of materials occurs, it is expected that the largest impacts on the soil will
occur closest to the source, and the magnitude of the impact will tend to decrease as a function of
distance from the source. In addition, it is expected that the spatial pattern of soil impacts will
tend to be elongated in the predominant downwind direction. Thus the Phase I investigation was
designed to determine if an off-site airborne release had occurred by examining the spatial
pattern of soil contaminant concentrations as a function of distance from the Facility in a
downwind direction. As seen in Figure 2 (Attachment A), concentrations of lead, below the
screening level, occurs within the primary downwind envelope.
To determine the distribution of the lead concentrations in soils as the distance from the Facility
increases, WESTON evaluated the lead concentration of samples versus the distance from the
Facility by graphing the data in relation to each other. Evaluation of this graph (Attachment E)
indicated low levels of lead were present in the upwind direction from the Facility. The
downwind direction also showed low concentrations (all less than the screening level) of lead in
the downwind direction but presented a decreasing concentration with increasing distance from
the Facility. These conclusions were confirmed by a linear regression of the concentrations
versus distance data (Attachment E).

Weston Solutions, Inc. MDEQ - Phase I Summary Report Industrial Smelting – 19430 Mt. Elliott
4-3 03/05/04
4.4 STATISTICAL ANALYSIS
Analytical data was entered into a spreadsheet file and differentiated as downwind and upwind
samples, then processed using the MDEQ online statistical interface for Part 201 evaluations. As
shown on the distribution analysis figures included in Attachment F the downwind mean is 192
mg/kg and the upwind mean is 110 mg/kg indicating the downwind concentrations are greater
than the upwind concentrations. In addition the relative frequency histogram (Attachment F)
for the downwind data is an uneven distribution across a wide range of concentrations while the
upwind results exhibit a more even distribution over a smaller range of concentrations.
Comparison of the upwind and downwind data sets indicates the lead concentrations are
sufficiently different from each other both in mean concentration and distribution to conclude
that the data potentially represent separate conditions.
4.5 CONCLUSIONS
The pattern of analytical results for lead in soil samples collected for the Facility suggests that
lead contamination detected in downwind locations may be attributable to historic releases from
historic smelting operations at the Facility. The analytical data was compared to a screening level
consisting of the MDEQ Residential and Commercial I Direct Contact Criteria for soils (400
mg/kg), as established under Part 201 Environmental Response of the Natural Resources and
Environmental Protection Act 1994, as amended.
None of the samples collected from upwind of the Facility contained concentrations of lead
above the 400 mg/kg screening level. The downwind samples show a clear trend of decreasing
concentration with increasing distance. The levels of lead start at 390 mg/kg (975 ft. from the
facility) and decrease with distance from the Facility. The data collected during the Phase I
sampling supports that an identifiable aerial release occurred from the Facility during historic
smelting operations. However, the levels identified during the Phase I investigation are below
the screening level.

Weston Solutions, Inc. MDEQ - Phase I Summary Report Industrial Smelting – 19430 Mt. Elliott
4-4 03/05/04
This page intentionally left blank
Weston Solutions, Inc. MDEQ - Phase I Summary Report Industrial Smelting – 19430 Mt. Elliott
5-1 03/05/04
SECTION 5
RECOMMENDATIONS
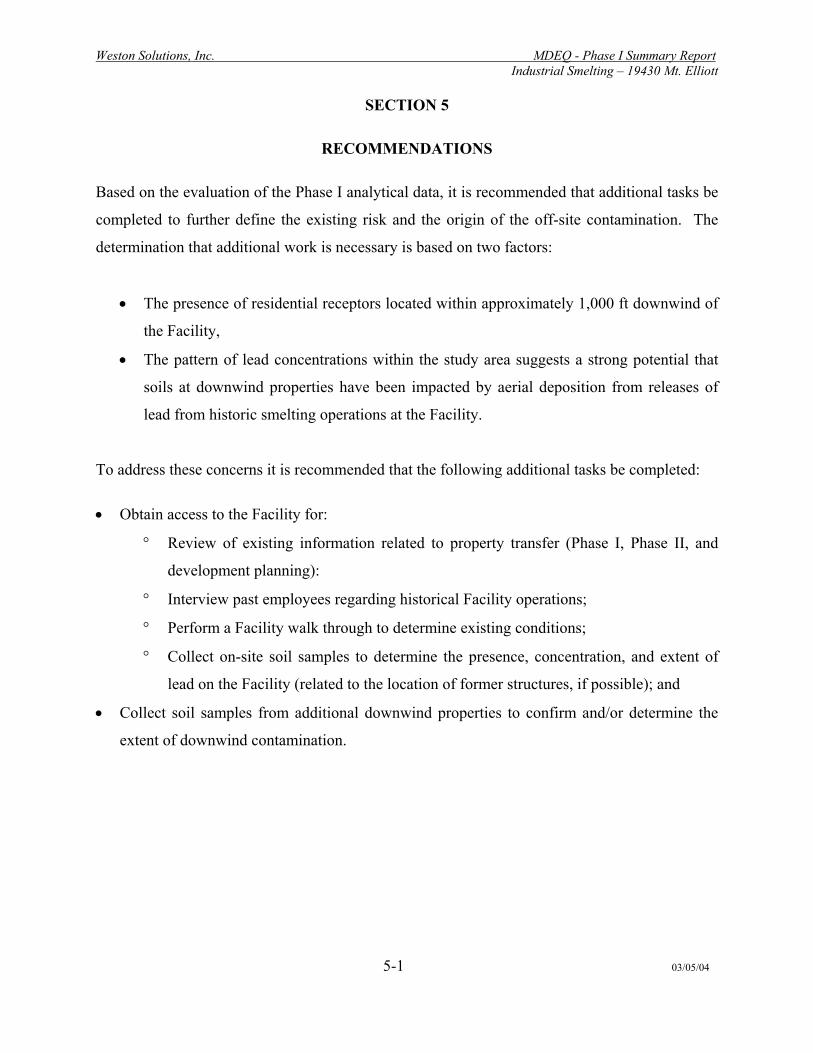
Based on the evaluation of the Phase I analytical data, it is recommended that additional tasks be
completed to further define the existing risk and the origin of the off-site contamination. The
determination that additional work is necessary is based on two factors:
• The presence of residential receptors located within approximately 1,000 ft downwind of
the Facility,
• The pattern of lead concentrations within the study area suggests a strong potential that
soils at downwind properties have been impacted by aerial deposition from releases of
lead from historic smelting operations at the Facility.
To address these concerns it is recommended that the following additional tasks be completed:
• Obtain access to the Facility for:
° Review of existing information related to property transfer (Phase I, Phase II, and
development planning):
° Interview past employees regarding historical Facility operations;
° Perform a Facility walk through to determine existing conditions;
° Collect on-site soil samples to determine the presence, concentration, and extent of
lead on the Facility (related to the location of former structures, if possible); and
• Collect soil samples from additional downwind properties to confirm and/or determine the
extent of downwind contamination.

Weston Solutions, Inc. MDEQ - Phase I Summary Report Industrial Smelting – 19430 Mt. Elliott
5-2 03/05/04
This page intentionally left blank

ATTACHMENT A
FIGURES


Page 1 of 1
FIGURE 1 Site Location Map
19430 Mt Elliot Street
WESTON SOLUTIONS, INC. OF MICHIGAN
300 River Place, Suite 2800 Detroit Lead Assessment Project Detroit, Michigan 48207 Detroit, Wayne County, Michigan
W.O. No. 20083.028.001
N
����
���
������
����
����
���
���������
������������
�������
������� ���
��������
��������
����������
��������������
�����������
���������
�
������������ ���
��� ��� ����
������������
����
���� �
��� �
����
�� ��� ��
��������
����� �
������
�����
���
� �����������
����
����
����� ! ����!�"��#$%&���'$(�� ! ����� ! �����!����#$%&���'$(�)*
������ !�����!����#$%&���'$(�� !������ !������!����#$%&���'$(���!
�����+"!����!����#$%&���'$(���!�����+"!�����!�"��#$%&���'$(�" !
�����+,�����!����#$%&���'$(��*�����+,������!����#$%&���'$(��"!
���� ! ����!����#$%&���'$(�+" ���� ! �����!����#$%&���'$(�"*
�����)*����!�"��#$%&���'$(�� �����)*�����!����#$%&���'$(�*�
����* ,����!����#$%&���'$(�,*����* ,�����!����#$%&���'$(�),
������+,*����!�"��#$%&���'$(�"!!������+,*�����!����#$%&���'$(��-!
�����+,�����!����#$%&���'$(� �! �����+,������!����#$%&���'$(� "!
������+++����!����#$%&���'$(��)!������+++�����!����#$%&���'$(�*!
������++)����!�"��#$%&���'$(��*!������++)�����!����#$%&���'$(�"!!
������+,�����!����#$%&���'$(��,!������+,������!����#$%&���'$(� +!
����
��� �
�
�#.'�/� �0('1�/.&��/2���3��12415$/ !!�16#7��($2#
01'#�")!!�#'7�1'&��12415$/�+)"!-
�����������
�������
������������
�/%0.'71$(� 8#('1/5��+ !��'���((1�'
�#'7�1'��#$%�..#..8#/'��7�9#2'�#'7�1'&��$:/#���0/':&��12415$/
! *!! �##'
"!!) �!")�!!�
"
�$72#(���0/%$71#. $8;(#%��7�;#7'1#.�$21(1':��3���/2#7/ '$'#��</#%��7�;#7':�1':��</#%��7�;#7':�1/%��17#2'1�/
�=�����
����!",",����!����#$%&���'$(��-!
��'#���((��#$%&���'$(�$/$(:'12$(�7#.0'(.�$7#�.4�</�1/�85�>5�
$8;(#���������/.'1'0#/'�����#.0('
��������?���?$;7?!�@!�@! �$;7
���
�$/0$7:�"!!+
� $8;(#%��7�;#7'1#.�A�7##/<$:B


ATTACHMENT B
TABLES

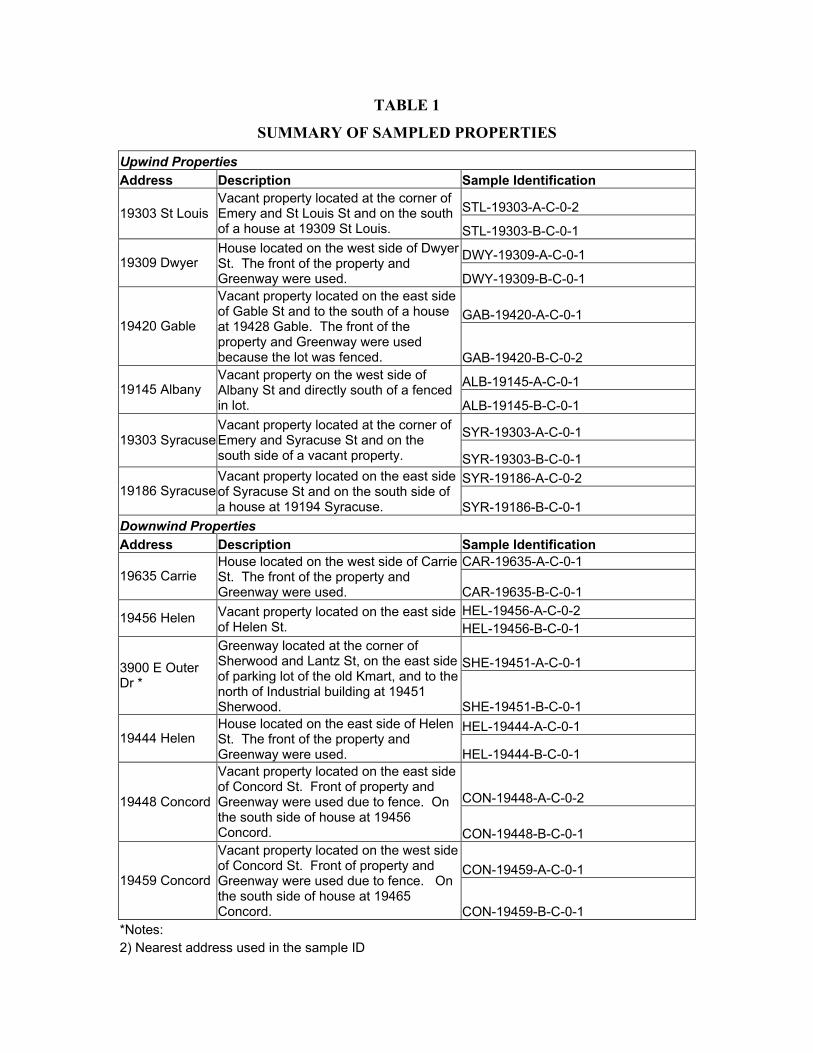
TABLE 1
SUMMARY OF SAMPLED PROPERTIES
Upwind Properties Address Description Sample Identification
STL-19303-A-C-0-2 19303 St Louis Vacant property located at the corner of Emery and St Louis St and on the south of a house at 19309 St Louis. STL-19303-B-C-0-1
DWY-19309-A-C-0-1 19309 Dwyer House located on the west side of Dwyer St. The front of the property and Greenway were used. DWY-19309-B-C-0-1
GAB-19420-A-C-0-1 19420 Gable
Vacant property located on the east side of Gable St and to the south of a house at 19428 Gable. The front of the property and Greenway were used because the lot was fenced. GAB-19420-B-C-0-2
ALB-19145-A-C-0-1 19145 Albany Vacant property on the west side of Albany St and directly south of a fenced in lot. ALB-19145-B-C-0-1
SYR-19303-A-C-0-1 19303 Syracuse Vacant property located at the corner of Emery and Syracuse St and on the south side of a vacant property. SYR-19303-B-C-0-1
SYR-19186-A-C-0-2 19186 Syracuse
Vacant property located on the east side of Syracuse St and on the south side of a house at 19194 Syracuse. SYR-19186-B-C-0-1
Downwind Properties Address Description Sample Identification
CAR-19635-A-C-0-1 19635 Carrie
House located on the west side of Carrie St. The front of the property and Greenway were used. CAR-19635-B-C-0-1
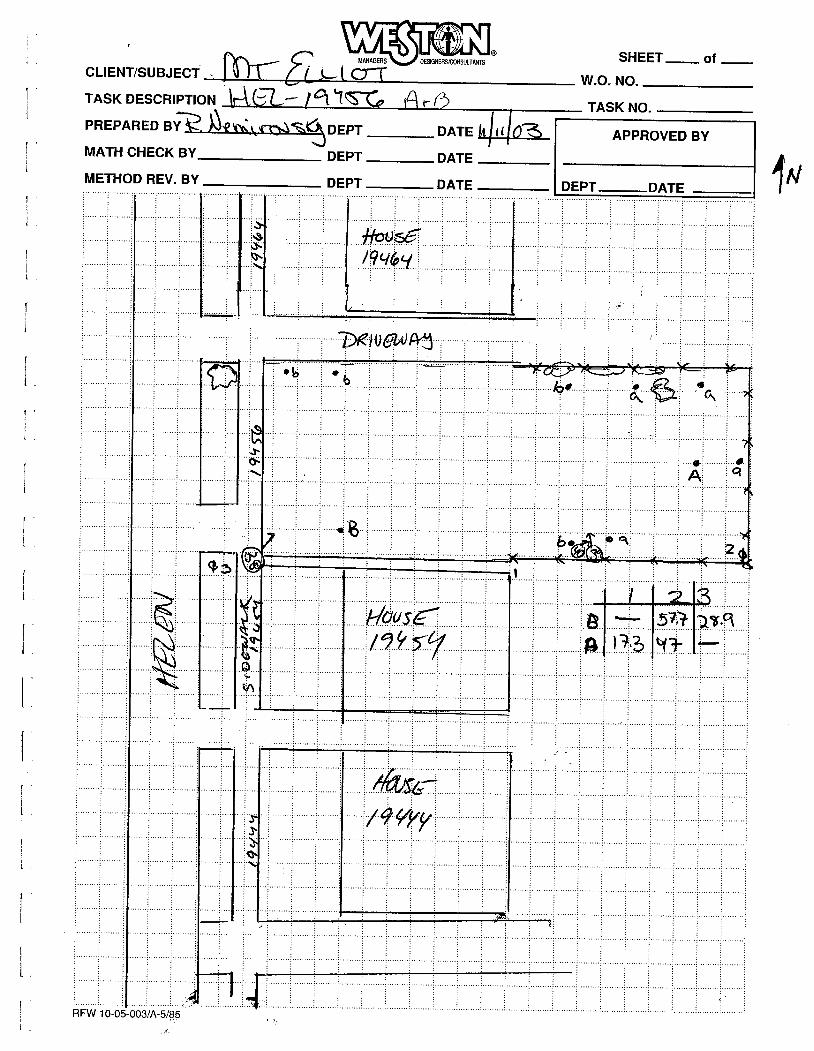
HEL-19456-A-C-0-2 19456 Helen Vacant property located on the east side of Helen St. HEL-19456-B-C-0-1
SHE-19451-A-C-0-1 3900 E Outer Dr *
Greenway located at the corner of Sherwood and Lantz St, on the east side of parking lot of the old Kmart, and to the north of Industrial building at 19451 Sherwood. SHE-19451-B-C-0-1
HEL-19444-A-C-0-1 19444 Helen
House located on the east side of Helen St. The front of the property and Greenway were used. HEL-19444-B-C-0-1
CON-19448-A-C-0-2 19448 Concord
Vacant property located on the east side of Concord St. Front of property and Greenway were used due to fence. On the south side of house at 19456 Concord. CON-19448-B-C-0-1
CON-19459-A-C-0-1 19459 Concord
Vacant property located on the west side of Concord St. Front of property and Greenway were used due to fence. On the south side of house at 19465 Concord. CON-19459-B-C-0-1
*Notes: 2) Nearest address used in the sample ID
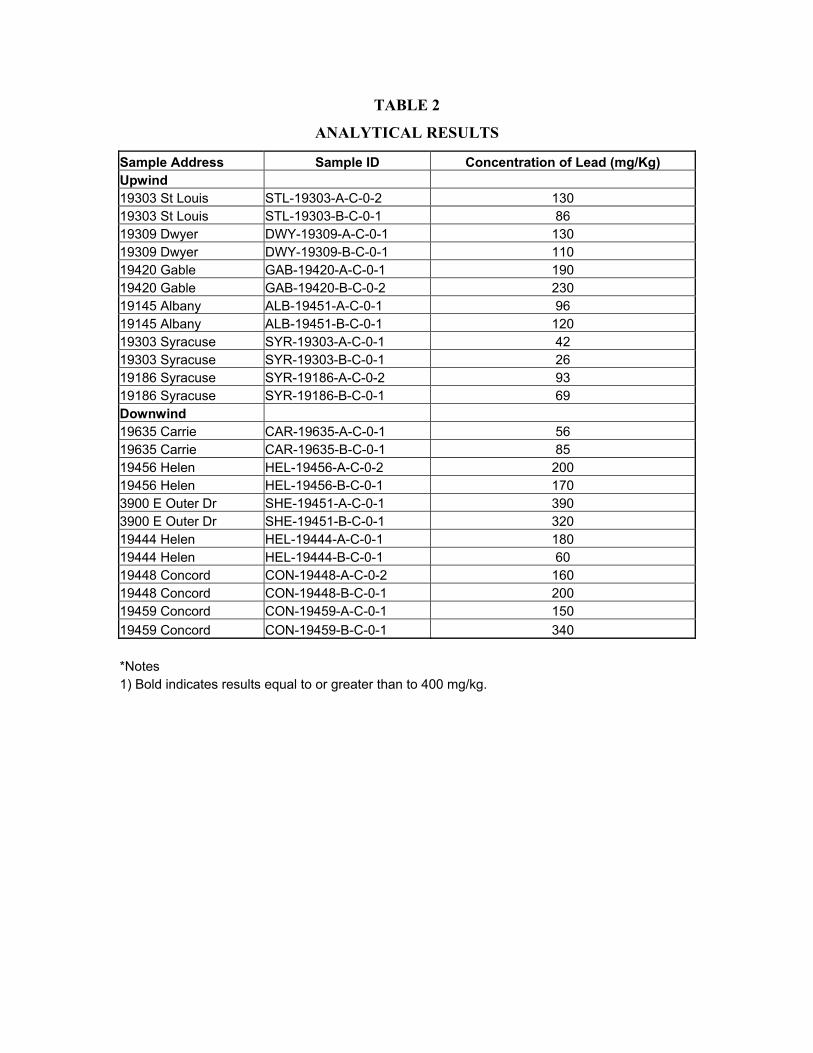
TABLE 2
ANALYTICAL RESULTS
Sample Address Sample ID Concentration of Lead (mg/Kg) Upwind 19303 St Louis STL-19303-A-C-0-2 130 19303 St Louis STL-19303-B-C-0-1 86 19309 Dwyer DWY-19309-A-C-0-1 130 19309 Dwyer DWY-19309-B-C-0-1 110 19420 Gable GAB-19420-A-C-0-1 190 19420 Gable GAB-19420-B-C-0-2 230 19145 Albany ALB-19451-A-C-0-1 96 19145 Albany ALB-19451-B-C-0-1 120 19303 Syracuse SYR-19303-A-C-0-1 42 19303 Syracuse SYR-19303-B-C-0-1 26 19186 Syracuse SYR-19186-A-C-0-2 93 19186 Syracuse SYR-19186-B-C-0-1 69 Downwind 19635 Carrie CAR-19635-A-C-0-1 56 19635 Carrie CAR-19635-B-C-0-1 85 19456 Helen HEL-19456-A-C-0-2 200 19456 Helen HEL-19456-B-C-0-1 170 3900 E Outer Dr SHE-19451-A-C-0-1 390 3900 E Outer Dr SHE-19451-B-C-0-1 320 19444 Helen HEL-19444-A-C-0-1 180 19444 Helen HEL-19444-B-C-0-1 60 19448 Concord CON-19448-A-C-0-2 160 19448 Concord CON-19448-B-C-0-1 200 19459 Concord CON-19459-A-C-0-1 150 19459 Concord CON-19459-B-C-0-1 340 *Notes 1) Bold indicates results equal to or greater than to 400 mg/kg.

ATTACHMENT C
WIND ROSE PLOT


NORTH
SOUTH
WEST EAST
3%
6%
9%
12%
15%
Wind Speed (m/s)
> 10.8
8.8-10.8
5.7- 8.8
3.6- 5.7
2.1- 3.6
0.5- 2.1
WIND ROSE PLOT
STATION #94847 - DETROIT/METROPOLITAN ARPT, MI
Weston Solutions, Inc.
PLOT YEAR-DATE-TIME
84 85 86 87 88 89 90 91 January 1 - December 31 ATTACHMENT CMidnight - 11 PM
DATE
2/3/2003
DISPLAY
Wind SpeedUNIT
m/s
CALM WINDS
3.67%AVG. WIND SPEED
5.06 m/s
Years 1984-1991
ORIENTATION
Direction(blowing from)
WRPLOT View 2.22 by Lakes Environmental Software - www.lakes-environmental.com


ATTACHMENT D
PHOTOGRAPHS OF SAMPLING LOCATIONS

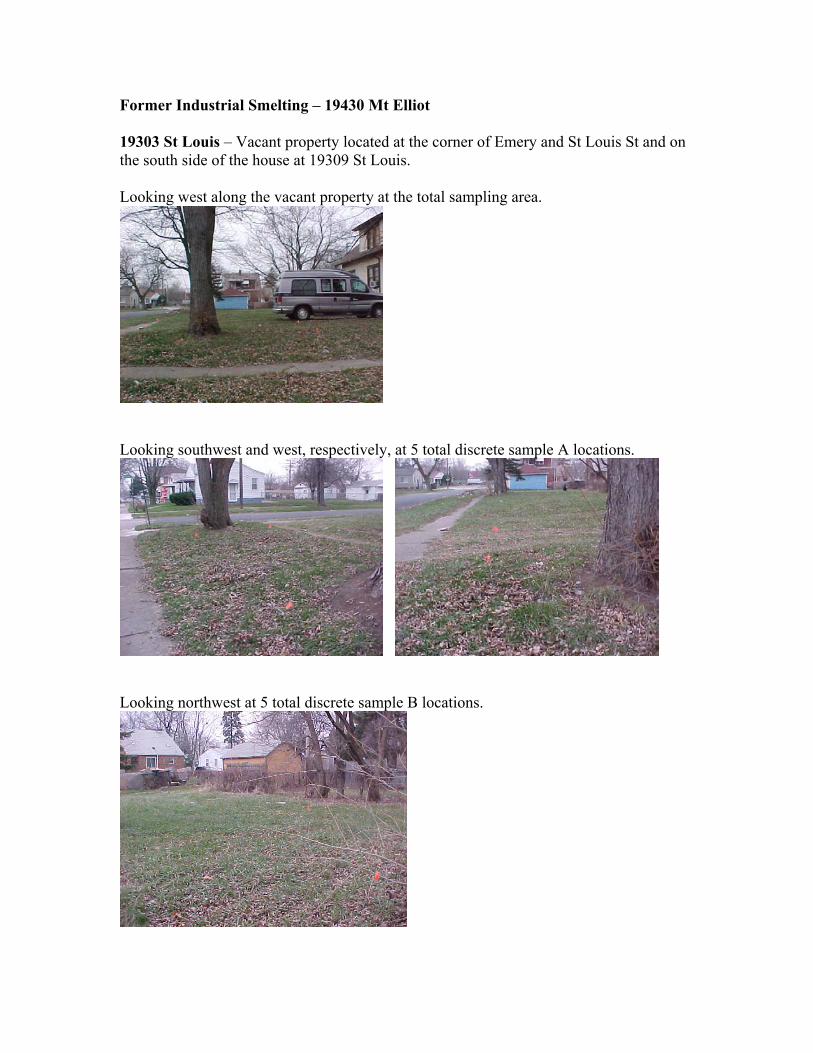
Former Industrial Smelting – 19430 Mt Elliot 19303 St Louis – Vacant property located at the corner of Emery and St Louis St and on the south side of the house at 19309 St Louis. Looking west along the vacant property at the total sampling area.
Looking southwest and west, respectively, at 5 total discrete sample A locations.
Looking northwest at 5 total discrete sample B locations.

Mt Elliot (cont’d) 19309 Dwyer – House located on the west side of Dwyer St. The front of the property and Greenway were used for sampling. Looking south along greenway at 5 discrete sample A locations.
Looking southwest along property at 5 discrete sample B locations.
Looking west along the property at the total sampling area.
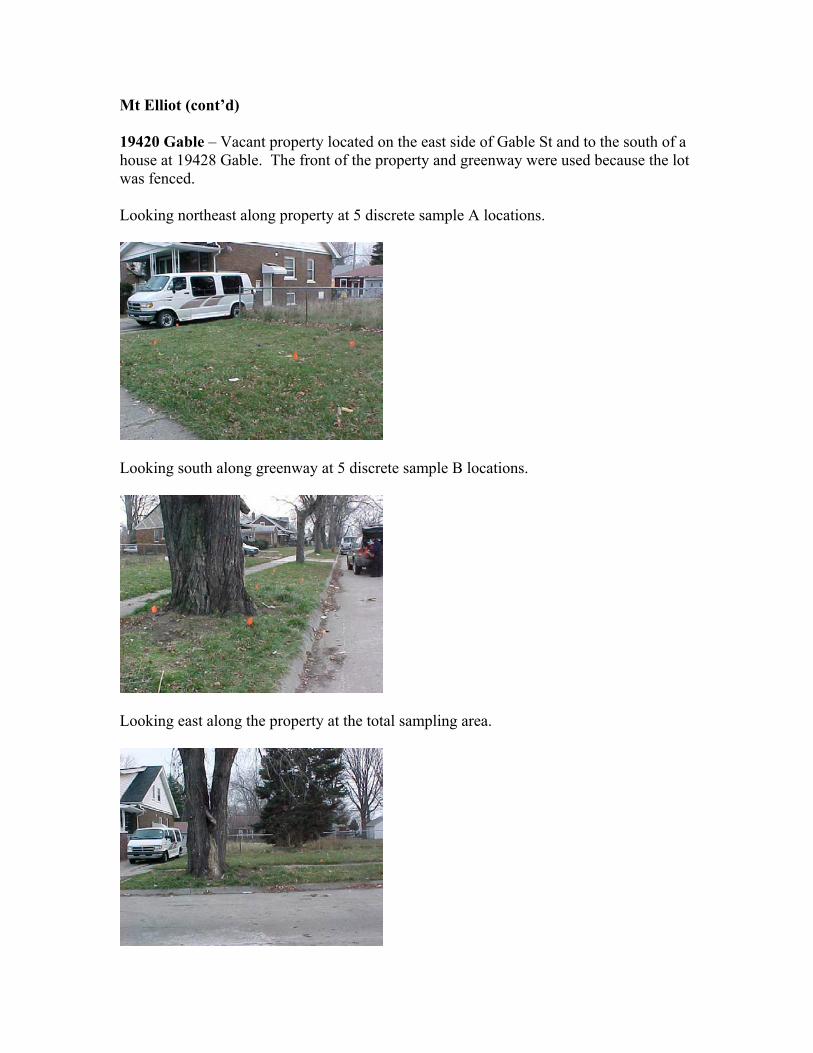
Mt Elliot (cont’d) 19420 Gable – Vacant property located on the east side of Gable St and to the south of a house at 19428 Gable. The front of the property and greenway were used because the lot was fenced. Looking northeast along property at 5 discrete sample A locations.
Looking south along greenway at 5 discrete sample B locations.
Looking east along the property at the total sampling area.

Mt Elliot (cont’d) 19145 Albany – Vacant property on the west side of Albany St and directly south of a fenced in lot. Looking north along the vacant property at 5 discrete sample A locations.
Looking northwest and north, respectively, at 5 total discrete sample B locations.
Looking west along the property at the total sampling area.
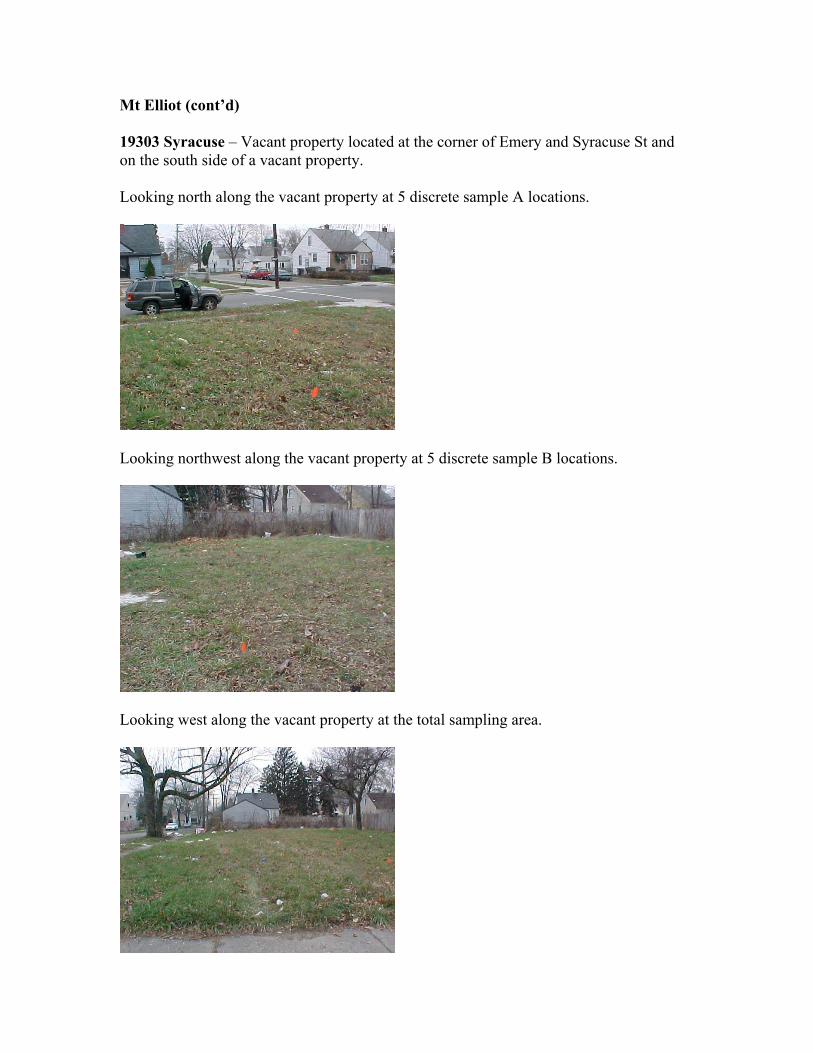
Mt Elliot (cont’d) 19303 Syracuse – Vacant property located at the corner of Emery and Syracuse St and on the south side of a vacant property. Looking north along the vacant property at 5 discrete sample A locations.
Looking northwest along the vacant property at 5 discrete sample B locations.
Looking west along the vacant property at the total sampling area.

Mt Elliot (cont’d) 19186 Syracuse – Vacant property located on the east side of Syracuse St and on the south side of a house at 19194 Syracuse. Looking west along the vacant property at 5 discrete sample A locations.
Looking north along the vacant property at 5 total sample B locations.
Looking east along the vacant property at the total sampling area.
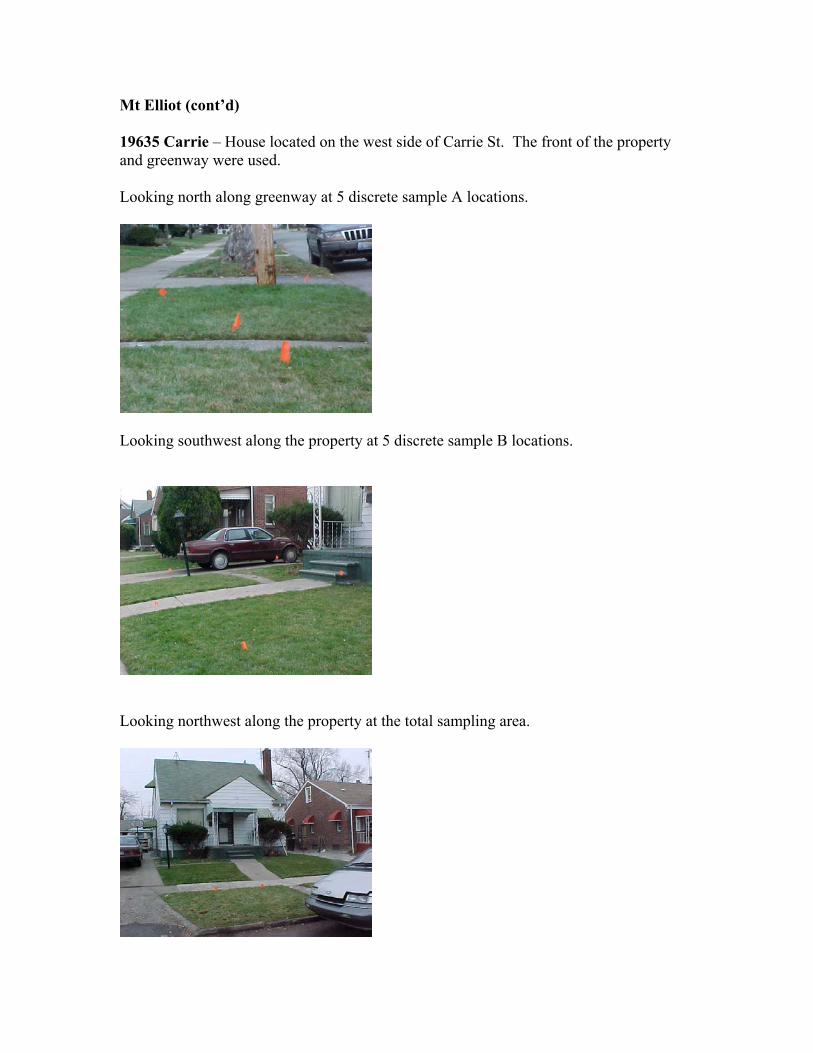
Mt Elliot (cont’d) 19635 Carrie – House located on the west side of Carrie St. The front of the property and greenway were used. Looking north along greenway at 5 discrete sample A locations.
Looking southwest along the property at 5 discrete sample B locations.
Looking northwest along the property at the total sampling area.
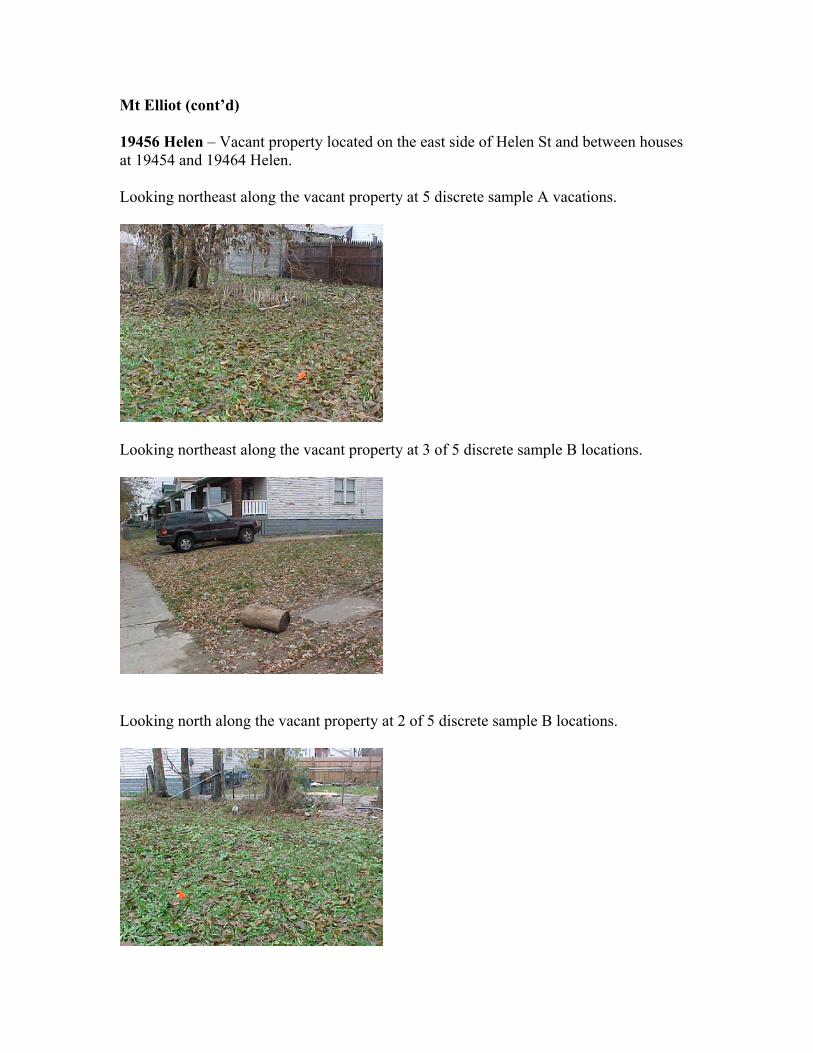
Mt Elliot (cont’d) 19456 Helen – Vacant property located on the east side of Helen St and between houses at 19454 and 19464 Helen. Looking northeast along the vacant property at 5 discrete sample A vacations.
Looking northeast along the vacant property at 3 of 5 discrete sample B locations.
Looking north along the vacant property at 2 of 5 discrete sample B locations.

Mt Elliot (cont’d) 3900 E Outer Dr – Greenway located at the corner of Sherwood and Lantz St, on the east side of the parking lot of the old Kmart, and directly north of Industrial building at 19451 Sherwood. Looking south along greenway at 5 discrete sample A locations.
Looking north along greenway at 5 discrete sample B locations.
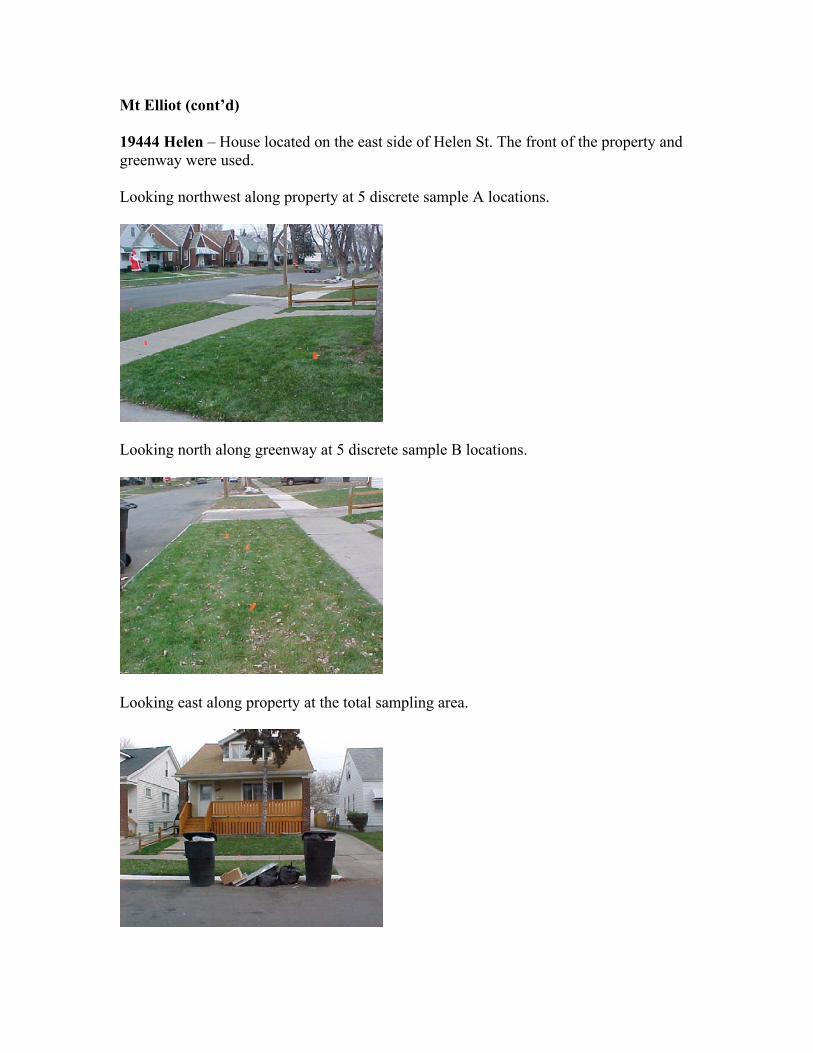
Mt Elliot (cont’d) 19444 Helen – House located on the east side of Helen St. The front of the property and greenway were used. Looking northwest along property at 5 discrete sample A locations.
Looking north along greenway at 5 discrete sample B locations.
Looking east along property at the total sampling area.

Mt Elliot (cont’d) 19448 Concord – Vacant property located on the west side of Concord St and directly south of a house at 19456 Concord. Front of property and greenway used due to fence. Looking east along property at 5 total discrete sample A locations.
Looking south along greenway at 5 discrete sample B locations.
Looking east along the property at total sampling area.
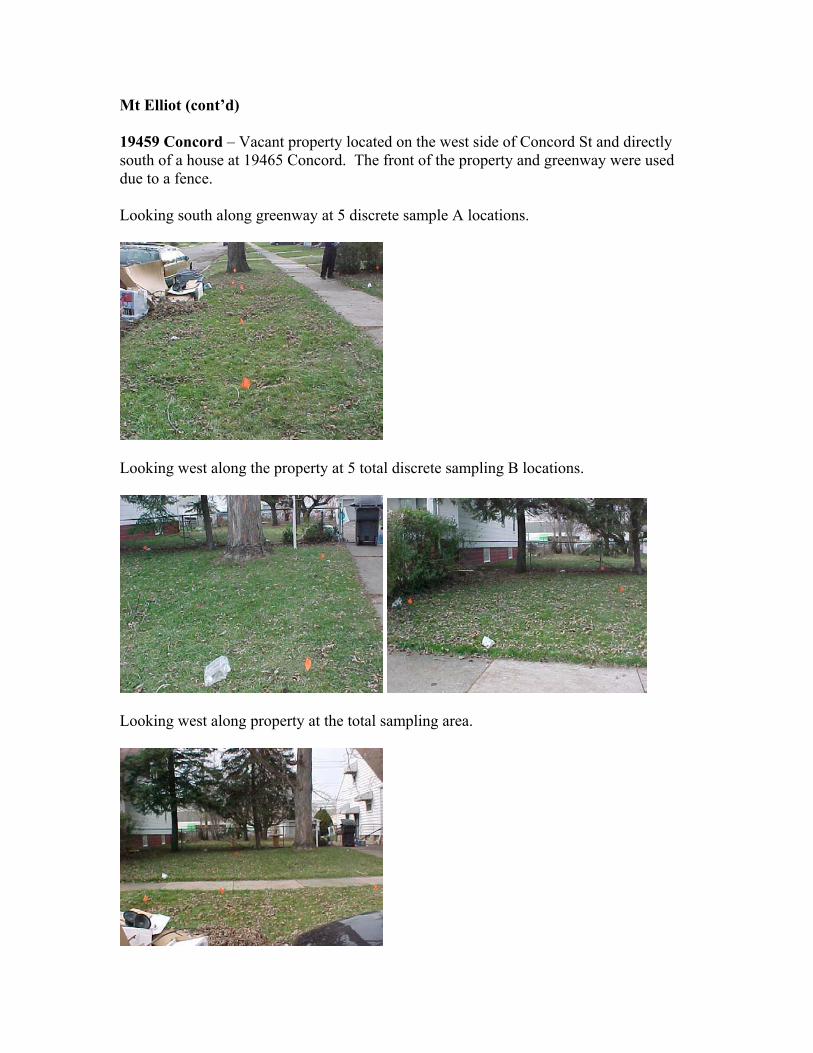
Mt Elliot (cont’d) 19459 Concord – Vacant property located on the west side of Concord St and directly south of a house at 19465 Concord. The front of the property and greenway were used due to a fence. Looking south along greenway at 5 discrete sample A locations.
Looking west along the property at 5 total discrete sampling B locations.
Looking west along property at the total sampling area.

ATTACHMENT E
CONCENTRATION GRAPH


19430 Mt Elliot
0
50
100
150
200
250
300
350
400
450
700 900 1100 1300 1500 1700 1900 2100 2300 2500 2700
Distance (ft)
Con
cent
ratio
n of
Lea
d (m
g/K
g)
UpwindDownwind

DRAFT Linear Regression Analysis DRAFT Detroit Lead Assessment Industrial *** Linear Model *** Call: lm(formula = Lead.ppm ~ Location + Distance.ft + Distance.ft:Location, data = Industrial, na.action = na.exclude) Residuals: Min 1Q Median 3Q Max -114 -35.76 -7.939 43.67 87.15 Coefficients: Value Std. Error t value Pr(>|t|) (Intercept) 216.9237 52.7731 4.1105 0.0005 Location 389.9067 95.9307 4.0645 0.0006 Distance.ft -0.0581 0.0273 -2.1253 0.0462 Distance.ft:Location -0.2276 0.0606 -3.7541 0.0012 Residual standard error: 56.04 on 20 degrees of freedom Multiple R-Squared: 0.6941 F-statistic: 15.12 on 3 and 20 degrees of freedom, the p-value is 0.00002259 Analysis of Variance Table Response: Lead.ppm Terms added sequentially (first to last) Df Sum of Sq Mean Sq F Value Pr(F) Location 1 40755.04 40755.04 12.97839 0.001777766 Distance.ft 1 57462.31 57462.31 18.29880 0.000367515 Distance.ft:Location 1 44255.82 44255.82 14.09321 0.001249388 Residuals 20 62804.45 3140.22 *** Linear Model *** Call: lm(formula = Log.Lead ~ Location + Distance.ft + Distance.ft:Location, data = Industrial, na.action = na.exclude) Residuals: Min 1Q Median 3Q Max -0.9603 -0.2549 0.02991 0.3528 0.569 Coefficients: Value Std. Error t value Pr(>|t|) (Intercept) 5.6648 0.4286 13.2163 0.0000 Location 1.7506 0.7791 2.2468 0.0361 Distance.ft -0.0006 0.0002 -2.7143 0.0134 Distance.ft:Location -0.0010 0.0005 -2.0264 0.0563 Residual standard error: 0.4551 on 20 degrees of freedom Multiple R-Squared: 0.5918 F-statistic: 9.664 on 3 and 20 degrees of freedom, the p-value is 0.0003771 Analysis of Variance Table Response: Log.Lead Terms added sequentially (first to last) Df Sum of Sq Mean Sq F Value Pr(F) Location 1 1.732174 1.732174 8.36189 0.00901969 Distance.ft 1 3.422642 3.422642 16.52244 0.00060463 Distance.ft:Location 1 0.850641 0.850641 4.10638 0.05626619 Residuals 20 4.143022 0.207151
ATTACHMENT F
STATISTICAL DISTRIBUTION

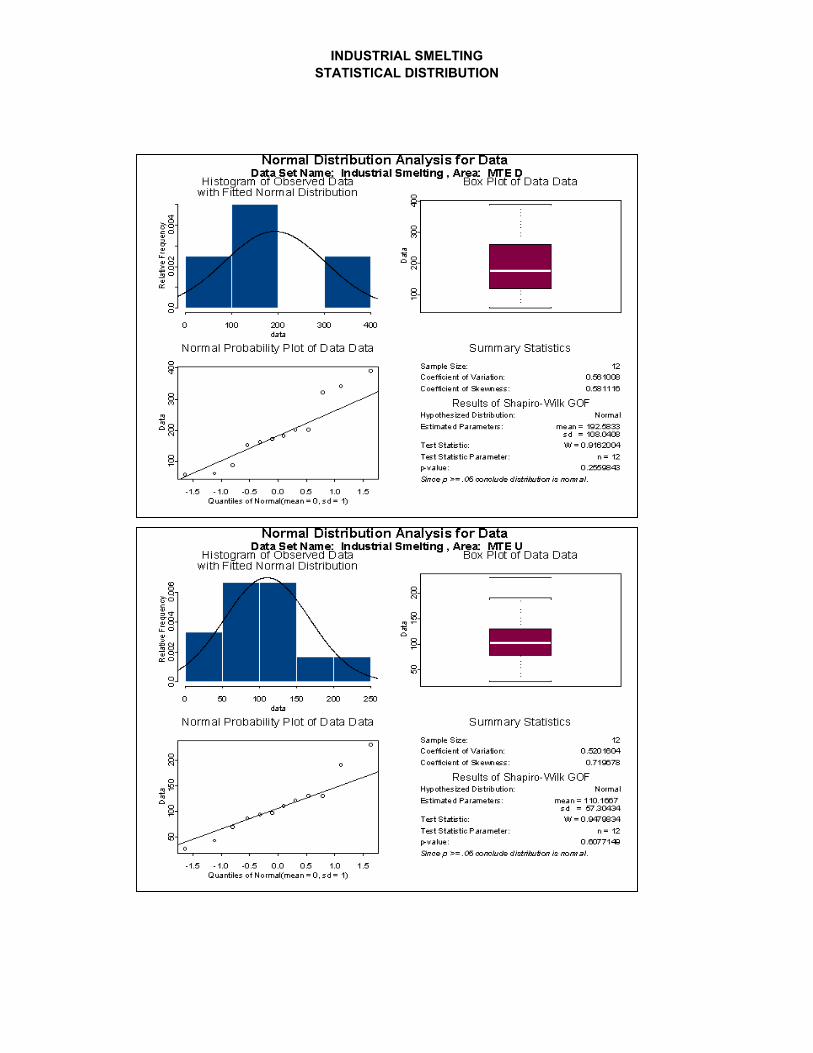
INDUSTRIAL SMELTINGSTATISTICAL DISTRIBUTION
