phase gradient microscopy in thick tissue with oblique
TRANSCRIPT

Phase gradient microscopy in thick tissue with obliqueback-illumination
Tim N Ford, Kengyeh K Chu & Jerome MertzDepartment of Biomedical Engineering
Boston UniversityBoston, MA 02215
[email protected],[email protected]
August 20, 2018
Abstract
Phase contrast techniques, such as differential interference contrast (DIC) mi-croscopy, are widely used to provide morphological images of unstained biologicalsamples. The trans-illumination geometry required for these techniques has restrictedtheir application to thin samples. We introduce oblique back-illumination microscopy(OBM), a method of collecting en face phase gradient images of thick scattering sam-ples, enabling near video-rate in vivo phase imaging with a miniaturized probe suitablefor endoscopy.
1
arX
iv:1
206.
3342
v1 [
phys
ics.
optic
s] 1
4 Ju
n 20
12

Phase contrast microscopy techniques are widely used in biological research because theycan provide high resolution images of unlabeled samples even when these are nearly trans-parent. For example, differential interference contrast (DIC), which reveals lateral phasegradients, is one of the more popular techniques because it provides apparent 3D samplerelief using a standard microscope equipped with a lamp and a camera [1]. Even simplertechniques based on oblique illumination can also be used with standard microscopes andprovide similar imaging as DIC [2–5]. However, in order to reveal lateral phase gradients,all these techniques must be operated in trans-illumination configurations, limiting their useto thin samples. Because one is often constrained to working instead with thick samples(e.g. endoscopy or in vivo applications), there is a clear need for a method that can provideDIC-like imaging in thick samples. We introduce such a method here.
Our technique is called oblique back-illumination microscopy (OBM). As its name sug-gests, this technique is based on a similar principle as oblique illumination microscopy, withthe notable difference that illumination and detection both occur from the same side of thesample (i.e. in a reflection geometry), allowing its application to samples of arbitrary thick-ness. Unlabeled samples can, of course, be imaged with microscopes based on direct lightreflection. The most successful of these for tissue imaging is optical coherence tomography(OCT), which, like OBM, can also be operated in a widefield en face configuration [6]. How-ever, microscopes based on light reflection intrinsically reveal only sample structure thatvaries rapidly in the axial direction, such as sharp interfaces or particles much smaller thanthe illumination wavelength [7]. In contrast, microscopes based on light transmission arenot subject to this constraint, and can reveal even slowly varying sample structure in thelateral direction, thus providing images of subtle sample features impossible to see in reflec-tion mode. An important characteristic of OBM is that, even though it is configured in areflection geometry, it is, in fact, a transmission microscope in disguise. In effect, OBM usesmultiple scattering in tissue to convert epi-illumination into trans-illumination. Because theillumination source is offset from the detection optical axis, the trans-illumination is oblique(Fig. 1). While illumination obliquity directly leads to phase gradient contrast, image in-tensity is also influenced by sample absorption. The use of two off-axis sources diametricallyopposed to one another permits the acquisition of two raw images with similar absorptioncontrast but with phase gradient contrast of opposing sign (Supplementary Fig. 1). Thesubtraction of these raw images enhances phase gradient contrast while canceling absorp-tion contrast; addition of the raw images has the opposite effect, revealing only absorptioncontrast while canceling phase gradient contrast. By this method, the sequential acquisitionof two raw images using alternating illumination sources decouples absorption and phasegradient contrast.
We present results obtained from a miniaturized OBM built using a flexible endomi-croscope probe comprising a distal micro-objective and an imaging fiber bundle comprising30,000 fiber cores (Online Methods). Illumination from two independently controlled lightemitting diodes (LEDs) was delivered to the sample via two optical fibers attached oppositeone another to the micro-objective housing. The endomicroscope probe was designed tooperate in contact mode, meaning that light reflected directly from the sample surface isnot collected by the micro-objective. Instead, the micro-objective only collects light thathas been multiply scattered in the sample and redirected upwards through the focal plane,located here at a depth of 60µm (the working distance of the micro-objective). Unless
2

stated otherwise, all images presented here are individual frames from movies acquired anddisplayed at a net rate of 17.5 Hz using a double-shutter camera that reads images pairwise.The exposure time per raw image was typically 1 to 5 ms.
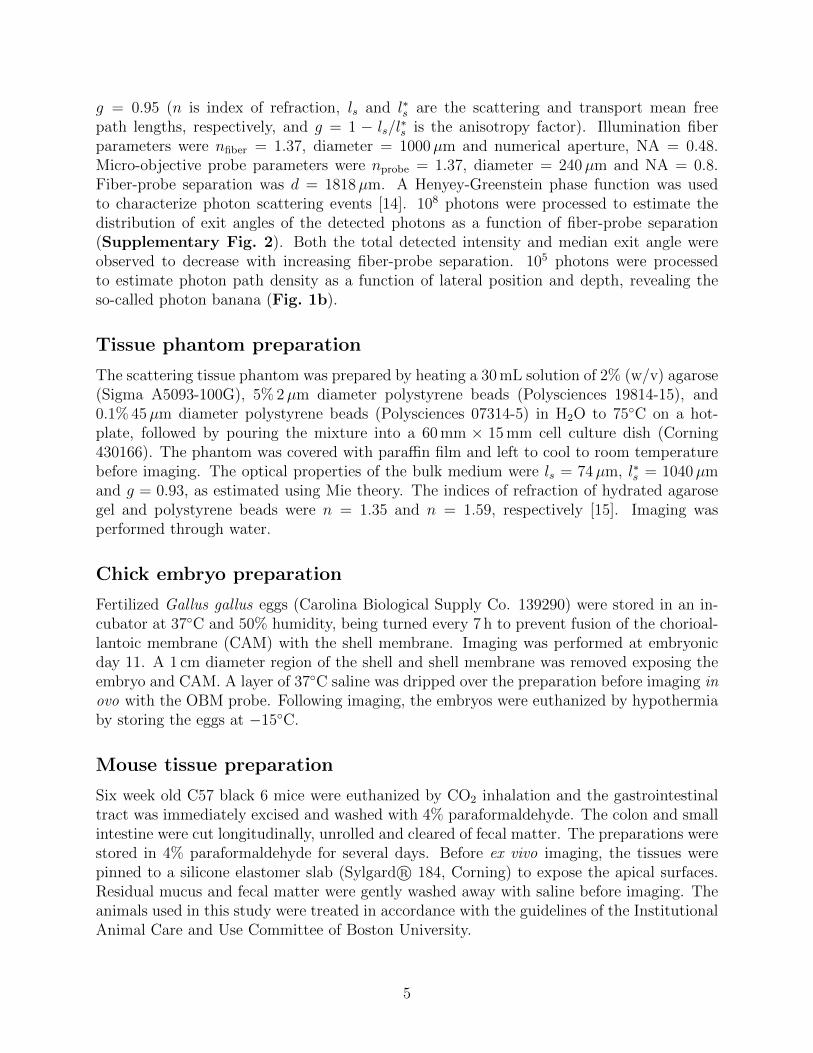
Figure 2 shows a phase gradient image of a 45µm polystyrene bead embedded in ascattering tissue phantom consisting of 2µm beads mixed in agarose. The phase gradientinduced by the bead was observed to be approximately linear. Note that since the phasegradient image is derived from a difference of raw images, it contains both positive andnegative values (zero is represented by an intermediate gray level). Because phase gradientsmust, by definition, arise from apparent sample structure, they must also arise from thevicinity of the focal plane (objects out of focus are blurred and exhibit little structure).Thus, phase gradient imaging exhibits apparent out-of-focus background rejection. This ismanifest in Supplementary Video 1, in which only the in-focus 2µm beads are visible.
Figure 2 also shows simultaneously acquired absorption and phase gradient images ofthe chorioallantoic membrane (CAM) in a day 11 chick embryo in vivo and in ovo. Notethe low contrast of the absorption images compared to the phase gradient images. Becausethe absorption images are derived from the sum of raw images, their values are positivedefinite (zero is black), and they do not exhibit out-of-focus background rejection (suchimaging is similar to orthogonal polarization spectral imaging [8]). Compared to imagesobtained from OCT, OBM images are speckle-free. Moreover, owing to the large photonfluxes involved, they are also relatively shot-noise free. Intensity noise arises, in our case,mostly from inhomogeneous image sampling due to an uneven distribution of fiber cores inthe imaging fiber bundle (Online Methods).
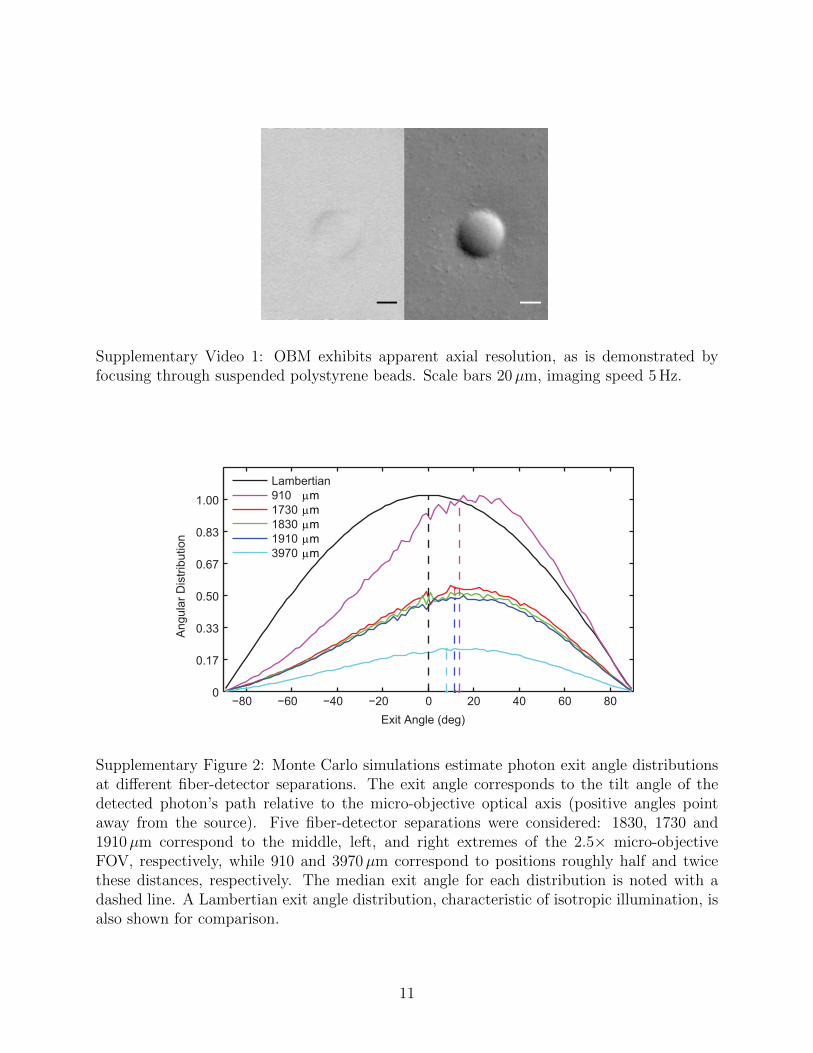
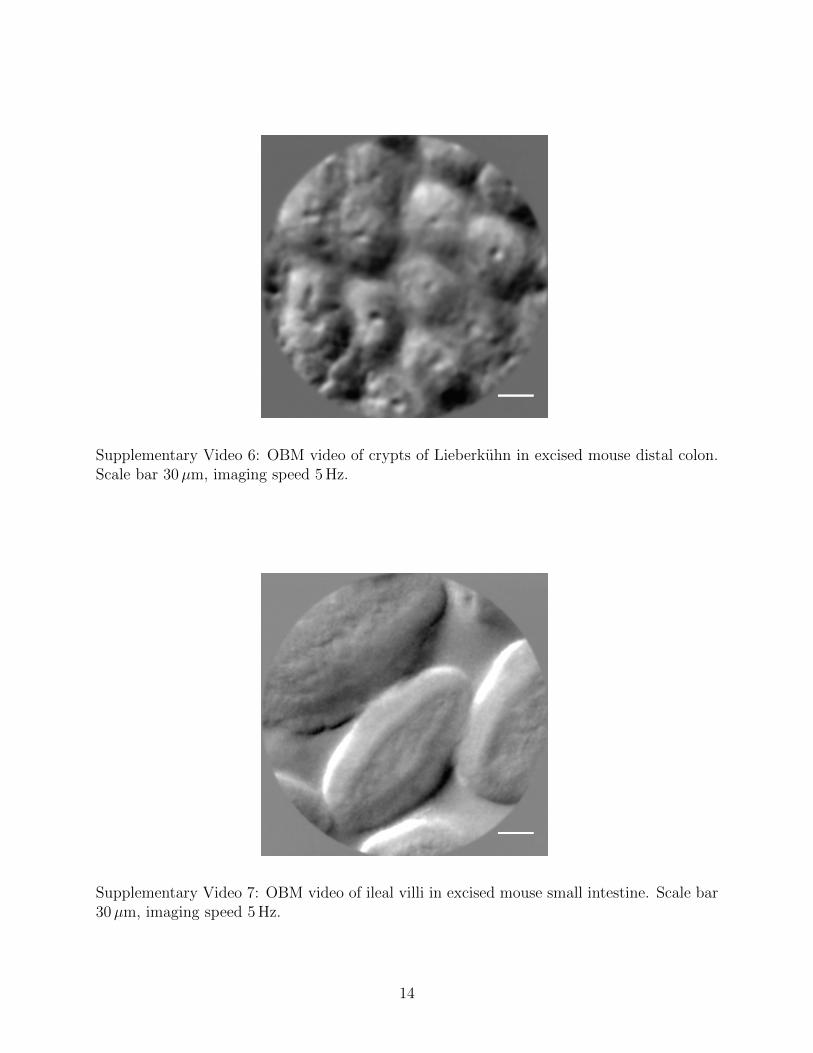
Finally, Figure 3 shows simultaneously acquired absorption and phase gradient imagesof excised, unstained mouse intestinal epithelium. The absorption images are essentiallyfeatureless in this case, whereas the phase gradient images are information rich. For example,crypts of Lieberkuhn and ileal villi are readily visible in Figures 3g (SupplementaryVideo 6) and 3h (Supplementary Video 7), respectively, illustrating the potential ofOBM for in situ histopathology and “optical biopsies”.
In summary, we have presented an apparatus that, to our knowledge, is the first to providesub-surface, DIC-like (i.e. transmission-like) phase gradient imaging from thick scatteringtissue in a reflection geometry. The apparatus is simple, fast, robust, and inexpensive,making it broadly appealing to biological and clinical researchers alike.
Acknowledgments
We thank S. Singh and J. Ritt for supplying the mouse gastrointestinal samples. We thankK. Calabro for helping develop the Monte Carlo simulation code. We thank all the mem-bers of the Biomicroscopy Lab for their helpful conversations and careful review of thismanuscript. This work was supported by an NIH grant R01-EB010059.
Author Contributions
T.N.F., K.K.C. and J.M. conceived and developed the technique. T.N.F. built the setup andacquired the data. T.N.F. and J.M. wrote the manuscript. J.M. supervised the project.
3

Competing Financial Interests
The authors declare no competing financial interests.
ONLINE METHODS
Hardware setup
White light from two LEDs (Luxeon Star MR-WC310-20s) was coupled into optical fibers(Thorlabs BFL48-1000; 0.48 NA; 1000µm core) using aspheric condenser lenses (ThorlabsACL5040-A). Illumination light was launched by the fibers into the sample (25 mW perchannel at the fiber output), where it was redirected through the focal plane by multiplescattering and collected by a micro-objective (Mauna-Kea Technologies; 2.6 mm diameter;1× or 2.5× magnification; 60µm working distance; water-immersion; 0.8 NA) coupled to acoherent imaging fiber bundle (30,000 cores; 600µm active area). The separation distancebetween the fiber and the micro-objective probe was approximately 1.8 mm. The proximalface of the fiber bundle was imaged with standard microscope optics (Olympus Plan 10×0.48 NA air objective, Linos AC f = 200 mm tube lens; 4f configuration) and recorded witha digital camera (PCO Pixelfly USB; 14-bit; 2 × 2 binning; 35 fps; 1 − 5 ms exposure timeper illumination direction). The camera was operated in double shutter mode to reduce theinter-frame delay between exposures (200µs), minimizing motion artifacts [9]. Illuminationpower delivered by the left and right optical fibers was triggered (Thorlabs LEDD1B) tooverlap with the first and second frame in the each image pair, respectively. Frame ratewas limited by the camera readout time. Image acquisition and display was performedusing custom written software (National Instruments LabVIEW 11.0). Illumination gatingand camera exposure were synchronously controlled using a data acquisition card (NationalInstruments PCI-6221).
Image processing
A preprocessing routine described previously [9] was first used to correct for the quasi-periodic sampling pattern imparted by the fiber bundle cores. Each raw image was then nor-malized by its respective low-pass filtered version (Gaussian filter kernel with σ = 80 pixels)to correct for non-uniform illumination profiles and thus “flatten” the images. The two nor-malized images were then either added or subtracted to produce absorption-only or phasegradient-only images, respectively (Supplementary Fig. 1). Image processing was per-formed with a graphics processing unit (NVIDIA GTX280) using custom-written softwarewritten in CUDA-C [10].
Monte Carlo simulations
CUDAMCML [11], a modification of MCML [12] enabling execution on graphics processingunits (GPUs), was used to perform the simulations. CUDAMCML was further modifiedto execute on a cluster of CUDA-enabled workstations [13]. A semi-infinite slab geometrywas modeled with tissue optical parameters ntissue = 1.37, ls = 150µm, l∗s = 3000µm and
4
g = 0.95 (n is index of refraction, ls and l∗s are the scattering and transport mean freepath lengths, respectively, and g = 1 − ls/l
∗s is the anisotropy factor). Illumination fiber
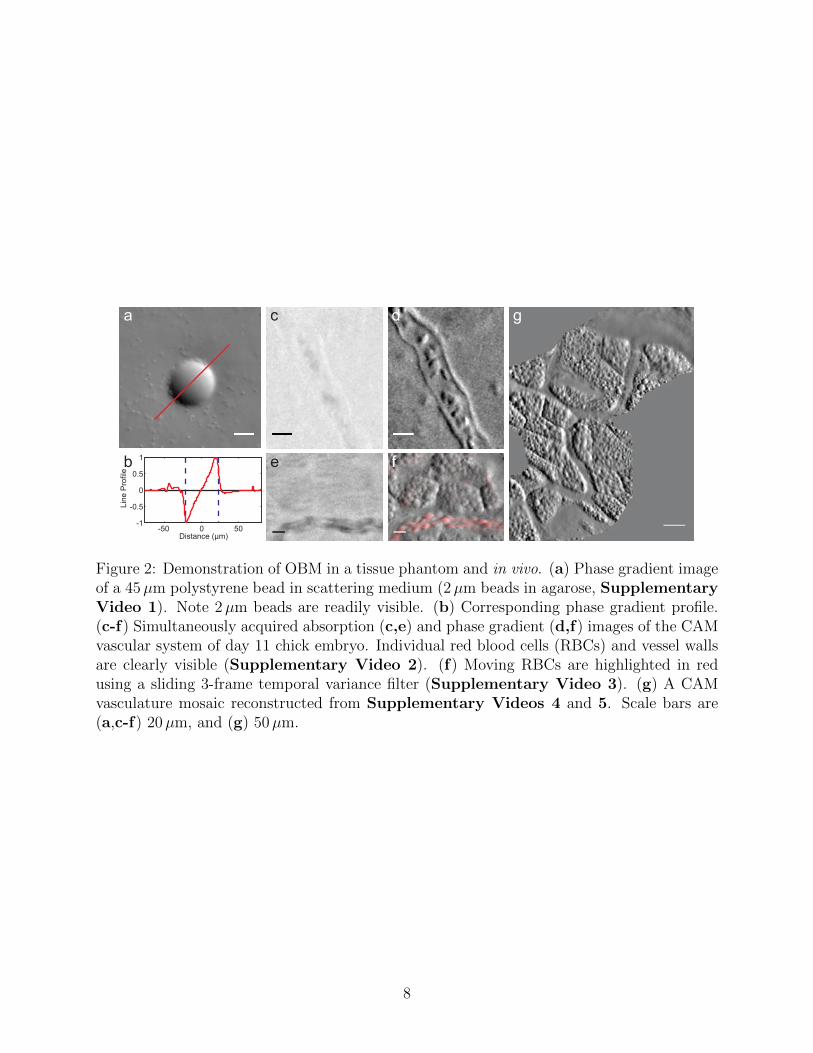
parameters were nfiber = 1.37, diameter = 1000µm and numerical aperture, NA = 0.48.Micro-objective probe parameters were nprobe = 1.37, diameter = 240µm and NA = 0.8.Fiber-probe separation was d = 1818µm. A Henyey-Greenstein phase function was usedto characterize photon scattering events [14]. 108 photons were processed to estimate thedistribution of exit angles of the detected photons as a function of fiber-probe separation(Supplementary Fig. 2). Both the total detected intensity and median exit angle wereobserved to decrease with increasing fiber-probe separation. 105 photons were processedto estimate photon path density as a function of lateral position and depth, revealing theso-called photon banana (Fig. 1b).
Tissue phantom preparation
The scattering tissue phantom was prepared by heating a 30 mL solution of 2% (w/v) agarose(Sigma A5093-100G), 5% 2µm diameter polystyrene beads (Polysciences 19814-15), and0.1% 45µm diameter polystyrene beads (Polysciences 07314-5) in H2O to 75◦C on a hot-plate, followed by pouring the mixture into a 60 mm × 15 mm cell culture dish (Corning430166). The phantom was covered with paraffin film and left to cool to room temperaturebefore imaging. The optical properties of the bulk medium were ls = 74µm, l∗s = 1040µmand g = 0.93, as estimated using Mie theory. The indices of refraction of hydrated agarosegel and polystyrene beads were n = 1.35 and n = 1.59, respectively [15]. Imaging wasperformed through water.
Chick embryo preparation
Fertilized Gallus gallus eggs (Carolina Biological Supply Co. 139290) were stored in an in-cubator at 37◦C and 50% humidity, being turned every 7 h to prevent fusion of the chorioal-lantoic membrane (CAM) with the shell membrane. Imaging was performed at embryonicday 11. A 1 cm diameter region of the shell and shell membrane was removed exposing theembryo and CAM. A layer of 37◦C saline was dripped over the preparation before imaging inovo with the OBM probe. Following imaging, the embryos were euthanized by hypothermiaby storing the eggs at −15◦C.
Mouse tissue preparation
Six week old C57 black 6 mice were euthanized by CO2 inhalation and the gastrointestinaltract was immediately excised and washed with 4% paraformaldehyde. The colon and smallintestine were cut longitudinally, unrolled and cleared of fecal matter. The preparations werestored in 4% paraformaldehyde for several days. Before ex vivo imaging, the tissues werepinned to a silicone elastomer slab (Sylgard R© 184, Corning) to expose the apical surfaces.Residual mucus and fecal matter were gently washed away with saline before imaging. Theanimals used in this study were treated in accordance with the guidelines of the InstitutionalAnimal Care and Use Committee of Boston University.
5

References
[1] Nomarski, G., J. Phys. Radium16, S9 (1955).
[2] Saylor, C.F., J. Res. US Natl. Bur. Stds. 15, 277 (1935).
[3] Axelrod, D., Cell Biophys. 3, 167173 (1981).
[4] Yi, R., Chu K.K. & Mertz J., Opt. Express 14, 5191-5200 (2006).
[5] Mehta, S.B. & Sheppard, C.J.R., Opt. Lett. 34, 1924-1926 (2009).
[6] Dubois, A. & Boccara, A.C., in Optical Coherence Tomography, Drexler, W. & Fujimoto,J. G. , Eds. (Springer, 2009), pp. 565-591.
[7] Mertz, J., Introduction to Optical Microscopy (Roberts & Co., 2009).
[8] Groner, W. et al., Nat. Med. 5, 1209-1212 (1999).
[9] Ford, T.N., Lim, D. & Mertz, J. J. Biomed. Opt. 17, 021105 (2012).
[10] NVIDIA CUDA Compute Unified Device Architecture Programming Guide, Version2.0 (2008).
[11] Alerstam, E., Svensson, T. & Andersson-Engels, S. ”CUDAMCML User manual andimplementation notes,” http://www.atomic.physics.lu.se/biophotonics/ (2009).
[12] Wang, L.H., Jacques, S.L. & Zheng, L.Q. Comput. Meth. Prog. Bio. 47, 131-146 (1995).
[13] Calabro, K.W., Aizenberg, E. & Bigio, I.J. Proc. SPIE 8230, 82300H (2012).
[14] Henyey, L.G. & Greenstein, J.L. Astrophys. J. 93, 70-83 (1941).
[15] Pogue, B.W. & Patterson, M.S. J. Biomed. Opt. 11, 041102 (2006).
6

Lateral position (µm)
Dep
th (µ
m)
0 500 1000 1500 2000 2500 3000 3500
500
1000
1500
2000 -6.5
-6
-5.5
-5
-4.5
-4
Tissue
CameraLEDLED
a
b
c
Figure 1: An OBM setup with a contact-mode endomicroscope probe. (a) Illumination fromtwo LEDs is sequentially projected into a thick sample by diametrically opposed opticalfibers attached to the probe housing. Multiple scattering in the sample redirects the light sothat it trans-illuminates the focal plane of the probe micro-objective (magenta dashed line).An image from the focal plane is then relayed by a flexible fiber bundle and projected ontoa digital camera. (b) Close-up of the probe distal end, onto which is superposed a densitymap obtained by Monte Carlo simulation of the light energy in the sample that was injectedby a single fiber (from left) and collected by the micro-objective (Online Methods). Note theobliqueness of the light distribution through the focal plane. (c) Oblique trans-illuminationis partially blocked by the micro-objective back aperture. Index of refraction variations atthe focal plane refract the light causing changes in the image intensity that are proportionalto the slope of the variations, thus leading to phase gradient contrast.
7
-50 0 50-1
-0.5
0
0.5
1
Distance (μm)
Line
Pro
file
a
b
c
e
d
f
g
Figure 2: Demonstration of OBM in a tissue phantom and in vivo. (a) Phase gradient imageof a 45µm polystyrene bead in scattering medium (2µm beads in agarose, SupplementaryVideo 1). Note 2µm beads are readily visible. (b) Corresponding phase gradient profile.(c-f) Simultaneously acquired absorption (c,e) and phase gradient (d,f) images of the CAMvascular system of day 11 chick embryo. Individual red blood cells (RBCs) and vessel wallsare clearly visible (Supplementary Video 2). (f) Moving RBCs are highlighted in redusing a sliding 3-frame temporal variance filter (Supplementary Video 3). (g) A CAMvasculature mosaic reconstructed from Supplementary Videos 4 and 5. Scale bars are(a,c-f) 20µm, and (g) 50µm.
8

cr
cllp
lpce
v
a c e
b d f
g h
Figure 3: Demonstration of OBM in excised mouse intestinal epithelium. (a-f) Simultane-ously acquired amplitude (a,c,e) and phase gradient (b,d,f) images taken with a 1× micro-objective (field of view (FOV) 600µm). (g,h) Higher magnification phase gradient imagesof the epithelium in the distal colon (g) and small intestine (h) were taken with a 2.5×micro-objective (FOV 240µm). Crypts of Lieberkuhn (cr), crypt lumens (cl) and laminapropia (lp) are indicated with arrows (g, Supplementary Video 6); ileal villi (v), colum-nar epithelium (ce) and lamina propia (lp) are indicated with arrows (h, SupplementaryVideo 7). Scale bars are (a-f) 75µm, and (g,h) 30µm.
9

Supplementary InformationPhase gradient microscopy in thick tissue withoblique back-illuminationTim N Ford, Kengyeh K Chu & Jerome Mertz
Supplementary Figure 1 Comparison of added versus subtracted raw OBM imagesSupplementary Figure 2 Photon exit angle distribution estimated with Monte Carlo simulationSupplementary Video 1 Manual focusing through scattering tissue phantomSupplementary Video 2 CAM vasculature and demonstration of axial resolutionSupplementary Video 3 CAM vasculature with moving RBCs highlighted in redSupplementary Video 4 Comparison of absorption versus phase gradient images in CAMSupplementary Video 5 Phase gradient mosaic of CAM vasculatureSupplementary Video 6 Morphological features of mouse distal colonSupplementary Video 7 Morphological features of mouse small intestine
a b
c d
Supplementary Figure 1: 45µm polystyrene bead suspended in scattering tissue phantom.(a,b) raw images under oblique back-illumination from two opposing directions. (c) Additionof (a) and (b) cancels phase gradient contrast and emphasizes absorption. (d) Subtractionof (a) and (b) cancels absorption contrast and emphasizes phase gradients. The 2µm beadsused to build the tissue phantom are readily visible only when they are in focus. Scale bars20µm.
10
Supplementary Video 1: OBM exhibits apparent axial resolution, as is demonstrated byfocusing through suspended polystyrene beads. Scale bars 20µm, imaging speed 5 Hz.
−80 −60 −40 −20 0 20 40 60 800
0.17
0.33
0.50
0.67
1.00
Exit Angle (deg)
Ang
ular
Dis
tribu
tion
0.83
Lambertian9101730183019103970
µmµmµmµmµm
Supplementary Figure 2: Monte Carlo simulations estimate photon exit angle distributionsat different fiber-detector separations. The exit angle corresponds to the tilt angle of thedetected photon’s path relative to the micro-objective optical axis (positive angles pointaway from the source). Five fiber-detector separations were considered: 1830, 1730 and1910µm correspond to the middle, left, and right extremes of the 2.5× micro-objectiveFOV, respectively, while 910 and 3970µm correspond to positions roughly half and twicethese distances, respectively. The median exit angle for each distribution is noted with adashed line. A Lambertian exit angle distribution, characteristic of isotropic illumination, isalso shown for comparison.
11

Supplementary Video 2: CAM vasculature of day 11 chick embryo visualized with OBM.Capillary vessel walls are clearly visible, as are the dynamics of individual red blood cells.Axial resolution is made apparent by manually focusing up and down between the CAMmesoderm and ectoderm. Our imaging depth is limited here by the 60µm working distanceof our micro-objective. Deeper imaging could be achieved with a longer working distance.In principle, maximum imaging depth of OBM is expected to be similar to that obtainedwith DIC, namely on the order of ls. Scale bar 20µm, imaging speed 17.5 Hz.
Supplementary Video 3: OBM video of CAM vasculature of day 11 chick embryo. MovingRBCs are highlighted in red using a sliding 3-frame temporal variance filter. Scale bar 50µm,imaging speed 17.5 Hz.
12

Supplementary Video 4: Simultaneously acquired absorption and phase gradient OBM videoof CAM vasculature of day 11 chick embryo. The probe was scanned over the sample usingmanually controlled translation stages. Scale bars 20µm, imaging speed 17.5 Hz.
Supplementary Video 5: Mosaic created from OBM video of CAM vasculature of day 11chick embryo. Scale bar 50µm, imaging speed 17.5 Hz.
13
Supplementary Video 6: OBM video of crypts of Lieberkuhn in excised mouse distal colon.Scale bar 30µm, imaging speed 5 Hz.
Supplementary Video 7: OBM video of ileal villi in excised mouse small intestine. Scale bar30µm, imaging speed 5 Hz.
14