phase diagrams - university of...
TRANSCRIPT
Phase Diagrams
❖ The internal structure of a material plays an important part on its mechanical properties.!
❖ There is a strong correlation between micro structure and mechanical properties.
Definitions
❖ Component!
❖ A component is the pure metals and or compounds of which an alloy is composed.!
❖ Brass is copper and Zinc mixed together to form an alloy
Brass
❖ Copper is the solute, it is the least common and fills in substitutional or interstitial positions.!
❖ Zinc is the solvent. The Zinc forms the major lattice points.

Solid Solution
❖ Consists of atoms of a least two different types.!
❖ Made up of Solute (atoms) and solvent (atoms).
Solubility
❖ For most systems at a specific temperature there is a maximum number of solute atoms the fit (or dissolve) in to the solvent this is the solubility.
Example of Solubility
10.3 Phases ● 283
10.2 SOLUBILITY LIMIT
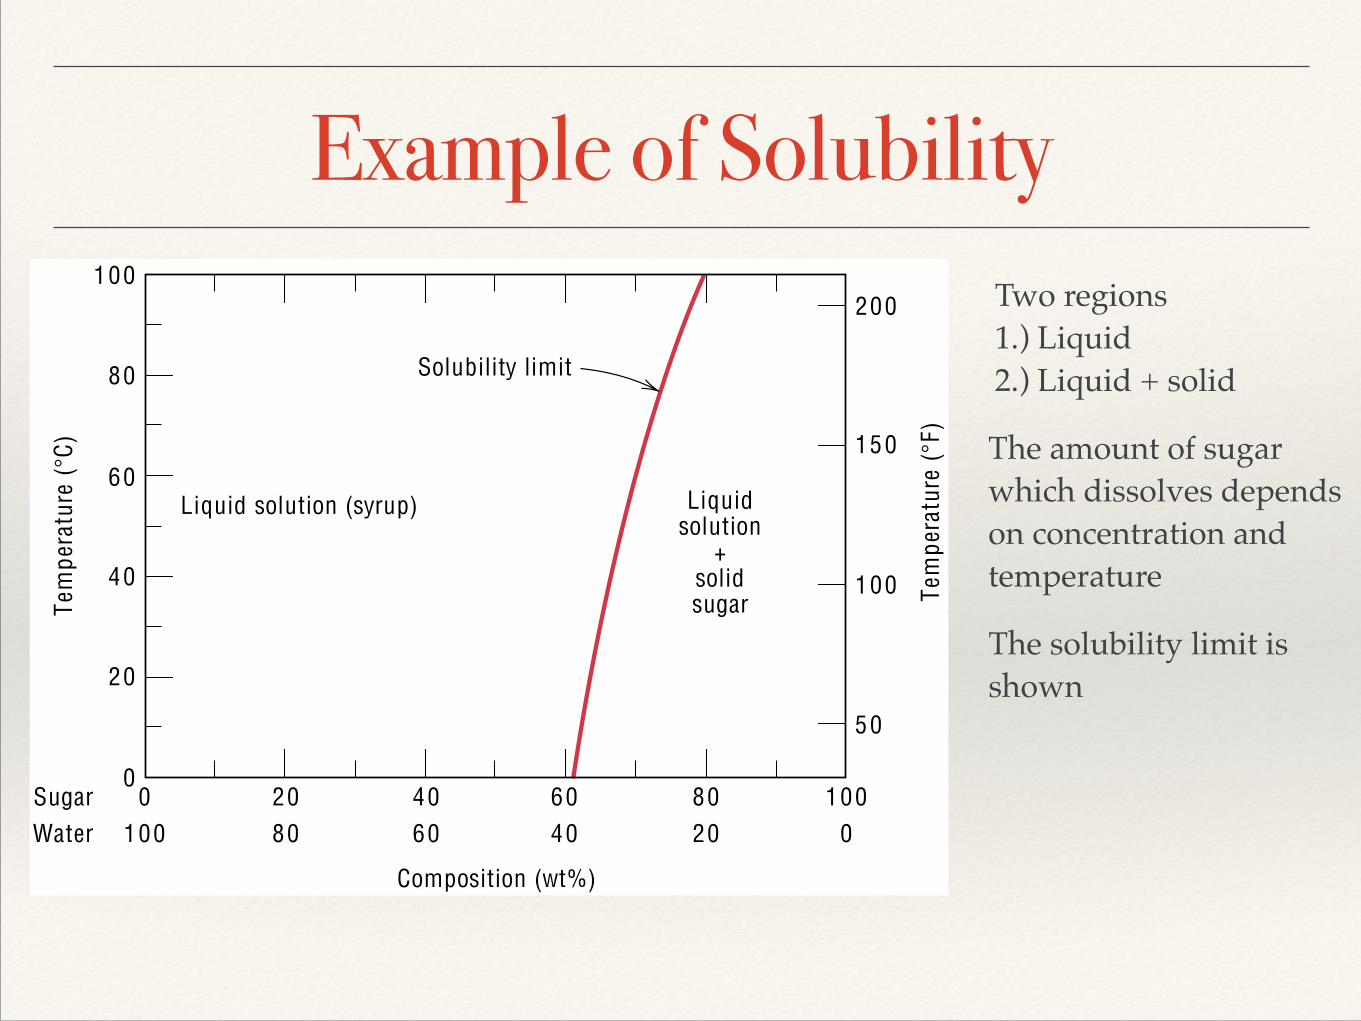
For many alloy systems and at some specific temperature, there is a maximumconcentration of solute atoms that may dissolve in the solvent to form a solidsolution; this is called a solubility limit. The addition of solute in excess of thissolubility limit results in the formation of another solid solution or compoundthat has a distinctly different composition. To illustrate this concept, consider thesugar–water (C12H22O11–H2O) system. Initially, as sugar is added towater, a sugar–water solution or syrup forms. As more sugar is introduced, the solution becomesmore concentrated, until the solubility limit is reached, or the solution becomessaturated with sugar. At this time the solution is not capable of dissolving any moresugar, and further additions simply settle to the bottom of the container. Thus, thesystem now consists of two separate substances: a sugar–water syrup liquid solutionand solid crystals of undissolved sugar.
This solubility limit of sugar in water depends on the temperature of the waterand may be represented in graphical form on a plot of temperature along theordinate and composition (in weight percent sugar) along the abscissa, as shownin Figure 10.1. Along the composition axis, increasing sugar concentration is fromleft to right, and percentage of water is read from right to left. Since only twocomponents are involved (sugar and water), the sum of the concentrations at anycomposition will equal 100 wt%. The solubility limit is represented as the nearlyvertical line in the figure. For compositions and temperatures to the left of thesolubility line, only the syrup liquid solution exists; to the right of the line, syrupand solid sugar coexist. The solubility limit at some temperature is the compositionthat corresponds to the intersection of the given temperature coordinate and thesolubility limit line. For example, at 20!C the maximum solubility of sugar in wateris 65 wt%. As Figure 10.1 indicates, the solubility limit increases slightly withrising temperature.
10.3 PHASES
Also critical to the understanding of phase diagrams is the concept of a phase. Aphase may be defined as a homogeneous portion of a system that has uniformphysical and chemical characteristics. Every pure material is considered to be a
Composition (wt%)
Tem
pera
ture
(°C)
Tem
pera
ture
(°F)
0 20 40 60 80 100100
SugarWater 80 60 40 20 0
50
100
150
Liquidsolution
+solidsugar
Liquid solution (syrup)
Solubility limit
200
0
20
40
60
80
100 FIGURE 10.1 Thesolubility of sugar(C12H22O11) in asugar–water syrup.
Two regions!1.) Liquid!2.) Liquid + solid
The amount of sugar !which dissolves depends!on concentration and!temperature
The solubility limit is!shown
10.3 Phases ● 283
10.2 SOLUBILITY LIMIT
For many alloy systems and at some specific temperature, there is a maximumconcentration of solute atoms that may dissolve in the solvent to form a solidsolution; this is called a solubility limit. The addition of solute in excess of thissolubility limit results in the formation of another solid solution or compoundthat has a distinctly different composition. To illustrate this concept, consider thesugar–water (C12H22O11–H2O) system. Initially, as sugar is added towater, a sugar–water solution or syrup forms. As more sugar is introduced, the solution becomesmore concentrated, until the solubility limit is reached, or the solution becomessaturated with sugar. At this time the solution is not capable of dissolving any moresugar, and further additions simply settle to the bottom of the container. Thus, thesystem now consists of two separate substances: a sugar–water syrup liquid solutionand solid crystals of undissolved sugar.
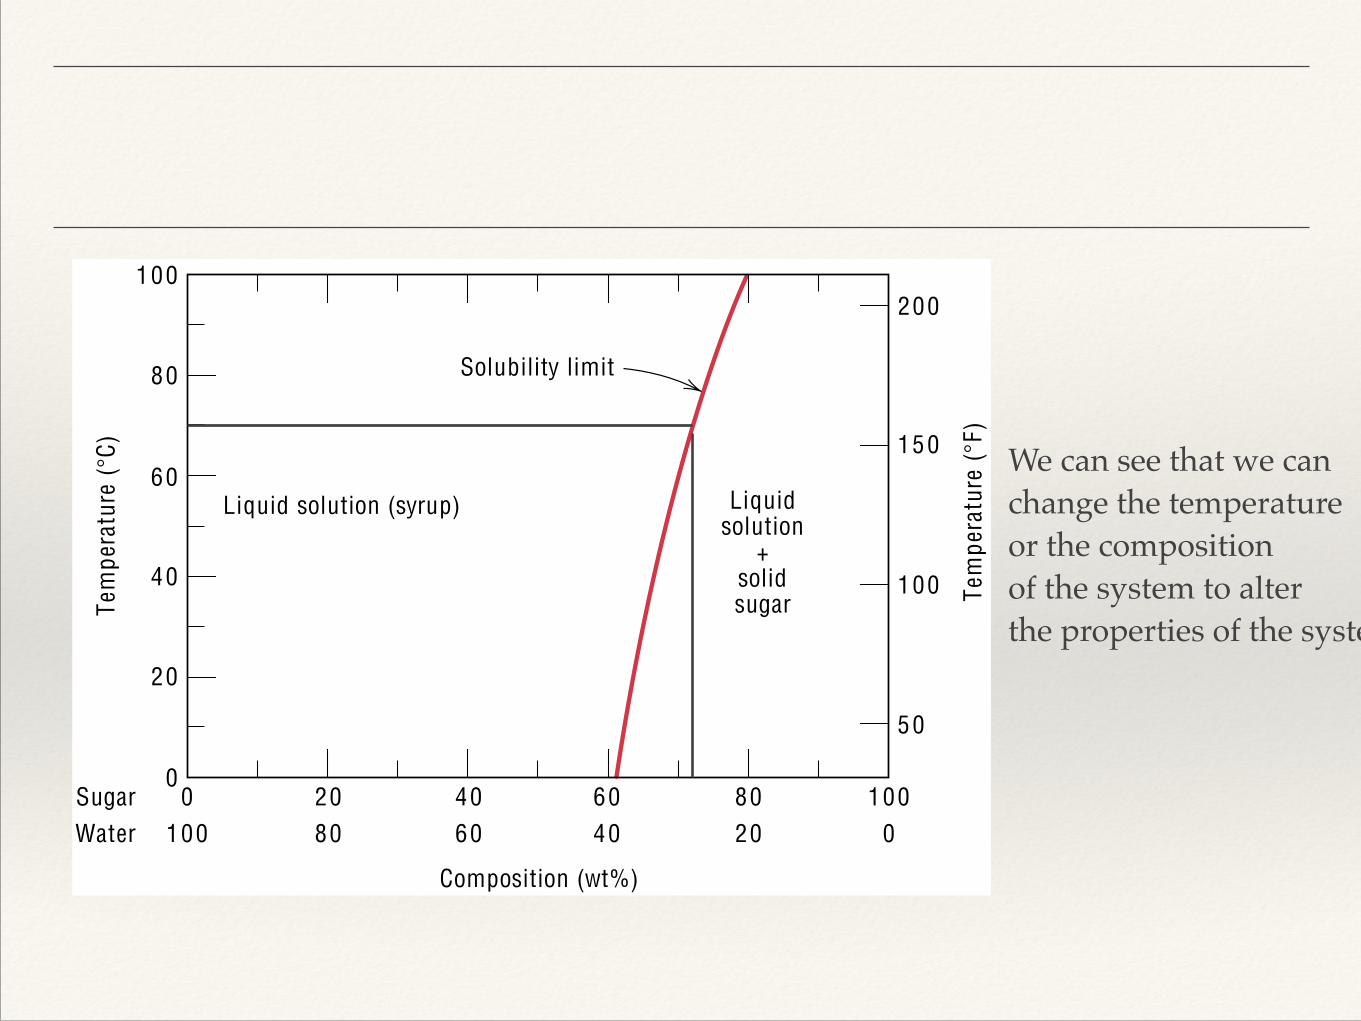
This solubility limit of sugar in water depends on the temperature of the waterand may be represented in graphical form on a plot of temperature along theordinate and composition (in weight percent sugar) along the abscissa, as shownin Figure 10.1. Along the composition axis, increasing sugar concentration is fromleft to right, and percentage of water is read from right to left. Since only twocomponents are involved (sugar and water), the sum of the concentrations at anycomposition will equal 100 wt%. The solubility limit is represented as the nearlyvertical line in the figure. For compositions and temperatures to the left of thesolubility line, only the syrup liquid solution exists; to the right of the line, syrupand solid sugar coexist. The solubility limit at some temperature is the compositionthat corresponds to the intersection of the given temperature coordinate and thesolubility limit line. For example, at 20!C the maximum solubility of sugar in wateris 65 wt%. As Figure 10.1 indicates, the solubility limit increases slightly withrising temperature.
10.3 PHASES
Also critical to the understanding of phase diagrams is the concept of a phase. Aphase may be defined as a homogeneous portion of a system that has uniformphysical and chemical characteristics. Every pure material is considered to be a
Composition (wt%)
Tem
pera
ture
(°C)
Tem
pera
ture
(°F)
0 20 40 60 80 100100
SugarWater 80 60 40 20 0
50
100
150
Liquidsolution
+solidsugar
Liquid solution (syrup)
Solubility limit
200
0
20
40
60
80
100 FIGURE 10.1 Thesolubility of sugar(C12H22O11) in asugar–water syrup.
We can see that we can!change the temperature!or the composition!of the system to alter!the properties of the system

Definitions❖ Phases!
❖ A phase is defined as a homogeneous portion of a system that has uniform physical and chemical characteristics!
❖ Every pure material is a phase, also considered phases are the solid, liquid and gasses of the material.!
❖ In our previous example, Liquid is one phase and the solid sugar another.

❖ If more than one phase is present in a given system it will have its own district properties.!
❖ Phases don’t need to have both different chemical and physical characteristics (just one)

Microstructure
❖ Simply the observed structures, studied using either optical or electron microscopy
Brass

Phase equilibrium❖ Exists in systems with more than one phase and is
characterised by time consistency between phases.!
❖ In our sugar example at 20 degrees centigrade, with 65% sugar, some will be solid, some in solution. The amount moving from one state to the other is equal to the amount moving in the opposite direction.!
❖ Upon heating however, the system will not be in equilibrium until the two directions once again are equal.
Metastable states
❖ Very slow movements from one state to the other are said to me metastable.!

Phase diagrams
❖ Much of the information about the phase structure of a system is conveniently described in whats called a phase diagram!
❖ Defined by three parameters which affect phase structure!
❖ Temperature, Pressure and composition

One component phase diagrams (Unary)
Single component!So we can change!
Temp and Pressure

Binary Isomorphous systems10.6 Binary Isomorphous Systems ● 287
both solid ! and liquid phases will be in equilibrium within this temperature range.For example, upon heating an alloy of composition 50 wt% Ni–50 wt% Cu (Figure10.2a),melting begins at approximately 1280!C (2340!F); the amount of liquid phasecontinuously increases with temperature until about 1320!C (2410!F), at which thealloy is completely liquid.
B
1453 CLiquid
Liquidus line Solidus line
A
1085 C
1600
1500
1400
1300
1200
1100
1000
0 20 40 60 80 100
Composition (at% Ni)
Tem
pera
ture
(C)
2800
2600
2400
2200
2000
Tem
pera
ture
(F)
100806040200
(Ni)(Cu)
(a )
Composition (wt% Ni)
+ L!
!
B
Tem
pera
ture
(C)
1300
1200
30
(b)
Composition (wt% Ni)CL C0 C!
+ Liquid!
+ Liquid!
!
!
Liquid
Tie line
20 40 50
R S
FIGURE 10.2 (a) Thecopper–nickel phasediagram. (Adapted
from Phase Diagramsof Binary Nickel Alloys,
P. Nash, Editor, 1991.Reprinted by
permission of ASMInternational, Materials
Park, OH.) (b) Aportion of the
copper–nickel phasediagram for which
compositions and phaseamounts are
determined at point B.
Nickel Copper alloy
In binary systems we can
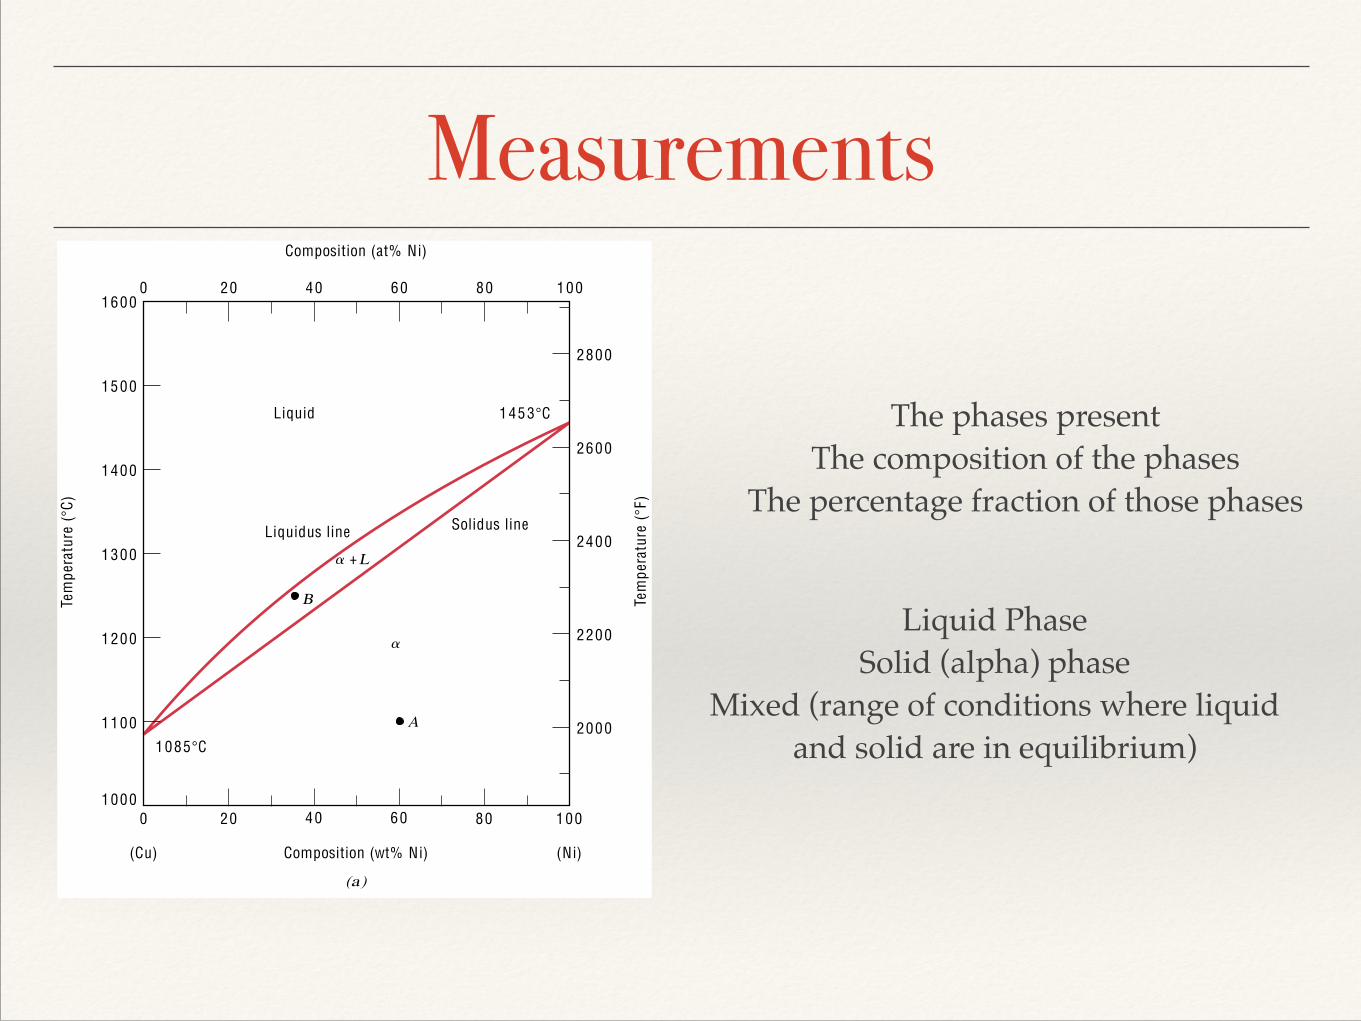
Measurements10.6 Binary Isomorphous Systems ● 287
both solid ! and liquid phases will be in equilibrium within this temperature range.For example, upon heating an alloy of composition 50 wt% Ni–50 wt% Cu (Figure10.2a),melting begins at approximately 1280!C (2340!F); the amount of liquid phasecontinuously increases with temperature until about 1320!C (2410!F), at which thealloy is completely liquid.
B
1453 CLiquid
Liquidus line Solidus line
A
1085 C
1600
1500
1400
1300
1200
1100
1000
0 20 40 60 80 100
Composition (at% Ni)
Tem
pera
ture
(C)
2800
2600
2400
2200
2000
Tem
pera
ture
(F)
100806040200
(Ni)(Cu)
(a )
Composition (wt% Ni)
+ L!
!
B
Tem
pera
ture
(C)
1300
1200
30
(b)
Composition (wt% Ni)CL C0 C!
+ Liquid!
+ Liquid!
!
!
Liquid
Tie line
20 40 50
R S
FIGURE 10.2 (a) Thecopper–nickel phasediagram. (Adapted
from Phase Diagramsof Binary Nickel Alloys,
P. Nash, Editor, 1991.Reprinted by
permission of ASMInternational, Materials
Park, OH.) (b) Aportion of the
copper–nickel phasediagram for which
compositions and phaseamounts are
determined at point B.
The phases present!The composition of the phases!
The percentage fraction of those phases
Liquid Phase!Solid (alpha) phase!
Mixed (range of conditions where liquid!and solid are in equilibrium)!
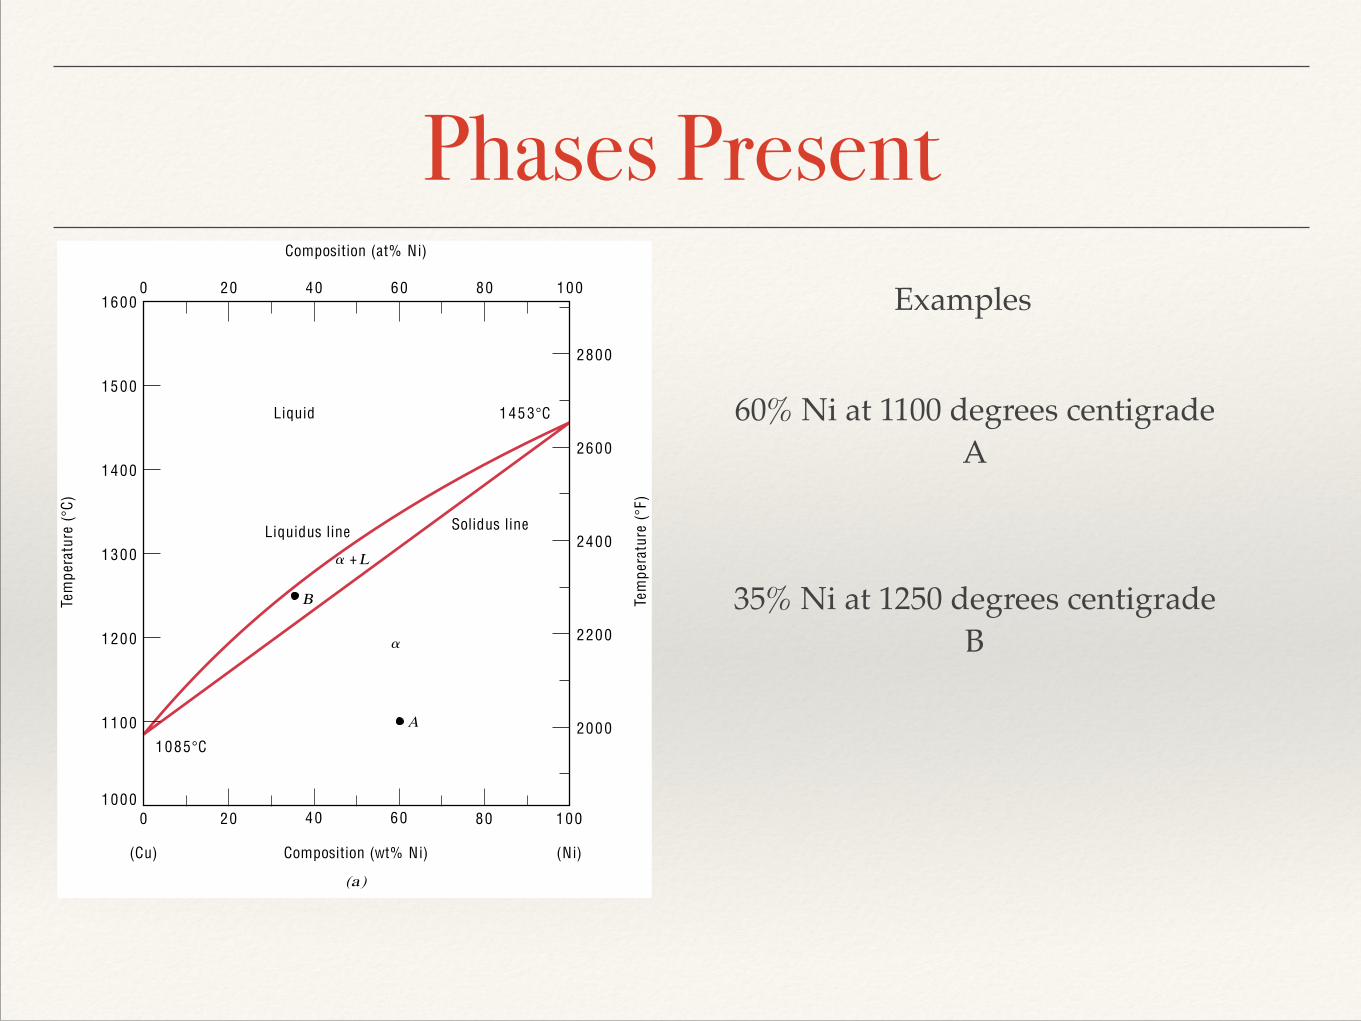
Phases Present10.6 Binary Isomorphous Systems ● 287
both solid ! and liquid phases will be in equilibrium within this temperature range.For example, upon heating an alloy of composition 50 wt% Ni–50 wt% Cu (Figure10.2a),melting begins at approximately 1280!C (2340!F); the amount of liquid phasecontinuously increases with temperature until about 1320!C (2410!F), at which thealloy is completely liquid.
B
1453 CLiquid
Liquidus line Solidus line
A
1085 C
1600
1500
1400
1300
1200
1100
1000
0 20 40 60 80 100
Composition (at% Ni)
Tem
pera
ture
(C)
2800
2600
2400
2200
2000
Tem
pera
ture
(F)
100806040200
(Ni)(Cu)
(a )
Composition (wt% Ni)
+ L!
!
B
Tem
pera
ture
(C)
1300
1200
30
(b)
Composition (wt% Ni)CL C0 C!
+ Liquid!
+ Liquid!
!
!
Liquid
Tie line
20 40 50
R S
FIGURE 10.2 (a) Thecopper–nickel phasediagram. (Adapted
from Phase Diagramsof Binary Nickel Alloys,
P. Nash, Editor, 1991.Reprinted by
permission of ASMInternational, Materials
Park, OH.) (b) Aportion of the
copper–nickel phasediagram for which
compositions and phaseamounts are
determined at point B.
Examples
60% Ni at 1100 degrees centigrade!A
35% Ni at 1250 degrees centigrade!B

Determination of the Phase compositions10.6 Binary Isomorphous Systems ● 287
both solid ! and liquid phases will be in equilibrium within this temperature range.For example, upon heating an alloy of composition 50 wt% Ni–50 wt% Cu (Figure10.2a),melting begins at approximately 1280!C (2340!F); the amount of liquid phasecontinuously increases with temperature until about 1320!C (2410!F), at which thealloy is completely liquid.
B
1453 CLiquid
Liquidus line Solidus line
A
1085 C
1600
1500
1400
1300
1200
1100
1000
0 20 40 60 80 100
Composition (at% Ni)
Tem
pera
ture
(C)
2800
2600
2400
2200
2000
Tem
pera
ture
(F)
100806040200
(Ni)(Cu)
(a )
Composition (wt% Ni)
+ L!
!
B
Tem
pera
ture
(C)
1300
1200
30
(b)
Composition (wt% Ni)CL C0 C!
+ Liquid!
+ Liquid!
!
!
Liquid
Tie line
20 40 50
R S
FIGURE 10.2 (a) Thecopper–nickel phasediagram. (Adapted
from Phase Diagramsof Binary Nickel Alloys,
P. Nash, Editor, 1991.Reprinted by
permission of ASMInternational, Materials
Park, OH.) (b) Aportion of the
copper–nickel phasediagram for which
compositions and phaseamounts are
determined at point B.
10.6 Binary Isomorphous Systems ● 287
both solid ! and liquid phases will be in equilibrium within this temperature range.For example, upon heating an alloy of composition 50 wt% Ni–50 wt% Cu (Figure10.2a),melting begins at approximately 1280!C (2340!F); the amount of liquid phasecontinuously increases with temperature until about 1320!C (2410!F), at which thealloy is completely liquid.
B
1453 CLiquid
Liquidus line Solidus line
A
1085 C
1600
1500
1400
1300
1200
1100
1000
0 20 40 60 80 100
Composition (at% Ni)
Tem
pera
ture
(C)
2800
2600
2400
2200
2000
Tem
pera
ture
(F)
100806040200
(Ni)(Cu)
(a )
Composition (wt% Ni)
+ L!
!
B
Tem
pera
ture
(C)
1300
1200
30
(b)
Composition (wt% Ni)CL C0 C!
+ Liquid!
+ Liquid!
!
!
Liquid
Tie line
20 40 50
R S
FIGURE 10.2 (a) Thecopper–nickel phasediagram. (Adapted
from Phase Diagramsof Binary Nickel Alloys,
P. Nash, Editor, 1991.Reprinted by
permission of ASMInternational, Materials
Park, OH.) (b) Aportion of the
copper–nickel phasediagram for which
compositions and phaseamounts are
determined at point B.
Examples!60% at 1100 C!
has phase (alpha)
Examples!35% at 1250 C!
has phase (alpha+Liquid)

Determination of phase amounts
10.6 Binary Isomorphous Systems ● 287
both solid ! and liquid phases will be in equilibrium within this temperature range.For example, upon heating an alloy of composition 50 wt% Ni–50 wt% Cu (Figure10.2a),melting begins at approximately 1280!C (2340!F); the amount of liquid phasecontinuously increases with temperature until about 1320!C (2410!F), at which thealloy is completely liquid.
B
1453 CLiquid
Liquidus line Solidus line
A
1085 C
1600
1500
1400
1300
1200
1100
1000
0 20 40 60 80 100
Composition (at% Ni)
Tem
pera
ture
(C)
2800
2600
2400
2200
2000
Tem
pera
ture
(F)
100806040200
(Ni)(Cu)
(a )
Composition (wt% Ni)
+ L!
!
B
Tem
pera
ture
(C)
1300
1200
30
(b)
Composition (wt% Ni)CL C0 C!
+ Liquid!
+ Liquid!
!
!
Liquid
Tie line
20 40 50
R S
FIGURE 10.2 (a) Thecopper–nickel phasediagram. (Adapted
from Phase Diagramsof Binary Nickel Alloys,
P. Nash, Editor, 1991.Reprinted by
permission of ASMInternational, Materials
Park, OH.) (b) Aportion of the
copper–nickel phasediagram for which
compositions and phaseamounts are
determined at point B.

Question: A copper-nickel alloy of composition 70 wt% Ni-30 wt% Cu is slowly
heated from a temperature of 1300C.
(a) At what temperature does the first liquid phase form?
(b) What is the composition of this liquid phase?
(c) At what temperature does complete melting of the alloy occur?
(d) What is the composition of the last solid remaining prior to complete melting?