phase behaviour analysis of the water from natural gas ... eparu c 5 17.pdf · phase behaviour...
TRANSCRIPT

http://www.revistadechimie.ro REV.CHIM.(Bucharest)♦ 68♦ No. 5 ♦ 2017970
Phase Behaviour Analysis of the Water from NaturalGas Along the Pipelines
CRISTIAN EPARU*, SORIN NEACSU, EUGEN MIHAIL IONESCU, MIHAI ALBULESCU, ALINA PRUNDURELPetroleum - Gas University of Ploiesti, 39 Bucuresti Blvd., 100520, Ploiesti, Romania
Based on the methodology for determining the liquid-vapor equilibrium conditions for wet gas, the paperpresents a model of water phase behavior for the water existing in gas transmitted through pipelines, modelbased on Simone simulator. By using this model, we tried to correlate the measured data of humidity withthe values of gas transmission parameters and with the pipeline profile.
Keywords: gas, humidity, transmission
Phase behaviour of the water from gas is influenced bygas pressure and temperature. During gas transmission,pressure and temperature variations cause the change ofwater phase behavior along the pipeline. In hydrauliccalculations of the transmission pipelines, it is usuallyconsidered that gas transmission is an isothermal process[1, 2]. This assumption simplifies calculations, as energyequation may be excluded. Considering actual conditionsoccurring during the transmission of natural gas, aspipelines follow the relief profile - often crossing themountains - this paper analyzes the equilibrium phase, incase of non-isothermal gas flow, taking into account energyequation.
In order to establish phase behavior, there werecalculated, along the analyzed pipelines, the coordinatesof water dew point, depending on gas local parameters(pressure and temperature).
The Simone simulator was used to model the flow ofgas-water mixture along the transmission pipelines.
Geometric data of the pipelines (i.e. diameters, lengths,profiles) and the values of gas parameters (i.e. pressure,flow, humidity) are real data for several gas pipelines inRomania [3]. Along a pipeline, the values of gas pressureand temperature change, fact which affects the phasebehavior of the water present in gas. Even if the value ofabsolute humidity remains constant, water state ofaggregation is influenced by gas pressure and temperature.Knowing the phase behavior of water along the pipelineallows the identification of the areas where water is invapor phase, and where it condenses, respectively [4].
The paper presents a model of phase behavior forhumidity in pipelines based on Simone simulator. Sincephase behavior changes according to the local values ofthe pressure and temperature, the simulator must takeinto account the pressure variation of the gas in relation tothe profile of the pipeline.
For this simulation, there was used a non-isothermalflow model, in which soil temperature is constant, and thetemperature of the gas varies depending on local energychanges.
Water that gives the humidity of the gas can be found invapor or liquid state [5, 6]. As Asante [7] demonstrated,the presence of liquid water, resulting from vapor phasecondensation, determines in gas transmission pipelinesthe decoupling of the two phases velocities. The gaseousphase moves through the pipeline faster than the liquidphase [8]. On the other hand, liquid water begins to
* email: [email protected]; Phone: 0244 573 171 / 182
accumulate, as a result of gravity, in the lower portions ofthe pipelines, thus reducing the flow area of the gas phaseand even forming water plugs, which are periodicallypushed to the downstream due to the gas pressure. In orderto have a picture of the humidity behavior along pipelines,we attempted to correlate the measured data of humiditywith the gas parameter values and with the characteristicsof gas pipelines. Figure 1 presents a schematic view of thepipelines in which the humidity measurements werecarried out. As can be seen the entering point is town Cand the delivery points are the 2 town called St and O.Figure 2 presents a view on a 3D map of this pipelines anda 2D of the altitudes for one of them. From point C to pointST the pipelines are crossing by 2 other connection pointcalled S and P.
Fig. 1. Pipelines withmonitored humidity
Phase behaviour of water in case of isothermal flowIn a first variant of modeling, gas temperature was
considered constant over the entire length of the pipeline,and the pressure was determined by simulating the flow,still observing the parameter values (flow, pressure) at theends of the pipes. During simulations, the pipeline profile(elevation) was also taken into account. All data wereintroduced into Simone simulator, and the results are shownin figure 3, 4 and 5. From these diagrams it appears thattaking into account the altitude causes significant changesof the pressure along the pipeline, which may influencethe phase behaviour of the gas humidity as previouslydemonstrated [9].
The values of gas humidity were measured in thetechnology nodes, at the ends of the pipelines and were

REV.CHIM.(Bucharest)♦ 68♦ No. 5 ♦ 2017 http://www.revistadechimie.ro 971
considered constant along the whole pipe. By using themodel presented by Neacsu et al. [9] we intended toestablish the areas where water condenses, thus turninginto liquid state. The data listed in figure 6 [for C–O pipeline]were used for the calculations whose results are graphicallyshown in figure 7. Both gas humidity and temperature wereconsidered constant along the pipeline.
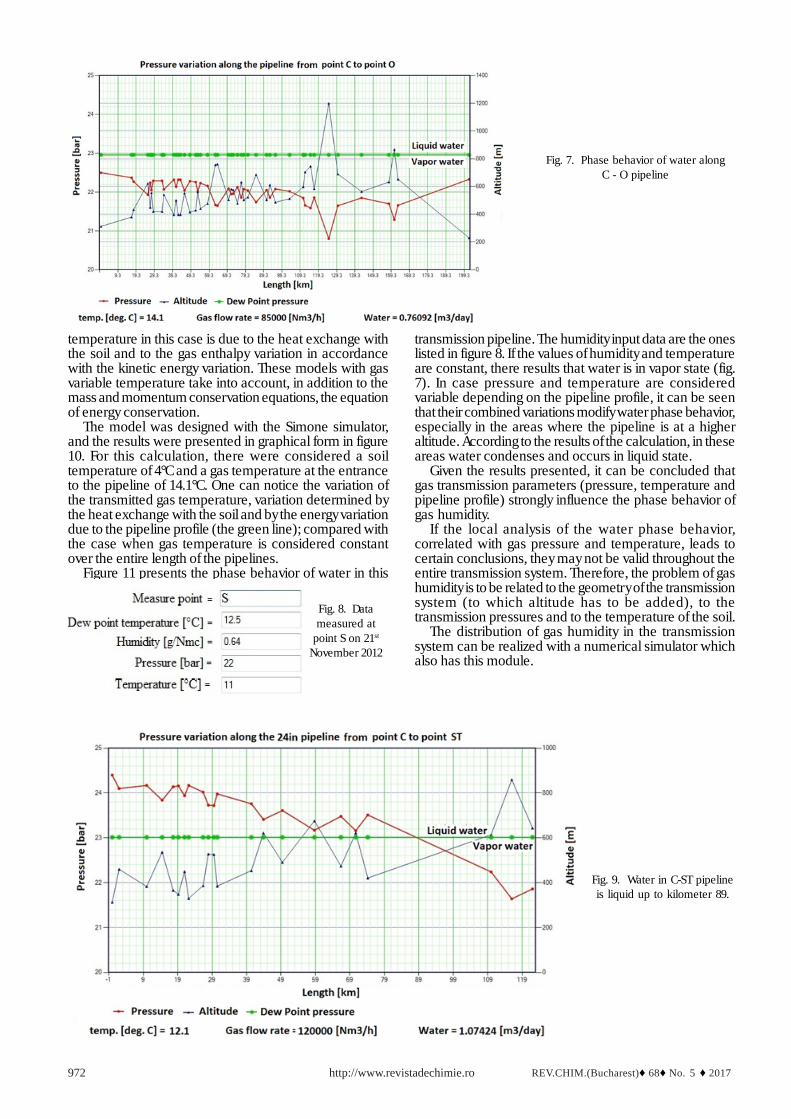
In these conditions, one can notice that the dew pointpressure is 22 985 bar, a value superior to the gas pressurealong the entire length of the pipeline, which means thatwater representing humidity of the transported gas is invapor state. By using data measured in node S (fig. 8),there were carried out calculations for C–ST pipeline andthe results were shown in figure 9. After having analyzedthe results, it appears that, starting from the entrance into
the pipeline up to kilometer 89, water from gas is in liquidphase, then gas pressure becomes lower than the pressureof the dew point, which allows water vaporization. Takinginto account the values of humidity, a water flow equal to1.074 m3/day is transported in the portion where water isliquid.
Phase behaviour of water in case of non-isothermalflow
The hypothesis of the wet gas isothermal flow isrestrictive and it does not correspond to the real situationin the transmission systems. If soil temperature isconsidered constant (or nearly constant), and gastemperature varies, determined by flow hydrodynamicconditions, and by the thermal interaction with the soil –which is a more plausible case – one can notice that thephase balance indicated by the dew point line is notconstant along the pipeline anymore, as in the case ofisothermal flow.
In order to analyze a more realistic situation, we havecreated a model in which soil temperature is constant andgas temperature is variable. The variation of gas
Fig. 2. Defining altitudes along thepipelines
Fig. 3. Pressure variation along pipeline from C to O
Fig. 4. Pressure variation along the 24in pipeline from C to ST
Fig. 5. Pressure variation along the 28in pipeline from C to ST
Fig. 6.Calculation data
http://www.revistadechimie.ro REV.CHIM.(Bucharest)♦ 68♦ No. 5 ♦ 2017972
temperature in this case is due to the heat exchange withthe soil and to the gas enthalpy variation in accordancewith the kinetic energy variation. These models with gasvariable temperature take into account, in addition to themass and momentum conservation equations, the equationof energy conservation.
The model was designed with the Simone simulator,and the results were presented in graphical form in figure10. For this calculation, there were considered a soiltemperature of 4°C and a gas temperature at the entranceto the pipeline of 14.1°C. One can notice the variation ofthe transmitted gas temperature, variation determined bythe heat exchange with the soil and by the energy variationdue to the pipeline profile (the green line); compared withthe case when gas temperature is considered constantover the entire length of the pipelines.
Figure 11 presents the phase behavior of water in this
Fig. 7. Phase behavior of water alongC - O pipeline
Fig. 8. Datameasured at
point S on 21st
November 2012
transmission pipeline. The humidity input data are the oneslisted in figure 8. If the values of humidity and temperatureare constant, there results that water is in vapor state (fig.7). In case pressure and temperature are consideredvariable depending on the pipeline profile, it can be seenthat their combined variations modify water phase behavior,especially in the areas where the pipeline is at a higheraltitude. According to the results of the calculation, in theseareas water condenses and occurs in liquid state.
Given the results presented, it can be concluded thatgas transmission parameters (pressure, temperature andpipeline profile) strongly influence the phase behavior ofgas humidity.
If the local analysis of the water phase behavior,correlated with gas pressure and temperature, leads tocertain conclusions, they may not be valid throughout theentire transmission system. Therefore, the problem of gashumidity is to be related to the geometry of the transmissionsystem (to which altitude has to be added), to thetransmission pressures and to the temperature of the soil.
The distribution of gas humidity in the transmissionsystem can be realized with a numerical simulator whichalso has this module.
Fig. 9. Water in C-ST pipelineis liquid up to kilometer 89.

REV.CHIM.(Bucharest)♦ 68♦ No. 5 ♦ 2017 http://www.revistadechimie.ro 973
ConclusionsGas humidity negatively affects the transmission
process when water vapors condense and create thedanger of accumulation in the pipelines.
From the analysis of the gas phase behaviour in certainmeasurement points, as well as of its behaviour along thepipeline, there results that the condensation of the watervapors depends on the humidity value, on pressure andtemperature. Therefore, in addition to the humidity values,the pressures and temperatures of the transmitted gasshould also be monitored. The models proposed in thispaper may be useful to determine the areas where there isthe danger of water condensation and the humidity limitvalues for which this phenomenon occurs.
The paper presents, for the first time, the phaseequilibrium dynamic of wet natural gas along thetransmission pipelines that crosses a mountain chain, usinga non-isothermal flow model. The simulations show thatwater condensation is influenced by the relief altitude. Thisresults are confirmed by the transmission network operator.
The most effective method of controlling the presenceof liquid water in the gas pipelines consists in gasdehydration in order to maintain low humidity values, sothat the water from gas remains in vapor phase.
Pressure and temperature influence the phase behaviorof water representing gas humidity. Pressure variation isdefined by the transmission process and cannot bechanged in order to change the phase behavior of water.Thus, a lower pressure reduces the risk for the water vaporsto condense, but this also decreases the capacity of thetransport system, and, as a result, it cannot be considereda viable solution.
The temperature of the transmitted gas is determinedby the atmospheric conditions that affect soil temperature.
During the summer, when soil temperatures are higher,there can be transmitted gas with higher humidity, but inwinter, when temperatures drop, gas humidity must belimited in order to prevent condensation and the occurrenceof liquid water.
References1.ALBULESCU, M., NEACSU, S., EPARU, C., BAMBO, S., SUDITU, S.,Considerations on the maximum transmission capacity of natural gaspipelines/networks, (in Romanian), Termotehnica Revue, Supplementno. 1, 20112.EPARU, C., RADULESCU, R., STOICA, D., The Dynamic Simulation ofThe Natural Gas Transportation, Ovidius University Annals ofChemistry, 2, 2013, p. 833.NEACSU, S., EPARU C., Informatics Platform for Managing the NaturalGas Transport Program, Proceedings of the 21st International BusinessInformation Management Association (IBIMA) Conference, Vienna,2013, p. 7484.ESLAMIMANESH A., MOHAMMADI A.H., RICHON, D., Thermodynamicconsistency test for experimental data of water content of methane,AIChE Journal, 57, 2011, p. 25665.BRENNEN, C.E., Fundamentals of Multi-phase Flow. CambridgeUniversity Press, Cambridge, United Kingdom, 20056.CROWE, C.T., Multi-phase Flow Handbook. CRC Press, Boca Raton,Florida, USA, 20067.ASANTE, B., Two-Phase Flow: Accounting for the Presence of Liquidsin Gas Pipeline Simulation, 34th PSIG Annual Meeting, Portland, Oregon,USA, 20028.MUCHARAM, L., ADEWUMI, M.A., WATSON, R., Study of GasCondensation in Transmission Pipelines with a Hydrodynamic Model,SPE Journal, 3, 1990, p. 2369.NEACSU, S., EPARU, C., PRUNDUREL A., Phase Behaviour of Waterfrom Natural Gas, Environmental Engineering and Management Journal,2016, in press
Manuscript received: 11.11.2016
Fig. 10. Pressure and temperaturevariation along the pipeline
Fig. 11. Phase behavior of water incase of variable gas temperature