phase 2b dose selection, leveraging comparator data ... · critical assumptions comparator analysis...
TRANSCRIPT
Phase 2b dose selection, leveraging comparator data
through multidisciplinary modeling & simulation
Thomas Kerbusch Thomas Kerbusch* (1), Russ Wada (2), Anthe Zandvliet (1), Kuenhi Tsai (6), Jing Su (6), Joanna
Zhuoying Peng (4), Yaming Hang (6), Christine Xu (3), Richard Shames (5), Ann Horowitz (3), Diane Neiman (4), Mani Lakshminarayanan (6), Usha Barai (3), Ferdous Gheyas (3), Paul Peloso (4), Devan Mehrotra (6), Nancy Zhang (2), Hanbin Li (2), Jaap Mandema (2), Gary
Herman (4), Sandy Allerheiligen (6) (1) Merck Research Laboratories, Oss, The Netherlands; (2) Quantitative Solutions, Menlo Park,
CA, USA; (3) Merck Research Laboratories, Kenilworth, NJ, USA; (4) Merck Research Laboratories, Rahway, NJ, USA; (5) Merck Research Laboratories, Palo Alto, CA, USA; 6 Merck
Research Laboratories, Upper Gwynedd, PA, USA.
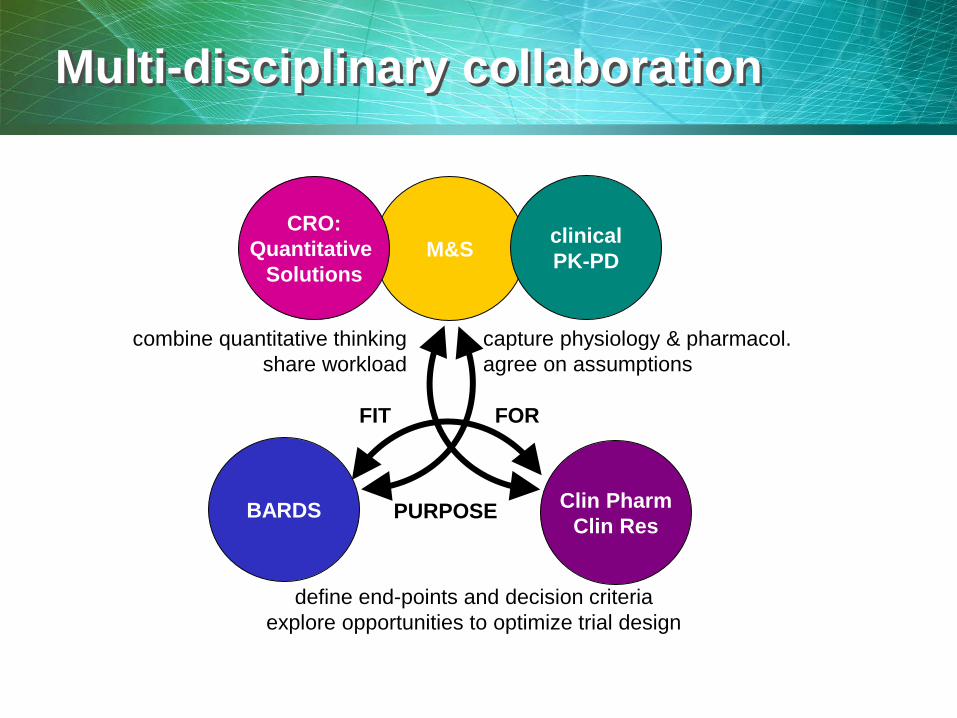
Multi-disciplinary collaboration
M&S
Clin Pharm Clin Res
combine quantitative thinking share workload
capture physiology & pharmacol. agree on assumptions
define end-points and decision criteria
explore opportunities to optimize trial design
FIT FOR
PURPOSE
CRO: Quantitative
Solutions
clinical PK-PD
BARDS
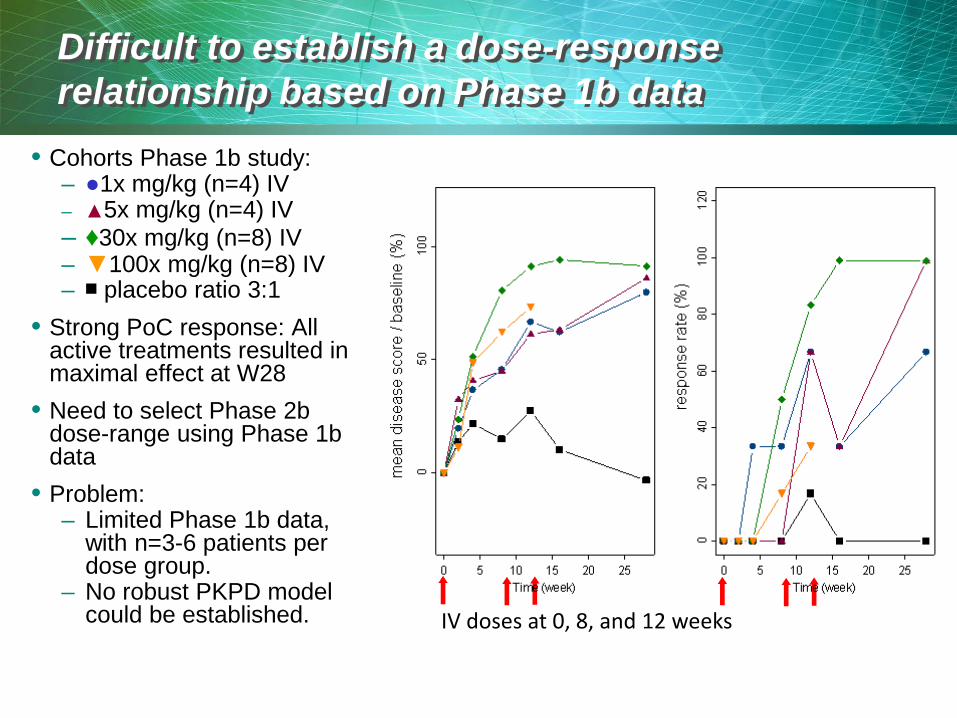
Difficult to establish a dose-response relationship based on Phase 1b data
• Cohorts Phase 1b study: – ●1x mg/kg (n=4) IV – ▲5x mg/kg (n=4) IV – ♦30x mg/kg (n=8) IV – ▼100x mg/kg (n=8) IV – ■ placebo ratio 3:1
• Strong PoC response: All active treatments resulted in maximal effect at W28
• Need to select Phase 2b dose-range using Phase 1b data
• Problem: – Limited Phase 1b data,
with n=3-6 patients per dose group.
– No robust PKPD model could be established.
IV doses at 0, 8, and 12 weeks

• Initial proposal for Phase 2b dose selection: based on max injectable SC dose – 25 mg SC at W0, W4, W16 (n=35) – 100 mg SC at W0, W4, W16 (n=70) – 200 mg SC at W0, W4, W16 (n=70) – 200 mg SC every 4 weeks (n=35) – Placebo SC every 4 weeks (n=35)
• Decision required: Phase 2b dose-selection – Will the initially proposed dose range (25-200 mg) allow for:
• estimation of dose-response? • determination of lowest maximum effective dose?
• Actions: Conduct a comparator analysis – Model-based dose selection
• Solution to in-house data limitations: borrow strength from published comparator data
– Best-in-Class strategy • Explore comparator landscape to understand requirements for
Phase 3 doses – need for maximum learning in Phase 2b
Dose selection for Phase 2b study using limited Phase 1b data
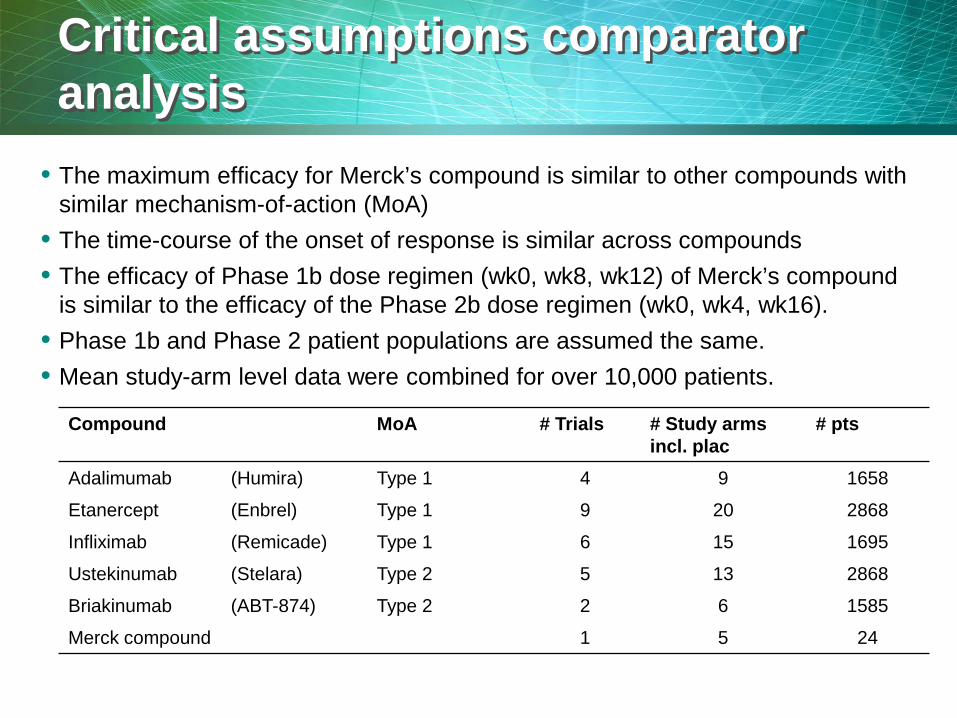
Critical assumptions comparator analysis
• The maximum efficacy for Merck’s compound is similar to other compounds with similar mechanism-of-action (MoA)
• The time-course of the onset of response is similar across compounds • The efficacy of Phase 1b dose regimen (wk0, wk8, wk12) of Merck’s compound
is similar to the efficacy of the Phase 2b dose regimen (wk0, wk4, wk16). • Phase 1b and Phase 2 patient populations are assumed the same. • Mean study-arm level data were combined for over 10,000 patients.
Compound MoA # Trials # Study arms incl. plac
# pts
Adalimumab (Humira) Type 1 4 9 1658
Etanercept (Enbrel) Type 1 9 20 2868
Infliximab (Remicade) Type 1 6 15 1695
Ustekinumab (Stelara) Type 2 5 13 2868
Briakinumab (ABT-874) Type 2 2 6 1585
Merck compound 1 5 24

Confidence in estimating efficacy response can be enhanced by co-modeling through correlation
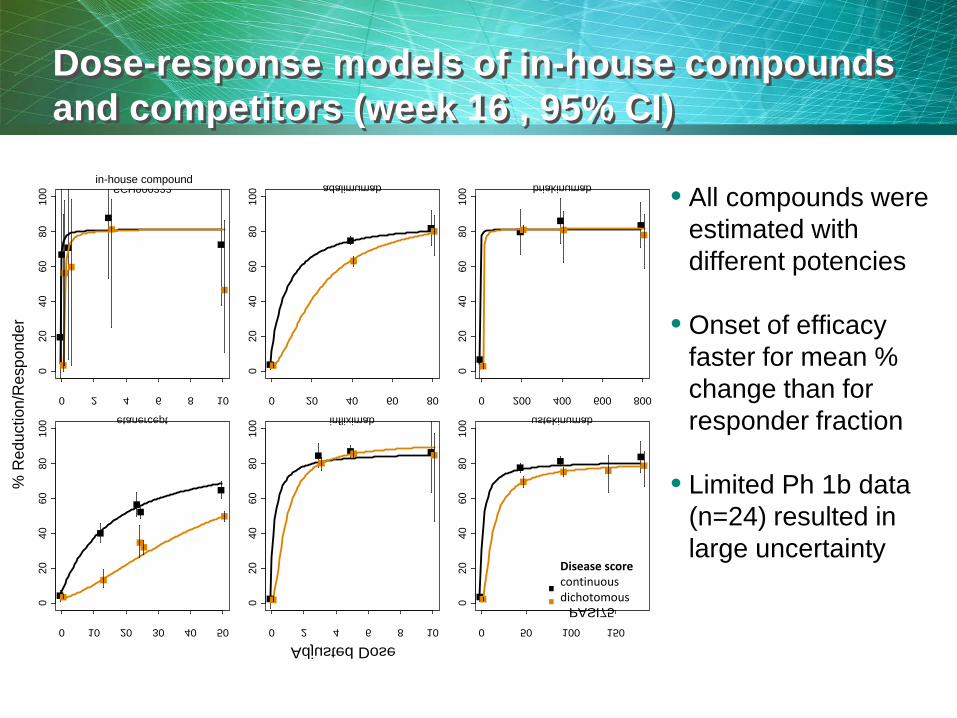
Data are plotted across all arms and time points in the database. Symbol size is proportional to the square root of the arm size. The fitted line is the cumulative normal distribution with mean of log (disease score / baseline), standard deviation of 0.66, and cutoff at -1.2.
0 2 4 6 8 10
020
4060
8010
0
SCH900222
0 20 40 60 80
020
4060
8010
0
adalimumab
0 200 400 600 800
020
4060
8010
0
briakinumab
0 10 20 30 40 50
020
4060
8010
0
etanercept
0 2 4 6 8 10
020
4060
8010
0
infliximab
0 50 100 150
020
4060
8010
0
ustekinumab
Adjusted Dose
% R
educ
tion/
Res
pond
er
endpointMean PASIPASI75
in-house compound
Disease scorecontinuousdichotomous
Dose-response models of in-house compounds and competitors (week 16 , 95% CI)
• All compounds were estimated with different potencies
• Onset of efficacy faster for mean % change than for responder fraction
• Limited Ph 1b data (n=24) resulted in large uncertainty

Dose-response model of in-house compound: increased response over time (80%CI)
Dose-response
• Near maximum effect is predicted to be achieved ≥50 mg.
• Doses of 50-200 mg are predicted to have little separation in time to reach maximum effect. Therefore, 200 mg is not predicted to have a faster maximum effect.
• 5 mg and 25 mg will allow for doses near ED50 (~8.4 mg) and are predicted to allow for establishing dose-response
1 5 10 50 100
02
04
06
08
0
4 week
1 5 10 50 100
02
04
06
08
0
8 week
1 5 10 50 100
02
04
06
08
0
12 week
1 5 10 50 100
02
04
06
08
0
16 week
SCH900222 D ( )
% re
spon
se, d
iffer
ence
from
pla
cebo
Dose in-house compound (mg)
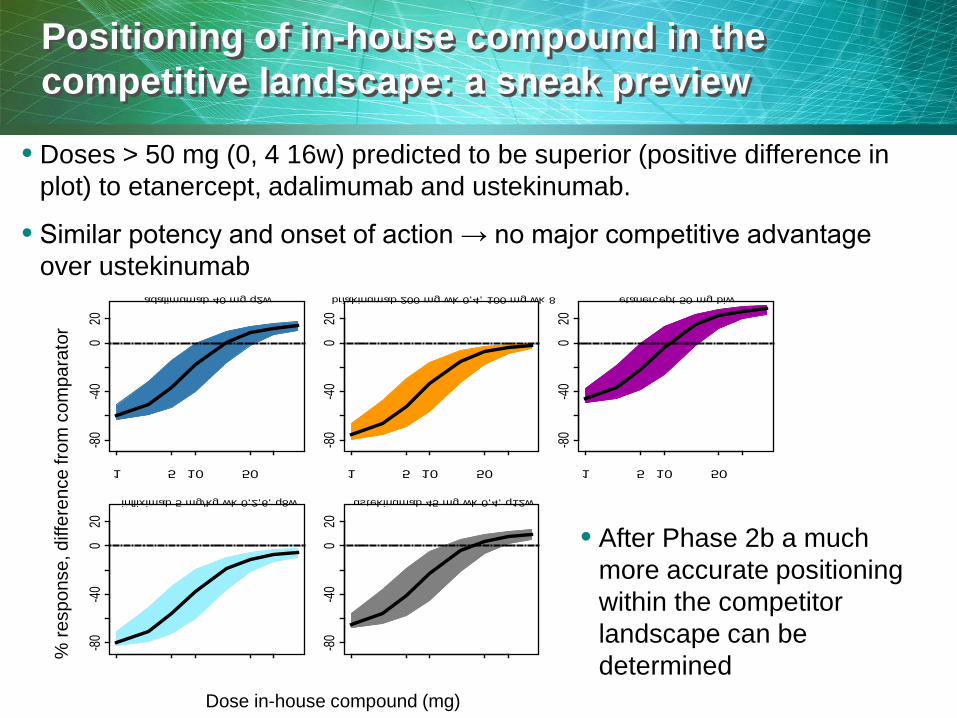
Positioning of in-house compound in the competitive landscape: a sneak preview
• Doses > 50 mg (0, 4 16w) predicted to be superior (positive difference in plot) to etanercept, adalimumab and ustekinumab.
• Similar potency and onset of action → no major competitive advantage over ustekinumab
• After Phase 2b a much more accurate positioning within the competitor landscape can be determined
1 5 10 50
-80-40
020
adalimumab 40 mg q2w
1 5 10 50
-80-40
020
briakinumab 200 mg wk 0,4, 100 mg wk 8
1 5 10 50
-80-40
020
etanercept 50 mg biw
1 5 10 50
-80-40
020
infliximab 5 mg/kg wk 0,2,6, q8w
1 5 10 50
-80-40
020
ustekinumab 45 mg wk 0,4, q12w
%
resp
onse
, diff
eren
ce fr
om c
ompa
rato
r
Dose in-house compound (mg)
Clinical trial simulations
• Why – Including doses around ED50 in the Phase 2b trial will allow for
identification of the lowest dose reaching maximum effect (“cusp of Emax”): best dose for Phase 3.
• How – Limitations and uncertainty in the available data are a fact. – Clinical trial simulations should incorporate these and still allow
for a robust dose selection decision for Phase 2b. – Dose-range should bracket (predicted) maximum response and
ED50. – Doses for Phase 2b were evaluated for being “near” placebo,
“near” maximum effect or in between (near ED50) by simulating 200,000 Phase 2b trials.
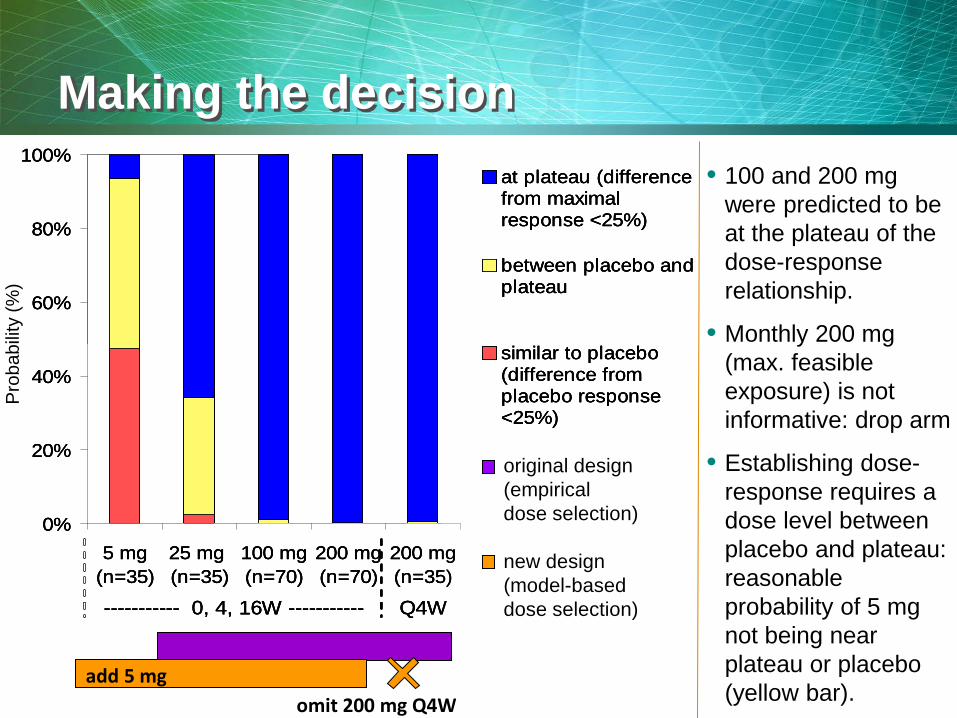
Making the decision
0%
20%
40%
60%
80%
100%
5 mg(n=35)
25 mg (n=35)
100 mg(n=70)
200 mg(n=70)
200 mg(n=35)
at plateau (differencefrom maximalresponse <25%)
between placebo andplateau
similar to placebo(difference fromplacebo response<25%)
----------- 0, 4, 16W ----------- Q4W
0%
20%
40%
60%
80%
100%
5 mg(n=35)
25 mg (n=35)
100 mg(n=70)
200 mg(n=70)
200 mg(n=35)
at plateau (differencefrom maximalresponse <25%)
between placebo andplateau
similar to placebo(difference fromplacebo response<25%)
----------- 0, 4, 16W ----------- Q4W
0%
20%
40%
60%
80%
100%
5 mg(n=35)
25 mg (n=35)
100 mg(n=70)
200 mg(n=70)
200 mg(n=35)
at plateau (differencefrom maximalresponse <25%)
between placebo andplateau
similar to placebo(difference fromplacebo response<25%)
----------- 0, 4, 16W ----------- Q4W
original design (empirical dose selection) new design (model-based dose selection)
add 5 mg omit 200 mg Q4W
• 100 and 200 mg were predicted to be at the plateau of the dose-response relationship.
• Monthly 200 mg (max. feasible exposure) is not informative: drop arm
• Establishing dose-response requires a dose level between placebo and plateau: reasonable probability of 5 mg not being near plateau or placebo (yellow bar).
Pro
babi
lity
(%)
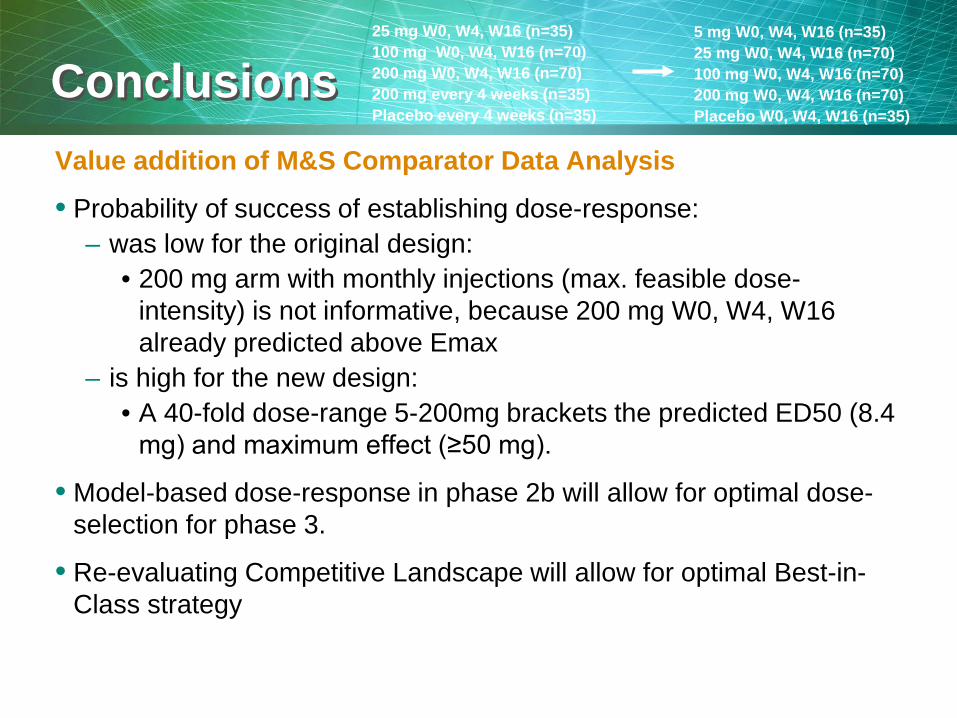
Conclusions Value addition of M&S Comparator Data Analysis
• Probability of success of establishing dose-response: – was low for the original design:
• 200 mg arm with monthly injections (max. feasible dose-intensity) is not informative, because 200 mg W0, W4, W16 already predicted above Emax
– is high for the new design: • A 40-fold dose-range 5-200mg brackets the predicted ED50 (8.4
mg) and maximum effect (≥50 mg).
• Model-based dose-response in phase 2b will allow for optimal dose-selection for phase 3.
• Re-evaluating Competitive Landscape will allow for optimal Best-in-Class strategy
25 mg W0, W4, W16 (n=35) 100 mg W0, W4, W16 (n=70) 200 mg W0, W4, W16 (n=70) 200 mg every 4 weeks (n=35) Placebo every 4 weeks (n=35)
5 mg W0, W4, W16 (n=35) 25 mg W0, W4, W16 (n=70) 100 mg W0, W4, W16 (n=70) 200 mg W0, W4, W16 (n=70) Placebo W0, W4, W16 (n=35)

BACKUP

Comparative efficacy model
14
0 5 10 15
020
4060
8010
0
Time (week)
PA
SI R
educ
tion
(%)
0 5 10 15
020
4060
8010
0
Time (week)
PA
SI7
5 R
espo
nder
s (%
)
Emax
Placebo
Low Dose
High Dose
Placebo
Low Dose
High Dose
Emax
resp
onse
rate
(%)
mea
n di
seas
e sc
ore
/ bas
elin
e (%
)
• The model has a maximum effect that gradually increases over time to a steady-state value.
• There is a dose-response relationship at each point in time. • Key assumptions: • The maximum efficacy for in-house compound is similar to competitors
with same MoA • The time-course of the onset of response is similar across compounds