phase 2: office, industrial & flex/r&d analysis
TRANSCRIPT
Frederick Market Analysis:Frederick Market Analysis:Phase 2: Office, Industrial & Flex/R&D Analysis
Prepared forPrepared for
The City of FrederickDepartment of Economic Development101 N Court StFrederick, MD 21701
bbpPrepared by
bbpA S S O C I A T E S
May 2008

City of Frederick Office, Industrial & Flex/R&D Market Analysis
1
Executive Summary Serving as the northern anchor of the I-270 Technology Corridor, at the hub of major transportation routes serving Washington, DC and Baltimore, the City of Frederick is both the historic heart of Frederick County and a center of innovation. The City’s top industries – including bioscience, information technology, and advanced manufacturing – undoubtedly have benefited from the City’s many strengths, including the numerous opportunities created by Fort Detrick (which directly employs 8,000), the City’s supportive business networks, and Frederick’s high quality of life. The growth of these industries has prompted significant interest in expanding the City’s commercial real estate markets. With major developments planned or under construction throughout Frederick, the City sought to obtain a greater understanding of Frederick’s commercial demand (e.g. current and projected growth of industries) and supply (e.g. current and planned commercial space). To investigate these conditions and trends, the City of Frederick Department of Economic Development engaged Basile Baumann Prost Cole and Associates (BBPC) to provide professional services for the development of a citywide commercial market analysis. This analysis was divided into two phases: 1) Retail Market Analysis; and 2) Office, Industrial, and Flex/R&D Market Analysis. The Retail Market Analysis was completed in September 2007 and is available through the Department of Economic Development. The Phase II Office, Industrial, and Flex/R&D Market Analysis specifically focused on current conditions and trends, potential sources of future demand and supply (and resulting “opportunity gap” of unmet future demand), and the development of strategies to enhancing the office, industrial, and flex/R&D markets in the City. Through this evaluation, several conclusions have been reached regarding the office, industrial, and flex/R&D markets in the City of Frederick. To start, opportunities for the expansion of the office, industrial, and flex markets have been identified (summarized in the following table).
Office, Industrial & Flex Development Opportunities Based on Demand and Supply Factors
2007-2020
Office Industrial Flex
Current Supply (Square Feet) 3,797,672 2,340,378 1,474,547 Current Employment (Jobs) 14,317 4,626 3,244
Current Occupied Supply (Square Feet) 3,459,679 1,996,342 1,285,805
Square Feet Per Employee 240 430 400
Net Future Employment (Jobs) 8,300 2,900 6,400
Net Future Demand (Square Feet) 2,000,000 1,250,000 2,560,000
Annual Demand (Square Feet) 153,000 96,000 197,000
Net Future Supply (Pipeline in Square Feet) 1,900,000 700,000 1,200,000
Opportunity Gap (Square Feet) 100,000 550,000 1,400,000 Total Future Potential Space (Square Feet)* 5,800,000 3,550,000 4,100,000 *Total Future Space = Current Supply (includes occupied and vacant space) plus net future supply (pipeline) plus opportunity gap Source: BBPC
City of Frederick Office, Industrial & Flex/R&D Market Analysis
2
Top findings include: Employment
• With nearly 50,000 employees in nearly 3,500 firms, the City represents 48 percent of all employment in Frederick County, making it a major employment hub
• Roughly 60 percent of all the office space in Frederick County (including the City) is located within City boundaries, significantly higher than its share of industrial (34 percent of total in County) and flex space (30 percent of total in County), and indicative of the City’s status as a strong location for professional business services and other traditional office-based employers
• The City could attract significant job growth through 2020 based on existing business expansions (organic growth) as well as recruitment of new firms
• Much of this growth will likely occur in the fields of bioscience, advanced technology, and professional, scientific and technical services, all of which provides demand for office, industrial, and flex space
• Current employment density is highest among office uses, followed by flex, then industrial (240 square feet per employee for office, 400 square feet per employee for flex, and 430 square feet per industrial employee)
• There is potential for the City to add 8,300 office-based employees, 2,900 industrial-based employees, and 6,400 flex-based employees over the next ten to twelve years
Opportunities for New Commercial Space • Future demand for space is anticipated to be high based on this employment growth (e.g. for
nearly 2 million square feet of office space, 1.25 million square feet of industrial, and 2.56 million square feet of flex space)
• Current levels of development under construction and proposed are also high, limiting the additional new opportunity for space; the opportunity “gap” between supply and demand for office space is 100,000; for industrial, 550,000; and for flex, 1,400,000 (2.05 million square feet total)
• The availability of land parcels zoned for commercial use, served by infrastructure, and sized to meet the demands of developers and selected major employers will be a major determinant of how much of the potential opportunity for new space is channeled within City boundaries
Commercial Land Capacity • BBPC’s broad-level evaluation of commercial land capacity suggests that, depending on the floor
area ratios (FARs) achieved, the City may have adequate land supply (over 400 unimproved acres and another 150 underutilized acres) to address commercial growth demands over the next thirteen years
• There are a myriad of dynamic factors in the City’s real estate market which may necessitate strategic annexation to expand the City’s commercial land supply: • Parcels could be developed at FAR levels lower than current trends • Underutilized parcels may not be redeveloped • Selected large employers (in particular bioscience and advanced manufacturing firms seeking
locations in campus style business parks) could require much larger parcel sizes than most of the unimproved and underutilized parcels offer (recent prospects and expanding businesses in the City have expressed need for between 250,000 to over 1 million square feet)

City of Frederick Office, Industrial & Flex/R&D Market Analysis
3
• Certain parcels may require more than 40 percent of their land area devoted to parking, roads, sewer, water, storm water management, and other infrastructure/environmental elements, causing lower capacity than that projected in the analysis
• Most of the City’s parcels fronting major highways are developed, providing a need for potential annexation of parcels along I-70 and Route 15 to attract major employers seeking high visibility and access
• Given these many dynamic factors, it appears the City may benefit from strategic annexation to ensure the most desirable locations contiguous to the City (e.g. those near the existing major transportation routes of I-70, I-270, and Route 15) are added to the commercial land supply to support a healthy commercial market and future business growth.
• To complement this strategic annexation, land use policies to encourage higher-intensity use of existing land are recommended to offer the City the best of both worlds: the chance to accommodate prospective large employers as well as the opportunity to become a regional model for higher-intensity, “smart-growth” development and redevelopment within the City’s current boundaries
• Land use strategies should create incentives to build in the City on infill lots or on contiguous annexed parcels at higher densities
Strategies to Enhance Commercial Market Demand
• With significant opportunities for new commercial development, and a high level of space underway, strategies related to business cultivation and recruitment should be undertaken to enhance demand for space to ensure that employment growth keeps pace with planned and potential future development
• Strategies are meant to increase the number of businesses and employees entering or expanding in the Frederick market, and cover a number of topics that emerged through conversations with area stakeholders. These topics, along with potential strategies, include:
o Workforce & Education: closer to home campaign (focused recruiting of companies that employ significant numbers of Frederick residents to open branches in the City); support of Frederick Business Roundtable for Education efforts encouraging STEM education (e.g. science, technology, engineering, and mathematics); and celebration of diversity and culture (since high-technology fields attract employees with diverse backgrounds and often international roots)
o Land, Zoning, Buildings & Infrastructure: refinements to land use policy and zoning (considerations for Land Management Code update, including residential-commercial linkage regulations and minimum floor area ratio requirements), streamlined development review, focus on specialized space needs of high-technology firms, and support of employment clusters
o Quality of Life: support for special events and tourism efforts that call attention to Frederick’s high quality of life, and thereby plant seeds for potential future relocations of businesses and skilled employees
o Location & Transportation: completion of Monocacy Boulevard linkages and interchanges, creation of the North-South Parallel Road to link major transportation networks in the City’s eastside, provision of adequate water and sewer and roadway capacity, expansion of broadband linkages, and transportation demand management
o Business Support Networks: creation of a single-point-of-contact for high-technology firms (designation of an umbrella organization among Frederick’s many technology-focused organizations and programs), and potential incentives packages focused specifically on technology

City of Frederick Office, Industrial & Flex/R&D Market Analysis
4
Table of Contents Executive Summary ...................................................................................................................................... 1 1 Introduction .......................................................................................................................................... 5
1.1 Background ................................................................................................................................... 5 1.2 Study Purpose ............................................................................................................................... 5 1.3 Work Completed ........................................................................................................................... 5 1.4 Report Organization ...................................................................................................................... 6
2 Economic and Market Overview .......................................................................................................... 7 2.1 Study Area Definition ................................................................................................................... 7 2.2 Contextual Information ................................................................................................................. 9 2.3 Demographic and Economic Profile ........................................................................................... 11 2.4 Land Uses .................................................................................................................................... 18 2.5 Position within Regional Economy ............................................................................................. 19
3 Office Market ..................................................................................................................................... 20 3.1 Overview ..................................................................................................................................... 20 3.2 Market Area Definition ............................................................................................................... 21 3.3 Market Conditions & Comparison to Larger Markets ................................................................ 22 3.4 Projected Demand for Office Space ............................................................................................ 23 3.5 Office Space Preferences of Target Users .................................................................................. 24 3.6 Projected Supply: Development Activity .................................................................................... 26 3.7 Opportunity Gap ......................................................................................................................... 29 3.8 Conclusions ................................................................................................................................. 29
4 Industrial Market ................................................................................................................................ 31 4.1 Overview ..................................................................................................................................... 31 4.2 Market Area Definition ............................................................................................................... 32 4.3 Market Conditions & Comparison to Larger Markets ................................................................ 33 4.4 Projected Demand for Industrial Space....................................................................................... 34 4.5 Industrial Space Preferences of Target Users ............................................................................. 36 4.6 Projected Supply: Development Activity .................................................................................... 37 4.7 Opportunity Gap ......................................................................................................................... 38 4.8 Conclusions ................................................................................................................................. 38
5 Flex/R&D Market .............................................................................................................................. 40 5.1 Overview ..................................................................................................................................... 40 5.2 Market Area Definition ............................................................................................................... 41 5.3 Market Conditions & Comparison to Larger Markets ................................................................ 42 5.4 Projected Demand for Flex/R&D Space ..................................................................................... 42 5.5 Flex/R&D Space Preferences of Target Users ............................................................................ 44 5.6 Projected Supply: Development Activity .................................................................................... 46 5.7 Opportunity Gap ......................................................................................................................... 47 5.8 Conclusions ................................................................................................................................. 48
6 Commercial Land Capacity Analysis ................................................................................................. 49 6.1 Overview ..................................................................................................................................... 49 6.2 Findings ....................................................................................................................................... 49 6.3 Conclusions ................................................................................................................................. 53
7 Strengths, Constraints, and Opportunities .......................................................................................... 55 7.1 Overview ..................................................................................................................................... 55 7.2 Summary ..................................................................................................................................... 58
8 Recommendations .............................................................................................................................. 64

City of Frederick Office, Industrial & Flex/R&D Market Analysis
5
1 Introduction 1.1 Background The City of Frederick engaged Basile Baumann Prost Cole and Associates, Inc. (BBPC) to provide professional services for the development of a citywide commercial market analysis. The analysis was divided into two phases: 1) Retail Market Analysis; and 2) Office, Industrial & Flex/R&D Analysis. The Retail Market Analysis was completed in September of 2007 and is available through the City of Frederick Department of Economic Development. The Phase I Retail Market Analysis focused on key retail sub-areas within the City, including Downtown Frederick, Route 40/ the Golden Mile, and The Northern End (the City’s large retail nodes). The Phase II Office, Industrial & Flex/R&D Analysis provides a City-wide analysis without focus on sub-areas. However, conditions and trends in the larger markets within which the City is located (e.g. Frederick County, suburban Maryland, and metropolitan Washington, DC) were evaluated because these conditions and trends influence prospects for future growth in the City of Frederick. 1.2 Study Purpose The office, industrial, and flex/R&D market analysis was commissioned to facilitate an understanding of commercial real estate market dynamics within the City of Frederick. The purpose of the study is to identify trends, issues, and opportunities and to analyze the current and future market for office, industrial, and flex/R&D uses. 1.3 Work Completed To address the purpose of the study, BBPC conducted an Office, Industrial & Flex/R&D Market Analysis that benefited from the participation and insight of local business owners, commercial brokers, and other key stakeholders. As part of this study, BBPC completed the following: • Kickoff meeting to: refine project goals and objectives, confirm project expectations, assumptions,
requirements, procedures and work plan; identify key stakeholders to be interviewed; receive all available documents, maps (GIS and other), and other materials from the City; confirm project boundaries; and discuss previous work and plans completed.
• Refinement of work program and meeting schedule based on kickoff meeting(s).
• Series of planned stakeholder focus group conversations, held with local real estate brokers and
developers, economic development practitioners, and business owners. • Demographic and economic trends analysis to identify factors influencing the office, industrial, and
flex/R&D markets in the City to identify: economic trends by industry in employment, labor force characteristics, number of businesses, and at-place employment.
• Market analysis of the office, industrial, and flex/R&D market to: identify regional context and trends,
identify trends in product preferences of target users, identify and examine information on recent projects, and determine the opportunity gap between projected future demand and supply.

City of Frederick Office, Industrial & Flex/R&D Market Analysis
6
• Evaluation of the City’s commercial land capacity, including assessment of unimproved parcels (i.e.
those with no building improvements) and identification of underutilized parcels (i.e. parcels that currently contain no buildings, but could hold significantly more commercial space – in terms of both size and value)
• Strengths, constraints, and opportunities analysis of a variety of factors influencing potential for
commercial expansion in the City, including issues surrounding workforce & education, quality of life, location & transportation, land & zoning, and other key factors.
• Recommendations regarding future supply and measures to expand demand for office, industrial, and
flex/R&D space in the City. 1.4 Report Organization The report is organized into eight sections. These sections include: • Section 1 Introduction • Section 2 Economic and Market Overview • Section 3 Office Market • Section 4 Industrial Market • Section 5 Flex/R&D Market • Section 6 Commercial Land Capacity Analysis • Section 7 Strengths, Constraints, and Opportunities • Section 8 Recommendations

City of Frederick Office, Industrial & Flex/R&D Market Analysis
7
2 Economic and Market Overview 2.1 Study Area Definition The prime area of analysis for the City of Frederick Office, Industrial & Flex/R&D Market Analysis is all the land within current City boundaries. Additionally, the areas encompassing the Frederick Planning Region, Frederick County, and the Washington, DC metropolitan region have been evaluated for comparison purposes. The City of Frederick is roughly bound by the Monocacy River to the north, Frederick Municipal Airport to the east, Interstate 70 to the south, and just west of Fredericktowne Mall to the west.
The City of Frederick (2007)
Area in Square Miles = 20.8 Area in Acres = 13,312
Source: The City of Frederick

City of Frederick Office, Industrial & Flex/R&D Market Analysis
8
The Frederick Planning Region includes the City of Frederick and such populated areas as Ballenger Creek and Clover Hill, as well as more rural parts of the County between the City of Frederick and Thurmont. The Frederick Planning Region is bound by geographic features, including: Little Hunting Creek to the north, the Monocacy River to the east, Ballenger Creek to the south, and the ridge of the Catoctin Mountains to the west.
Frederick Planning Region (2007)
Area in Square Miles = 94 Area in Acres = 60,000
Source: ESRI Business Information Systems, BBP Associates

City of Frederick Office, Industrial & Flex/R&D Market Analysis
9
2.2 Contextual Information With multiple existing business clusters, the City of Frederick offers a broad array of locations for commerce. The City’s fourteen designated business parks cover all the major types of commercial uses – office, flex/research & development (R&D), and industrial – as well as environments featuring a mix of uses (Downtown Frederick) and office interspersed with retail (the Golden Mile/Route 40 corridor).
Business Parks within the City of Frederick (2008)
Source: The City of Frederick
Business Park Name & Use(s) Business Park Name & Use(s) Business Park Name & Use(s)
1 Airport Industrial Park Office, Warehouse
6 Frederick Industrial Park Manufacturing, Office
11 North Amber Business Park Office, Medical
2 Ballenger Creek Center Office
7 Frederick Research Park Office, Medical
12 Riverside Corporate Park East R&D, Biotech, Corporate Office
3 Center Park R&D, Manufacturing
8 Golden Mile Retail, Office
13 Riverside Corporate Park West Manufacturing, Light Industrial
4 Downtown Mixed Use (Retail, Office, Residential)
9 Governor's Choice Office, Manufacturing
14 Worman's Mill Industrial R&D, Flex
5 Frederick Airport Park R&D, Flex
10 Industrial Center East Manufacturing, Flex

City of Frederick Office, Industrial & Flex/R&D Market Analysis
10
These commercial centers accommodate a variety of businesses, from those seeking unique, rehabilitated Downtown space to those desiring a location near major transportation networks (I-70, Route 15, Frederick’s municipal airport) and those looking for newly constructed space or a build-to-suit opportunity. Employers also have the option of locating in dense clusters, within a stone’s throw of numerous other commercial businesses and organizations. With its compact and historic form, Downtown Frederick features a higher density than other areas of the City. The East Street and Patrick Street corridors also exhibit strong concentrations of employers, and the Riverside Corporate Park serves as an emerging center for commerce (focused on research & development, biotechnology, corporate offices, manufacturing, and light industrial space) as illustrated in the following map of business locations.
Businesses in the City of Frederick (2008)
Within these business parks and at individual sites throughout the City there were an estimated 3,498 businesses that together employed 48,567 workers in 2007. This level of commerce represents just over 40 percent of all businesses and 48 percent of all employees in Frederick County, and 78 percent of all businesses and 76 percent of all employees in the Frederick Planning Region, as illustrated in Figure 1.
Source: City of Frederick, Frederick County, BBPC, 2008

City of Frederick Office, Industrial & Flex/R&D Market Analysis
11
Figure 1: Businesses & At-Place Employment (2007) City Planning Region County Businesses 3,498 4,496 8,383 At-Place Employment 48,567 64,288 101,405 Planning Region numbers include City numbers; County numbers include Planning Region and City numbers Source: ESRI Business Information Systems, BBP Associates, 2007
2.3 Demographic and Economic Profile Employment There are two key types of employment that are useful to analyze when studying market conditions: labor force (e.g. residents over age 16 that are employed, whether at organizations located within the area of study or elsewhere), and at-place employment (e.g. workers of organizations located within the area of study, which may live in the same area or elsewhere). In the City of Frederick, at-place employment (48,567) outnumbered labor force (31,014) in 2007, indicating that the City serves as a destination for employment. Similarly, the Planning Region’s at-place employees (64,288) outnumbered the labor force (47,186).1
Figure 2: Labor Force & At-Place Employment (2007) City Planning Region County Labor Force 31,014 47,186 120,590 At-Place Employment 48,567 64,288 101,405 Planning Region numbers include City numbers; County numbers include Planning Region and City numbers Source: ESRI Business Information Systems, BBP Associates, 2007
In contrast, at the County level, the labor force (120,590) was higher than the number of at-place employees (101,405), indicating that more residents leave the County for employment each day than non-residents commute to the County for employment.2 This imbalance presents an opportunity for employers in the County (including those at the City level) to add more jobs targeted to County workers.
1 Planning Region numbers of at-place employees and labor force includes City numbers of same. 2 County numbers of at-place employees and labor force includes Planning Region and City numbers of same.
City of Frederick Office, Industrial & Flex/R&D Market Analysis
12
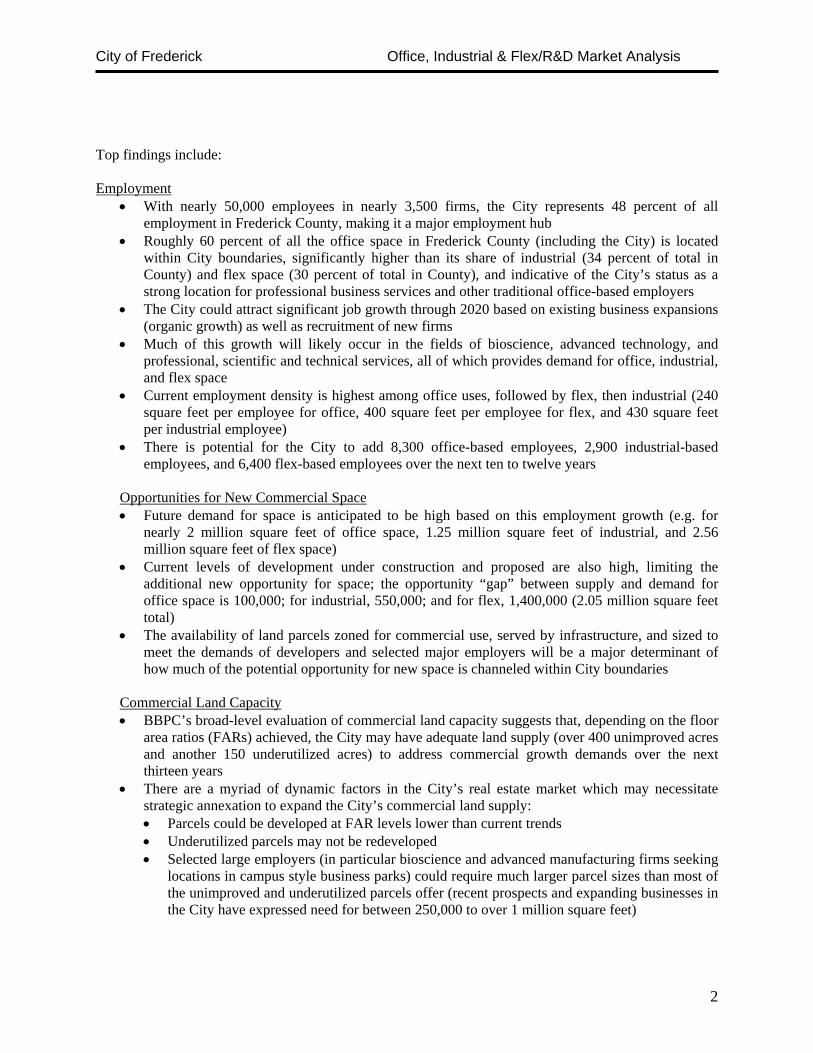
Labor Force by Occupation The City labor force included 31,010 employed citizens in 2007, representing 66 percent of the Planning Region labor force (47,187) and 25 percent of the County labor force (120,590).3
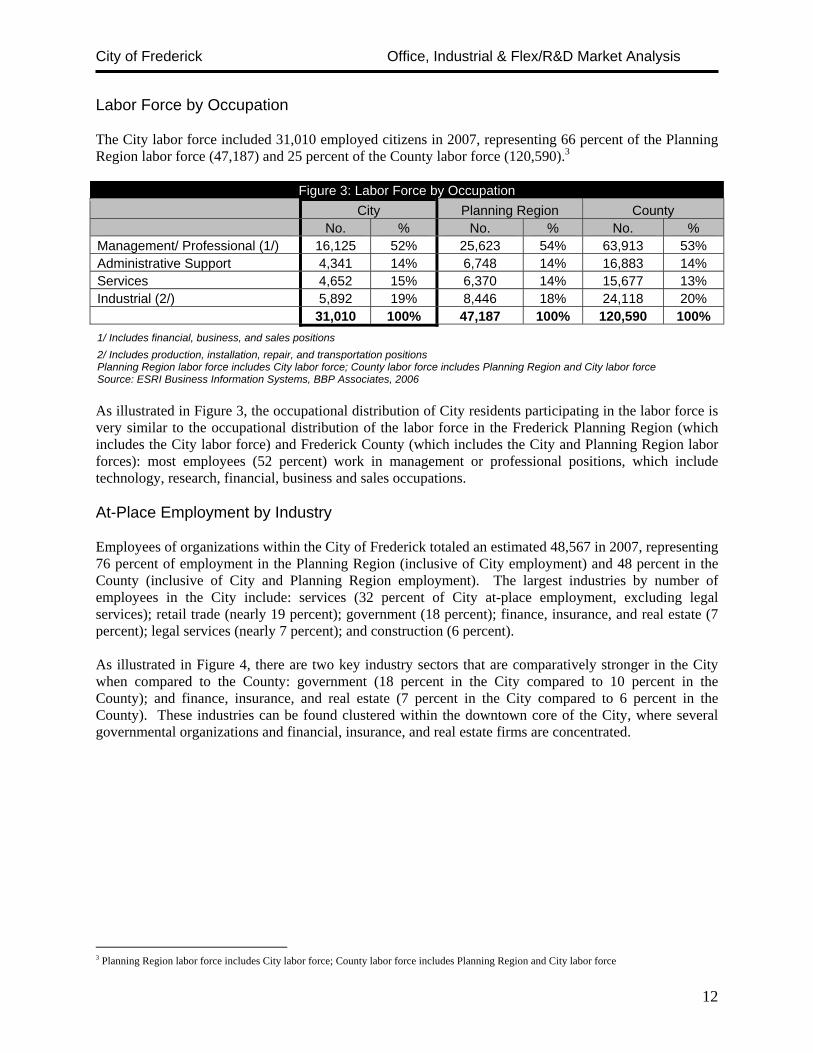
Figure 3: Labor Force by Occupation City Planning Region County No. % No. % No. % Management/ Professional (1/) 16,125 52% 25,623 54% 63,913 53% Administrative Support 4,341 14% 6,748 14% 16,883 14% Services 4,652 15% 6,370 14% 15,677 13% Industrial (2/) 5,892 19% 8,446 18% 24,118 20% 31,010 100% 47,187 100% 120,590 100% 1/ Includes financial, business, and sales positions 2/ Includes production, installation, repair, and transportation positions Planning Region labor force includes City labor force; County labor force includes Planning Region and City labor force Source: ESRI Business Information Systems, BBP Associates, 2006 As illustrated in Figure 3, the occupational distribution of City residents participating in the labor force is very similar to the occupational distribution of the labor force in the Frederick Planning Region (which includes the City labor force) and Frederick County (which includes the City and Planning Region labor forces): most employees (52 percent) work in management or professional positions, which include technology, research, financial, business and sales occupations. At-Place Employment by Industry Employees of organizations within the City of Frederick totaled an estimated 48,567 in 2007, representing 76 percent of employment in the Planning Region (inclusive of City employment) and 48 percent in the County (inclusive of City and Planning Region employment). The largest industries by number of employees in the City include: services (32 percent of City at-place employment, excluding legal services); retail trade (nearly 19 percent); government (18 percent); finance, insurance, and real estate (7 percent); legal services (nearly 7 percent); and construction (6 percent). As illustrated in Figure 4, there are two key industry sectors that are comparatively stronger in the City when compared to the County: government (18 percent in the City compared to 10 percent in the County); and finance, insurance, and real estate (7 percent in the City compared to 6 percent in the County). These industries can be found clustered within the downtown core of the City, where several governmental organizations and financial, insurance, and real estate firms are concentrated.
3 Planning Region labor force includes City labor force; County labor force includes Planning Region and City labor force
City of Frederick Office, Industrial & Flex/R&D Market Analysis
13
Figure 4: Industry Mix by Employment
City Planning Region County No. % No. % No. %
Agriculture & Mining 141 0.3% 302 0.5% 1,225 1.2% Construction 3,125 6.4% 4,267 6.6% 10,081 9.9% Manufacturing 2,202 4.5% 3,039 4.7% 6,356 6.3% Transportation 964 2.0% 1,014 1.6% 1,967 1.9% Communication 145 0.3% 219 0.3% 245 0.2% Utilities 111 0.2% 192 0.3% 254 0.3% Wholesale Trade 1,447 3.0% 1,835 2.9% 3,017 3.0% Retail Trade 9,074 18.7% 14,296 22.2% 21,033 20.7% FIRE* 3,483 7.2% 5,492 8.5% 6,537 6.4% Legal Services 3,159 6.5% 3,630 5.6% 6,685 6.6% Other Services 15,635 32.2% 21,064 32.8% 33,673 33.2% Government 8,903 18.3% 8,619 13.4% 9,904 9.8% Other Industries 178 0.4% 322 0.5% 428 0.4% TOTAL 48,567 100.0% 64,291 100.0% 101,405 100.0% *FIRE = finance, insurance and real estate Planning Region employment includes City employment; County employment includes Planning Region and City employmentSource: ESRI Business Information Solutions, BBPC, 2007
Analysis of employment growth trends in the City from 2002 to 2007 reveals that several industries likely to occupy office, industrial, and flex/R&D space have experienced strong recent growth. The professional, scientific, and technical services sector blossomed from 2002 to 2007, adding nearly 2,500 jobs (a 130 percent increase in five years). This increase occurred in connection with expansion of Fort Detrick, expansion of the Maryland bioscience cluster, and efforts by City and County organizations focused on recruiting professional, scientific and technical industries such as bioscience and information technology. The construction and public administration sectors grew during this period, adding 1,413 and 1,527 new jobs, respectively, although each experienced volatility over the past five years (each experiencing growth in some years and contraction in others). The finance and insurance sector also experienced volatility, adding jobs from 2002 to 2004 but declining from 2004 to 2007. Manufacturing employment declined throughout the five year period by 914 jobs, similar to declines in this sector at the national level. Though manufacturing employment fell as a whole, selected manufacturing industries are thriving in the City and County. In particular, bioscience pharmaceutical manufacturing and high technology manufacturing firms have expanded locally, with BP Solar, a manufacturer of photovoltaic cells and modules, adding 70 jobs in a $100 million expansion, and MedImmune, a biologics/pharmaceutical manufacturer, adding 250 new jobs in a $250 million expansion. The City employment trends are documented in Figure 5.

City of Frederick Office, Industrial & Flex/R&D Market Analysis
14
Figure 5: Employment Growth Trends
City of Frederick, 2002 to 2007
Industry Year Net Gain/Loss
2002 2004 2007 2002 to 2004 2004 to 2007 2002 to 2007
Manufacturing 2,850 2,680 1,936 (170) (744) (914)
Professional, Scientific & Technical Services 1,921 4,100 4,419 2,179 319 2,498
Finance & Insurance 2,400 1,658 2,318 (742) 660 (82)
Construction 1,750 3,267 3,163 1,517 (104) 1,413
Public Administration 7,400 7,217 8,927 (183) 1,710 1,527
Source: The City of Frederick, ESRI Business Information Solutions, BBPC, 2007 Employment Commuting Trends To better understand the origins and destinations of Frederick’s labor force and at-place employees, BBPC compared commuting patterns of the Frederick County labor force (e.g. residents of the County that hold jobs, either in or outside the County) and Frederick County at-place employees (e.g. workers whose jobs are located within Frederick County who may live either in or outside the County). County level data was used because the Census does not provide City-level commuting information; the data is further limited in that it dates to the year 2000 (the most recent Census). However, the information still provides a general indication of the commuting patterns of the City’s labor force and at-place employees, and is useful in understanding the regional context within which the City competes for workers. As illustrated in the following map, the majority of Frederick County’s resident labor force (59 percent) works in the County. However, a large minority (22 percent) commute to jobs located in Montgomery County. Employment patterns within the City are likely to be similar to those at the County level.
Employment Locations of Frederick County Resident Labor Force (2000)
Source: Census Transportation Planning Package, BBPC, 2007
Frederick 60270

City of Frederick Office, Industrial & Flex/R&D Market Analysis
15
Other major commuting destinations (e.g. those to which more than 900 residents commute), ranked in order of popularity include: the District of Columbia (3 percent); Washington County, MD (2 percent); Carroll County, MD (2 percent); Fairfax County, VA (2 percent); Howard County, MD (2 percent); Prince George’s County, MD (1 percent); Loudoun County, VA (1 percent); Baltimore City, MD (1 percent); and Baltimore County, MD (1 percent). Companies and organizations in Frederick County draw their workforce from a number of jurisdictions in the region. In contrast to the commuting patterns of Frederick County residents, this workforce drawing area for Frederick County employers is focused more to the west and north. As illustrated in the following map, most of these employees are also residents of Frederick County (71 percent). The next largest share of employees live in Washington County (8 percent), followed by Montgomery (5 percent).
Residence Locations of Frederick County At-Place Employees (2000)
Other key drawing areas of employees (e.g. jurisdictions within which more than 400 employees of Frederick County organizations reside) ranked in order of popularity include: Carroll County, MD (3 percent); Franklin County, PA (2 percent); Adams County, PA (2 percent); Jefferson County, WV (2 percent); Berkeley County, WV (1 percent); Howard County, MD (1 percent); Baltimore County, MD (1 percent); and Loudoun County, VA (0.5 percent).
Source: Census Transportation Planning Package, BBPC, 2007
Frederick 60270

City of Frederick Office, Industrial & Flex/R&D Market Analysis
16
Businesses There were 8,383 businesses in Frederick County in 2007: 3,498 in the City, 998 in the Planning Region (excluding the City, and 4,496 when the City is included), and 3,887 in the County (excluding those located in the City and Planning Region, and 8,383 when the City and Planning Region are included). The majority (23 percent) of the City of Frederick’s estimated 3,498 businesses were classified as office/professional firms, including professional/scientific/technical service providers, finance/insurance/real estate firms, information-related firms, and management services.
Employers by Industry (2007)
Retail & Hospitality
70220%
Office/Professional
81723%Industrial
48514%Public Uses
1795%
Institutional54116%
Other77422%
Retail & Hospitality1,00422%
Office/Professional
1,09224%Industrial
69416%
Public Uses1874%
Institutional59113%
Other93021%
Retail & Hospitality
64016%
Office/Professional
73819%
Industrial1,17130%
Public Uses702%
Institutional2717%
Other99526%
Office/professional firms were also the largest share of Planning Region employers, which, including City employers, totaled 1,000. In contrast to the City and Planning Region, the largest category of County employers (including the Planning Region and City businesses) was industrial-type businesses (30 percent).
1/ Includes retail trade and accommodation/ food service businesses 2/ Includes FIRE (finance, insurance & real estate), information, professional services, and management firms 3/ Includes manufacturing, transportation, construction, and waste management services 4/ Includes health care and education-related organizations Source: ESRI Business Information Systems, 2007
City of Frederick Planning Region (Includes City Employers)
County (Includes City & Planning Region Employers)

City of Frederick Office, Industrial & Flex/R&D Market Analysis
17
Major Employers
Top employers in the City of Frederick include governmental, institutional, and private sector organizations. These include:
• Fort Detrick and the National Cancer Institute (7,900 employees); • Frederick County Board of Education (5,300 employees) • Frederick County Government (2,500); • Frederick Memorial Healthcare System (2,400 employees); • Wells Fargo Home Mortgage (1,650 employees); • Frederick Community College (1,320 employees); • United Health Care (1,565 employees); • State Farm Insurance Corporation (929 employees); • Frederick City Government (851 employees); and • BP Solar (550 employees).
Additionally, the surrounding Frederick Planning Region contains a variety of large employers, including:
• Bechtel Corporation (2,203 employees); • CitiMortgage (900 employees); • Wal-Mart Retail Stores (700 employees); • NVR, Inc. (650 employees); and • Chase Card Services (575 employees).
Several of these major employers have served as catalysts for spin-off business growth in the City and County. The presence of major employers Fort Detrick and the National Cancer Institute and the supportive programs developed by local government agencies have in part prompted the emergence of Frederick’s bioscience industry. A 2006 study estimated that between 2002 and 2004, the City added 441 jobs in the bioscience field (approximately 8 percent of the total 5,649 jobs added in the City over that time period). In particular, Fort Detrick has contributed to the loction of Dynport Vaccine, Midwest Research, Charles River Laboratories, and Southern Research Institute in Frederick.
Emerging bioscience and information technology businesses are supported by the Fort Detrick Business Development Office (FDBDO) and the Frederick Innovative Technology Center, Inc. (FITCI), Frederick’s business incubator. FDBDO facilitates contracting opportunities (and therefore business growth) by coordinating relationships between Fort Detrick, private contractors, higher education institutions, and economic development organizations.
With two locations – 10,000 square feet at the Hood College campus and 11,000 square feet at Metropolitan Court – FITCI facilities can accommodate approximately 80 client employees in 35 offices and 16 laboratories. Currently, leaders estimate that FITCI adds around four new clients per year with a graduation cycle of approximately two to three years. An estimated six clients graduate per year. When clients graduate, it is anticipated that they will seek space in the Frederick commercial market. For example, recent FITCI graduate Akonni Biosystems, Inc. (which grew from 3 initial employees to 24 in two years) has relocated within renovated industrial space in Downtown Frederick at Sagner Avenue, which is located near the Frederick MARC station on East Street within a U.S. Small Business Administration designated Historically Underutilized Business Zone (HUB zone).

City of Frederick Office, Industrial & Flex/R&D Market Analysis
18
Education
Approximately 30 percent of residents over age 25 in both the City and County held a bachelor’s degree or higher in 2000, higher than the 24 percent of total United States residents with that level of educational attainment. Frederick County includes three higher education institutions: Hood College (approximately 2,250 students), Frederick Community College (approximately 4,800 students), and Mount St. Mary’s University (approximately 2,000 students).
Institutions of higher education in Frederick offer programs tailored to enhancing students’ technology and science skills. Frederick Community College recently introduced a bio-processing program that was a direct result of collaboration between the college and biotech industry leaders. The program is meant to prepare students to work as process operators in biological manufacturing facilities. Hood College offers a graduate program in biomedical science that provides linkages between the college and area scientists, such as those working with the National Cancer Institute (NCI) and the U.S. Army Medical Research Institute of Infectious Disease at Fort Detrick (USAMRIID). The Frederick Business Roundtable for Education supports rigorous education initiatives to best prepare Frederick students for twenty-first century jobs. Recent graduates and other job seekers are linked to jobs via programs offered through the Frederick County Business and Employment Center and Frederick County Workforce Services.
Additionally, the State of Maryland’s Higher Education Commission plans to study introducing a regional higher-education center in Frederick. The center, which was described in recent testimony by the Maryland Lieutenant Governor on BRAC-related infrastructure needs, would be created in order to support Fort Detrick.4
2.4 Land Uses Approximately half of the land within the City of Frederick (approximately 6,400 acres) is zoned for commercial/employment uses (including commercial, industrial, mixed use and institutional zoning categories). The remainder of the land is zoned for residential, open space and recreational uses, as illustrated in the following map. 4 “Lt. Governor Brown Testimony Before House Armed Services Committee, Subcommittee on Readiness: Implementation of the Base Realignment and Closure 2005 Decisions,” 12 December 2007; transcript available at: http://www.gov.state.md.us/ltgovernor/speeches/071212.html.

City of Frederick Office, Industrial & Flex/R&D Market Analysis
19
Commercial/Employment Uses in the City of Frederick Parcels Zoned for Commercial or Institutional Use, 2007
2.5 Position within Regional Economy Frederick is considered a submarket within the broader Washington, D.C. regional commercial real estate market. Like other Maryland communities, Frederick is a growth magnet for biotechnology industries as the home of Fort Detrick and the National Cancer Institute and serves as the northern anchor of the Interstate 270 biotech corridor.5 In addition to Frederick’s growing cluster of biotechnology firms, regional market experts cite Frederick’s skilled workforce and relative affordability (particularly when compared to Washington, DC) as key strengths. According to Don Schline, senior associate with real estate firm Manekin, LLC, “given its reasonable office rental rates and stable labor pool, Frederick has become the smart alternative for companies that want to bypass the backlashes of the D.C. marketplace.” Some companies in the region have taken advantage of the opportunity to open offices in Frederick to be closer to their employees’ homes. A spokeswoman from Lockheed Martin cited the “attractive housing opportunities in Frederick, the potential and significant reduction in commuting time and fuel costs for [employees] and [the] availability of Frederick County’s educated and highly skilled workforce” as key reasons behind the 2006 opening of a Frederick branch office for 110 employees (which is currently expected to grow to 500 employees).6 5 Maryland ranks third behind California and Massachusetts in terms of number of biotechnology companies, according to Ernst & Young. 6 Neil Adler, “Lockheed Martin to Open First Frederick Office,” 18 August 2006, Baltimore Business Journal
Source: The City of Frederick, BBPC, 2007
City of Frederick Office, Industrial & Flex/R&D Market Analysis
20
3 Office Market
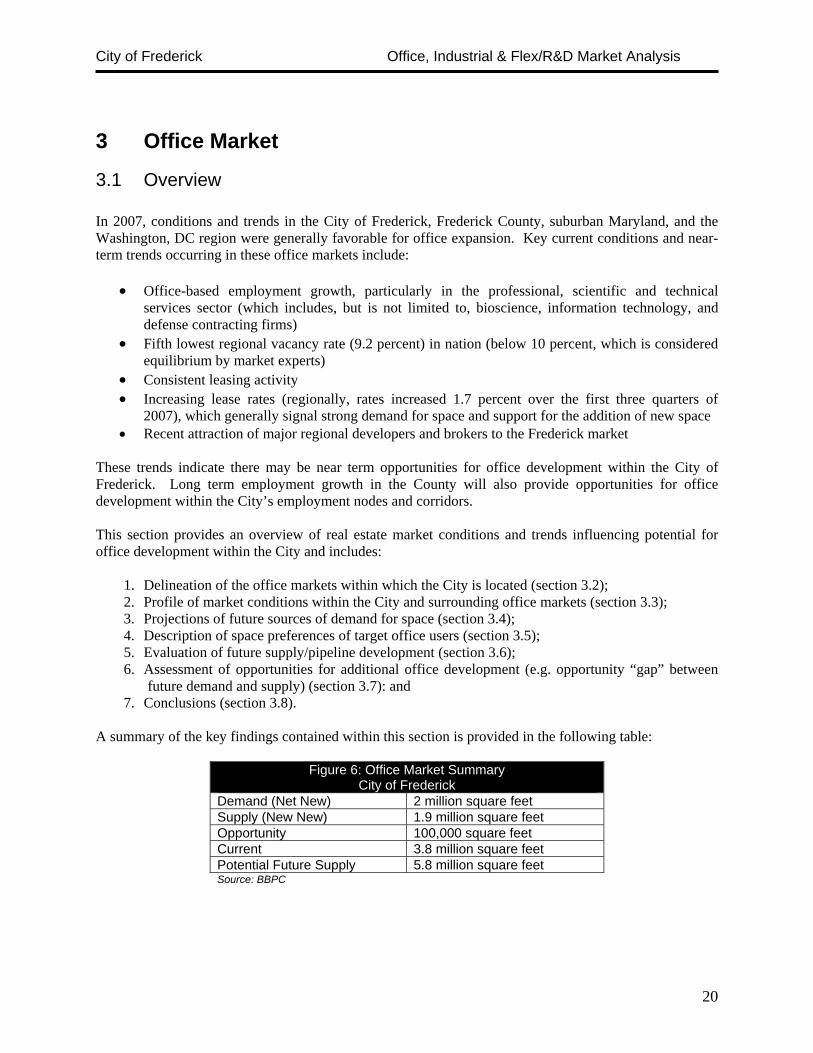
3.1 Overview In 2007, conditions and trends in the City of Frederick, Frederick County, suburban Maryland, and the Washington, DC region were generally favorable for office expansion. Key current conditions and near-term trends occurring in these office markets include:
• Office-based employment growth, particularly in the professional, scientific and technical services sector (which includes, but is not limited to, bioscience, information technology, and defense contracting firms)
• Fifth lowest regional vacancy rate (9.2 percent) in nation (below 10 percent, which is considered equilibrium by market experts)
• Consistent leasing activity • Increasing lease rates (regionally, rates increased 1.7 percent over the first three quarters of
2007), which generally signal strong demand for space and support for the addition of new space • Recent attraction of major regional developers and brokers to the Frederick market
These trends indicate there may be near term opportunities for office development within the City of Frederick. Long term employment growth in the County will also provide opportunities for office development within the City’s employment nodes and corridors. This section provides an overview of real estate market conditions and trends influencing potential for office development within the City and includes:
1. Delineation of the office markets within which the City is located (section 3.2); 2. Profile of market conditions within the City and surrounding office markets (section 3.3); 3. Projections of future sources of demand for space (section 3.4); 4. Description of space preferences of target office users (section 3.5); 5. Evaluation of future supply/pipeline development (section 3.6); 6. Assessment of opportunities for additional office development (e.g. opportunity “gap” between
future demand and supply) (section 3.7): and 7. Conclusions (section 3.8).
A summary of the key findings contained within this section is provided in the following table:
Figure 6: Office Market Summary City of Frederick
Demand (Net New) 2 million square feet Supply (New New) 1.9 million square feet Opportunity 100,000 square feet Current 3.8 million square feet Potential Future Supply 5.8 million square feet Source: BBPC

City of Frederick Office, Industrial & Flex/R&D Market Analysis
21
3.2 Market Area Definition The City of Frederick is situated within the suburban Maryland office market, one of three major office markets in the greater Washington, DC Metropolitan Area (the other two markets are the Northern Virginia and Washington, DC office markets).7 Twenty traditional office submarkets have been defined within suburban Maryland. These are clustered among three counties: Frederick, Montgomery, and Prince George’s. Frederick County is defined as one submarket. Montgomery includes nine submarkets: Germantown, Gaithersburg, North Rockville, Rockville, North Bethesda, Bethesda/Chevy Chase, Kensington/Wheaton, North Silver Spring/Rt. 29, and Silver Spring (the first five mentioned submarkets are clustered along the I-270 corridor). Prince George’s includes ten submarkets: Beltsville/Calverton, Bowie, Branch Avenue, College Park, Greenbelt, Lanham/Landover, Largo/Capital Heights, Laurel, Oxon Hill/Ft. Washington, and Penn Ave/Upper Marlboro.8
Metropolitan Washington DC Office Markets Washington, DC, Suburban Maryland, and Northern Virginia
Frederick Identified for Reference
7 The office submarket nomenclature and definitions are used by leading real estate market firms such as CB Richard Ellis and GVA Advantis. 8 An office submarket map for the Washington, DC metropolitan region is available via CB Richard Ellis’s research division at http://www.cbre.com/EN/Research/ (local reports section)
Source: ESRI Business Information Solutions, BBPC, 2007

City of Frederick Office, Industrial & Flex/R&D Market Analysis
22
3.3 Market Conditions & Comparison to Larger Markets Since trends occurring in the metropolitan Washington, DC region, suburban Maryland, and Frederick County influence the potential for office development within the City, each of these office markets has been analyzed to establish past trends and future outlook. Competitive nearby submarkets (e.g. Germantown, Gaithersburg, and North Rockville) have also been profiled for comparison. Figure 7 offers a “snapshot” of the current office market activity to provide an indication of how the City compares with the broader geographic markets of which it is a part. Total inventory of rentable office space in the City – which includes both tenant- and owner-occupied space – was approximately 3.8 million square feet in 2007, representing approximately 1 percent of the total 316.7 million square feet of rentable office space in the metro area, and 60 percent of the Frederick County 6.4 million square feet of rentable office space.
Figure 7: Metropolitan Washington, DC Office Markets (Second Quarter 2007)
Market Rentable Area (SF)
Direct Vacancy Rate (%)
Net Absorption YTD (SF)
Total Under Construction
(SF)
Average Lease Rate $ SF/YR
Class A City of Frederick (1/) 3,797,672 8.9% 458,574 12,000 N/A Frederick County (1/) 6,368,941 9.8% 471,855 285,900 $24.42 Germantown 2,606,416 9.4% 97,935 0 $24.13 Gaithersburg 2,963,327 16.2% (184,272) 0 $25.40 North Rockville 9,398,735 10.6% (54,958) 220,000 $25.44 Suburban Maryland 70,462,274 9.5% 192,973 1,875,967 $28.32 Metro Washington, DC 316,739,476 9.2% 3,049,497 13,592,149 $34.22 1/ Rentable area, direct vacancy, net absorption, and total under construction for Frederick County & the City of Frederick estimated using CoStar data. All other data provided by GVA Advantis. Source: CoStar©, GVA Advantis, BBPC, 2007
The 2007 vacancy rate in the City of Frederick (8.9 percent) is slightly lower than in Frederick County (9.8 percent), suburban Maryland (9.5 precent) and the metro region (9.2 percent). The City vacancy rate is also lower than in Germantown (9.4 percent), Gaithersburg (16.2 percent) and North Rockville (10.6 percent). Gaithersburg and North Rockville both exhibit higher than average vacancy rates due to a high level of recently delivered office space that has not yet been fully absorbed. The lower City vacancy rate indicates the supply of space is relatively tighter in the City than in nearby submarkets. Frederick County has traditionally offered lower office lease rates than other parts of the Washington, DC region. Average lease rates per square foot for Class A space in Frederick County ($24.42 per square foot per year) are relatively affordable compared to other areas in the region ($34.22 per square foot per year at the regional level).9 However, lease rates in Frederick County are slightly higher than in the Germantown submarket ($24.13 per square foot per year) and only slightly less than lease rates in Gaithersburg ($25.40 per square foot per year) and North Rockville ($25.44 per square foot per year). Lease rates in Germantown, Gaithersburg,
9 Average lease rates per square foot for Class A space was not available at the City level. However, the average lease rate for all types of space in the City was $21.72, according to data provided by CoStar.

City of Frederick Office, Industrial & Flex/R&D Market Analysis
23
and North Rockville have recently fallen due to relatively high levels of recent deliveries coupled with higher than average vacancy rates in these submarkets.
3.4 Projected Demand for Office Space Generally speaking, demand for office space is a function of employment growth – both through expansion of existing firms and recruitment of new industries. Job growth in the City of Frederick in recent years is a case in point. The City’s professional, scientific and technical services employment grew 130 percent from 2002 to 2007 with the addition of approximately 2,500 jobs. Over this time period, developers added roughly 800,000 square feet of new office space as a response to demand from the professional services as well as other office-based industries. Top industries that occupy office space in the City of Frederick, classified by North American Industry Classification System codes (NAICS codes), are:
• Professional, Scientific & Technical Services (NAICS 54) • Management (NAICS 55) • Administrative and Support Services (NAICS 56) • Information (NAICS 51) • Finance & Insurance (NAICS 52) • Real Estate, Rental and Leasing (NAICS 53) • Health Care & Social Services (NAICS 62) – in particular, offices of physicians, dentists, and
other medical practitioners (non-hospital) • Public Administration (NAICS 92) • Other Services (NAICS 81) – in particular, civic, professional and other organizations
Employment growth projections are best understood in the larger market context, since many new and expanding firms consider sites within both the City and County for (re)location. Projections for Frederick County identify a potential net addition of 13,900 new office-based jobs from 2007 to 2020.10 BBPC estimates that the City of Frederick could capture an estimated 60 percent of these jobs (similar to the City’s current share of office employment), for a net addition of 8,300 jobs over the next 13 years. This projected growth is assumed to include both net inflow of new jobs as well as growth of existing businesses. With an estimated 15,070 office-based employees and approximately 3.5 million square feet of occupied office space in 2007, the City of Frederick’s office market supplied roughly 240 square feet per office worker (including common areas). Applying this standard to the projected office employment growth of 8,300 new office workers yields a potential demand for roughly 2 million square feet of space in the City by 2020, or approximately 150,000 square feet per year. To test the reasonableness of this projected demand for space, BBPC evaluated recent trends in the delivery and absorption of new space. Actual levels of delivered and absorbed space are shown in the following chart, along with vacancy rates, for the period 2003 to 2007.
10 To project future office-based employment, BBPC used 2010 and 2020 projections for all County employment (including office-based and non office-based) provided by Frederick County and estimated future distribution of employment using occupational projections provided by the Maryland Department of Labor

City of Frederick Office, Industrial & Flex/R&D Market Analysis
24
Net Office Deliveries, Absorption & Vacancy Rates City of Frederick, 2003 to 2007
0.0%
2.0%
4.0%
6.0%
8.0%
10.0%
12.0%
14.0%
16.0%
‐300000
‐200000
‐100000
0
100000
200000
300000
400000
500000
600000
2003 2004 2005 2006 2007
Net Deliveries Net Absorption Vacancy Rate
From 2003 through 2007, net absorption of space in the City has averaged roughly 120,000 square feet per year. Delivery of new space over this time period was an estimated 205,000 square feet per year. Based on the recent levels of both absorption and delivery of new space, the projected future annual demand for 150,000 square feet of space, which falls within the 120,000 to 205,000 square foot range, thus appears reasonable.
3.5 Office Space Preferences of Target Users Understanding the needs and desires of office space occupants is an important step towards predicting what types of space will be most attractive to new and expanding firms. Preferences in terms of property type, size, land area, and other characteristics can vary by industry. In the City of Frederick, a variety of industries occupy office space – from realtors to government agencies – but the City’s expressed economic engines, which the City views as the key industries that drive demand for other supportive services (such as government, retail, real estate, etc.) are:
Source: CoStar, BBPC, 2007

City of Frederick Office, Industrial & Flex/R&D Market Analysis
25
• Bioscience; • Information technology; and • Services (including medical, financial, and professional & business services, which includes
defense contractors, engineering firms, architecture firms, and design firms). These industries share many preferences – the desire to locate near a highly-educated local workforce and to locate within clusters of industries offering similar products and services – and are a strong fit for the City, which offers the benefits of a skilled workforce and presence of Fort Detrick and National Cancer Institute as the northern anchor of the I-270 technology corridor. They are also projected to experience high levels of growth in the metropolitan Washington, DC economy and in Frederick. A summary of the top characteristics and preferences of firms likely to use office space in the City of Frederick, as gleaned from interviews with local stakeholders, information provided by the City, and property data is provided in the following table.
Figure 8: Space Preferences of Office Users City of Frederick
Property Type Building Space Size Land Area Variety of property types are popular: • Employment campuses with strong
industry clusters; • Downtown renovated spaces; • Stand-alone buildings with visible
address for large corporate tenants (e.g. Wells Fargo Home Mortgage)
Key features demanded: • Offices that offer specialized features
for bioscience, information technology, and defense contractors: lab space, SCIF space (sensitive compartmented information facility), and highly secure spaces (particularly for defense contractors)
• Green buildings (including LEED certified buildings)
• Location within mixed use environments
• Location near cultural & recreational offerings
• Creative & inspiring architecture (often historic & rehabilitated space)
• Some interest in ownership opportunities, as evidenced by trend in supply toward office condominium development (South Market Center, Glass Factory, etc.) as a minor portion of demand
Function of number of employees per firm; wide variety of sizes in City: • Median contiguous space was
2,500 in 2007 (indicating half of all occupants require small spaces less than 2,500 square feet)
• City includes several large office spaces (200k to 300k SF) for large employers: Wells Fargo (310,000 SF); United Healthcare (209,184 SF)
• In nearby Planning Region, Bechtel occupies an estimated 400,000 SF in five buildings
• Bioscience industry in particular varies widely in space needs per firm; recent graduates of FITCI reportedly sought 5,000 to 7,000 square feet, while large firms employing upwards of 1,000 workers can require over 200,000 to over 300,000 square feet
Median commercial parcel zoned DB, DO, or PB was 3,500 square feet (roughly 0.1 acres) Recent business prospects in the City sought from 250,000 to 350,000 square feet (5.7 to 8 acres) of land area; businesses that were expanding sought 80,000 to 100,000 square feet (1.8 to 2.3 acres)
Source: CoStar, The City of Frederick, BBPC Target tenants in the professional, scientific, and technical services category offer a number of preferences for office space. These preferences, which BBPC identified through evaluation of trends at the national level and local stakeholder input, include demand for buildings with a range of space options and flexibility for future expansion. In Frederick’s market, emerging bioscience or technology companies may initially demand less than 5,000 square feet of space, but rapidly outgrow these spaces. Frederick also attracts larger firms that can require over 200,000 to over 300,000 square feet. Buildings in campus

City of Frederick Office, Industrial & Flex/R&D Market Analysis
26
style arrangements that can offer flexible space configurations can thus appeal to this broad range of space requirements. These knowledge-based businesses also increasingly seek creative and inspiring architecture, which often takes the form of historic rehabilitated space. In Frederick, the Glass Factory, a renovated warehouse on East 4th Street, embodies this trend toward unique historic architecture. Future rehabilitation of older space, such as the Union Mills and Monocacy Valley Canning projects in Downtown have the potential to capitalize on this market. Amenity rich environments are another important selling point to knowledge-based businesses. Amenities can include building features, such as those commonly found in Class A buildings: unique shapes and floor plans, notable architectural designs, high quality materials and workmanship, excellent location and access, and professional management. Green building features, which are increasingly in demand at the national level for all commercial building types, are another key attraction because they provide both environmental and economic savings and enhance the company image of tenants. Green features can include green roofs, passive heating and cooling, use of pervious paving materials for parking lots, efficient water systems, enhanced indoor environmental quality, use of non-toxic and sustainable materials, and reuse of materials (such as historic properties). For defense contractors and high-technology businesses, specialized features such as SCIF space (Sensitive Compartmented Information Facility), enhanced security features (such as ingress and egress cameras), and lab facilities are also desirable (and often required) building features. Beyond building features, amenities within the surrounding contextual environment are important. Mixed use atmospheres, where workers can walk to retail shops and restaurants, are strong selling points to knowledge-based firms, as are cultural and recreational assets. Given the amenity-laden environment of Downtown Frederick, office space development should be focused within and around this hub – through both new infill development and rehabilitation of historic spaces.
3.6 Projected Supply: Development Activity Projects Under Construction
As of November 2007, one project (the Whittier Professional Center) was under construction in the City of Frederick representing 12,000 square feet. An additional 8 office projects representing 273,900 square feet were under construction in Frederick County at that time. Of the 9 projects in the City and County, only the Westview Corporate Center was pre-leased. The others were being built on a speculative basis, suggesting developers perceive demand in the Frederick market is strong enough to support speculative construction.

City of Frederick Office, Industrial & Flex/R&D Market Analysis
27
Figure 9: Office Development Projects Under Construction (as of November 2007)
Frederick County Submarket
Project Location Sq. Ft. Delivery Community
Whittier Professional Center Christopher Xing 12,000 2007 City of Frederick
Westview Corporate Center 5216 Chairmans Ct 14,000 2008 Planning Region
Conley Farm Bldg 1 Guilford Dr @ New Design Rd 39,600 2008 Planning Region
Conley Farm Bldg 2 Guilford Dr @ New Design Rd 32,400 2008 Planning Region
Conley Farm Bldg 3 Guilford Dr @ New Design Rd 39,600 2008 Planning Region
Westview South Bldg 1 - Phase I New Design Rd 43,400 2007 Planning Region
Westview South Bldg 2 - Phase I New Design Rd 43,400 2007 Planning Region
Westview South Bldg 3 - Phase I New Design Rd 34,500 2008 Planning Region
Westview South Bldg 4 - Phase I New Design Rd 27,000 2008 Planning Region
Whittier Professional Center Christopher Xing 12,000 2007 City of Frederick
TOTAL 285,900 TOTAL IN CITY 12,000
Source: CoStar, BBPC, 2007
Proposed Projects
As of November 2007, there were 28 office development projects representing over 4.6 million square feet proposed for construction in the City of Frederick and Frederick County. The office development project in the Villages of Urbana, which calls for 2 million square feet of space, is the largest single proposed project and accounts for approximately 43 percent of the total proposed inventory.
Twelve projects representing 1.9 million square feet were proposed for construction in the City of Frederick. One of the City projects (73-77 Thomas Johnson Drive) was planned with specific organizations committed as occupants, and three other projects located in the County were preleased. The remaining 24 projects are thus far proposed to be built under a speculative basis.

City of Frederick Office, Industrial & Flex/R&D Market Analysis
28
Figure 10: Office Development Projects Proposed (As of November 2007)
Frederick County Submarket
Project Location Sq. Ft. Delivery Community
Ballenger Center 327 Ballenger Center Dr 120,000 Unknown City of Frederick
McHenry Site - Opt 3 300 E Patrick St 80,388 Unknown City of Frederick
Riverside-5 8500 Progress Dr 120,000 2008 City of Frederick
73-77 Thomas Johnson Dr 73-77 Thomas Johnson Dr 80,000 Unknown City of Frederick
1 Commerce Center South East Street 109,000 2010
(Estimated) City of Frederick Frederick County Board of Education Building South East Street 100,000
2009 (Estimated) City of Frederick
COPT Thomas Johnson Drive 160,000 Unknown City of Frederick
Riverside Research Park* Riverside 900,000 2008 City of Frederick
Union Mills Carroll Creek 64,000 Unknown City of Frederick
Lots 256 R Riverside 150,000 Unknown City of Frederick
Monocacy Valley Canning South East Street 35,857 2009 City of Frederick
Westview Corporate Center 5205 Chairmans Ct 40,000 Unknown Planning Region
Westview Commons II Crestwood Blvd 65,000 Unknown Planning Region
Westview Commons II Crestwood Blvd 65,000 Unknown Planning Region
Westview South Bldg 5 - Phase II New Design Rd 66,000 Unknown Planning Region
Westview South Bldg 6 - Phase II New Design Rd 66,000 Unknown Planning Region
Westview South Bldg 7 - Phase II New Design Rd 34,500 Unknown Planning Region
Westview South Bldg 8 - Phase II New Design Rd 27,000 Unknown Planning Region
Westview South Bldg 9 - Phase II New Design Rd 27,000 Unknown Planning Region
Westview South Bldg 10 - Phase II New Design Rd 43,400 Unknown Planning Region
Westview South Bldg 11 - Phase II New Design Rd 34,500 Unknown Planning Region
Westview South Bldg 12 - Phase II New Design Rd 27,000 Unknown Planning Region
Westview South Bldg 13 - Phase III New Design Rd 66,000 Unknown Planning Region
Westview South Bldg 14 - Phase III New Design Rd 27,000 Unknown Planning Region
Westview South Bldg 15 - Phase III New Design Rd 43,400 Unknown Planning Region
Westview South Bldg 16 - Phase III New Design Rd 34,500 Unknown Planning Region
Kingsbrook Crossing 3 5316-5400 New Design Rd 18,200 2008 Planning Region
Villages of Urbana 3300-3399 Urbana Pike 2,000,000 Unknown Frederick County
TOTAL 4,603,745 TOTAL IN CITY 1,919,245
*Assumes half of Riverside Research Park is office space Source: CoStar, BBPC, 2007

City of Frederick Office, Industrial & Flex/R&D Market Analysis
29
Total Development Pipeline
In total, approximately 4.9 million square feet of new office development was under construction or proposed for construction in Frederick County as of November 2007. Approximately 41 percent (roughly 1.9 million square feet) of this development was under construction or proposed in the City of Frederick. In contrast, approximately 60 percent of the current Frederick County office inventory is located in the City of Frederick. This change in share of development is attributable to the 2 million square feet of office development planned at the Villages of Urbana, which will create a major new cluster of office space beyond City limits. This cluster is in accordance with Frederick County land use plans that have identified Urbana as a potential gateway to Frederick.
3.7 Opportunity Gap Assuming all of the office development projects under construction and proposed in the City are built as planned (and constructed by 2020), pipeline development (1.9 million square feet) will meet most future demand in the City but leave an opportunity for an additional 100,000 square feet to meet the total projected demand for 2 million square feet of office space from 2007 to 2020.
3.8 Conclusions Recent and projected trends in regional and immediate office market areas surrounding the City of Frederick indicate market demand for office development within the City, which supports projects in the pipeline. Employment growth in the County, coupled with interest from regional developers in the Frederick market, will support office expansion. Should the City realize its full projected growth in employment, there will be demand to support the 1.9 million square feet already in the development pipeline as well as an additional 100,000 square feet. The combined 2 million square feet (pipeline and opportunity development) would increase the City’s office space inventory from 3.8 million square feet to 5.8 million square feet – a 52 percent increase from 2007 to 2020 (an approximately 4 percent increase per year). This annual pace of growth is in line with employment growth projections for the City (based on projections at the County level); however, the rate of growth could be conservative if the City is able to accelerate its job growth through the recruitment of large tenants similar to Well Fargo Home Mortgage, United Healthcare, or Bechtel, each of which occupies over 200,000 square feet. An important factor influencing the City’s ability to recruit such large office-based firms is the ability of the City to offer an available supply of space for expansion through its land use policies. Additionally, the projected growth in employment could be conservative in that it may not take into account the spinoff employment impacts of the expansion of jobs at Fort Detrick and the National Cancer Institute. Spinoff job growth also could necessitate an expanded supply of space in the City to accommodate development. Trends and conditions in the City, County, suburban Maryland, and the Washington, DC region indicate there will be continued demand for office development in the Frederick market through 2020. These trends and conditions include:

City of Frederick Office, Industrial & Flex/R&D Market Analysis
30
• Office based employment growth in industries such as the professional, scientific, and technical
services sector (which includes bioscience, information technology, and defense contracting firms)
• Relatively low regional vacancy rates (fifth lowest in nation at 9.2 percent), and even lower City of Frederick vacancy rate (8.9 percent), indicative of relatively strong demand for space
• Increasing lease rates that indicate relatively strong demand for space (with the exception of decreasing rates in selected Montgomery County submarkets, where high levels of recent office deliveries and lagging absorption have pulled down lease rates and increased vacancy rates)
• Steady leasing activity throughout the region • Preference for smaller, multi-tenant properties in amenity-rich environments • Demonstrated developer interest in Frederick, including recent attraction of major regional
developers and brokers to the Frederick market • Traditional concentration of Frederick County office space within the City of Frederick • Modest interest from some firms in real estate ownership opportunities • Interest in locations proximate to the employment hub at Fort Detrick • Desire by many firms to reuse older properties or occupy new space on infill sites in Downtown
Frederick

City of Frederick Office, Industrial & Flex/R&D Market Analysis
31
4 Industrial Market
4.1 Overview Industrial market conditions and trends were positive in 2007 in the City of Frederick, Frederick County, suburban Maryland, and the Washington, DC region. Key current conditions and near-term trends occurring in these industrial markets include:
• Employment growth in industries likely to prefer industrial space, including bioscience and technology firms (many of which contain a manufacturing component), transportation, maintenance/installation, and construction industries
• Decreasing vacancy rates (7.6 percent in the Washington metropolitan region as of second quarter 2007 compared to 8.6 percent in second quarter 2006)
• Steadily increasing lease rates (increase of 1.9 percent in the Washington metropolitan region from mid 2006 to mid 2007)
• Relatively affordable lease rates (approximately $8 per square foot per year) compared to office space (~$34/SF/YR) and flex space (~$13/SF/YR) in Washington metropolitan region
• Recent attraction of major regional developers and brokers to the Frederick market (e.g. COPT, Matan, and Alexandria)
• Transitioning of the eastern area in and around Downtown Frederick from an industrial to mixed use area, which has prompted need for identification of new sites for industrial relocations
Based on these trends, there may be near term opportunities for industrial development within the City of Frederick. Long term employment growth in the County will also provide opportunities for industrial development within the City’s employment corridors and nodes. This section offers an overview of real estate market conditions and trends influencing potential for industrial development within the City and includes:
1. Delineation of the industrial markets within which the City is located (section 4.2); 2. Profile of market conditions within the City and surrounding industrial markets (section 4.3); 3. Projections of future sources of demand for space (section 4.4); 4. Description of space preferences of target industrial space users (section 4.5); 5. Evaluation of future supply/pipeline development (section 4.6); 6. Assessment of opportunities for additional industrial development (e.g. opportunity “gap”
between future demand and supply) (section 4.7); and 7. Conclusions (section 4.8).
A summary of the key findings contained within this section is provided in the following table:
Figure 11: Industrial Market Summary City of Frederick
Demand (Net New) 1.25 million square feet Supply (Net New) 700,000 square feet Opportunity 550,000 square feet Current 2.3 million square feet Potential Future Supply 3.55 million square feet Source: BBPC
City of Frederick Office, Industrial & Flex/R&D Market Analysis
32
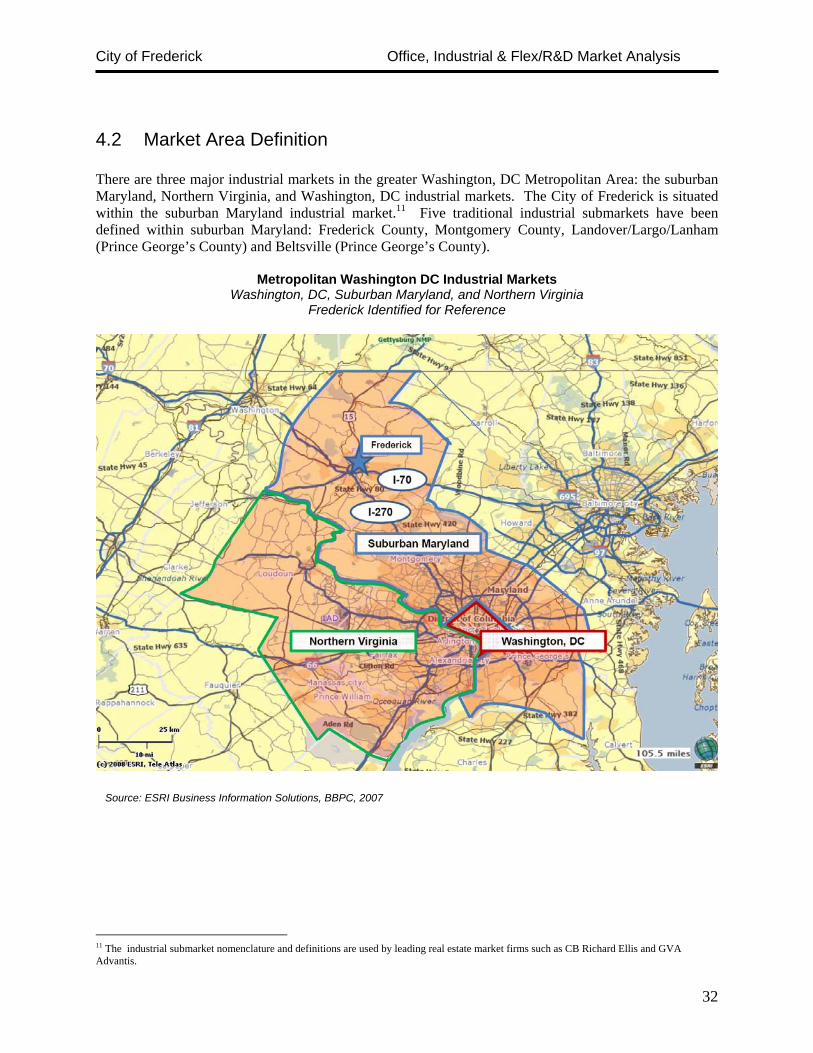
4.2 Market Area Definition There are three major industrial markets in the greater Washington, DC Metropolitan Area: the suburban Maryland, Northern Virginia, and Washington, DC industrial markets. The City of Frederick is situated within the suburban Maryland industrial market.11 Five traditional industrial submarkets have been defined within suburban Maryland: Frederick County, Montgomery County, Landover/Largo/Lanham (Prince George’s County) and Beltsville (Prince George’s County).
Metropolitan Washington DC Industrial Markets Washington, DC, Suburban Maryland, and Northern Virginia
Frederick Identified for Reference
11 The industrial submarket nomenclature and definitions are used by leading real estate market firms such as CB Richard Ellis and GVA Advantis.
Source: ESRI Business Information Solutions, BBPC, 2007

City of Frederick Office, Industrial & Flex/R&D Market Analysis
33
4.3 Market Conditions & Comparison to Larger Markets Prospects for industrial development in the City of Frederick are in part influenced by conditions occurring in surrounding markets; as such, conditions in the City and surrounding geographic areas have been profiled to establish current conditions and trends. Figure 12 offers a “snapshot” of the City of Frederick, Frederick County, Montgomery County, Prince George’s County, suburban Maryland and Metro Washington DC industrial markets. Total inventory of rentable industrial space in the City was approximately 2.3 million square feet in 2007, representing approximately 3 percent of the total 78.6 million square feet of rentable industrial space in the Washington metropolitan area. The City’s share of regional industrial space is three times higher than its share of regional office space. City industrial space comprised 34 percent of the Frederick County 6.8 million square feet of rentable industrial space.
Figure 12: Metropolitan Washington, DC Industrial Markets (Second Quarter 2007)
Market Rentable Area (SF)
Direct Vacancy Rate (%)
Net Absorption YTD (SF)
Total Under Construction
(SF) Average NNN
Rent City of Frederick (1/) 2,340,378 14.7% (20,898) 128,610 $10.17 Frederick County (1/) 6,822,997 7.6% (41,802) 352,640 $9.64 Montgomery 8,971,139 8.1% 39,152 0 $10.66 Prince George’s 23,638,103 10.4% 311,957 520,192 $5.87 Suburban Maryland 39,432,239 9.4% 309,307 872,832 $6.76 Metro Washington, DC 78,589,743 7.6% 455,486 1,963,744 $8.18 1/ Data for Frederick County & the City of Frederick estimated using CoStar data. All other data provided by GVA Advantis. Source: CoStar©, GVA Advantis, BBPC, 2007
The vacancy rate for industrial space in the City of Frederick (14.7 percent) is higher than in Frederick County (7.6 percent), suburban Maryland (9.4 precent) and the metro region (7.6 percent). The higher City vacancy is attributable to two properties with large vacancies: 200 Monroe Center (former Von Hoffman plant) and 1341 Hughes Ford Road (former Hartz manufacturing). The Monroe Center property was recently renovated, and has 139,000 square feet available (a portion of which was recently under lease to Frederick Community College); the Hughes Ford Road property has approximately 100,000 square feet available. Lease rates for Frederick County industrial spaces are comparable to those in other parts of the Washington, DC region. Average triple net lease rates in Frederick County were $9.64 per square foot per year in 2007, slightly lower than the City average ($10.17) and the Montgomery County average ($10.66). Frederick lease rates are higher than average lease rates in Prince George’s County ($5.87), suburban Maryland ($6.76) and the region ($8.18). The City of Frederick and Frederick County lease rates may be higher than those in the region because Frederick is a relatively newer market; the average building in the City of Frederick was built in around 1990, while many buildings in Prince George’s County (where rates are comparatively low) were built in the 1950s and 1960s.

City of Frederick Office, Industrial & Flex/R&D Market Analysis
34
4.4 Projected Demand for Industrial Space Growth of industrial employment, through both the recruitment of new firms as well as retention and expansion of existing businesses, is the primary determinant of demand for new industrial space. In the City of Frederick, expansion of the bioscience and advanced manufacturing industries has led to demand for new industrial space. For instance, growth at BP Solar has led the company to invest in a 140,000 square foot expansion facility that is currently under construction; growth of MedImmune has prompted the company to proceed with the planned expansion of two 300,000+ square foot facilities. Top industries that feed demand for industrial space in the City of Frederick, classified by North American Industry Classification System codes (NAICS codes), are:
• Construction (NAICS 23) • Manufacturing (NAICS 31-33) – includes bioscience manufacturing (e.g. research &
development in physical, engineering and life sciences, pharmaceutical & medicine manufacturing, etc.)
• Wholesale Trade (NAICS 42) • Transportation (NAICS 48) • Warehousing (NAICS 49)
Since many new and expanding firms consider sites within both the City and County for (re)location, BBPC analyzed industrial employment projections for Frederick County that include both the City and County. Projections for Frederick County identify a potential net addition of 8,300 new industrial-based jobs from 2007 to 2020. 12 BBPC estimates that the City of Frederick could capture an estimated 35 percent of these jobs (similar to the current proportion of County industrial employment in the City), for a net addition of 2,900 jobs over the next 13 years. This employment growth is assumed to include jobs created by newly recruited companies as well as organic growth of existing firms. Currently, the City of Frederick contains an estimated 4,626 industrial-based employees and approximately 2 million square feet of occupied industrial space, suggesting the City’s industrial market supplied roughly 430 square feet per employee in 2007 (including common areas). Applying this standard to the projected industrial employment growth of 2,900 new industrial workers yields a potential demand for roughly 1.25 million square feet of space in the City by 2020, or approximately 100,000 square feet per year. BBPC evaluated recent trends in the delivery and absorption of new space to test the reasonableness of this level of annual demand. Levels of delivered and absorbed space are shown in the following chart, along with vacancy rates, for the period 2003 to 2007.
12 To project future industrial-based employment, BBPC used 2010 and 2020 projections for all County employment (including industrial-based and non industrial-based) provided by Frederick County and estimated future distribution of employment using occupational projections provided by the Maryland Department of Labor

City of Frederick Office, Industrial & Flex/R&D Market Analysis
35
Net Industrial Deliveries, Absorption & Vacancy Rates City of Frederick, 2003 to 2007
0.0%
2.0%
4.0%
6.0%
8.0%
10.0%
12.0%
14.0%
16.0%
18.0%
20.0%
(300,000)
(200,000)
(100,000)
0
100,000
200,000
300,000
400,000
2003 2004 2005 2006 2007
Net Deliveries Net Absorption Vacancy Rate
From 2003 through 2007, net absorption of space in the City has averaged a negative 5,600 square feet per year, indicating spaces were vacated at a faster rate than new spaces occupied. The negative absorption in recent years may be attributable to the loss of industrial employers Hartz and Von Hoffman, which led to the influx of a high level of vacant space on Hughes Ford Road. Despite negative absorption in selected years, delivery of new space over this time period was an estimated 90,000 square feet per year, and should be high in 2007 with the addition of major developments built-to-suit for expanding firms such as MedImmune. Further, any relocation of existing City of Frederick industrial firms currently located Downtown to vacant industrial space elsewhere should bolster absorption in future years, assuming these businesses’ current spaces are reused for non-industrial purposes. For example, a number of industrial firms along the East Street corridor in the vicinity of the old Frederick Brickworks site have expressed interest in relocation. Their current space needs vary from as low as 5,000 building square feet up to over 100,000 square feet, and from an acre up to nearly ten acres. It is expected that such areas will be converted to mixed-use, retail, residential and office uses. Based on the recent levels of both absorption and delivery of new space, as well as the potential relocation of industrial firms, the projected future annual demand for 100,000 square feet of space (and total potential for 1.25 million square feet from 2007 to 2020) appears reasonable.
Source: CoStar, BBPC, 2007

City of Frederick Office, Industrial & Flex/R&D Market Analysis
36
4.5 Industrial Space Preferences of Target Users Key tenants that should be targeted as tenants of future industrial developments include those with projected employment growth, those that have been identified as priority industries by the City, and those with traditional preference for industrial spaces. These industries include:
• Bioscience (firms with manufacturing processes); and • Advanced manufacturing.
In selecting sites, firms in these industries generally seek those that offer proximity to both major transportation networks as well as the local labor force. For the bioscience and advanced manufacturing fields, access to highly educated employees is extremely important. The following table provides a summary of the top characteristics and preferences of firms likely to use industrial space in the City of Frederick, as gleaned from interviews with local stakeholders, information provided by the City, and property data.
Figure 13: Space Preferences of Industrial Users City of Frederick
Property Type Building Space Size Land Area Variety of property types are popular: • Industrial parks with strong industry
clusters • Renovated industrial spaces near
downtown for technology firms • Stand-alone buildings Key features demanded: • Primarily Medium & Large Floor
Plates (e.g. 25,000 SF to 50,000 SF and above)
• Larger Floor Plates on Larger Lots (Lot Coverage 35-40 percent)
• Deep Spaces (up to 500 feet) • Affordability Relative to Office Space • Circulation Space for Trucks • On-Site Parking for Trailers & Storage • Green Buildings • Proximity to Major Transportation
Networks and Employee Base
Often function of number of employees per firm and size required by manufacturing/production processes; wide variety of sizes in City: • Average industrial building is
approximately 40,000 square feet • City includes several large
industrial firms, including BP Solar (currently 157,483 square feet, with plans to add 140,000 square feet) MedImmune (currently 67,000 square feet, planning to add over 600,000 square feet), and Aldi (roughly 450,000 square feet)
• Bioscience industry varies widely in space needs per firm; recent graduates of FITCI reportedly sought 5,000 to 7,000 square feet, while large firms employing upwards of 1,000 workers can require over 200,000 to over 300,000 square feet
Average land area per industrial property (e.g. zoned M1, M2 or MO) was approximately 45,000 square feet (1 acres) Recent manufacturing, warehouse, and other industrial business prospects in the City sought from 200,000 to 550,000 square feet of land area (4.6 to 12.6 acres); businesses that were expanding sought 600,000 to over 1,000,000 square feet (13.8 to 23 acres)
Source: CoStar, The City of Frederick, BBPC

City of Frederick Office, Industrial & Flex/R&D Market Analysis
37
The target tenants for industrial space include companies seeking building features not offered in flex/R&D or office developments. These can include larger floor plates (e.g. 25,000 SF to 50,000 SF and up); larger lots (with lot coverage of approximately 35 to 40 percent); deep spaces (up to 500 feet); higher ceilings; affordability relative to office space; circulation space for trucks; and on-site parking for trailers and storage. Green building features are becoming more important to industrial tenants – particularly for those occupying large buildings that operate on a 24-hour-a-day, 7-day-a-week schedule and demand stronger lighting efficiency and better indoor climate quality for employees. As an example, BP Solar plans to incorporate LEED (Leadership in Energy and Environmental Design) design features within its planned manufacturing facility. Sustainable elements, including a green roof, water recycling and bio-retention features, and energy-efficient heating, cooling and lighting are planned.
4.6 Projected Supply: Development Activity Projects Under Construction
As of November 2007, there were three industrial development projects representing approximately 650,000 square feet under construction in the City of Frederick: the 140,000 square foot expansion facility of BP Solar, the 379,000 square foot expansion of MedImmune, and a 130,000 square foot industrial building on Tilco Drive. An additional two projects were underway in Frederick County for a total of nearly 900,000 square feet when combined with the City projects.
Figure 14: Industrial Development Projects Under Construction (as of November 2007)
Frederick County Submarket
Project Location Sq. Ft. Delivery Community
BP Solar Expansion Solarex Court 140,000 2009 City of Frederick
MedImmune Expansion 660 Research Dr 379,000 Unknown City of Frederick
1539 Tilco Dr 1539 Tilco Dr 128,610 2007 City of Frederick
Wellington 1 New Design Rd 172,030 2007 Planning Region
Winchester Blvd Winchester Blvd 52,000 2008 Frederick County
TOTAL 871,640
TOTAL IN CITY 647,610 Source: CoStar, BBPC, 2007
Proposed Projects
There were two projects proposed in the City of Frederick representing nearly 70,000 square feet and 17 percent of all projects proposed in Frederick County as of November 2007.

City of Frederick Office, Industrial & Flex/R&D Market Analysis
38
Figure 15: Industrial Development Projects Proposed (as of November 2007)
Frederick County Submarket
Project Location Sq. Ft. Delivery Community
270 Interstate Circle 270 Interstate Circle 43,000 2008 City of Frederick
Reichs Ford Rd Reichs Ford Rd 24,500 Unknown City of Frederick
Stanford Trading Center IV, BldgA 3954 Dartmouth Ct 30,404 Unknown Frederick County
Geoffrey Way Geoffrey Way 137,500 Unknown Frederick County
Wedgewood North Bldg 1 4905 International Blvd 12,800 2008 Frederick County
Wedgewood North Bldg 2 4905 International Blvd 12,800 2008 Frederick County
Wedgewood North Bldg 3 4905 International Blvd 12,900 2008 Frederick County
Wedgewood North Bldg 4 4905 International Blvd 12,000 2008 Frederick County
Frederick Distribution Center 3500-3599 New Design Rd 100,000 Unknown Frederick County
TOTAL 385,940
TOTAL IN CITY 67,500
Source: CoStar, BBPC, 2007 Total Development Pipeline
As of November 2007, approximately 700,000 square feet of new industrial development was under construction or proposed for construction in the City of Frederick, and a total of 1.3 million in the City and County combined. Projects located in the City represented over half of this total pipeline, led by the expansion of MedImmune.
4.7 Opportunity Gap Pipeline projects in the City currently total 700,000 square feet. With a projected demand for 1.25 million square feet, there is an opportunity for additional development in the realm of 550,000 square feet to accommodate unmet projected demand for space.
4.8 Conclusions Trends and conditions in regional and immediate industrial market areas surrounding the City of Frederick indicate market potential for industrial development within the City. Employment growth in the County, coupled with interest from regional developers in the Frederick market, will support industrial expansion – albeit at a lower level than the projected level of office and flex development in the City. BBPC estimates that employment growth (based on future projections and recent trends in absorption) could stimulate demand for an additional 550,000 square feet above and beyond the 700,000 square feet already in the development pipeline. Such development (both the 700,000 square feet in the pipeline and

City of Frederick Office, Industrial & Flex/R&D Market Analysis
39
the additional 550,000 square feet) will increase the City’s industrial space inventory from 2.3 million square feet to roughly 3.6 million square feet. Therefore, future development could increase the City’s industrial space inventory by 57 percent (a 4 percent increase per year). Market trends and conditions in the City, County, suburban Maryland, and the Washington, DC region support industrial development in the Frederick market through 2020. These trends and conditions include:
• Industrial based employment growth, including bioscience and technology firms (many of which include a manufacturing component), transportation, maintenance/installation, and construction industries
• Decreasing vacancy rates at the regional level (7.6 percent regionally as of second quarter 2007 compared to 8.6 one year prior)
• Higher vacancy rates in the City of Frederick compared to Frederick County, attributable to a few properties with large vacancies that were recently renovated (suggesting the higher vacancy rates are likely not a long-term trend but reflect an anomaly)
• Steadily increasing lease rates at the regional level indicative of relatively strong demand for space
• Relatively affordable space compared to office and flex spaces in the region • Preference for consolidated distribution centers and low, narrow industrial buildings • Demonstrated developer and broker interest in the Frederick market
Overall, the City offers opportunities for industrial expansion. However, certain conditions in the City – limited land supply, relative cost of land, narrow streets (in Downtown) and constrained water supply – could reduce opportunities for selected types of industrial users. Given these constraints, the expansion of industrial activity in the City should focus on those industries offering a higher density of employment per square foot, diminished need for truck transportation (particularly for sites near Downtown), and low water consumption.

City of Frederick Office, Industrial & Flex/R&D Market Analysis
40
5 Flex/R&D Market
5.1 Overview Market conditions and trends in the Washington, DC metropolitan area, suburban Maryland, Frederick County, and the City of Frederick were positive in 2007, and supportive of flex development in the near term. Key current conditions and term trends occurring in these flex markets include:
• Employment growth in industries that may favor flex space, including bioscience and technology firms (some of which may require spaces equipped for manufacturing operations)
• Decreasing vacancy rates (10.9 percent regionally, lower than the 13 percent vacancy rate in 2006 and closer to the equilibrium rate of 10 percent)
• Increasing lease rates (1.5 percent increase over past three quarters) • Net absorption increasing in response to pre-leasing and steady leasing activity • Shift of some traditional office tenants to flex spaces in response to increasing office lease rates
and relatively affordable flex rates • Recent attraction of major regional developers and brokers to the Frederick market
These conditions and trends are conducive to flex development within the City of Frederick, which should also benefit from long term employment growth in the County in industries likely to consider flex space as an alternative to traditional office spaces. This section provides an overview of real estate market conditions and trends influencing potential for flex development within the City and includes:
1. Delineation of the flex markets within which the City is located (section 5.2); 2. Profile of market conditions within the City and surrounding flex markets (section 5.3); 3. Projections of future sources of demand for space (section 5.4); 4. Description of space preferences of target flex space users (section 5.5); 5. Evaluation of future supply/pipeline development (section 5.6); 6. Assessment of opportunities for additional flex development (e.g. opportunity “gap” between
future demand and supply) (section 5.7); and 7. Conclusions (section 5.8).
A summary of the key findings contained within this section is provided in the following table:
Figure 16: Flex Market Summary City of Frederick
Demand (Net New) 2.56 million square feet Supply (Net New) 1.2 million square feet Opportunity 1.4 million square feet Current 1.5 million square feet Potential Future Supply 4.1 million square feet Source: BBPC
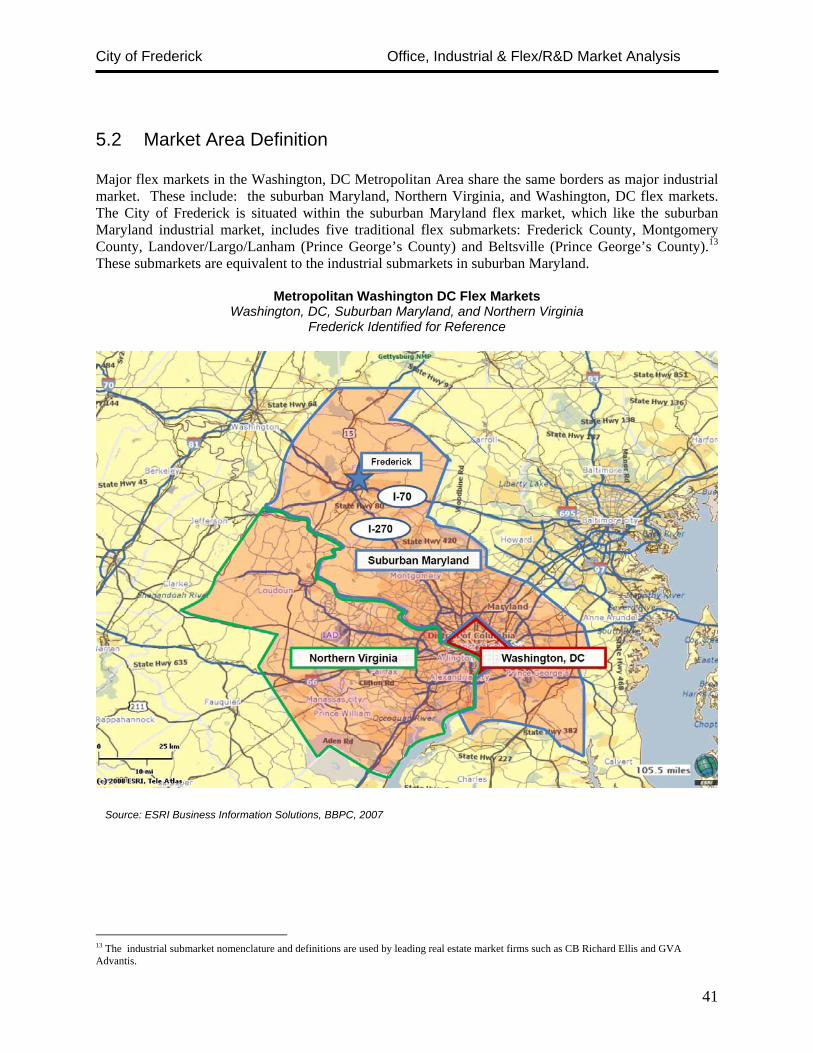
City of Frederick Office, Industrial & Flex/R&D Market Analysis
41
5.2 Market Area Definition Major flex markets in the Washington, DC Metropolitan Area share the same borders as major industrial market. These include: the suburban Maryland, Northern Virginia, and Washington, DC flex markets. The City of Frederick is situated within the suburban Maryland flex market, which like the suburban Maryland industrial market, includes five traditional flex submarkets: Frederick County, Montgomery County, Landover/Largo/Lanham (Prince George’s County) and Beltsville (Prince George’s County).13 These submarkets are equivalent to the industrial submarkets in suburban Maryland.
Metropolitan Washington DC Flex Markets Washington, DC, Suburban Maryland, and Northern Virginia
Frederick Identified for Reference
13 The industrial submarket nomenclature and definitions are used by leading real estate market firms such as CB Richard Ellis and GVA Advantis.
Source: ESRI Business Information Solutions, BBPC, 2007

City of Frederick Office, Industrial & Flex/R&D Market Analysis
42
5.3 Market Conditions & Comparison to Larger Markets To place trends and characteristics of the City of Frederick flex market into context, key market features of surrounding geographic areas has been profiled in order to establish current conditions and provide a basis for comparison. Figure 17 offers a “snapshot” of current flex market conditions in the City, Frederick County, Montgomery and Prince George’s Counties, suburban Maryland, and metropolitan Washington, DC. Existing flex developments represented approximately 1.5 million square feet in the City in 2007, comprising approximately 3 percent of the total 51.3 million square feet in the region. This 3 percent share is equivalent to the City’s share of regional industrial space and three times higher than the City’s share of regional office space. The City’s 1.5 million square feet represented approximately 30 percent of the County’s flex inventory (approximately 4.9 million square feet) – lower than the City’s share of County industrial space (34 percent) and office space (60 percent).
Figure 17: Metropolitan Washington, DC Flex Markets (Second Quarter 2007)
Market Rentable Area (SF)
Direct Vacancy Rate (%)
Net Absorption YTD (SF)
Total Under Construction
(SF) Average NNN
Rent City of Frederick (1/) 1,474,547 12.8% 2,698 189,200 $10.24 Frederick County (1/) 4,888,853 10.9% (59,205) 271,677 $10.92 Montgomery 11,552,602 7.8% 17,865 0 $16.08 Prince George’s 8,509,723 10.4 231,978 196,206 $10.57 Suburban Maryland 24,951,178 9.2% 190,638 467,883 $13.20 Metro Washington, DC 51,335,046 10.9% 214,834 1,019,312 $13.53 1/ Data for Frederick County & the City of Frederick estimated using CoStar data. All other data provided by GVA Advantis. Source: CoStar©, GVA Advantis, BBPC, 2007
The vacancy rate in the City of Frederick (12.8 percent) is slightly higher than in Frederick County (10.9 percent), suburban Maryland (9.2 precent) and the metro region (10.9 percent). The City vacancy rate is also higher than in Montgomery County (7.8 percent) and Prince George’s (10.4 percent). Average lease rates for flex space (on a triple net basis) in the City of Frederick ($10.24 per square foot per year) were comparable to the County ($10.92) and lower than in suburban Maryland ($13.20), the region ($13.53), Montgomery ($16.08) and Prince George’s ($10.57) in 2007.
5.4 Projected Demand for Flex/R&D Space In the City of Frederick, the red-hot expansion of employment of the bioscience and advanced manufacturing industries – much of which has spun off from contracts with Fort Detrick (the contractor database totals 1,000 interested firms) – has led to new demand for industrial spaces. The Riverside Research Park, a research and development employment campus offering 1.8 million square feet of flex industrial/R&D space on 121 acres, has been one area benefitting from the spinoff demand for secure and flexible space prompted by the growth of Fort Detrick contractors.

City of Frederick Office, Industrial & Flex/R&D Market Analysis
43
Flex and industrial spaces generally accommodate similar industries, so the industries that drive demand for industrial space in the City of Frederick also spur demand for flex space. These industries, classified by North American Industry Classification System codes (NAICS codes), are:
• Construction (NAICS 23) • Manufacturing (NAICS 31-33) – includes bioscience manufacturing (e.g. research &
development in physical, engineering and life sciences, pharmaceutical & medicine manufacturing, etc.)
• Wholesale Trade (NAICS 42) • Transportation (NAICS 48) • Warehousing (NAICS 49)
With a high degree of interrelationships between the City and County economies, many expanding and new firms consider sites in both geographic areas for (re)location. As such, BBPC evaluated flex-based employment projections at the County level to understand the broad parameters shaping demand. Projections for Frederick County identify a potential net addition of 11,700 new flex-based jobs from 2007 to 2020. 14 BBPC estimates that the City of Frederick could capture an estimated 55 percent of these jobs (based on the City’s growing share of flex space in the County), for a net addition of 6,400 jobs over the next 13 years. Employment growth resulting from expansion of existing firms as well as new firms is included in this figure. The City of Frederick contained an estimated 3,244 flex-based employees in 2007 and approximately 1.3 million square feet of occupied flex space, suggesting the City’s flex market supplied roughly 400 square feet per employee in 2007 (including common areas). Applying this standard to the projected addition of 6,400 new potential flex workers translates into demand for roughly 2.56 million square feet of space in the City by 2020, or approximately 200,000 square feet per year. BBPC analyzed recent trends in the absorption and delivery of flex space to assess whether this projected annual demand based on employment projections is reasonable. The chart on the following page illustrates recent levels of delivered and absorbed space along with vacancy rates for 2003 to 2007.
From 2003 through 2007, net absorption of space in the City has averaged roughly 90,000 square feet per year (with some years absorption near 150,000 square feet per year). Delivery of new space over this time period was an estimated 120,000 square feet per year. Given the significantly higher levels of absorption and deliveries from 2003 to 2007, the projected annual demand for 200,000 square feet annually (and 2.56 million square feet from 2007 to 2020) appears possible, particularly in light of the expansions of bioscience firms likely to demand flex/R&D space.
14 To project future flex-based employment, BBPC used 2010 and 2020 projections for all County employment (including flex-based and non flex-based) provided by Frederick County and estimated future distribution of employment using occupational projections provided by the Maryland Department of Labor

City of Frederick Office, Industrial & Flex/R&D Market Analysis
44
Net Flex Deliveries, Absorption & Vacancy Rates City of Frederick, 2003 to 2007
0.00%
2.00%
4.00%
6.00%
8.00%
10.00%
12.00%
14.00%
16.00%
18.00%
20.00%
0
50,000
100,000
150,000
200,000
250,000
2003 2004 2005 2006 2007
Net Deliveries Net Absorption Vacancy Rate
5.5 Flex/R&D Space Preferences of Target Users Flex/R&D space, with its inherent flexibility to accommodate different types of tenants, often attracts a hybrid mix of traditional office-based and industrial-based businesses. Thus, target tenants include both traditional office-based and industrial-based businesses projected to grow at relatively high levels in the Washington, DC region and Frederick County. These industries include:
• Bioscience (particularly those engaged in research and development); • Information technology; and • Defense contracting.
Source: CoStar, BBPC, 2007

City of Frederick Office, Industrial & Flex/R&D Market Analysis
45
In selecting sites, firms in these industries share many of the preferences identified among their office and industrial counterparts, including proximity to major transportation networks and the local labor force. The following table provides a summary of the top characteristics and preferences of firms likely to use flex space in the City of Frederick, as gleaned from interviews with local stakeholders, information provided by the City, and property data.
Figure 18: Space Preferences of Flex Users City of Frederick
Property Type Building Space Size Land Area Variety of property types are popular: • Research campuses and industrial
parks with strong industry clusters • Downtown rehabilitated/renovated
spaces • Stand-alone buildings Key features demanded: • Range of Spaces/Flexibility: Small
(<5,000 SF) to Large (>50,000 SF) • Flexible Interior Space Configurations
& Expansion Options • SCIF space (Sensitive
Compartmented Information Facility) • Affordability Relative to Office Space • Larger Floor Plates • Secure Spaces (e.g. Cameras at
Ingress & Egress Points) • Ample Parking & Circulation Space
for Trucks • Lab Space • High Portion of Office Space (25 to 80
percent) • High Curb Appeal • Green Buildings • Proximity to Transportation Network &
Employee Base • Environmentally Conditioned Space
(Heating/Cooling is Required by Many Federal Contracts)
Often function of number of employees per firm and size required by manufacturing/production processes; wide variety of sizes in City: • Average industrial building is
approximately 28,000 square feet • City includes several large flex,
including SeraCare Bioservices (65,000 square feet) and Charles River Laboratories (50,000 square feet)
• Bioscience industry varies widely in space needs per firm; recent graduates of FITCI reportedly sought 5,000 to 7,000 square feet, while large firms employing upwards of 1,000 workers can require over 200,000 to over 300,000 square feet
Median land area per flex property (e.g. zoned M1, M2, MO, or MXE) was roughly 50,000 square feet (1.1 acres) Desired land area of prospective and expanding firms varied based on recent requests: • Recent manufacturing,
warehouse, and other industrial business prospects in the City sought from 200,000 to 550,000 square feet (4.6 to 12.6 acres) of land area
• Prospective firms seeking lab/office combinations sought 350,000 to nearly 900,000 square feet (8 to 21 acres)
• Businesses that were expanding sought 50,000 to over 1,000,000 square feet (1.1 to 23 acres)
Source: CoStar, The City of Frederick, BBPC Tenants often choose flex/R&D spaces because of their flexible space configurations and future expansion options. Accordingly, buildings or projects with a range of potential space options, from small (e.g. <5,000 square feet) to large (e.g. >50,000 square feet) are attractive product types. Such a variety of space options can accommodate newly graduated (but still often small) firms from FITCI (which on average are reported to require 5,000 to 7,000 square feet upon graduation) up to well-established and expanding firms in Frederick. Another top selling feature of flex/R&D space in the metro region and local Frederick market has been the relative affordability of space compared to office spaces, which appeals to cost-conscious tenants. Ample parking and circulation space for trucks are also desirable features. Target tenants generally prefer flex/R&D spaces offering high proportions of space designed for office or showroom space (e.g. 25 to 80 percent), and high curb appeal. Specialized features including security measures (e.g. cameras at ingress and egress points), SCIF space (sensitive compartmented information

City of Frederick Office, Industrial & Flex/R&D Market Analysis
46
facility), and lab space are also highly desirable to selected defense contractors, bioscience, and information technology firms. Finally, as is occurring in the office and industrial markets, the flex market is “going green.” Energy and resource saving features are becoming more common in new flex/R&D developments around the nation, as tenants embrace the long-term cost savings associated with efficient, environmentally-friendly design.
5.6 Projected Supply: Development Activity Projects Under Construction
There were three flex development projects under construction in the City of Frederick as of November 2007 representing roughly 190,000 square feet, or 70 percent of all the flex development under construction in the County. The planned City developments were focused in and around the Riverside development.
Figure 19: Flex Development Projects Under Construction (as of November 2007)
Frederick County Submarket
Project Location Sq. Ft. Delivery Community
Riverside Tech. Park Bldg A 8420 Gas House Pike 93,360 2007 City of Frederick
PEBC No. 4 99 Monocacy Blvd 11,600 2007 City of Frederick
Riverside Tech. Park Bldg D 8435 Progress Dr 84,240 2008 City of Frederick
Ballenger Commerce Ctr III 4907 International Blvd 50,900 2007 Frederick County
McKinney Commerce Center 4537 Metropolitan Ct 31,577 2008 Frederick County
TOTAL 271,677 TOTAL IN CITY 189,200
Source: CoStar, BBPC, 2007
Proposed Projects
As of November 2007 there were four flex development projects representing roughly 1 million square feet proposed in the City of Frederick. These projects represented about 83 percent of the County’s total proposed flex projects (including those in the City) – the majority of which was proposed under the Riverside Research Park development in the City (1,800,000 million square feet, of which half is assumed to be flex and half office).

City of Frederick Office, Industrial & Flex/R&D Market Analysis
47
Figure 20: Flex Development Projects Proposed (as of November 2007)
Frederick County Submarket
Project Location Sq. Ft. Delivery Community
Monocacy Center East - Bldg 3 Bowmans Farm Rd 30,600 2007 City of Frederick
Monocacy Center East - Bldg 4 Bowmans Farm Rd 30,600 2007 City of Frederick
Riverside Research Park* Gas House Pike @ Monocacy Blvd 900,000 2008 City of Frederick
Riverside Tech. Park Bldg B 8430 Gas House Pike 87,240 Unknown City of Frederick
Stanford Trading Center IV, BldgB 3950 Dartmouth Ct 8,000 Unknown Frederick County
McKinney Business Center 1 4450 Georgia Pacific Blvd 24,250 Unknown Frederick County
McKinney Business Center 2 4450 Georgia Pacific Blvd 29,000 Unknown Frederick County
McKinney Business Center 3 4450 Georgia Pacific Blvd 49,500 Unknown Frederick County
7311 Governor's Way 7311 Governor's Way 30,000 Unknown Frederick County
Stanford Trading Center III 4780 Winchester Blvd 67,312 Unknown Frederick County TOTAL 1,256,502
TOTAL IN CITY 1,048,440*Assumes half of Riverside Research Park is office space Source: CoStar, BBPC, 2007
Total Development Pipeline
In total, approximately 1.2 million square feet of new flex development was under construction or proposed for construction in the City of Frederick as of November 2007. This level of development represented approximately 81 percent of the total development in the pipeline for the City and County combined. In comparison, only 30 percent of the current Frederick County flex inventory is located in the City of Frederick. Pipeline development projects therefore represent a major shift in flex development locations into the City.
5.7 Opportunity Gap Flex developments under construction or proposed in the City of Frederick currently represent 1.2 million square feet. Assuming these pipeline developments are constructed by 2020, they will meet roughly 47 percent of the total potential demand for 2.56 million square feet by 2020, presenting an opportunity for an additional 1.4 million square feet of flex space.
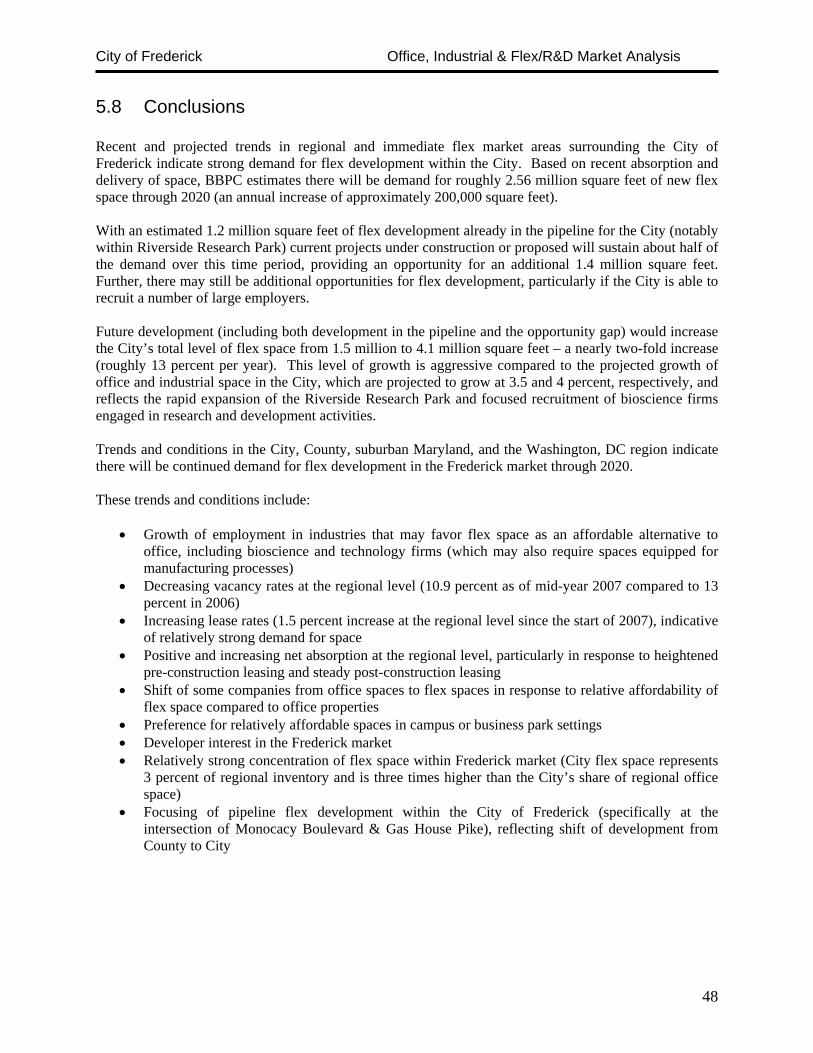
City of Frederick Office, Industrial & Flex/R&D Market Analysis
48
5.8 Conclusions Recent and projected trends in regional and immediate flex market areas surrounding the City of Frederick indicate strong demand for flex development within the City. Based on recent absorption and delivery of space, BBPC estimates there will be demand for roughly 2.56 million square feet of new flex space through 2020 (an annual increase of approximately 200,000 square feet). With an estimated 1.2 million square feet of flex development already in the pipeline for the City (notably within Riverside Research Park) current projects under construction or proposed will sustain about half of the demand over this time period, providing an opportunity for an additional 1.4 million square feet. Further, there may still be additional opportunities for flex development, particularly if the City is able to recruit a number of large employers. Future development (including both development in the pipeline and the opportunity gap) would increase the City’s total level of flex space from 1.5 million to 4.1 million square feet – a nearly two-fold increase (roughly 13 percent per year). This level of growth is aggressive compared to the projected growth of office and industrial space in the City, which are projected to grow at 3.5 and 4 percent, respectively, and reflects the rapid expansion of the Riverside Research Park and focused recruitment of bioscience firms engaged in research and development activities. Trends and conditions in the City, County, suburban Maryland, and the Washington, DC region indicate there will be continued demand for flex development in the Frederick market through 2020. These trends and conditions include:
• Growth of employment in industries that may favor flex space as an affordable alternative to office, including bioscience and technology firms (which may also require spaces equipped for manufacturing processes)
• Decreasing vacancy rates at the regional level (10.9 percent as of mid-year 2007 compared to 13 percent in 2006)
• Increasing lease rates (1.5 percent increase at the regional level since the start of 2007), indicative of relatively strong demand for space
• Positive and increasing net absorption at the regional level, particularly in response to heightened pre-construction leasing and steady post-construction leasing
• Shift of some companies from office spaces to flex spaces in response to relative affordability of flex space compared to office properties
• Preference for relatively affordable spaces in campus or business park settings • Developer interest in the Frederick market • Relatively strong concentration of flex space within Frederick market (City flex space represents
3 percent of regional inventory and is three times higher than the City’s share of regional office space)
• Focusing of pipeline flex development within the City of Frederick (specifically at the intersection of Monocacy Boulevard & Gas House Pike), reflecting shift of development from County to City

City of Frederick Office, Industrial & Flex/R&D Market Analysis
49
6 Commercial Land Capacity Analysis
6.1 Overview Recent trends in the office, flex, and industrial markets, as well as future forecasted employment growth, suggest there will be strong demand for future expansion of commercial space in the City of Frederick. The availability of land zoned for commercial use will be a major determinant of how much of this demand is funneled within City boundaries. To support a healthy real estate market, BBPC recommends that the City maintain a supply of land zoned for commercial use that is approximately two to three times higher than projected demand. This ratio would enable the City to accommodate the high level of development already in the pipeline, the additional development opportunities presented by projected employment growth, and respond flexibly to future opportunities that may not have been captured in BBPC’s projections of future demand. BBPC evaluated the City’s commercial land capacity by analyzing two types of land: unimproved (e.g. those with no building improvements) and underutilized (parcels that currently contain buildings, but could hold significantly more commercial space – in terms of both size and value). This evaluation is not without its limitations. The analysis is a “snapshot” in time, meaning that it may not necessarily reflect changes in development activity that has occurred since November 2007. Further, the broad-level assessment includes many assumptions about the potential use of land (for instance, that 60 percent of each parcel is buildable) that may not accurately reflect conditions on a site-by-site basis (e.g. environmental constraints, irregularities in parcel shape that make development difficult, etc.). For these reasons, a more accurate method would include analysis of each and every parcel’s capacity and constraints. Such evaluation is beyond the scope of this analysis, which rather aims to understand the broader potential capacity of the parcels of a group.
6.2 Findings As of November 2007, there were over 20,000 parcels in the City of Frederick representing roughly 12,000 acres and $6.4 billion in total assessed value. Approximately 28 percent of this land (3,300 acres) is zoned for commercial uses (including commercial, industrial, and mixed use zoning categories, but excluding institutional). The remainder of the land (roughly 8,700 acres) is zoned for residential, open space, recreational, and institutional uses. Total assessed value of commercial parcels as of November 2007 was an estimated $1.3 billion, representing approximately 21 percent of the City’s total assessed value (estimated at $6.4 billion). The following chart illustrates how BBPC classified the City’s commercial parcels in order to identify parcels with capacity for new commercial space using the following four-step process:
1. Parcels were broken out by improvement status; 2. Unimproved parcels were broken out by status of development plans; and 3. Improved parcels were identified as underutilized or not. 4. Underutilized parcels were broken out by status of development plans.

City of Frederick Office, Industrial & Flex/R&D Market Analysis
50
Parcel Classification Process
Total Commercially Zoned Acres: 3,300
(144 M SF)
Unimproved Acres: 989 (43 M SF)
With No Development Plans (Acres): 618 (27
M SF)
With Development Plans (Acres): 371 (16
M SF)
Improved Acres: 2,311 (101 M SF)
Underutilized Acres: 623 (27 M SF)
With No Development Plans/Recent
Development (Acres): 209 ( 9.1 M SF)
With Development Plans (Acres): 414 (18
M SF)
Non- Underutilized Acres: 1,688 (74 M
SF)
Unimproved Parcels Of the 3,300 commercially-zoned acres, a total of 989 acres (30 percent of total acres) within 90 parcels were unimproved in 2007, as identified by the City of Frederick. Excluding parcels with development plans (to limit the analysis to those parcels with opportunities for development), there were 65 parcels representing 618 unimproved acres. Assuming these parcels are developed to their maximum potential floor area ratios under current zoning, an estimated total of up to 20.8 million square feet of commercial space could be added on unimproved parcels alone. This calculation was based on the following assumptions:
• Potential maximum floor area ratios were those identified through the City’s Land Management Code as of November 2007;
• Unimproved parcels were limited to those identified by the City of Frederick’s GIS department, and edited to exclude any parcels owned by government organizations;
Source: BBPC, 2007

City of Frederick Office, Industrial & Flex/R&D Market Analysis
51
• Calculation of potential commercial building area included deductions for infrastructure, parking, and environmental constraints (40 percent of land area was deducted before calculating potential building area); and
• In accordance with the Land Management Code, assumed 75 percent of parcels zoned MXE could be development with commercial structures, and 50 percent of land area of parcels zoned MU could be developed with commercial structures.
Excluding parcels zoned for retail use (e.g. general commercial or neighborhood commercial, which together comprise 175 acres), the remaining parcels (which cover 443 acres) offer capacity for approximately 14.3 million square feet of commercial space under current zoning. However, less efficient development (that is, below maximum floor area ratios permitted under current zoning) could reduce this capacity. BBPC analyzed recently constructed office, industrial, and flex developments in the City and County (e.g. those built between 2000 and 2007). The average office building was constructed at a floor area ratio of approximately 0.5; both the average flex and industrial buildings were constructed at floor area ratios of approximately 0.2. Assuming the non-retail commercial parcels are developed at these lower FAR levels, an estimated 3.4 million square feet of development would be accommodated on these parcels. This calculation assumes:
• 40 percent land area deduction for infrastructure; • FAR of 0.5 for office, 0.2 for flex, and 0.2 for industrial; and • Mix of uses matching the projected future demand for commercial development in Frederick (e.g.
34 percent office space, 22 percent industrial, and 44 percent flex). Underutilized Parcels In addition to unimproved parcels, the City contains a number of underutilized commercial parcels that offer potential for redevelopment. For the purposes of this analysis, underutilized parcels have been defined as those meeting the following criteria:
• Land area is greater than 5,000 square feet (e.g. large enough to redevelop); • Land value is at least two times greater than improvement value; • Existing structures were built before 1990; and • Zoning is one of the following categories: general commercial (GC), light industrial (M1), heavy
industrial (M2), manufacturing/office (MO), mixed use (MU), mixed employment (MXE), neighborhood commercial (NC), professional business (PB), and residential/office (RO). Government-owned parcels zoned for institutional use were excluded. Parcels zoned downtown business (DB) or downtown business office (DBO) were excluded because these parcels were excluded from the City’s identification of unimproved parcels and because of the desire to avoid identifying historic buildings as candidates for demolition/rebuilding.
A total of 168 parcels encompassing 623 acres met this criteria (and were not labeled as unimproved parcels). Excluding parcels with development plans, there were 155 parcels representing 209 underutilized acres; these parcels contained 511,509 square feet in 2007. If these parcels are developed to their maximum floor area ratios under current zoning (using the same assumptions as outlined under the unimproved parcels subsection), an additional 7.7 million square feet of commercial space could be added – for a net addition of 7.2 million square feet when the existing 511,509 square feet is subtracted. When parcels zoned for retail use are excluded (which together offer 58 acres), the remaining parcels (together featuring 151 acres) offer capacity for approximately 5.2 million square feet.

City of Frederick Office, Industrial & Flex/R&D Market Analysis
52
However, less efficient development (that is, below maximum floor area ratios permitted under current zoning) could reduce this capacity. BBPC analyzed recently constructed office, industrial, and flex developments in the City and County (e.g. those built between 2000 and 2007). The average office building was constructed at a floor area ratio of approximately 0.5; both the average flex and industrial buildings were constructed at floor area ratios of approximately 0.2. Assuming the non-retail commercial parcels (which total 151 out of 209 underutilized acres) are developed at these lower FAR levels, an estimated net 1.5 million square feet of development would be accommodated on these parcels. This calculation assumes:
• 40 percent land area deduction for infrastructure; • FAR of 0.5 for office, 0.2 for flex, and 0.2 for industrial; • Mix of uses matching the projected mix of opportunities for commercial development in
Frederick (e.g. 34 percent office space, 22 percent industrial, and 44 percent flex); and • The 511,509 square feet of existing development on these parcels are subtracted from the
potential capacity to yield the net potential square feet of development. Total Development Potential of Unimproved & Underutilized Parcels In total, development to the maximum floor area ratios under current zoning will enable the addition of approximately 19.5 million square feet of non-retail commercial development in the City.
City of Frederick Unimproved & Underutilized Parcels (2007) Less Development Pipeline
Source: The City of Frederick, BBPC, 2007

City of Frederick Office, Industrial & Flex/R&D Market Analysis
53
Parcels that could add the most commercial space under current zoning include: the Frederick Brick Works property at 184 East South Street (65 acres with potential for approximately 6 million square feet of commercial development under mixed use zoning), an approximately 100-acre property at the intersection of Monocacy Boulevard and Route 15 (located to the east of 15 and offering potential for approximately 4 million square feet under general commercial zoning), and a cluster of parcels along Gas House Pike. The opportunity gap analysis resulted in the identification of approximately 2.05 million square feet of potential future development to match unmet demand for commercial space in the City by 2020. This potential development represents approximately 12 percent of the total land capacity (17.85 million square feet) identified through the land capacity analysis. If this level of development is constructed by 2020, the City will retain land capacity for an additional 17.45 million square feet of commercial development to address employment growth needs beyond 2020. If parcels are developed at current FAR levels rather than maximum, and the mix of uses matches the projected opportunity gap (e.g. 34 percent office space, 22 percent industrial, and 44 percent flex), then a net total of approximately 4.9 million square feet of commercial development (excluding retail uses) would be built on unimproved and underutilized land (with 3.4 million square feet on unimproved acres and a net addition of 1.5 million square feet on underutilized acres). If the 2.05 million square feet of potential development identified through the opportunity gap analysis is constructed by 2020, the City will retain capacity for another 2.85 million square feet of development for growth beyond 2020. The following table summarizes the land capacity analysis top findings:
Figure 21: Development Capacity of Unimproved & Underutilized Parcels Without Development Plans
(Nov 2007)To Maximum FAR To Current FAR Levels
Unimproved 14.3 M SF 3.4 M SF
Underutilized 5.2 M SF 1.5 M SF Total 19.5 M SF 4.9 M SF Opportunity Gap 2.05 M SF 2.05 M SF Remaining Capacity 17.45 M SF 2.85 M SF Remaining Capacity of Unimproved Alone 12.25 M SF 1.35 M SF
Source: BBPC
6.3 Conclusions The potential development capacity of the City’s unimproved and underutilized parcels (when all parcels with development plans are excluded) ranges from 4.9 million to 19.5 million square feet. BBPC recommends that the City’s supply of commercial land be two to three times higher than demand for commercial land. Since the opportunity gap analysis identified demand for 2.05 million square feet, the City would need a land supply sufficient to hold 4.1 to 6.15 million square feet of new space. Thus, the current supply of land, at face value, may be appropriate given projected demand.

City of Frederick Office, Industrial & Flex/R&D Market Analysis
54
Of course, there are a myriad of dynamic factors in the City’s real estate market which could necessitate annexation to expand the City’s commercial land supply:
• Parcels could be developed at FAR levels lower than current trends • Underutilized parcels may not be redeveloped (leaving a capacity of 1.35 million square feet if
unimproved parcels are developed under current FAR levels, or 12.25 if under allowable maximum FAR levels)
• Selected large employers (in particular bioscience and advanced manufacturing firms seeking locations in campus style business parks) could require much larger parcel sizes than most of the unimproved and underutilized parcels offer. The average size of the City’s unimproved parcels was 90,000 square feet (approximately 2 acres); underutilized parcels provided, at the median, 26,000 square feet (approximately 0.6 acres). In contrast, major employers, such as BP Solar, often locate in large employment campuses (BP Solar is situated on 23 acres, or over 1 million square feet). Recent prospects and expanding businesses in the City have expressed need for between 250,000 to over 1 million square feet
• Certain parcels may require more than 40 percent of their land area devoted to parking, roads, sewer, water, storm water management, and other infrastructure/environmental elements, causing lower capacity than that projected in the analysis
• Major corporate employers generally prefer sites with strong visibility and access; however, many of the City’s sites fronting interstates (I-70 and Route 15) are already developed
Given these many dynamic factors, it appears the City may benefit from strategic annexation to ensure the most desirable locations contiguous to the City (e.g. those near the existing major transportation routes of I-70, I-270, and Route 15) are added to the commercial land supply to support a healthy commercial market and future business growth. To complement this strategic annexation, land use policies to encourage higher-intensity use of existing land are recommended to offer the City the best of both worlds: the chance to accommodate prospective large employers as well as the opportunity to become a regional model for higher-intensity, “smart-growth” development and redevelopment within the City’s current boundaries.

City of Frederick Office, Industrial & Flex/R&D Market Analysis
55
7 Strengths, Constraints, and Opportunities
7.1 Overview Current physical, economic and market conditions in the City of Frederick shape potential for commercial growth in the City; while many features are strengths supporting future expansion, some features could act as constraints to future growth if not addressed. The following table summarizes the strengths, constraints, and opportunities surrounding commercial development in the City, which were identified through both conversations with focus group participants and analysis of conditions and trends.
Figure 22: Strengths, Constraints, and Opportunities City of Frederick Commercial Markets
Strengths Constraints/Challenges Opportunities
Workforce & Education
• Skilled workforce/labor pool
(local and regional)
• Pent-up demand for commercial space from residents that commute to employment
• Gold-medal educational system
• Presence of three centers of higher education in County
• Customized training programs available for employers at area educational institutions
Land, Zoning, Buildings & Infrastructure
• Flexible zoning provisions for
commercial development, including MXE and MU zoning
• City and County offer stronger land capacity to accommodate future commercial development
Workforce & Education
• Lack of housing affordable to
workforce
• Uncertainty surrounding skills of labor pool over next 15 years – will Frederick County residents have the right skills in STEM (science, technology, engineering, and mathematics)
• Blue collar labor pool is shrinking as workers move north and west in search of more affordable housing
• Bioscience workforce can be difficult to find locally; must pull from broader region
• Manufacturing businesses face competition for labor pool with businesses in Washington County and Pennsylvania
Land, Zoning, Buildings & Infrastructure
• Few remaining large,
commercially zoned vacant parcels in City
Workforce & Education
• Support local and statewide push
for STEM education (science, technology, engineering, and mathematics
• Strengthen programs at Mount Saint Mary’s, Hood College, and Frederick Community College to boost the skills of the workforce
• Work with the new employee development roundtable through the Chamber of Commerce to advance primary and secondary education
• Promote diversity in recognition of the diverse backgrounds attracted to high-technology fields
• Recruit companies with large pools of workers already living in Frederick to relocate or open branch offices in the City
Land, Zoning, Buildings & Infrastructure
• Consider annexation of County
land for commercial development within established greenbelt

City of Frederick Office, Industrial & Flex/R&D Market Analysis
56
Employment Anchors & Growth
• Presence of Fort Detrick, which
is experiencing private and public sector job growth that will lead to spin-off job growth
• Employment projected to grow in County and City over next few decades, particularly in rapidly growing bioscience industry
• Trend of scientific industries migrating north to Frederick from Montgomery County
Quality of Life
• Downtown atmosphere,
amenities, distinctive character, and mix of uses
• Parks and greenspace in City and County that serve as amenities
• Sense of community
• Strong participation of business owners in civic/social organizations
• Active social and cultural events calendar
• Vibrant arts community and Main Street organization
• City serves as strong focal point for County
Location & Transportation • Location along I-270
biotechnology corridor (northern anchor); cluster of biotechnology businesses
• Location at hub of transportation network
• Proximity to I-270, U.S. 15, and I-70 – all connectors to regional customers and workforce
• Lack of land zoned for heavy industry (G-1) in City and County, which is pushing industrial development to Hagerstown/Washington County
• Limited sewer capacity, which if not expanded to keep pace with development and water allocations, could limit future development result in future development delays or moratoriums
• Concerns regarding future water capacity and broadband access
• Few large commercial
campuses
• Lack of large contiguous spaces to suit needs of lab users and defense contractors
• Limited supply of lab space needed by many bioscience businesses
• Limited selection of Class A properties (e.g. Patrick Center, Ballenger Center, new Carroll Creek properties) which cater primarily to attorneys, architects, and banks
• Limited ‘SCIF’ space (sensitive compartmented information facility) catering to defense industries, particularly in office space sector
Location & Transportation
• Congested areas within
transportation network (particularly U.S. 15 and Thomas Johnson Drive)
• Enable commercial development through rezoning of non-commercial parcels
• Use rezoning to promote balanced development of office and lab/flex space in eastern area of City
• Consider requiring new residential development to have a portion of office/employment space for residents
• Expand supply of County’s commercially zoned land (including City) to match projected development necessitated by employment growth
• Ensure zoning of parcels proximate to downtown retain option for businesses with manufacturing component for bioscience users
• Expand available commercial space in the City’s east side
• Pursue expansion of FITCI within City
• Support development of available space in timeframe that matches employment growth
• Focus heavier industrial development away from densely populated areas
• Expand supply of SCIF space
and lab space
• Expand space catering to high-technology in or close to Downtown
• Preserve a supply of industrial space in the County that is close to the City

City of Frederick Office, Industrial & Flex/R&D Market Analysis
57
• Equidistance from three major
airports
• Presence of municipal airport
• Pending major transportation improvements
Market Conditions & Trends • Relatively affordable space
compared to metro region average rates
• Affordability of Downtown office space (anecdotally reported at $12 to $15/SF/YR
• Strong developer interest
• Diversified economy that is not reliant on any single industry
• Relatively low office vacancy rates in the City
Business Support Networks & Attitudes • Business-friendly attitude of City
• Strong local banking presence
supportive of entrepreneurs, local developers
• Presence of high-tech business incubator
• Cooperative business spirit and sense of camaraderie among businesses
• More support for commercial development relative to residential among general public
• Variety of economic development programs catering to high-technology industries
Market Conditions & Trends
• Recent decrease in office
lease rates in Montgomery County (due to large deliveries in Germantown, Gaithersburg, and North Rockville) that have diminished relative affordability of Frederick space
• Perceived high cost of entry due to fees and permits, which can be more expensive for higher value lab space (because City permit fees charged as percent of value)
• Relatively high taxes compared to other jursidictions
• Developers have shifted attention from City to County when planning industrial developments
• Consider industrial development
authority (IDA) to create an industrial area
• Support rehabilitation of historic buildings in Downtown to cater to the preferences of creative individuals seeking creative and inspiring work places
• Promote development of strong industry clusters
Quality of Life
• Focus on efforts to bring visitors in to the City to attract new employees and residents
Location & Transportation
• Pursue North-South Parallel Road to connect eastern area of City to major roadways
• Investigate options to mitigate vehicular traffic congestion
Business Support Networks & Attitudes
• Pursue government grant
opportunities or lease guarantees to assist FITCI tenants with building new space
• Consider incentives/subsidies to bio-technology companies
• Create a single contact point for high-tech industry
• Enhance inspections/permitting process for bioscience companies
Source: BBPC, 2007

City of Frederick Office, Industrial & Flex/R&D Market Analysis
58
7.2 Summary Strengths Workforce & Education Participants in the commercial market focus groups repeatedly cited the workforce and educational programs as key assets to the Frederick economy. Businesses within the City have access to a skilled local and regional workforce that extends through Montgomery County to the south, Baltimore County to the east, Pennsylvania to the north and West Virginia to the west. The local labor force includes a strong base of knowledge workers, with scientific and highly technical research occurring at Fort Detrick and private firms. Many engineering and defense professionals live in Frederick, many of which work at businesses within the City or County, but a portion of which commute to employers in Montgomery, the District of Columbia and Northern Virginia. These commuting residents, which would likely prefer to work closer to home, offer a source of pent-up demand for commercial business growth and building expansion in Frederick. Frederick educational institutions are shaping the next generation of potential local employees. The City and County contain three centers of higher education: Hood College, Frederick Community College and Mount Saint Mary’s. These institutions offer customized training programs for employers to ensure students are given the opportunity to obtain skills in high demand. Land, Zoning, Buildings & Infrastructure
In contrast to neighboring Montgomery County, which is approaching build-out of vacant parcels, the City of Frederick and Frederick County offer a relatively strong supply of undeveloped land to accommodate future commercial development. Large undeveloped parcels in the City include the Brickworks property adjacent to Downtown (approximately 70 acres) and a cluster of vacant parcels along Gas House Pike near Route 26 and Monocacy Boulevard. In addition to theses vacant sites, the City also features underutilized commercial parcels that provide opportunities for future infill development and redevelopment. The zoning of many of these parcels allows flexibility for developers, with such categories as mixed employment (MXE) and mixed use (MU) offering potential for a variety of commercial uses. Employment Anchors & Growth
Major employment engines such as Fort Detrick, which houses the U.S. Biological Defense Research Program and the National Cancer Institute, serve as catalysts to business development and employment growth in Frederick. Over the next few years, Fort Detrick will add 1,200 new public and private sector jobs that will likely lead to spin-off job growth, and could accelerate a trend focus group participants cited of scientific industries migrating north to Frederick from Montgomery County.

City of Frederick Office, Industrial & Flex/R&D Market Analysis
59
Projections for the County and City predict strong employment growth over the next few, particularly in the rapidly growing bioscience industry and other professional, scientific and technical service industries. Such growth may support expansion of the office, flex, and industrial space markets, since bioscience and high-technology firms occupy all three types of space. Quality of Life
Business owners that participated in the focus group discussions described a number of attractive quality of life features unique to Frederick, and emphasized the importance of these factors in their decision to locate in the City. Downtown Frederick was described as a top attraction, with its vibrant retail and restaurant scene, historic atmosphere, distinctive character, and mix of uses. One business owner described the lure of being able to walk from the office to lunch or shopping throughout the day; another emphasized the desirability of locating in a unique historic space rather than a “vanilla box” style newer space. For these business owners – both of whom run highly-technical and creative knowledge-based businesses – a more creative and inspiring environment is viewed as conducive to creative and inspiring work. Focus group participants cited a strong sense of community and camaraderie in Frederick. In part, this sense of community is related to the strong participation of business owners in civic and social organizations; for instance, the local Rotary Club has over 400 members. Participants also suggested that the City’s sense of identity and distinctive character lends itself to fostering a sense of community. Downtown in particular serves as a strong focal point for the County that other neighboring counties lack (e.g. Montgomery and Howard). Finally, the City offers an amenity-rich environment, with many recreational opportunities. The City and County offer quality parks and greenspace, and community organizations such as arts groups and the dynamic local Main Street organization provide an active social and cultural events calendar. Location & Transportation The City of Frederick is strategically located at the apex of the regional transportation system. Equidistant from three major airports (e.g. Baltimore-Washington International, Dulles and Reagan), and situated at the hub of I-270, U.S. 15, and I-70, Frederick has access to regional and national (and international) clientele. The City also offers a municipal airport and MARC (Maryland Area Regional Commuter) train station that enhance transportation options for businesses. Pending major transportation improvements will further improve access, particularly in the eastern area of the City, where connections from East Street and Monocacy Boulevard to I-70 are in the works. The City serves as the northern anchor of the I-270 biotechnology corridor, a linear cluster of bioscience businesses and organizations (including major federal government agencies such as the National Institutes of Health) that stretches through Montgomery County to the District of Columbia. This strategic location enables the City to capture a portion of the bioscience businesses attracted to this corridor.

City of Frederick Office, Industrial & Flex/R&D Market Analysis
60
Market Conditions & Trends Developer interest is strong and growing in Frederick, evidenced by the entrance of major regional developers and brokers into the market (e.g. COPT, Matan, Alexandria) in recent years. These developers and brokers have cited Frederick’s strong business growth and relatively affordable space (compared to the region) as key selling points when attracting tenants. Developers have such confidence in the future growth of bioscience firms that they are building flex space on a speculative basis. And while the growth of the bioscience industry is often cited as an underlying strength supporting market expansion, focus group participants also emphasized the importance of Frederick’s diversified economy, which includes many industries and is not reliant on the success of any one single industry.
Business Support Networks & Attitudes Businesses in Frederick find numerous sources of support. Focus group participants emphasized the business-friendly attitude of the City, the strong local banking presence that supports entrepreneurs and local developers, the high-technology incubator (Frederick Innovative Technology Center, Inc. or FITCI), and a variety of economic development programs that support business expansion, creation and retention. Focus group participants also noted there is a cooperative business spirit and sense of camaraderie among businesses in Frederick, and that the general public seems to offer greater support for commercial development relative to support for residential. Constraints Workforce & Education
Though many Frederick residents offer professional skills, focus group participants expressed uncertainty regarding whether the labor pool over the next several decades will acquire skills and education needed in high growth industries, particularly science, technology, engineering, and mathematics skills (STEM). Bioscience business owners indicated that skilled scientific workers are currently difficult to find in the local workforce and that such employees must be recruited from the broader region. The issue of retaining a supply of housing affordable to the workforce was also raised through focus group conversations. Participants noted a trend of blue collar workers moving north and west in search of more affordable housing, and that manufacturing businesses now face competition for employees with businesses in Washington County to the west and Pennsylvania to the north.
Land, Zoning, Buildings & Infrastructure
While the City and County offer relatively more undeveloped land capacity than neighboring Montgomery County, there are few remaining large, commercially zoned vacant parcels in the City. Focus group participants also suggested available land zoned for heavy industry (GI) is scarce in the City and County, and this limited supply is pushing industrial development to Hagerstown and Washington County.

City of Frederick Office, Industrial & Flex/R&D Market Analysis
61
Stakeholders expressed concerns over infrastructure capacity. Participants warned that sewer capacity, if not expanded to keep pace with development and water allocations, could limit future development and result in future development delays or moratoriums. Future water capacity and broadband access were also noted as factors that could restrict future growth. Focus group participants indicated the existing commercial building inventory offers a limited selection of some features in demand by prospective tenants, including: large contiguous spaces to suit the needs of lab users and defense contractors (which can require upwards of 50,000 square feet); lab space in general; large campuses; Class A properties catering to the preferences of attorneys, architects, and banks (for whom appearance and quality of space is important), is limited; and ‘SCIF’ space (sensitive compartmented information facility) catering to defense industries, particularly in the office space sector. Location & Transportation
Though the transportation network offers many choices and access points for businesses to the regional labor pool and clientele, selected portions of the transportation network experience high levels of congestion. Peak hour traffic along I-270, U.S. 15 and Thomas Johnson Drive were described as highly congested, and frustrating to businesses that utilize these roadways. Market Conditions & Trends
Though Frederick has traditionally offered a relatively affordable alternative to Montgomery County, recent large deliveries in Germantown, Gaithersburg, and North Rockville have pushed down office lease rates in these submarkets to the point that they are on par with the average rates of space in Frederick County. Focus group participants suggested there is a high cost of entry for developers in the Frederick market due to fees and permits, which can be more expensive for higher value lab spaces (because the City charges permit fees as a percent of value). Several participants suggested they perceive taxes as relatively high in the City. Opportunities Workforce & Education
To support the continued growth of bioscience and high-technology industries in Frederick, there is an opportunity to encourage primary and secondary educational programs emphasizing STEM (science, technology, engineering, and mathematics). As stakeholders suggested, these programs should borrow from Montgomery County’s model of providing magnet school programs at public elementary, middle, and high schools (such as the science programs at Blair and Poolesville High Schools). The development of such programs should be supported through the recently formed Frederick Business Roundtable for Education through the Frederick Chamber of Commerce, which will be identifying the potential shortfall of intellectual employees and working to advance technology-oriented educational programs.

City of Frederick Office, Industrial & Flex/R&D Market Analysis
62
Programs at higher education facilities (e.g. Hood College, Mount Saint Mary’s, and Frederick Community College) also offer opportunity to be strengthened to boost the skills of the workforce and make these institutions centers of excellence in high-technology. Graduates of these programs should be encouraged to work and live in Frederick. There is an opportunity to recruit companies that have large pools of workers already living in Frederick to relocate or open branch offices in the City. Focus group participants also suggested diversity of the workforce should be supported in recognition of the diverse backgrounds attracted to high-technology fields (an increasingly international workforce).
Land, Zoning, Buildings & Infrastructure
Stakeholders participating in the focus group discussions highlighted an opportunity for expansion of the City’s commercial land supply and space inventory to match projected future employment growth. Some participants recommended annexation of County land for commercial development within the established greenbelt. Other stakeholders suggested there is an opportunity for rezoning to encourage commercial development, mixed use development, and a future balanced mix of office and lab/flex space (particularly in the eastern area of the City). One participant recommended that the County’s supply of commercially zoned land (including land within the City) be increased to 5 percent of all parcels. Several participants suggested reducing emphasis on industrial development by rezoning parcels zoned for industrial for office and flex. These stakeholders recommended that a base of industrial businesses be preserved in the County to serve the City and County. Heavier industrial development was recommended in the County rather than City, away from densely populated residential areas. Some stakeholders raised the possibility of creating an industrial development authority (IDA) that would create an industrial area catering primarily to light industrial uses. Since several bioscience and high-technology stakeholders said their preferred business location is Downtown Frederick, and since some of these firms have a manufacturing component, there may be opportunities to zone parcels proximate to Downtown (e.g. along East Street, near the MARC train station) such that manufacturing is permitted. With a sizable share of residents (40 percent) commuting to work outside Frederick County, there is an opportunity to increase opportunities for work close to home through zoning. Participants suggested that the City require new residential development projects also include office/employment space, following the linkage program Montgomery County has adopted. There are opportunities to strategically enhance voids in the existing supply of space and meet the needs and preferences of target businesses. Such development should include the expansion of SCIF space and lab space, and the expansion of FITCI to respond to strong demand for incubator space. Since many high-technology businesses prefer the creative culture of Downtown and its historic spaces, there is an opportunity to expand space catering to such firms in or close to Downtown, especially through the rehabilitation of historic buildings. Finally, there is an opportunity to promote stronger geographic clusters of industries through recruitment and marketing. Such clusters have been shown to improve the productivity of high-technology firms, since co-location of similar firms enables sharing of ideas.

City of Frederick Office, Industrial & Flex/R&D Market Analysis
63
Quality of Life
With many attractive quality of life features, there is an opportunity for the City to market its amenities to potential new employees and residents from around the region. Efforts that bring visitors in to the City – such as special events like First Saturday or the Festival of the Arts – can be used as a mechanism to expose visitors from the region to the quality of life in Frederick. Location & Transportation
There are opportunities to further enhance access in the City and to alleviate traffic congestion. The City should pursue a long-envisioned North-South Parallel Road that would connect I-70 to U.S. 15 and I-270 to the eastern area of the City, where a cluster of vacant, commercially zoned land is available. Opportunities to reduce traffic congestion include those focused on reducing demand for vehicular travel, including expansion of transit service (such as the frequency and capacity of MARC commuter service to the District of Columbia) and increased development of mixed use projects featuring office/industrial/flex and retail development that can reduce mid-day auto trips. Business Support Networks & Attitudes
Though Frederick has a strong business support network – with groups and programs such as the City of Frederick Department of Economic Development (DED), the Frederick County Office of Economic Development (OED), the Small Business Development Center (SBDC), the Frederick Network of the Tech Council of Maryland/MdBIO, the Fort Detrick Alliance, the Fort Detrick Business Development Office, the Maryland Technology Development Corporation (TEDCO), and the Fort Detrick Technology Transfer Initiative – there are opportunities to further improve and expand programs. With a high graduation rate, FITCI tenants should, as stakeholders suggested, appreciate additional assistance in finding and/or building new space in Frederick. Such support should include the pursuit of government grants or lease guarantees, which TEDCO is currently pursuing. Support should also include incentives and/or subsidies to biotechnology firms, which competitive jurisdictions such as the City of Baltimore offer. Business owners expressed desire for a single contact point for high-technology firms, which could be accommodated through the creation of an umbrella organization covering the many technology-focused groups in Frederick. The purpose of this contact point would be to increase cohesiveness to the already strong high-technology support network. Finally, though stakeholders described the City’s permitting process as strong, they suggested it should be improved through education of staff on state-of-the-art high-technology wet lab space, which would enable a smoother inspections/permitting process for bioscience companies.

City of Frederick Office, Industrial & Flex/R&D Market Analysis
64
8 Recommendations There is a significant level of new commercial space planned to deliver from 2007 to 2020 in the Frederick market as well as additional opportunities for new development. To ensure that employment growth keeps pace with this planned and potential future development, strategies related to business cultivation and recruitment should be undertaken to enhance demand for space. These strategies are meant to increase the number of businesses and employees entering or expanding in the Frederick market. In general, it is recommended that strategies be implemented under the following categories:
1. Workforce & Education 2. Land, Zoning, Buildings & Infrastructure 3. Quality of Life 4. Location & Transportation 5. Business Support Networks
These categories are directly tied to the types of strengths, challenges, and opportunities identified through focus group conversations and analysis, and are meant to improve both people resources (e.g. the workforce), place resources (e.g. land, buildings, transportation, and quality of life amenities), and business resources (e.g. support networks and development programs). These strategies are summarized in Figure 23.
Figure 23: Recommendations to Enhance Demand Category Recommendation
Workforce & Education
- Closer to Home Campaign. Undertake focused recruitment effort geared toward companies and organizations with significant shares of employees living in Frederick. Encourage creation of branch offices in City to reduce employees’ commutes and enhance employee satisfaction.
- Workforce Development. Support existing efforts that encourage STEM education (e.g. science, technology, engineering, and mathematics) through the Frederick Business Roundtable for Education, the Frederick County Workforce Development Board, Frederick Community College, Hood College, and Mount St. Mary’s University.
- Celebrate Diversity & Culture. Since high-technology fields attract employees
with diverse backgrounds and often international roots, celebration of diversity and culture should be promoted through such activities as special events that highlight Frederick’s diversity – including the many origins of its restaurant offerings (e.g. Indian, Ethiopian, Italian, Spanish, Mexican, etc.) and many cultural and artistic offerings.

City of Frederick Office, Industrial & Flex/R&D Market Analysis
65
Category Recommendation
Land, Zoning, Buildings & Infrastructure
Land Use Policy & Zoning (Considerations for Land Management Code Update) - Closer to Home Regulations/Residential-Commercial Linkage. To encourage a
balance of office/employment space for residents close to home, future regulations should include provisions mandating that residential developments provide a certain share of office/employment space. This linkage is important in that it can reduce the length and frequency of vehicle trips by allowing residents to work closer to home and it provides a captive potential labor pool for employers. The commercial component should occur in a timely fashion to the residential, which could be regulated through the use of minimum thresholds for development (e.g. no more than a certain proportion of residential use may be built until the commercial component is constructed, similar to the structure of the City’s current mixed-use zoning category).
- Minimum FAR Requirements. As evidenced by the analysis of the City’s land capacity,
developers have recently been building at levels well below permitted FAR. To promote the more efficient use of the City’s limited land resources, minimum floor area ratio (RAF) regulations should be considered.
- Consider Annexation in Conjunction with Minimum FAR Requirements. The City
has a large land capacity for future development if parcels are built to capacity under current zoning. At the same time, the City offers few large contiguous undeveloped parcels. In response, the City should consider annexation of properties with commercial uses; however, this annexation should be balanced with efforts to promote efficient use of remaining City land. Minimum FAR regulations are one such measure to require more efficient use of land.
- Zoning for Balanced Office & Flex, Reduced Industrial. With pipeline development in
the City increasingly focused on office and flex development, future regulations should encourage a balanced mix of these two uses and diminished focus on industrial development (particularly heavy industry, which is often resource-heavy). However, there is still a need for industrial space in the County, close to the City and major transportation networks, and there is demand for space for bioscience users with a manufacturing component close to Downtown Frederick.
Development Review - Predictable/Transparent Development Review. Establishing and maintaining a
streamlined, easy-to-navigate, and expedient review system can help boost the City’s competitive edge against competing jurisdictions and encourage business owners as well as developers to choose the City of Frederick. Streamlined review can include pre-application conferences, permit coordinating processes, expedited permits for higher-intensity development, and clear standards for development. Further, increasing the user-friendliness of the City’s permitting fee system can be accomplished through the introduction of online calculators to allow developers the chance to identify ballpark fee estimates in a simple, one-stop-source.
Buildings & Infrastructure - Incubator Expansion. The strong success of the Frederick Innovative Technology
Center, Inc. (FITCI), which has already expanded once into a new facility, supports the additional expansion of the incubator with another facility. If possible, the facility should be located near other high-technology firms to create a cluster of ideas and innovation.
- Market Product Preferences to Developers. Encourage developers to add specialized
space features to the Frederick inventory in demand by target tenants through marketing materials (e.g. brochures, websites, etc.). Focus on harder to find SCIF space, lab space, and green building features.
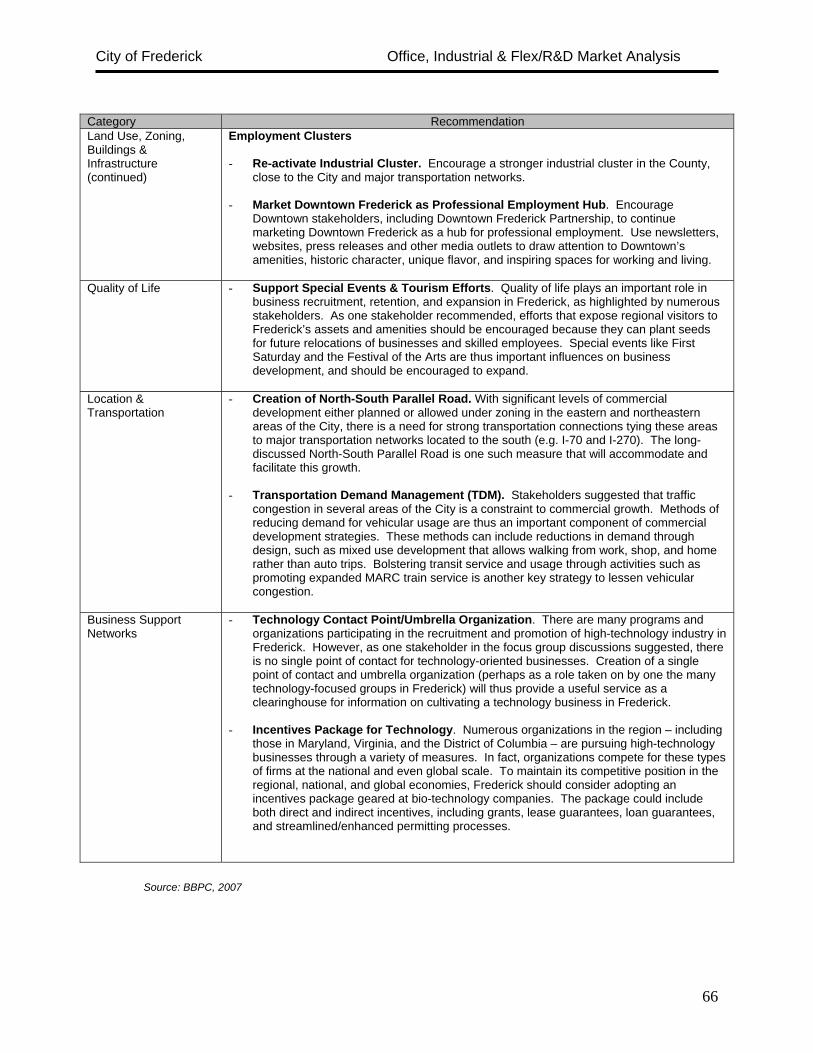
City of Frederick Office, Industrial & Flex/R&D Market Analysis
66
Category Recommendation Land Use, Zoning, Buildings & Infrastructure (continued)
Employment Clusters - Re-activate Industrial Cluster. Encourage a stronger industrial cluster in the County,
close to the City and major transportation networks.
- Market Downtown Frederick as Professional Employment Hub. Encourage Downtown stakeholders, including Downtown Frederick Partnership, to continue marketing Downtown Frederick as a hub for professional employment. Use newsletters, websites, press releases and other media outlets to draw attention to Downtown’s amenities, historic character, unique flavor, and inspiring spaces for working and living.
Quality of Life - Support Special Events & Tourism Efforts. Quality of life plays an important role in
business recruitment, retention, and expansion in Frederick, as highlighted by numerous stakeholders. As one stakeholder recommended, efforts that expose regional visitors to Frederick’s assets and amenities should be encouraged because they can plant seeds for future relocations of businesses and skilled employees. Special events like First Saturday and the Festival of the Arts are thus important influences on business development, and should be encouraged to expand.
Location & Transportation
- Creation of North-South Parallel Road. With significant levels of commercial development either planned or allowed under zoning in the eastern and northeastern areas of the City, there is a need for strong transportation connections tying these areas to major transportation networks located to the south (e.g. I-70 and I-270). The long-discussed North-South Parallel Road is one such measure that will accommodate and facilitate this growth.
- Transportation Demand Management (TDM). Stakeholders suggested that traffic congestion in several areas of the City is a constraint to commercial growth. Methods of reducing demand for vehicular usage are thus an important component of commercial development strategies. These methods can include reductions in demand through design, such as mixed use development that allows walking from work, shop, and home rather than auto trips. Bolstering transit service and usage through activities such as promoting expanded MARC train service is another key strategy to lessen vehicular congestion.
Business Support Networks
- Technology Contact Point/Umbrella Organization. There are many programs and organizations participating in the recruitment and promotion of high-technology industry in Frederick. However, as one stakeholder in the focus group discussions suggested, there is no single point of contact for technology-oriented businesses. Creation of a single point of contact and umbrella organization (perhaps as a role taken on by one the many technology-focused groups in Frederick) will thus provide a useful service as a clearinghouse for information on cultivating a technology business in Frederick.
- Incentives Package for Technology. Numerous organizations in the region – including those in Maryland, Virginia, and the District of Columbia – are pursuing high-technology businesses through a variety of measures. In fact, organizations compete for these types of firms at the national and even global scale. To maintain its competitive position in the regional, national, and global economies, Frederick should consider adopting an incentives package geared at bio-technology companies. The package could include both direct and indirect incentives, including grants, lease guarantees, loan guarantees, and streamlined/enhanced permitting processes.
Source: BBPC, 2007

City of Frederick Office, Industrial & Flex/R&D Market Analysis
67
In addition to the recommendations outlined above, BBPC recommends that the City of Frederick undertake focused master plans for specific employment areas in the City, including Downtown Frederick (including the undeveloped Brick Works property and underutilized parcels along East Street) and the City’s eastern and northeastern areas, where significant levels of development are either planned or allowed under current zoning. Such plans will offer specialized analysis and recommendations regarding the total environment – land use, transportation, natural features, historic resources, etc. – that impacts commercial growth, and will offer opportunity for strong citizen participation and visioning in the future outcomes of these areas.