pharmacokinetics of plasma lamivudine(3tc), and its active...
TRANSCRIPT

Presented at the 12th Int. Workshop on Clin. Pharmacology of HIV Therapy, 13-15 April 2011, Miami, Fl, USA
Pharmacokinetics of plasma lamivudine (3TC), and its active intracellular anabolite 3TC‐triphosphate (3TC‐TP) over a 24 hour dosing interval following administration of 3TC 300 mg and 150 mg once daily (od) to HIV‐negative healthy volunteers.
The ENCORE 2 Study.
Else LJ1, Jackson A3, Puls R4, Hill A1, Fahey P4, Lin E4, Amara A2, Siccardi M1, Tjia J1, Emery S4, Khoo S1, Back DJ1 and Boffito M3
1 Department of Molecular and Clinical Pharmacology, University of Liverpool, Liverpool, UK.2 NIHR Biomedical Research Centre, Royal Liverpool Hospital Trust, Liverpool, UK3 St Stephen’s Centre, Chelsea and Westminster Hospital, London, UK.4 National Centre in HIV Epidemiology and Clinical Research, University of New South Wales, Sydney, Australia.

Presented at the 12th Int. Workshop on Clin. Pharmacology of HIV Therapy, 13-15 April 2011, Miami, Fl, USA
• Lamivudine (3TC)‐ cytidine nucleoside analog converted intracellularly (3‐step phosphorylation) to active triphosphate form (3TC‐TP)‐ correlation between intracellular [3TC‐TP] exposure and efficacy1
• PD: no strong evidence for dose‐related differences in efficacy ‐ (300mg vs 150mg bd)2‐3 & (150mg bd vs. 300mg od)4‐ saturation of phosphorylation pathways at higher doses?
• PK: 3TC‐TP exposures equivalent when administered at 150mg bd & 300mg oddoses5
• OBJECTIVE (ENCORE 2): determine the pharmacokinetics, safety and tolerability of plasma 3TC and 3TC‐TP over a 24 hour dosing interval following administration of 300 mg and 150 mg once daily to HIV‐negative healthy volunteers in a randomised crossover design.
Background:Rationale
1Fletcher et al; AIDS 2000; 2Eron et al NEJM 1995; 3Barlett et al Ann Int Med 1996; 4DeJesus et al CID 2004; 5Yuen et al Antimicrob Agents Chemothr 2004

Presented at the 12th Int. Workshop on Clin. Pharmacology of HIV Therapy, 13-15 April 2011, Miami, Fl, USA
• open label, randomized, cross‐over pharmacokinetic (PK) study
• 24 healthy volunteers, randomised (1:1) into 2 groups
• Participant demographics, clinical data, concomitant medications, adverse events recorded
• plasma 3TC & intracellular 3TC‐TP PK sampling: Day 10 & Day 30 (*0, 1, 2, 4, 8, 12, 24 h)
3TC 150 mg OD 3TC 300 mg OD10 day washout
days1 10 20 30
PK sampling* PK sampling*
3TC 300 mg OD 3TC 150 mg OD10 day washout
PK sampling* PK sampling*
SCREENING
‐28 0
Randomized (1:1)
Arm 1:
Arm 2:
Background:ENCORE 2 Design

Presented at the 12th Int. Workshop on Clin. Pharmacology of HIV Therapy, 13-15 April 2011, Miami, Fl, USA
Bioanalytical Methods:Plasma 3TC quantification
Calibrators/QC: drug‐free plasma spiked with working 3TC solutions (range 5‐5000 ng/mL)
Clinical samples: ~ 1 mL plasma obtained (4 mL EDTA tube)
Sample pre‐treatment (all samples): 300 µL (plasma sample) + 300 µL formic acid (0.02%)IS (2‐chloroadenosine; 20 µL) added
Analytes eluted via reverse phase (Synergi; polar C18) chromatography
Quantification performed via HPLC‐MS/MS(MRM; positive ionisation mode)
3TC extracted by solid phase extraction (SPE C18; bond‐eluent)‐ evaporated to dryness ‐ reconstituted in mobile phase (100 µL)

Presented at the 12th Int. Workshop on Clin. Pharmacology of HIV Therapy, 13-15 April 2011, Miami, Fl, USA
Bioanalytical Methods:Intracellular 3TC‐TP quantification
Calibrators/QC: drug‐free PBMCs (~4*106 cells) prepared via Ficoll gradient centrifugation
Clinical samples: PBMCs prepared via CPT tubes (cell count recorded)
Cells re‐suspended in 70% methanol & dispatched in 1mL fractions(stored at ‐80°C)
Calibrators/QC: PBMC samples spiked with working 3TC‐TP solutions (range 0.5‐100 ng/sample)
Sample pre‐treatment (all samples): 1 mL ACN & IS (2‐chloroadenosine triphosphate; 20 µL) added samples centrifuged (13,000rpm), evaporated to dryness re‐suspended in mobile phase (100 uL)
Analytes eluted via reverse phase (Fortis C18) ion‐pair (N,N‐DMHA) chromatography
Quantification performed via HPLC‐MS/MS(MRM; negative ionisation mode)

Presented at the 12th Int. Workshop on Clin. Pharmacology of HIV Therapy, 13-15 April 2011, Miami, Fl, USA
3 4 5 6 7 8 9 10Time (min)
0
50
1000
50
1000
50
1000
50
1000
50
100
Rel
ativ
e A
bund
ance
0
50
1000
50
1000
50
100
NL: 3.83E3TIC F: - c ESI SRM ms2 465.973 [158.860-158.870, 368.098-368.108]
NL: 4.01E3TIC F: - c ESI SRM ms2 467.991 [159.053-159.063, 370.306-370.316]
NL: 3.26E3TIC F: - c ESI SRM ms2 467.991 [159.053-159.063, 370.306-370.316] MS
NL: 4.16E3TIC F: - c ESI SRM ms2 480.974 [158.933-158.943, 383.021-383.031]
NL: 5.26E3TIC F: - c ESI SRM ms2 489.900 [158.895-159.905, 391.995-392.005]
NL: 2.26E3TIC F: - c ESI SRM ms2 505.969 [158.966-158.976, 408.000-408.010]
NL: 8.19E3TIC F: - c ESI SRM ms2 539.931 [159.130-159.140, 442.068-442.078]
TIC
dCTP
3TC-TP
3TC-TP (clinical sample: 12.2 * 106 cells)
dTTP
dATP
dGTP / ATP
2Cl-ATP (IS)
Chromatogram: 3TC‐TP, IS and endogenous dNTPs

Presented at the 12th Int. Workshop on Clin. Pharmacology of HIV Therapy, 13-15 April 2011, Miami, Fl, USA
• PK parameters (AUC24, C24, Cmax) calculated by non‐compartmental analysis (WinNonlin®), expressed as unadjusted geometric means (90%CI)
• Within‐subject changes expressed by geometric mean ratios (GMR, 90% CI; adjusted for study arm, period and intra‐individual variation)‐ Linear mixed effects modelling
• Results were considered statistically significant at <0.05 or if 90% CI of GMR ratios excluded 1 or 0
• Regimens were considered bioequivalent if 90% CI for the GMR fell within the acceptance range of 0.8‐1.25.
Methods:Pharmacokinetic and statistical analyses

Presented at the 12th Int. Workshop on Clin. Pharmacology of HIV Therapy, 13-15 April 2011, Miami, Fl, USA
Results:Baseline characteristics and lipids (screening and day 37‐44 follow up)
N (%) Median (range)
Sex, female 13 (54) ‐
Ethnicity‐Caucasian‐Black‐Oriental‐Other
16 (67)4 (17)1 (4)3 (13)
‐‐‐
Age, years 24 33.5 (27.0‐57.0)
Weight, kg 24 72.2 (48.8‐109.6)
BMI, kg/m2 24 23.7 (19.5‐34.7)
Total Cholesterol, mmol/L
‐ Screening 24 5.25 (3.7‐7.2)
‐ Follow up 24 4.80 (3.6‐7.1)
Triglycerides, mmol/L
‐ Screening 24 1.28 (0.53‐3.2)
‐ Follow up 24 0.87 (0.47‐2.4)
• No serious adverse events related to study medication were recorded

Presented at the 12th Int. Workshop on Clin. Pharmacology of HIV Therapy, 13-15 April 2011, Miami, Fl, USA
Results:Plasma 3TC pharmacokinetic data (geometric mean; 90% CI)
0
200
400
600
800
1,000
1,200
0 4 8 12 16 20 24
3TC
pla
sma
(ng/
mL)
Time Post Dose (h)
Phases 1&2 (300 & 150 mg)
300 mg; n=24
150 mg; n=24
Presented at the 12th Int. Workshop on Clin. Pharmacology of HIV Therapy, 13-15 April 2011, Miami, Fl, USA
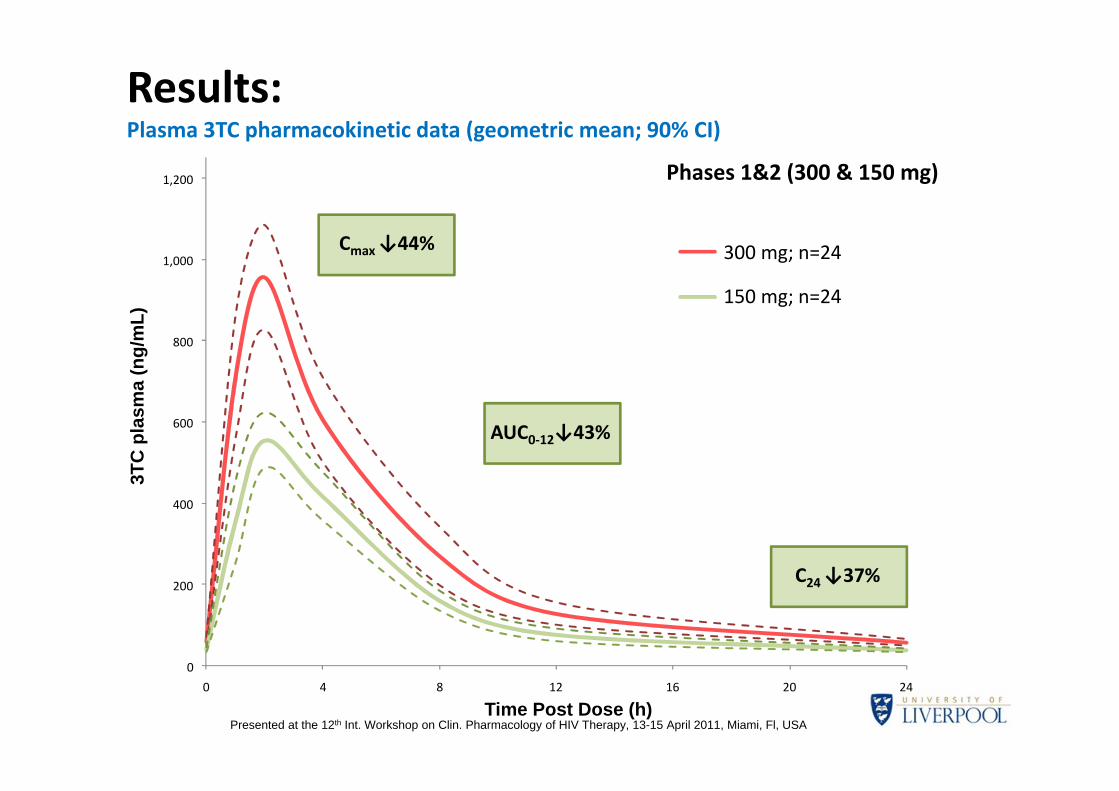
Results:Plasma 3TC pharmacokinetic data (geometric mean; 90% CI)
0
200
400
600
800
1,000
1,200
0 4 8 12 16 20 24
3TC
pla
sma
(ng/
mL)
Time Post Dose (h)
Phases 1&2 (300 & 150 mg)
300 mg; n=24
150 mg; n=24
Cmax↓44%
AUC0‐12↓43%
C24 ↓37%

Presented at the 12th Int. Workshop on Clin. Pharmacology of HIV Therapy, 13-15 April 2011, Miami, Fl, USA
Results:Plasma 3TC pharmacokinetic parameters: unadjusted geometric means, full mixed model (fitting dose, arm, period with adjustment for cross‐over) and basic mixed model (fitting dose with adjustment for cross‐over).
Full mixed model Basic mixed model
Dose Arm Period Dose
Dose (OD) Parameter Geometric mean(90% CI) GMR (90% CI) P value P value P value GMR (90% CI)
150 mg AUC0‐24ng.h/mL
4773 (4408, 5169)0.57 (0.55, 0.60) <0.001 0.002 0.277 0.57 (0.56, 0.59)
300 mg 8354 (7609, 9172)
150 mg C24ng/mL
38.1 (34.0, 42.7)0.63 (0.59, 0.67) <0.001 0.105 0.955 0.63 (0.59, 0.67)
300 mg 60.8 (53.4, 69.2)
150 mg Cmaxng/mL
757 (688, 833)0.56 (0.53, 0.60) <0.001 0.019 0.558 0.56 (0.53, 0.60)
300 mg 1344 (1247, 1448)
• ~43% reduction in 3TC plasma exposure with 150 mg od regimen (50% dose reduction)
• None of the 3TC plasma PK parameters meet the criteria for bioequivalence

Presented at the 12th Int. Workshop on Clin. Pharmacology of HIV Therapy, 13-15 April 2011, Miami, Fl, USA
Results:Plasma 3TC pharmacokinetic parameters: unadjusted geometric means, full mixed model (fitting dose, arm, period with adjustment for cross‐over) and basic mixed model (fitting dose with adjustment for cross‐over).
Full mixed model Basic mixed model
Dose Arm Period Dose
Dose (OD) Parameter Geometric mean(90% CI) GMR (90% CI) P value P value P value GMR (90% CI)
150 mg AUC0‐24ng.h/mL
4773 (4408, 5169)0.57 (0.55, 0.60) <0.001 0.002 0.277 0.57 (0.56, 0.59)
300 mg 8354 (7609, 9172)
150 mg C24ng/mL
38.1 (34.0, 42.7)0.63 (0.59, 0.67) <0.001 0.105 0.955 0.63 (0.59, 0.67)
300 mg 60.8 (53.4, 69.2)
150 mg Cmaxng/mL
757 (688, 833)0.56 (0.53, 0.60) <0.001 0.019 0.558 0.56 (0.53, 0.60)
300 mg 1344 (1247, 1448)
• ~43% reduction in 3TC plasma exposure with 150 mg od regimen (50% dose reduction)
• None of the 3TC plasma PK parameters meet the criteria for bioequivalence• Significant differences between study arms (Arm 1 > Arm 2)

Presented at the 12th Int. Workshop on Clin. Pharmacology of HIV Therapy, 13-15 April 2011, Miami, Fl, USA
Results:Intracellular 3TC‐TP pharmacokinetic data (geometric mean; 90% CI)
0.00
1.00
2.00
3.00
4.00
5.00
0 4 8 12 16 20 24
300 mg; n=24
150 mg; n=24
3TC
-TP
intr
acel
lula
r (pm
ol/1
06ce
lls)
Time Post Dose (h)
Phases 1&2 (300 & 150 mg)
Cmax↓30%
AUC0‐12↓27%
C24 ↓18%

Presented at the 12th Int. Workshop on Clin. Pharmacology of HIV Therapy, 13-15 April 2011, Miami, Fl, USA
Results:Intracellular 3TC‐TP pharmacokinetic parameters: unadjusted geometric means, full mixed model (fitting dose, arm, period with adjustment for cross‐over) and basic mixed model (fitting dose with adjustment for cross‐over).
Full mixed model Basic mixed model
Dose Arm Period Dose
Dose (OD) Parameter Geometric mean(90% CI) GMR (90% CI) P value P value P value GMR (90% CI)
150 mg AUC0‐24pmol.h/106 cells
44.0 (38.0‐51.0)0.73 (0.64, 0.83) <0.001 0.637 0.008 0.74 (0.64, 0.86)
300 mg 59.5 (51.8‐68.3)
150 mg C24pmol/106 cells
1.23 (1.00, 1.52)0.82 (0.68, 0.99) 0.083 0.404 0.246 0.83 (0.68, 1.01)
300 mg 1.49 (1.19, 1.86)
150 mg Cmaxpmol/106 cells
2.95 (2.47, 3.51)0.70 (0.61, 0.82) <0.001 0.981 0.008 0.72 (0.61, 0.85)
300 mg 4.10 (3.59, 4.69)
• ~27% reduction in intracellular 3TC‐TP exposure with 150 mg od regimen (50% dose reduction)
• None of the 3TC‐TP intracellular PK parameters meet the criteria for bioequivalence

Presented at the 12th Int. Workshop on Clin. Pharmacology of HIV Therapy, 13-15 April 2011, Miami, Fl, USA
Results:Intracellular 3TC‐TP pharmacokinetic parameters: unadjusted geometric means, full mixed model (fitting dose, arm, period with adjustment for cross‐over) and basic mixed model (fitting dose with adjustment for cross‐over).
Full mixed model Basic mixed model
Dose Arm Period Dose
Dose (OD) Parameter Geometric mean(90% CI) GMR (90% CI) P value P value P value GMR (90% CI)
150 mg AUC0‐24pmol.h/106 cells
44.0 (38.0‐51.0)0.73 (0.64, 0.83) <0.001 0.637 0.008 0.74 (0.64, 0.86)
300 mg 59.5 (51.8‐68.3)
150 mg C24pmol/106 cells
1.23 (1.00, 1.52)0.82 (0.68, 0.99) 0.083 0.404 0.246 0.83 (0.68, 1.01)
300 mg 1.49 (1.19, 1.86)
150 mg Cmaxpmol/106 cells
2.95 (2.47, 3.51)0.70 (0.61, 0.82) <0.001 0.981 0.008 0.72 (0.61, 0.85)
300 mg 4.10 (3.59, 4.69)
• ~27% reduction in intracellular 3TC‐TP exposure with 150 mg od regimen (50% dose reduction)
• None of the 3TC‐TP intracellular PK parameters meet the criteria for bioequivalence• Significant effect of study period (Day 10 vs. Day 30)

Presented at the 12th Int. Workshop on Clin. Pharmacology of HIV Therapy, 13-15 April 2011, Miami, Fl, USA
Results:Intracellular 3TC‐TP pharmacokinetic parameters (AUC0‐24): unadjusted geometric means, mixed model (stratified by Study Arm).
Mixed model
Period
Dose (OD) Dose (OD) Parameter Geometric mean(90% CI) GMR (90% CI) P value
Arm 1150 mg AUC0‐24
pmol.h/106 cells47.2 (38.6, 57.8)
0.90 (0.75, 1.09) 0.374300 mg 52.3 (41.1, 66.5)
Arm 2150 mg AUC0‐24
pmol.h/106 cells40.5 (31.8, 51.5)
1.71 (1.41, 2.07) <0.001300 mg 69.2 (63.2, 75.8)
• Arm 1: (300 mg → 150 mg) no significant differences

Presented at the 12th Int. Workshop on Clin. Pharmacology of HIV Therapy, 13-15 April 2011, Miami, Fl, USA
Results:Intracellular 3TC‐TP pharmacokinetic parameters (AUC0‐24): unadjusted geometric means, mixed model (stratified by Study Arm).
Mixed model
Period
Dose (OD) Dose (OD) Parameter Geometric mean(90% CI) GMR (90% CI) P value
Arm 1150 mg AUC0‐24
pmol.h/106 cells47.2 (38.6, 57.8)
0.90 (0.75, 1.09) 0.374300 mg 52.3 (41.1, 66.5)
Arm 2150 mg AUC0‐24
pmol.h/106 cells40.5 (31.8, 51.5)
1.71 (1.41, 2.07) <0.001300 mg 69.2 (63.2, 75.8)
• Arm 1: (300 mg → 150 mg) no significant differences • Arm 2: (150 mg → 300 mg) highly significant differences
• Consistent with a combined DOSE and PERIOD effect

Presented at the 12th Int. Workshop on Clin. Pharmacology of HIV Therapy, 13-15 April 2011, Miami, Fl, USA
Results:Geometric mean 3TC‐TP (AUC0‐24): stratified by dose and study arm
Stratified by Arm:
‐ Arm 1: reduction in dose cancels the effect of period
‐ Arm 2: ↑ due to combined dose/period effects
3TC
-TP
(pm
ol.h
/106
cells
)
Stratified by dose: ‐ clear dose and period effect
‐ ~40% increase attributable to dose
‐ ~30% increase attributable to period
0
10
20
30
40
50
60
70
80
300 mg 150 mg 150 mg 300 mg
ARM 1 ARM 2
0
10
20
30
40
50
60
70
80
Day 10 Day 30 Day 10 Day 30
150 mg 300 mg
Presented at the 12th Int. Workshop on Clin. Pharmacology of HIV Therapy, 13-15 April 2011, Miami, Fl, USA
Conclusions:
• Mean plasma 3TC concentrations:‐ significantly higher for the 300 mg vs. 150 mg dose‐ significant differences between study arms
• Mean intracellular 3TC‐TP concentrations:‐ significantly higher for the 300 mg vs. 150 mg dose‐ significantly higher at Day 30 vs. Day 10 (period effect)‐ no prospect of an interaction/order effect
• For key plasma/intracellular pharmacokinetic parameters: 3TC at 150 mg is not bioequivalent to the standard regimen of 300 mg od
‐ indicating that saturation of cytosine phosphorylation pathways is not achieved at a dose of 150 mg od.

Presented at the 12th Int. Workshop on Clin. Pharmacology of HIV Therapy, 13-15 April 2011, Miami, Fl, USA
Acknowledgments:
Funder: Bill and Melinda Gates Foundation Principal Contact: Dr. Stephen Becker
Sponsor: National Centre in HIV Epidemiology and Clinical Research (NCHECR) University of New South Wales, Sydney, Australia
Principal Investigator: Dr. Marta BoffitoSt Stephen’s Centre Chelsea and Westminster Hospital, London