pharmacoeconomics (basics for md pharmacology)
TRANSCRIPT

Pharmacoeconomics (For MD Pharmacology)
Dr. Advaitha M. V

TERMINOLOGIES
Health economics : • Health Economics is an applied field of study that
allows for the systematic and rigorous examination of the problems faced in promoting health for all –
• This is achieved By applying economic theories of consumer, producer and social choice.

• The aim of Health economics : is to identify what is most efficient, so that the
greatest amount of benefit (Pharmaceutical products/ Health services) can be bought for a given amount of money or resources.
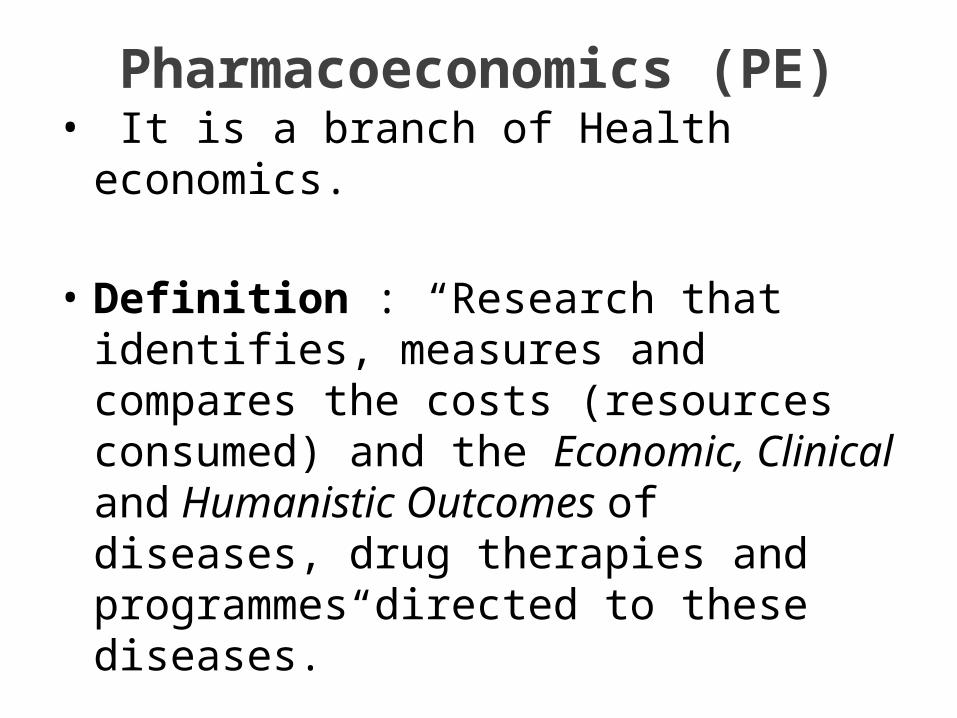
Pharmacoeconomics (PE)• It is a branch of Health economics.
• Definition : “Research that identifies, measures and compares the costs (resources consumed) and the Economic, Clinical and Humanistic Outcomes of diseases, drug therapies and programmes directed to these diseases.”
• Term first coined in 1986 by Townsend
Who takes Key Interest in PEHealth care funders Pharmaceutical Companies.Governments.Social security funds. insurance companies.REMARKS : • They struggle to meet their rising costs.
• They make many efforts to contain drug costs, by price negotiation, patient co-payments or dedicated drug budgets.
COSTS AND BENEFITS
Cost classification• 1.Direct Cost–
• Cost from the perspective of the healthcare funder.
Includes staff costs, capital costs, drug acquisition costs.
Contd.. Direct cost
• Cost from the perspective of the Patient Medications, Supplies, Laboratory tests,
Healthcare professionals' time, Hospitalization.
• Direct costs are relatively easy to measure.
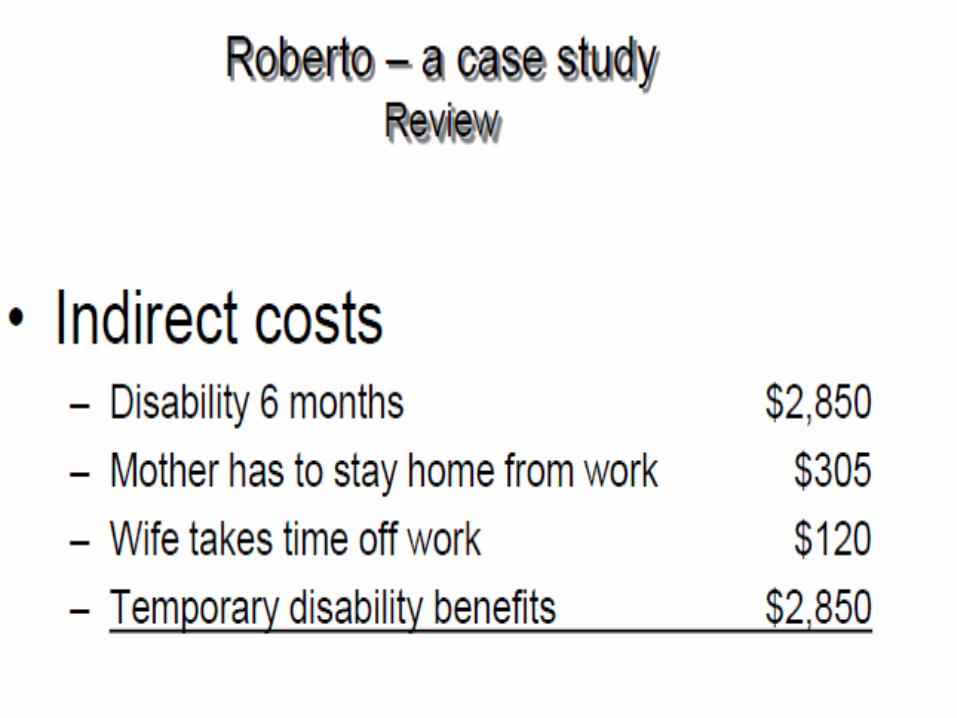
2.Indirect Cost –• It is Cost from the perspective of society as a
whole:
• for example :
loss of earnings, loss of productivity, loss of leisure time, due to the illness, and cost of travel to hospital etc.

• This would include not just the patient themselves but also their family and society as a whole.
• Many of these are difficult to measure, and there is some controversy over how to value these.
3.Intangible Cost –
• It is the pain, worry or other distress which a patient or their family might suffer.
• These may be impossible to measure in monetary terms, but are sometimes captured in measures of quality of life.


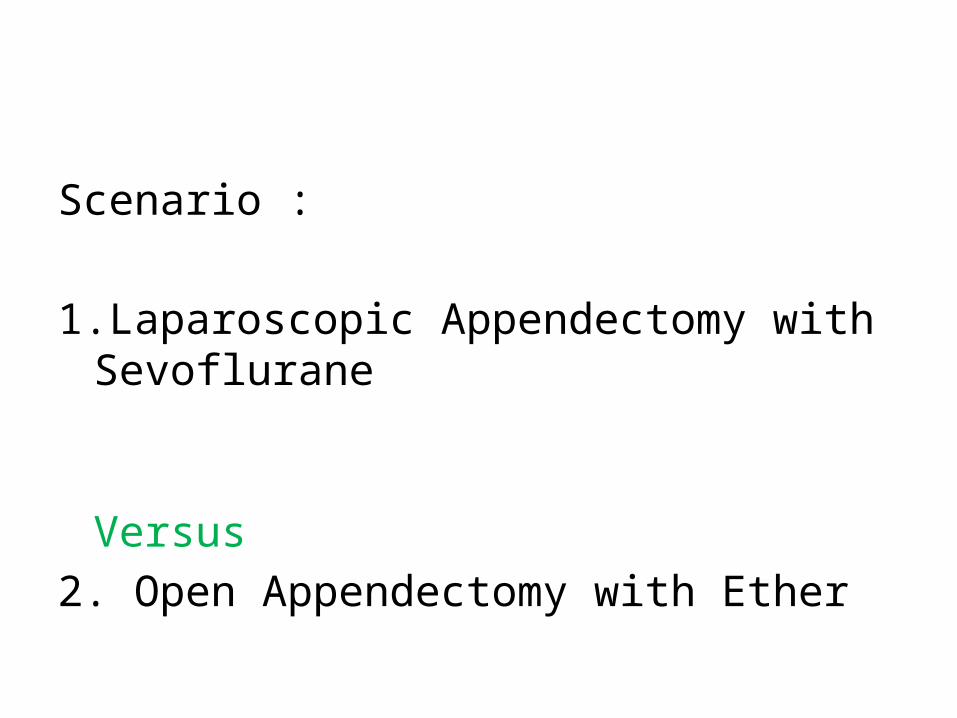
Scenario :
1.Laparoscopic Appendectomy with Sevoflurane
Versus 2. Open Appendectomy with Ether
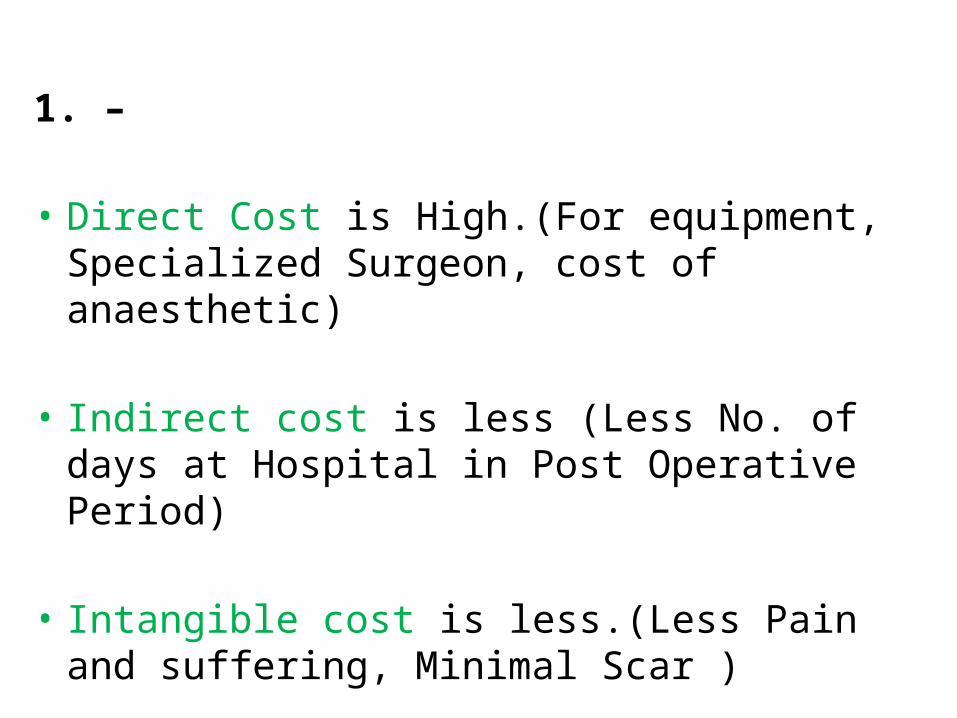
1. –
• Direct Cost is High.(For equipment, Specialized Surgeon, cost of anaesthetic)
• Indirect cost is less (Less No. of days at Hospital in Post Operative Period)
• Intangible cost is less.(Less Pain and suffering, Minimal Scar )
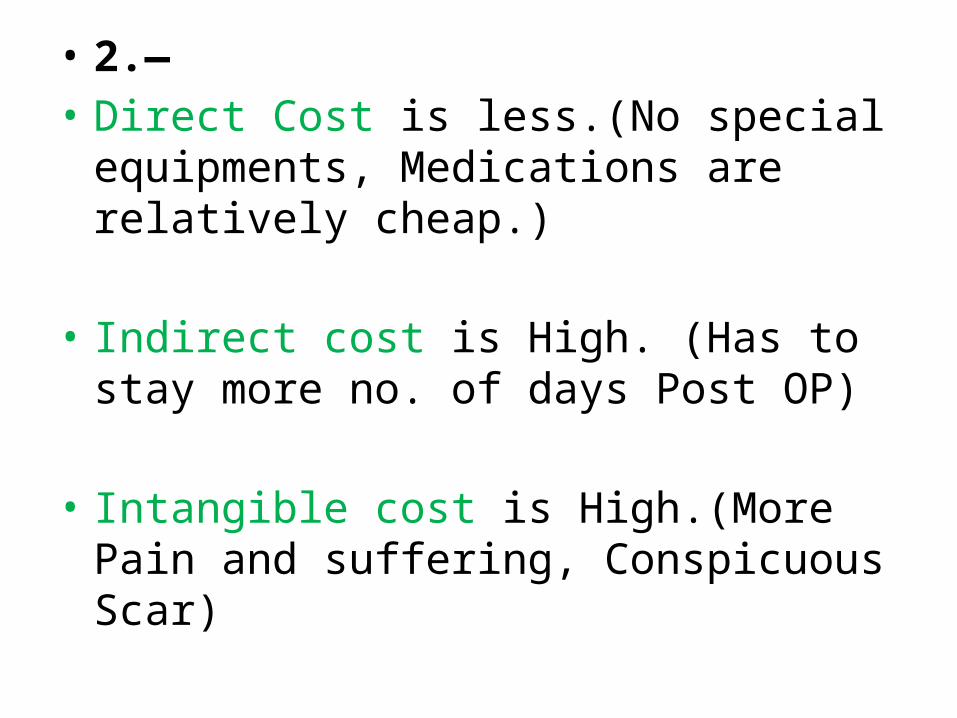
• 2.—• Direct Cost is less.(No special equipments,
Medications are relatively cheap.)
• Indirect cost is High. (Has to stay more no. of days Post OP)
• Intangible cost is High.(More Pain and suffering, Conspicuous Scar)

Benefits• The benefits we expect from an intervention
might be measured in:
• 1. “Natural” units –
• e.g. years of life saved, strokes prevented, peptic ulcers healed etc.
• 2.“Utility” units – • Utility is an economist’s word for satisfaction, or
sense of well being.
• It is an attempt to evaluate the quality of a state of health, and not just its quantity.
• E.g, • The Quality Adjusted Life Year (QALY) is one
widely used measure, which attempts to integrate both quality and the quantity of life.
[QALYs represent the number of full years at full health that are valued equivalently to the number of years as experienced]

• QALYs are calculated as the average number of additional years of life gained from an intervention.
• Then it is multiplied by a utility judgment of the quality of life in each of those years.
• For example, A person might be placed on hypertension therapy for 30
years, which prolongs his life by 10 years at a slightly reduced quality level of 0.9.
• In addition, the need for continued drug therapy reduces his quality of life by 0.03.
• Hence, the QALYs gained would be 10 x 0.9 - 30 x 0.03 = 8.1 years.
• The valuations of quality may be collected from surveys; a subjective weight is given to indicate the quality or utility of a year of life with that disability.

Method of Economic evaluation
• Cost minimization analysis.• Cost effectiveness analysis.• Cost utility analysis.• Cost benefit analysis.
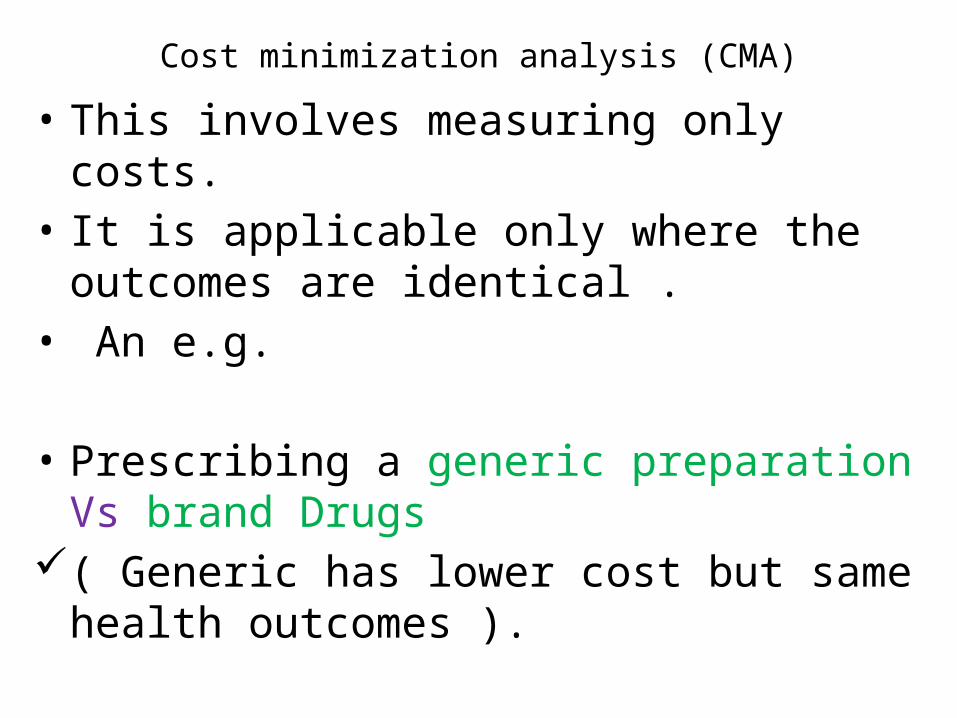
Cost minimization analysis (CMA)
• This involves measuring only costs.• It is applicable only where the outcomes are
identical .• An e.g. • Prescribing a generic preparation Vs brand Drugs ( Generic has lower cost but same health
outcomes ).
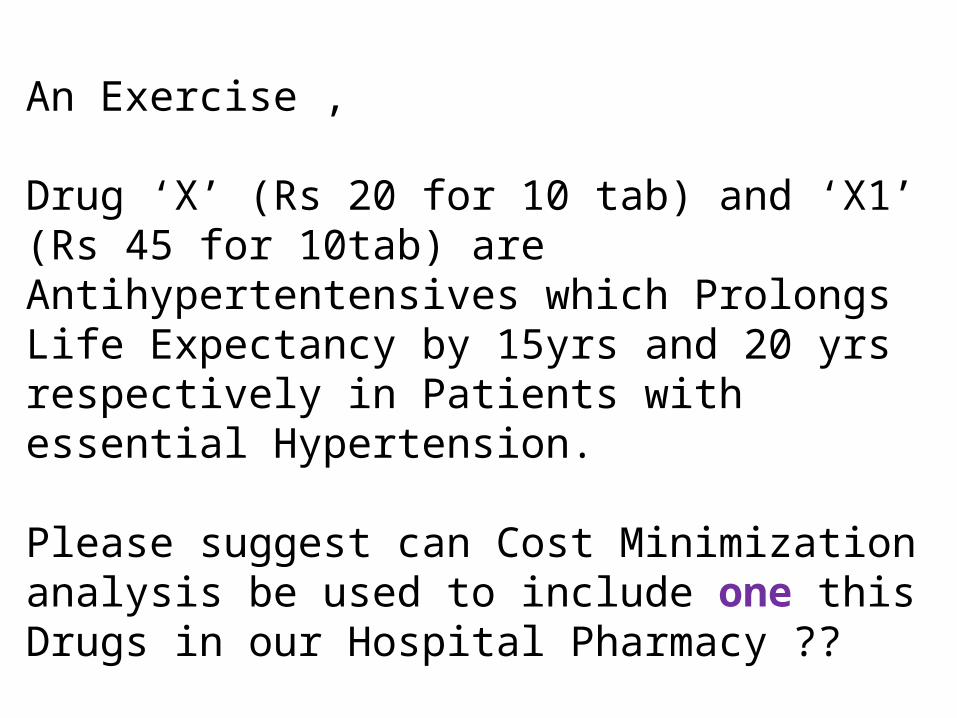
An Exercise ,
Drug ‘X’ (Rs 20 for 10 tab) and ‘X1’ (Rs 45 for 10tab) are Antihypertentensives which Prolongs Life Expectancy by 15yrs and 20 yrs respectively in Patients with essential Hypertension.
Please suggest can Cost Minimization analysis be used to include one this Drugs in our Hospital Pharmacy ??
• Ans : No
• Why – The outcome or the Health benefit of the 2 drugs are not equivalent. so we cannot use CMA.
Methods of Economic Assessment
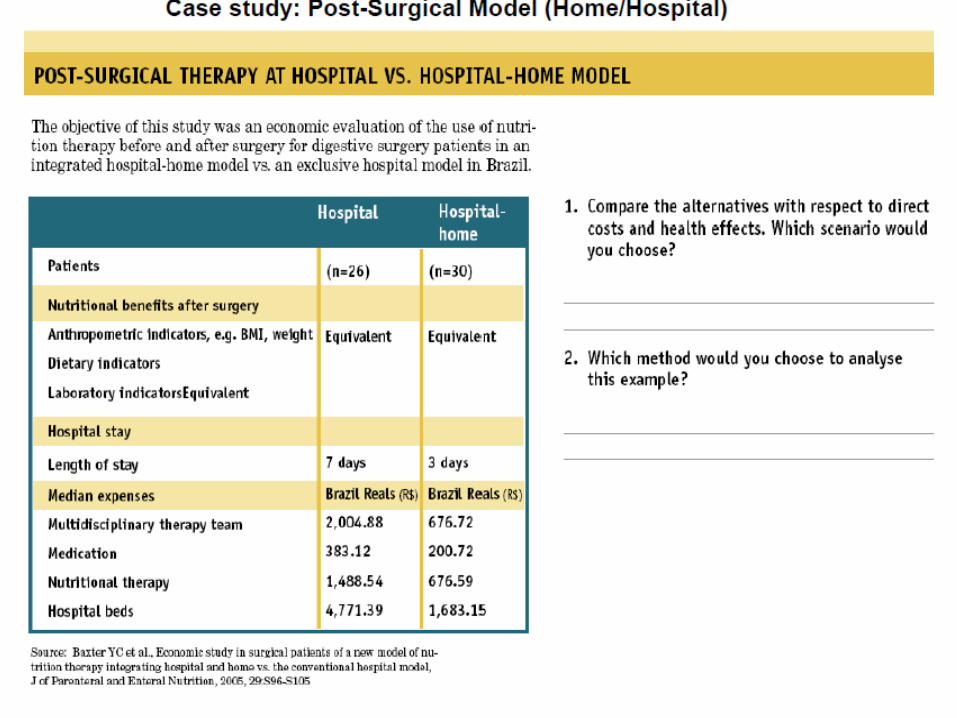
Answer :• Case study : Hospital vs Home Model
• 1st –Since the clinical efficacy of the 2 programs is equivalent, we should look at the difference in length of stay and costs.
The hospital-home model has less expenditures and is thus more cost-effective
• 2nd –cost-minimization analysis.
Cost-Effectiveness Analysis
• A Scenario :
• The Government Organization has to decide Whether to launch Oral Polio Vaccine (OPV) or Inactivated Polio Vaccine (IPV) Programme. ??
• Cost : OPV is cheaper To IPV.

• Effects : OPV : • 1. Provides ‘herd immunity’ ( it provides
immunity even to non-immunized) which is essential in countries like India.
• Does not requires highly trained personnel.• Useful in controlling epidemics.

Effects of IPV : • It is safe to administer as it contains
inactivated virus.
• Especially in People over 50 yrs, With corticosteroid/Radiation therapy.
• So, Basically we are comparing two treatments with different efficacy and costs to achieve a similar outcome.

• Another E.g,
• Whether to Implement Pentavalent Vaccine Or Go for DPT with optional influenza and HBV vaccine In our Govt Health set-up ?
?!?! Still Debate is On..
• Cost-effectiveness analysis (CEA) is a way of summarizing the health benefits and resources used by competing healthcare programs—
So that policy makers can choose among them.
• CEA involves comparing programs or treatment alternatives with different safety and efficacy profiles.
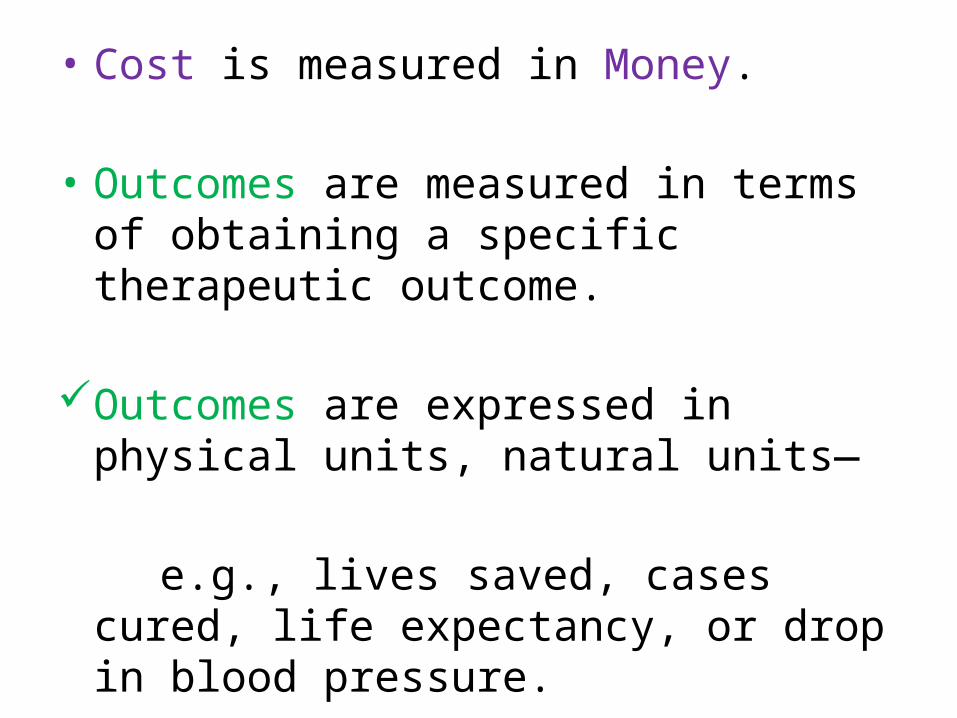
• Cost is measured in Money.
• Outcomes are measured in terms of obtaining a specific therapeutic outcome.
Outcomes are expressed in physical units, natural units—
e.g., lives saved, cases cured, life expectancy, or drop in blood pressure.
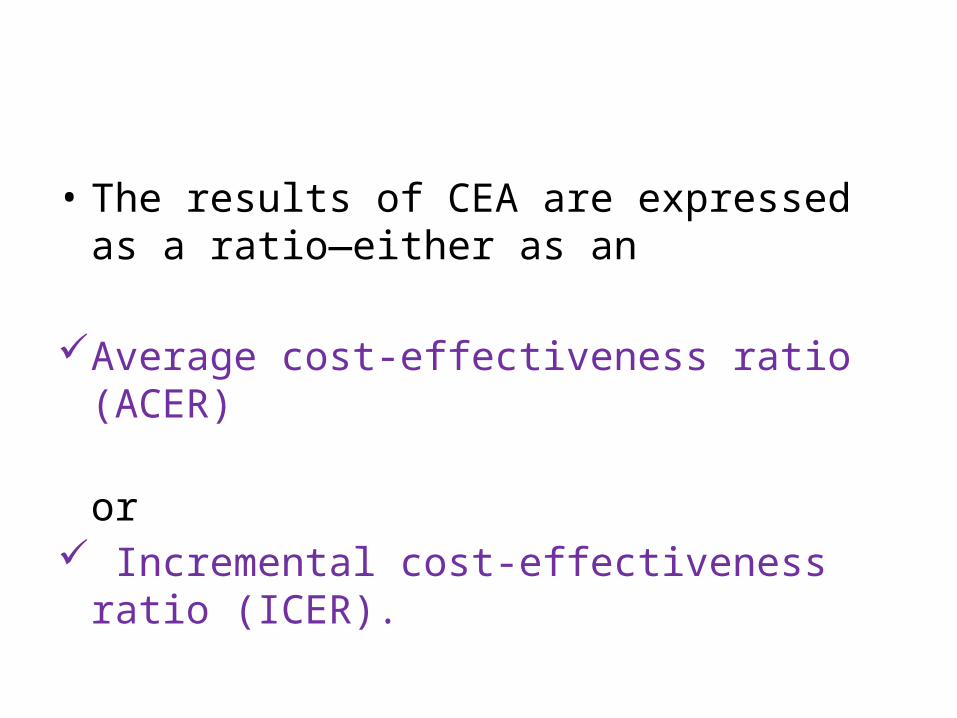
• The results of CEA are expressed as a ratio—either as an
Average cost-effectiveness ratio (ACER) or Incremental cost-effectiveness ratio (ICER).
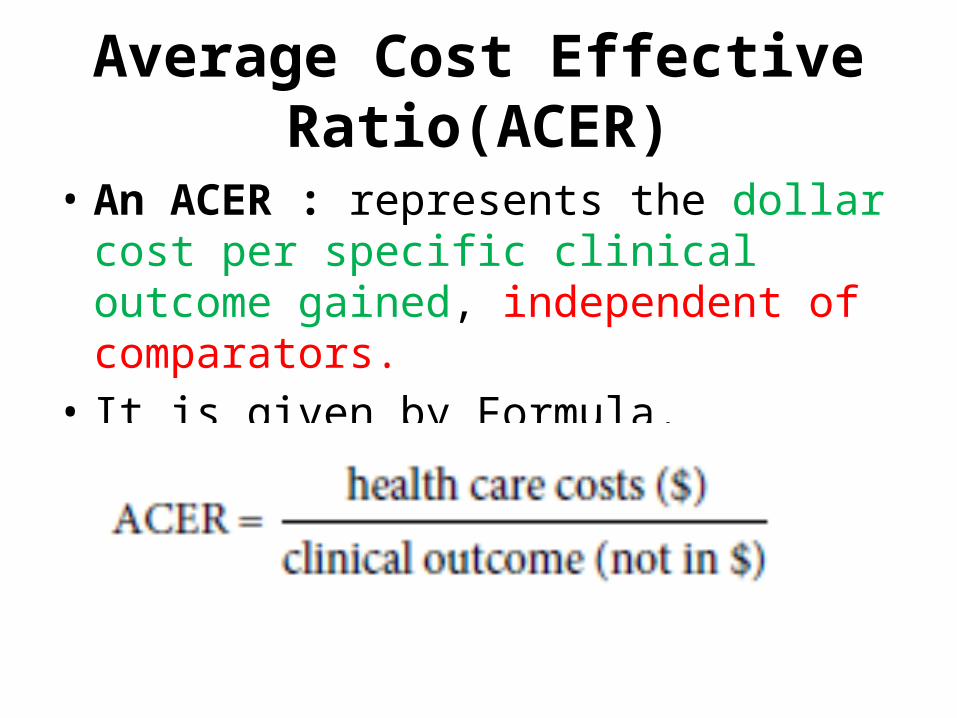
Average Cost Effective Ratio(ACER)
• An ACER : represents the dollar cost per specific clinical outcome gained, independent of comparators.
• It is given by Formula.
• This allows the costs and outcomes to be reduced to a single value to allow for comparison.
• Using this ratio, the clinician would choose the alternative with the least cost per outcome gained.
• The most cost-effective alternative is not always the least costly alternative for obtaining a specific therapeutic objective.
• In this regard, cost-effectiveness need not be cost reduction but rather cost optimization
Incremental Cost Effective Ratio (ICER)
• Often clinical effectiveness is gained at an increased cost.
• Is the increased benefit worth the increased cost?
• Incremental CEA can be used to determine the additional cost and effectiveness gained when
one treatment alternative is compared with the
next best treatment alternative.
• Thus, instead of comparing the ACERs of each treatment alternative –
The additional cost that a treatment
alternative imposes over another treatment is compared with the additional effect, benefit, or outcome it provides.
• An E.g, • Already there is an existing ART Regimens in Govt
health set up……..• Lately, research shows A few new drugs are to be
added and some drugs are to be removed from the regimen to increase the effectiveness of treatment.
• However this modified treatment comes with an additional cost.
• Question – Is this modified treatment (additional benefit) worth the additional cost ?
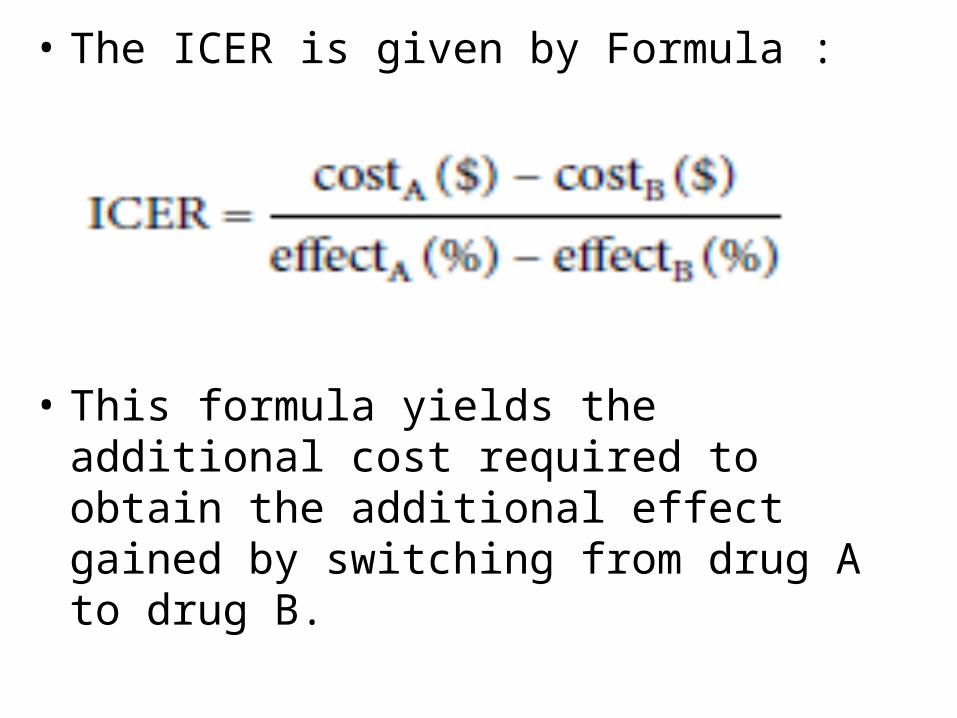
• The ICER is given by Formula :
• This formula yields the additional cost required to obtain the additional effect gained by switching from drug A to drug B.
• CEA is useful in balancing cost with patient outcome, determining which treatment alternatives represent the best health outcome per dollar spent.
• CEA can provide valuable data to support drug policy, formulary management, and individual patient treatment decisions.
• Globally, CEA is being used to set public policies regarding the use of pharmaceutical products (national formularies) in countries such as Australia, New Zealand, Canada etc.
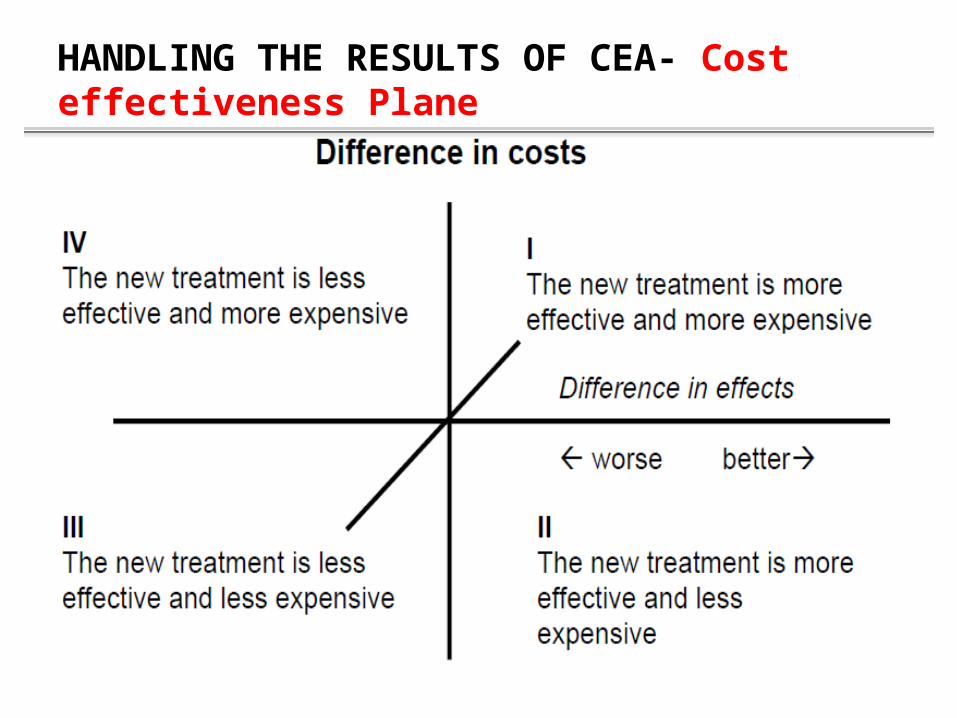
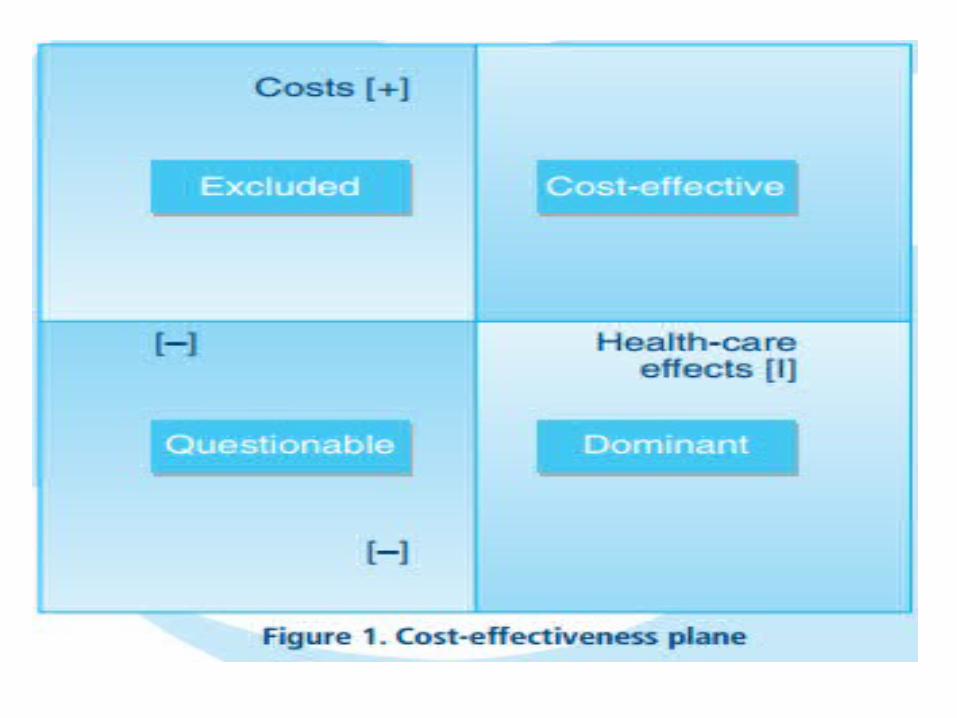
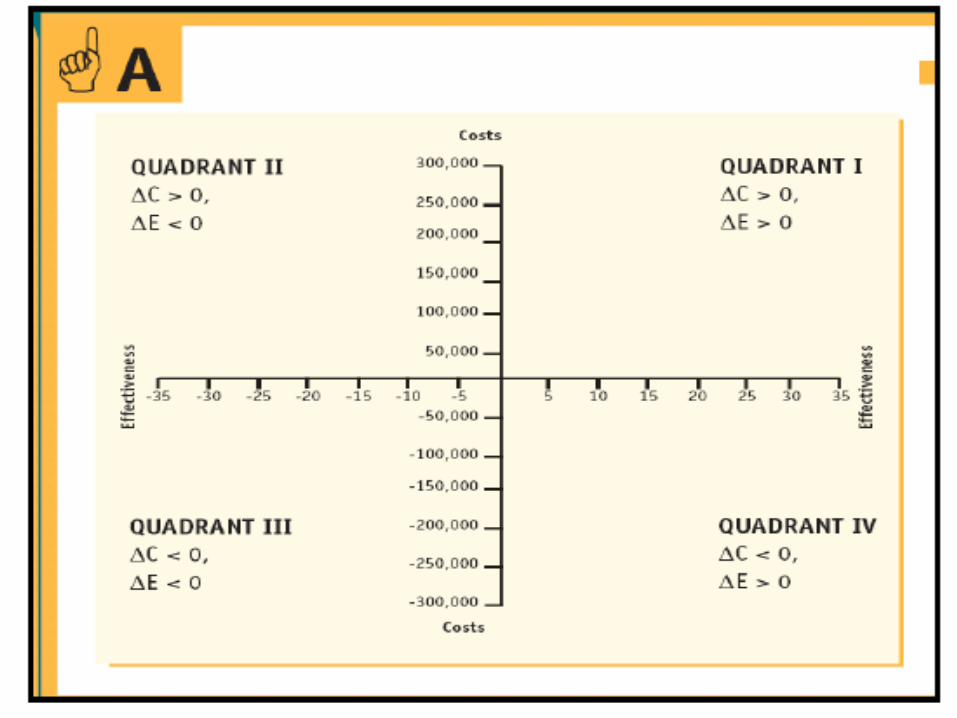
HANDLING THE RESULTS OF CEA- Cost effectiveness Plane
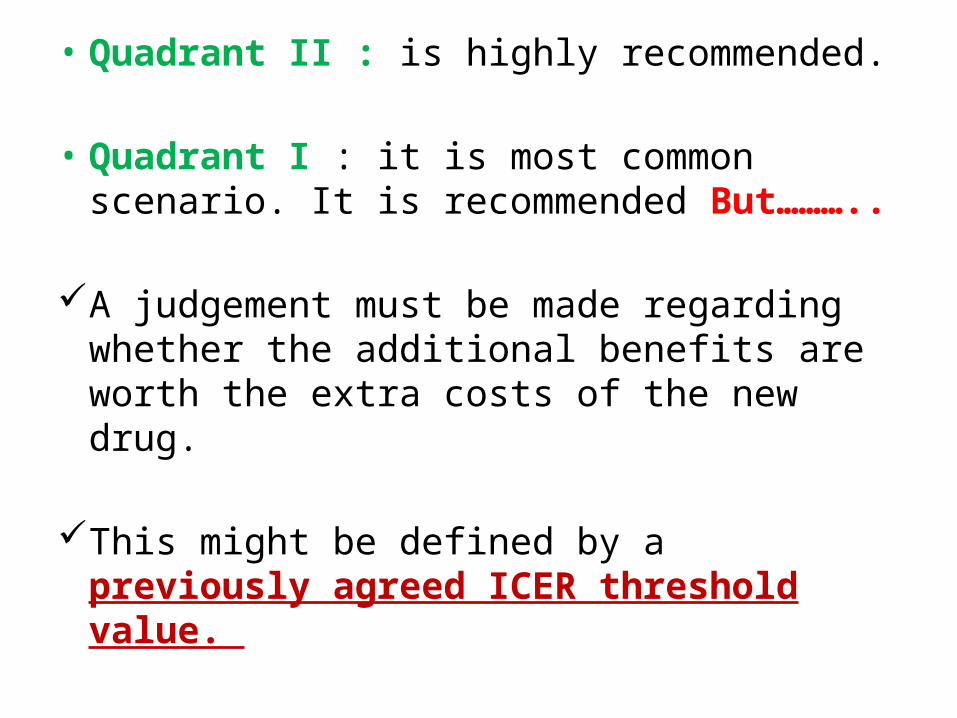
• Quadrant II : is highly recommended.
• Quadrant I : it is most common scenario. It is recommended But………..
A judgement must be made regarding whether the additional benefits are worth the extra costs of the new drug.
This might be defined by a previously agreed ICER threshold value.
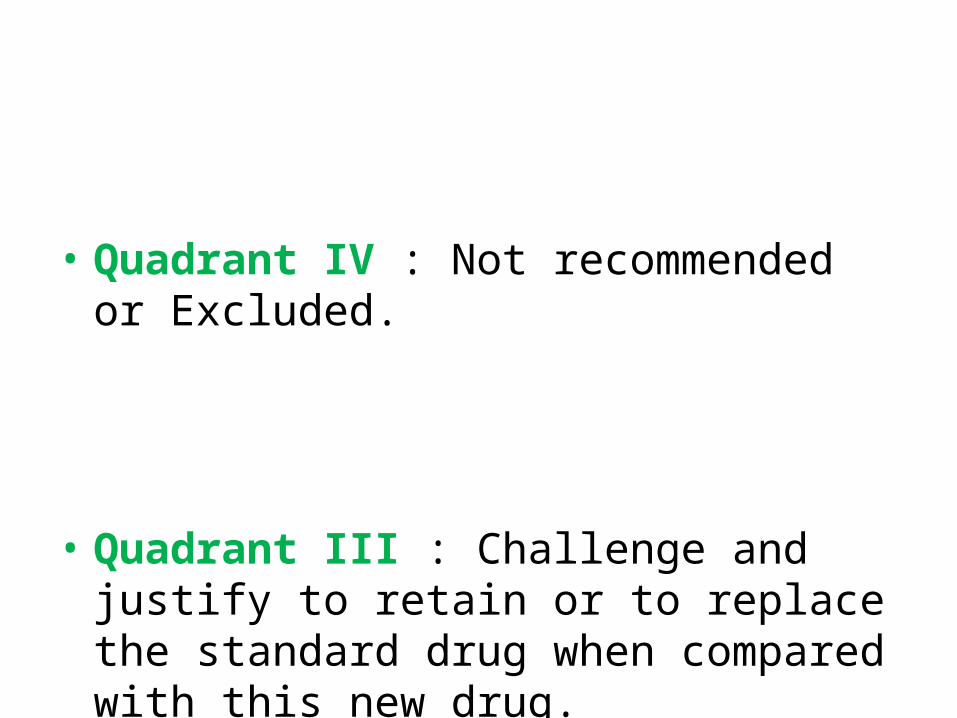
• Quadrant IV : Not recommended or Excluded.
• Quadrant III : Challenge and justify to retain or to replace the standard drug when compared with this new drug.
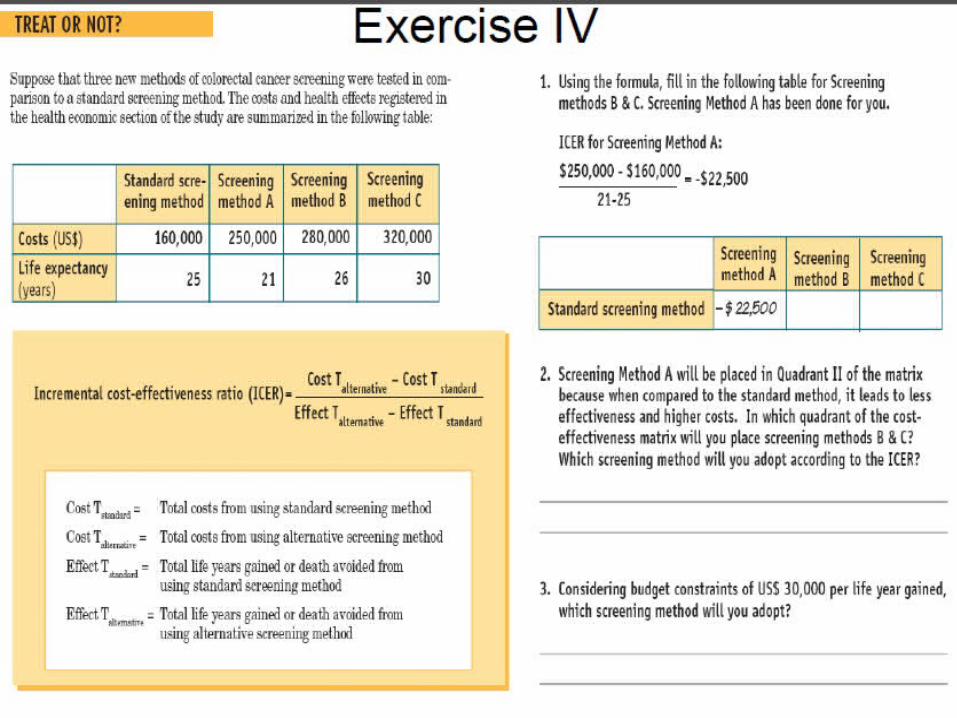
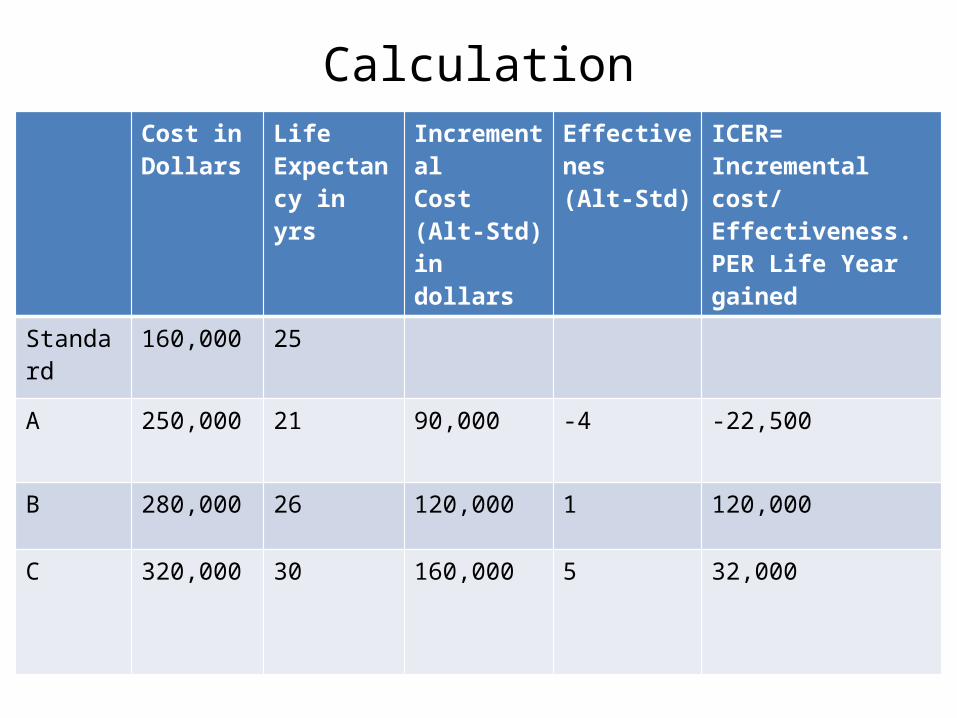
CalculationCost in Dollars
Life Expectancy in yrs
IncrementalCost(Alt-Std) in dollars
Effectivenes(Alt-Std)
ICER= Incremental cost/ Effectiveness.PER Life Year gained
Standard 160,000 25
A 250,000 21 90,000 -4 -22,500
B 280,000 26 120,000 1 120,000
C 320,000 30 160,000 5 32,000
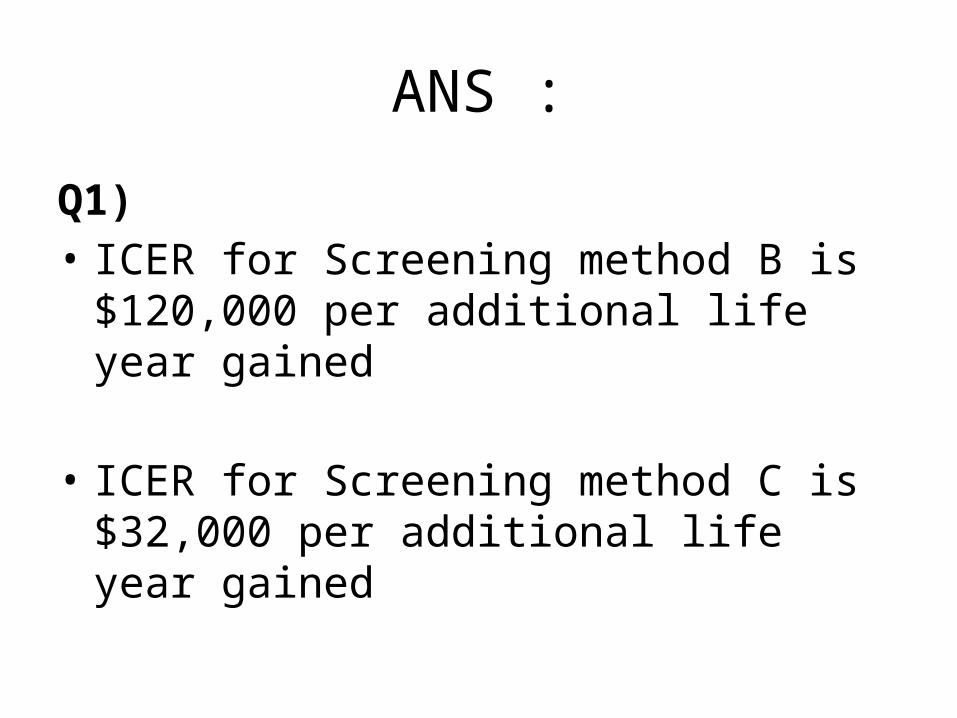
ANS :
Q1) • ICER for Screening method B is $120,000 per
additional life year gained
• ICER for Screening method C is $32,000 per additional life year gained
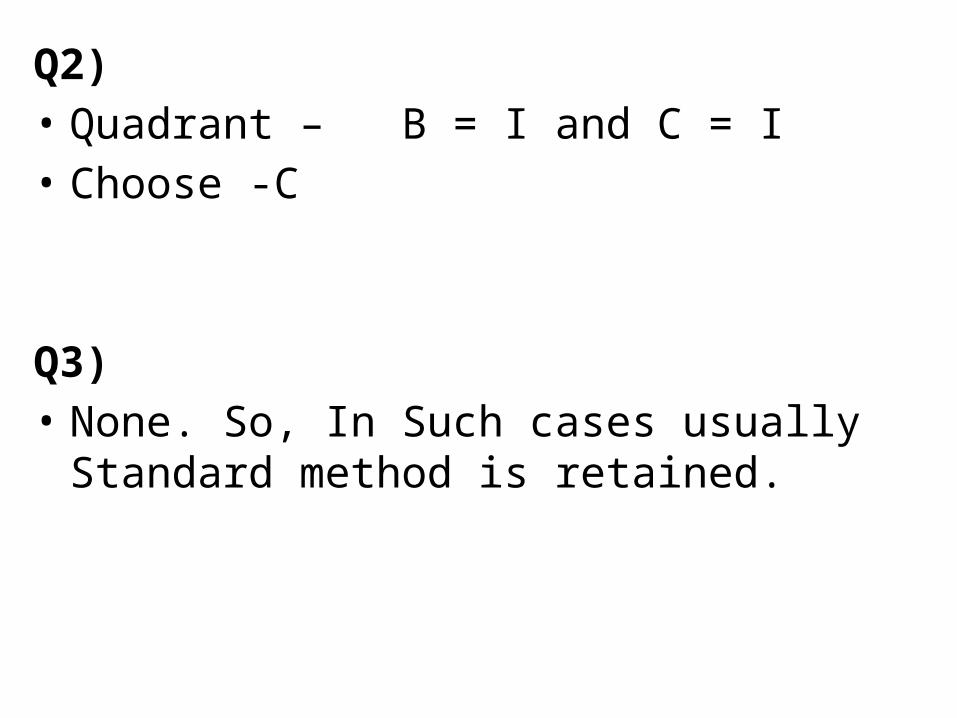
Q2) • Quadrant – B = I and C = I• Choose -C
Q3) • None. So, In Such cases usually Standard
method is retained.

Cost-Utility Analysis
• E.g, Osteoarthritis Knee – QALY of :- Arthodesis Vs Knee Replacement
Surgery
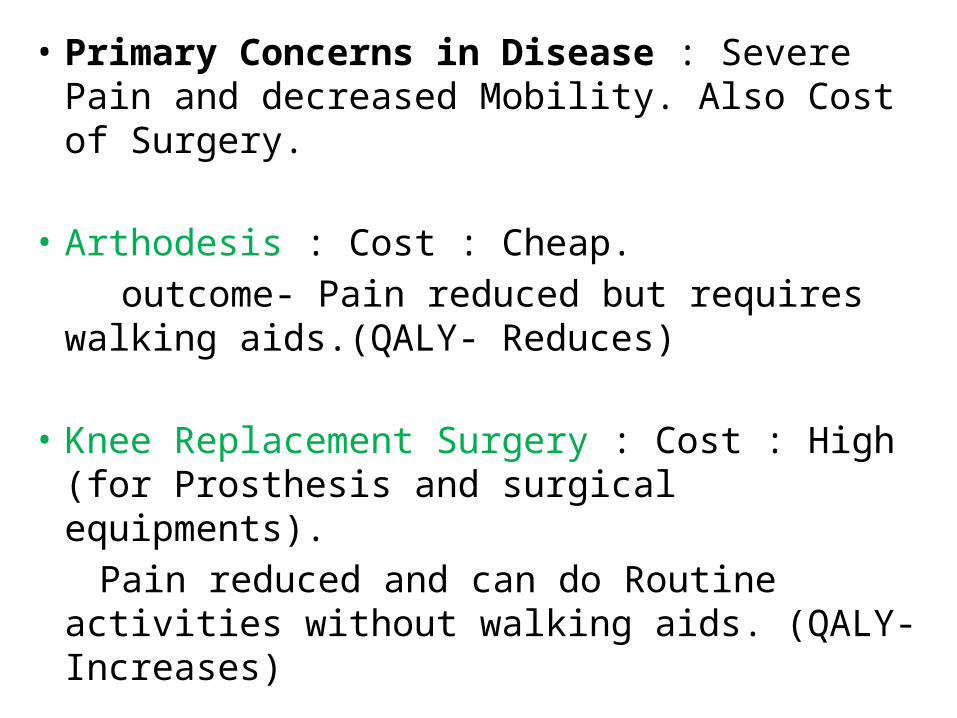
• Primary Concerns in Disease : Severe Pain and decreased Mobility. Also Cost of Surgery.
• Arthodesis : Cost : Cheap. outcome- Pain reduced but requires walking
aids.(QALY- Reduces)
• Knee Replacement Surgery : Cost : High (for Prosthesis and surgical equipments).
Pain reduced and can do Routine activities without walking aids. (QALY- Increases)
• Pharmacoeconomists sometimes want to include a measure of patient preference or quality of life when comparing competing treatment alternatives.
• Cost-utility analysis (CUA) is a method for comparing treatment alternatives that integrates patient preferences and Health-related quality of life (HRQoL).
• CUA compares cost, quality, and the quantity of patient-years.
• Cost is measured in dollars, and therapeutic outcome is measured in patient-weighted utilities rather than in physical units.
• Often the utility measurement used is a quality-adjusted life year (QALY) gained.
• QALY is a common measure of health status used in CUA, combining morbidity and mortality data.
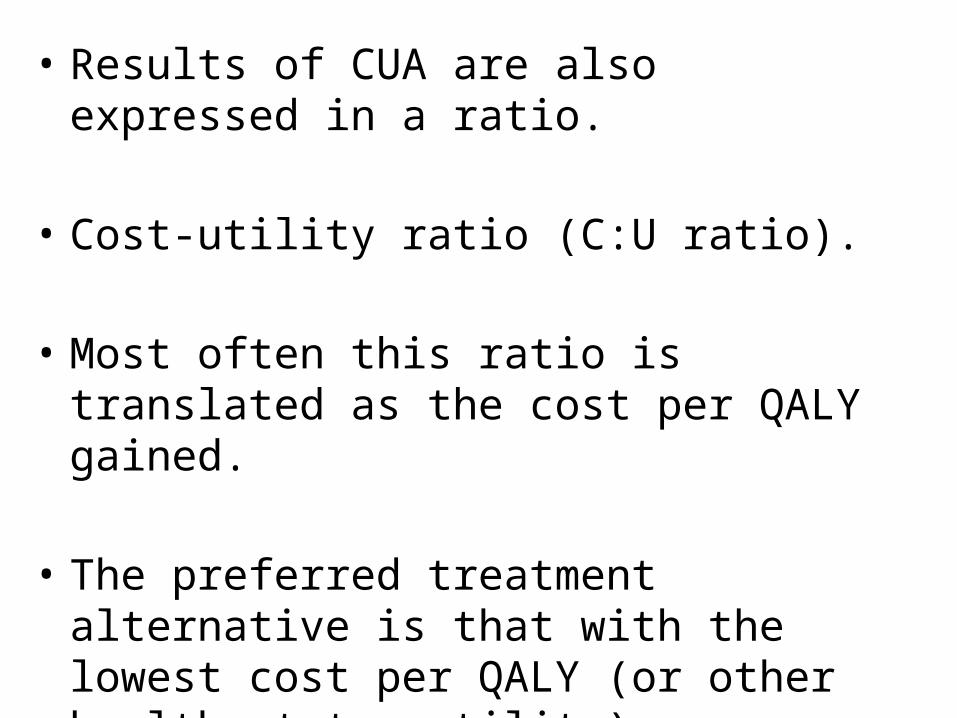
• Results of CUA are also expressed in a ratio. • Cost-utility ratio (C:U ratio).
• Most often this ratio is translated as the cost per QALY gained.
• The preferred treatment alternative is that with the lowest cost per QALY (or other health-status utility)
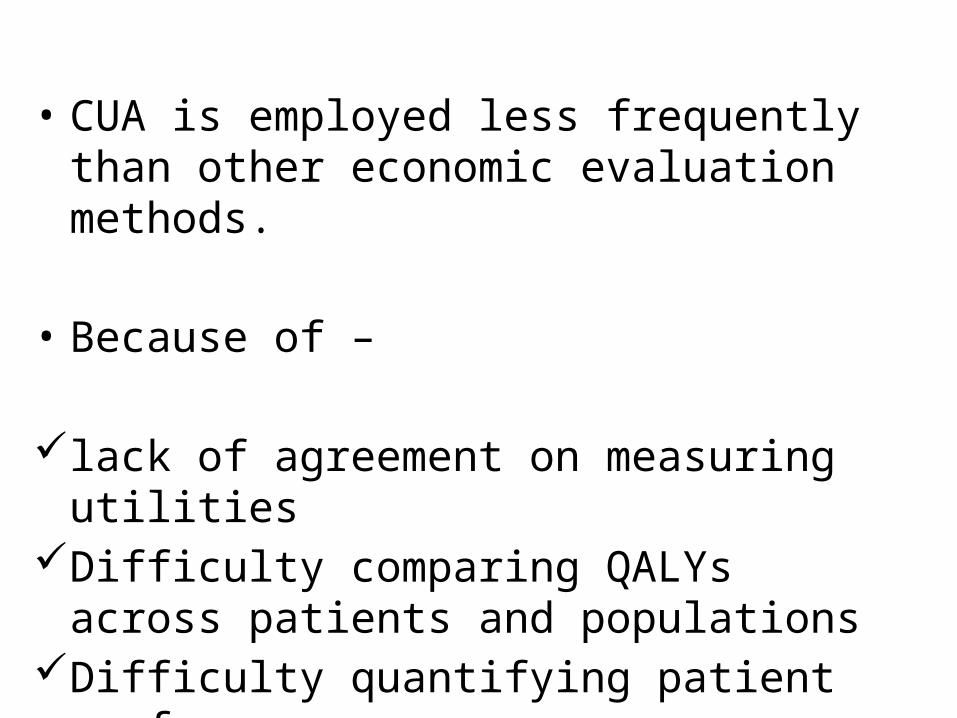
• CUA is employed less frequently than other economic evaluation methods.
• Because of –
lack of agreement on measuring utilitiesDifficulty comparing QALYs across patients and
populationsDifficulty quantifying patient preferences.
• CUA is complex, So it is limited in scope of application from a hospital perspective.
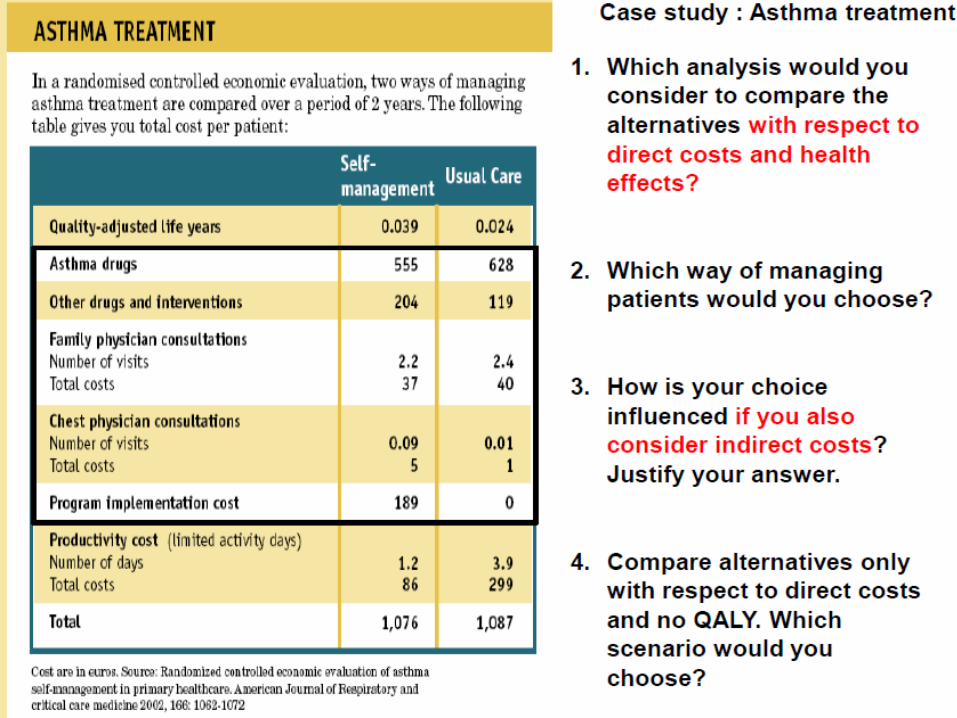
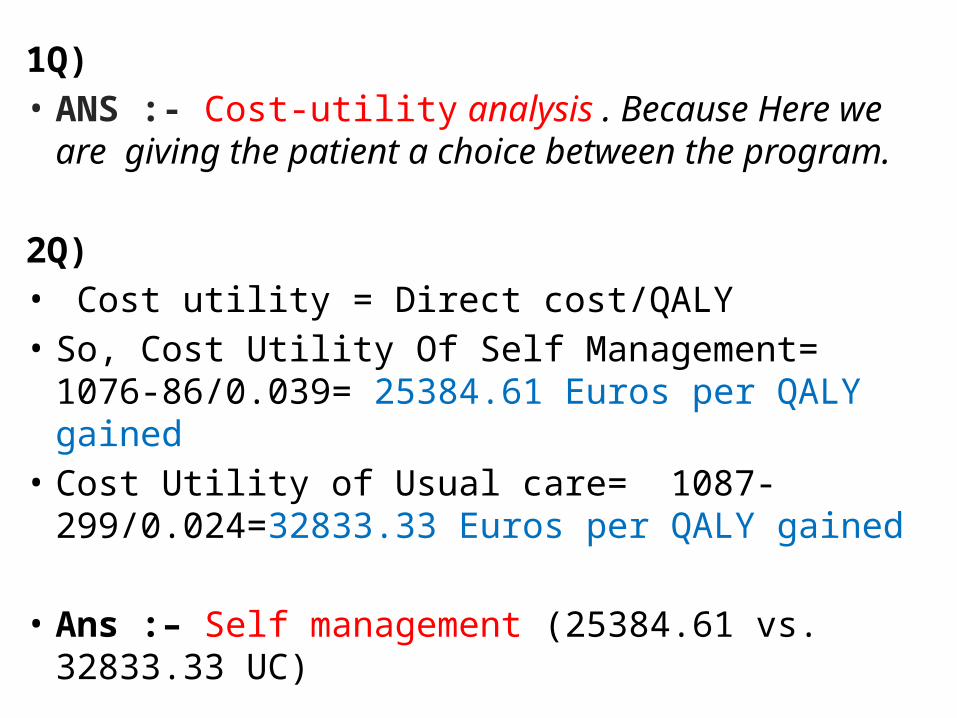
1Q)• ANS :- Cost-utility analysis . Because Here we are
giving the patient a choice between the program.
2Q)• Cost utility = Direct cost/QALY• So, Cost Utility Of Self Management= 1076-
86/0.039= 25384.61 Euros per QALY gained• Cost Utility of Usual care= 1087-
299/0.024=32833.33 Euros per QALY gained
• Ans :– Self management (25384.61 vs. 32833.33 UC)
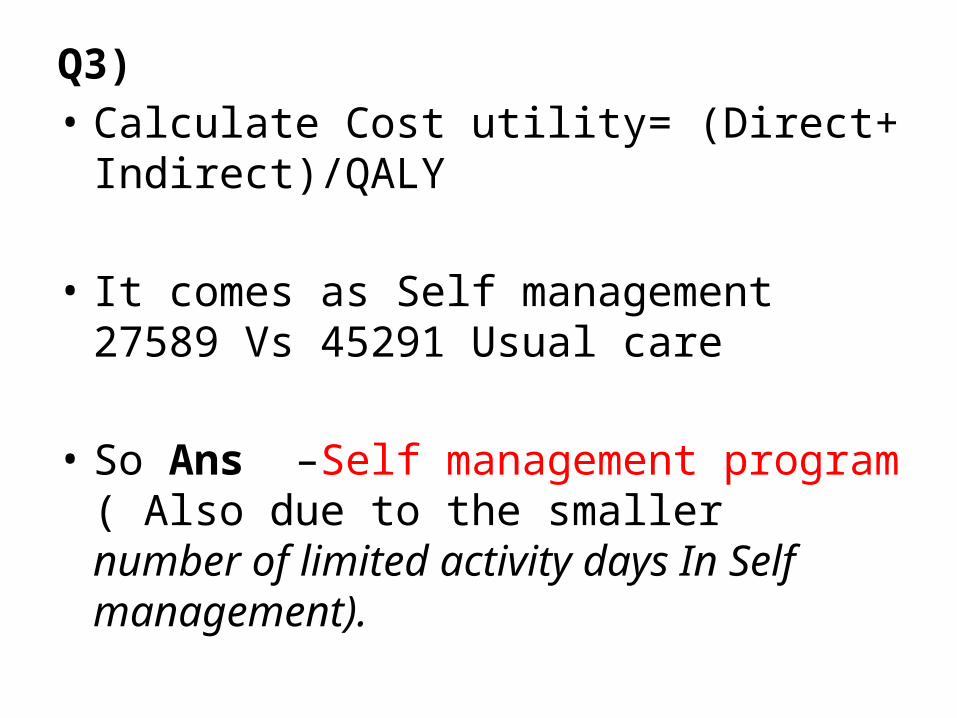
Q3)• Calculate Cost utility= (Direct+ Indirect)/QALY
• It comes as Self management 27589 Vs 45291 Usual care
• So Ans –Self management program ( Also due to the smaller number of limited activity days In Self management).
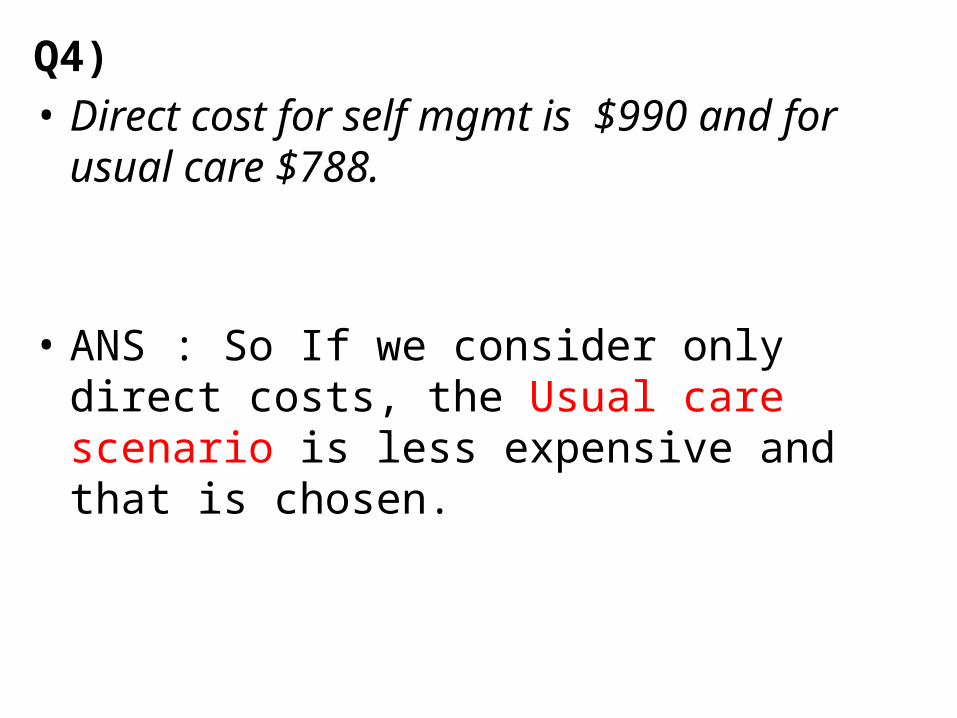
Q4)• Direct cost for self mgmt is $990 and for usual
care $788.
• ANS : So If we consider only direct costs, the Usual care scenario is less expensive and that is chosen.

Cost-Benefit AnalysisLet us Think !!!!
• Why there is High No. research going on For Diabetes, Hypertension ??
• Why there is relatively less research on Antimicrobials ??
• Why Pharma companies requests to CDSCO to Waiver Phase III trials of NDA for Multiple Myeloma and some rare type of cancers ??
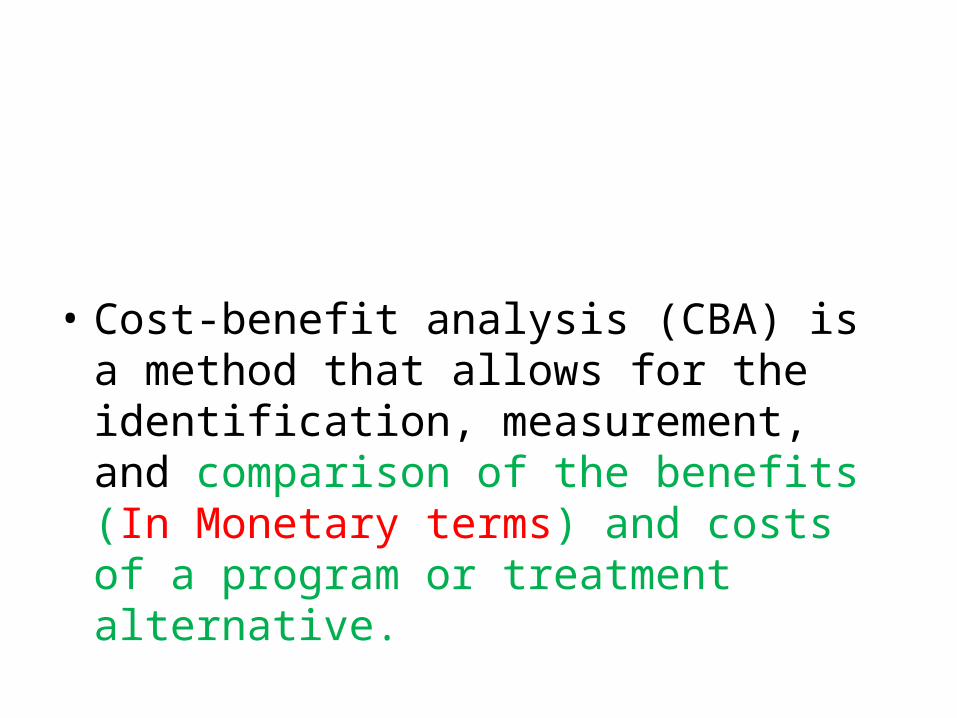
• Cost-benefit analysis (CBA) is a method that allows for the identification, measurement, and comparison of the benefits (In Monetary terms) and costs of a program or treatment alternative.
• Both the costs and the benefits are measured and converted into equivalent dollars in the year in which they will occur.
• Future costs and benefits are discounted or reduced to their current value.
• These costs and benefits are expressed as a ratio (a benefit-to-cost ratio), a net benefit, or a net cost.
• A clinical decision maker would choose the program or treatment alternative with the highest net benefit or the greatest benefit-to-cost (B:C) ratio.
• Guidelines for the interpretation of this ratio are –
• 1. If the B:C ratio is greater than 1, the program or treatment is of value.—
The benefits realized by the program or treatment
alternative outweigh the cost of providing it.
• 2. If the B:C ratio equals 1— -- the benefits equal the cost. --The benefits realized by the program or
treatment alternative are equivalent to the cost of providing it.
• 3. If the B:C ratio is less than 1, the program or treatment is not economically beneficial.
• CBA can be an appropriate method to use in justifying and documenting the value of an existing healthcare service or the potential worth of a new one.
• For e.g, Conventional ultrasound (present in Hospital for last 20 yrs) Vs To purchase a New color Doppler sonography.
• However, the relative magnitude of the costs and benefits for the service must be considered when making this resource-allocation decision.
• If a service costs $100 to implement and results in a benefit to the hospital of $1,000, and a service that costs $100,000 to implement results in a benefit of $1 million, both have a B:C ratio of 10.
• Thus caution should be exercised when using B:C ratios and CBA as a comparison tool.
• Of all Pharmacoeconomic evaluation methods, CBA is probably used the least. Because—
Although, method has the advantage of valuing indirect costs and Intangible costs (monetarily) ,
Valuation of outcomes such as productivity and quality of life is difficult to perform reliably and meaningfully.
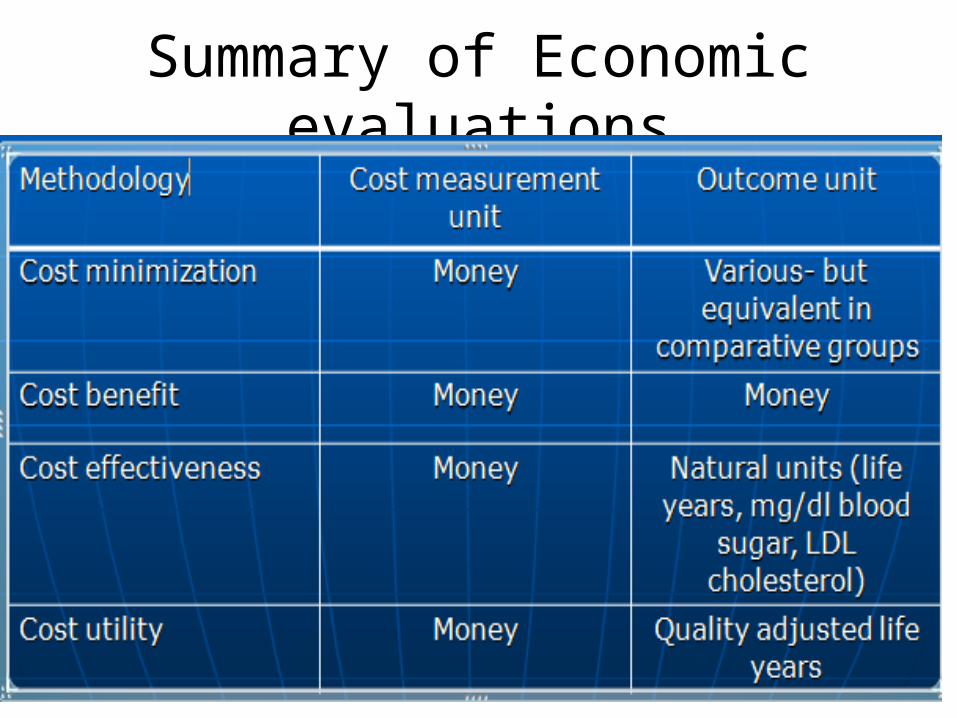
Summary of Economic evaluations
LIMITATIONS OF PHARMACOECONOMIC EVALUATION
• The whole process may be open to bias,
in the choice of comparator drug, the assumptions made, or in the selective reporting of results.
• This suspicion arises because most studies are conducted or funded by pharmaceutical companies.
• Health economics is therefore sometimes misused as a marketing ploy .
References• LISA SANCHEZ TRASK, Access Pharmacy Chapter 1. Pharmacoeconomics: Principles,
Methods, and Applications. http://accesspharmacy.mhmedical.com/content.aspx?bookid=462§ionid=41100767.
• Tom Walley, M.D. Chapter 9. Pharmacoeconomics and Economic Evaluation of Drug Therapies
• SURENDRA G. GATTANI. PHARMACOECONOMICS: A REVIEW. Asian Journal of Pharmaceutical and Clinical Research Vol.2 Issue 3, July-September 2009.

THANK YOU


