pharma & biotech 2015 in review -...
TRANSCRIPT
Pharma & Biotech 2015 in ReviewLisa Urquhart and Jonathan Gardner – March 2016
2 Copyright © 2016 Evaluate Ltd. All rights reserved.EP Vantage Pharma & Biotech 2015 in Review
Pharma and Biotech 2015 in Review
What a difference a few months make. Before the cold chill set into the market at the beginning of 2016 many were predicting more good times for the sector, especially as much of 2015 echoed the exuberance of a super-charged 2014.
Until the autumn share prices continued to set highs, the IPO window remained wide open, VCs revelled in their
returns, and if there were suspicions that the good times could be stalling all one had to do was look at Pfizer’s
record-breaking move on Allergan.
Many had also seen the continued magnanimity of the FDA in approving new medicines as a sign that improved
productivity in the market would persist in driving valuations.
Since then all has changed. A brief year-end rally has been replaced by further stock price slides, wiping out a
whole year’s worth of gains for the Nasdaq biotech index.
The sentiment issues facing the industry – criticism about high drug prices, the gradual closing of the tax inversion
loophole, and the feeling that company valuations are still too high – remain. Add to this the worsening macro-
economic environment, and it is unlikely that the current volatility in the market will subside quickly.
There had always been dissenting voices about the robustness of the current bull run, but in 2015 they began
crystallising around pricing. First in the spotlight was Valeant, which drew criticism for the price hikes for the heart
drugs Nitropress and Isuprel, but 2015 will perhaps be best remembered for Martin Shkreli bursting onto front
pages with the 5,000% price increase for the generic toxoplasmosis drug Daraprim.
While the industry was quick to distance itself from a seemingly unapologetic Mr Shkreli, his actions had catapulted
price gouging into the consciousness of the US public and the political arena.
The first big fall in the market came in mid-September after the presidential hopeful Hillary Clinton vowed to take
on this sort of price-gouging in the industry. Then came a slowdown in China and falling oil prices.
One company that perhaps summed up the switch in fortunes in 2015 is NantKwest. The oncology group managed
to float in July, raising $223m, and then saw a 39% share price jump on its first day of trading bumped its market
cap up to $2.6bn.
However, despite the fairytale beginning, the happily ever after proved more elusive, as the shares were more than
50% below their IPO price three months after floating. In November the group was forced to undertake a $50m
share buyback programme – highly unusual for a lossmaking biotech –to shore up its flagging stock price.
Copyright © 2016 Evaluate Ltd. All rights reserved.
That said, the year was not without its positives. Companies continued to push scientific innovation, and the fever
around CRISPR replaced the previous year’s excitement over CAR-T therapies. However, both technologies are
very much in their infancy in terms of producing working therapeutics.
The venture capital haul topped an already impressive total for 2014, and until the very end of the year VCs were
able to get exits. However, the trend for larger rounds to fewer recipients continued, again raising fears that the
lack of funding for the industry’s smaller players could choke off innovation.
The FDA continued approving new products, and 2015 saw a record-breaking 57 new drugs hit the US market, the
highest total this century. That said, the sales potential of this expanded cohort was still below the forecasts for the
class of 2014, which included future blockbusters Harvoni, Opdivo and Keytruda. But even so, the number of drugs
moving through pipelines gave hope to industry observers.
Since the end of 2015 the volatility in the market has left the industry falling into two distinct camps: those who
believe that fundamentals remain strong and that the markets will recover, driven by the need for new medicines,
aging western populations and the development of paradigm shifting treatments. Then there are the bears,
who see the current woes as the beginning of a larger shift in the industry, where outside pricing pressure
and over-stretched valuations are finally coming home to roost, and believe that at best 2016 will remain an
uncharacteristically quiet year, with valuations falling even further as macro-economic factors weigh on global
markets.
Certainly, companies like Axovant, Agios Pharmaceuticals and Blueprint Medicines, which managed to float despite
not having any projects in clinical development, now look like a market operating at the height of folly. As such the
current conditions could be the start of a shakeout of biotech unicorns.
Either way, the current correction in stock prices means that for the first time in years bargains can be had,
presenting an ideal time for the cash rich to hoover up discounted companies. Perhaps when we return to look at
2016 it might be remembered as the year of M&A.
Unless stated, all data are sourced to EvaluatePharma and were compiled in January 2016.
3 EP Vantage Pharma & Biotech 2015 in Review
Copyright © 2016 Evaluate Ltd. All rights reserved.4 Investor infatuation tempered
Investor infatuation tempered
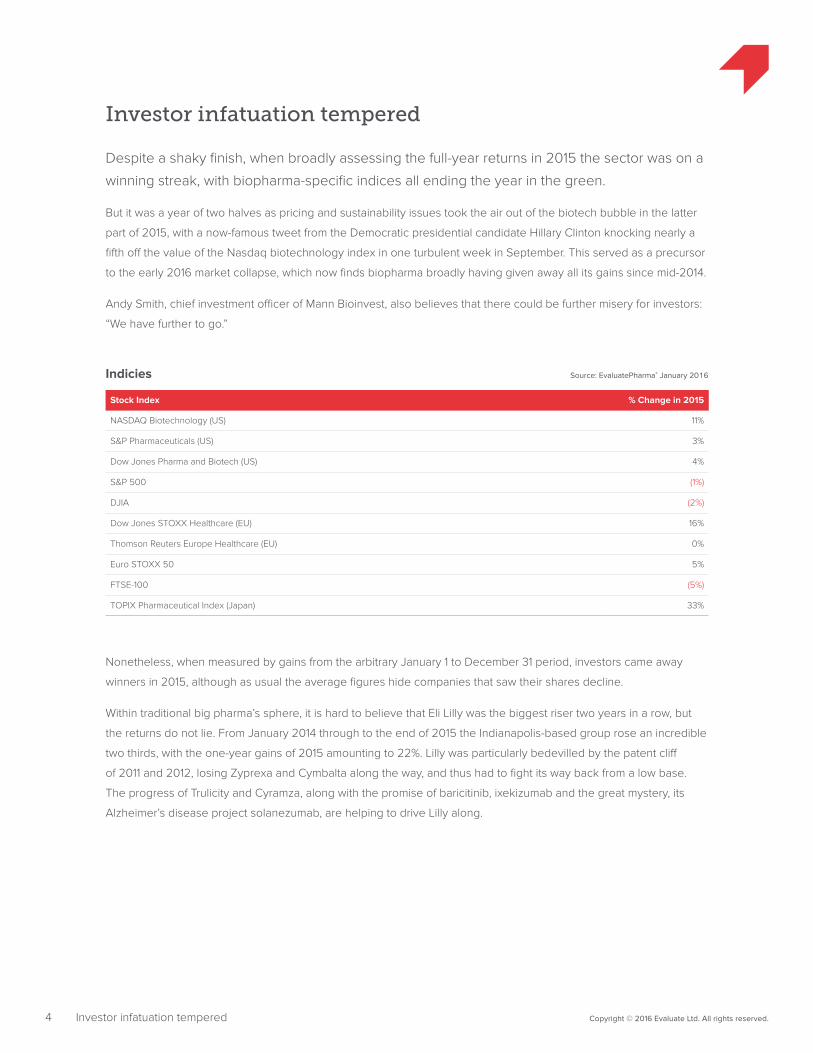
Despite a shaky finish, when broadly assessing the full-year returns in 2015 the sector was on a
winning streak, with biopharma-specific indices all ending the year in the green.
But it was a year of two halves as pricing and sustainability issues took the air out of the biotech bubble in the latter
part of 2015, with a now-famous tweet from the Democratic presidential candidate Hillary Clinton knocking nearly a
fifth off the value of the Nasdaq biotechnology index in one turbulent week in September. This served as a precursor
to the early 2016 market collapse, which now finds biopharma broadly having given away all its gains since mid-2014.
Andy Smith, chief investment officer of Mann Bioinvest, also believes that there could be further misery for investors:
“We have further to go.”
Stock Index % Change in 2015
NASDAQ Biotechnology (US) 11%
S&P Pharmaceuticals (US) 3%
Dow Jones Pharma and Biotech (US) 4%
S&P 500 (1%)
DJIA (2%)
Dow Jones STOXX Healthcare (EU) 16%
Thomson Reuters Europe Healthcare (EU) 0%
Euro STOXX 50 5%
FTSE-100 (5%)
TOPIX Pharmaceutical Index (Japan) 33%
Indicies Source: EvaluatePharma® January 2016
Nonetheless, when measured by gains from the arbitrary January 1 to December 31 period, investors came away
winners in 2015, although as usual the average figures hide companies that saw their shares decline.
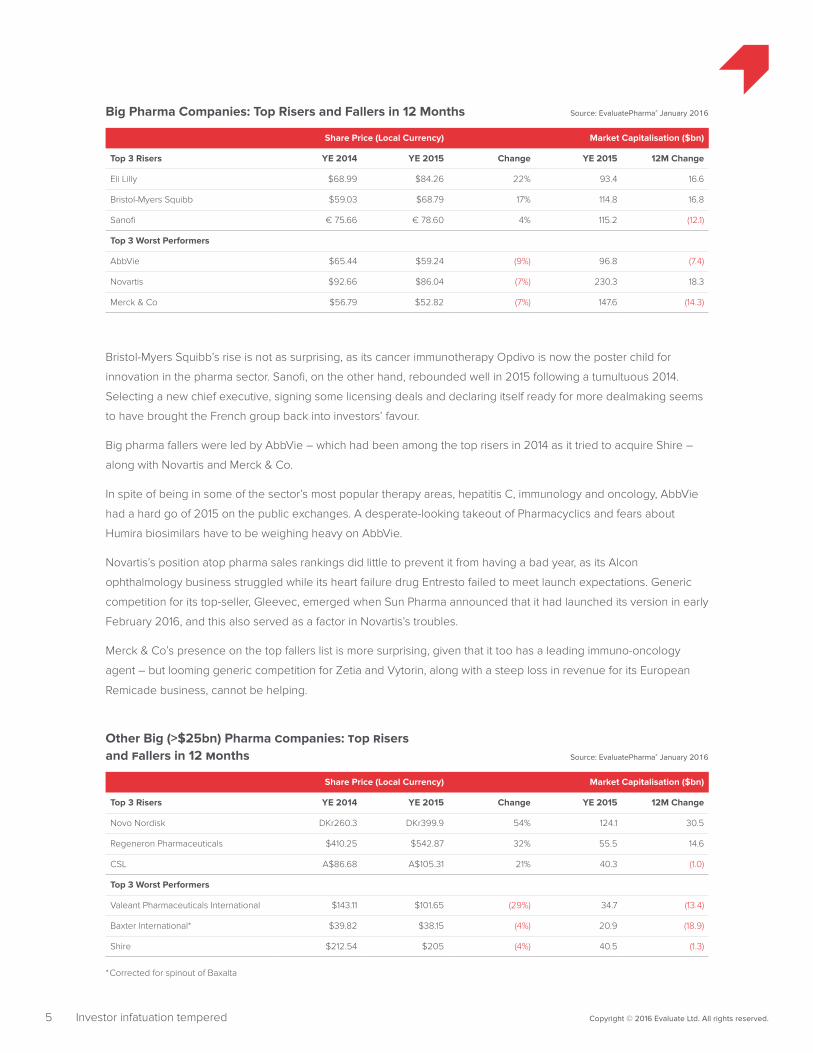
Within traditional big pharma’s sphere, it is hard to believe that Eli Lilly was the biggest riser two years in a row, but
the returns do not lie. From January 2014 through to the end of 2015 the Indianapolis-based group rose an incredible
two thirds, with the one-year gains of 2015 amounting to 22%. Lilly was particularly bedevilled by the patent cliff
of 2011 and 2012, losing Zyprexa and Cymbalta along the way, and thus had to fight its way back from a low base.
The progress of Trulicity and Cyramza, along with the promise of baricitinib, ixekizumab and the great mystery, its
Alzheimer’s disease project solanezumab, are helping to drive Lilly along.
Copyright © 2016 Evaluate Ltd. All rights reserved.5 Investor infatuation tempered
Share Price (Local Currency) Market Capitalisation ($bn)
Top 3 Risers YE 2014 YE 2015 Change YE 2015 12M Change
Eli Lilly $68.99 $84.26 22% 93.4 16.6
Bristol-Myers Squibb $59.03 $68.79 17% 114.8 16.8
Sanofi € 75.66 € 78.60 4% 115.2 (12.1)
Top 3 Worst Performers
AbbVie $65.44 $59.24 (9%) 96.8 (7.4)
Novartis $92.66 $86.04 (7%) 230.3 18.3
Merck & Co $56.79 $52.82 (7%) 147.6 (14.3)
Share Price (Local Currency) Market Capitalisation ($bn)
Top 3 Risers YE 2014 YE 2015 Change YE 2015 12M Change
Novo Nordisk DKr260.3 DKr399.9 54% 124.1 30.5
Regeneron Pharmaceuticals $410.25 $542.87 32% 55.5 14.6
CSL A$86.68 A$105.31 21% 40.3 (1.0)
Top 3 Worst Performers
Valeant Pharmaceuticals International $143.11 $101.65 (29%) 34.7 (13.4)
Baxter International* $39.82 $38.15 (4%) 20.9 (18.9)
Shire $212.54 $205 (4%) 40.5 (1.3)
Big Pharma Companies: Top Risers and Fallers in 12 Months Source: EvaluatePharma® January 2016
Other Big (>$25bn) Pharma Companies: Top Risers and Fallers in 12 Months Source: EvaluatePharma® January 2016
*Corrected for spinout of Baxalta
Bristol-Myers Squibb’s rise is not as surprising, as its cancer immunotherapy Opdivo is now the poster child for
innovation in the pharma sector. Sanofi, on the other hand, rebounded well in 2015 following a tumultuous 2014.
Selecting a new chief executive, signing some licensing deals and declaring itself ready for more dealmaking seems
to have brought the French group back into investors’ favour.
Big pharma fallers were led by AbbVie – which had been among the top risers in 2014 as it tried to acquire Shire –
along with Novartis and Merck & Co.
In spite of being in some of the sector’s most popular therapy areas, hepatitis C, immunology and oncology, AbbVie
had a hard go of 2015 on the public exchanges. A desperate-looking takeout of Pharmacyclics and fears about
Humira biosimilars have to be weighing heavy on AbbVie.
Novartis’s position atop pharma sales rankings did little to prevent it from having a bad year, as its Alcon
ophthalmology business struggled while its heart failure drug Entresto failed to meet launch expectations. Generic
competition for its top-seller, Gleevec, emerged when Sun Pharma announced that it had launched its version in early
February 2016, and this also served as a factor in Novartis’s troubles.
Merck & Co’s presence on the top fallers list is more surprising, given that it too has a leading immuno-oncology
agent – but looming generic competition for Zetia and Vytorin, along with a steep loss in revenue for its European
Remicade business, cannot be helping.
Copyright © 2016 Evaluate Ltd. All rights reserved.6 Investor infatuation tempered
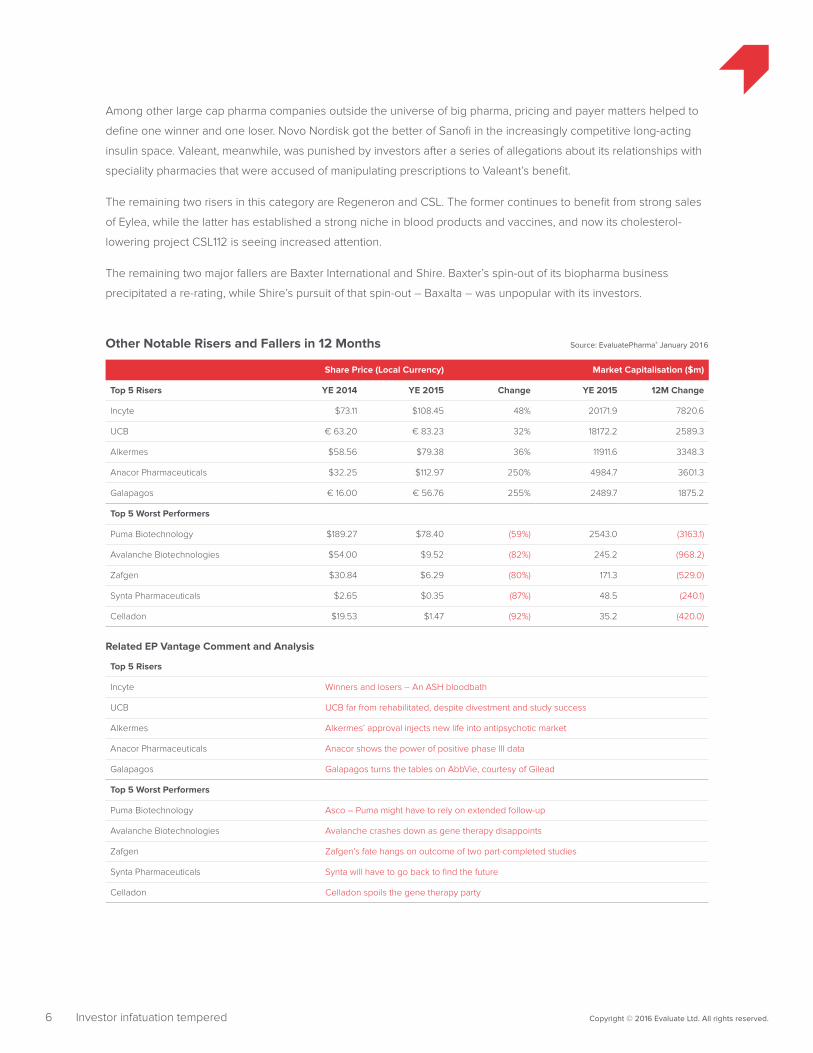
Among other large cap pharma companies outside the universe of big pharma, pricing and payer matters helped to
define one winner and one loser. Novo Nordisk got the better of Sanofi in the increasingly competitive long-acting
insulin space. Valeant, meanwhile, was punished by investors after a series of allegations about its relationships with
speciality pharmacies that were accused of manipulating prescriptions to Valeant’s benefit.
The remaining two risers in this category are Regeneron and CSL. The former continues to benefit from strong sales
of Eylea, while the latter has established a strong niche in blood products and vaccines, and now its cholesterol-
lowering project CSL112 is seeing increased attention.
The remaining two major fallers are Baxter International and Shire. Baxter’s spin-out of its biopharma business
precipitated a re-rating, while Shire’s pursuit of that spin-out – Baxalta – was unpopular with its investors.
Share Price (Local Currency) Market Capitalisation ($m)
Top 5 Risers YE 2014 YE 2015 Change YE 2015 12M Change
Incyte $73.11 $108.45 48% 20171.9 7820.6
UCB € 63.20 € 83.23 32% 18172.2 2589.3
Alkermes $58.56 $79.38 36% 11911.6 3348.3
Anacor Pharmaceuticals $32.25 $112.97 250% 4984.7 3601.3
Galapagos € 16.00 € 56.76 255% 2489.7 1875.2
Top 5 Worst Performers
Puma Biotechnology $189.27 $78.40 (59%) 2543.0 (3163.1)
Avalanche Biotechnologies $54.00 $9.52 (82%) 245.2 (968.2)
Zafgen $30.84 $6.29 (80%) 171.3 (529.0)
Synta Pharmaceuticals $2.65 $0.35 (87%) 48.5 (240.1)
Celladon $19.53 $1.47 (92%) 35.2 (420.0)
Top 5 Risers
Incyte Winners and losers – An ASH bloodbath
UCB UCB far from rehabilitated, despite divestment and study success
Alkermes Alkermes’ approval injects new life into antipsychotic market
Anacor Pharmaceuticals Anacor shows the power of positive phase III data
Galapagos Galapagos turns the tables on AbbVie, courtesy of Gilead
Top 5 Worst Performers
Puma Biotechnology Asco – Puma might have to rely on extended follow-up
Avalanche Biotechnologies Avalanche crashes down as gene therapy disappoints
Zafgen Zafgen’s fate hangs on outcome of two part-completed studies
Synta Pharmaceuticals Synta will have to go back to find the future
Celladon Celladon spoils the gene therapy party
Other Notable Risers and Fallers in 12 Months Source: EvaluatePharma® January 2016
Related EP Vantage Comment and Analysis
Among the mid- and small-cap companies, it was primarily clinical and business development that defined the
biggest risers and fallers. For example, Incyte and Galapagos were on a roll because of expectations for their assets
Jakafi and filgotinib – the former crashing out in pancreatic cancer in February 2016. On the negative side of the
ledger, Avalanche, Zafgen, Synta, and Celladon all faced clinical setbacks.
Zafgen and Synta may have been punished more severely by having the misfortune of facing failure just as the
broader biotech market was imploding.
Copyright © 2016 Evaluate Ltd. All rights reserved.7 Investor infatuation tempered
8 Copyright © 2016 Evaluate Ltd. All rights reserved.IPO – Volatility the order of the day
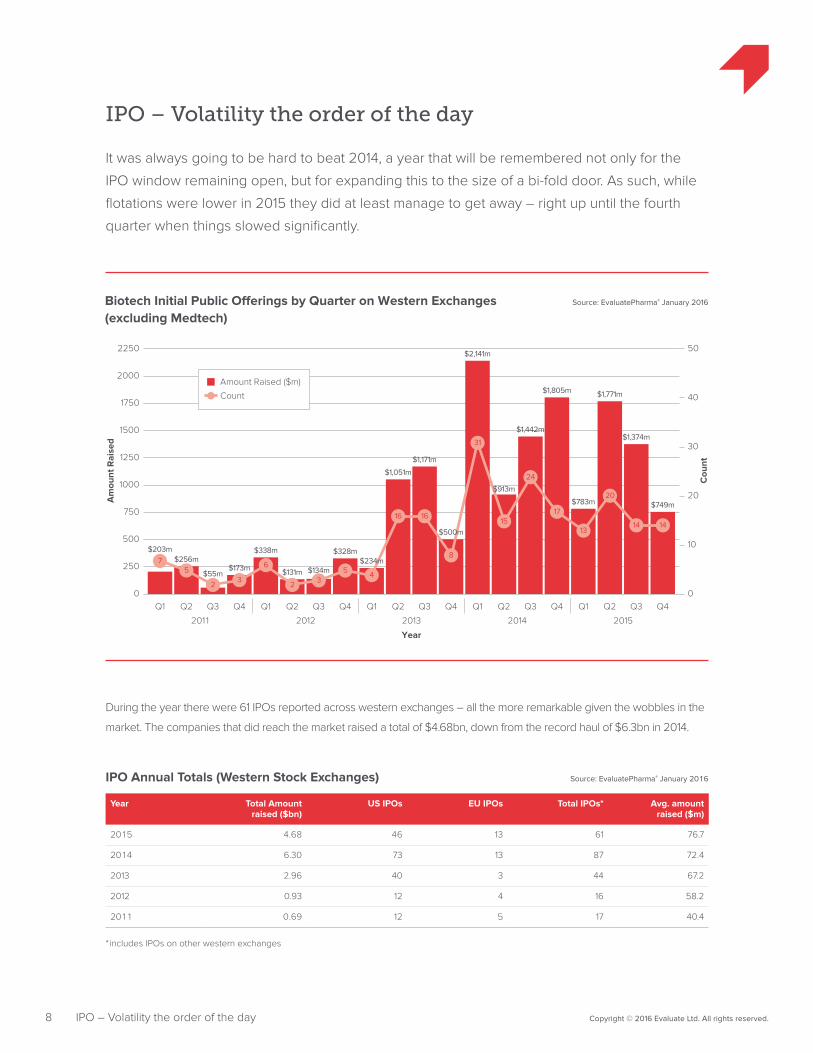
Source: EvaluatePharma® January 2016Biotech Initial Public O�erings by Quarter on Western Exchanges (excluding Medtech)
Am
ount
Rai
sed
Cou
nt
250
750
500
1000
1500
1250
1750
2000
2250 50
40
30
20
10
0Q1
$203m
Q2
$256m
Q3
$55m
Q4
$173m
Q1
$338m
Q2
$131m
Q3
$134m
Q4
$328m
Q1 Q2
$1,051m
Q3
$1,171m
Q4 Q1
$2,141m
Q2 Q3
$1,442m
Q4
$1,805m
Q1
$783m
Q2
$1,771m
Q3
$1,374m
Q4
$749m
0
1414
20
13
17
24
15
31
8
1616
4532
6
32
57 $234m
$500m
$913m
Amount Raised ($m)
Count
2012 2013 2014 20152011
Year
IPO – Volatility the order of the day
It was always going to be hard to beat 2014, a year that will be remembered not only for the
IPO window remaining open, but for expanding this to the size of a bi-fold door. As such, while
flotations were lower in 2015 they did at least manage to get away – right up until the fourth
quarter when things slowed significantly.
During the year there were 61 IPOs reported across western exchanges – all the more remarkable given the wobbles in the
market. The companies that did reach the market raised a total of $4.68bn, down from the record haul of $6.3bn in 2014.
Year Total Amount raised ($bn)
US IPOs EU IPOs Total IPOs* Avg. amount raised ($m)
2015 4.68 46 13 61 76.7
2014 6.30 73 13 87 72.4
2013 2.96 40 3 44 67.2
2012 0.93 12 4 16 58.2
2011 0.69 12 5 17 40.4
IPO Annual Totals (Western Stock Exchanges) Source: EvaluatePharma® January 2016
* includes IPOs on other western exchanges
9 Copyright © 2016 Evaluate Ltd. All rights reserved.IPO – Volatility the order of the day
Company Amount raised
Offering price ($)
Range Discount/premium
Exchange YE2015 Share Price Change
Since Float
Date
Axovant $315m 15.00 $13-$18 (3%) NYSE 20% June
NantKwest $208m 25.00 $20-$23 16% Nasdaq (31%) July
Adaptimmune $191m 17.00 $15-$17 6% Nasdaq (29%) April
Spark Therapeutics $161m 23.00 $19-$21 10% Nasdaq 97% January
Aimmune Therapeutics $160m 16.00 $14-$16 7% Nasdaq 15% August
Blueprint Medicines $147m 18.00 $17-$19 0% Nasdaq 46% April
REGENXBIO $139m 22.00 $14-$16 47% Nasdaq (25%) September
ProNAi Therapeutics $138m 17.00 $15-17 6% Nasdaq (12%) July
Seres Therapeutics $134m 18.00 $16-18 6% Nasdaq 95% June
Global Blood Therapeutics $120m 20.00 $14-16 33% Nasdaq 62% August
Average across top 10 IPOs $171m 13% 24%
Average across all 61 IPOs $76.7m (5%) 8%
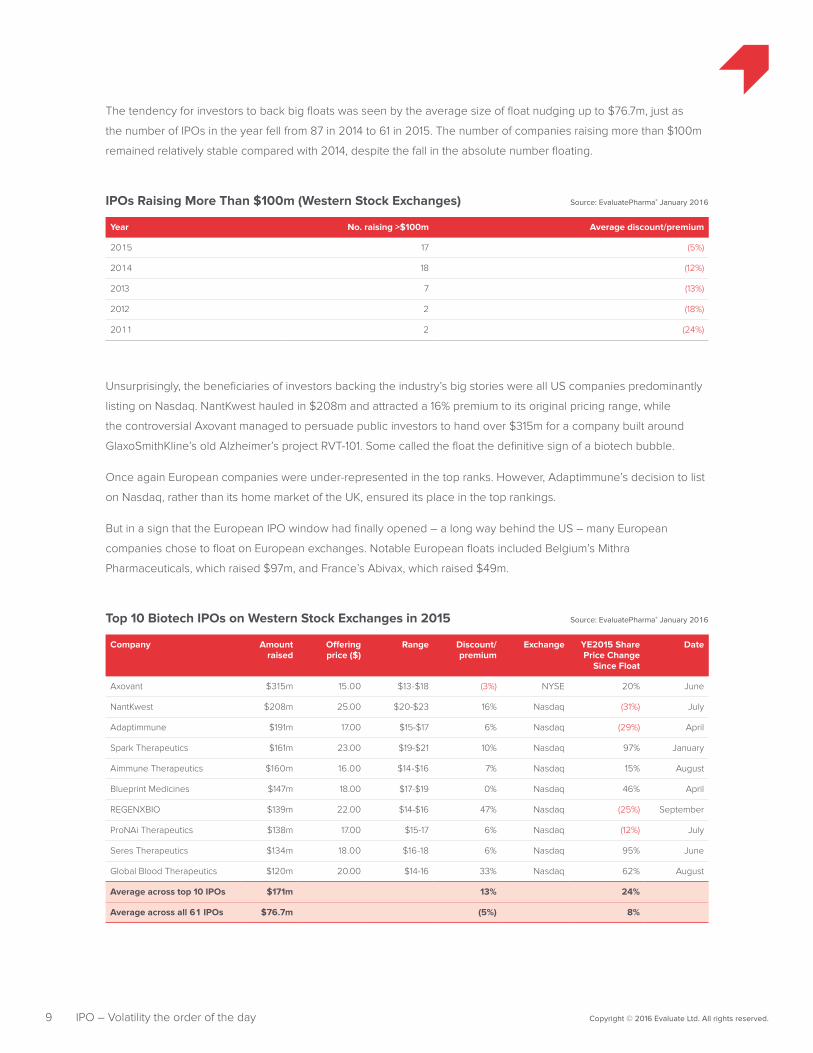
Year No. raising >$100m Average discount/premium
2015 17 (5%)
2014 18 (12%)
2013 7 (13%)
2012 2 (18%)
2011 2 (24%)
Top 10 Biotech IPOs on Western Stock Exchanges in 2015 Source: EvaluatePharma® January 2016
IPOs Raising More Than $100m (Western Stock Exchanges) Source: EvaluatePharma® January 2016
The tendency for investors to back big floats was seen by the average size of float nudging up to $76.7m, just as
the number of IPOs in the year fell from 87 in 2014 to 61 in 2015. The number of companies raising more than $100m
remained relatively stable compared with 2014, despite the fall in the absolute number floating.
Unsurprisingly, the beneficiaries of investors backing the industry’s big stories were all US companies predominantly
listing on Nasdaq. NantKwest hauled in $208m and attracted a 16% premium to its original pricing range, while
the controversial Axovant managed to persuade public investors to hand over $315m for a company built around
GlaxoSmithKline’s old Alzheimer’s project RVT-101. Some called the float the definitive sign of a biotech bubble.
Once again European companies were under-represented in the top ranks. However, Adaptimmune’s decision to list
on Nasdaq, rather than its home market of the UK, ensured its place in the top rankings.
But in a sign that the European IPO window had finally opened – a long way behind the US – many European
companies chose to float on European exchanges. Notable European floats included Belgium’s Mithra
Pharmaceuticals, which raised $97m, and France’s Abivax, which raised $49m.
10 Copyright © 2016 Evaluate Ltd. All rights reserved.IPO – Volatility the order of the day
Haircuts – the discounts companies accept on their IPO ranges – were some of the lowest in the last five years,
indicating that valuations were being pitched more realistically. However, in what looked like a sign of the hardening
economic climate at year end, the discount to IPO price range jumped to 17% as companies tried to squeeze
themselves through what looked to be a closing IPO window.
The third and fourth quarters saw an equal number of companies floating on the public exchanges – 14 in each
period. The difference was that the fourth-quarter entrants raised just half that of the third quarter, pointing to smaller
companies willing to accept less money and bigger haircuts just to get away.
There were signs that the window was swinging shut in October, when the UK’s Shield Therapeutics and Apellis
were among the victims of turning sentiment, and both were forced to pull their float plans. There were also no
biotech IPOs on Nasdaq during December.
Shield did eventually manage to get away in 2016, but at a much reduced price, and Apellis decided not to risk the
markets at all, instead opting for a further venture capital round to get its rare disease treatments closer to market.
Genghis Lloyd-Harris, a partner at Abingworth, believes that getting IPOs away in 2016 will remain tough: “Although
the IPO window is not hermetically sealed you better have outstanding insider support to get an IPO away in the US.”
For those who did manage to float in 2015, their time on the public markets has not been easy, with many now
trading below their offer price.
The companies that did not get their IPOs completed before the end of last year now face the choice of waiting until
the markets improve or relying heavily on insiders. But as Renaissance Capital analysts point out the question will be
whether private investors will be willing to accept only modest premiums to their last venture round.
As such it looks like, rather than finding their exits through IPO in 2016, venture investors might want to turn to the
cleaner exit route of sales.
11 Copyright © 2016 Evaluate Ltd. All rights reserved.Venture funding focuses on the lucky few
Source: EvaluatePharma® January 2016Annual VC Investments with 10 Biggest Rounds Shown as Proportion of Total Raised
Inve
stm
ent
Cou
nt
2
4
6
8
10
12 500
450
400
300
350
100
50
150
200
250
00
Year
2007
$6.0bn
13%
2008
$4.8bn
15%
2009
$4.9bn
14%
2010
$4.9bn
18%
2011
$4.3bn
18%
2012
$4.8bn
18%
2013
$4.9bn
17%
2014
$7.1bn
17%
2015
$9.6bn
23%
377361
385
449
398
429414
464
369
Investment ($bn) 10 Biggest Rounds*Count
Venture funding focuses on the lucky few
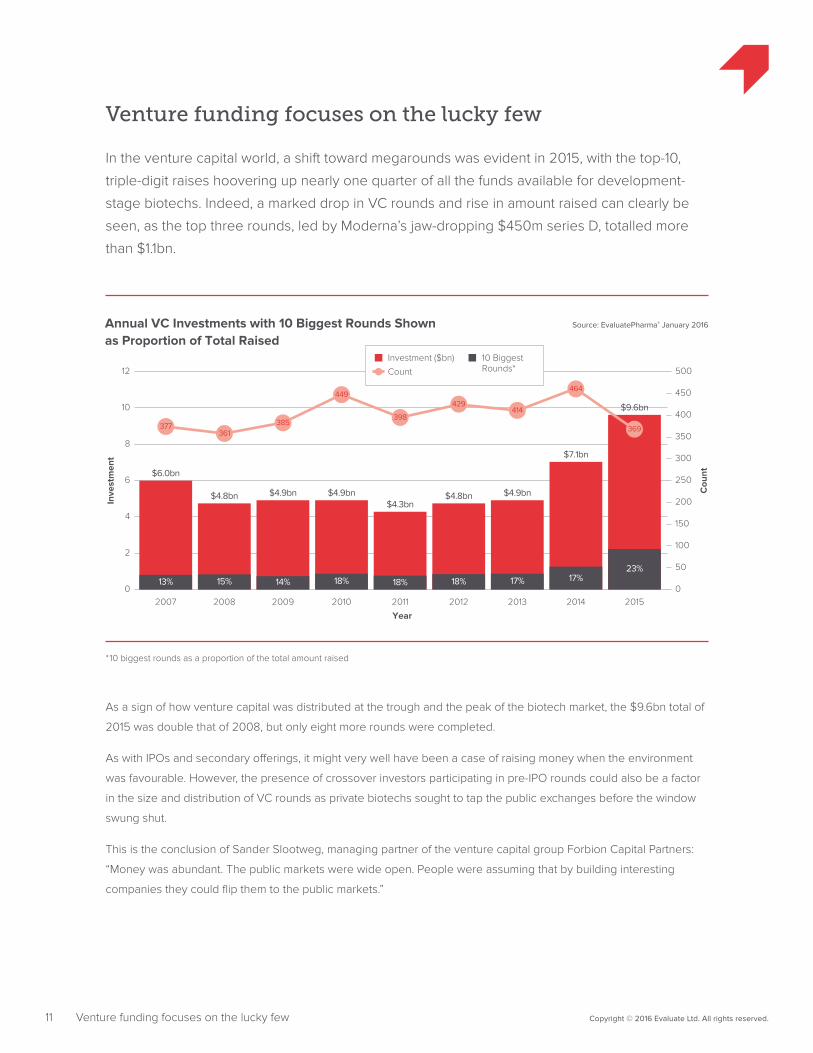
In the venture capital world, a shift toward megarounds was evident in 2015, with the top-10,
triple-digit raises hoovering up nearly one quarter of all the funds available for development-
stage biotechs. Indeed, a marked drop in VC rounds and rise in amount raised can clearly be
seen, as the top three rounds, led by Moderna’s jaw-dropping $450m series D, totalled more
than $1.1bn.
As a sign of how venture capital was distributed at the trough and the peak of the biotech market, the $9.6bn total of
2015 was double that of 2008, but only eight more rounds were completed.
As with IPOs and secondary offerings, it might very well have been a case of raising money when the environment
was favourable. However, the presence of crossover investors participating in pre-IPO rounds could also be a factor
in the size and distribution of VC rounds as private biotechs sought to tap the public exchanges before the window
swung shut.
This is the conclusion of Sander Slootweg, managing partner of the venture capital group Forbion Capital Partners:
“Money was abundant. The public markets were wide open. People were assuming that by building interesting
companies they could flip them to the public markets.”
*10 biggest rounds as a proportion of the total amount raised
12 Copyright © 2016 Evaluate Ltd. All rights reserved.Venture funding focuses on the lucky few
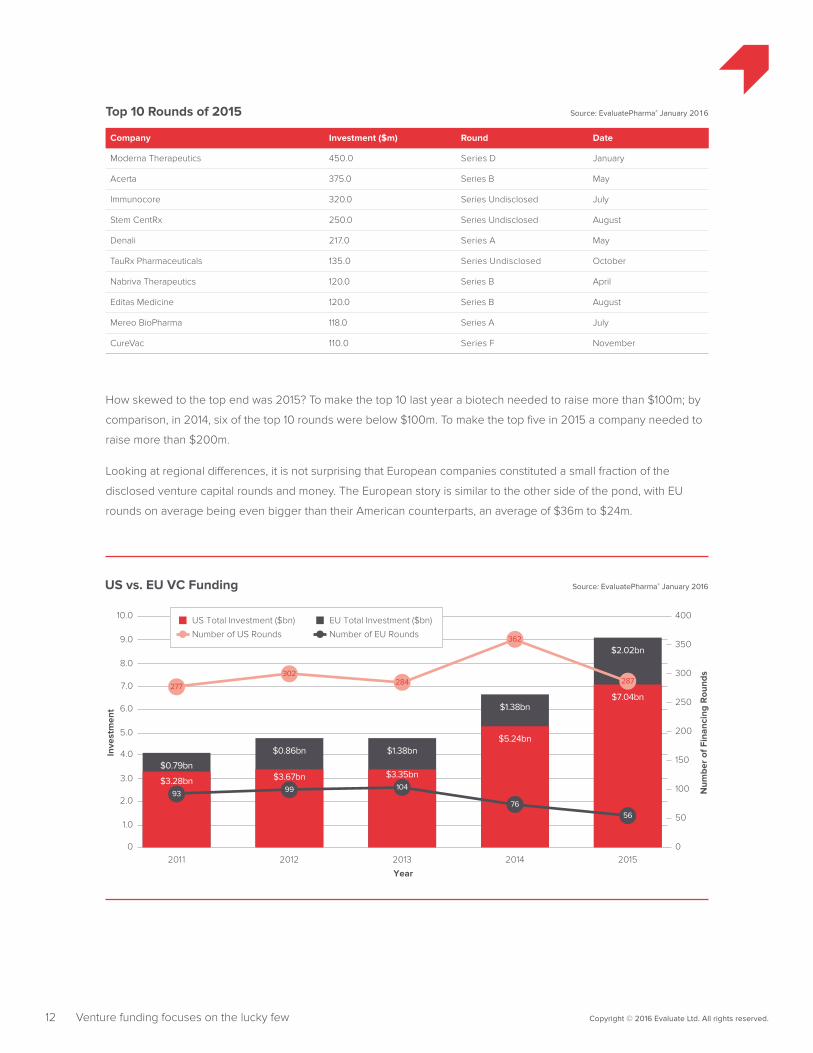
How skewed to the top end was 2015? To make the top 10 last year a biotech needed to raise more than $100m; by
comparison, in 2014, six of the top 10 rounds were below $100m. To make the top five in 2015 a company needed to
raise more than $200m.
Looking at regional differences, it is not surprising that European companies constituted a small fraction of the
disclosed venture capital rounds and money. The European story is similar to the other side of the pond, with EU
rounds on average being even bigger than their American counterparts, an average of $36m to $24m.
Company Investment ($m) Round Date
Moderna Therapeutics 450.0 Series D January
Acerta 375.0 Series B May
Immunocore 320.0 Series Undisclosed July
Stem CentRx 250.0 Series Undisclosed August
Denali 217.0 Series A May
TauRx Pharmaceuticals 135.0 Series Undisclosed October
Nabriva Therapeutics 120.0 Series B April
Editas Medicine 120.0 Series B August
Mereo BioPharma 118.0 Series A July
CureVac 110.0 Series F November
Top 10 Rounds of 2015 Source: EvaluatePharma® January 2016
Source: EvaluatePharma® January 2016US vs. EU VC Funding
Inve
stm
ent
Num
ber
of F
inan
cing
Rou
nds
1.0
2.0
3.0
4.0
5.0
6.0
7.0
8.0
9.0
10.0 400
300
350
100
50
150
200
250
00
Year
2015
$7.04bn
$2.02bn
2014
$5.24bn
$1.38bn
2013
$3.35bn
$1.38bn
2012
$3.67bn
$0.86bn
2011
$3.28bn
$0.79bn
287
362
284302
277
5676
1049993
US Total Investment ($bn)
Number of US Rounds
EU Total Investment ($bn)
Number of EU Rounds
13 Copyright © 2016 Evaluate Ltd. All rights reserved.Venture funding focuses on the lucky few
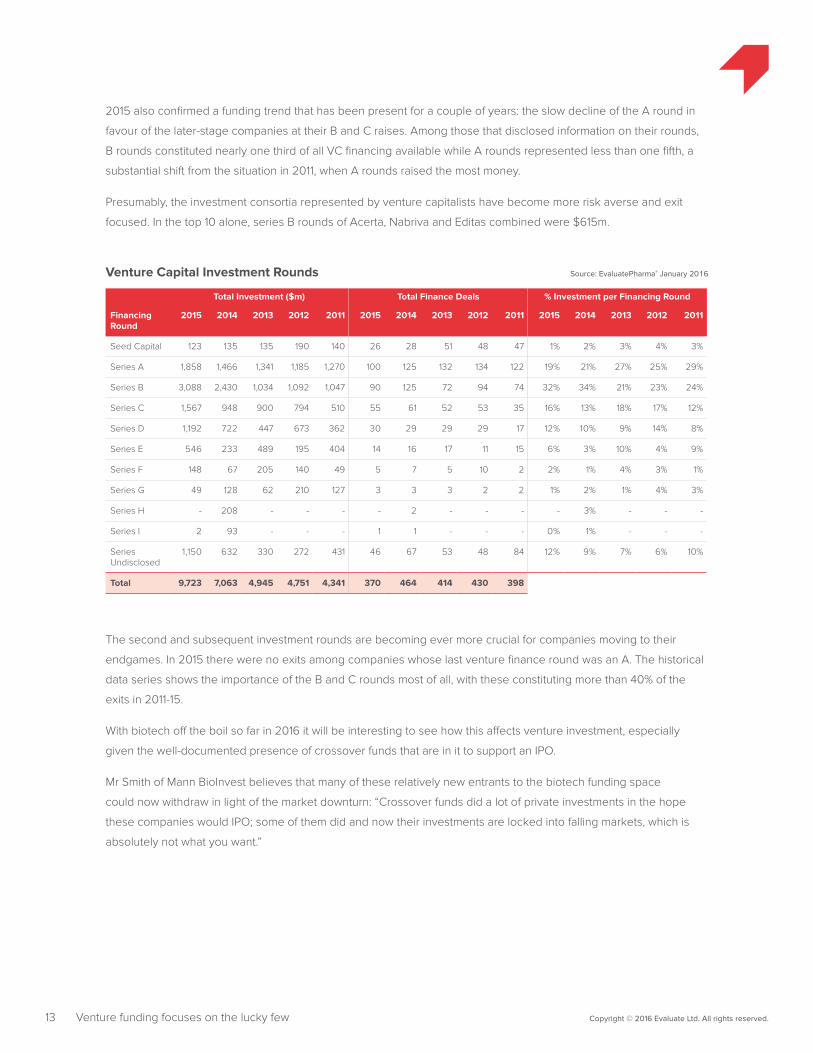
2015 also confirmed a funding trend that has been present for a couple of years: the slow decline of the A round in
favour of the later-stage companies at their B and C raises. Among those that disclosed information on their rounds,
B rounds constituted nearly one third of all VC financing available while A rounds represented less than one fifth, a
substantial shift from the situation in 2011, when A rounds raised the most money.
Presumably, the investment consortia represented by venture capitalists have become more risk averse and exit
focused. In the top 10 alone, series B rounds of Acerta, Nabriva and Editas combined were $615m.
Total Investment ($m) Total Finance Deals % Investment per Financing Round
Financing Round
2015 2014 2013 2012 2011 2015 2014 2013 2012 2011 2015 2014 2013 2012 2011
Seed Capital 123 135 135 190 140 26 28 51 48 47 1% 2% 3% 4% 3%
Series A 1,858 1,466 1,341 1,185 1,270 100 125 132 134 122 19% 21% 27% 25% 29%
Series B 3,088 2,430 1,034 1,092 1,047 90 125 72 94 74 32% 34% 21% 23% 24%
Series C 1,567 948 900 794 510 55 61 52 53 35 16% 13% 18% 17% 12%
Series D 1,192 722 447 673 362 30 29 29 29 17 12% 10% 9% 14% 8%
Series E 546 233 489 195 404 14 16 17 11 15 6% 3% 10% 4% 9%
Series F 148 67 205 140 49 5 7 5 10 2 2% 1% 4% 3% 1%
Series G 49 128 62 210 127 3 3 3 2 2 1% 2% 1% 4% 3%
Series H - 208 - - - - 2 - - - - 3% - - -
Series I 2 93 - - - 1 1 - - - 0% 1% - - -
Series Undisclosed
1,150 632 330 272 431 46 67 53 48 84 12% 9% 7% 6% 10%
Total 9,723 7,063 4,945 4,751 4,341 370 464 414 430 398
Venture Capital Investment Rounds Source: EvaluatePharma® January 2016
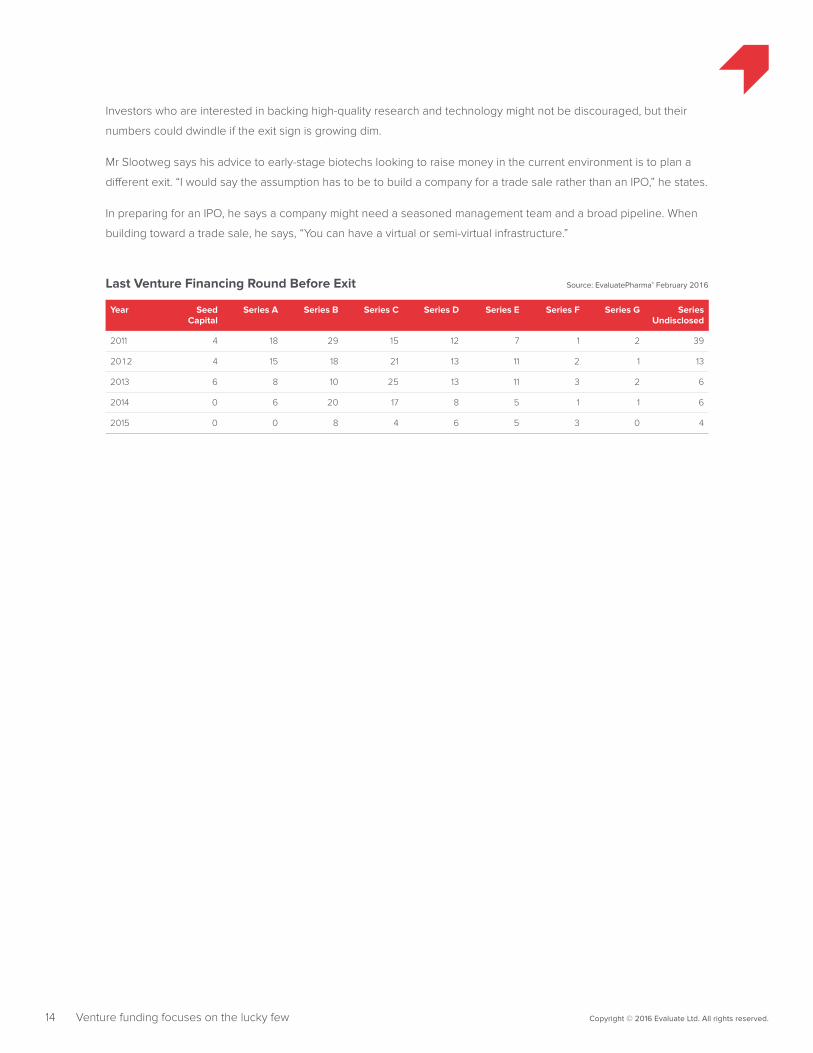
The second and subsequent investment rounds are becoming ever more crucial for companies moving to their
endgames. In 2015 there were no exits among companies whose last venture finance round was an A. The historical
data series shows the importance of the B and C rounds most of all, with these constituting more than 40% of the
exits in 2011-15.
With biotech off the boil so far in 2016 it will be interesting to see how this affects venture investment, especially
given the well-documented presence of crossover funds that are in it to support an IPO.
Mr Smith of Mann BioInvest believes that many of these relatively new entrants to the biotech funding space
could now withdraw in light of the market downturn: “Crossover funds did a lot of private investments in the hope
these companies would IPO; some of them did and now their investments are locked into falling markets, which is
absolutely not what you want.”
14 Copyright © 2016 Evaluate Ltd. All rights reserved.Venture funding focuses on the lucky few
Investors who are interested in backing high-quality research and technology might not be discouraged, but their
numbers could dwindle if the exit sign is growing dim.
Mr Slootweg says his advice to early-stage biotechs looking to raise money in the current environment is to plan a
different exit. “I would say the assumption has to be to build a company for a trade sale rather than an IPO,” he states.
In preparing for an IPO, he says a company might need a seasoned management team and a broad pipeline. When
building toward a trade sale, he says, “You can have a virtual or semi-virtual infrastructure.”
Year Seed Capital
Series A Series B Series C Series D Series E Series F Series G Series Undisclosed
2011 4 18 29 15 12 7 1 2 39
2012 4 15 18 21 13 11 2 1 13
2013 6 8 10 25 13 11 3 2 6
2014 0 6 20 17 8 5 1 1 6
2015 0 0 8 4 6 5 3 0 4
Last Venture Financing Round Before Exit Source: EvaluatePharma® February 2016
15 Copyright © 2016 Evaluate Ltd. All rights reserved.M&A – Pfizer to the rescue
Source: EvaluatePharma® January 2016Pharma and Biotech M&A Activity
Dea
l Val
ue
Dea
l Cou
nt
50
150
100
200
250
300
350
400 300
250
200
150
50
100
02010
$112bn
2011
$56bn
2012
$43bn
2013
$80bn
2014
$220bn
2015
$345bn
$185bn
PFE [AGN]($160bn)
$146bn
AGN [ACT]($66.0bn)
$71bn
Alcon [NVS]($37.7bn)
0
Deal Value
Deal Count
YearExcludes terminated dealsAnalysis conducted by deal announcement date
203200197196208
262
M&A – Pfizer to the rescue
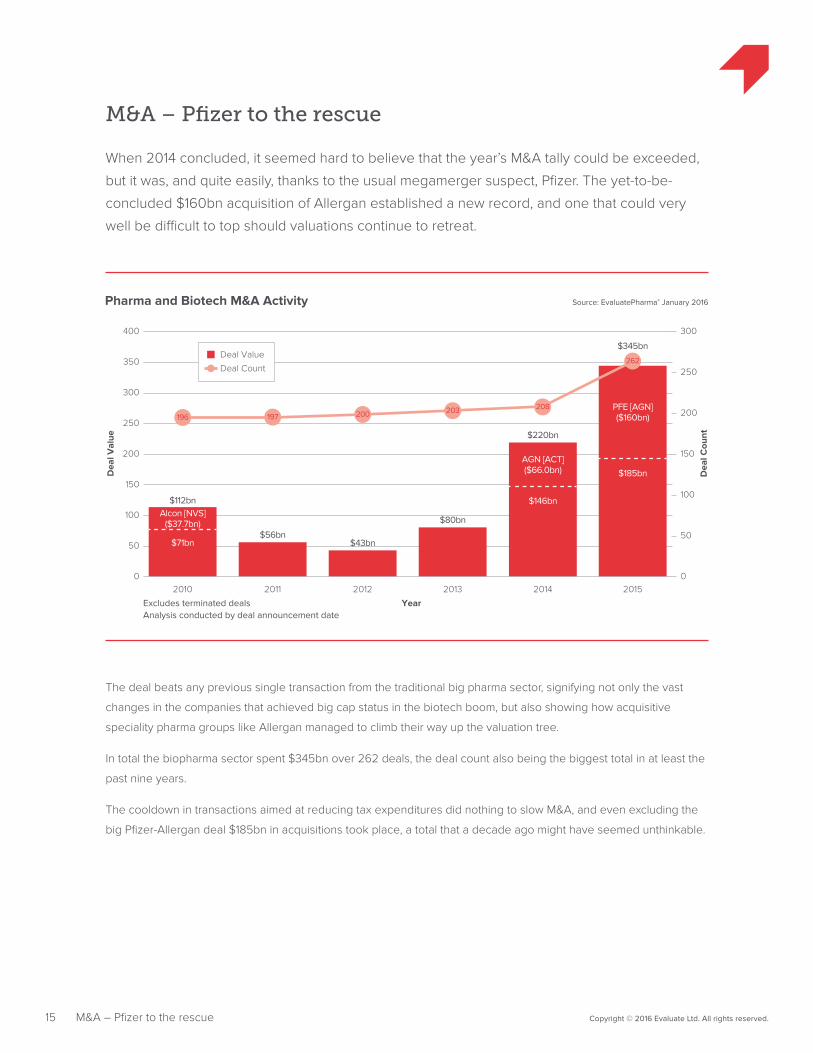
When 2014 concluded, it seemed hard to believe that the year’s M&A tally could be exceeded,
but it was, and quite easily, thanks to the usual megamerger suspect, Pfizer. The yet-to-be-
concluded $160bn acquisition of Allergan established a new record, and one that could very
well be difficult to top should valuations continue to retreat.
The deal beats any previous single transaction from the traditional big pharma sector, signifying not only the vast
changes in the companies that achieved big cap status in the biotech boom, but also showing how acquisitive
speciality pharma groups like Allergan managed to climb their way up the valuation tree.
In total the biopharma sector spent $345bn over 262 deals, the deal count also being the biggest total in at least the
past nine years.
The cooldown in transactions aimed at reducing tax expenditures did nothing to slow M&A, and even excluding the
big Pfizer-Allergan deal $185bn in acquisitions took place, a total that a decade ago might have seemed unthinkable.
16 Copyright © 2016 Evaluate Ltd. All rights reserved.M&A – Pfizer to the rescue
Source: EvaluatePharma® January 2016Average M&A Deal Values Per Year
Ave
rage
for
Dea
ls ≤
$2
0bn
Ave
rage
for
≥ $
25
0m
Dea
ls ($
bn)
100
300
200
400
500
600
700
800
900 3.0
2.5
2.0
1.5
0.5
1.0
02010
$411m
2011
$424m
2012
$375m
2013
$637m
2014
$847m
2015
$828m
0
Average for Deals ≤ $20bn ($m)
Average for $250m+ Deals ($bn)
YearAnalysis excludes $40bn+ deals and medtech
1.7
1.31.4
1.9
2.4 2.4
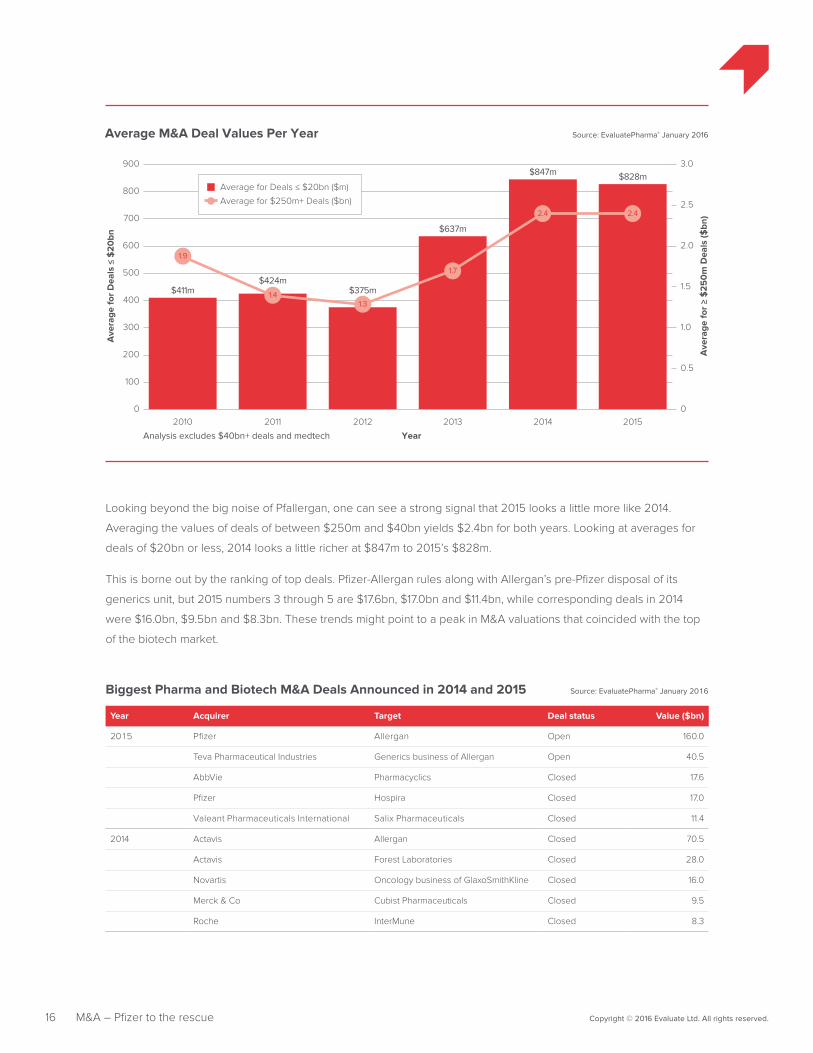
Looking beyond the big noise of Pfallergan, one can see a strong signal that 2015 looks a little more like 2014.
Averaging the values of deals of between $250m and $40bn yields $2.4bn for both years. Looking at averages for
deals of $20bn or less, 2014 looks a little richer at $847m to 2015’s $828m.
This is borne out by the ranking of top deals. Pfizer-Allergan rules along with Allergan’s pre-Pfizer disposal of its
generics unit, but 2015 numbers 3 through 5 are $17.6bn, $17.0bn and $11.4bn, while corresponding deals in 2014
were $16.0bn, $9.5bn and $8.3bn. These trends might point to a peak in M&A valuations that coincided with the top
of the biotech market.
Year Acquirer Target Deal status Value ($bn)
2015 Pfizer Allergan Open 160.0
Teva Pharmaceutical Industries Generics business of Allergan Open 40.5
AbbVie Pharmacyclics Closed 17.6
Pfizer Hospira Closed 17.0
Valeant Pharmaceuticals International Salix Pharmaceuticals Closed 11.4
2014 Actavis Allergan Closed 70.5
Actavis Forest Laboratories Closed 28.0
Novartis Oncology business of GlaxoSmithKline Closed 16.0
Merck & Co Cubist Pharmaceuticals Closed 9.5
Roche InterMune Closed 8.3
Biggest Pharma and Biotech M&A Deals Announced in 2014 and 2015 Source: EvaluatePharma® January 2016
17 Copyright © 2016 Evaluate Ltd. All rights reserved.M&A – Pfizer to the rescue
Should the early 2016 re-rating continue, it will be interesting to watch how big pharma business development
strategies change. Prized assets might be less expensive in coming months, so one hypothesis holds that deal
activity will pick up even if total dollar amounts do not.
On the other hand, the view being taken by some big pharma chief executives is that biotech leaders and investors
believed the hype in the heat of the biotech bull rush, and as a result their companies are simply overpriced. This
school is best exemplified by Roche’s Severin Schwan and Sanofi’s Olivier Brandicourt, the latter of whom recently
said, “We’re not sure that the expectation of boards and shareholders of this company may actually be realistic even
after recent price falls.”
Mr Slootweg, of Forbion Capital Partners, believes that the valuation imbalance is not universal. “There are certain
subsectors where people have inflated expectations, like immuno-oncology. I think there will be a huge shake-out. In
other areas, the valuations are realistic.”
He also believes that valuation is not the only factor at work in M&A decision-making. “The underlying need of larger
players to fill pipelines – I think that’s more the driver.”
It would be unfortunate for the sector if an unintended consequence of the enthusiasm for biotech during 2012-2015
translated into a suppression of deal making in future.
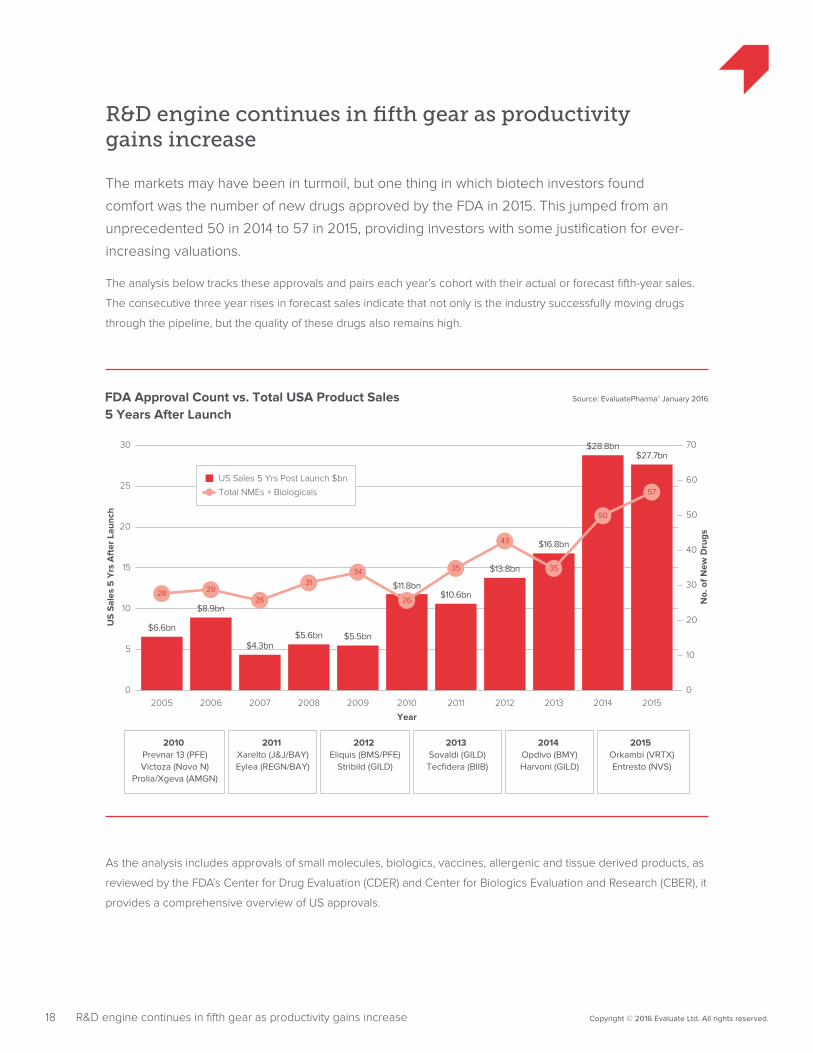
R&D engine continues in fifth gear as productivity gains increase
The markets may have been in turmoil, but one thing in which biotech investors found
comfort was the number of new drugs approved by the FDA in 2015. This jumped from an
unprecedented 50 in 2014 to 57 in 2015, providing investors with some justification for ever-
increasing valuations.
The analysis below tracks these approvals and pairs each year’s cohort with their actual or forecast fifth-year sales.
The consecutive three year rises in forecast sales indicate that not only is the industry successfully moving drugs
through the pipeline, but the quality of these drugs also remains high.
18 Copyright © 2016 Evaluate Ltd. All rights reserved.R&D engine continues in fifth gear as productivity gains increase
Source: EvaluatePharma® January 2016FDA Approval Count vs. Total USA Product Sales5 Years After Launch
US
Sal
es 5
Yrs
Aft
er L
aunc
h
No.
of N
ew D
rugs
5
10
15
20
25
30 70
50
60
40
30
20
10
02005
$6.6bn
2006
$8.9bn
2007
$4.3bn
2008
$5.6bn
2009
$5.5bn
2010
$11.8bn
2011
$10.6bn
2012
$13.8bn
2013
$16.8bn
2014
$28.8bn
2015
$27.7bn
0
US Sales 5 Yrs Post Launch $bn
Total NMEs + Biologicals
Year
2010 Prevnar 13 (PFE)Victoza (Novo N)
Prolia/Xgeva (AMGN)
2011 Xarelto (J&J/BAY)Eylea (REGN/BAY)
2012 Eliquis (BMS/PFE)
Stribild (GILD)
2013 Sovaldi (GILD)Tecfidera (BIIB)
2014 Opdivo (BMY)Harvoni (GILD)
2015 Orkambi (VRTX)Entresto (NVS)
28 2926
3134
26
35
43
35
50
57
As the analysis includes approvals of small molecules, biologics, vaccines, allergenic and tissue derived products, as
reviewed by the FDA’s Center for Drug Evaluation (CDER) and Center for Biologics Evaluation and Research (CBER), it
provides a comprehensive overview of US approvals.
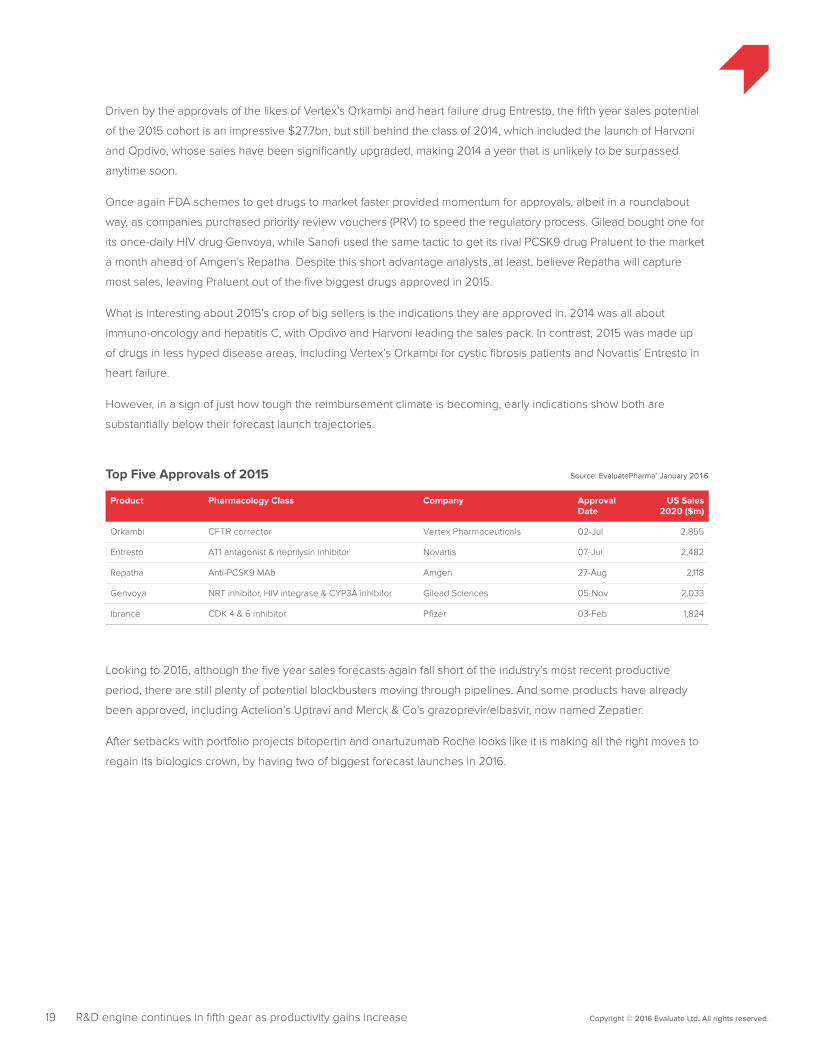
Driven by the approvals of the likes of Vertex’s Orkambi and heart failure drug Entresto, the fifth year sales potential
of the 2015 cohort is an impressive $27.7bn, but still behind the class of 2014, which included the launch of Harvoni
and Opdivo, whose sales have been significantly upgraded, making 2014 a year that is unlikely to be surpassed
anytime soon.
Once again FDA schemes to get drugs to market faster provided momentum for approvals, albeit in a roundabout
way, as companies purchased priority review vouchers (PRV) to speed the regulatory process. Gilead bought one for
its once-daily HIV drug Genvoya, while Sanofi used the same tactic to get its rival PCSK9 drug Praluent to the market
a month ahead of Amgen’s Repatha. Despite this short advantage analysts, at least, believe Repatha will capture
most sales, leaving Praluent out of the five biggest drugs approved in 2015.
What is interesting about 2015’s crop of big sellers is the indications they are approved in. 2014 was all about
immuno-oncology and hepatitis C, with Opdivo and Harvoni leading the sales pack. In contrast, 2015 was made up
of drugs in less hyped disease areas, including Vertex’s Orkambi for cystic fibrosis patients and Novartis’ Entresto in
heart failure.
However, in a sign of just how tough the reimbursement climate is becoming, early indications show both are
substantially below their forecast launch trajectories.
Product Pharmacology Class Company Approval Date
US Sales 2020 ($m)
Orkambi CFTR corrector Vertex Pharmaceuticals 02-Jul 2,855
Entresto AT1 antagonist & neprilysin inhibitor Novartis 07-Jul 2,482
Repatha Anti-PCSK9 MAb Amgen 27-Aug 2,118
Genvoya NRT inhibitor, HIV integrase & CYP3A inhibitor Gilead Sciences 05-Nov 2,033
Ibrance CDK 4 & 6 inhibitor Pfizer 03-Feb 1,824
Top Five Approvals of 2015 Source: EvaluatePharma® January 2016
19 Copyright © 2016 Evaluate Ltd. All rights reserved.R&D engine continues in fifth gear as productivity gains increase
Looking to 2016, although the five year sales forecasts again fall short of the industry’s most recent productive
period, there are still plenty of potential blockbusters moving through pipelines. And some products have already
been approved, including Actelion’s Uptravi and Merck & Co’s grazoprevir/elbasvir, now named Zepatier.
After setbacks with portfolio projects bitopertin and onartuzumab Roche looks like it is making all the right moves to
regain its biologics crown, by having two of biggest forecast launches in 2016.
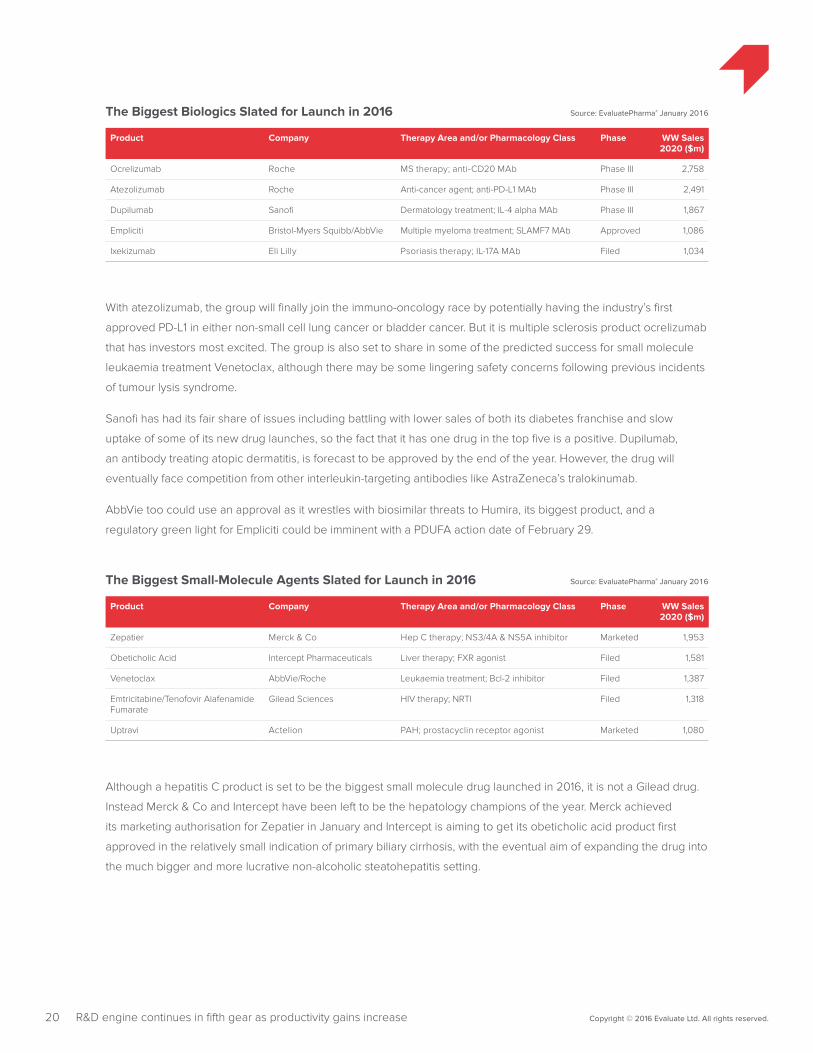
With atezolizumab, the group will finally join the immuno-oncology race by potentially having the industry’s first
approved PD-L1 in either non-small cell lung cancer or bladder cancer. But it is multiple sclerosis product ocrelizumab
that has investors most excited. The group is also set to share in some of the predicted success for small molecule
leukaemia treatment Venetoclax, although there may be some lingering safety concerns following previous incidents
of tumour lysis syndrome.
Sanofi has had its fair share of issues including battling with lower sales of both its diabetes franchise and slow
uptake of some of its new drug launches, so the fact that it has one drug in the top five is a positive. Dupilumab,
an antibody treating atopic dermatitis, is forecast to be approved by the end of the year. However, the drug will
eventually face competition from other interleukin-targeting antibodies like AstraZeneca’s tralokinumab.
AbbVie too could use an approval as it wrestles with biosimilar threats to Humira, its biggest product, and a
regulatory green light for Empliciti could be imminent with a PDUFA action date of February 29.
Product Company Therapy Area and/or Pharmacology Class Phase WW Sales 2020 ($m)
Zepatier Merck & Co Hep C therapy; NS3/4A & NS5A inhibitor Marketed 1,953
Obeticholic Acid Intercept Pharmaceuticals Liver therapy; FXR agonist Filed 1,581
Venetoclax AbbVie/Roche Leukaemia treatment; Bcl-2 inhibitor Filed 1,387
Emtricitabine/Tenofovir Alafenamide Fumarate
Gilead Sciences HIV therapy; NRTI Filed 1,318
Uptravi Actelion PAH; prostacyclin receptor agonist Marketed 1,080
Product Company Therapy Area and/or Pharmacology Class Phase WW Sales 2020 ($m)
Ocrelizumab Roche MS therapy; anti-CD20 MAb Phase III 2,758
Atezolizumab Roche Anti-cancer agent; anti-PD-L1 MAb Phase III 2,491
Dupilumab Sanofi Dermatology treatment; IL-4 alpha MAb Phase III 1,867
Empliciti Bristol-Myers Squibb/AbbVie Multiple myeloma treatment; SLAMF7 MAb Approved 1,086
Ixekizumab Eli Lilly Psoriasis therapy; IL-17A MAb Filed 1,034
The Biggest Small-Molecule Agents Slated for Launch in 2016 Source: EvaluatePharma® January 2016
The Biggest Biologics Slated for Launch in 2016 Source: EvaluatePharma® January 2016
20 Copyright © 2016 Evaluate Ltd. All rights reserved.R&D engine continues in fifth gear as productivity gains increase
Although a hepatitis C product is set to be the biggest small molecule drug launched in 2016, it is not a Gilead drug.
Instead Merck & Co and Intercept have been left to be the hepatology champions of the year. Merck achieved
its marketing authorisation for Zepatier in January and Intercept is aiming to get its obeticholic acid product first
approved in the relatively small indication of primary biliary cirrhosis, with the eventual aim of expanding the drug into
the much bigger and more lucrative non-alcoholic steatohepatitis setting.
Some of these drugs, will however, not make it to market this year, and some are cautioning that the current volatility
in the market might have an impact on long-term pipeline productivity. Mr Smith of Mann Bioinvest warns that R&D
spend might slow down among smaller companies.
“The last thing you want to do if you are a company that has raised money is spend it. So what we might see is
companies going into hibernation, we will see them delaying their clinical trials, or slowing down trials, or not
starting trials, because they don’t know how long this retrenchment will go on for.”
However, the full implications of this scenario will not hit productivity for a few years. What drugs launching now
are more likely to encounter is a toughening reimbursement climate. Sustaining, or even commanding, the prices
that underlie all of these forecasts could become more challenging. And as EP Vantage has previously argued until
the reimbursement outlook becomes clearer pharma and biotech could be in for more volatile times in spite of the
clear R&D wins.
21 Copyright © 2016 Evaluate Ltd. All rights reserved.R&D engine continues in fifth gear as productivity gains increase
22 Copyright © 2016 Evaluate Ltd. All rights reserved.Stormy horizons
Stormy horizons
At the end of last year there were still plenty of bulls predicting the good times would continue
into 2016. The gloomy start to the year has proved them wrong, and trying to predict what the
rest of the year ahead holds from the vantage point of only a few volatile months is a risky, if not
foolhardy enterprise.
Attempts at crystal ball gazing have been made even more difficult by the fact that it was not pricing and
reimbursement, or drug failure that eventually burst the biotech bubble. Instead it was the wider macro-economic
environment, including China’s stalling growth, the fall in oil prices and the continued crisis in the Middle East that did
what logic had failed to accomplish.
“The thing about investor behaviour in a period where share prices are going up is the illogical expectation that
because share prices have gone up a lot for the last five to eight years they will continuing to go up for much longer
than that,” says Mr Smith of Mann Bioinvest.
But with the air now out of the bubble, the industry is left facing not only a period of uncertainty, as valuations find
their level, but other issues that will be harder to ignore in a downward market.
The noise around the pricing debate has not gone away, and while the eventual winner of the US presidential
elections will have little or no influence on drug prices, the subject will continue to weigh on sentiment.
Pharmacy benefit managers, however, do have influence and they will carry on flexing their muscles in negotiating
lower prices, especially among drug classes with high competition, or products that offer only offer incremental
benefits. Even drugs with clear advantages, but high prices, could see pushback, or more pay for performance
reimbursement deals.
Politically, while the threat of a Grexit has all but subsided, there is now an even more serious danger of a Brexit.
The effects of the UK leaving the European Union are hard to predict, but it will do little to ease jittery international
markets.
The coming year will also see more biosimilar entrants knocking at the door of the US healthcare system, and
despite the doomsaying by originators, their uptake might be surprising, especially if payers like Express Scripts have
anything to do with it.
Venture capital funds, who last year invested record amounts of money, are almost certainly going to be less active
in the coming year. The closing of the IPO window has robbed them of exit opportunities, and the US has only seen
five IPOs since the start of the year across all sectors. What might give industry watchers hope is that four have been
in healthcare.
With so many uncertainties Mr Lloyd-Harris of Abingworth is predicting a much quieter time in the sector, as smaller
companies who have raised money hunker down and cut their cash burn. “The mindset among companies now is
‘cash is king and who knows when we will be able to raise money again.’”
23 Copyright © 2016 Evaluate Ltd. All rights reserved.Stormy horizons
However, this might have a knock on effect of increased collaborations within the industry and licensing deals, with
heavy R&D development elements.
And while some argue that valuations of some companies are still too high. Cheaper stock prices do mean buying
opportunities, either for big pharma, who largely sat out the recent wave of record breaking M&A, or cash-rich
larger biotechs.
So the market might expect a wave of M&A, but perhaps not until the expectations of owners fall into line with the
reality of their share prices. Traditionally, a pickup in M&A has also heralded an opening in the IPO window; however,
if this does not materialise, then the industry could be heading for uncharted waters.
As such, the only winners in 2016 might be large, revenue-producing , cash-rich companies wanting to pick up assets.
For everyone else, the defining feature of success might be the amount of cash raised while the sun shone on
much of 2015.
Report authors: Lisa Urquhart and Jonathan Gardner
Additional complimentary copies of this report can be downloaded at: www.evaluategroup.com/PharmaBiotech2015Review
Evaluate Headquarters Evaluate Ltd. 1 1 -29 Fashion Street London E1 6PX United Kingdom T +44 (0)20 7377 0800 F +44 (0)20 7539 1801
Evaluate North America EvaluatePharma USA Inc. 15 Broad Street, Suite 401 Boston, MA 02109, USA T +1 617 573 9450 F +1 617 573 9542
Evaluate Japan Evaluate Japan KK Akasaka Garden City 4F 4-15-1 Akasaka, Minato-ku Tokyo 107-0052, Japan T +81 (0)80 1164 4754
www.evaluate.com
Established in 1996, Evaluate Ltd is the trusted leader in high quality life science sector analysis and consensus forecasts to 2020. Evaluate’s team of expert analysts transform life science information into insights so companies can perform well.
EvaluatePharma® delivers exclusive consensus sales forecasts and trusted commercial insight into biotech and pharmaceutical performance.
@EvaluatePharma
EvaluateMedTech® sets a new standard in commercial analysis and consensus forecasts of the global medical device and diagnostic industry.
@EvaluateMedTech
EvaluateClinical Trials® delivers unique clinical trial intelligence expertly curated to efficiently analyse the global clinical trial landscape.
@EPClinicalTrial
EP Vantage an award winning editorial team, provides daily commentary and analysis with fresh perspectives and insight into current and future industry trends.
@EPVantage
Evaluate Custom Services provides customised solutions to help you access, analyse and manage the information you need to support effective decision-making.
The Evaluate services enable the life science community to make sound business decisions about value and opportunity.